POST-ELECTION REPORT
|
|
|
- Diane Adams
- 6 years ago
- Views:
Transcription


1 POST-ELECTION REPORT Inside the Numbers: Gubernatorial Election Suburban Cook County November 4, 2014 Cook County Clerk David Orr cookcountyclerk.com
2

3 Cook County clerk david orr 69 W. Washington, Suite 500, Chicago, Illinois tel (312) fax (312) web cookcountyclerk.com Dear Friends: The November 4, 2014 Gubernatorial General Election brought many election changes extended hours for early voting; early voting on the Sunday before the election; expanded grace period registration and voting; Election Day registration; and electronic pollbooks in all precincts. Voting before Election Day set records, with more mail ballots being cast than ever before and a 68.5 percent increase in pre-election day voting. The Nov. 4 election also featured one of the closest elections in Illinois history, the state treasurer s race. That close contest was not decided until two weeks after the election, when all legally late-arriving mail ballots and valid provisional votes were counted truly demonstrating how every vote counts. I invite you to delve into the results and analysis of how suburban Cook County voted, in this post-election report. For example: Voting before Election Day by mail or during early voting and grace period voting grew to more than 26 percent this election, up from 15.4 percent in The 51,237 mail ballots cast exceeded all previous elections in suburban Cook County, with twice as many as in Turnout reached 49.8 percent, down from 52.5 percent in 2010 (nearly matching the 2006 turnout of 49.7 percent). More women than men voted 54.2 percent vs percent and voters 65 and older made up about one-third of all voters. Election Day registration was popular, as 3,604 people registered for the first time or updated their registration on Nov. 4. The busiest of our 18 sites was the Evanston Civic Center, where 455 citizens registered. Voters of all ages used Election Day registration, but voters ages made up nearly half of participants. Republican gubernatorial candidate Bruce Rauner won the same number of suburban Cook County townships 16 as Bill Brady in 2010, but Rauner received about 32,000 more votes than Brady. As always, this report, full election results and many printable maps are available on our website, cookcountyclerk.com. Sincerely, David Orr Cook County Clerk
4 Suburban Cook County Post-Election Report November 4, 2014 Gubernatorial Election Table of Contents Voter Registration Up, Turnout Down 1 Voter Registration Up in 28 Townships 2 Turnout Down in All 30 Townships 3 Older Voters, Women Drive Turnout 4 Map: Turnout of Registered Voters by Precinct 5 Durbin Wins 25 Townships, Challenger Gained Ground 6 Map: Ballots Cast for U.S. Senator 7 Quinn Wins Suburban Cook, Rauner Out-Performs Brady 8 Rauner Wins More Townships, Quinn Gets More Votes 9 Votes Cast for Governor Map: Ballots Cast for Governor 12 Party Vote by Township 13 IL Treasurer: Frerichs Wins Suburban Cook by 73,505 Votes 14 Map: Ballots Cast for IL Treasurer 15 Dold Wins 10th Congressional District by 5,700 Votes 16 Map: Ballots Cast by Precinct for Congressional District Statewide Referenda Receive Resounding Support 18 Pre-Election Day Voting Increases 68.5%, Now 26.7% of Total Turnout 19 Election Day Registration a Huge Success 20 Young Voters Nearly Half Of Election Day Registrations 21 Summary Report Ballots Cast 22 Constitutional Amendments 22 U.S. Senator 22 Governor 22 Lieutenant Governor 22 Attorney General 22 Secretary of State 23 Comptroller 23 Treasurer 23 Representatives in Congress State Senator Representatives in General Assembly Water Reclamation Commissioner 34 President, Cook County Board of Commissioners 34 County Clerk 34 County Sheriff 34 County Treasurer 34 County Assessor 34 Cook County Board of Commissioners County Board of Review, 3rd District 37 Superintendents of Schools 37 Appellate Court Judges 37 Circuit Court Judges Judicial Subcircuits Sanitary District 41 Retention Judges Referenda Write-in Votes 60-61
5 Voter Registration Up, Turnout Down The number of registered voters in suburban Cook County for the Nov. 4 election was the highest of any Gubernatorial Election. The 1,398,724 registered voters in suburban Cook County represented a 2.1 percent increase over the 1,370,186 registered voters for the 2010 Gubernatorial General Election. Voter registration efforts by civic, community, education, and religious groups were instrumental at adding voters to the rolls. The Clerk s office also expanded grace period registration to all early voting sites and executed a successful pilot of Election Day registration. Despite increased registration opportunities, overall turnout dipped to 49.8 percent. Gubernatorial Election Turnout: Year Registered Voters Ballots Cast Turnout ,245, , % ,272, , % ,262, , % ,365, , % ,370, , % ,370, , % ,398, , % Suburban Cook County Turnout in Gubernatorial Primary and General Elections 70.0% 60.0% 50.0% 52.8% 49.7% 53.9% 51.1% 49.7% 52.5% 49.8% 40.0% 30.0% 20.0% 30.2% 28.0% 23.9% 33.4% 25.0% 25.5% 10.0% 16.0% 0.0% Primary General 1
6 Voter Registration Up In 28 Townships The number of registered voters - not including Election Day or grace period registrants - increased in 28 of suburban Cook County s 30 townships as compared to the 2010 Gubernatorial General Election. Hanover Township had the largest percentage increase in registered voters of any township, growing by about 3,000 voters for a 6.81 percent jump. Schaumburg Township added 2,610 voters, and Wheeling Township increased by 2,228. Suburban Cook County: Voter Registration in Gubernatorial Elections # of Registered Voters Township Nov Nov Nov % Change Barrington 9,431 9,815 10, % Berwyn 23,859 24,405 24, % Bloom 53,370 51,573 51, % Bremen 64,753 64,455 65, % Calumet 10,279 10,480 10, % Cicero 25,346 26,472 28, % Elk Grove 43,517 43,538 44, % Evanston 45,891 43,219 42, % Hanover 38,858 41,960 44, % Lemont 12,310 13,147 13, % Leyden 42,612 42,453 43, % Lyons 60,203 59,558 61, % Maine 72,767 73,448 75, % New Trier 38,168 38,345 39, % Niles 60,467 61,398 62, % Northfield 55,747 55,594 56, % Norwood Park 15,009 14,851 15, % Oak Park 33,773 33,389 34, % Orland 63,588 64,504 65, % Palatine 58,887 59,345 61, % Palos 32,156 32,171 32, % Proviso 86,975 83,903 85, % Rich 46,442 48,107 49, % River Forest 7,291 7,206 7, % Riverside 10,097 10,133 10, % Schaumburg 67,213 67,055 69, % Stickney 18,519 18,701 19, % Thornton 102, , , % Wheeling 84,021 83,962 86, % Worth 86,020 85,843 86, % Suburban Cook 1,370,230 1,370,186 1,398,724* 2.08% * Does not include Election Day or grace period registrants. 2
7 Turnout Down In All 30 Townships In all 30 suburban Cook County townships, the turnout percentage and number of ballots cast were less in 2014 than New Trier Township had the highest turnout (65.4%) for the fourth consecutive gubernatorial election. Turnout only topped 60 percent in one other township Oak Park. As in 2006 and 2010, Cicero Township had the lowest turnout (32.1%). Nov. 4, 2014 Historical Gubernatorial Election Turnout (%) Township Registered Voters Ballots Cast Turnout (%) 2010 (%) 2006 (%) 2002 (%) 1998 (%) Barrington 10,469 5, % Berwyn 24,662 9, % Bloom 51,770 24, % Bremen 65,118 30, % Calumet 10,738 4, % Cicero 28,236 9, % Elk Grove 44,869 22, % Evanston 42,577 24, % Hanover 44,819 18, % Lemont 13,941 7, % Leyden 43,786 17, % Lyons 61,555 32, % Maine 75,165 36, % New Trier 39,050 25, % Niles 62,933 28, % Northfield 56,880 32, % Norwood Park 15,087 6, % Oak Park 34,004 20, % Orland 65,375 33, % Palatine 61,005 31, % Palos 32,718 16, % Proviso 85,126 42, % Rich 49,422 27, % River Forest 7,436 4, % Riverside 10,253 5, % Schaumburg 69,665 32, % Stickney 19,394 7, % Thornton 100,134 47, % Wheeling 86,190 46, % Worth 86,347 42, % Suburban Cook 1,398, , % 52.5% 49.7% 51.1% 53.9% Highest Turnout % Lowest Turnout % 3

8 Older Voters, Women Drive Turnout Who turned out to vote in the gubernatorial general election? More women than men, and many more older voters than younger ones. An analysis of turnout by age and gender shows that as the age of voters goes up, their overall turnout increases. More women than men voted, by a margin of 54.2 percent to 45.8 percent. Broken down by age and gender, the group with the greatest number of voters who turned out for the election were women between 55 and 64 years old they made up 13.2 percent of total turnout. Next highest were men ages 55 to 64 years old (11.7 percent). Voters 55 and older made up 55.9 percent of all voters in the Nov. 4 election. Nearly 31 percent of voters were 65 years old and older. The percentage of voters 75 years and older was nearly double that of 25- to 34-year-old voters 13.8 percent vs. 7.7 percent. Turnout by Age & Gender 100,000 90,000 80, % of all ballots cast 13.2% of all ballots cast 70,000 Ballots Cast 60,000 50,000 40,000 30,000 20,000 10, Male Female 4
9 Turnout of Registered Voters by Precinct November 4, 2014 Gubernatorial General Election Cook County, Illinois Palatine Barrington Wheeling Northfield. New Trier Evanston Hanover Schaumburg Niles Maine Elk Grove Norwood Park Riverside 45-49% Berwyn 40-44% 24 Cicero >55% 2 Chicago Stickney Lyons Proviso Park 50-54% River Forest Oak <40% Leyden % Turnout Stickney Indicates Forest Preserve Area Palos 7 19 Worth Lemont Calumet Registered SUMMARY Voters Suburban Cook County 1,398,724 City of Chicago 1,368,708 Cook County Total 2,767,432 Orland Percent Turnout Turnout 696, , ,364, The numbers on the Chicago portion of the map indicate each Chicago ward. Bremen Thornton Rich Bloom City of Chicago precinct data provided by the Chicago Board of Elections Commissioners. December 10,
10 Durbin Wins 25 Townships, Challenger Gained Ground Though 48 percent more ballots were cast for U.S. Senate in the 2008 Presidential Election, the total number of votes for Dick Durbin s Republican challenger was virtually the same in ,000. Jim Oberweis won 37.1 percent of the vote and five townships up from Sauerberg s 25.1 percent and one township in Suburban Cook County: U.S. Senate Results Township Durbin Sauerberg Durbin Oberweis Barrington 3, % 3, % 1, % 3, % Berwyn 12, % 2, % 6, % 2, % Bloom 30, % 6, % 17, % 5, % Bremen 36, % 8, % 19, % 9, % Calumet 7, % % 4, % % Cicero 12, % 1, % 6, % 1, % Elk Grove 21, % 10, % 11, % 10, % Evanston 29, % 3, % 20, % 3, % Hanover 19, % 8, % 9, % 7, % Lemont 5, % 4, % 2, % 4, % Leyden 19, % 7, % 9, % 7, % Lyons 28, % 15, % 16, % 14, % Maine 34, % 15, % 18, % 16, % New Trier 20, % 10, % 13, % 10, % Niles 32, % 9, % 18, % 9, % Northfield 28, % 13, % 17, % 14, % Norwood Park 6, % 2, % 3, % 3, % Oak Park 24, % 3, % 16, % 3, % Orland 28, % 16, % 13, % 17, % Palatine 27, % 17, % 14, % 16, % Palos 14, % 8, % 7, % 8, % Proviso 52, % 9, % 31, % 9, % Rich 34, % 3, % 23, % 3, % River Forest 4, % 1, % 2, % 1, % Riverside 5, % 2, % 3, % 2, % Schaumburg 33, % 13, % 17, % 13, % Stickney 8, % 2, % 4, % 2, % Thornton 66, % 6, % 39, % 5, % Wheeling 42, % 21, % 22, % 21, % Worth 43, % 16, % 23, % 16, % Suburban Cook 734, % 246, % 416, % 245, % Note: Chart does not reflect any ballots cast for third party candidates. 6
11 Ballots Cast for US Senator November 4, 2014 Gubernatorial General Election Cook County, Illinois Ridg e Sheridan Asbury Ashland La Salle Cornell Mackinaw Ewing nd Is la ny Burnham Wentworth Chicago Indiana Halsted 177th Lansing wo Glenwood-Lansing od -D ye Bloom Joe Orr Steger Lincoln Steger Lynwood r Ford Heights Sauk Village 231st Burnham Ashland Lans ing 186th Calumet rs r no Go ve Sto Dan Ryan Halsted Ashland Wood Center Park Dixie Harw o od Pulaski Crawford Western 231st Colfax Noble Ashland es enn Vin c n ya R an D g Le 7 I5 Central University Park Gle n Cottage Grove Western Western California Michigan Kedzie Kedzie Pulaski s bu m C Cicero Central Oak Park Ridgeland Governors Park Forest Richton Park ks Glenwood 14th Ashland Steger Doctor Martin Luther King Jr Berwyn Oak Park 82nd 80th Sauk Frankfort Lincoln Chicago Heights 26th Chicago The numbers on the Chicago portion of the map indicate each Chicago ward. Matteson Rieg el Rich Kingery Ma in Holbrook Flossmoor Calumet City ity 170th Thornton rd te Memorial nc Riv er Oa Thornton l Flossmoor Vollmer Ridge ig a Thornton Margaret Homewood na Sta South Holland State Kedzie Mc Cormick Crawford Pulaski olu Morgan Skokie Central Central 86th t es hw ut West So Wolf 108th 104th 175th Sibley Mic h 162nd Br ai lt on od Hazel Crest Dolton Phoenix 171st Riege e lin Mo 183rd Tinley Park 179th Markham Do Torrence Hohlfelder Wagner Harms Central Ridgeland es Des P lain Cork Kean 104th Wolf Bell Will Cook Harvey Burnham 142nd wo 175th Palos Country Club Hills City of Chicago precinct data provided by the Chicago Board of Elections Commissioners. on en 171st 138th e Gr Orland Hills 183rd * In suburban Cook County, 21,758 ballots were cast for Libertarian Party candidate Sharon Hansen. In the City of Chicago, 20,358 ballots were cast for Libertarian Party candidate Sharon Hansen. These figures are not reflected in the map. nt d Posen Oak Forest 130th or Blue Island Midlothian 151st or 10 9 Calumet Th Riverdale 139th ian 147th 159th Vermont Robbins 106th pf 131st 135th 100th ho 127th th Midlo 111th 34 e 119th 123rd e 7 8 Bis lleg 76th o or 115th Alsip Worth Co 19 ag Sh 103rd 5 95th State es t 21 hic 6 enn es 76th c Vin w 79th 18 C Loom is So h ut 167th 20 h Worth 151st Orland 17 e 51st Garfield rd Crestwood Orland Park Pershing 16 Kedzie 153rd ch Ar er 11 Chicago Ridge Palos Heights 143rd Roosevelt ut Ridgeland 131st Jackson Oak Lawn Evergreen Park 80th Palos Park Hometown Harlem State 47th Burbank Hickory Hills Palos 22 so n 87th Roberts Smith ve n 43 Eisenhower den Og Cermak 65th StickneyStat 111th C alsa g 119th 94th Registered Voters 1,398,724 1,368,708 2,767,432 i Ste 23 63rd Bridgeview Kean SUMMARY Suburban Cook County City of Chicago Cook County Total James D. "Jim" Oberweis Ballots Cast 245,570 99, ,555 31st Bedford Park 123rd 131st 151st Richard J. Ballots* Durbin Cast Ballots Cast 696, , , ,744 1,364, , Palos Hills Augusta Washington Cicero 25th 26th Forest View Summit 88th 135th Lee Thatcher 5th Tri-State Taft 25th t lie on hy Il th Adla 44 e d Diversey y So County Line Jo Nolt a rt 127th er nn Chicago 24 Stickney Lyons Mc Cook 107th tate Lemont ch Ar Ke Cicero Addison 26 Pershing 103rd Lemont in Ma Mc C Stickney 43rd Willow Springs S Tr i- N ew 33 Cermak Justice 87th Calumet Sag to n Hyde Par k in ld Hodgkins German Church 91st Lawrence ore Indicates Forest Preserve Area 79th 30 Fullerton 40 Foster Sh Burr Ridge Els Irving Park 38 31st n East P B Riverside fie Lyons eld Willow Springs <30% 55th gto urlin Devon ke Countryside fi la in Oak Park Berwyn Peterson La Pla Western Springs La Grange 47th Hinsdale ell River Forest 39th Brookfield 30-39% ld w South Canal Forest Park 31st La Grange Park 40-49% Evanston Howard Augusta River Oak Forest Park Proviso Broadview Westchester 50-59% North 1st 60-69% Fullerton Maywood Hillside Brainard >70% W st- Oak Brook 36 in Skokie Montrose Addison Madison La Grange 61-70% Lake Kemman 51-60% Ea ld erf ie Maple 41-50% (Republican) Butt in s River Grove 17th 31-40% >70% Northlake Wolf <30% t es Ca Norwood Norridge Park North North Saint Charles James D. "Jim" Oberweis 41 Higg Evanston Elg Golf Church Franklin Park Melrose Park North Berkeley a le Wilmette Central Niles Lawrence Gunnison er (Democratic) Wolf Richard J. Durbin nd Foster Belmont Riv Grand Rose Mannheim Leyden st Av o iew Oakton Nagle Cumberland Ruby Schiller Park n kli n we ott ith Dempster Lincoln Niles Talc Higgins Rosemont 41 ck w Narragansett Devon Roselle Waukegan en or th Canfield Lee ss Park Ridge % Ballots Cast Happ Edens Hibbard Riv er Wolf Bu Be Lake lenv Old G Golf Morton Grove Maine Touhy Elk Grove Village Fra Sunset Ridge Landwehr Wheeling Elmhurst Main Elmhurst East River alo Buff Schoenbeck me ie r Des Plaines 84th Biesterfield Busse Land Pfingsten ve G ro Mount Prospect Weber I 290 Plum Grove Waterman Wilke Hicks Meacham ar k Nerge Elgin-O'Har e in Elk Grove Thack er Ballard Kenilworth Clar k gp Arlington Heights Hicks Quentin Ela Plum Grove Hough Springinsguth Barrington Roselle Brinker Sutton Old Sutton Bartlett aly He Sutton Wise Ir vin qu t Winnetka an Schaumburg Hanover Park on es Hill igh Gifford Schau mburg Alg Glenview e Bartlett Schaumburg Mount Prospect rth w East Lake Glenview Central. Winnetka ke Bartlett Golf Kensington No West Lake au e Rolling Meadows Willow lw Mi Lak ff Northfield Prospect Heights New Tower Trier Voltz Sherid Streamwood cho Arlington Heights Euclid Walters Techny Leh Hanover Elgin Kir d er es Riv ago Vi lla Palatine Wheeling lain Des P Bode an Central Hoffman Estates Summit em South Barrington an Glencoe Ridg e Mundhank s Fre Northwest Shoe Factory Congdon Chic in Hintz Wheeling R igh g in qu New Wilke Hig on Palatine Palatine er Leh Penny in Inverness er m ay Alg Baldw Bradwell Sh ay e rn Edens Expy stw o th Northbrook Fore aw Deerfield Buffalo Grove Dundee nb H Barrington ee Dund ly a He Lake Cook Deer Park Sanders Barrington Hills County Line Barrington ee Gr Otis Potter Main a County Line Ela Bateman nle ok ie Sk Do Huntington County Line December 10,
12 Quinn Wins Suburban Cook, Rauner Out-performs Brady Pat Quinn received more votes in suburban Cook County than his challenger, but he lost to Bruce Rauner statewide in part because his margin of victory narrowed here. Quinn received 17,372 fewer votes in suburban Cook County than in 2010, while Rauner received 31,782 more than the Republican challenger Bill Brady did four years ago. Suburban Cook: Governor s Race Results vs 2010 DEM REP 3RD PARTIES Change Quinn Quinn Brady Rauner Change Change Ballots Cast 380, ,053-17, , ,957 31,782 48,689 13,277-35,412 % of Ballots Cast 54% 53% -1% 40% 45% 5% 6% 2% -4% Third-party candidates played a bigger role in the 2010 gubernatorial contest than in 2014, and Republican Bruce Rauner picked up the difference throughout the state. From 2010 to 2014, Pat Quinn had a drop-off in votes in Chicago, suburban Cook County, and the rest of Illinois. Governor s Race: 2010 vs % 10% 20% 30% 40% 50% 60% 70% 80% 90% 100% , ,110 49,428 Chicago , ,431 13,237 Suburban Cook , , , ,957 48,689 13, ,745,219 1,713, ,142 Statewide ,681,343 1,823, ,534 DEM REP 3rd Party 8
13 Rauner Wins More Townships, Quinn Gets More Votes Bruce Rauner won the same number of suburban Cook County townships 16 as Bill Brady did in 2010, but in the townships he won, he generally collected more votes than his predecessor. Pat Quinn won 13 townships in 2014, one fewer than in 2010 because River Forest was a dead heat. Two other townships Leyden and Worth were separated by about 2 percent of ballots cast. Suburban Cook County: Governor s Race 2010 vs 2014 DEM REP Township Quinn Quinn Brady Rauner Barrington 1, % 1, % 3, % 4, % Berwyn 5, % 6, % 2, % 3, % Bloom 16, % 16, % 6, % 6, % Bremen 18, % 18, % 9, % 10, % Calumet 4, % 4, % % % Cicero 5, % 6, % 2, % 2, % Elk Grove 9, % 8, % 11, % 12, % Evanston 19, % 18, % 4, % 5, % Hanover 8, % 7, % 9, % 9, % Lemont 2, % 2, % 4, % 5, % Leyden 8, % 8, % 8, % 8, % Lyons 14, % 13, % 15, % 17, % Maine 16, % 15, % 17, % 20, % New Trier 12, % 9, % 12, % 15, % Niles 17, % 15, % 11, % 12, % Northfield 15, % 12, % 16, % 19, % Norwood Park 2, % 2, % 3, % 3, % Oak Park 15, % 15, % 4, % 4, % Orland 12, % 11, % 18, % 20, % Palatine 12, % 11, % 18, % 19, % Palos 6, % 6, % 9, % 9, % Proviso 29, % 29, % 10, % 11, % Rich 21, % 22, % 4, % 5, % River Forest 2, % 2, % 1, % 2, % Riverside 2, % 2, % 2, % 2, % Schaumburg 14, % 13, % 15, % 17, % Stickney 3, % 3, % 2, % 3, % Thornton 39, % 38, % 7, % 7, % Wheeling 20, % 17, % 24, % 27, % Worth 20, % 20, % 18, % 20, % Suburban Cook 380, % 363, % 280, % 311, % 9
14 Votes Cast for Governor Suburban Cook County Township Netsch (D) Edgar (R) Poshard (D) Ryan (R) Blagojevich (D) Ryan (R) Barrington 565 3, ,419 1,225 3,381 Berwyn 3,566 8,289 4,841 6,118 6,300 4,051 Bloom 8,710 15,706 11,590 12,951 14,597 8,799 Bremen 9,764 15,555 15,239 14,541 17,848 10,498 Calumet 2,104 1,449 3,105 1,283 3, Cicero 2,284 9,754 3,704 7,399 6,874 4,253 Elk Grove 3,991 16,108 6,345 13,966 8,143 12,936 Evanston 12,363 7,936 11,716 9,299 16,101 5,357 Hanover 2,600 8,488 4,018 8,025 7,260 8,509 Lemont 1,047 3,469 1,485 2,949 2,265 3,782 Leyden 5,361 18,158 6,965 13,403 10,696 9,890 Lyons 8,086 21,935 10,791 18,435 14,347 16,895 Maine 9,359 26,693 11,672 23,242 16,282 20,306 New Trier 8,037 15,429 7,266 16,444 11,202 11,930 Niles 12,895 17,025 13,086 15,476 19,135 11,529 Northfield 7,311 18,917 8,269 19,137 13,778 15,263 Norwood Park 1,855 5,469 2,609 4,765 3,909 4,049 Oak Park 8,760 6,727 9,269 7,931 12,646 5,131 Orland 4,898 15,658 8,960 17,875 11,941 17,439 Palatine 4,578 18,731 7,192 18,587 9,933 17,487 Palos 4,036 11,548 6,063 10,459 6,888 9,556 Proviso 14,925 23,134 22,151 18,903 27,682 13,627 Rich 7,678 9,942 11,580 9,839 16,391 6,260 River Forest 1,244 2,654 1,535 3,093 1,895 2,391 Riverside 1,418 4,224 1,872 3,726 2,481 3,212 Schaumburg 5,331 19,071 8,033 17,988 12,280 15,626 Stickney 3,090 6,267 4,481 4,506 5,326 3,715 Thornton 17,266 23,073 28,702 17,685 35,708 11,613 Wheeling 8,816 30,002 12,806 27,818 17,903 24,989 Worth 11,737 30,278 17,525 24,407 21,535 22,436 Suburban Cook 193, , , , , ,600 10
15 Blagojevich (D) Topinka (R) Quinn (D) Brady (R) Quinn (D) Rauner (R) Township 1,569 3,246 1,529 3,951 1,274 4,308 Barrington 5,627 3,702 5,898 2,876 6,482 3,000 Berwyn 14,643 5,859 16,784 6,402 16,758 6,672 Bloom 17,902 7,531 18,644 9,783 18,394 10,972 Bremen 3, , , Calumet 6,651 2,650 5,769 2,263 6,540 2,154 Cicero 9,518 10,290 9,259 11,470 8,801 12,834 Elk Grove 14,004 4,790 19,640 4,591 18,635 5,586 Evanston 8,442 6,472 8,078 9,072 7,623 9,777 Hanover 2,352 3,387 2,410 4,817 2,113 5,240 Lemont 10,114 7,310 8,114 8,555 8,296 8,703 Leyden 12,726 15,053 14,048 15,770 13,359 17,866 Lyons 16,479 15,634 16,242 17,581 15,458 20,187 Maine 9,872 11,096 12,464 12,909 9,307 15,705 New Trier 16,395 9,428 17,590 11,097 15,258 12,399 Niles 14,338 14,707 15,415 16,712 12,286 19,629 Northfield 3,685 2,819 2,951 3,286 2,759 3,839 Norwood Park 10,571 4,889 15,606 4,093 15,062 4,905 Oak Park 12,077 14,223 12,197 18,843 11,567 20,772 Orland 11,435 15,102 12,113 18,461 11,084 19,945 Palatine 6,876 7,589 6,719 9,017 6,279 9,888 Palos 26,413 11,405 29,375 10,508 29,572 11,570 Proviso 17,815 4,406 21,817 4,600 22,020 5,046 Rich 1,564 2,115 2,579 1,900 2,159 2,159 River Forest 1,736 3,761 2,683 2,722 2,609 2,987 Riverside 14,288 12,560 14,402 15,511 13,831 17,648 Schaumburg 4,736 2,510 3,861 2,998 3,808 3,322 Stickney 34,526 6,526 39,303 7,117 38,857 7,317 Thornton 18,746 20,259 20,082 24,287 17,692 27,013 Wheeling 20,945 16,087 20,619 18,425 20,869 20,051 Worth 349, , , , , ,957 Suburban Cook 11
16 Ballots Cast for Governor November 4, 2014 Gubernatorial General Election Cook County, Illinois Ridg e Sheridan Michigan Halsted University Park Cornell Mackinaw Ewing Colfax nd Is la ny Calumet City ks Wentworth Chicago Indiana Halsted Memorial Burnham Kingery Lans ing rd te 177th Lansing 186th Glenwood wo Glenwood-Lansing od -D ye Bloom Joe Orr Steger Calumet Lincoln Steger Lynwood r Torrence Gle n Ford Heights Sauk Village 231st Burnham 231st 170th Thornton Cottage Grove Ashland Park Forest Richton Park Sto Dan Ryan Doctor Martin Luther King Jr es enn Vin c Ashland Wood o od Harw r no rs Western Crawford Go ve Chicago Heights 26th ig a nc ity Riv er Oa Thornton Ma in 14th Ashland Steger Governors Sauk Frankfort Lincoln na Sta Thornton Holbrook Flossmoor Chicago The numbers on the Chicago portion of the map indicate each Chicago ward. Matteson Central Ridgeland Vollmer Rieg el Rich Ridge l Flossmoor 162nd Br ai South Holland Margaret Homewood Pulaski Country Club Hills 171st Riege e lin Mo 183rd Hazel Crest Dixie I5 7 Markham 175th lt on Sibley Mic h Phoenix Center Park n ya R an D g Le Palos Oak Park 175th Do Dolton State Kedzie Cicero 82nd Central Harvey Burnham 142nd od 171st 183rd City of Chicago precinct data provided by the Chicago Board of Elections Commissioners. on wo Oak Forest nt en 80th Posen Midlothian Tinley Park 179th * In suburban Cook County, 13,277 ballots were cast for Libertarian Party candidates Grimm & Cummings. In the City of Chicago, 13,237 ballots were cast for Libertarian Party candidates Grimm and Cummings. These figures are not reflected in the map. La Salle Noble Western Ashland Morgan Berwyn Kedzie California Pulaski s bu m olu C Central Central Cork t es hw ut So Blue Island 147th 159th or 138th e Gr West 139th ian 130th Calumet Th Riverdale State es 104th th Midlo Vermont Robbins d 131st 135th 10 9 enn 108th Western Ridgeland Des P lain es Oak Park 127th 106th or Wolf Ashland Harms Central e 111th th pf Will Cook Asbury Kedzie Mc Cormick Waukegan Skokie Lee Hohlfelder Wagner Happ Edens Hibbard Crawford Pulaski 119th 123rd th ho 86th 104th Kean lleg 76th o 6 Bis Wolf 115th Alsip Worth Co 19 Chicago Ridge 5 e 103rd ag or 21 hic Sh 79th C 76th 103rd 151st Orland Hills 20 h st Garfield c Vin w 167th Pershing Loom is So h ut t es 11 ut Worth 151st Orland er Oak Lawn Evergreen Park Crestwood Orland Park ch Ar 16 Kedzie 153rd 25 Hometown Palos Heights 143rd 14 2 So County Line 47th 87th Hickory Hills 131st Jackson Roosevelt 12 so n Burbank Ridgeland Bell 22 65th 80th State ve n Hyde Par k 63rd Harlem Smith Ad Roberts Palos Park 94th Registered SUMMARY Voters Suburban Cook County 1,398,724 City of Chicago 1,368,708 Cook County Total 2,767,432 Rauner & Sanguinetti Ballots Cast 311, , ,388 31st 23 Bridgeview Palos 123rd 151st Quinn & Ballots* Vallas Cast Ballots Cast 696, , , ,813 1,364, ,866 Cicero 25th 26th Ste lai 43 Eisenhower den Og Cermak e StickneyStat 111th C alsa g 119th Augusta 26th 71 Palos Hills 32 Chicago 24 Cicero 44 e d Diversey y Washington 28 Bedford Park Kean 135th r 131st nn 1 Forest View Summit 88th 127th Ke Addison ore t lie on hy Sh Jo Nolt Lemont a rt Il 1 Mc Cook 107th tate w to n Cermak Justice S Tr i- Ne Lawrence 37 Stickney Lyons 103rd Calumet Sag e ch Ar Foster ke fi Willow Springs Lemont 30 Fullerton Pershing Hodgkins 87th in Ma Mc C Els Irving Park 38 Stickney 43rd Devon La Pla in d el Lyons German Church 91st in Burl Riverside Peterson st gton East Indicates Forest Preserve Area 79th Berwyn South Canal Kemman Maple Burr Ridge in ell Oak Park 1st 17th Pla Thatcher 25th 5th Tri-State Taft er Countryside ld fie ld w River Forest 39th Western Springs La Grange 47th <30% North Madison Brookfield 55th Evanston Howard Augusta River Oak Forest Park Forest Park 31st La Grange Park Hinsdale 36 in Skokie Montrose Addison Fullerton Proviso Broadview Willow Springs >70% Hillside Brainard 30-39% Ca Norwood Norridge Park Maywood La Grange 61-70% ld Westchester 50-59% 40-49% B Oak Brook 60-69% 51-60% t es in s River Grove Riv 41-50% Ea W st- Wolf 31-40% >70% Wolf <30% Lake Saint Charles (Republican) 41 Higg Evanston Elg Golf Church Niles a le Wilmette Central Oakton Lawrence Gunnison North North Northlake rf ie utt e nd iew Franklin Park Melrose Park North Berkeley st Av o Foster Belmont Rose Grand Rauner & Sanguinetti (Democratic) Mannheim Leyden % Ballots Cast Quinn & Vallas Ruby Schiller Park n kli n ott Cumberland 41 we Talc Higgins Rosemont ith Dempster Lincoln Niles Canfield Devon Roselle ck w Nagle en or th Park Ridge Be Narragansett Wolf Lee ss Touhy Elk Grove Village Fra Sunset Ridge Landwehr Riv er Elmhurst Wheeling Main Elmhurst East River alo Buff Schoenbeck me ie r Bu Golf Morton Grove Maine Des Plaines 84th Biesterfield Busse Land Pfingsten ve G ro Mount Prospect Weber I 290 Plum Grove Waterman Wilke Hicks Meacham ar k Nerge Elgin-O'Har e in Elk Grove Thack er Ballard Lake Clar k gp Arlington Heights Hicks Quentin Ela Plum Grove Hough Springinsguth Barrington Roselle Brinker Sutton Old Sutton Bartlett aly He Sutton Wise Ir vin qu t Kenilworth an Schaumburg Hanover Park on es Winnetka lenv Old G e Gifford Schau mburg Alg Glenview Hill igh Bartlett Schaumburg Mount Prospect East Lake Glenview Central. Winnetka ke Bartlett Golf rth w West Lake au e Rolling Meadows Prospect Heights Kensington No Willow w Mil Lak ff Northfield Sherid Streamwood cho Arlington Heights Euclid New Tower Trier Voltz Techny Leh Hanover Elgin Kir River ago Vi lla Palatine d lain es Des P Bode an Central Hoffman Estates Summit em South Barrington Wheeling Ridg e Mundhank s Fre an Glencoe y in Northwest Shoe Factory Congdon Chic qu Hintz Wheeling R igh g in on Palatine Palatine er Leh Penny in Inverness New Wilke Hig Alg Baldw Bradwell er m ay e rn Sh Walters nb o th Northbrook Edens Expy a stw aw Deerfield Buffalo Grove Dundee Fore H Barrington ee Dund ly a He Lake Cook Deer Park Sanders Barrington Hills County Line Barrington ee Gr Otis Potter Main a County Line Ela Bateman nle ok ie Sk Do Huntington County Line December 10,
17 Party Vote by Township In 11 suburban Cook County townships, voters were evenly split between the two parties statewide candidates. These townships all voted Democratic for U.S. Senate, Attorney General, and Secretary of State, while voting for the Republican candidates for Governor, Comptroller and Treasurer. In 2014, Democrats swept the statewide races in 13 townships, up from 9 in Senate Governor Attorney General 13 Secretary of State Comptroller Treasurer Ratio 5 to 1 ratio Barrington R R R D R R 5 to 1 Lemont R R R D R R 5 to 1 4 to 2 ratio Orland R R D D R R 4 to 2 Palatine R R D D R R 4 to 2 Palos R R D D R R 4 to 2 3 to 3 ratio Elk Grove D R D D R R 3 to 3 Hanover D R D D R R 3 to 3 Leyden D R D D R R 3 to 3 Lyons D R D D R R 3 to 3 Maine D R D D R R 3 to 3 New Trier D R D D R R 3 to 3 Northfield D R D D R R 3 to 3 Norwood Park D R D D R R 3 to 3 Riverside D R D D R R 3 to 3 Schaumburg D R D D R R 3 to 3 Wheeling D R D D R R 3 to 3 2 to 3 one tie River Forest D Tie D D R R 2 to 3 (1 tie) 0 to 6 ratio Berwyn D D D D D D 0 to 6 Bloom D D D D D D 0 to 6 Bremen D D D D D D 0 to 6 Calumet D D D D D D 0 to 6 Cicero D D D D D D 0 to 6 Evanston D D D D D D 0 to 6 Niles D D D D D D 0 to 6 Oak Park D D D D D D 0 to 6 Proviso D D D D D D 0 to 6 Rich D D D D D D 0 to 6 Stickney D D D D D D 0 to 6 Thornton D D D D D D 0 to 6 Worth D D D D D D 0 to 6
18 IL Treasurer: Frerichs Wins Suburban Cook By 73,505 Votes The race for Illinois Treasurer between Mike Frerichs (D) and Tom Cross (R) was one of the closest in Illinois history decided by a statewide margin of 9,225 votes or 0.26 percent. In suburban Cook County, Frerichs defeated Cross by 73,505 votes and took 53.8 percent of ballots cast. Cross won more townships 17 to Frerichs s 13 but five of Frerichs townships were won with margins of 10,000 or more votes. Township Ballots Michael W. Tom Matthew Total Cast Frerichs (D) Cross (R Skopek (L) Votes Barrington 5,676 1,344 3, ,481 Berwyn 9,849 6,224 2, ,432 Bloom 24,158 16,654 5, ,188 Bremen 30,463 18,364 9,876 1,179 29,419 Calumet 4,912 4, ,725 Cicero 9,049 5,371 2, ,357 Elk Grove 22,287 8,712 11, ,479 Evanston 24,832 17,850 5, ,666 Hanover 18,012 7,889 8, ,329 Lemont 7,594 2,117 4, ,282 Leyden 17,774 7,866 8, ,938 Lyons 32,233 13,372 16,275 1,286 30,933 Maine 36,855 15,112 18,503 1,551 35,166 New Trier 25,509 9,759 13, ,034 Niles 28,476 15,077 11, ,003 Northfield 32,565 12,776 17, ,101 Norwood Park 6,829 2,760 3, ,441 Oak Park 20,525 14,308 4, ,666 Orland 33,240 11,747 19,115 1,181 32,043 Palatine 31,925 11,035 18,535 1,084 30,654 Palos 16,735 6,148 9, ,056 Proviso 42,421 28,131 11,371 1,324 40,826 Rich 27,816 22,088 4, ,022 River Forest 4,422 2,018 2, ,208 Riverside 5,764 2,407 2, ,525 Schaumburg 32,607 14,193 15,895 1,258 31,346 Stickney 7,474 3,904 2, ,172 Thornton 47,379 38,448 6, ,897 Wheeling 45,981 17,604 25,088 1,520 44,212 Worth 42,438 20,676 18,054 2,005 40,735 Suburban Cook 695, , ,661 24, ,336 *Highlighted fields denote townships where Frerichs won by more than 10,000 votes 14
19 Ballots Cast for Treasurer November 4, 2014 Gubernatorial General Election Cook County, Illinois Ashland La Salle Cornell Mackinaw Ewing nd Is la ny Wentworth Burnham Lans ing 177th Lansing wo Glenwood-Lansing od -D ye Bloom Joe Orr Steger Lincoln Steger Lynwood r Ford Heights Sauk Village 231st Burnham Ashland ks 186th Calumet rs Western r no Go ve Chicago Indiana Halsted Harw o od Pulaski Crawford Sto Dan Ryan Halsted Ashland Wood Center Park Dixie I5 7 Oak Park Colfax Noble Ashland es enn Vin c n ya R an D g Le 231st Gle n Cottage Grove Western Western California Michigan Kedzie Kedzie Pulaski s bu m olu Cicero Central 80th Doctor Martin Luther King Jr Berwyn Oak Park 82nd Central University Park Kingery State Crawford Pulaski C Central Central 86th t es hw ut So West 104th Morgan Skokie Ridg e Sheridan Asbury Kedzie Mc Cormick Wagner Harms Central Ridgeland es Des P lain Cork Kean 104th Wolf Ridgeland Governors Park Forest Richton Park Ashland Steger Riv er Oa Glenwood 14th Chicago Heights 26th Chicago Sauk Frankfort Lincoln Rieg el City of Chicago precinct data provided by the Chicago Board of Elections Commissioners. Matteson Calumet City ity 170th Thornton rd te Memorial nc Thornton Ma in Holbrook Flossmoor ig a Thornton l Rich Vollmer Ridge na Sta South Holland Margaret Homewood Flossmoor 162nd od Country Club Hills 175th Sibley Mic h Phoenix 171st Riege e lin Mo 183rd Hazel Crest Dolton Br ai lt on wo Markham Do en 108th Harvey Burnham 142nd State es Palos 183rd The numbers on the Chicago portion of the map indicate each Chicago ward. on e Gr 159th Posen Midlothian Oak Forest 138th Torrence Hohlfelder Lee Thatcher 25th 5th Tri-State Taft Will Cook 147th 130th d Blue Island nt 10 or 139th ian 106th 9 Calumet Th Riverdale or 100th pf th Midlo Vermont Robbins th ho 131st 135th 6 111th 34 e 119th 123rd 76th o or 115th e ag Sh 19 5 h 103rd hic Bis lleg Tinley Park 179th * In suburban Cook County, 24,509 ballots were cast for Libertarian Party candidate Matthew Skopek. In the City of Chicago, 23,987 ballots were cast for Libertarian Party candidate Matthew Skopek. These figures are not reflected in the map. 76th enn t 79th C th 175th 20 c Vin es st Garfield 15 e Alsip Worth Co 171st Pershing Loom is w 11 Chicago Ridge 151st Orland Hills 94th So h ut 167th ch Ar er ut Worth 151st Orland 14 Kedzie Wolf 47th 2 103rd Crestwood Orland Park Jackson Oak Lawn Evergreen Park Ridgeland 153rd 25 Hometown Palos Heights 143rd Roosevelt 12 so n Burbank Hickory Hills 131st 22 65th 80th Bell ve n 87th Harlem State i Ste 23 63rd Roberts Smith Adla StickneyStat Palos Palos Park 151st Tom Cross Ballots Cast 284, , ,044 31st Cicero 43 Eisenhower den Og Cermak Cicero 25th 26th th C alsa g 119th Augusta 26th Stickney Palos Hills 32 Chicago 24 Bridgeview Kean Michael W. Ballots* Frerichs Cast Ballots Cast 695, , , ,289 1,363, , e d Diversey y Washington 28 Bedford Park 88th Registered SUMMARY Voters Suburban Cook County 1,398,724 City of Chicago 1,368,708 Cook County Total 2,767, th nn 1 26 Forest View Summit 123rd 131st Ke Addison So County Line t lie on hy Hyde Par k Jo Nolt a rt 127th er to n ore Mc Cook 107th tate Lemont ch Ar Il 1 103rd Lemont in Ma Mc C 31 Pershing Lyons Willow Springs S Tr i- N ew Lawrence Cermak Justice 87th Calumet Sag 30 Fullerton 40 Foster Irving Park 38 Stickney 43rd Hodgkins German Church 91st Els Sh Indicates Forest Preserve Area 79th in ld Devon ke Burr Ridge st n East P B Riverside fie Lyons eld Willow Springs <30% 55th fi la in gto urlin Peterson La Countryside Berwyn South Canal Pla Western Springs La Grange 47th Hinsdale ell Oak Park 39th Brookfield 30-39% ld w River Forest 1st Forest Park 31st La Grange Park 40-49% Evanston Howard Augusta River Oak Forest Park Proviso Broadview Westchester 50-59% North Madison Kemman 60-69% Fullerton Maywood Hillside Brainard >70% Lake La Grange 61-70% W st- ld erf ie Maple 51-60% Ea Oak Brook 36 in Skokie Montrose Addison River Grove 17th 41-50% (Republican) Butt in s Norwood Norridge Park er 31-40% >70% Northlake Wolf <30% t Ca Lawrence Gunnison North North Saint Charles es 41 Higg Evanston Elg Golf Church Niles a le Wilmette Central Franklin Park Melrose Park North Berkeley Tom Cross (Democratic) Wolf Michael W. Frerichs nd Foster Belmont Riv Grand Rose Mannheim Leyden st Av o iew Oakton Nagle Cumberland Ruby Schiller Park n kli n we ott ith Dempster Lincoln Niles Talc Higgins Rosemont 41 ck w Narragansett Devon Roselle Waukegan en or th Canfield Lee ss Park Ridge % Ballots Cast Happ Edens Hibbard Riv er Wolf Bu Be Lake lenv Old G Golf Morton Grove Maine Touhy Elk Grove Village Fra Sunset Ridge Landwehr Wheeling Elmhurst Main Elmhurst East River alo Buff Schoenbeck me ie r Des Plaines 84th Biesterfield Busse Land Pfingsten ve G ro Mount Prospect Weber I 290 Plum Grove Waterman Wilke Hicks Meacham ar k Nerge Elgin-O'Har e in Elk Grove Thack er Ballard Kenilworth Clar k gp Arlington Heights Hicks Quentin Ela Plum Grove Hough Springinsguth Barrington Roselle Brinker Sutton Old Sutton Bartlett aly He Sutton Wise Ir vin qu t Winnetka an Schaumburg Hanover Park on es Hill igh Gifford Schau mburg Alg Glenview e Bartlett Schaumburg Mount Prospect rth w East Lake Glenview Central. Winnetka ke Bartlett Golf Kensington No West Lake au e Rolling Meadows Willow lw Mi Lak ff Northfield Prospect Heights New Tower Trier Voltz Sherid Streamwood cho Arlington Heights Euclid Walters Techny Leh Hanover Elgin Kir er es Riv ago Vi lla Palatine d lain Des P Bode an Central Hoffman Estates Summit em South Barrington Wheeling Ridg e Mundhank s Fre an Glencoe ay in Northwest Shoe Factory Congdon Chic qu Hintz Wheeling R er igh g in on Palatine Palatine er m Leh Penny in Inverness New Wilke Hig Alg Baldw Bradwell Sh ay e rn Edens Expy stw o th Northbrook Fore aw Deerfield Buffalo Grove Dundee nb H Barrington ee Dund ly a He Lake Cook Deer Park Sanders Barrington Hills County Line Barrington ee Gr Otis Potter Main a County Line Ela Bateman nle ok ie Sk Do Huntington County Line December 10,
20 Dold Wins 10th Congressional District by 5,700 Votes In the closely-watched 10th Congressional District contest, Republican Bruce Dold who formerly held the seat beat Democrat incumbent Brad Schneider by 5,700 votes with 51.6 percent of ballots cast. In Lake County, 3.8 percent more voters chose Dold over Schneider. 10th Congressional District Results Cook County Lake County Total Ballots Cast % of Ballots Cast Ballots Cast % of Ballots Cast Ballots Cast % of Ballots Cast Schneider (D) 21, % 67, % 88, % Dold (R) 21, % 72, % 94, % Less than one-fourth of the district s registered voters reside in Sububan Cook County. In the 110 suburban Cook County precincts, Dold also won, but by a smaller margin (0.6%) than his districtwide victory and received just 241 more votes than Schneider. Suburban Cook County voters were so divided that each candidate won two townships: Schneider beat Dold in Maine and New Trier townships, while Dold won Northfield and Wheeling townships. Township Ballots Cast Suburban Cook: 10th Congressional District Results Schneider (D) Dold (R) % of Ballots Cast Ballots Cast % of Ballots Cast Total Votes Maine 4, % 3, % 7,815 New Trier 2, % 1, % 3,963 Northfield 9, % 10, % 19,693 Wheeling 5, % 6, % 11,400 Suburban Cook 21, % 21, % 42,871 16
21 Ballots Cast by Precinct for Congressional District 10 November 4, 2014 Gubernatorial General Election Cook County, Illinois. Lake County % Ballots Cast by Precinct Brad Schneider (Democratic) Robert Dold (Republican) <40% >60% 41-45% 55-59% 46-50% 50-54% 51-55% 45-49% 56-60% 40-44% >60% <40% Congressional District 10 Cook County Township Boundaries Lake County Precinct Boundaries Wheeling Northfield New Trier SUMMARY Registered Voters Ballots Cast Brad Schneider Robert Dold Suburban Cook County 88,863 44,075 21,315 21,556 Lake County 300, ,257 69,821 74,436 Cook County Total 388, ,332 91,136 95,992 Maine December 10,
22 Statewide Referenda Receive Resounding Support Five referenda on the ballot called for changes to state law: protecting victims and voters rights, raising the minimum wage, mandating insurance coverage for birth control and raising school funding by increasing taxes on income over $1 million. All five referenda received greater support than either candidate for governor. Most townships came down on the questions in consistent patterns. Calumet, Rich and Thornton were the biggest supporters of all referenda, followed by Evanston and Oak Park. Barrington and Lemont were least favorable. Only New Trier (48%), Lemont (48%) and Barrington (40%) failed to give majority support to one question the millionaire s tax. Referenda % Support Ranked by Township Victims' Rights Voters' Rights Minimum Wage Birth Control Millionaire's Tax Rich 78% Evanston 76% Calumet 88% Calumet 85% Calumet 82% Bremen 76% Oak Park 76% Rich 85% Evanston 84% Rich 79% Thornton 76% Rich 74% Thornton 84% Rich 82% Thornton 79% Calumet 75% Thornton 69% Evanston 81% Oak Park 82% Evanston 75% Proviso 75% Calumet 69% Oak Park 79% Thornton 81% Bloom 74% Bloom 75% Proviso 67% Cicero 79% Bloom 76% Oak Park 73% Oak Park 75% Bloom 67% Proviso 78% Proviso 75% Proviso 73% Orland 74% Berwyn 66% Bloom 77% Berwyn 73% Cicero 71% Worth 74% Niles 65% Berwyn 76% Cicero 72% Bremen 70% Berwyn 74% Bremen 65% Bremen 73% Bremen 72% Berwyn 70% Evanston 74% River Forest 63% Stickney 70% Niles 68% Stickney 65% Lyons 73% Suburban Cook 63% Suburban Cook 69% New Trier 67% Niles 64% Riverside 73% Northfield 62% Leyden 69% Suburban Cook 67% Suburban Cook 63% Suburban Cook 73% New Trier 62% Niles 69% River Forest 66% Worth 62% Stickney 73% Riverside 62% Worth 68% Stickney 65% Leyden 62% Niles 73% Cicero 62% Norwood Park 67% Riverside 64% Hanover 60% Schaumburg 72% Schaumburg 61% Schaumburg 66% Schaumburg 64% Schaumburg 60% Hanover 72% Hanover 61% Maine 66% Northfield 64% Norwood Park 58% Palos 72% Lyons 60% Hanover 65% Leyden 63% Riverside 58% Maine 72% Worth 60% Elk Grove 64% Hanover 63% Maine 58% Lemont 72% Maine 60% Northfield 64% Worth 63% Elk Grove 56% Northfield 71% Stickney 60% Riverside 64% Lyons 63% Lyons 55% Leyden 71% Leyden 59% River Forest 64% Maine 60% River Forest 55% Norwood Park 71% Norwood Park 59% Lyons 63% Wheeling 59% Palos 54% Cicero 70% Palatine 58% Wheeling 63% Elk Grove 59% Wheeling 54% Palatine 70% Elk Grove 58% New Trier 61% Norwood Park 58% Orland 54% New Trier 70% Orland 57% Palos 60% Palatine 57% Northfield 54% River Forest 70% Wheeling 56% Palatine 59% Orland 57% Palatine 52% Elk Grove 69% Palos 56% Orland 59% Palos 57% New Trier 48% Barrington 69% Lemont 54% Lemont 54% Lemont 53% Lemont 48% Wheeling 68% Barrington 54% Barrington 51% Barrington 52% Barrington 40% 18

23 Pre-Election Day Voting Increases 68.5%, Now 26.7% of Total Turnout Pre-election day voting in all its forms early voting, mail voting, and grace period registration and voting accounted for 26.7 percent of all ballots cast, an increase of 68.5 percent over the 2010 election. More mail ballots were cast this election than any election in suburban Cook County history, and twice as many as four years ago. Early voting also set a new midterm record, with 128,011 ballots cast. And thanks to expanding grace period registration to all early voting sites, 4,831 citizens registered to vote and immediately cast a ballot between Oct. 8 and Nov. 3. Suburban Cook: Pre-Election Ballots Cast 2006 Total 2010 Total 2014 Total % Change Registered Voters 1,370,230 1,370,186 1,398, % Early Voting 32,903 83, , % Grace Period/In-Person Absentee 377 1,582 6, % Mail Voting 10,674 25,004 51, % Election Day* 636, , , % Pre-Election Ballots 43, , , % Total Ballots Cast 680, , , % % Pre-Election Ballots 6.5% 15.4% 26.7% *Includes 3,604 Election Day Registration voters Voting By Type: 2010 vs Election Day, 608,633 Election Day, 510,252 Early Voting, 83,871 Early Voting, 128,011 Grace Period/In-Person Absentee, 1,582 Mail Voting, 25,004 Mail Voting, 51,237 Grace Period/In- Person Absentee, 6,903 19
24 Election Day Registration A Success A pilot of Election Day Registration was popular with suburban Cook County voters 3,604 people registered for the first time or updated their registration on Nov. 4. Election Day Registration was available at 17 strategically-located sites throughout suburban Cook County, plus the Clerk s downtown office. The busiest site was the Evanston Civic Center, where 455 citizens registered, including many Northwestern University students. 20
25 Young Voters Nearly Half Of Election Day Registrations While young people ages 18 to 34 made up 46.7 percent of all Election Day Registration participants, voters of all ages took advantage of the pilot program. Likewise, residents of 124 out of 129 suburban Cook County municipalities used EDR to cast ballots, but Evanston citizens including many Northwestern University students made up nearly 10 percent of all EDR participants. The EDR gender breakdown mimicked overall turnout, with women making up percent of all Election Day registrants. Election Day Registrations By Age 1, % 25.0% 20.0% 15.0% 10.0% 5.0% 0.0% EDR Ballots Cast % of EDR Ballots Cast Election Day Registration Top 15 By Voters Municipality Municipality EDR Voters % of all EDR Evanston % Oak Park % Arlington Heights % Schaumburg % Cicero % Calumet City % Palatine % Hoffman Estates % Oak Lawn % Orland Park % Des Plaines % Berwyn % Glenview % Northbrook % Matteson % 21
26 General Election Cook County and The City of Chicago Tuesday, November 4, 2014 Combined Summary Cook County City of Chicago Combined Total Ballots Cast 696, ,033 1,364,436 Crime Victim Rights Cook County City of Chicago Combined Total Percentage Yes 504, ,714 1,020, % No 101,187 74, , % 605, ,139 1,196,135 Protect Right to Vote Cook County City of Chicago Combined Total Percentage Yes 436, , , % No 137,169 84, , % 573, ,714 1,148,096 Senator, U.S. Cook County City of Chicago Combined Total Percentage Richard J. Durbin - DEM 416, , , % James D. ''Jim'' Oberweis - REP 245,570 99, , % Sharon Hansen - LIB 21,758 20,358 42, % Write-In , % 684, ,779 1,334,630 Governor & Lieutenant Governor, Illinois Cook County City of Chicago Combined Total Percentage Pat Quinn & Paul Vallas - DEM 363, , , % Bruce Rauner & Evelyn Sanguinetti - REP 311, , , % Chad Grimm & Alexander Cummings - LIB 13,277 13,237 26, % Write-In 891 1,240 2, % 689, ,721 1,346,899 Attorney General, State of Illinois Cook County City of Chicago Combined Total Percentage Lisa Madigan - DEM 463, ,816 1,014, % Paul M. Schimpf - REP 203,071 82, , % Ben Koyl - LIB 15,611 16,249 31, % Write-In , % 682, ,443 1,333,136 22
27 Secretary of State, State of Illinois Cook County City of Chicago Combined Total Percentage Jesse White - DEM 501, ,080 1,067, % Michael Webster - REP 166,049 68, , % Christopher Michel - LIB 16,850 17,084 33, % Write-In , % 684, ,589 1,337,360 Comptroller, State of Illinois Cook County City of Chicago Combined Total Percentage Sheila Simon - DEM 345, , , % Judy Baar Topinka - REP 307, , , % Julie Fox - LIB 26,412 21,847 48, % Write-In , % 680, ,597 1,324,200 Treasurer, State of Illinois Cook County City of Chicago Combined Total Percentage Michael W. Frerichs - DEM 358, , , % Tom Cross - REP 284, , , % Matthew Skopek - LIB 24,509 23,987 48, % Write-In , % 667, ,622 1,300,392 U.S. Representative, 1st District Cook County City of Chicago Combined Total Percentage Bobby L. Rush - DEM 29, , , % Jimmy Lee Tillman - REP 29,637 5,983 35, % 59, , ,605 U.S. Representative, 2nd District Cook County City of Chicago Combined Total Percentage Robin Kelly - DEM 89,323 47, , % Eric M. Wallace - REP 14,805 2,826 17, % Write-In % 104,351 50, ,124 U.S. Representative, 3rd District Cook County City of Chicago Combined Total Percentage Daniel William Lipinski - DEM 61,314 42, , % Sharon M. Brannigan - REP 39,936 11,564 51, % 101,250 54, ,562 23
28 U.S. Representative, 4th District Cook County City of Chicago Combined Total Percentage Luis V. Gutierrez - DEM 20,985 58,681 79, % Hector Concepcion - REP 10,037 12,241 22, % 31,022 70, ,944 U.S. Representative, 5th District Cook County City of Chicago Combined Total Percentage Mike Quigley - DEM 14,542 93, , % Vince Kolber - REP 10,370 33,354 43, % Nancy Wade - GRN 1,327 8,965 10, % 26, , ,684 U.S. Representative, 6th District Cook County City of Chicago Combined Total Percentage Michael Mason - DEM 9,450 9, % Peter J. Roskam - REP 20,239 20, % 29,689 29,689 U.S. Representative, 7th District Cook County City of Chicago Combined Total Percentage Danny K. Davis - DEM 40, , , % Robert L. Bumpers - REP 8,854 18,314 27, % 49, , ,278 U.S. Representative, 8th District Cook County City of Chicago Combined Total Percentage Tammy Duckworth - DEM 43,523 43, % Larry Kaifesh - REP 32,642 32, % 76,165 76,165 U.S. Representative, 9th District Cook County City of Chicago Combined Total Percentage Janice D. Schakowsky - DEM 88,064 52, , % Susanne Atanus - REP 59,703 12,681 72, % Write-In % 148,283 65, ,122 U.S. Representative, 10th District Cook County City of Chicago Combined Total Percentage Brad Schneider - DEM 21,315 21, % Robert Dold - REP 21,556 21, % 42,871 42,871 24
29 U.S. Representative, 11th District Cook County City of Chicago Combined Total Percentage Bill Foster - DEM % Darlene Senger - REP 1,098 1, % 1,669 1,669 State Senator, 3rd District Cook County City of Chicago Combined Total Percentage Mattie Hunter - DEM 43,662 43, % 43,662 43,662 State Senator, 6th District Cook County City of Chicago Combined Total Percentage John J. Cullerton - DEM 39,851 39, % Stefanie Linares - REP 20,291 20, % 60,142 60,142 State Senator, 9th District Cook County City of Chicago Combined Total Percentage Daniel Biss - DEM 55,986 55, % 55,986 55,986 State Senator, 12th District Cook County City of Chicago Combined Total Percentage Steven Landek - DEM 23,124 1,762 24, % 23,124 1,762 24,886 State Senator, 15th District Cook County City of Chicago Combined Total Percentage Napoleon Harris - DEM 41,888 2,847 44, % 41,888 2,847 44,735 State Senator, 18th District Cook County City of Chicago Combined Total Percentage Bill Cunningham - DEM 22,959 18,556 41, % Shaun Colin Murphy - REP 24,061 5,597 29, % 47,020 24,153 71,173 State Senator, 24th District Cook County City of Chicago Combined Total Percentage Suzanne Glowiak - DEM 1,294 1, % Chris Nybo - REP 1,596 1, % 2,890 2,890 25
30 State Senator, 27th District Cook County City of Chicago Combined Total Percentage Matt Murphy - REP 55,928 55, % 55,928 55,928 State Senator, 30th District Cook County City of Chicago Combined Total Percentage Terry Link - DEM 1,528 1, % Don Wilson - REP 1,085 1, % 2,613 2,613 State Senator, 39th District Cook County City of Chicago Combined Total Percentage Don Harmon - DEM 25,521 8,335 33, % 25,521 8,335 33,856 State Representative, 1st District Cook County City of Chicago Combined Total Percentage Daniel J. Burke - DEM ,420 11, % ,420 11,710 State Representative, 2nd District Cook County City of Chicago Combined Total Percentage Edward J. Acevedo - DEM 12,081 12, % 12,081 12,081 State Representative, 3rd District Cook County City of Chicago Combined Total Percentage Luis Arroyo - DEM ,749 11, % ,749 11,948 State Representative, 4th District Cook County City of Chicago Combined Total Percentage Cynthia Soto - DEM 15,342 15, % 15,342 15,342 State Representative, 5th District Cook County City of Chicago Combined Total Percentage Kenneth ''Ken'' Dunkin - DEM 22,440 22, % Collin Johnson - REP 4,715 4, % 27,155 27,155 26
31 State Representative, 6th District Cook County City of Chicago Combined Total Percentage Esther Golar - DEM 19,159 19, % 19,159 19,159 State Representative, 7th District Cook County City of Chicago Combined Total Percentage Emanuel ''Chris'' Welch - DEM 26,839 26, % 26,839 26,839 State Representative, 8th District Cook County City of Chicago Combined Total Percentage La Shawn K. Ford - DEM 10,398 15,051 25, % 10,398 15,051 25,449 State Representative, 9th District Cook County City of Chicago Combined Total Percentage Arthur Turner - DEM 20,890 20, % 20,890 20,890 State Representative, 10th District Cook County City of Chicago Combined Total Percentage Pamela Reaves-Harris - DEM 21,102 21, % Mark Calonder - REP 3,638 3, % 24,740 24,740 State Representative, 11th District Cook County City of Chicago Combined Total Percentage Ann M. Williams - DEM 22,562 22, % 22,562 22,562 State Representative, 12th District Cook County City of Chicago Combined Total Percentage Sara Feigenholtz - DEM 25,512 25, % 25,512 25,512 State Representative, 13th District Cook County City of Chicago Combined Total Percentage Gregory Harris - DEM 22,632 22, % 22,632 22,632 27
32 State Representative, 14th District Cook County City of Chicago Combined Total Percentage Kelly M. Cassidy - DEM ,659 23, % Denis Detzel - REP 97 3,401 3, % ,060 26,954 State Representative, 15th District Cook County City of Chicago Combined Total Percentage John C. D'Amico - DEM 6,912 9,521 16, % Gregory A. Bedell - REP 5,741 4,226 9, % 12,653 13,747 26,400 State Representative, 16th District Cook County City of Chicago Combined Total Percentage Lou Lang - DEM 9,277 8,149 17, % 9,277 8,149 17,426 State Representative, 17th District Cook County City of Chicago Combined Total Percentage Laura Fine - DEM 21,809 21, % Kathleen Myalls - REP 15,534 15, % 37,343 37,343 State Representative, 18th District Cook County City of Chicago Combined Total Percentage Robyn Gabel - DEM 28,256 28, % 28,256 28,256 State Representative, 19th District Cook County City of Chicago Combined Total Percentage Robert Martwick - DEM 2,094 16,473 18, % 2,094 16,473 18,567 State Representative, 20th District Cook County City of Chicago Combined Total Percentage Mo Khan - DEM 6,027 5,327 11, % Michael P. McAuliffe - REP 9,282 9,597 18, % 15,309 14,924 30,233 State Representative, 21st District Cook County City of Chicago Combined Total Percentage Silvana Tabares - DEM 5,416 5,309 10, % 5,416 5,309 10,725 28
33 State Representative, 22nd District Cook County City of Chicago Combined Total Percentage Michael J. Madigan - DEM ,423 16, % ,423 16,956 State Representative, 23rd District Cook County City of Chicago Combined Total Percentage Michael J. Zalewski - DEM 13, , % 13, ,244 State Representative, 24th District Cook County City of Chicago Combined Total Percentage Elizabeth ''Lisa'' Hernandez - DEM 10,299 2,083 12, % 10,299 2,083 12,382 State Representative, 25th District Cook County City of Chicago Combined Total Percentage Barbara Flynn Currie - DEM 24,810 24, % 24,810 24,810 State Representative, 26th District Cook County City of Chicago Combined Total Percentage Christian L. Mitchell - DEM 25,715 25, % Jacob ''Coby'' Hakalir - REP 5,083 5, % 30,798 30,798 State Representative, 27th District Cook County City of Chicago Combined Total Percentage Monique D. Davis - DEM 9,030 22,194 31, % 9,030 22,194 31,224 State Representative, 28th District Cook County City of Chicago Combined Total Percentage Robert ''Bob'' Rita - DEM 13,956 12,439 26, % 13,956 12,439 26,395 State Representative, 29th District Cook County City of Chicago Combined Total Percentage Thaddeus Jones - DEM 20,082 2,801 22, % 20,082 2,801 22,883 29
34 State Representative, 30th District Cook County City of Chicago Combined Total Percentage William ''Will'' Davis - DEM 21,157 21, % 21,157 21,157 State Representative, 31st District Cook County City of Chicago Combined Total Percentage Mary E. Flowers - DEM 8,091 18,303 26, % 8,091 18,303 26,394 State Representative, 32nd District Cook County City of Chicago Combined Total Percentage André Thapedi - DEM 4,424 15,404 19, % 4,424 15,404 19,828 State Representative, 33rd District Cook County City of Chicago Combined Total Percentage Marcus C. Evans, Jr. - DEM 10,096 17,994 28, % 10,096 17,994 28,090 State Representative, 34th District Cook County City of Chicago Combined Total Percentage Elgie R. Sims, Jr. - DEM 6,699 16,308 23, % Mark Ekhoff - REP 1, , % 7,886 16,700 24,586 State Representative, 35th District Cook County City of Chicago Combined Total Percentage Frances Ann Hurley - DEM 9,661 15,544 25, % Victor C. Horne - REP 9,398 3,529 12, % 19,059 19,073 38,132 State Representative, 36th District Cook County City of Chicago Combined Total Percentage Kelly M. Burke - DEM 21,167 4,276 25, % 21,167 4,276 25,443 State Representative, 37th District Cook County City of Chicago Combined Total Percentage Nichole Serbin - DEM 2,977 2, % Margo McDermed - REP 6,209 6, % 9,186 9,186 30
35 State Representative, 38th District Cook County City of Chicago Combined Total Percentage Al Riley - DEM 25,290 25, % Anthony Granata - REP 6,776 6, % 32,066 32,066 State Representative, 39th District Cook County City of Chicago Combined Total Percentage Will Guzzardi - DEM 14,644 14, % 14,644 14,644 State Representative, 40th District Cook County City of Chicago Combined Total Percentage Jaime M. Andrade, Jr. - DEM 14,861 14, % 14,861 14,861 State Representative, 43rd District Cook County City of Chicago Combined Total Percentage Anna Moeller - DEM 2,152 2, % Jeffrey A. Meyer - REP 1,524 1, % 3,676 3,676 State Representative, 44th District Cook County City of Chicago Combined Total Percentage Fred Crespo - DEM 10,715 10, % Ramiro Juarez - REP 8,866 8, % 19,581 19,581 State Representative, 45th District Cook County City of Chicago Combined Total Percentage Jenny M. Burke - DEM 1,002 1, % Christine Jennifer Winger - REP 1,056 1, % 2,058 2,058 State Representative, 47th District Cook County City of Chicago Combined Total Percentage Patricia R. ''Patti'' Bellock - REP 2,382 2, % 2,382 2,382 State Representative, 49th District Cook County City of Chicago Combined Total Percentage Mike Fortner - REP 1,118 1, % 1,118 1,118 31
36 State Representative, 51st District Cook County City of Chicago Combined Total Percentage Ed Sullivan, Jr. - REP % State Representative, 52nd District Cook County City of Chicago Combined Total Percentage Bill Downs - DEM 1,172 1, % David McSweeney - REP 3,966 3, % 5,138 5,138 State Representative, 53rd District Cook County City of Chicago Combined Total Percentage David Harris - REP 27,097 27, % 27,097 27,097 State Representative, 54th District Cook County City of Chicago Combined Total Percentage Laddi K. Singh - DEM 11,360 11, % Tom Morrison - REP 21,973 21, % 33,333 33,333 State Representative, 55th District Cook County City of Chicago Combined Total Percentage Martin J. Moylan - DEM 14, , % Mel Thillens - REP 13, , % 28, ,856 State Representative, 56th District Cook County City of Chicago Combined Total Percentage Michelle Mussman - DEM 11,831 11, % Jim Moynihan - REP 11,263 11, % 23,094 23,094 State Representative, 57th District Cook County City of Chicago Combined Total Percentage Elaine Nekritz - DEM 13,542 13, % Bill Grossi - REP 10,486 10, % 24,028 24,028 32
37 State Representative, 58th District Cook County City of Chicago Combined Total Percentage Scott Drury - DEM 2,105 2, % Mark Neerhof - REP 1,109 1, % 3,214 3,214 State Representative, 59th District Cook County City of Chicago Combined Total Percentage Carol Sente - DEM 1,596 1, % Leslie Munger - REP 1,064 1, % 2,660 2,660 State Representative, 77th District Cook County City of Chicago Combined Total Percentage Kathleen Willis - DEM 6,770 6, % 6,770 6,770 State Representative, 78th District Cook County City of Chicago Combined Total Percentage Camille Lilly - DEM 18,283 7,899 26, % Write-In % 18,463 7,899 26,362 State Representative, 80th District Cook County City of Chicago Combined Total Percentage Anthony DeLuca - DEM 15,490 15, % 15,490 15,490 State Representative, 82nd District Cook County City of Chicago Combined Total Percentage Jim Durkin - REP 13,848 13, % 13,848 13,848 33
38 Commissioner, Water Reclamation District Cook County City of Chicago Combined Total Percentage (vote for 3) Cynthia M. Santos - DEM 299, , , % Frank Avila - DEM 276, , , % Timothy ''Tim'' Bradford - DEM 266, , , % James (Jim) Parrilli - REP 211,167 78, , % Herb Schumann - REP 204,308 75, , % R. Cary Capparelli - REP 185,485 68, , % Karen Roothaan - GRN 65,252 65, , % George Milkowski - GRN 55,553 53, , % Michael Smith - GRN 52,307 58, , % 1,616,733 1,460,223 3,076,956 Board President, Cook County Cook County City of Chicago Combined Total Percentage Toni Preckwinkle - DEM 519, ,630 1,072, % 519, ,630 1,072,886 Clerk, Cook County Cook County City of Chicago Combined Total Percentage David D. Orr - DEM 520, ,074 1,061, % 520, ,074 1,061,515 Sheriff, Cook County Cook County City of Chicago Combined Total Percentage Thomas J. Dart - DEM 520, ,442 1,055, % 520, ,442 1,055,783 Treasurer, Cook County Cook County City of Chicago Combined Total Percentage Maria Pappas - DEM 514, ,995 1,048, % 514, ,995 1,048,234 Assessor, Cook County Cook County City of Chicago Combined Total Percentage Joseph Berrios - DEM 466, , , % 466, , ,435 Commissioner, County Board 1st District Cook County City of Chicago Combined Total Percentage Richard R. Boykin - DEM 32,646 35,659 68, % Write-In % 32,836 35,910 68,746 34
39 Commissioner, County Board 2nd District Cook County City of Chicago Combined Total Percentage Robert B. Steele - DEM 57,091 57, % 57,091 57,091 Commissioner, County Board 3rd District Cook County City of Chicago Combined Total Percentage Jerry ''Iceman'' Butler - DEM 77,354 77, % 77,354 77,354 Commissioner, County Board 4th District Cook County City of Chicago Combined Total Percentage Stanley S. Moore - DEM 16,879 58,313 75, % 16,879 58,313 75,192 Commissioner, County Board 5th District Cook County City of Chicago Combined Total Percentage Deborah Sims - DEM 45,331 25,211 70, % 45,331 25,211 70,542 Commissioner, County Board 6th District Cook County City of Chicago Combined Total Percentage Joan Patricia Murphy - DEM 65,796 65, % 65,796 65,796 Commissioner, County Board 7th District Cook County City of Chicago Combined Total Percentage Jesus G. Garcia - DEM 25,320 25, % 25,320 25,320 Commissioner, County Board 8th District Cook County City of Chicago Combined Total Percentage Luis Arroyo, Jr. - DEM 37,529 37, % 37,529 37,529 Commissioner, County Board 9th District Cook County City of Chicago Combined Total Percentage Frank L Mc Partlin - DEM 21,066 8,974 30, % Peter N. Silvestri - REP 37,150 14,140 51, % 58,216 23,114 81,330 35
40 Commissioner, County Board 10th District Cook County City of Chicago Combined Total Percentage Bridget Gainer - DEM 64,914 64, % 64,914 64,914 Commissioner, County Board 11th District Cook County City of Chicago Combined Total Percentage John P. Daley - DEM 13,622 40,471 54, % Carl Segvich - REP 9,312 15,432 24, % 22,934 55,903 78,837 Commissioner, County Board 12th District Cook County City of Chicago Combined Total Percentage John Fritchey - DEM 51,499 51, % 51,499 51,499 Commissioner, County Board 13th District Cook County City of Chicago Combined Total Percentage Larry Suffredin - DEM 53,645 15,070 68, % 53,645 15,070 68,715 Commissioner, County Board 14th District Cook County City of Chicago Combined Total Percentage Gregg Goslin - REP 66,217 66, % 66,217 66,217 Commissioner, County Board 15th District Cook County City of Chicago Combined Total Percentage Michael A Urban - DEM 28,392 28, % Timothy O. Schneider - REP 40,569 40, % 68,961 68,961 Commissioner, County Board 16th District Cook County City of Chicago Combined Total Percentage Jeffrey R. Tobolski - DEM 33,157 1,753 34, % 33,157 1,753 34,910 Commissioner, County Board 17th District Cook County City of Chicago Combined Total Percentage Elizabeth ''Liz'' Doody Gorman - REP 56,926 56, % 56,926 56,926 36
41 Board of Review, 3rd District Cook County City of Chicago Combined Total Percentage Larry Rogers, Jr. - DEM 126, , , % 126, , ,382 Superintendent of Schools, DuPage County Cook County City of Chicago Combined Total Percentage Darlene J. Ruscitti - REP % 2 2 Superintendent of Schools, Kane County Cook County City of Chicago Combined Total Percentage Patricia A. Dal Santo - REP 11,930 11, % 11,930 11,930 Superintendent of Schools, Lake County Cook County City of Chicago Combined Total Percentage Roycealee J. Wood - REP 5,050 5, % 5,050 5,050 Appellate Court Judge (Vac of Gordon) Cook County City of Chicago Combined Total Percentage Shelly A. Harris - DEM 449, , , % 449, , ,590 Appellate Court Judge (Vac of Murphy) Cook County City of Chicago Combined Total Percentage David Ellis - DEM 442, , , % 442, , ,949 Appellate Court Judge (Vac of Steele) Cook County City of Chicago Combined Total Percentage John B. Simon - DEM 442, , , % 442, , ,379 Judge, Cook County Circuit (Vac of Arnold) Cook County City of Chicago Combined Total Percentage Bridget Anne Mitchell - DEM 439, , , % 439, , ,922 37
42 Judge, Cook County Circuit (Vac of Burke) Cook County City of Chicago Combined Total Percentage Maritza Martinez - DEM 431, , , % 431, , ,004 Judge, Cook County Circuit (Vac of Connors) Cook County City of Chicago Combined Total Percentage Kristal Rivers - DEM 432, , , % 432, , ,961 Judge, Cook County Circuit (Vac of Egan) Cook County City of Chicago Combined Total Percentage Daniel J. Kubasiak - DEM 422, , , % 422, , ,071 Judge, Cook County Circuit (Vac of Phelps Felton) Cook County City of Chicago Combined Total Percentage Patricia O'Brien Sheahan - DEM 420, , , % 420, , ,357 Judge, Cook County Circuit (Vac of Howse, Jr.) Cook County City of Chicago Combined Total Percentage Caroline Kate Moreland - DEM 418, , , % 418, , ,672 Judge, Cook County Circuit (Vac of Lowrance) Cook County City of Chicago Combined Total Percentage Thomas J. Carroll - DEM 419, , , % 419, , ,780 Judge, Cook County Circuit (Vac of McDonald) Cook County City of Chicago Combined Total Percentage Cynthia Y. Cobbs - DEM 420, , , % 420, , ,594 Judge, Cook County Circuit (Vac of Neville, Jr.) Cook County City of Chicago Combined Total Percentage William B. Raines - DEM 414, , , % 414, , ,727 38
43 Judge, Cook County Circuit (Vac of Reyes) Cook County City of Chicago Combined Total Percentage Diana Rosario - DEM 410, , , % 410, , ,823 Judge, Cook County Circuit (Vac of Hill Veal) Cook County City of Chicago Combined Total Percentage Andrea Michele Buford - DEM 414, , , % 414, , ,944 Judge, 2nd Subcircuit (Vac of O'Neal) Cook County City of Chicago Combined Total Percentage Steven G. Watkins - DEM 33,959 31,671 65, % 33,959 31,671 65,630 Judge, 3rd Subcircuit (Vac of Donnelly) Cook County City of Chicago Combined Total Percentage Terrence J. McGuire - DEM 17,660 46,486 64, % 17,660 46,486 64,146 Judge, 4th Subcircuit (Vac of Billik, Jr.) Cook County City of Chicago Combined Total Percentage John J. Mahoney - DEM 44,689 44, % Ian Brenson - REP 31,061 31, % 75,750 75,750 Judge, 4th Subcircuit (Vac of Mulhern) Cook County City of Chicago Combined Total Percentage John Michael Allegretti - DEM 55,968 55, % 55,968 55,968 Judge, 7th Subcircuit (Vac of Hardy-Campbell) Cook County City of Chicago Combined Total Percentage Robert D. Kuzas - DEM 11,926 37,669 49, % 11,926 37,669 49,595 Judge, 7th Subcircuit (Vac of Taylor) Cook County City of Chicago Combined Total Percentage Judy Rice - DEM 12,050 39,714 51, % 12,050 39,714 51,764 39
44 Judge, 9th Subcircuit (Vac of Goldberg) Cook County City of Chicago Combined Total Percentage Megan Elizabeth Goldish - DEM 42,344 17,729 60, % 42,344 17,729 60,073 Judge, 9th Subcircuit (Vac of Meyer) Cook County City of Chicago Combined Total Percentage Anjana Hansen - DEM 41,981 17,418 59, % 41,981 17,418 59,399 Judge, 9th Subcircuit (Vac of Preston) Cook County City of Chicago Combined Total Percentage Abbey Fishman Romanek - DEM 43,390 17,570 60, % 43,390 17,570 60,960 Judge, 10th Subcircuit (Add'l Judge A) Cook County City of Chicago Combined Total Percentage Anthony C. ''Tony'' Kyriakopoulos - DEM 11,171 41,127 52, % 11,171 41,127 52,298 Judge, 11th Subcircuit (Add'l Judge A) Cook County City of Chicago Combined Total Percentage Pamela McLean Meyerson - DEM 32,096 20,486 52, % 32,096 20,486 52,582 Judge, 12th Subcircuit (Vac of Jordan) Cook County City of Chicago Combined Total Percentage James L. Kaplan - DEM 45,975 45, % James Paul Pieczonka - REP 47,152 47, % 93,127 93,127 Judge, 13th Subcircuit (Vac of Iosco) Cook County City of Chicago Combined Total Percentage John Curry - REP 65,243 65, % 65,243 65,243 Judge, 15th Subcircuit (Vac of Doody, Jr.) Cook County City of Chicago Combined Total Percentage Patrick Kevin Coughlin - DEM 77,602 77, % 77,602 77,602 40
45 Judge, 15th Subcircuit (Vac of Sterba) Cook County City of Chicago Combined Total Percentage Chris Lawler - DEM 77,787 77, % 77,787 77,787 Trustee, La Grange Highlands Sanitary District Cook County City of Chicago Combined Total Percentage Constance Livingston 1,260 1, % 1,260 1,260 Trustee, South Lyons Township Sanitary District (vote for 2) Cook County City of Chicago Combined Total Percentage Susan M. Felice 1,169 1, % Michael G. Grace % 2,161 2,161 Trustee, South Palos Township Sanitary District Cook County City of Chicago Combined Total Percentage (vote for 2) Lawrence M. Pichman % Peter F. Costa % Thomas E. Hoffman Cook County City of Chicago Combined Total Percentage Yes 378, , , % No 118,911 83, , % 497, , ,668 Thomas E. Flanagan Cook County City of Chicago Combined Total Percentage Yes 358, , , % No 148, , , % 506, , ,154 Michael P. Toomin Cook County City of Chicago Combined Total Percentage Yes 357, , , % No 129,695 96, , % 487, , ,208 41
46 Themis N. Karnezis Cook County City of Chicago Combined Total Percentage Yes 341, , , % No 142, , , % 484, , ,415 James Patrick Flannery Cook County City of Chicago Combined Total Percentage Yes 370, , , % No 122,321 86, , % 492, , ,915 Sebastian Thomas Patti Cook County City of Chicago Combined Total Percentage Yes 352, , , % No 131,407 89, , % 483, , ,424 Mary Ellen Coghlan Cook County City of Chicago Combined Total Percentage Yes 376, , , % No 118,078 81, , % 494, , ,259 Kathleen Marie McGury Cook County City of Chicago Combined Total Percentage Yes 372, , , % No 113,329 77, , % 486, , ,762 Shelley Lynn Sutker-Dermer Cook County City of Chicago Combined Total Percentage Yes 356, , , % No 125,413 86, , % 481, , ,302 Lynn Marie Egan Cook County City of Chicago Combined Total Percentage Yes 374, , , % No 113,530 78, , % 487, , ,183 42
47 Andrew Berman Cook County City of Chicago Combined Total Percentage Yes 341, , , % No 124,357 87, , % 465, , ,108 Diane Gordon Cannon Cook County City of Chicago Combined Total Percentage Yes 347, , , % No 120,698 84, , % 468, , ,014 Evelyn B. Clay Cook County City of Chicago Combined Total Percentage Yes 351, , , % No 116,738 75, , % 467, , ,565 Clayton J. Crane Cook County City of Chicago Combined Total Percentage Yes 333, , , % No 128,946 91, , % 462, , ,131 Candace Jean Fabri Cook County City of Chicago Combined Total Percentage Yes 344, , , % No 120,466 83, , % 464, , ,096 John J. Fleming Cook County City of Chicago Combined Total Percentage Yes 346, , , % No 119,430 84, , % 465, , ,550 Rodolfo (Rudy) Garcia Cook County City of Chicago Combined Total Percentage Yes 333, , , % No 133,379 86, , % 467, , ,778 43
48 James J. Gavin Cook County City of Chicago Combined Total Percentage Yes 349, , , % No 114,466 79, , % 463, , ,099 Rickey Jones Cook County City of Chicago Combined Total Percentage Yes 331, , , % No 128,395 81, , % 459, , ,355 Kathleen G. Kennedy Cook County City of Chicago Combined Total Percentage Yes 361, , , % No 108,661 73, , % 470, , ,281 William G. Lacy Cook County City of Chicago Combined Total Percentage Yes 338, , , % No 121,752 83, , % 459, , ,200 Marjorie C. Laws Cook County City of Chicago Combined Total Percentage Yes 344, , , % No 117,869 79, , % 462, , ,355 Patricia Manila Martin Cook County City of Chicago Combined Total Percentage Yes 351, , , % No 112,137 73, , % 464, , ,556 Veronica B. Mathein Cook County City of Chicago Combined Total Percentage Yes 343, , , % No 117,461 80, , % 460, , ,477 44
49 Edmund Ponce de Leon Cook County City of Chicago Combined Total Percentage Yes 329, , , % No 131,164 88, , % 460, , ,263 James L. Rhodes Cook County City of Chicago Combined Total Percentage Yes 332, , , % No 126,773 88, , % 459, , ,578 James G. Riley Cook County City of Chicago Combined Total Percentage Yes 347, , , % No 116,702 81, , % 464, , ,871 Donald J. Suriano Cook County City of Chicago Combined Total Percentage Yes 333, , , % No 124,493 90, , % 457, , ,579 Kenneth J. Wadas Cook County City of Chicago Combined Total Percentage Yes 330, , , % No 125,031 89, , % 455, , ,162 Frank G. Zelezinski Cook County City of Chicago Combined Total Percentage Yes 336, , , % No 124,054 96, , % 460, , ,538 Gregory Joseph Wojkowski Cook County City of Chicago Combined Total Percentage Yes 337, , , % No 123,726 95, , % 461, , ,414 45
50 Mary Anne Mason Cook County City of Chicago Combined Total Percentage Yes 350, , , % No 113,126 72, , % 463, , ,107 Robert E. Gordon Cook County City of Chicago Combined Total Percentage Yes 341, , , % No 116,902 78, , % 458, , ,326 Lewis Nixon Cook County City of Chicago Combined Total Percentage Yes 328, , , % No 127,439 89, , % 455, , ,058 Eileen Mary Brewer Cook County City of Chicago Combined Total Percentage Yes 352, , , % No 110,391 75, , % 462, , ,044 Margaret Ann Brennan Cook County City of Chicago Combined Total Percentage Yes 355, , , % No 107,860 76, , % 462, , ,853 Janet Adams Brosnahan Cook County City of Chicago Combined Total Percentage Yes 343, , , % No 116,720 83, , % 460, , ,919 James Brown Cook County City of Chicago Combined Total Percentage Yes 336, , , % No 120,321 75, , % 456, , ,700 46
51 Peter A. Felice Cook County City of Chicago Combined Total Percentage Yes 328, , , % No 125,239 90, , % 453, , ,272 Kerry M. Kennedy Cook County City of Chicago Combined Total Percentage Yes 350, , , % No 110,502 76, , % 460, , ,972 Casandra Lewis Cook County City of Chicago Combined Total Percentage Yes 341, , , % No 116,450 74, , % 457, , ,532 Thomas J. Lipscomb Cook County City of Chicago Combined Total Percentage Yes 328, , , % No 125,686 91, , % 453, , ,864 Sheila McGinnis Cook County City of Chicago Combined Total Percentage Yes 349, , , % No 111,005 79, , % 460, , ,612 Dennis Michael McGuire Cook County City of Chicago Combined Total Percentage Yes 337, , , % No 118,178 86, , % 456, , ,674 William Timothy O'Brien Cook County City of Chicago Combined Total Percentage Yes 341, , , % No 116,955 86, , % 458, , ,397 47
52 Laura Marie Sullivan Cook County City of Chicago Combined Total Percentage Yes 340, , , % No 121,990 86, , % 462, , ,681 Sandra Tristano Cook County City of Chicago Combined Total Percentage Yes 342, , , % No 116,591 82, , % 459, , ,512 Valarie E. Turner Cook County City of Chicago Combined Total Percentage Yes 345, , , % No 111,225 72, , % 457, , ,302 Raul Vega Cook County City of Chicago Combined Total Percentage Yes 325, , , % No 128,925 87, , % 454, , ,334 Marilyn F. Johnson Cook County City of Chicago Combined Total Percentage Yes 346, , , % No 110,316 71, , % 457, , ,754 Michael B. Hyman Cook County City of Chicago Combined Total Percentage Yes 330, , , % No 123,160 87, , % 453, , ,800 Joan E. Powell Cook County City of Chicago Combined Total Percentage Yes 336, , , % No 121,471 83, , % 457, , ,699 48
53 Patrick J. Sherlock Cook County City of Chicago Combined Total Percentage Yes 332, , , % No 120,010 87, , % 452, , ,819 Anita Rivkin-Carothers Cook County City of Chicago Combined Total Percentage Yes 334, , , % No 122,208 85, , % 456, , ,373 Maureen Ward Kirby Cook County City of Chicago Combined Total Percentage Yes 343, , , % No 113,658 80, , % 456, , ,582 Edward A. Arce Cook County City of Chicago Combined Total Percentage Yes 325, , , % No 126,053 88, , % 451, , ,595 James N. O'Hara Cook County City of Chicago Combined Total Percentage Yes 336, , , % No 120,858 90, , % 457, , ,468 Mauricio Araujo Cook County City of Chicago Combined Total Percentage Yes 320, , , % No 131,578 90, , % 452, , ,157 Eileen O'Neill Burke Cook County City of Chicago Combined Total Percentage Yes 346, , , % No 114,353 83, , % 460, , ,845 49
54 Thomas J. Byrne Cook County City of Chicago Combined Total Percentage Yes 340, , , % No 117,102 84, , % 457, , ,266 Ann Collins-Dole Cook County City of Chicago Combined Total Percentage Yes 344, , , % No 112,948 79, , % 457, , ,022 Donna L. Cooper Cook County City of Chicago Combined Total Percentage Yes 346, , , % No 110,320 73, , % 456, , ,753 Anna Helen Demacopoulos Cook County City of Chicago Combined Total Percentage Yes 341, , , % No 117,556 84, , % 458, , ,777 Margarita Kulys Hoffman Cook County City of Chicago Combined Total Percentage Yes 340, , , % No 115,759 83, , % 455, , ,606 Diana L. Kenworthy Cook County City of Chicago Combined Total Percentage Yes 342, , , % No 112,621 79, , % 455, , ,724 Pamela Elizabeth Loza Cook County City of Chicago Combined Total Percentage Yes 336, , , % No 121,162 86, , % 457, , ,250 50
55 Annie O'Donnell Cook County City of Chicago Combined Total Percentage Yes 320, , , % No 146, , , % 466, , ,385 Jackie Marie Portman Cook County City of Chicago Combined Total Percentage Yes 345, , , % No 111,616 76, , % 456, , ,285 Pat Rogers Cook County City of Chicago Combined Total Percentage Yes 341, , , % No 114,364 79, , % 455, , ,488 Dominique C. Ross Cook County City of Chicago Combined Total Percentage Yes 336, , , % No 118,095 76, , % 454, , ,291 Kristyna Colleen Ryan Cook County City of Chicago Combined Total Percentage Yes 350, , , % No 108,632 76, , % 459, , ,531 Debra B. Walker Cook County City of Chicago Combined Total Percentage Yes 352, , , % No 107,689 69, , % 459, , ,113 Ursula Walowski Cook County City of Chicago Combined Total Percentage Yes 342, , , % No 116,551 89, , % 459, , ,568 51
56 Increase Minimum Wage Cook County City of Chicago Combined Total Percentage Yes 483, ,775 1,017, % No 162,738 74, , % 645, ,819 1,254,623 Insurance/Birth Control Cook County City of Chicago Combined Total Percentage Yes 468, , , % No 192,196 90, , % 660, ,790 1,264,436 Millionaire Income Tax Cook County City of Chicago Combined Total Percentage Yes 436, , , % No 218, , , % 655, ,490 1,250,702 IL Mental-Health Funding Cook County City of Chicago Combined Total Percentage Yes 539, ,466 1,085, % No 119,043 52, , % 658, ,186 1,257,486 Gun-Sale Restrictions Cook County City of Chicago Combined Total Percentage Yes 556, ,655 1,092, % No 106,659 61, , % 662, ,294 1,261,027 Village of Barrington, Home Rule Cook County City of Chicago Combined Total Percentage Yes % No 1,236 1, % 2,091 2,091 Village of Berkeley, Electrical Aggregation Cook County City of Chicago Combined Total Percentage Yes % No % 1,360 1,360 52
57 Village of Burr Ridge, Stipends Cook County City of Chicago Combined Total Percentage Yes 1,185 1, % No % 1,696 1,696 City of Country Club Hills, Term Limits Cook County City of Chicago Combined Total Percentage Yes 3,893 3, % No 2,020 2, % 5,913 5,913 Village of Crestwood, Home Rule Cook County City of Chicago Combined Total Percentage Yes 1,004 1, % No 2,299 2, % 3,303 3,303 City of Des Plaines, Electrical Aggregation Cook County City of Chicago Combined Total Percentage Yes 7,696 7, % No 6,840 6, % 14,536 14,536 Village of Harwood Heights, ''Fly Quiet'' Cook County City of Chicago Combined Total Percentage Yes 1,539 1, % No % 1,715 1,715 Village of Harwood Heights, Noise Contour Cook County City of Chicago Combined Total Percentage Yes 1,652 1, % No % 1,737 1,737 Village of Indian Head Park, Heritage Center Cook County City of Chicago Combined Total Percentage Yes % No % 1,615 1,615 53
58 Village of Lynwood, Home Rule Cook County City of Chicago Combined Total Percentage Yes 1,191 1, % No 1,651 1, % 2,842 2,842 Village of Lyons, Sales Tax Cook County City of Chicago Combined Total Percentage Yes 1,345 1, % No % 2,280 2,280 Village of Matteson, Home Rule Cook County City of Chicago Combined Total Percentage Yes 3,281 3, % No 3,452 3, % 6,733 6,733 Village of Niles, Trustee Vacancy Cook County City of Chicago Combined Total Percentage Yes 5,021 5, % No 1,528 1, % 6,549 6,549 Village of Norridge, ''Fly Quiet'' Restrictions Cook County City of Chicago Combined Total Percentage Yes 2,934 2, % No % 3,258 3,258 City of Palos Heights, Issue Bonds Cook County City of Chicago Combined Total Percentage Yes 3,580 3, % No 2,200 2, % 5,780 5,780 City of Park Ridge, Library Tax Rate Cook County City of Chicago Combined Total Percentage Yes 8,515 8, % No 6,344 6, % 14,859 14,859 54
59 City of Park Ridge, Pollution Standards Cook County City of Chicago Combined Total Percentage Yes 12,470 12, % No 2,226 2, % 14,696 14,696 City of Prospect Heights, Appoint City Clerk Cook County City of Chicago Combined Total Percentage Yes 1,382 1, % No 2,209 2, % 3,591 3,591 City of Prospect Heights, Appoint City Cook County City of Chicago Combined Total Percentage Treasurer Yes 1,271 1, % No 2,315 2, % 3,586 3,586 Village of Riverdale, Medical Cannibas Cook County City of Chicago Combined Total Percentage Cultivation Yes 2,204 2, % No % 3,056 3,056 Village of Riverdale, Dispensing Medical Cannibas Cook County City of Chicago Combined Total Percentage Yes 2,191 2, % No % 3,042 3,042 Village of Riverdale, Parking Cook County City of Chicago Combined Total Percentage Yes 1,135 1, % No 1,864 1, % 2,999 2,999 Village of Riverside, Issue Bonds Cook County City of Chicago Combined Total Percentage Yes 2,668 2, % No % 3,464 3,464 55
60 Village of Summit, 911 Surcharge Cook County City of Chicago Combined Total Percentage Yes % No % 1,275 1,275 Village of Tinley Park, Term Limits Cook County City of Chicago Combined Total Percentage Yes 11,964 11, % No 3,567 3, % 15,531 15,531 Berwyn Township, Amend Constitution Cook County City of Chicago Combined Total Percentage Yes 7,051 7, % No 2,035 2, % 9,086 9,086 Oak Park Township, Universal Background Cook County City of Chicago Combined Total Percentage Checks Yes 18,364 18, % No 1,511 1, % 19,875 19,875 Oak Park Township, Trans Pacific Partnership Cook County City of Chicago Combined Total Percentage Yes 13,440 13, % No 4,797 4, % 18,237 18,237 Unincorporated Maine Township, Electricity Cook County City of Chicago Combined Total Percentage Yes 2,020 2, % No 1,081 1, % 3,101 3,101 Inverness Park District, Number of Commissioners Cook County City of Chicago Combined Total Percentage Yes 1,328 1, % No % 1,620 1,620 56
61 Lan Oak Park District, Increase Limiting Rate Cook County City of Chicago Combined Total Percentage Yes 3,601 3, % No 3,952 3, % 7,553 7,553 Gail Borden Public Library, Annexation Cook County City of Chicago Combined Total Percentage Yes 4,749 4, % No 1,903 1, % 6,652 6,652 Lemont Public Library District, Issue Bonds Cook County City of Chicago Combined Total Percentage Yes 4,059 4, % No 3,264 3, % 7,323 7,323 School District 79, Increase Limiting Rate Cook County City of Chicago Combined Total Percentage Yes % No % 1,364 1,364 School District 92 1/2, Increase Limiting Rate Cook County City of Chicago Combined Total Percentage Yes 2,881 2, % No 2,429 2, % 5,310 5,310 School District 157, Issue bonds Cook County City of Chicago Combined Total Percentage Yes 1,524 1, % No % 2,080 2,080 School District 169, Tax Extension Cook County City of Chicago Combined Total Percentage Yes % No %
62 High School District 86, Collective Bargaining Cook County City of Chicago Combined Total Percentage Yes % No % 1,139 1,139 High School District 203, Issue Bonds Cook County City of Chicago Combined Total Percentage Yes 17,351 17, % No 9,288 9, % 26,639 26,639 Elk Grove Rural Fire Prot District, # of Trustees Cook County City of Chicago Combined Total Percentage Yes % No % Palatine Rural Fire Protection Dist., Special Tax Cook County City of Chicago Combined Total Percentage Yes 1,851 1, % No 1,327 1, % 3,178 3,178 Medical Marijuana Sites Cook County City of Chicago Combined Total Percentage Yes 432, , % No 148, , % 581, ,545 FAA Noise Rules Cook County City of Chicago Combined Total Percentage Yes 451, , % No 124, , % 576, ,263 School Funding Formula Cook County City of Chicago Combined Total Percentage Yes 437, , % No 149, , % 587, ,215 58
63 Ban Metal Shredder P2W25 Cook County City of Chicago Combined Total Percentage Yes % No % Brown Line Flyover Cook County City of Chicago Combined Total Percentage Yes % No %
64 Cook County General Election Summary of Qualified Write ins CONT_NAME CAND_NAME TOTAL Senator, U.S. HILAIRE F. SHIOURA 9 Governor & Lieutenant Governor, Illinois ROBERT "CHICO" PEREZ, JR. 6 Governor & Lieutenant Governor, Illinois MICHAEL W. SCRUGGS 3 Governor & Lieutenant Governor, Illinois MARK SMITH 6 Governor & Lieutenant Governor, Illinois SCOTT SUMMERS 171 Governor & Lieutenant Governor, Illinois RYAN SWEENEY & AARON MERREIGHN 6 Secretary of State, State of Illinois SHELDON SCHAFER 214 Comptroller, State of Illinois TIMOTHY GOODCASE 33 U.S. Representative, 2nd District MARCUS LEWIS 119 U.S. Representative, 9th District PHIL COLLINS 63 State Representative, 78th District TOM DEMAS 8 Commissioner, County Board 1st District PERICLES ABBASI 1 November 4,
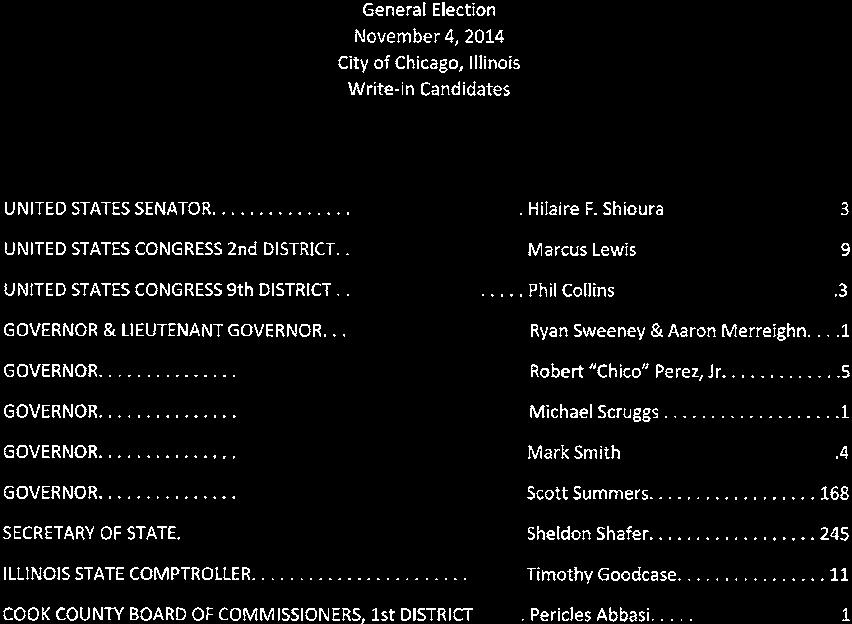
65 61


66 David Orr Cook County Clerk 69 W. Washington, Fifth Floor Chicago, IL cookcountyclerk.com
BANK OF AMERICA CHICAGO MARATHON EXTRA SERVICE SUNDAY, OCTOBER 8, 2017 (Wheelchair start 7:20 AM; Marathon start 7:30 AM)
") BANK OF AMERICA CHICAGO MARATHON EXTRA SERVICE SUNDAY, OCTOBER 8, 2017 (Wheelchair start 7:20 AM; Marathon start 7:30 AM) Line Train No. Direction BNSF 9400 Inbound: depart Aurora at 4:55 AM making stops
BANK OF AMERICA CHICAGO MARATHON EXTRA SERVICE SUNDAY, OCTOBER 8, 2017 (Wheelchair start 7:20 AM; Marathon start 7:30 AM) Line Train No. Direction BNSF 9400 Inbound: depart Aurora at 4:55 AM making stops
Hospital/Facility Type (Acute In-patient, LTAC, Rehabilitation, or Specialty) Address City Zip Phone. Hospital Name
 Address City Zip Phone. Hospital Name") Hospital Name Hospital/Facility Type (Acute In-patient, LTAC, Rehabilitation, or Specialty) Address City Zip Phone ADVENTIST BOLINGBROOK HOSPITAL ACUTE INPATIENT 420 MEDICAL CENTER DR BOLINGBROOK 60440
Hospital Name Hospital/Facility Type (Acute In-patient, LTAC, Rehabilitation, or Specialty) Address City Zip Phone ADVENTIST BOLINGBROOK HOSPITAL ACUTE INPATIENT 420 MEDICAL CENTER DR BOLINGBROOK 60440
Hospital/Facility Type (Acute In-patient, LTAC, Rehabilitation, or Specialty) ADDRESS City Zip Phone. Hospital Name
 ADDRESS City Zip Phone. Hospital Name") Hospital Name Hospital/Facility Type (Acute In-patient, LTAC, Rehabilitation, or Specialty) ADDRESS City Zip Phone ADVENTIST BOLINGBROOK HOSPITAL ACUTE INPATIENT 420 MEDICAL CENTER DR BOLINGBROOK 60440
Hospital Name Hospital/Facility Type (Acute In-patient, LTAC, Rehabilitation, or Specialty) ADDRESS City Zip Phone ADVENTIST BOLINGBROOK HOSPITAL ACUTE INPATIENT 420 MEDICAL CENTER DR BOLINGBROOK 60440
Education Options Strategy Chicago Board of Education June 26, Chicago Public Schools
 Education Options Strategy Chicago Board of Education June 26, 2013 Chicago Public Schools Chicago s Dropout Challenge An estimated 56,000 youth are out-of- school or significantly off-track for graduation.
2010 Taxi Inspection Program (effective 02/10/2010)
") 2010 Taxi Inspection Program (effective 02/10/2010) Applications for Chauffeur Licenses will be accepted between the hours of 8:00AM to Noon, Monday Friday. NORMAL processing time will be 5 BUSINESS days.
2010 Taxi Inspection Program (effective 02/10/2010) Applications for Chauffeur Licenses will be accepted between the hours of 8:00AM to Noon, Monday Friday. NORMAL processing time will be 5 BUSINESS days.
AGENDA. II. Approval of Meeting Minutes September 27, 2017 (Attachment A) Action Requested: Approval of the Minutes
 Action Requested: Approval of the Minutes") NORTHWEST MUNICIPAL CONFERENCE 1600 East Golf Road, Suite 0700 Des Plaines, Illinois 60016 (847) 296-9200 Fax (847) 296-9207 www.nwmc-cog.org A Regional Association of Illinois Municipalities and Townships
NORTHWEST MUNICIPAL CONFERENCE 1600 East Golf Road, Suite 0700 Des Plaines, Illinois 60016 (847) 296-9200 Fax (847) 296-9207 www.nwmc-cog.org A Regional Association of Illinois Municipalities and Townships
II. Approval of the March 22, 2012 Meeting Minutes (Attachment A) Action requested: Approval of minutes
 Action requested: Approval of minutes") NORTHWEST MUNICIPAL CONFERENCE 1616 East Golf Road Des Plaines, Illinois 60016 (847) 296-9200 Fax (847) 296-9207 www.nwmc-cog.org A Regional Association of Illinois Municipalities and Townships Representing
NORTHWEST MUNICIPAL CONFERENCE 1616 East Golf Road Des Plaines, Illinois 60016 (847) 296-9200 Fax (847) 296-9207 www.nwmc-cog.org A Regional Association of Illinois Municipalities and Townships Representing
DuPage County Community Services 421 N. County Farm Road Wheaton, IL (630)
") DuPage County Community Services 421 N. County Farm Road Wheaton, IL 60187 (630) 407-6500 1-800-942-9412 HEATING SITES PLEASE CALL FIRST TO SEE IF SITE IS OPEN DURING EXTREME COLD! ADDISON The Addison
DuPage County Community Services 421 N. County Farm Road Wheaton, IL 60187 (630) 407-6500 1-800-942-9412 HEATING SITES PLEASE CALL FIRST TO SEE IF SITE IS OPEN DURING EXTREME COLD! ADDISON The Addison
Illinois Statewide Central Line-associated Blood Stream Infection Report (CLABSI) Neonatal and Pediatric Intensive Care
 Neonatal and Pediatric Intensive Care") Illinois Statewide Central Line-associated Blood Stream Infection Report (CLABSI) Neonatal and Pediatric Intensive Care Health Care Associated Infections s in Illinois are participating in programs to
Illinois Statewide Central Line-associated Blood Stream Infection Report (CLABSI) Neonatal and Pediatric Intensive Care Health Care Associated Infections s in Illinois are participating in programs to
DuPage County Community Services 421 N. County Farm Road Wheaton IL (630) Income Tax Services 2013
 Income Tax Services 2013") DuPage County Community Services 421 N. County Farm Road Wheaton IL 60187 (630) 407-6500 1-800-942-9412 Income Tax Services 2013 Aurora Cowherd Middle School 441 N. Farnsworth Ave. (Farnsworth & Grove
DuPage County Community Services 421 N. County Farm Road Wheaton IL 60187 (630) 407-6500 1-800-942-9412 Income Tax Services 2013 Aurora Cowherd Middle School 441 N. Farnsworth Ave. (Farnsworth & Grove
All CountyCare Primary Care Medical Home Sites - By Geographic Region
 All CountyCare Primary Care Medical Home Sites - By Region Health Address Zip Code ACCESS at Anixter 2020 N. Clybourn Ave., 60614 Northside 773-404-5277 M, Tu, W: 8:30am- Th, F: 8:30am-4pm ACCESS at St.
Blue Medicare Advantage PPO Contracted Providers
 Appendix D Blue Medicare Advantage PPO Contracted Providers Ambulatory Surgicenters... 2 Durable Medical Equipment... 4 Hearing Aid 6 Home Health Care.. 7 Home Infusion 10 Hospice... 11 Inpatient Metro
Blue Medicare Advantage PPO Contracted Providers
 Appendix D Blue Medicare Advantage PPO Contracted Providers Ambulatory Surgicenters... 2 Durable Medical Equipment... 4 Hearing Aid 6 Home Health Care.. 7 Home Infusion 10 Hospice... 11 Inpatient Metro
City of Chicago Department of Business Affairs and Consumer Protection
 City of Department of Business Affairs and Consumer Protection TAXICAB INDUSTRY NOTICE December 29, 2011 Notice No. 11-061 UPDATED PHYSICAL EXAMINATION CERTIFICATION FORM Please note: Some minor changes
Fall Haul IL 2014 Donation Challenge Other Schools Participating Week 5 FINAL November 1 through November 30
 Fall Haul IL 2014 Donation Challenge Other Schools Participating Week 5 FINAL November 1 through November 30 Grand Total 656,762 Number of 5-Star Learning Ranch (Batavia) 100 A Vito Martinez Middle School
DISCHARGE PLANNERS RESOURCE NOTEBOOK (DPRN) CHICAGO SOUTHLAND, WILL & NORTHWEST INDIANA
 CHICAGO SOUTHLAND, WILL & NORTHWEST INDIANA") RESOURCES OR AGING WELL Summer - Winter 2017 DISCHARGE PLANNERS RESOURCE NOTEBOOK (DPRN) CHICAGO SOUTHLAND, WILL & NORTHWEST INDIANA RESOURCES OR AGING WELL APRIL SEPTEMBER 2017 REE CHICAGO SOUTHLAND,
RESOURCES OR AGING WELL Summer - Winter 2017 DISCHARGE PLANNERS RESOURCE NOTEBOOK (DPRN) CHICAGO SOUTHLAND, WILL & NORTHWEST INDIANA RESOURCES OR AGING WELL APRIL SEPTEMBER 2017 REE CHICAGO SOUTHLAND,
PREPARATION PACKET FOR THE KENNEDY-KING COLLEGE 6343 S. HALSTED ST. - BLDG W, CHICAGO
 PREPARATION PACKET FOR THE 2018 EXPUNGEMENT SUMMIT Learn how to get your RAP Sheet and/or Criminal History Record; NEW SEALING LAW for almost ALL FELONIES; availability of Drug Testing; Expungement and
Upgrading Voter Registration in Florida
 Upgrading Voter Registration in Florida David Becker Director, Election Initiatives 1 2012: Florida Snapshot Below National Average of 71.2% 2 Change in Voting Age Population (VAP), 2008-2012 U.S. Census
THE CRUCIAL NEED TO Transform THE METRA POLICE DEPARTMENT A Comprehensive Assessment of the Department s Mission, Leadership and Operations
 THE CRUCIAL NEED TO Transform THE METRA POLICE DEPARTMENT A Comprehensive Assessment of the Department s Mission, Leadership and Operations Protecting What Matters August 28, 2013 Mr. Alex Wiggins Deputy
NOTICE OF PRIVACY PRACTICES
 NOTICE OF PRIVACY PRACTICES THIS NOTICE OF PRIVACY PRACTICES IS BEING PROVIDED TO YOU AS REQUIRED BY THE HEALTH INSURANCE PORTABILITY AND ACCOUNTABILITY ACT ( HIPAA ). IF YOU WISH TO RECEIVE A PAPER COPY
City of Chicago Department of Business Affairs and Consumer Protection
 City of Department of Business Affairs and Consumer Protection TAXICAB INDUSTRY NOTICE December 6, 2011 Notice No. 11-057 UPDATED PHYSICAL EXAMINATION CERTIFICATION FORM Pursuant to Municipal Code of section
Listed below are the states in which GIFT has registered to solicit charitable donations and includes the registration number assigned by each state.
 Listed below are the states in which GIFT has registered to solicit charitable donations and includes the registration number assigned by each state. Alabama: AL16-188 Consumer Protection 501 Washington
WELCOME TO THE 65TH ANNUAL COLLEGE NIGHT 2016! AT SCOTCH PLAINS-FANWOOD HIGH SCHOOL Tuesday, November 1, 2016 at 7:00 P.M. Don't Miss It!!!
 WELCOME TO THE 65TH ANNUAL COLLEGE NIGHT 2016! AT SCOTCH PLAINS-FANWOOD HIGH SCHOOL Tuesday, November 1, 2016 at 7:00 P.M. Don't Miss It!!! As of 10/14/16 Name of College/University or Branch of Military
NATIONAL DEBATE TOURNAMENT
 NATIONAL DEBATE TOURNAMENT Spring 2016 Report Spring 2016 Report PREPARED BY Dr. Jim Hanson Climb the Mountain Speech & Debate Foundation Email: jim@climbthemountain.us Based on the tabroom.com Results
Community Health Needs Assessment
 Community Health Needs Assessment 2014 2016 December 2016 Thank you for taking the time to learn more about Advocate South Suburban Hospital and its mission to serve the residents of Hazel Crest and the
NATIONAL DEBATE TOURNAMENT
 NATIONAL DEBATE TOURNAMENT Fall 2017 Report Fall 2017 Report PREPARED BY Dr. Jim Hanson Climb the Mountain Speech & Debate Foundation Email: jim@climbthemountain.us Based on the tabroom.com Results Page
NATIONAL DEBATE TOURNAMENT
 NATIONAL DEBATE TOURNAMENT Spring 2017 Report Spring 2017 Report PREPARED BY Dr. Jim Hanson Climb the Mountain Speech & Debate Foundation Email: jim@climbthemountain.us Based on the tabroom.com Results
RECOUNT RULES & VOTING SYSTEMS
 state s be ed nces is permitted Voter ID Required Voting Systems Manufacturer AL Not more than 1/2 of 1% No provisions for. Non-photo ID AK Tie Vote Losing cand. or 10 voters may. Non-photo ID DRE with
Sacrament of Confirmation for Adults Spring 2017
 Sacrament of for Adults Spring Parishes and Vicariate Bishops are scheduling adult celebrations for adults. Active Catholics, age 19 and older who have celebrated the sacraments of Baptism and Eucharist
PRIMARY ELECTION FACT SHEET
 PRIMARY ELECTION FACT SHEET Election Date: Tuesday, June 7, 2016 Poll Hours: Voter Registration Deadlines: Where to Register: Registration Changes: Absentee Voting: 7:00 am to 9:00 pm Mail voter registration
Training 2014 June Republican Primary. Sign in for training Complete machine assignment Silence your cell phones
 Training 2014 June Republican Primary Sign in for training Complete machine assignment Silence your cell phones Introductions Amy Gambrill (703) 792-6473 agambrill@pwcgov.org Recruitment Who do you want
November 7, 2017 Bond Proposal FREQUENTLY ASKED QUESTIONS
 HISTORY AND FEATURES November 7, 2017 Bond Proposal FREQUENTLY ASKED QUESTIONS 1. What is on the November 7, 2017 ballot? On November 7, 2017, voters in Concord Community Schools will be asked to consider
Figure 10: Total State Spending Growth, ,
 26 Reason Foundation Part 3 Spending As with state revenue, there are various ways to look at state spending. Total state expenditures, obviously, encompass every dollar spent by state government, irrespective
Sacrament of Confirmation for Adults Spring 2015
 Sacrament of for Adults Spring 2015 Parishes and Vicariate Bishops are scheduling adult celebrations for adults. Active Catholics, age 19 and older who have celebrated the sacraments of Baptism and Eucharist
SNOW PLOW COMPETITION FINAL RESULTS
 SNOW PLOW COMPETITION 2014 - FINAL RESULTS Rank Rank: 1 : 635 Team #: 20 Mount Prospect, Village of Sean Eisen Kevin DeLuca Rank: 2 : 593 Team #: 36 Bolingbrook, Village of CR Jones Brian Calderon Rank:
Annual Report 2014 EVERGREEN PARK FIRE DEPARTMENT
 Annual Report 2014 EVERGREEN PARK FIRE DEPARTMENT Village of Evergreen Park Mayor Village Clerk Trustee Trustee Trustee Trustee Trustee Trustee James J. Sexton Catherine T. Aparo Daniel F. McKeown Carol
District 86 College Fair April 19, 2018 Hinsdale South High School
 Albion College Alma College Alverno College American Academy of Art Andrews University Aquinas College Arizona University Augustana College Aurora University Ball University Baylor University Belmont University
Medicare Supplement Insurance Plans. Apply with the recognized Illinois leader for your health care insurance needs.
 Medicare Supplement Insurance Plans Apply with the recognized Illinois leader for your health care insurance needs. Be one of the more than 40,000 members who have coverage from the Illinois leader...
List of Other Schools Participating
 List of Other Schools Participating Grand Total 568,333 Reminder: this promotion is restricted to elementary and middle schools only (K-8) in our service territory. Other schools may be listed below in
Dashboard. Campaign for Action. Welcome to the Future of Nursing:
 Welcome to the Future of Nursing: Campaign for Action Dashboard About This Dashboard: These graphs and charts show goals by which the Campaign evaluates its efforts to implement recommendations in the
BlueFor contracting institutional and professional providers
 REVIEW BlueFor contracting institutional and professional providers What s Inside? BeSmart. BeWell Videos Now Available on DVD... 2 How We re Helping Members Manage Chronic Conditions...3 Special Beginnings
Martin J. Luby, University of Texas at Austin and the University of Illinois Institute of Government and Public Affairs
 FEBRUARY 2017 ISSUE BRIEF The Feds giveth and the Feds taketh away: The budget sequester means Illinois governments could lose hundreds of millions in federal bond subsidies Martin J. Luby, University
Election Summary Report General Election Audubon County, Iowa - November 6, 2012 Audubon Nov, Official % %
 Page 1 of 5 StraightTicketSelection State Senate District 06 2 of 2 Precincts Reporting 554 REPUBLICAN PARTY 310 55.96% DEMOCRATIC PARTY 244 44.04% President and Vice President 3,457 Mitt Romney Paul Ryan
Organization Sponsoring the Event: Austin Austin Health Center of Cook County
 Organization Sponsoring the Event: AIDS Foundation of Chicago Place of Event: The Bridge Project - DHS sites every Tuesday and Wednesday for June 2012 Event Location: 5323 S. Western Ave., Chicago, IL
Elks National Foundation Chicago Northshore, IL Lodge No. #1316 Distance 8.93 miles Cicero-Berwyn, IL Lodge No. #1510 Distance 9.
 SUBMITTING YOUR APPLICATION Thank you your interest in the 2014 Most Valuable Student scholarship application. This page contains the basic details about submitting your application. For complete application
Northwest Community EMS System
 Northwest Community EMS System Partners in innovation Standing in the gap for you every day! It all began with Jan and Stan Jan Schwettman Dr. Zydlo Gov. Olgilvie They held endless meetings to create EMS
GAIL BOUSHEY & JOAN MOSER THE SISTERS
 Suburban Council of the International Reading Association and National Louis University present: Fostering Literacy Independence in the Elementary Grades Featuring GAIL BOUSHEY & JOAN MOSER THE SISTERS
March 2014 Volume XIIII Issue III
 avolume XIII PrkRidgeFireDepartmentOURMISSION:TOLIMITTHELOSSOFLIFEANDPROPERTYTHROUGHPLANNING,PREVENTIONANDRESPONSEOn March 14, 2014, Candidate FF/PM Daniel Vaci graduated from NIPSTA (Northeastern Illinois
Dane County Municipalities In-Person Voting Information
 Town of Albion Town of Berry Town of Black Earth Town of Blooming Grove Mon- Fri 8 am to 1pm and by appointment 608-774-4622 Town Hall 620 Albion Rd Mon, Tue, Thu, Fri 7:30 am- 4pm; Wed 7:30 am- 10am;
Big Money, Money from Outside Chicago, Dominates Mayoral Race
 Big Money, Money from Outside Chicago, Dominates Mayoral Race In the wake of the Supreme Court s decisions undermining campaign finance rules, most notably Citizens United v FEC, our elections have become
2018 American Legion Alabama Boys State
 2018 American Legion Alabama Boys State Sunday, May 27, 2018 9:00-2:00 pm Registration Presidential 1 Lobby 11:00-1:30 pm Lunch Fresh Foods 1:00 1:45 pm Veteran s Reception Military & Veterans Affairs
EAC Survey. Pat Wolfe Elections Administrator
 EAC Survey Pat Wolfe Elections Administrator EAC Survey Election Assistance Commission (EAC) issues survey every two years Required by the Help America Vote Act (HAVA) Survey gathers information on federal
Background Materials
 Background Materials Prepared by the Los Angeles City Ethics Commission May 2006 (213) 978-1960 http://ethics.lacity.org preserving the public trust City Ethics Commission Gil Garcetti President Bill Boyarsky
Putting coastal and Great Lakes science to work for communities since 1968
 Putting coastal and Great Lakes science to work for communities since 1968 Jonathan Pennock, Jim Hurley & Amber Mace National Association of Marine Laboratories March 2018 Photo: Coastal marsh, Maryland
National Bureau for Academic Accreditation And Education Quality Assurance ACTUARIAL SCIENCE
 1 ABILENE CHRISTIAN ABILENE TX B 2 APPALACHIAN STATE BOONE NC B 3 ARIZONA STATE - TEMPE TEMPE AZ B 4 BAYLOR WACO TX B 5 BENTLEY ^ WALTHAM MA B 6 BOSTON ^ BOSTON MA M 7 BOWLING GREEN STATE BOWLING GREEN
An Analysis of USDA Farm Program Payments and Rural Development Funding In Low Population Growth Rural Counties
 An Analysis of USDA Farm Program Payments and Rural Development Funding In Low Population Growth Rural Counties Jon M. Bailey Kim Preston Center for Rural Affairs Rural Research and Analysis Program July
SEASON FINAL REGISTRATION REPORTS
 Materials Included: 2012-2013 SEASON FINAL REGISTRATION REPORTS 2011-12 & 2012-13 Comparison by Group 2 2012-13 USA Hockey Member Counts 3 2012-13 Non-Participant Membership Information 4 2012-13 8 and
2018 Spring Primary (February 20) - In-Person Absentee Voting Information for Dane County
 - In-Person Absentee Voting Information for Dane County") Town of Albion Monday thru Thursday 8:00 a.m. to 3:00 p.m., office closed on Friday. The clerk will be available on Friday, February 16th. 884-8974 Town Hall 620 Albion Rd Town of Berry Monday, Tuesday,
Town of Albion Monday thru Thursday 8:00 a.m. to 3:00 p.m., office closed on Friday. The clerk will be available on Friday, February 16th. 884-8974 Town Hall 620 Albion Rd Town of Berry Monday, Tuesday,
Working with Gift Funds
 Working with Gift Funds Robert W. Groves Vice President Sarah Blanck Director, Finance & Endowments Slide 1 University Advancement Bob Groves Vice President University Advancement Scott Westerman Assoc.
SURVEY RESULTS. State of Illinois Alzheimer s Disease Annual Survey. Dear Friends,
 SURVEY RESULTS State of Illinois lzheimer s Disease nnual Survey Dear Friends, I am very pleased to share with you the results of the lzheimer s ssociation, Illinois Chapter s 2016 State of Illinois lzheimer
National Bureau for Academic Accreditation And Education Quality Assurance
 1 ARKANSAS STATE UNIVERSITY - JONESBORO STATE UNIV. AR B 2 BALL STATE UNIVERSITY MUNCIE IN BM 3 BOSTON UNIVERSITY ^ BOSTON MA BM 4 BRIGHAM YOUNG UNIVERSITY PROVO UT B 5 CALIFORNIA STATE UNIVERSITY - FULLERTON
Union Pacific Railroad Black Employee Network's Jerry Morris and Summer Houston Memorial Scholarship
 Jerry Morris and Summer Houston Memorial Scholarship TO: FROM: SUBJECT: All Scholarship Applicants Black Employee Network of Union Pacific Union Pacific Railroad Black Employee Network's Jerry Morris and
Loras College Statewide Survey April 2015
 Loras College Statewide Survey April 0 Field Dates: April, 0 Completed Surveys: 000 Margin of Error: +/.% (for total sample),.% for Republican subsample,.% for Democratic Subsample Note on Methodology:
Federal Voting Assistance Program (FVAP) Department of Defense. Military Voter Training
 Department of Defense. Military Voter Training") Federal Voting Assistance Program (FVAP) Department of Defense Military Voter Training 1 Introduction If you wish to complete you Voter Registration and Absentee Ballot Request Form, click here. If you
Federal Voting Assistance Program (FVAP) Department of Defense Military Voter Training 1 Introduction If you wish to complete you Voter Registration and Absentee Ballot Request Form, click here. If you
Georgia Militia Districts
 Georgia Militia Districts By Alex M. Hitz [Reprinted from Georgia Bar Journal, Vol. 18, No. 3 (February, 1956), and published with the permission of the Georgia Bar Association.] The active, organized
Seattle Public Schools Five Year School Projections ( ) Last Updated: 10/19/2016
 Last Updated: 10/19/2016") Student Assignment and Projections Overview Seattle Public Schools elementary, middle, and high school students are initially assigned to a designated attendance area school based on where the student
Student Assignment and Projections Overview Seattle Public Schools elementary, middle, and high school students are initially assigned to a designated attendance area school based on where the student
01/15/ EIU Students Initiated Into Kappa Delta Sororityl.pdf
 Eastern Illinois University The Keep 1999 Press Releases 1-15-1999 01/15/1999 - EIU Students Initiated Into Kappa Delta Sororityl.pdf University Marketing and Communications Follow this and additional
NATIONAL DEBATE TOURNAMENT
 NATIONAL DEBATE TOURNAMENT Spring 2018 Report Spring 2018 Report PREPARED BY Dr. Jim Hanson Seattle University Climb the Mountain Speech & Debate Foundation Email: jim@climbthemountain.us Based on the
COMBINED AGENCY RESPONSE TEAM (C.A.R.T.) CENTRAL BOARD MEETING MINUTES. March 12, 2013
 CENTRAL BOARD MEETING MINUTES. March 12, 2013") COMBINED AGENCY RESPONSE TEAM (C.A.R.T.) CENTRAL BOARD MEETING MINUTES March 12, 2013 The meeting of the CART Central Board was called to order at 09:03 hrs by Chairperson Bruce Boyle at the Orland Park
COMBINED AGENCY RESPONSE TEAM (C.A.R.T.) CENTRAL BOARD MEETING MINUTES March 12, 2013 The meeting of the CART Central Board was called to order at 09:03 hrs by Chairperson Bruce Boyle at the Orland Park
Higher Education Employment Report
 Higher Education Employment Report First Quarter 2017 / Published September 2017 Executive Summary The number of jobs in higher education increased 0.6 percent, or 22,100 jobs, during the first quarter
Chicago Department of Public Health Mental Health Services Transition Report
 Chicago Department of Public Health Mental Health Services Transition Report Overview In 2012, the Chicago Department of Public Health (CDPH) implemented a mental health reform plan to improve the quality
CITY OF GRANTS PASS SURVEY
 CITY OF GRANTS PASS SURVEY by Stephen M. Johnson OCTOBER 1998 OREGON SURVEY RESEARCH LABORATORY UNIVERSITY OF OREGON EUGENE OR 97403-5245 541-346-0824 fax: 541-346-5026 Internet: OSRL@OREGON.UOREGON.EDU
Friends NEWS Volume 10, Issue 1 Cook County, Illinois Winter 2010
 www.fotfp.org Friends NEWS Volume 10, Issue 1 Cook County, Illinois Winter 2010 Firing underlines need for board separation Just six weeks after Doug Chien started in an important leadership position with
14 th Annual Business Excellence Awards. January 28 th, The most glamorous event of the season. Orléans Chamber of Commerce
 14 th Annual Business Excellence Awards January 28 th, 2016 The most glamorous event of the season. Orléans Chamber of Commerce 2 Award Nomination Kit Nomination Categories Public Votes 1. Small Business
2015 Major Field Test Comparative Data Guide Major Field Test for Political Science
 2015 Major Field Test Comparative Data Guide Major Field Test for Political Science The annual Comparative Data Guide (CDG) contains tables of scaled scores and percentiles for individual student scores
NUMBERED KEY CANVASS Benton County, Oregon General Election RUN DATE:11/17/08 02:33 PM November 4, 2008 REPORT-EL52 PAGE 0001
 Benton County Elections, Oregon - November 4, 2008 - Page 1 of 55 RUN DATE:11/17/08 02:33 PM November 4, 2008 REPORT-EL52 PAGE 0001 TOTAL PERCENT TOTAL PERCENT 01 = REGISTERED VOTERS - TOTAL 52,085 03
School Placements Comprehensive- Actual
 Placements 20-202 Comprehensive- Actual / Agency reit: First Service Learning (ED ) Tier One A First Teacher Shadow Exp. (ED ) ** see note below Local (EDUC 22) Urban Week (EDUC 22) 5-2/K-2 Urban Week
Peerless Pump Company Sales Contact List
 Sales Contact List Direct Sales Contact List... Pg. 2 Business Partner Sales Contact List... Pg. 4 International Sales Contact list... Pg. 6 Application Engineers... Pg. 7 LaBour Sales Contact List...
Michigan Fall Training
 2016 Michigan Fall Training Meet the Instructors Bill Allen Chris Carlisle Terry Haworth Don Metrish Munch s Supply Bill Allen is a commercial specialist with Munch s Supply. He joined the company in 1993
ASA Survey Results for Commercial Fees Paid for Anesthesia Services practice management
 practice management ASA Survey Results for Commercial Fees Paid for Anesthesia Services 2013 Stanley W. Stead, M.D., M.B.A Sharon K. Merrick, M.S., CCS-P Thomas R. Miller, Ph.D., M.B.A. ASA is pleased
2018 Debate State Final Qualifier Information
 2018 Debate State Final Qualifier Information State Finals 2018 State Debate Information Manual Table of Contents... 2 Letter of Welcome... 3 Tournament Locations... 4 Registration... 4 UIS Campus Diagram...
Marion County, Iowa Voting Precincts & Polling Place Locations
 T17 G28 Place IA 102 T15 T76N R18W E 1st St. Farmer St. E 15th St. E 15th St E 16th St Vermeer Rd. (Sharon St.) Sharon St. St. Union St. Trinity Reformed Church Activity Center 708 E. Second Independence
Defense-State Liaison Office. USA 4 Military Families Initiative
 Defense-State Liaison Office USA 4 Military Families Initiative Overview DoD-State Liaison Office (DSLO) Ten Key Issues: Issues & Outcomes What Does This Mean for Your Families, and Your State? 2 Regional
Legislative Update: New Illinois State Laws. Would you like to switch to a green Blue Review? What s Inside? September 2009
 September 2009 What s Inside? New Account Groups... 3 View Managed Care Updates Online... 3 Availity Implements Electronic Edit... 4 In the Know: Taxonomy Codes... 5 Professional Network Consultants...
Poverty and Health. Frank Belmonte, D.O., MPH Vice President Pediatric Population Health and Care Modeling
 Poverty and Health Frank Belmonte, D.O., MPH Vice President Pediatric Population Health and Care Modeling An iconic image of child poverty Children Living in Poverty 4 Healthcare Services Account for $19.2
NSSE 2017 Selected Comparison Groups Ohio University
 NSSE 2017 Selected Groups IPEDS: 204857 About This Report Groups The NSSE Institutional Report displays core survey results for your students alongside those of three s. In May, your institution was invited
Newsletter. March Now Hiring. Board of Review. Honoring Yesterday. Building Tomorrow. In This Edition. Township Calendar
 Newsletter March 2014 In This Edition Now Hiring. Page 1 Board of Review... Page 1 Election Information Page 2 Parks and Rec Board Vacancies... Page 2 Skywarn 2014... Page 3 2014 Siren Test Schedule..
WELCOME TO THE 66 TH ANNUAL COLLEGE NIGHT 2017!! AT SCOTCH PLAINS-FANWOOD HIGH SCHOOL Wednesday, November 1, 2017 AT 7:00 PM. Don t Miss It!!!!
 WELCO TO THE 66 TH ANNUAL COLLEGE NIGHT 2017!! AT SCOTCH PLAS-FANWOOD HIGH SCHOOL Wednesday, November 1, 2017 AT 7:00 PM Don t Miss It!!!! As of 10/3/2017 146 schools are in attendance: College/University
College Fairs - Fall 2013
 College Fairs - Fall 2013 City State Date of Program Start Time End Time Arizona Brophy/Xavier College Night Phoenix AZ 10/14/2013 7:00 p.m. 9:00 p.m. Mesa OP-Shop College Fair Mesa AZ 10/14/2013 6:00
College Profiles - Navy/Marine ROTC
 Page 1 of 6 The U.S. Navy and Marine Corps are a team that provides for our national defense. The men and women who serve are called on to provide support at sea, in the air and on land. The Navy-Marine
Summary of 2011 National Radon Action Month Results
 Summary of 2011 National Radon Action Month Results This document summarizes the results of the 2011 National Radon Action Month (NRAM). The summary describes the total number of 2011 activities compared
'."- "AUTOMATED EXTERNAL DEFIBRILLATOR PROGRAM LEGISLATIVE REPORT
 990228 1999 "AUTOMATED EXTERNAL DEFIBRILLATOR PROGRAM LEGISLATIVE REPORT DEPARTMENT OF PUBLIC SAFETY Office of the Commissioner 445 Minnesota Street, Suite 1000 North Central Life Tower St. Paul, Minnesota
North Carolina Central University Contact Information for Filing Student Complaints
 North Carolina Central University Contact Information for Filing Student Complaints Please click on the appropriate state for information regarding the process for filing a student complaint within the
Election Night Reporting Guide
 Election Night Reporting Guide General Primary/ General Nonpartisan/Special Election July 31, 2012 Table of Contents Overview of Georgia Election Night Reporting... 3 How do I access Election Night Reporting?...
NSTC COMPETITIVE AREA DEFINITIONS. UIC Naval Service Training Command (NSTC), Great Lakes, IL
, Great Lakes, IL") NSTC COMPETITIVE AREA DEFINITIONS UIC 00210 Naval Service Training Command (NSTC), Great Lakes, IL UIC 00210 NSTC, N8, Pensacola, FL UIC 0763A Recruit Training Command, Great Lakes, IL NSTC Pensacola Programs,
NSTC COMPETITIVE AREA DEFINITIONS UIC 00210 Naval Service Training Command (NSTC), Great Lakes, IL UIC 00210 NSTC, N8, Pensacola, FL UIC 0763A Recruit Training Command, Great Lakes, IL NSTC Pensacola Programs,
Cook County Health and Hospitals System
 Cook County Health and Hospitals System Presentation to Inform Strategic Plan NURSING MANAGEMENT Agnes Therady, RN, MSN, MBA, FACHE, NEA-BC April 21, 2016 Building a high quality, safe, reliable, patient-centered,
National Youth Leadership Training Recognitions & Guidelines
 National Youth Leadership Training Recognitions & Guidelines Central Region NYLT Committee The Central Region NYLT Committee is comprised of volunteer representation from each Area, a volunteer Regional
WBUR Poll Survey of 500 Registered Nurses in Massachusetts Field Dates: October 5-10, 2018
 Conducted for WBUR by WBUR Poll Survey of 500 Registered Nurses in Massachusetts Field Dates: October 5-10, 2018 Which of the following best describes your main place of work as a nurse? A teaching hospital
State Finals State Debate Information Manual
 State Finals 2017 State Debate Information Manual Table of Contents... 1 Letter of Welcome... 2 Tournament Locations... 3 Registration... 3 UIS Campus Diagram... 4 Parking Information... 5 Tentative Time