Alaska Mental Health Trust Workforce Development Initiative
|
|
|
- Sandra Short
- 6 years ago
- Views:
Transcription
1 Alaska Mental Health Trust Workforce Development Initiative An Overview of Workforce Related Data & Strategies to Address the Gaps Prepared by the Western Interstate Commission for Higher Education (WICHE) Mental Health Program For: The Alaska Mental Health Trust Authority Steering Committee Contacts: Mimi Bradley, Psy.D. Scott Adams, Psy.D.
2 Introduction Access to health services in Alaska is seriously challenged by shortages across the professional and paraprofessional workforce. Alaska shares this problem with other rural and frontier States, but the challenges are magnified by the diversity of populations and their wide dispersion across the vast landmass of Alaska. The Alaska Mental Health Trust Authority (referred to as the Trust for the remainder of this document) expressed the desire to develop a comprehensive workforce plan, serving all Trust beneficiary areas, to articulate an agreed upon set of action steps to facilitate the preparation and continuing education of a qualified health workforce. The beneficiaries of The Trust are Alaskans who experience mental illness; developmental disabilities; chronic alcoholism; or Alzheimer's disease and related dementia. While the individuals in these beneficiary areas often experience unique issues and require different approaches to treatment, workforce concerns span all areas. The Mental Health Trust Authority, in partnership with the State Division of Behavioral Health, and the University of Alaska System brought stakeholders together to strategically discuss and examine the workforce trends and demands in Alaska, including recruitment, retention, education, training, and career opportunities. The goal of this project is to expand upon the current workforce efforts and to increase communication between systems and initiatives to foster a more coordinated strategy that maximizes resources and decreases duplication. This document is not meant to be exhaustive but will attempt to provide an overview of current workforce efforts for Trust beneficiary areas. The data provided in this report was used to guide the Workforce Steering Committee in identifying priorities for future resources and collaboration and to create a strategic implementation plan with specific deliverables and timelines. A Phased Approach The Trust asked the WICHE Mental Health Program (WICHE MHP) to help facilitate this project. The WICHE MHP has a history of work in Alaska, including working on behavioral health workforce initiatives, community readiness assessments, and system of care integration projects. This participatory project unfolded over the following three phases. Phase I: The Alaska Trust Workforce Development Steering Committee was formed to guide this project and includes personnel from the Trust, as well as representatives from many leading institutions and provider agencies that serve Trust beneficiary areas (see the Steering Committee list in Appendix A). The Steering Committee is composed of leaders who are committed to implementing a workforce plan. They bring experience, ideas, and resources to recruit colleagues and execute the plan in their respective institutions. Phase II: In collaboration with the Alaska Trust Authority Workforce Development Steering Committee, the WICHE MHP prepared a report that provided an overview of the current status of workforce development efforts in Alaska. This report describes available data reflecting the current and projected workforce needs and review existing efforts. This narrative served to 2
3 inform those engaged in the development of the Alaska Trust Authority Workforce Development Plan with essential background information to support the planning process. The Steering Committee met Tuesday, April 25, 2006 at the Alaska Psychiatric Institute (API). At this meeting, the Steering Committee discussed the goals and reached agreement regarding the process for developing and vetting the Alaska Trust Workforce Development Plan. The Steering Committee accomplished the following: Identified information sources for the data report. Identified key stakeholders for inclusion in the Phase III planning process. Determined the format for a Phase III Planning Meeting with broad stakeholder involvement. Determined the focus areas for Phase III planning. Phase III: WICHE MHP facilitated a day and a half small work group planning meeting, hosted by the Trust, to review the report. WICHE MHP facilitated a planning process to assist the Trust in developing a Workforce Development Plan with strong stakeholder support and consensus. The accomplishments of this phase include: WICHE MHP conducted a day and a half statewide meeting on May 24 and 25, 2006 in Anchorage, with a wide array of stakeholders concerned with health workforce development. This meeting developed a set of strategies for the Trust to include in the final plan document. The Steering Committee met for two working conference calls to review and edit the strategies generated at the May meeting. Steering Committee members also provided budget estimates for various workforce projects. Developed a final strategic planning document (this document) that the Trust can further vet with its constituents and stakeholders prior to formal adoption. The next sections will cover available data regarding workforce trends in Alaska and results of the strategic planning process including goals, strategies, and action steps. 3
4 Context: Workforce Components and Trends At any given time, the need for workforce development in healthcare is determined by the prevalence of disease or disorders and the number and location of professionals to provide services. Prevalence rates are based on epidemiological studies of populations, while the number and location of clinicians is based on the interplay of education and occupation trends. Additionally, a competent and adequate workforce has the right number of experienced and skilled people in the right jobs at the right time. Thus, establishing and sustaining an effective behavioral health workforce involves several components: A profile of present population and demographics; An estimation of the prevalence of mental illness; An analysis of the professional occupations available to serve the community; A picture of the higher education programs designed to supply well-trained professionals. Population Prevalence Healthcare Workforce Occupations Education Each of these four components interrelates, and changes to one often affect the others. For instance, large and rapid increases in population can translate into greater numbers of people with a behavioral health problem (even if percentage remains the same). But it can also mean more people available to enter the behavioral health field as clinicians. Thus, it is important to study previous trends to project future courses. More importantly, these projections allow decision-makers to identify potential avenues of growth, as well as barriers and means of overcoming them. Alaska has been addressing workforce shortages for the past several years with various committees and initiatives. For example, in 2003, the University of Alaska (UA) system convened a meeting of educators from disciplines spanning the behavioral health field to discuss how they can most effectively address workforce shortages, especially in rural areas. Despite a number of productive efforts in the UA system to develop an effective workforce that is trained in rural behavioral health, educators in Alaska see that more work needs to be done and are committed to formalizing workforce development activities that ensure the needs of Alaskans are 4
5 met. Based on the meeting in 2003 regarding behavioral health workforce development in Alaska, educators in University of Alaska behavioral health programs developed recommendations in the areas of collaboration, education, financing, and evaluation and research (See Appendix B). Considerable momentum and progress has been made following this meeting, with the help of the Alaska Mental Health Trust Authority, which supported seven of the programs that were created or continued as a result of the meeting. These programs included the UAA/UAF Joint Ph.D. in Psychology, the Alaska Rural Behavioral Health Training Academy, UAA Masters in Social Work by Distance, UAF Bachelor of Social Work Rural Cohort, UAA Human Services, UAF Human Services, and Residential Services Certificate programs. However, even with the creation of new programs, gaps in the workforce and training still exist. The Trust wanted to continue the momentum that exists in Alaska and to develop a focused strategic plan for the workforce serving Trust beneficiaries. The report includes data related to Alaska s population, occupations, and educational system. Accordingly, the following sections cover different aspects of these workforce components. The vast majority of data is quantitative, but qualitative data from in-state studies of the healthcare workforce is included as appropriate and relevant. The table below summarizes the sources of data used in this report. This report also chronicles the planning process for this initiative. Following the data portion of this report, the reader will find the strategic planning document generated by the Trust, the Steering Committee, and multiple stakeholders throughout this process. This portion of the report also provides the final budget for which money will be allocated toward the different goals. 5
6 Resource Name Year Research Team Alaska Alliance for Direct Service Careers Survey Human Services Department Behavioral Health Initiative Year End Report Status of Recruitment Resources and Strategies II (SORRAS II) Factors Influencing Retention and Attrition of Community Health Aide/Practitioners The Behavioral Health Workforce in Alaska: A Status Report Status of Recruitment Resources and Strategies I (SORRAS I) The 2002 Social Services Job Survey Alaska Alliance for Direct Service Careers Wage and Benefit Research Report Alaska s Allied Health Workforce: A Statewide Assessment Type of Data # of Agencies/ Respondents 2006 AADSC Quantitative Dr. Laura Kelly, Melodee Monson 2005 ACRH, UAA Quantitative ACRH, UAA Qualitative WICHE Mental Health Program 2003 ACRH, UAA Quantitative School of Social Work, Department of Psychology, DHS, CHD; UAA C & S Management Associates 2001 ACRH, UAA Quantitative Qualitative Agency Survey 70; Alumni Survey 106; Focus Group 22 Quantitative 37 Quantitative Qualitative 369 Purpose/ Information Collected Agencies responded to a survey that included questions regarding turnover, challenges in recruitment efforts, AADSC media campaign, and use of the AADSC job posting system Provided information on the increase in HUMS practicum enrollments, increase in placement agencies, new applicants, student enrollment, and graduates from both AAS and BHS programs. SORRAS II collected the same data points from the original study, which surveyed all rural Alaskan health care facilities, but also included select urban facilities, including all the large hospitals in Anchorage, Fairbanks, and Juneau Co-worker support, Access to basic training, Fully staffed clinic, Community support, Family support Provided an overview of workforce development efforts for behavioral health in Alaska. 20summary.pdf Strategies used by small hospitals, rural clinics, and rural mental health centers to recruit physical, behavioral, and oral health providers. Documented the costs associated with recruiting these professionals. Identify and characterize the social services jobs market in Southcentral Alaska to strengthen UAA educational programs and help University students make informed career decisions.(job types, salaries, educational requirements, and turnover rates; characteristics of successful employees) Existing wage and benefit levels for direct service professionals in Alaska; and strategies that other states have used to increase compensation levels for direct service professionals # of employees, vacancies, annual turnover, projected future needs, and recruitment difficulties; Training needs, cross training, suggestions for planning health related coursework Alaska Department of Labor and Workforce Development Health Resources and Services Administration (HRSA) State Health Workforce Profiles Highlights Alaska United States Census Bureau Acronym Key: Alaska Center for Rural Health (ACRH), University of Alaska Anchorage (UAA), Department of Human Services (DHS), Center for Human Development (CHD) 6
7 Section I: Population Data and Trends Major changes in America's general workforce are anticipated between now and the year This change is brought into sharp focus when comparing the percentage of the population entering the workforce to the percentage leaving it. On average, WICHE states will see a projected 21.7% increase in the number of people between the ages of 18 to 64 entering the workforce by 2025 (the range is a low of -10.9% for North Dakota and a high of 76.4% in Nevada). However, the projected average percent of persons 65 and older (i.e., retirement age) leaving the workforce in WICHE states is a staggering 118% (with a low of 50.5% in South Dakota and a high of 222.5% in Alaska). 1 As this translates into actual numbers of people, some WICHE states will have more citizens entering than leaving the workforce, while others will have more leaving than entering (see the table below). For instance, California is projected to have a net increase of 1,473,050 in workforce by Alaska, on the other hand, is projected to have a net decrease in their workforce of 10,384 by In all, eight WICHE States are projected to have actual numbers of people entering the workforce in excess of the numbers leaving. Table 1 15 WICHE States % Change Pop. Ages to 2025 % Change Pop. Ages to 2025 Net People Entering or Leaving the Workforce California ,473,050 Arizona ,676 Nevada ,136 Washington ,108 Utah ,775 Oregon ,927 Nation ,799 Idaho ,068 Colorado ,191 Alaska ,384 South Dakota ,531 Wyoming ,936 North Dakota ,836 Hawaii ,271 Montana ,902 New Mexico ,654 Source: higheredinfo.org A number of specific population trends in Alaska help to further explain the overall workforce data presented above. These include major historical events related to population changes, shifts in age and ethnic/racial composition of the population, and migration in or out of the state. 1 Data is from 7
8 The graph below presents data on population changes in Alaska over a 60-year period. As the graph indicates, significant political and/or economic events have led to fairly extreme shifts, up or down, in the state s population. These include wars, the oil pipeline construction and boom (and bust), and military base closures. During these times, there was either a significant immigration or outmigration of, in effect, a temporary population. However, the natural increases in population have been much more stable, with a slight but steady increase over the 60-year period. The Census Bureau produced a report on population projections for Alaska for the period 1995 to In general, Alaska is projected to be the 45th most populous state with 885 thousand people (up from 48 th ). It s rate of population change, at 46.6%, ranks as the 8th largest. However, Alaska's dependency ratio, (i.e., the number of youth under age 20 and elderly ages 65 and over for every 100 people of working ages 20 to 64) could rise from 65.1 in 1995 to 80.6 in Source: Figures are from Series A (the Preferred Series) as reported in Campbell, Paul R., 1996, "Population Projections for States, by Age, Sex, Race and Hispanic Origin: 1995 to 2025," Report PPL-47, U.S. Bureau of the Census, Population Division. Most of these data are available in files found on the Population Projections section of the World Wide Web's Census Bureau Home Page ( 8
9 In terms of ethnic/racial composition, the report estimated that: By 2025, non-hispanic Whites are projected to compose 57.1% of Alaska's population, down from 73% in From 1995 to 2025, the non-hispanic Asian and Pacific Islander population is expected to grow by 641.1%, leading to a projected to increase from 4.3% to 21.5% of the state population. From 1995 to 2025, the Hispanic population is expected to increase by 162.7%, leading to an increase from 3.8% to 6.7% of the state population. The non- Hispanic Asian and Pacific Islander growth rate ranks 1 st largest, while the Hispanic growth rate ranks 11th largest. Another significant trend that relates to those noted is the relative inmigration versus outmigration of people to and from Alaska. A report 3 from the Census Bureau describes state-tostate migration patterns for the years 1995 to During that period, Alaska had an outmigration of 126,000, mainly to other states in the West. Specifically, Arizona, California, Oregon, Texas, and Washington all received inflows of more than 5,000 people from Alaska. Despite a significant number of people coming to the state, Alaska had a net outmigration of 30,000, mostly concentrated in the western states of Arizona, Oregon, and Washington. As the table below indicates, the largest inflow of population came from California, while the largest outflow went to Washington. Table 2: Largest Migration Inflow and Outflow by State: 1995 to 2000 Largest inflow was from: Size of inflow Alaska California 12,518 Largest outflow was to: Size of outflow Washington 16,635 Source: U.S. Census Bureau, Census On the positive side, more recent data indicates that outmigration was down significantly from 2000 to Whereas Alaska had an annual average loss of 3,035 people from 1990 to 2000, the state s annual loss from 2000 to 2004 was only 730 people. If this trend maintains for the rest of the decade, then Alaska would have reduced its outmigration by over 400% in 10 years. Table 3: Total and Average Annual Domestic Net Migration for States: and Total number Average annual number State Alaska 30,354 2,918 3, Source: U.S. Census Bureau, Population Estimates Program, Marc J. Perry. State-to-State Migration Flows: 1995 to 2000; Census 2000 Special Reports; Issued August


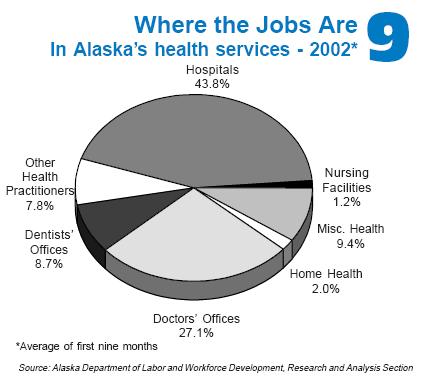
10 The map below shows annual rates of migration for Alaska in different areas of the state. Section II: Occupational Data and Trends for the Health Services Sector This section will describe data and trends regarding the health service sector as a whole, a profile of the healthcare workforce, number of workers and projected needs, vacancy rates, qualifications and hiring issues, as well as data on recruitment and retention. Healthcare Services Sector In terms of the health service sector overall, the Department of Labor in Alaska reported that the health services industry is the fastest growing, and one of the larger sectors of Alaska s economy. It s a billion-dollar industry, and it employs about 22,000 people. 4 As the pie charts on the next page indicate, health services compose 7% of the states employment, with 60.9% of jobs in healthcare offered through hospitals or doctor s offices. In terms of income, health services and hospitals are above the state average for annual average earnings. According to a Health Resources and Services Administration (HRSA) workforce profile on Alaska, 5 health services employment in Alaska grew 74% between 1988 and 2000, while the state s population grew by 16% during that period. This is a net per capita growth of 50% in health services sector employment, more than double than the national rate of growth (21%)


11 11

12 Other data from the HRSA Profile breaks down certain trends for different professionals. Presented here are some data for healthcare workers 6 : Medicine There were more than 1,000 active patient care physicians in Alaska in 2000, or 166 physicians per 100,000. This falls well below the national ratio of 198 physicians per 100,000 (40 th in U.S.). Alaska had 71 active primary care physicians per 100,000 population in 2000, slightly higher than the rate of 69 per 100,000 for the entire country. The number of physicians in Alaska grew 49% between 1989 and 2000, while the population grew 15% over this period. This is a net per capita growth of 30%, compared to the national per capita increase of 17%. There were 95 physician assistants practicing in Alaska in This was equal to 15.1 physician assistants per 100,000 population, slightly higher than the national rate of Alaska ranked 22nd in the nation in physician assistants per capita. Nursing There were RNs per 100,000 population in 2000, higher than the national rate of However, Alaska ranked last among the states in the per capita employment of Licensed Practical/Vocational Nurses (LPNs), with 66.9 LPNs per 100,000 population as compared to the national rate of per 100,000. Alaska also ranked last in the number of LPNs employed in the state in 2000 with 420 workers. There were 420 nurse practitioners in Alaska in This was equal to 66.9 per 100,000 population, giving Alaska one of the highest ratio of nurse practitioners per capita in the nation. Pharmacy There were 320 pharmacists and 320 pharmacy technicians and aides practicing in Alaska in Alaska had 51 pharmacists and 51 pharmacy technicians and aides per 100,000 population in 2000, which ranked them 49th and 50th, respectively, among the 50 states. Aides There were 630 home health aides and 1,370 nursing aides, orderlies, and attendants working in Alaska in Alaska had home health aides and nursing aides, orderlies, and attendants per 100,000 population in 2000 (44th and 50th, respectively, among the 50 states)
13 Healthcare Workforce Projections and Non-Resident Workers Table 4 (below) presents data from the Alaska Department of Labor on 30 healthcare professions in terms of number of professionals in 2002, projected workforce changes by 2012, as well as the number and percent of nonresident workers in a given occupation. This table is arranged alphabetically. Tables 5 through 8 present the top 10 professions organized by 1) highest actual ( numeric ) number of workers by 2012, 2) percent of change in workforce, 3) number of nonresident workers, and 4) percent of occupation that is nonresident (for all 30 occupations, see the tables in Appendix C). Overall, in the period between 2002 and 2012, Alaska is projected to have an increase of 5,454 professionals across the 30 occupations indicated. This equates to a 28% increase. The largest numeric change (1,666) in this period is for registered nurses, followed by personal and home care aides (621) and home health aides (473). Educational, vocational, and school counselors are expected to have a decrease in positions of 13, followed by general pediatricians (10), social scientists and related workers (15), and psychiatrists (17). The top three occupations with the highest percent of change are pharmacists (48.6%), personal and home care aides (41.7%), and home health aides (40.3%). The lowest percents of changes are for educational, vocational, and school counselors (-2.7%) and social scientists and related workers (6.3%). The report indicated that there were 2,479 nonresident workers across the 30 occupations. The profession with the highest number of non-resident workers is registered nurses (685), while the lowest number is for marriage and family therapists (2), followed closely by social scientists and related workers (3), psychiatric aides (4), medical and public health social workers (7), and psychiatrists (8). The top three highest percents of nonresident workers is general pediatricians (34.1%), pharmacists (25.8%), and physician assistants (23.9%); the lowest three percents were for psychiatric aides (3.3%), marriage and family therapists (3.9%), and medical and public health social workers (4.0%). Table 9 summarizes data from tables 5 to 8 and presents the occupations that occur most frequently in the top 10 in terms of highest numeric increase and percent by 2012, as well as the highest number and percent of nonresident workers. Four professions appeared in all four top 10 lists: pharmacists (avg. rank = 3.0), home health aides (avg. rank = 4.0), registered nurses (avg. rank = 4.8), and social and human service assistants (avg. rank = 7.0). Two occupations appeared in three out of the four top ten lists: personal and home care aides (avg. rank = 2.7) and physician assistants (avg. rank = 5.7). 13
14 Table 4: Workforce Projections and Nonresident Workers Health Care Occupations Working in All Industries Projected Employment Occupation Total Employment Total (2002) Growth Rate Non- Resident Workers % 13 (2012) 7 Change % 10 Workers Numeric Nonresident Child, Family, and School Social Workers Clinical, Counseling, and School Psychologists Counselors, All Other Educational, Vocational, and School Counselors Healthcare Support Workers, All Other Home Health Aides 1,173 1, Licensed Practical and Licensed Vocational Nurses Marriage and Family Therapists Medical and Public Health Social Workers Mental Health and Substance Abuse Social Workers Mental Health Counselors Nursing Aides, Orderlies, and Attendants 1,704 2, Occupational Therapists Pediatricians, General Personal and Home Care Aides 1,488 2, Personal Care and Service Workers, All Other Pharmacists Physician Assistants Psychiatric Aides Psychiatric Technicians Psychiatrists Registered Nurses (Only some in BH) 5,004 6,670 1, Rehabilitation Counselors Social and Community Service Managers Social and Human Service Assistants 1,123 1, Social Scientists and Related Workers, All Other Special Education Teachers, Middle School Special Education Teachers, Preschool, Kindergarten, and Elementary School Special Education Teachers, Secondary School Substance Abuse and Behavioral Disorder Counselors Totals 19,325 24,779 5,454 28% 2,479 14
15 Table 5: Workforce Projections and Nonresident Workers by Numeric Change Health Care Occupations Working in All Industries Projected Non- Occupation Numeric Nonresident Employment Total Employment Total Growth Rate Resident Workers (2002) (2012) 7 Change % 10 Workers % 13 Registered Nurses (Only some in BH) 5,004 6,670 1, Personal and Home Care Aides 1,488 2, Home Health Aides 1,173 1, Nursing Aides, Orderlies, and Attendants 1,704 2, Social and Human Service Assistants 1,123 1, Mental Health and Substance Abuse Social Workers Pharmacists Counselors, All Other Healthcare Support Workers, All Other Substance Abuse and Behavioral Disorder Counselors Table 6: Workforce Projections and Nonresident Workers by Growth Rate % Health Care Occupations Working in All Industries Projected Employment Employment Growth Occupation Total Total Numeric Rate Nonresident (2002) (2012) 7 Change % 10 Workers Non- Resident Workers % 13 Pharmacists Personal and Home Care Aides 1,488 2, Home Health Aides 1,173 1, Mental Health and Substance Abuse Social Workers Physician Assistants Medical and Public Health Social Workers Social and Human Service Assistants 1,123 1, Registered Nurses (Only some in BH) 5,004 6,670 1, Rehabilitation Counselors Mental Health Counselors
16 Table 7: Workforce Projections and Nonresident Workers Organized by Nonresident Workers Health Care Occupations Working in All Industries Projected Employment Employment Growth Occupation Total Total Numeric Rate Nonresident (2002) (2012) 7 Change % 10 Workers Non- Resident Workers % 13 Registered Nurses (Only some in BH) 5,004 6,670 1, Pharmacists Home Health Aides 1,173 1, Personal and Home Care Aides 1,488 2, Nursing Aides, Orderlies, and Attendants 1,704 2, Healthcare Support Workers, All Other Personal Care and Service Workers, All Other Social and Human Service Assistants 1,123 1, Physician Assistants Licensed Practical and Licensed Vocational Nurses Table 8: Workforce Projections and Nonresident Workers Organized by % Nonresident Workers Health Care Occupations Working in All Industries Projected Employment Employment Growth Occupation Total Total Numeric Rate Nonresident (2002) (2012) 7 Change % 10 Workers Non- Resident Workers % 13 Pediatricians, General Pharmacists Physician Assistants Registered Nurses (Only some in BH) 5,004 6,670 1, Licensed Practical and Licensed Vocational Nurses Clinical, Counseling, and School Psychologists Home Health Aides 1,173 1, Social and Human Service Assistants 1,123 1, Personal Care and Service Workers, All Other Psychiatrists
17 Table 9 Occupation # of Times in Top 10 Ranks Avg. Rank Pharmacists 4 7,1,2,2 3.0 Home Health Aides 4 3,3,3,7 4.0 Registered Nurses (Only some in BH) 4 1,8,1,9 4.8 Social and Human Service Assistants 4 5,7,8,8 7.0 Personal and Home Care Aides 3 2,2,4 2.7 Physician Assistants 3 5,9,3 5.7 Nursing Aides, Orderlies, and Attendants 2 4,5 4.5 Mental Health and Substance Abuse Social Workers 2 6,4 5.0 Physician Assistants 2 9,3 6.0 Healthcare Support Workers, All Other 2 9,6 7.5 Licensed Practical and Licensed Vocational Nurses 2 10,5 7.5 Personal Care and Service Workers, All Other 2 7,9 8.0 Pediatricians, General Medical and Public Health Social Workers Clinical, Counseling, and School Psychologists Counselors, All Other Rehabilitation Counselors Substance Abuse and Behavioral Disorder Counselors Mental Health Counselors Psychiatrists Despite the projected workforce increases between 2002 and 2012, there are presently vacancies in a number of behavioral health professions (see table 10 below). 7 A study including 32 facilities (hospitals and nursing homes) and 256 other Alaska health care organizations found that four of 21 occupations listed having a 20% or higher vacancy rate, with village counselors having the highest rate at 36%. Seven occupations have between 10-14% vacancy rates, while the remaining 10 have 0-9% vacancy rates. Respondents from six professions reported no vacancies: behavioral health clinicians, developmental specialists, family crisis workers, licensed marital and family therapists, and social work assistants. The occupations with the highest number of vacancies are social workers (24) and counselors (21). Required and Desired Qualifications of Professionals The State of Alaska establishes qualifications for licensed occupations. However, for other, nonlicensed occupations, minimum and desired educational qualifications are typically set by hiring organizations. Data from the Alaska Department of Labor and two studies regarding professional qualifications for a variety of healthcare workers provides insight into where the workforce in the state stands in this regard. 7 The study did not look at physical healthcare professions. 17

18 Table 10 BEHAVIORAL HEALTH VACANCY RATES - HEALTH PROFESSIONS 2005 SURVEY 2/13/2006 Behavioral Health Positions Vacancies Vacancy Rate Village Counselor % Psychologist % Psychiatric Nurse Practitioner % Psychiatrist % Family Services Worker % Mental Health Specialist % Social Worker % Chemical Dependency Counselor % Counselor % Behavioral Health Aide % Human Services Worker/Personnel % Psychiatric Nurse % Psychiatric Technician % Psychiatric Aide % Residential Aide % Behavioral Health Clinician 2 0 0% Developmental Specialist 1 0 0% Family Crisis 6 0 0% Family Service Aide 4 0 0% Licensed Marital and Family Therapist 1 0 0% Social Work Assistant 1 0 0% TOTAL % Note: 2005 survey results from 32 facilities (hospitals and nursing homes), and 256 other Alaska health care organizations. The Department of Labor produced the following data on the level of education needed for a range of healthcare jobs by As the chart indicates, 79% of healthcare jobs will require an AA degree or less (with on the job training). The remaining jobs (20%) will require a Bachelor s degree or higher. This data is somewhat consistent with the 2002 Social Services Job Survey, which presents data on the minimum versus desired educational qualifications for social service jobs. As the chart below indicates, about 63% of social service jobs have a 18
19 minimal educational requirement of an AA degree or lower, with the remainder having a Bachelor s degree or higher as the minimal requirement. However, about 93% of social service jobs require a Bachelor s or less. The chart also indicates that there is a disparity between the minimum qualifications and what is desired for the range of social service jobs. It is clear from the data that having an AA or Bachelor s degree is desired for a majority of these jobs. Educational Requirements for Social Service Jobs: Minimum vs. Desired PhD Education Level MA/MS/MSW BA/BS/BSW AA/AAS Desired Educational Requirements for Social Service Jobs Minimum Educational Requirements for Social Service Jobs High School Number of Jobs As related to minimal and desired qualifications for either general healthcare or social service jobs, the AADSC Wage and Benefit Research Report (2002; C & S Management Associates) looked at the percent of agencies that use experience as a substitute for education and hire below minimum qualifications (see table 11 below). Across 37 healthcare provider agencies who participated in the study and reported on 25 different professional positions, an average of 59.1% hire below minimum qualifications and 68% allow experience as a substitute for training. This does not include data regarding clinical psychologists or occupational therapists, as their qualifications and related hiring are fixed. The report indicates that the variation in qualification levels for some professions is to be expected. For example, the clinical supervisor for a very large, urban mental health center would naturally be expected to have either a masters or doctoral degree. By contrast, a small, rural substance abuse program with only two or three employees might well have a substance abuse counselor certificate rather than a degree...what is not clear from the data is the extent to which hiring below minimum standards is being done in order to hire at a lower wage rate due to budgetary constraints or whether it is a reflection of the availability of the professionals. 19
20 Table 11: Percent of Agencies using Experience as a Substitute for Education and Hire Below Minimum Qualifications by Profession Profession Experience as Substitute Hiring Below Minimum Qualifications Advocate 100.0% 100.0% Client Evaluator 100.0% 100.0% SA Prevention Professional 100.0% 100.0% CD Counselor I 100.0% 87.5% CD Clinical Supervisor 100.0% 66.7% Case Manager/Coordinator 100.0% 60.0% MH Clinical Associate 100.0% 50.0% CD Counselor II 100.0% 50.0% Eligibility Worker 100.0% 50.0% Paraprofessional Counselor 100.0% 33.3% Team Leader/Coordinator 80.0% 60.0% Infant Learning Educator 80.0% 60.0% Program Manager 70.0% 60.0% Individual Support Worker 66.7% 41.7% LPN 66.7% 66.7% Administrator 61.1% 50.0% RN 50.0% 50.0% Recreation/Activity Therapist 50.0% 50.0% Infant Learning Associate 50.0% 75.0% Clinical Director/Supervisor 40.0% 20.0% Vocational Specialist 33.3% 66.7% Respite Worker 28.6% 42.9% Licensed Clinician 12.5% 37.5% Clinician/Therapist/Counselor 10.0% 50.0% Clinical Psychologist 0.0% 0.0% Occupational Therapist 0.0% 0.0% Infant Learning Therapist 0.0% 50.0% Recruitment Data The Status of Recruitment Resources and Strategies (SORRAS) is a study conducted by the ACRH and University of Alaska, Anchorage (UAA), with two versions. SORRAS I looked at strategies used by small hospitals, rural clinics, and rural mental health centers to recruit physical, behavioral, and oral health providers. It also documented the costs associated with recruiting these professionals. SORRAS II collected the same data points from the original study, but also included select urban facilities (e.g., all the large hospitals in Anchorage, Fairbanks, and Juneau). The data in tables 12 to 20, as well as charts in this section, come from the SORRAS studies and provide an overview of various aspects of recruitment in Alaska, such as costs, commonly used strategies, most and least effective strategies, as well as barriers to recruitment. The total cost of recruitment strategies for SORRAS II for all facilities was $24,119,465 compared to $12,050, 693 in SORRAS I, however the first study only included rural facilities. Other disparities include the amount of money spent on recruitment by rural facilities in Year 2 ($14,881,485) compared to Year 2 urban facilities ($9,237,980). In particular, the Regional Tribal Health Organization Rural Facilities spent $9,514,116 compared to similar organizations 20
21 in urban areas ($3,645,669). Additionally, Community Health Centers in rural areas spent almost 8 times more on recruitment strategies than Community Health Centers in urban areas. In both Year 1 and Year 2, facilities spent the most money on cost of locums of all recruitment strategies. The next highest expense from both studies was spent on staff time. Urban facilities in Year 2 spent considerably more money on recruiting firms than rural facilities. Money spent on cost of locums was considerably higher in rural facilities in Year 2. The mean average cost per hire from Year 1 and Year 2 are fairly consistent. However, Year 2 Rural facilities spent approximate $11,000 more on average per hire. Average recruitment activity costs and average recruitment related staff time were considerably higher in Year 2 Urban facilities compared to Year 2 Rural facilities. Across organization types, in Year 2, Regional Tribal Health Organizations spent the most (i.e., mean average cost) per hire, followed by Non-tribal Hospitals, and Community Health Centers. Unaffiliated Tribal Health Organizations spent the least amount on average per hire although their average number hired in proportion to the average number recruited was also considerably lower. In Year 1, facilities spent the most hiring psychiatrists. In Year 2, facilities spent the most on hiring Clinical Psychologists. Year 2 Rural facilities consistently spent a higher amount on recruitment costs in all provider categories compared to Urban facilities. This table indicates the cost per hire for Alaska compared to the Continental United States. In both categories (i.e., Rural Alaska Hospitals and All Other Rural Alaska Facilities including Clinics and Mental Health Centers), Alaska s cost per hire was considerably higher when compared the Continental United States. Table 12 Total Recruitment Strategy Cost Breakdown by Organization Type Year 2 All Facilities Year 2 Urban Facilities Year 2 Rural Facilities Year 1 All Facilities (Rural) Non-tribal Hospital $8,274,817 $4,899,550 $3,375,267 $2,111,385 Regional Tribal Health Corporation $13,160,439 $3,645,669 $9,514,770 $8,238,608 Unaffiliated Tribal Health Organization $322,116 $0 $322,116 $395,234 Community Health Center $1,021,435 $133,000 $888,435 $439,918 Other Rural Health Providers $181,826 $0 $181,826 $270,150 Behavioral Health Providers $1,158,832 $559,761 $599,071 $595,398 Total $24,119,465 $9,237,980 $14,881,485 $12,050,693 21
22 Table 13 Total Recruitment Cost Breakdown by Strategy Type Year 1 All Facilities (Rural) Year 2 All Facilities Year 2 Urban Facilities Year 2 Rural Facilities Total Total Total Total Recruiting firms $1,434,248 $1,060,000 $374,248 $588,164 Advertising $1,234,945 $713,864 $521,081 $301,534 Website management $91,499 $5,000 $86,499 NA Membership organization $22,900 $7,600 $15,300 NA Recruitment related staff travel $242,616 $91,000 $151,616 $55,681 Travel/accommodations for on-site interview $474,705 $205,615 $269,090 $240,070 Moving expenses (inc. travel) $2,751,820 $1,506,500 $1,245,320 $792,156 Cost of locums $12,914,085 $3,926,880 $8,987,205 $4,944,266 Training and orientation $837,166 $466,077 $371,089 $258,134 Other costs $118,000 $8,000 $110,000 $1,265,818 Staff time $3,997,481 $1,247,444 $2,750,033 $3,604,870 Grand Total $24,119,465 $9,237,980 $14,881,481 $12,050,693 Table 14 Recruitment Cost Compared to Y1 Y2 Y2 Y1 All Y2 All Facilities Urban Facilities Rural Facilities Facilities (Rural) Average recruitment activity costs $304,879 $887,837 $212,832 $148,172 Average recruitment related staff time $62,461 $138,604 $50,001 $48,714 Average number hired Total number hired Average number recruited Total number recruited Mean average cost per hire $34,413 $25,004 $36,074 $38,018 Mean average cost per recruit $27,927 $20,514 $29,162 $31,353 22
23 Table 15: Data from SORRAS II Average Recruitment Cost by Organization Type Regional Unaffiliated Non- Tribal Tribal tribal Health Health Hospital Organization Organization Community Health Center Other Rural Health Providers Behavioral Health Providers All Facilities Avg. recruitment activity costs $304,879 $454,772 $832,058 $29,844 $63,570 $20,143 $50,483 Avg. related staff time $62,461 $96,882 $107,973 $13,894 $38,574 $10,161 $38,658 Avg. number hired Total number hired Average number recruited Total number recruited Mean average cost per hire $34,413 $39,132 $52,919 $11,860 $34,326 $17,768 $25,505 Mean average cost per recruit $27,927 $35,596 $31,284 $26,238 $27,608 $16,714 $22,971 Table 16 Year 2 Urban Facilities Year 2 Rural Facilities Year 1 All Facilities (Rural) Average Recruitment Cost Per Hire by Provider Type Year 2 All Facilities Avg. Avg. Avg. Avg. Physician $126,782 $119,307 $135,752 $73,739 Pharmacist $71,322 $39,852 $105,939 $63,886 Midlevel $25,655 $6,115 $37,724 $32,201 Registered Nurse $17,688 $10,527 $36,096 $42,575 Dentist $35,542 $33,477 $36,001 $27,315 Dental Hygienist $3,225 $947 $7,130 $40,572 Psychiatrist $106,117 $65,301 $177,546 $237,678 Clinical Psychologist $374,987 $0 $357,379 $34,563 LCSW $33,931 $13,986 $35,926 $20,566 Masters Level Therapist $22,541 $3,709 $28,818 $16,571 Grand Total 23
24 Table 17: Cost Per Hire in Alaska versus Continental U.S. (SORRAS II Data) Cost Per Hire: Alaska Versus Continental U.S. Rural Alaska Hospitals Continental U.S. 1 All Other Rural Alaska Facilities (Clinics, Mental Health Centers) Continental U.S. Clinics (Nursing and Specialty Services) 1 Total cost* $3,709, ,835,814 $2,184,411 $127,310,190 Total hires , ,174 Cost Per Hire $18,186 $3,662 $20,804 $4,685 *These figures excludes the cost of locums and new recruit training 1 Staffing.org study Recruitment Strategies Data presented in tables 18 to 20, as well as charts below, present the top 10 most common recruitment strategies, most and least effective strategies, barriers to recruitment, and factors that would make recruitment better. The top two most common strategies used to recruit providers in both the SORRAS I and II are word of mouth/networking and emphasizing the rural lifestyle. Other strategies falling in the top seven include introductions/spending time with staff, on-site visits, as well as emphasizing a good community and positive working environment. Table 18: Top 10 Most Common Strategies Used to Recruit Providers SORRAS I SORRAS II % of % of Strategy Agencies Agencies Reporting Reporting Use Rank Use Rank Word of mouth/networking 92% 1 89% 1 Emphasize rural lifestyle 91% 2 88% 2 Introductions/spend time with staff 83% 3 83% 4 Conduct on-site visit 79% 5 81% 5 Emphasize good community 79% 6 79% 7 Positive working environment 79% 7 86% 3 Emphasize community need 72% 9 71% 9 Newspaper ads 80% 4 NA NA Use websites 79% 8 NA NA Emphasize time off/vacation perks 72% 10 NA NA Arrange tour of community NA NA 79% 6 Mission of the organization NA NA 78% 8 Emphasize medical benefits NA NA 71% 10 The reports indicate that different recruitment methods were used for different types of providers. For instance, journal ads were most commonly used to recruit pharmacists (75%), clinical psychologists (62%), psychiatrists (58%), and physicians (50%). Newspaper advertising was used commonly across the board, but was used frequently in the recruitment of LCSWs (81%) and Masters Level Therapists (81%). Professional recruiting firms were used especially to recruit physicians (42%) and pharmacists (31%). Direct mail was used most often in the recruitment of physicians (25%). 24
25 The list of most effective recruitment strategies includes most if not all of the strategies indicated above. In both the SORRAS I and II, websites and word of mouth/networking were considered the top two most effective strategies. Current staff was often considered the best resource for recruiting other providers. About a third of the internet resources mentioned was a State of Alaska resource (e.g., State of Alaska website, State of Alaska Job Website ). Others that fell mostly in the top six were newspaper ads, emphasizing the quality of life, financial/benefit incentives, and hiring from temporary to full time status. The report also indicated that smaller facilities, such as CHCs, private clinics, and independent THOs were more likely to cite newspaper advertising as their most effective recruitment strategy. Table 19: Most Effective Recruitment Strategies SORRAS I SORRAS II % of % of Strategy Agencies Agencies Reporting Reporting Use Rank Use Rank Websites 28% 1 18% 2 Word of mouth/networking 26% 2 18% 1 Newspaper ads 16% 3 10% 4 Emphasize quality of life 11% 4 9% 6 Financial/benefit incentives 9% 5 8% 8 Hiring temp to full-time 8% 6 9% 5 Professional association 7% 7 NA NA Onsite visit 7% 8 11% 3 Good work environment 7% 9 8% 7 Journals 5% 10 4% 12 ANTHC 5% 11 5% 11 Job fairs 3% 17 5% 10 Build personal relationship NA NA 5% 9 Table 20: Least Effective Recruitment Strategies SORRAS I SORRAS II % of Agencies Reporting % of Agencies Reporting Use Rank Use Rank Newspaper ads 32% 1 18% 1 Websites 16% 2 14% 2 Journals 13% 3 9% 3 Professional Recruiting Firm 7% 4 4% 6 Recruiting Outside 4% 5 NA NA Financial/benefit incentives 3% 6 8% 4 Local recruitment 3% 7 6% 5 Emphasizing location 3% 8 NA NA Onsite visits 3% 9 1% 8 Recruiting is not a problem 3% 10 NA NA Direct mail NA NA 3% 7 Other 5% 11 9% 9 As table 20 above indicates, a number of the recruitment strategies considered most effective were also considered least effective, particularly newspaper ads, websites, financial/benefit incentives, and onsite visits. According to the report, those who found advertising in the 25
26 newspaper and use of websites ineffective emphasized the importance of clearly targeting your intended audience. In terms of strategies used by particular organizations, the report stated that regional tribal health organizations, non-tribal rural hospitals, and hospitals nearly all used newspapers in their recruitment, despite this strategy being commonly referred to as the least effective recruitment method for these facilities. Understanding the relative effectiveness of recruitment strategies requires knowledge of barriers that agencies or organizations run into when recruiting providers. Data from the SORRAS I indicates at least 14 different barriers to recruitment. Five of these barriers were reported by over 50% of respondents. Starting with the barrier indicated by the highest percent of respondents, these five include: locating qualified candidates (71%), geographic isolation/harsh living (61%), spousal compatibility/job availability (57%), lack of urban amenities (53%), and housing availability (51%). It should be noted that all organizations participating in the SORRAS I were rural. The four biggest barriers to recruitment in the SORRAS II are identical to those reported in the SORRAS I study. The chart below lists the other barriers reported by respondents from SORRAS I. Barriers to Recruitment Overall (SORRAS I Data) Locating qualified candidates 71% Geographic isolation/harsh living 61% Spousal compatability/job availability 57% Lack of urban amenities Housing availability Competitive salary/benefits Aggressive job marketing campaign 53% 51% 49% 46% Cost of relocating providers Call requirements 32% 34% Lack of locum availability Professional growth Intensity/hardship of the position Educational opportunities for children 21% 18% 17% 17% Lack of community welcome 4% 0% 10% 20% 30% 40% 50% 60% 70% 80% The SORRAS studies also collected data on factors that would make recruitment more effective. Data from the SORRAS I is presented in the chart below (again bear in mind that these are only rural sites). As can be seen, there were four primary factors identified: being able to offer higher salaries, easier ways to identify candidates, bigger recruiting budgets, and needing more candidates. The report indicated that many respondents reported that their recruitment efforts could be improved if there was a centralized pool of candidates available. However, they did not necessarily know if this is feasible or how it would work. The chart below presents other factors identified as improving recruitment efforts, including more effective use of websites, better 26
Alaska s Behavioral Health Workforce: Identifying occupations that are hardest for employers to fill and assessing what can be done to help
 Alaska s Behavioral Health Workforce: Identifying occupations that are hardest for employers to fill and assessing what can be done to help UA Behavioral Health Workforce Development Meeting October 25,
Issue Brief. Maine s Health Care Workforce. January Maine s Unique Challenge. Current State of Maine s Health Care Workforce
 January 2009 Issue Brief Maine s Health Care Workforce Affordable, quality health care is critical to Maine s continued economic development and quality of life. Yet substantial shortages exist at almost
Arizona State Funding Project: Addressing the Teacher Labor Market Challenge Executive Summary. Research conducted by Education Resource Strategies
 Arizona State Funding Project: Addressing the Teacher Labor Market Challenge Executive Summary Research conducted by Education Resource Strategies Key findings 1. Student outcomes in Arizona lag behind
 HEALTH CARE PROVIDER APPOINTMENT AND COMPENSATION AUTHORITIES FISCAL YEAR 2017 (Interim Report) SENATE REPORT 112-173, ACCOMPANYING S. 3254, THE NATIONAL DEFENSE AUTHORIZATION ACT FOR FISCAL YEAR 2017
Health Professions Workforce
 Health Professions Workforce For the Health of Texas February 28, 2011 Ben G. Raimer, MD, MA, FAAP Past Chairman (1997-2010), Statewide Health Coordinating Council Senior Vice President, Health Policy
THE UTILIZATION OF MEDICAL ASSISTANTS IN CALIFORNIA S LICENSED COMMUNITY CLINICS
 THE UTILIZATION OF MEDICAL ASSISTANTS IN CALIFORNIA S LICENSED COMMUNITY CLINICS Tim Bates and Susan Chapman UCSF Center for the Health Professions Overview Medical Assistants (MAs) play a key role as
Survey of Health Care Employers in Arizona: Long-Term Care Facilities, 2015
 Survey of Health Care Employers in Arizona: Long-Term Care Facilities, 2015 June 22, 2016 Prepared by: Lela Chu Joanne Spetz, PhD University of California, San Francisco 3333 California Street, Suite 265
 ANNUAL REPORT TO CONGRESSIONAL COMMITTEES ON HEALTH CARE PROVIDER APPOINTMENT AND COMPENSATION AUTHORITIES FISCAL YEAR 2017 SENATE REPORT 112-173, PAGES 132-133, ACCOMPANYING S. 3254 THE NATIONAL DEFENSE
2005 Survey of Licensed Registered Nurses in Nevada
 2005 Survey of Licensed Registered Nurses in Nevada Prepared by: John Packham, PhD University of Nevada School of Medicine Tabor Griswold, MS University of Nevada School of Medicine Jake Burkey, MS Washington
Inventory of State Health Workforce Data Collection
 2016 Inventory of State Health Workforce Data Collection Center for Health Workforce Studies School of Public Health University at Albany, State University of New York Inventory of State Health Workforce
Current and Projected Health Workforce Supply and Demand in Nevada
 Current and Projected Health Workforce Supply and Demand in Nevada John Packham, PhD and Tabor Griswold, PhD Office of Statewide Initiatives University of Nevada School of Medicine February 24, 2016 Nevada
Licensed Nurses in Florida: Trends and Longitudinal Analysis
 Licensed Nurses in Florida: 2007-2009 Trends and Longitudinal Analysis March 2009 Addressing Nurse Workforce Issues for the Health of Florida www.flcenterfornursing.org March 2009 2007-2009 Licensure Trends
Fiscal Research Center
 January 2016 Georgia s Rankings Among the States: Budget, Taxes and Other Indicators ABOUT THE FISCAL RESEARCH CENTER Established in 1995, the (FRC) provides nonpartisan research, technical assistance
Trends in the Supply and Distribution of the Health Workforce in North Carolina
 Trends in the Supply and Distribution of the Health Workforce in North Carolina Erin Fraher, PhD MPP Director Program on Health Workforce Research & Policy Cecil G. Sheps Center for Health Services Research,
Unemployment Rate (%) Rank State. Unemployment
 Rank State. Unemployment") States Ranked by February 2018 Unemployment Rate Seasonally Adjusted Unemployment Unemployment Unemployment 1 Hawaii 2.1 19 Alabama 3.7 33 Ohio 4.5 2 New Hampshire 2.6 19 Missouri 3.7 33 Rhode Island 4.5
States Ranked by February 2018 Unemployment Rate Seasonally Adjusted Unemployment Unemployment Unemployment 1 Hawaii 2.1 19 Alabama 3.7 33 Ohio 4.5 2 New Hampshire 2.6 19 Missouri 3.7 33 Rhode Island 4.5
Unemployment Rate (%) Rank State. Unemployment
 Rank State. Unemployment") States Ranked by November 2015 Unemployment Rate Seasonally Adjusted Unemployment Unemployment Unemployment 1 North Dakota 2.7 19 Indiana 4.4 37 Georgia 5.6 2 Nebraska 2.9 20 Ohio 4.5 37 Tennessee 5.6
States Ranked by November 2015 Unemployment Rate Seasonally Adjusted Unemployment Unemployment Unemployment 1 North Dakota 2.7 19 Indiana 4.4 37 Georgia 5.6 2 Nebraska 2.9 20 Ohio 4.5 37 Tennessee 5.6
Unemployment Rate (%) Rank State. Unemployment
 Rank State. Unemployment") States Ranked by April 2017 Unemployment Rate Seasonally Adjusted Unemployment Unemployment Unemployment 1 Colorado 2.3 17 Virginia 3.8 37 California 4.8 2 Hawaii 2.7 20 Massachusetts 3.9 37 West Virginia
States Ranked by April 2017 Unemployment Rate Seasonally Adjusted Unemployment Unemployment Unemployment 1 Colorado 2.3 17 Virginia 3.8 37 California 4.8 2 Hawaii 2.7 20 Massachusetts 3.9 37 West Virginia
Unemployment Rate (%) Rank State. Unemployment
 Rank State. Unemployment") States Ranked by August 2017 Unemployment Rate Seasonally Adjusted Unemployment Unemployment Unemployment 1 North Dakota 2.3 18 Maryland 3.9 36 New York 4.8 2 Colorado 2.4 18 Michigan 3.9 38 Delaware 4.9
States Ranked by August 2017 Unemployment Rate Seasonally Adjusted Unemployment Unemployment Unemployment 1 North Dakota 2.3 18 Maryland 3.9 36 New York 4.8 2 Colorado 2.4 18 Michigan 3.9 38 Delaware 4.9
Unemployment Rate (%) Rank State. Unemployment
 Rank State. Unemployment") States Ranked by March 2016 Unemployment Rate Seasonally Adjusted Unemployment Unemployment Unemployment 1 South Dakota 2.5 19 Delaware 4.4 37 Georgia 5.5 2 New Hampshire 2.6 19 Massachusetts 4.4 37 North
States Ranked by March 2016 Unemployment Rate Seasonally Adjusted Unemployment Unemployment Unemployment 1 South Dakota 2.5 19 Delaware 4.4 37 Georgia 5.5 2 New Hampshire 2.6 19 Massachusetts 4.4 37 North
Unemployment Rate (%) Rank State. Unemployment
 Rank State. Unemployment") States Ranked by September 2017 Unemployment Rate Seasonally Adjusted Unemployment Unemployment Unemployment 1 North Dakota 2.4 17 Indiana 3.8 36 New Jersey 4.7 2 Colorado 2.5 17 Kansas 3.8 38 Pennsylvania
States Ranked by September 2017 Unemployment Rate Seasonally Adjusted Unemployment Unemployment Unemployment 1 North Dakota 2.4 17 Indiana 3.8 36 New Jersey 4.7 2 Colorado 2.5 17 Kansas 3.8 38 Pennsylvania
Unemployment Rate (%) Rank State. Unemployment
 Rank State. Unemployment") States Ranked by December 2017 Unemployment Rate Seasonally Adjusted Unemployment Unemployment Unemployment 1 Hawaii 2.0 16 South Dakota 3.5 37 Connecticut 4.6 2 New Hampshire 2.6 20 Arkansas 3.7 37 Delaware
States Ranked by December 2017 Unemployment Rate Seasonally Adjusted Unemployment Unemployment Unemployment 1 Hawaii 2.0 16 South Dakota 3.5 37 Connecticut 4.6 2 New Hampshire 2.6 20 Arkansas 3.7 37 Delaware
Unemployment Rate (%) Rank State. Unemployment
 Rank State. Unemployment") States Ranked by September 2015 Unemployment Rate Seasonally Adjusted Unemployment Unemployment Unemployment 1 North Dakota 2.8 17 Oklahoma 4.4 37 South Carolina 5.7 2 Nebraska 2.9 20 Indiana 4.5 37 Tennessee
States Ranked by September 2015 Unemployment Rate Seasonally Adjusted Unemployment Unemployment Unemployment 1 North Dakota 2.8 17 Oklahoma 4.4 37 South Carolina 5.7 2 Nebraska 2.9 20 Indiana 4.5 37 Tennessee
Unemployment Rate (%) Rank State. Unemployment
 Rank State. Unemployment") States Ranked by November 2014 Unemployment Rate Seasonally Adjusted Unemployment Unemployment Unemployment 1 North Dakota 2.7 19 Pennsylvania 5.1 35 New Mexico 6.4 2 Nebraska 3.1 20 Wisconsin 5.2 38 Connecticut
States Ranked by November 2014 Unemployment Rate Seasonally Adjusted Unemployment Unemployment Unemployment 1 North Dakota 2.7 19 Pennsylvania 5.1 35 New Mexico 6.4 2 Nebraska 3.1 20 Wisconsin 5.2 38 Connecticut
Unemployment Rate (%) Rank State. Unemployment
 Rank State. Unemployment") States Ranked by July 2018 Unemployment Rate Seasonally Adjusted Unemployment Unemployment Unemployment 1 Hawaii 2.1 19 Massachusetts 3.6 37 Kentucky 4.3 2 Iowa 2.6 19 South Carolina 3.6 37 Maryland 4.3
States Ranked by July 2018 Unemployment Rate Seasonally Adjusted Unemployment Unemployment Unemployment 1 Hawaii 2.1 19 Massachusetts 3.6 37 Kentucky 4.3 2 Iowa 2.6 19 South Carolina 3.6 37 Maryland 4.3
STATE ENTREPRENEURSHIP INDEX
 University of Nebraska - Lincoln DigitalCommons@University of Nebraska - Lincoln Business in Nebraska Bureau of Business Research 12-2013 STATE ENTREPRENEURSHIP INDEX Eric Thompson University of Nebraska-Lincoln,
CONTRA COSTA MENTAL HEALTH MENTAL HEALTH SERVICES ACT EXECUTIVE SUMMARY
 CONTRA COSTA MENTAL HEALTH MENTAL HEALTH SERVICES ACT Workforce Education & Training Draft Plan December 2008 Background EXECUTIVE SUMMARY The Mental Health Services Act (Prop 63) passed by California
Health Care Employment, Structure and Trends in Massachusetts
 Health Care Employment, Structure and Trends in Massachusetts Chapter 224 Workforce Impact Study Prepared by: Commonwealth Corporation and Center for Labor Markets and Policy, Drexel University Prepared
Fiscal Research Center
 January 2017 Georgia s Rankings Among the States: Budget, Taxes and Other Indicators ABOUT THE FISCAL RESEARCH CENTER Established in 1995, the (FRC) provides nonpartisan research, technical assistance
Industry Overview and Projected Employment Growth in Specified Occupations
 The Healthcare Services Industry in Tarrant County Industry Overview and Projected Employment Growth in Specified Occupations Prepared for: Tarrant County College Prepared by: Terry L. Clower, Ph.D. Michael
FEDERAL SPENDING AND REVENUES IN ALASKA
 FEDERAL SPENDING AND REVENUES IN ALASKA Prepared by Scott Goldsmith and Eric Larson November 20, 2003 Institute of Social and Economic Research University of Alaska Anchorage 3211 Providence Drive Anchorage,
Fiscal Research Center
 January 2018 Georgia s Rankings Among the States: Budget, Taxes and Other Indicators ABOUT THE FISCAL RESEARCH CENTER Established in 1995, the (FRC) provides nonpartisan research, technical assistance
NURSING INVESTMENT REPORT:
 University of Alaska NURSING INVESTMENT REPORT: 2000-2009 Overview In the decade from 2000 to 2009, the University of Alaska (UA) significantly increased basic nursing graduates from its associate and
BUILDING INDUSTRY PARTNERSHIP TO ADDRESS RURAL NURSING EDUCATION
 BUILDING INDUSTRY PARTNERSHIP TO ADDRESS RURAL NURSING EDUCATION Cori Garcia Hansen, Center Director, Area Health Education Center for Western Washington In Rural and Tribal Communities RURAL NURSING DISTANCE
Health Resources & Services Administration and the Affordable Care Act: Strategies for Increasing Provider Capacity & Retention
 Health Resources & Services Administration and the Affordable Care Act: Strategies for Increasing Provider Capacity & Retention Hal Zawacki, San Francisco Regional Office Health Resources and Services
Health Workforce Demand in Nevada Presented to the Western Interstate Commission for Higher Education (WICHE)
") Health Workforce Demand in Nevada Presented to the Western Interstate Commission for Higher Education (WICHE) Tabor Griswold, PhD Office of Statewide Initiatives University of Nevada School of Medicine
Health Workforce Demand in Nevada Presented to the Western Interstate Commission for Higher Education (WICHE) Tabor Griswold, PhD Office of Statewide Initiatives University of Nevada School of Medicine
Minnesota s Marriage & Family Therapist (MFT) Workforce, 2015
 Workforce, 2015") OFFICE OF RURAL HEALTH AND PRIMARY CARE Minnesota s Marriage & Family Therapist (MFT) Workforce, 2015 HIGHLIGHTS FROM THE 2015 MFT WORKFORCE SURVEY i Overall According to the Board of Marriage and Family
OFFICE OF RURAL HEALTH AND PRIMARY CARE Minnesota s Marriage & Family Therapist (MFT) Workforce, 2015 HIGHLIGHTS FROM THE 2015 MFT WORKFORCE SURVEY i Overall According to the Board of Marriage and Family
 HEALTH CARE PROVIDER APPOINTMENT AND COMPENSATION AUTHORITIES FISCAL YEAR 2016 SENATE REPORT 112-173 NATIONAL DEFENSE AUTHORIZATION ACT FOR FISCAL YEAR 2016 Generated on November 4, 2016 1 2016 REPORT
Packham July 25, 2016
 Packham July 25, 216 Health Workforce in Nevada Supply and Demand Update John Packham, PhD Office of Statewide Initiatives University of Nevada, Reno School of Medicine July 25, 216 Forces Driving Health
Indiana s Health Care Workforce
 Indiana s Health Care Workforce An Overview Jonathan Barclay, MA Zach Sheff, MPH Indiana Medicaid Advisory Committee Aug. 19, 2014 Indiana Health Workforce Reports 2 Methodology - Survey offered during
UNIVERSITY OF CALIFORNIA
 UNIVERSITY OF CALIFORNIA Report on Nursing Programs Enrollment Levels, FY 2008-09 2008-09 Legislative Session Budget and Capital Resources Budget and Capital Resources UNIVERSITY OF CALIFORNIA Report
Standards and Competencies in Allied Health Policy Making
 Standards and Competencies in Allied Health Policy Making April 10, 2015 Rebecca Spitzgo Bureau of Health Workforce Health Resources and Services Administration U.S. Department of Health and Human Services
NGO adult mental health and addiction workforce
 more than numbers NGO adult mental health and addiction 2014 survey of Vote Health funded 1 Recommended citation: Te Pou o Te Whakaaro Nui. (2015). NGO adult mental health and addiction : 2014 survey of
engineering salary guide
 engineering salary guide At a time when lean practices and agile teams create the expectation of doing more with less, employers need to develop new strategies to attract and retain the best employees
CHILD ABUSE REPORTING LAWS IN GDB PUPPY RAISING STATES
 CHILD ABUSE REPORTING LAWS IN GDB PUPPY RAISING STATES All information below is excerpted from Mandatory Reporters of Child Abuse and Neglect by the Child Welfare Information Gateway. All States, the District
Supply and Demand of Health Care Workers in Minnesota. Speaker: Teri Fritsma Wednesday, March 8, :35 3:20 p.m.
 Supply and Demand of Health Care Workers in Minnesota Speaker: Teri Fritsma Wednesday, March 8, 2017 2:35 3:20 p.m. Teri Fritsma Teri Fritsma is a senior research analyst for the Minnesota Department of
Questions and Answers Florida Department of Economic Opportunity Employment and Unemployment Data Release July 2018 (Released August 17, 2018)
") Questions and Answers Florida Department of Economic Opportunity Employment and Unemployment Data Release July 2018 (Released August 17, 2018) 1. What are the current Florida labor statistics and what
Questions and Answers Florida Department of Economic Opportunity Employment and Unemployment Data Release July 2018 (Released August 17, 2018) 1. What are the current Florida labor statistics and what
POLICY BRIEF. North Dakota Health Care Workforce: Planning Together to Meet Future Health Care Needs
 POLICY BRIEF North Dakota Health Care Workforce: Planning Together to Meet Future Health Care Needs Mary Wakefield, Ph.D. Mary Amundson, M.A. Patricia Moulton, Ph.D. Brad Gibbens, M.P.A. January 2007 Part
Minnesota s Respiratory Therapist Workforce, 2016
 OFFICE OF RURAL HEALTH AND PRIMARY CARE Minnesota s Respiratory Therapist Workforce, 2016 HIGHLIGHTS FROM THE 2016 RESPIRATORY THERAPIST SURVEY Table of Contents Minnesota s Respiratory Therapist Workforce,
Overview of the Long-Term Care Health Workforce in Colorado
 Overview of the Long-Term Care Health Workforce in Colorado July 17, 2009 FOR MORE INFORMATION, PLEASE CONTACT: Amy Downs, MPP Director for Policy and Research Colorado Health Institute 303.831.4200 x221
Jurisdiction: City of Berkeley Date: March 5, 2009
 PART IV: REQUIRED EXHIBITS EXHIBIT 1: WORKFORCE FACE SHEET MENTAL HEALTH SERVICES ACT (MHSA) WORKFORCE EDUCATION AND TRAINING COMPONENT TEN-YEAR PROGRAM AND EXPENDITURE PLAN, Fiscal Years 2008-09 through
Salary and Demographic Survey Results
 Salary and Demographic Survey Results Executive Summary In July of 2010, Grant Professionals Association (GPA formerly AAGP) conducted a salary and demographic survey of grant professionals. The survey
Industry Profiles Health Care
 Industry Profiles Health Care The Health Care cluster includes industries that provide for the health and well-being of Pennsylvania residents. Direct patient care forms the cornerstone of this cluster.
Valuing the Invaluable: A New Look at State Estimates of the Economic Value of Family Caregiving (Data Update)
") Valuing the Invaluable: A ew Look at State Estimates of the Economic Value of Family Caregiving (Data Update) This update includes comparisons to FY 2006 Medicaid. At the time of the original release,
Valuing the Invaluable: A ew Look at State Estimates of the Economic Value of Family Caregiving (Data Update) This update includes comparisons to FY 2006 Medicaid. At the time of the original release,
The North Carolina Mental Health and Substance Abuse Workforce
 The North Carolina Mental Health and Substance Abuse Workforce Erica Richman, PhD, MSW Erin Fraher, PhD, MPP & Katie Gaul, MA Program on Health Workforce Research & Policy Cecil G. Sheps Center for Health
OCCUPATIONAL TRENDS AND ISSUES IN THE NYC PRIVATE SOCIAL SERVICES SECTOR
 OCCUPATIONAL TRENDS AND ISSUES IN THE NYC PRIVATE SOCIAL SERVICES SECTOR INDIVIDUAL & FAMILY SERVICES AND JOB TRAINING/VOCATIONAL REHABILITATION A LABOR MARKET PROFILE PREPARED FOR THE NYC EMPLOYMENT &
The State of the Allied Health Workforce in North Carolina
 The State of the Allied Health Workforce in North Carolina Erin Fraher, MPP Director, NC HPDS Phillip Summers, MPH Research Assistant Katie Gaul, MA Research Associate Stephen Rutledge Research Assistant
Table 1 Elementary and Secondary Education. (in millions)
") Revised February 22, 2005 WHERE WOULD THE CUTS BE MADE UNDER THE PRESIDENT S BUDGET? Data Table 1 Elementary and Secondary Education Includes Education for the Disadvantaged, Impact Aid, School Improvement
Revised February 22, 2005 WHERE WOULD THE CUTS BE MADE UNDER THE PRESIDENT S BUDGET? Data Table 1 Elementary and Secondary Education Includes Education for the Disadvantaged, Impact Aid, School Improvement
Rankings of the States 2017 and Estimates of School Statistics 2018
 Rankings of the States 2017 and Estimates of School Statistics 2018 NEA RESEARCH April 2018 Reproduction: No part of this report may be reproduced in any form without permission from NEA Research, except
Grants 101: An Introduction to Federal Grants for State and Local Governments
 Grants 101: An Introduction to Federal Grants for State and Local Governments Introduction FFIS has been in the federal grant reporting business for a long time about 30 years. The main thing we ve learned
Hannah Maxey, PhD, MPH, RDH Assistant Professor and Director of The Bowen Center for Health Workforce Research and Policy
 Hannah Maxey, PhD, MPH, RDH Assistant Professor and Director of The Bowen Center for Health Workforce Research and Policy Health Workforce: The intersection of health sciences, health systems, and population/patient
ETHNIC/RACIAL PROFILE OF STUDENT POPULATION IN SCHOOLS WITH
 Assembly on School-Based NASBHCNational Health Care Bringing Health Care to Schools for Student Success School-Based Health Centers National Census School Year 2004-05 PURPOSE A. Hanson 2007 The National
Final Report: Estimating the Supply of and Demand for Bilingual Nurses in Northwest Arkansas
 Final Report: Estimating the Supply of and Demand for Bilingual Nurses in Northwest Arkansas Produced for the Nursing Education Consortium Center for Business and Economic Research Reynolds Center Building
Loan Repayment Program Available to Medical Providers Practicing in Rural North Carolina
 COMMITTEE ON ACCESS TO HEALTHCARE IN RURAL NORTH CAROLINA Loan Repayment Program Available to Medical Providers Practicing in Rural North Carolina Maggie Sauer, MS, MHA Department of Health and Human Services
Demographics, Skills Gaps, and Market Dynamics
 Conference Papers Upjohn Research home page 2013 Demographics, Skills Gaps, and Market Dynamics Randall W. Eberts W.E. Upjohn Institute, eberts@upjohn.org Citation Eberts, Randall W. 2013. " Demographics,
Clinician Recruitment and Retention Strategies for Migrant Health Centers. Tuesday, May 5th, 2009
 Clinician Recruitment and Retention Strategies for Migrant Health Centers Tuesday, May 5th, 2009 1 Impact of Clinician Shortages & Recruitment Practices Trish Bustos Workforce Coordinator Northwest Regional
Montana AHEC Healthcare Workforce Advisory Committee Healthcare Workforce Strategic Plan
 Montana AHEC Healthcare Workforce Advisory Committee Healthcare Workforce Strategic Plan MUS Healthcare Education & Workforce Coordinating Council June 19, 2017 Kristin Juliar, Director Who we are AHEC
Updates from the UCSF Health Workforce Research Center
 Health Workforce Research Center on Long-Term Care Updates from the UCSF Health Workforce Research Center The UCSF Health Workforce Research Center has completed Year 1 in its four-year cooperative agreement
The Current State of Addiction Treatment
 The Current State of Addiction Treatment Understanding characteristics & needs of the substance abuse treatment workforce in Washington. Jeffrey R.W. Knudsen RMC Research Corporation jknudsen@rmccorp.com
TITLE V HEALTH CARE WORKFORCE Subtitle A Purpose and Definitions. KEY: Relevant titles Page numbers References to school psychology H. R.
 TITLE V HEALTH CARE WORKFORCE Subtitle A Purpose and Definitions KEY: Relevant titles Page numbers References to school psychology SEC. 5001. PURPOSE. The purpose of this title is to improve access to
Full-time Equivalents and Financial Costs Associated with Absenteeism, Overtime, and Involuntary Part-time Employment in the Nursing Profession
 Full-time Equivalents and Financial Costs Associated with Absenteeism, Overtime, and Involuntary Part-time Employment in the Nursing Profession A Report prepared for the Canadian Nursing Advisory Committee
Survey of Health Care Employers in Arizona: Home Health Agencies, 2015
 Survey of Health Care Employers in Arizona: Home Health Agencies, 2015 July 15, 2016 Prepared by: Lela Chu Joanne Spetz, PhD University of California, San Francisco 3333 California Street, Suite 265 San
Dashboard. Campaign for Action. Welcome to the Future of Nursing:
 Welcome to the Future of Nursing: Campaign for Action Dashboard About This Dashboard: These graphs and charts show goals by which the Campaign evaluates its efforts to implement recommendations in the
Registered Nurses. Population
 The Registered Nurse Population Findings from the 2008 National Sample Survey of Registered Nurses September 2010 U.S. Department of Health and Human Services Health Resources and Services Administration
Loan Repayment Program Available to Medical Providers Practicing in Rural North Carolina
 JOINT LEGISLATIVE OVERSIGHT COMMITTEE ON HEALTH AND HUMAN SERVICES - GRADUATE MEDICAL EDUCATION SUBCOMMITTEE Loan Repayment Program Available to Medical Providers Practicing in Rural North Carolina Maggie
South Carolina Nursing Education Programs August, 2015 July 2016
 South Carolina Nursing Education Programs August, 2015 July 2016 Acknowledgments This document was produced by the South Carolina Office for Healthcare Workforce in the South Carolina Area Health Education
The Nursing Workforce: Challenges for Community Health Centers and the Nation s Well-being
 The Nursing Workforce: Challenges for Community Health Centers and the Nation s Well-being Jane K Kadohiro, DrPH, APRN, CDE University of Hawaii at Manoa Overview Today s nursing workforce Determinants
Employee Telecommuting Study
 Employee Telecommuting Study June Prepared For: Valley Metro Valley Metro Employee Telecommuting Study Page i Table of Contents Section: Page #: Executive Summary and Conclusions... iii I. Introduction...
Nunavut Nursing Recruitment and Retention Strategy November 06, 2007
 Nunavut Nursing Recruitment and Retention Strategy November 06, 2007 Page 1 of 10 I. PREFACE The Nunavut Nursing Recruitment and Retention Strategy is the product of extensive consultation with nursing
The Cost of a Physician Vacancy
 The Cost of a Physician Vacancy A resource provided by Merritt Hawkins, the nation s leading physician search and consulting firm and a company of AMN Healthcare (NYSE: AHS), the largest healthcare workforce
Rural Health Clinics
 Rural Health Clinics * An Issue Paper of the National Rural Health Association originally issued in February 1997 This paper summarizes the history of the development and current status of Rural Health
Salary and Demographic Survey Results
 Salary and Demographic Survey Results Executive Summary In April of 2013, GPA conducted a salary and demographic survey of grant professionals. The survey was distributed to all active GPA members and
Bianca K. Frogner, PhD Assistant Professor The George Washington University. Joanne Spetz, PhD Professor University of California, San Francisco
 Bianca K. Frogner, PhD Assistant Professor The George Washington University Joanne Spetz, PhD Professor University of California, San Francisco Acknowledgements Funding: Joint Center for Political and
Health Care Sector Profile for the Lake Charles RLMA. Employment and Wage Trends 4th Quarter 2015 for the Health Care Sector by Parish
 Health Care Sector Profile for the Lake Charles RLMA The Labor Market information (LMI) division of Research and Statistics helps provide information on various sectors in the regional economy. Reports
Minnesota s Registered Nurse Workforce
 Minnesota s Registered Nurse Workforce 2013-2014 HIGHLIGHTS FROM THE 2013-2014 RN WORKFORCE SURVEY i Overall Registered nurses are the largest segment of the health care workforce delivering primary and
Oklahoma Department of Career and Technology Education
 Oklahoma Department of Career and Technology Education Information Commons September 2016 Oklahoma Healthcare Practitioners and Technical Occupations Parameters Occupations Code Description 29-0000 Healthcare
Health Care (NAICS 62, except 624) SIGNIFICANT POINTS
 SIGNIFICANT POINTS") Health Care (NAICS 62, except 624) SIGNIFICANT POINTS As the largest industry in 2004, health care provided 13.5 million jobs 13.1 million jobs for wage and salary workers and about 411,000 jobs for the
Health Care (NAICS 62, except 624) SIGNIFICANT POINTS As the largest industry in 2004, health care provided 13.5 million jobs 13.1 million jobs for wage and salary workers and about 411,000 jobs for the
State Statutes Search: https://www.childwelfare.gov/topics/systemwide/lawspolicies/state/?cwigfunctionsaction=statestatutes:main&cwigfunctionspk=1
 State Statutes Search: https://www.childwelfare.gov/topics/systemwide/lawspolicies/state/?cwigfunctionsaction=statestatutes:main&cwigfunctionspk=1 California Mandatory Reporters of Citation: Penal Code
Certified Community Behavioral Health Clinic (CCHBC) 101
 101") Certified Community Behavioral Health Clinic (CCHBC) 101 On April 1, 2014, the President signed the Protecting Access to Medicare Act (PAMA) into law, which included a provision authorizing a two part
Certified Community Behavioral Health Clinic (CCHBC) 101 On April 1, 2014, the President signed the Protecting Access to Medicare Act (PAMA) into law, which included a provision authorizing a two part
Improving Care for Dual Eligibles through Health IT
 Los Angeles, October 31, 2012 Presentation Improving Care for Dual Eligibles through Health IT The National Dual Eligibles Summit Duals Market is sizable Medicare and Medicaid Populations Medicaid Total
2014 Online Job Advertisements for Licensed Psychologists
 2014 Online Job Advertisements for Licensed Psychologists American Psychological Association Center for Workforce Studies Luona Lin, M. Cameron Hatcher, Karen Stamm, and Peggy Christidis January 2016 Recommended
Minnesota s Physical Therapist Assistant Workforce, 2015
 Minnesota s Physical Therapist Assistant Workforce, 2015 HIGHLIGHTS FROM THE 2015 PHYSICAL THERAPIST ASSISTANT WORKFORCE SURVEY i Overall According to the Minnesota Board of Physical Therapy, as of April
Florida s Workforce Supply Characteristics and Trends: Registered Nurses (RN)
") Florida s 2016-2017 Workforce Supply Characteristics and Trends: Registered Nurses (RN) Addressing Nurse Workforce Issues for the Health of Florida www.flcenterfornursing.org Visit our site at: www.flcenterfornursing.org
Florida s 2016-2017 Workforce Supply Characteristics and Trends: Registered Nurses (RN) Addressing Nurse Workforce Issues for the Health of Florida www.flcenterfornursing.org Visit our site at: www.flcenterfornursing.org
Introduction. Current Law Distribution of Funds. MEMORANDUM May 8, Subject:
 MEMORANDUM May 8, 2018 Subject: TANF Family Assistance Grant Allocations Under the Ways and Means Committee (Majority) Proposal From: Gene Falk, Specialist in Social Policy, gfalk@crs.loc.gov, 7-7344 Jameson
The Northwest Minnesota Health Professions Study: An Analysis
 The Northwest Minnesota Health Professions Study: An Analysis The Northwest Minnesota Health Professions Study: An Analysis - Development and publication of this analysis sponsored by: University of Minnesota
The Nurse Labor and Education Markets in the English-Speaking CARICOM: Issues and Options for Reform
 A. EXECUTIVE SUMMARY 1. The present report concludes the second phase of the cooperation between CARICOM countries and the World Bank to build skills for a competitive regional economy. It focuses on the
The Health Care Workforce in New York, 2005 Trends in the Supply and Demand for Health Workers
 The Health Care Workforce in New York, 2005 Trends in the Supply and Demand for Health Workers The Center for Health Workforce Studies School of Public Health, University at Albany 7 University Place Rensselaer,
Step one; identify your most marketable skill sets and experiences. Next, create a resume to summarize and highlight those skills.
 UNDERSTANDING THE JOB MARKET Step one; identify your most marketable skill sets and experiences. Next, create a resume to summarize and highlight those skills. Now you are ready to begin your entry into
IMPROVING WORKFORCE EFFICIENCY
 JULY 14, 2010 IMPROVING WORKFORCE EFFICIENCY Developing and training a health care workforce to meet the increased demand on services due to an increase in access from health reform, an aging population,
SEP Memorandum Report: "Trends in Nursing Home Deficiencies and Complaints," OEI
 DEPARTMENT OF HEALTH &. HUMAN SERVICES Office of Inspector General SEP 18 2008 Washington, D.C. 20201 TO: FROM: Kerry Weems Acting Administrator Centers for Medicare & Medicaid Services Daniel R. Levinson~
Improve the geographic distribution of health professionals; Increase access to health care for underserved populations; and
 The members of the Health Professions and Nursing Education Coalition (HPNEC) are pleased to submit this statement for the record in support of the health professions education programs authorized under