Final Report: Estimating the Supply of and Demand for Bilingual Nurses in Northwest Arkansas
|
|
|
- Jennifer Spencer
- 5 years ago
- Views:
Transcription
 575-4151 Contact: Katherine A.")
1 Final Report: Estimating the Supply of and Demand for Bilingual Nurses in Northwest Arkansas Produced for the Nursing Education Consortium Center for Business and Economic Research Reynolds Center Building 217 Sam M. Walton College of Business 1 University of Arkansas Fayetteville, Arkansas (479) Contact: Katherine A. Deck, Interim Director March 2007
2 Executive Summary In 2004, researchers at the Center for Business and Economic Research (CBER) in the Sam M. Walton College of Business at the University of Arkansas prepared a report that detailed the projected shortage of minority nurses in the four county region of Northwest Arkansas. The study focused particularly on the Hispanic residents of Northwest Arkansas, as projections showed the estimated proportion of the total population for that ethnicity increasing from 9.5 percent in 2005 to 16.0 percent in A separate set of projections in the report estimated that the proportion of the nursing workforce with Hispanic ethnicity would increase from 2.1 to 3.9 percent over the same time period. The report concluded that over the 20 year period, there would be an ever-increasing Hispanic representation disparity in the Northwest Arkansas nursing labor force. That study succeeded in its goal of quantifying the projected shortage of minority nurses relative to the overall population base. This provided nurse educators, hospitals, and grant-makers with sufficient information to begin addressing the Hispanic nurse gap with a variety of programs. However, upon the completion of the study, additional questions remained regarding the second language skills of the Northwest Arkansas nursing workforce and the effect on the quality of patient healthcare. To that end, the Nursing Education Consortium approached the CBER about producing a new report with four objectives: 1. To determine the existing bilingual nursing population, and to the degree possible, the extent of the language capabilities of the existing nursing population; 2. To determine the frequency of interaction between non-english speaking patients and non-bilingual nurses/healthcare staff; 3. To determine how information is conveyed when a non-bilingual healthcare provider interacts with a non-english speaking patient; and 4. To qualitatively and quantitatively where possible, estimate the impact of interactions between non-bilingual healthcare providers and non-english speaking patients on the following measures: a. The quality of care, b. Patient privacy and record confidentiality, and c. Efficiency of providing healthcare services In order to accomplish these objectives, substantial support was necessary from Northwest Arkansas hospital administrators, nurse supervisors, nurse educators, and bilingual nursing students. A study methodology was conceived employing surveys of three distinct populations: hospital administrators in Benton and Washington Counties, the nursing workforce in Northwest Arkansas, and non-english speaking patients at the six acute care hospitals in Benton and Washington Counties. From these surveys, the following highlights resulted. ii
3 Northwest Arkansas hospital administrators reported that 3.5 percent (53 out of 1,497) of their nursing workforce had bilingual capabilities at the end of percent of the sample of nurses in Northwest Arkansas self-reported either proficiency or fluency in oral Spanish. None of the 359 nurses included in the study sample reported having any proficiency or fluency in Marshallese or Vietnamese percent of hospital administrators reported that non-english speaking patients interact with non-bilingual nurses on at least a daily basis. Only 42.5 percent of nurses reported personal interactions with non-english speaking patients on at least a daily basis. LPNs were more likely to interact with non-english speaking patients daily than RNs. When bilingual nurses are unavailable, personal communication is accomplished as shown in the table below: When no bilingual nurse is available, what percentage of the time is communication accomplished Hospital Administrator Average Nurse Average By a Bilingual Clinical Staff Member? 28.0% 38.0% By a Bilingual Non-Clinical Staff Member? 38.0% 34.0% By a Bilingual Adult Relative of the Patient? 49.0% 49.0% By a Bilingual Minor Relative of the Patient? 29.0% 38.0% All of the hospital administrators reported that telephone translation services were used on at least a daily basis. Only 26.1 percent of nurses reported at least daily usage of telephone translators. The table below summarizes the hospital administrator and nurse perceived negative and strong negative effects of interactions between non-bilingual nurses and non-english speaking patients. Measure Percent of Hospital Administrators Reporting Negative or Strong Negative Effects Percent of Nurses Reporting Negative or Strong Negative Effects Patient Assessment 88.9% 79.7% Standard of Care 77.8% 57.2% Record Confidentiality 44.4% 51.3% Facility Efficiency 30.0% 79.8% 85.8 percent of surveyed non-english speaking patients identified a hospital translator as being the most beneficial form of communication, but only 41.2 percent of patients reported receiving medical information from a hospital translator percent of non-english speaking patients reported that the most beneficial aspect of bilingual nursing staff was the ability to receive timely answers to medical questions. iii
4 Table of Contents Executive Summary... ii Table of Contents... iv List of Figures... iv List of Tables... v Introduction... 1 Background Information... 3 Administrator Survey... 5 Description... 5 Results... 5 Nurse Survey Description Results Patient Survey Description Results Conclusions Demand for Bilingual Nurses in Northwest Arkansas Supply of Bilingual Nurses in Northwest Arkansas Appendix Hospital Administrator Survey Nurse Survey Patient Survey English Version Spanish Version List of Figures Figure 1: Nurses in Washington and Benton County Hospitals by Licensure... 6 Figure 2: Postcard Soliciting Participation in Nurse Survey Figure 3: Respondent Distribution by Facility County Figure 4: Respondent Distribution by County of Residence iv
5 List of Tables Table 1: How many full-time equivalent nurses are employed at your facility by licensure?... 5 Table 2: How many full-time equivalent nurses have bilingual capabilities?... 7 Table 3: Please provide an evaluation of the extent of the language capabilities, both written and oral, of your bilingual nursing staff Table 4: How often do non-english speaking patients interact with non-bilingual nurses?... 8 Table 5: When non-english speaking patients interact with non-bilingual nurses, what percentage of that time is used to convey healthcare information... 9 Table 6: On average, when a bilingual nurse is not available, what effect is there on the quality of the assessment a nurse completes for that non-english speaking patient?... 9 Table 7: On average, when a bilingual nurse is not available, what effect is there on the standard of care a non-english speaking patient receives?... 9 Table 8: On average, when a bilingual nurse is not available, what effect is there on the record confidentiality of non-english speaking patients? Table 9: On average, when a bilingual nurse is not available, what effect is there on facility efficiency (the ability of the facility staff to serve each patient efficiently)? Table 10: How often are telephone translators used in your facility? Table 11: How much does your facility expend monthly for telephone translators? Table 12: What would the level on interest be in offering medical Spanish programs for English speakers on your staff? Table 13: Are you familiar with the National Standards on Culturally and Linguistically Appropriate Services (CLAS)? Table 14: Is interpretation a part of the job description and performance evaluation of your nurses with additional language skills? Table 15: Are there any other observations or comments you would like to share with the Center for Business and Economic Research and the Nursing Education Consortium regarding the bilingual nursing situation in Northwest Arkansas? Table 16: LPN and RN Nurse Population in Northwest Arkansas Table 17: Nurse Survey Respondent Distribution by Facility County Table 18: What is your county of residence? Table 19: What is your highest level of Arkansas nursing licensure? Table 20: What is your highest level of nursing education? Table 21: What type of facility employs you? Table 22: How often do you interact with non-english speaking patients? Table 23: Nurse Interaction with non-english Speaking Patients by Licensure Table 24: When non-english speaking patients interact with non-bilingual nurses, what percentage of that time is used to convey healthcare information Table 25: On average, when a bilingual nurse is not available, what effect is there on the quality of the assessment a nurse completes for that non-english speaking patient? Table 26: On average, when a bilingual nurse is not available, what effect is there on the standard of care a non-english speaking patient receives? Table 27: On average, when a bilingual nurse is not available, what effect is there on the record confidentiality of non-english speaking patients? v
6 Table 28: On average, when a bilingual nurse is not available, what effect is there on facility efficiency (the ability of the facility staff to serve each patient efficiently)? Table 29: What is your oral second language capability? Table 30: Oral Spanish capability by licensure Table 31: What is your written or reading second language capability? Table 32: How often are telephone translators used in your facility? Table 33: How interested would you be in taking a Spanish language course in medical terms and conversational style? Table 34: If a Spanish language medical conversation course were available, which time format would you prefer? Table 35: Which option would most motivate you to take a Spanish language medical conversation course? Table 36: Are there any other observations or comments you would like to share with the Center for Business and Economic Research and the Nursing Education Consortium regarding the bilingual nursing situation in Northwest Arkansas? Table 37: What is the patient's gender? Table 38: In what year were you born? Table 39: Please describe your ethnicity Table 40: Why were you in the hospital? Table 41: What is your country (continent) of origin? Table 42: Which describes your ability to understand medical instructions in English? 32 Table 43: Did nursing staff that treated you speak Spanish? Table 44: Which answers best describe how you received medical information? Table 45: Of all of these forms of communication, which was the most beneficial to you? Table 46: I would consider bilingual nursing staff to be a benefit because: Table 47: Are there other comments you would like to make for this survey? Table 48: Comparison of Hospital Administrator and Nurse Perceptions of the Effect of non-bilingual Nurse Interactions with non-english Speaking Patients vi
7 Introduction In its earlier study entitled Nursing Workforce Shortage and Diversity Disparity in Northwest Arkansas 1 released in September 2004, the Center for Business and Economic Research (CBER) estimated the overall shortage of registered nurses (RNs) and the shortage of minority nurses in Northwest Arkansas relative to minority representation in the general population. Unfortunately, the fundamental questions germane to both the quality of care provided to non-english speaking patient populations and the possible inefficiencies caused by the unavailability of a bilingual nursing workforce were not addressed due to the lack of sufficient funding. Additional funding would have allowed for the compilation of localized nursing data, especially data related to nurses language capabilities. These deficiencies imply the previous study was not able to shed direct light on the shortage of bilingual nurses and the impact of that shortage on healthcare outcomes. In response to the widely discussed/adopted strategy of recruiting bilingual high school graduates to Northwest Arkansas s nursing schools in hopes of increasing the bilingual nursing population, it is important to examine whether there exists a shortage of bilingual nurses and the severity of such a shortage in the existing nursing workforce. Further, even if such a shortage is determined, its urgency cannot be substantiated unless a negative relationship is found between healthcare quality and efficiency and the shortage of bilingual nurses. To accomplish the above, this proposed study must achieve the following objectives: 1. To determine the existing bilingual nursing population, and to the degree possible, the extent of the language capabilities of the existing nursing population; 2. To determine the frequency of interaction between non-english speaking patients and non-bilingual nurses/healthcare staff; 3. To determine how information is conveyed when a non-bilingual healthcare provider interacts with a non-english speaking patient; and 4. To qualitatively and quantitatively where possible, estimate the impact of interactions between non-bilingual healthcare providers and non-english speaking patients on the following measures: a. The quality of care, b. Patient privacy and record confidentiality, and c. Efficiency of providing healthcare services Completion of the objectives listed above will significantly improve our understanding of the relationship between supply of and demand for bilingual nurses, and more importantly, the magnitude of the costs in monetary and non-monetary terms of failing to provide bilingual nurses to serve the non-english speaking patient population. 1 Defined as the region including Benton, Carroll, Madison, and Washington Counties. 1
8 In order to accomplish these objectives, substantial support was necessary from Northwest Arkansas hospital administrators, nurse supervisors, nurse educators, and bilingual nursing students. A study methodology was conceived employing surveys of three distinct populations: hospital administrators in Benton and Washington Counties, the nursing workforce in Northwest Arkansas, and non-english speaking patients at the six acute care hospitals in Benton and Washington Counties. When the results of these surveys are combined with the estimates of the disparity between minority representation in the general population and minority representation in registered nurses in Northwest Arkansas, a much broader picture of bilingual nursing supply and demand emerges. This report is structured as follows. In the next section, some background information from the 2004 CBER report on the nursing workforce shortage is presented. The next section contains a description of and the results from the hospital administrator survey. Following that are the methodology and outcomes of the nurse survey and the non- English speaking patient survey. A set of conclusions ties all of the results together. At the end of the document there is an appendix which contains screen shots of the Internet based surveys and copies of the paper based survey instruments and informed consent forms. 2
9 Background Information The following table and graph summarized many of the results of the 2004 CBER Report Nursing Workforce Shortage and Diversity Disparity in Northwest Arkansas. Of particular note to the current report are the projections about the Hispanic population and Hispanic registered nurses. The table shows that the percentage of the overall population in Benton, Carroll, Madison, and Washington Counties that is Hispanic is expected to rise from 9.5 percent in 2005 to 16.0 percent in At the same time, the proportion of registered nurses who are Hispanic is expected to rise from 2.1 percent to 3.8 percent. This implies an ever-increasing shortage of Hispanic nurses based on population representation. Year Disparity between Racial/Ethnic Minority Representation in the General Population and the Population of Registered Nurses in Northwest Arkansas Non-Hispanic Black Percent of Projected General Population Hispanic Asian/Pacific Islander American Indian Alaskan Native Other Races or Ethnicity Minority Total % 9.5% 1.6% 1.3% 1.5% 15.1% % 10.7% 1.8% 1.2% 1.5% 16.7% % 13.9% 2.2% 0.9% 1.5% 20.4% % 16.0% 2.4% 0.8% 1.5% 23.0% Year Non-Hispanic Black Percent of Projected Number of Registered Nurses Hispanic Asian/Pacific Islander American Indian Alaskan Native Other Races or Ethnicity Minority Total % 2.1% 3.7% 0.5% 2.5% 13.8% % 2.3% 3.8% 0.4% 3.2% 15.1% % 3.1% 4.2% 0.3% 5.4% 19.5% % 3.8% 4.6% 0.2% 7.7% 23.9% Year Non-Hispanic Black Racial/Ethnic Minority Representation Disparity Hispanic Asian/Pacific Islander American Indian Alaskan Native Other Races or Ethnicity Minority Total % -7.3% 2.1% -0.8% 1.0% -1.3% % -8.4% 2.0% -0.7% 1.6% -1.5% % -10.8% 2.0% -0.6% 3.9% -0.9% % -12.2% 2.1% -0.6% 6.1% 0.9% (-) indicates under-representation and (+) indicates over-representation in registered nurses Source: UA Center for Business and Economic Research 3
10 Projected Demand, Supply, and Shortage Trends of Hispanic Nurses in the 4-County Study Area Number of Registered Nurses Demand Supply Shortage Projection Year As can be seen, while shortfalls are projected based on racial and ethnic representation, no specific information about the language capabilities of the nursing workforce emerge. Hispanic nurses may or may not have Spanish language capabilities, just as nurses of other ethnicities may or may not have Spanish language capabilities. Therefore, programs that are designed to alleviate the disparity of nurses based on ethnicity may not be sufficient to address a lack of bilingually trained nurses in the Northwest Arkansas area. The remaining portions of this report are designed to illuminate what the bilingual capabilities of the Northwest Arkansas nursing workforce are and what impacts bilingual capabilities have on the quality of the region s healthcare. 4
11 Administrator Survey Description The first part of the three-pronged approach to examine the status of bilingual nurses in Northwest Arkansas involved surveying local hospital administrators. The administrators consisted of chief nursing officers, directors of information, and compliance officers within their assorted organizations. The survey instrument was designed to elicit information about the characteristics of each hospital s nursing workforce, specifically their language capabilities. The survey also sought to quantify the prevalence of interactions between non-english speaking patients and non-bilingual nurses, and the administrators perceptions of the effects those interactions have on patient assessment, standard of care, and record confidentiality, as well as overall facility efficiency. The administrators were also queried about their perceptions of the need for bilingual medical training for their employees. Administrators from all six hospitals in Washington and Benton Counties participated in this survey, so the results reflect a complete picture of the state of bilingual nursing in the region s hospitals. The survey was administered starting in November An Internet based survey instrument was used (see the Appendix for screen shots of the survey instrument). A total of 10 hospital administrators provided information on Northwest Medical Center- Bentonville, Northwest Medical Center-Springdale, Siloam Springs Memorial Hospital, St. Mary s Hospital, Washington Regional Medical Center, and Willow Creek Women s Hospital. Results Table 1 presents the breakdown of nurse licensures at the respondent facilities. Nearly 1,500 nurses worked at the six hospitals in Benton and Washington Counties. Of these nurses, a total of 53.7 percent were reported as licensed at the registered nurse (RN) level. There were 280 nurses included in the survey results whose designations were not reported. If these nurses have licensures that are distributed like those that were reported, then 66.1 percent of the hospital nurses would have RN designations. Figure 1 shows how RNs make up the bulk of the hospital nursing workforce, followed by Certified Nurse Assistants (CNAs), Licensed Practical Nurses (LPNs), RNs with Bachelors of Science in Nursing (BSN-RNs), and Advanced Practice Nurses (APNs). Table 1: How many full-time equivalent nurses are employed at your facility by licensure? Nurse Licensure Number Percent of Total CNA % LPN % RN % BSN-RN % APN 7 0.5% Not Reported % Total 1, % 5
12 Figure 1: Nurses in Washington and Benton County Hospitals by Licensure APN, 7 BSN-RN, 77 Not Reported, 280 CNA, 240 LPN, 89 RN, 804 Having established the total population of nurses working at Benton and Washington County hospitals, determining the bilingual skills of that population was the next imperative. Table 2 details the bilingual capabilities of the respondent facilities nursing populations. Although, the hospital administrator respondents were asked about multiple language capabilities (including Spanish, Vietnamese, Marshallese, and all other languages), respondents only reported the existence of bilingual Spanish capabilities among their nursing staffs. Table 2 shows that 53 nurses were identified as having bilingual capabilities by their administrators. While RNs constituted the largest number of bilingually capable nurses, only 2.6 percent of the RN population in Benton and Washington County hospitals were identified as being bilingual. Each of the other nurse licensure categories have fewer bilingual representatives in Northwest Arkansas hospitals, but a greater percentage of the nurses in each category have bilingual skills. The largest percentages of bilingual nurses by licensure were CNAs (7.5 percent), BSN- RNs (6.5 percent), and LPNs (5.6 percent). The hospital administrator respondents reported that none of the nurses working with APN licensure had bilingual capabilities. Overall, 3.5 percent of the Benton and Washington County hospital nursing workforce was identified as having bilingual Spanish capabilities. This percentage is virtually identical to the 3.4 percent rate of bilingual capabilities in the nurses whose licensures were not reported by their hospital administrator. 6
13 Table 2: How many full-time equivalent nurses have bilingual capabilities? Nurse Licensure Spanish Spanish as Percent of Total Vietnamese Marshallese Other CNA % LPN 5 5.6% RN % BSN-RN 5 6.5% APN 0 0.0% Not Reported % Total % The hospital administrators were then asked to evaluate the oral and written language capabilities of their nursing staffs by licensure. Once again, the administrators only reported having bilingual capabilities in the Spanish language. Vietnamese, Marshallese, and other language capabilities were not reported, even in elementary form, among the hospital nursing staffs. Table 3 presents the results of the language proficiency evaluations. The hospital administrators reported proficient and fluent CNAs, elementary-skilled LPNs, RNs at every capability level, and no bilingual capabilities among the APN workforce. Table 3: Please provide an evaluation of the extent of the language capabilities, both written and oral, of your bilingual nursing staff. Oral Language Capability Spanish Vietnamese Marshallese Other CNA Elementary Proficient Fluent LPN Elementary Proficient Fluent RN Elementary Proficient Fluent BSN-RN Elementary Proficient Fluent APN Elementary Proficient Fluent
14 Written Language Capability Spanish Vietnamese Marshallese Other CNA Elementary Proficient Fluent LPN Elementary Proficient Fluent RN Elementary Proficient Fluent BSN-RN Elementary Proficient Fluent APN Elementary Proficient Fluent The first part of the hospital administrator survey instrument established some descriptive statistics about the hospital nursing staff population in Northwest Arkansas. The second part of the survey instrument was designed to collect information about the respondent hospital administrators perception of the interactions between non-english speaking patients and non-bilingual nurses. Table 4 shows the reported breakdown of the frequency of interactions between non-english speaking patients and non-bilingual nurses percent of the respondent administrators reported that non-english speaking patients interact with non-bilingual nurses in their facility at least daily, with 30.0 percent reporting hourly interaction between non-english speaking patients and non-bilingual staff percent of respondents reported these interactions occur on a weekly basis and the remaining 20.0 percent reported interaction between non-english speaking patients and non-bilingual nursing staff seldom/never happen. Table 4: How often do non-english speaking patients interact with non-bilingual nurses? How Often? Count Percent of Total Every Hour % Daily % Weekly % Monthly 0 0.0% Seldom/Never % When interactions between non-english speaking patients and non-bilingual nurse occur, there are a variety of ways that information can be conveyed. Table 5 shows that translator phone services are most often used (80.0 percent of the time), followed by interacting via an adult bilingual relative of the patient (49.0 percent of the time), interacting via a bilingual non-clinical hospital staff member (38.0 percent of the time), interacting via a bilingual minor relative of the patient (29.0 percent of the time), and 8
15 interacting via a bilingual clinical staff member who is not a nurse (28.0 percent of the time.) Table 5: When non-english speaking patients interact with non-bilingual nurses, what percentage of that time is used to convey healthcare information... How? Average Median Count By a Bilingual Clinical Staff Member? 28.0% 20.0% 8 By a Bilingual Non-Clinical Staff Member? 38.0% 30.0% 10 By a Bilingual Adult Relative of the Patient? 49.0% 40.0% 9 By a Bilingual Minor Relative of the Patient? 29.0% 20.0% 7 By Translation Phone? 80.0% 80.0% 5 Using one of these alternate communication options for interacting with a non-english speaking patient when no bilingual nurse is available may affect various aspects of the patient s hospital experience and satisfaction as well as the management and effectiveness of the hospital as an organization. The next part of the hospital administrator survey instrument was designed to investigate whether managers perceived any differential effects on a variety of quality measures. These measures include patient assessment quality, standard of care, record confidentiality, and facility efficiency. Table 6 shows that 88.9 percent of the hospital administrators reported that the lack of a bilingual nurse led to a negative or strongly negative effect on patient assessment. In Table 7, it can be seen that 77.8 percent of the hospital administrators perceive a negative or strongly negative effect on the standard of care a non-english speaking patient receives when a bilingual nurse is unavailable. Table 6: On average, when a bilingual nurse is not available, what effect is there on the quality of the assessment a nurse completes for that non-english speaking patient? Effect Count Percent of Total Strong Positive Effect on Assessment 0 0.0% Positive Effect on Assessment 0 0.0% No Effect on Assessment % Negative Effect on Assessment % Strong Negative Effect on Assessment % Table 7: On average, when a bilingual nurse is not available, what effect is there on the standard of care a non-english speaking patient receives? Effect Count Percent of Total Strong Positive Effect on Standard of Care 0 0.0% Positive Effect on Standard of Care 0 0.0% No Effect on Standard of Care % Negative Effect on Standard of Care % Strong Negative Effect on Standard of Care % Hospital administrators do not report the same levels of negative effects on record confidentiality as on assessment and standard of care when non-english speaking patients interact with non-bilingual nurses. In fact as shown in Table 8, 11.1 percent of 9
16 administrators believe that there is a positive effect on record confidentiality, while 44.4 percent believe that there is no differential effect on record confidentiality when a bilingual nurse is unavailable. Table 8: On average, when a bilingual nurse is not available, what effect is there on the record confidentiality of non-english speaking patients? Effect Count Percent of Total Strong Positive Effect on Record Confidentiality 0 0.0% Positive Effect on Record Confidentiality % No Effect on Record Confidentiality % Negative Effect on Record Confidentiality % Strong Negative Effect on Record Confidentiality % Table 9 shows that hospital administrators also have mixed feelings about the overall benefit bilingual nurses have on the ability of the facility staff to serve each patient efficiently. A total of 60.0 percent of the hospital administrators indicated that the unavailability of bilingual nursing staff had a positive or strongly positive effect on facility efficiency percent of the administrators indicated a negative or strongly negative impact on efficiency, and 10.0 percent indicated no impact on facility efficiency. Table 9: On average, when a bilingual nurse is not available, what effect is there on facility efficiency (the ability of the facility staff to serve each patient efficiently)? Effect Count Percent of Total Strong Positive Effect on Efficiency % Positive Effect on Efficiency % No Effect on Efficiency % Negative Effect on Efficiency % Strong Negative Effect on Efficiency % The final part of the hospital administrator survey instrument queried the hospital management about their telephone translation systems, perceived interest in offering medical Spanish training opportunities for their nursing staff, and policies for evaluating and rewarding staff for having bilingual skills. The information in Table 10 reiterates the importance of telephone translation services (as previously shown in Table 5). A total of 60.0 percent of the respondent administrators indicate using telephone translators every hour, and the remaining 40.0 percent of administrators reported daily use of this service. Table 10: How often are telephone translators used in your facility? How Often? Count Percent of Total Every Hour % Daily % Weekly 0 0.0% Monthly 0 0.0% Seldom/Never 0 0.0% 10
17 Most of the administrator respondents did not provide information about the expenditures required for the telephone translation services; however, two of the respondents indicated that such services averaged $4,750 per month for their hospital facilities. Table 11 shows this information. Table 11: How much does your facility expend monthly for telephone translators? Average Count How Much? $4,750 2 When queried about the perceived level of interest in offering medical Spanish programs for English speaking nursing staff, all respondents indicated that they were at least somewhat interested. 70 percent of administrators responded that their level of interest was very high, as shown in Table 12. Table 12: What would the level on interest be in offering medical Spanish programs for English speakers on your staff? Level of Interest Count Percent of Total Very Interested % Somewhat Interested % Not Interested 0 0.0% However, when it comes to evaluating the performance of nurses with additional language skills, only 30.0 percent of respondents indicated that they were aware of the National Standards on Culturally and Linguistically Appropriate Services (CLAS). Only 10.0 percent of respondents indicated that interpretation is included in the job description or performance evaluation for their nursing staff. Table 13: Are you familiar with the National Standards on Culturally and Linguistically Appropriate Services (CLAS)? Familiarity Count Percent of Total Yes % No % Table 14: Is interpretation a part of the job description and performance evaluation of your nurses with additional language skills? Job Description and Evaluation Contain Interpretation Count Percent of Total Yes % No % Finally, the hospital administrators were invited to share any other thoughts that they might have on the bilingual nursing situation in Northwest Arkansas. All of the comments offered by the respondents dealt with the practical issues of bilingual skill dissemination and retention. Table 15 details the comments in their entirety. 11
18 Table 15: Are there any other observations or comments you would like to share with the Center for Business and Economic Research and the Nursing Education Consortium regarding the bilingual nursing situation in Northwest Arkansas? Comments Frequent small learning sessions would be helpful if conducted with words/phrases staff must use every day Nurses want to learn languages to be better able to serve the patients that they care for. They desire language skills that are conversational as well as medically based to care for the whole patient. A continuum of courses needs to be conveniently offered. I am in a beginning Spanish class, and, even though I took Spanish several years ago, it is very difficult to learn a language at my age. I have also been amazed by the lack of interest nurses have in learning a second language. Nurse Survey Description The second prong of the three-tiered approach to examining the bilingual nursing population in Northwest Arkansas involved surveying the nurses themselves. The nurse survey instrument was designed to elicit information about the bilingual skills of the population, perceptions about the quality of care that non-english speaking patients receive, and interest in and motivation for taking medical Spanish training classes. Of the three surveys included in this study, the nurse component is perhaps the most important for providing a ground level view of the status of the bilingual nursing community as well as the impact of interactions between non-english speaking patients and nonbilingual nurses. In order to administer the nurse survey, address lists of current RNs and LPNs were obtained from the Arkansas Nursing Board. Within the broad four county region of Northwest Arkansas (Benton, Carroll, Madison, and Washington Counties), there were 1,101 LPNs and 3,141 RNs. Table 16 contains the breakdown of nurses by county. Table 16: LPN and RN Nurse Population in Northwest Arkansas County LPN Percent of Percent of LPN and Percent of RN Total Total RN Total Benton % 1, % 1, % Carroll % % % Madison % % % Washington % 1, % 2, % Total 1, % 3, % 4, % Source: Arkansas Nursing Board (November 2006) In November 2006, postcards were sent to each of the Northwest Arkansas nurses on the Arkansas Nursing Board list. Figure 2 shows the text of that postcard. Participants were 12

19 asked to use an online survey tool (available in the Appendix of this document) or to request a paper survey if Internet access was unavailable. Figure 2: Postcard Soliciting Participation in Nurse Survey This initial request for participation netted about 100 completed survey responses. As a second strategy for obtaining surveys, hospital administrators at each of the six Washington and Benton County hospitals were asked to encourage their nursing staffs to complete the survey. A combination of making hospital Internet connections available to nursing staff to complete the online instrument, providing paper surveys and postage-paid return envelopes in conspicuous locations, and having CBER researchers operate laptop computers with wireless Internet connections in public hospital spaces increased the response rate to the survey. A total of 359 surveys were completed by nursing staff during the study period which ended on March 1, This response level means that, in general, one can be 95% confident that the survey sample averages reflect the true population averages with a confidence interval of plus or minus 5 percent. Results The results of the survey of nurses are presented in this section. The nurses were asked to identify their facility or worksite name. The facilities were then coded by county. Table 17 and Figure 3 show the nurse survey sample distribution by facility county. Washington County accounted for 48.5 percent of the responses, while Benton County accounted for 39.0 percent. If the responses where facility was not reported are 13
20 distributed like the rest of the sample, then Washington County facilities employ 54.5 percent of the nurse respondents and Benton County facilities employ 43.9 percent of the nurse respondents. Boone, Carroll, and Pulaski counties also were reported as containing facilities that employ nurses included in the sample. Table 17: Nurse Survey Respondent Distribution by Facility County Facility County Count Percent of Total Benton % Boone 1 0.3% Carroll 3 0.8% Pulaski 1 0.3% Washington % Not Reported % Total % Figure 3: Respondent Distribution by Facility County Washington 48.5% Benton 39.0% Boone 0.3% Pulaski 0.3% Not Reported 11.1% Carroll 0.8% After determining the county of employment for the nurse sample, a question was then asked about each nurse s county of residence. This question allows for direct comparison between the sample of respondents to the nurse survey and the population of nurses in Northwest Arkansas as defined by the Arkansas Nursing Board s master list. Table 18 and Figure 4 show the respondent distribution by county of residence. The results show that the distribution of survey respondents was disproportionately likely to be from Benton County and disproportionately unlikely to be from Washington County as 14
21 compared to the overall nurse population in Northwest Arkansas. The comparisons between the Carroll and Madison County respondent rates were not significantly different from their population percentages. Table 18: What is your county of residence? County of Residence Count Percent of Total Benton % Carroll 4 1.1% Madison 8 2.2% Washington % Other % Not Reported % Total % Figure 4: Respondent Distribution by County of Residence Washington 40.9% Benton 49.6% Other 3.1% Not Reported 3.1% Madison 2.2% Carroll 1.1% The nurse respondents were then asked about their level of licensure. Table 19 shows the distribution of the licensure level for the nurse survey respondent sample. Out of the sample, 86.1 percent of the respondents reported having a RN designation as their highest level of licensure, and 10.0 percent of the respondents report having a LPN designation. When the APNs, CNAs, and respondents who did not report licensure are excluded, these percentages are 89.6 percent for RNs and 10.4 percent for LPNs. As the true population has a RN percentage of 74.0 percent and an LPN percentage of 26.0 percent, it can be seen that the respondents were disproportionately likely to be RNs and disproportionately unlikely to be LPNs, relative to the true population. 15
22 Table 19: What is your highest level of Arkansas nursing licensure? Nursing Licensure Count Percent of Total Advanced Practice Nurse 5 1.4% Registered Nurse % Licensed Practical Nurse % Certified Nursing Assistant 3 0.8% Not Reported 6 1.7% Total % The next survey instrument question asked the respondents about their levels of nursing education. Almost half (48.2 percent) of the survey respondents indicated that an associate degree was their highest level of nursing education, while an additional 28.7 percent indicated that a baccalaureate degree was their highest level of nursing education. According to 2000 U.S. Census Bureau data, in Benton and Washington Counties, 22.4 percent of the general population has at least a baccalaureate degree. Thus, the educational attainment of the nurse survey sample was slightly higher than that of the general population (data were not available for the nursing population). Table 20: What is your highest level of nursing education? Educational Attainment Count Percent of Total Diploma % Associate % Baccalaureate % Masters % Doctorate 1 0.3% Total % Although postcards were sent to the entire population of nurses in Benton, Carroll, Madison, and Washington Counties, extra effort was placed on acquiring respondents from the six acute care hospitals in Benton and Washington Counties. Therefore the results shown in Table 21 are not surprising. A total of 85.6 percent of all the nurse respondents reported being employed by acute care hospitals. An additional 4.8 percent of nurses reported working in medical, surgery, or specialty clinics, with other employers making up less than a percent apiece. The remainder of the results for the nurse survey should, therefore, be viewed through that lens the respondents were most likely nurses working in an acute care hospital setting. 16
23 Table 21: What type of facility employs you? Facility Type Count Percent of Total Acute Care Hospital % Medical Clinic 5 1.4% Surgical Clinic 4 1.1% Specialty Clinic 8 2.3% Rehabilitation Clinic 3 0.8% Dental Clinic 0 0.0% Nursing Home 2 0.6% Extended Care Facility 0 0.0% Industrial Nurse 1 0.3% School Nurse 3 0.8% Not Currently Practicing Nursing 1 0.3% Other % Total % Respondents were then asked how often they interacted with non-english speaking patients percent of respondents indicated they interact with non-english speaking patients at least weekly, with 42.5 percent indicating that interaction was, at least, on a daily basis. Table 22 shows the full distribution, while Table 23 shows the cross tabulation of the interaction of nurses with non-english speaking patients by nurse licensure (the percentage totals do not match because respondents had to have answered both questions in order to be included in the cross tabulation). As can be seen, LPNs report slightly more frequent interaction with non-english patients (88.9 percent report at least weekly interaction with 55.6 percent reporting at least daily interaction) than RNs (72.4 percent report at least weekly interaction with 39.6 reporting at least daily interaction). Table 22: How often do you interact with non-english speaking patients? How Often Count Percent of Total Every Hour % Daily % Weekly % Monthly % Seldom/Never % Total % Table 23: Nurse Interaction with non-english Speaking Patients by Licensure APN RN LPN CNA Total Every Hour 0.0% 5.5% 16.7% 0.0% 6.5% Daily 100.0% 34.1% 38.9% 33.3% 35.5% Weekly 0.0% 32.8% 33.3% 33.3% 32.4% Monthly 0.0% 18.2% 5.6% 33.3% 16.8% Seldom/Never 0.0% 9.4% 5.6% 0.0% 8.8% 17
24 Nurses were then queried about interactions between non-bilingual nurses and non- English speaking patients. Table 24 shows how often communications were completed via bilingual clinical and non-clinical staff members (not nurses), and via adult and minor relatives of the patient. The sample of nurses reported that bilingual adult relatives of patients were most likely to be the communication conduit when bilingual nurses were unavailable to interact with non-english speaking patients. There was no statistical difference between the frequency of interaction via bilingual clinical and non-clinical staff members and by bilingual minor relatives of the patient. Table 24: When non-english speaking patients interact with non-bilingual nurses, what percentage of that time is used to convey healthcare information... How? Average Median Count By a Bilingual Clinical Staff Member? 38% 30% 312 By a Bilingual Non-Clinical Staff Member? 34% 20% 301 By a Bilingual Adult Relative of the Patient? 49% 40% 315 By a Bilingual Minor Relative of the Patient? 38% 40% 304 Tables 25 through 28 detail the respondent nurses perceptions of patient assessment quality, standard of care, record confidentiality, and facility efficiency when bilingual nurses are unavailable to interact with non-english speaking patients. These questions were identical to those in the hospital administrator survey and provide an interesting basis of comparison. Table 25 reports the results of the question about the nurse sample s perceptions of the impact on the quality of patient assessment when bilingual nurses are not available to interact with non-english speaking patients. A total of 79.7 percent of the nurse respondents reported a negative or strong negative effect on assessment. Hospital administrators reported negative or strong negative effects on assessment 88.0 percent of the time. Table 25: On average, when a bilingual nurse is not available, what effect is there on the quality of the assessment a nurse completes for that non-english speaking patient? Effect Count Percent of Total Strong Positive Effect on Assessment 8 2.3% Positive Effect on Assessment 9 2.6% No Effect on Assessment % Negative Effect on Assessment % Strong Negative Effect on Assessment % Total % Table 26 contains the results of the survey question designed to investigate the nurses perception of the impact the lack of a bilingual nurse has on a non-english speaking patient s standard of care. Of the nurse sample, 57.2 percent reported that there was a negative or strong negative effect on standard of care when a non-bilingual nurse interacted with a non-english speaking patient. An additional 37.1 percent of respondents indicated no effect on standard of care. The hospital administrators reported 18
25 perceptions of a negative or strong negative impact on standard of care 77.8 percent of the time. Table 26: On average, when a bilingual nurse is not available, what effect is there on the standard of care a non-english speaking patient receives? Effect Count Percent of Total Strong Positive Effect on Standard of Care 9 2.6% Positive Effect on Standard of Care % No Effect on Standard of Care % Negative Effect on Standard of Care % Strong Negative Effect on Standard of Care % Total % Record confidentiality was the next issue addressed in the survey instrument. As shown in Table 27, 51.3 percent of the nurses sampled reported a negative or strong negative effect on record confidentiality from non-bilingual nurse interactions with non-english speaking patients percent of nurse respondents reported no impact on record confidentiality. The corresponding statistics from the hospital administrator survey were: 44.4 percent reported negative or strong negative impact on record confidentiality and 44.4 percent reported no effect on record confidentiality. Table 27: On average, when a bilingual nurse is not available, what effect is there on the record confidentiality of non-english speaking patients? Effect Count Percent of Total Strong Positive Effect on Record Confidentiality 6 1.7% Positive Effect on Record Confidentiality % No Effect on Record Confidentiality % Negative Effect on Record Confidentiality % Strong Negative Effect on Record Confidentiality % Total % Table 28 shows the results of the query about perceptions of overall facility efficiency when bilingual nurses are unavailable to interact with non-english speaking patients. As is shown, 79.8 percent of the nurse sample reported they believe there is a negative or strong negative impact on facility efficiency. These results are the most markedly different from the hospital administrator survey. Only 30.0 percent of hospital administrators reported perceptions of negative or strong negative effects on the ability of the facility staff to serve each patient efficiently. 19
26 Table 28: On average, when a bilingual nurse is not available, what effect is there on facility efficiency (the ability of the facility staff to serve each patient efficiently)? Effect Count Percent of Total Strong Positive Effect on Efficiency 6 1.7% Positive Effect on Efficiency 9 2.6% No Effect on Efficiency % Negative Effect on Efficiency % Strong Negative Effect on Efficiency % Total % The next couple of questions investigate the self-reported oral and written second language capabilities of the nursing sample. Table 25 shows the results of the overall oral bilingual capabilities of the sample in terms of Spanish, Vietnamese, and Marshallese. For Spanish oral second language capabilities, 4.8 percent of the sample reported proficiency or fluency and 48.0 percent reported elementary skills percent of the sample reported no Spanish language capability. For Vietnamese and Marshallese, no survey respondents indicated having achieved either oral proficiency or fluency and 2.8 and 2.1 percents, respectively, indicated elementary oral skills. Table 29: What is your oral second language capability? Oral Second Language Capability Spanish Vietnamese Marshallese None 47.1% 97.2% 97.9% Elementary 48.0% 2.8% 2.1% Proficient 2.7% 0.0% 0.0% Fluent 2.1% 0.0% 0.0% Count In addition to the oral second language capabilities described in the table above, two respondents indicated fluency in each of the following: French, Portuguese, and German. Individual respondents indicated fluency in Chinese, Polish, and American Sign Language. Two additional respondents indicated proficiency in French, and one respondent indicated elementary skills in Arabic. Table 30 displays the cross tabulation of oral Spanish capabilities with the distribution of nurse licensure of the survey respondents. Again, the total column does not match Table 29 because only respondents who answered both the licensure and the oral Spanish capability questions are included. As is shown, RNs are more likely to have elementary capabilities than LPNs, but there is no statistical difference in reported Spanish proficiency and fluency between the two groups. Table 30: Oral Spanish capability by licensure Oral Spanish Capability APN RN LPN CNA Total None 20.0% 46.7% 56.3% 66.7% 47.4% Elementary 60.0% 48.8% 37.5% 0.0% 47.4% Proficient 0.0% 2.8% 0.0% 33.3% 2.7% Fluent 20.0% 1.7% 6.3% 0.0% 2.4% 20
27 Table 31 presents the written or reading second language capabilities for the sample in terms of Spanish, Vietnamese, and Marshallese. As is shown, 5.1 percent of the sample indicated either proficiency or fluency in Spanish, while 33.1 percent indicated elementary Spanish skills percent of the sample indicated no Vietnamese written or reading language capability and 98.6 percent indicated no Marshallese written or reading capability. Again, the results indicated that there were no Vietnamese or Marshallese proficient or fluent nurses in the sample. Table 31: What is your written or reading second language capability? Written or Reading Second Language Capability Spanish Vietnamese Marshallese None 61.7% 99.3% 98.6% Elementary 33.1% 0.7% 1.4% Proficient 3.9% 0.0% 0.0% Fluent 1.2% 0.0% 0.0% Count In addition to the written or reading second language capabilities indicated in the above table, two respondents indicated fluency in French, Portuguese, and German. One respondent indicated fluency in Chinese. Single respondents indicated proficiency in French and Polish. Table 32 presents the results of the nurse sample s perceptions about how often telephone translation services are used. A total of 26.1 percent of respondents indicated that telephone translators are used at least daily. This compares to the percent of the hospital administrators who indicated that telephone translators were used at least daily. Table 32: How often are telephone translators used in your facility? How Often? Count Percent of Total Every Hour 9 2.6% Daily % Weekly % Monthly % Seldom/Never % Total % The final three questions of the nurse survey instrument queried the nurses about their interest in, the convenience of, and their motivation to take Spanish language courses in medical terms and conversation. Table 33 shows the results of the nurse sample s selfreported level of interest in taking a Spanish language course. Of the respondents, 86.0 percent indicated at least some interest, with 58.9 percent of the respondents indicating that they were very interested in such an opportunity. 21
28 Table 33: How interested would you be in taking a Spanish language course in medical terms and conversational style? Interest Level Count Percent of Total Very Interested % Slightly Interested % Not Interested % Total % Once interest was ascertained, the next question asked about the most convenient time for Spanish medical conversational classes to be offered. The nurses responses varied widely, with the most popular option being weekday mornings from 10am to 12pm, as shown in Table 34. Among those who had indicated being very interested in Spanish language courses in the previous question, the preferences were even more disparate, but the weekday morning 10am to 12pm time slot was still reported the most preferred. Table 34: If a Spanish language medical conversation course were available, which time format would you prefer? Which Time Format? Count Percent of Total Very Interested Count Percent of Total Weekday Mornings from 10 AM to 12 PM % % Weekday Afternoons from 3 to 5 PM % % Weekday Evenings from 5 to 7 PM % % Weekday Evenings from 7 to 9 PM % % Saturday Mornings from 10 AM to 12 PM % % Saturday Afternoons from 3 to 5 PM 9 2.9% 6 2.9% Total % % Finally, the nurse survey respondents were asked what would most motivate them to take a Spanish language medical conversation course. As is shown in Table 35, personal growth was reported as the most popular option (29.9 percent of respondents), followed closely by paid tuition (29.0 percent of respondents). Table 35: Which option would most motivate you to take a Spanish language medical conversation course? Option Count Percent of Total Personal Growth % Continuing Education Credit % Paid Tuition % Stipend for Course Completion % Total % Like the hospital administrators, the nurses who completed their survey instrument were given the opportunity to make any comments they wanted about the bilingual nursing 22
29 situation in Northwest Arkansas. These comments are reported (with spelling, but no grammar correction) below in Table 36. Many of the nurse respondents took the time to share their opinions. Those opinions fell into two broad categories: those who believed having nursing staff with the ability to translate was imperative and that patient care suffered when it was not available, and those who believed that communicating in English should be the responsibility of the patient, rather than having facilities make accommodations. Table 36: Are there any other observations or comments you would like to share with the Center for Business and Economic Research and the Nursing Education Consortium regarding the bilingual nursing situation in Northwest Arkansas? Comments We have had only two referrals for bilingual or different speaking individuals in the ten plus years I have worked for this facility. We have people from the community, churches, hospital, and some staff. 1) Have a person on staff, somewhere who can translate or 2) Promote English speaking classes in the community 1) I have yet to encounter a time when I could not adequately communicate with my patient to give appropriate nsg. care. 2) We do need more help in bilingual nsg. staff to help communication with patient. 1) If you cannot speak the language, then you should learn! 2) It is neither pragmatic nor realistic to place this language burden on nurses (who are already overburdened! 3) Patients who speak only Spanish should provide a translator (family or friend) 4) "Red Phones"-translation services are too backlogged to be practical...????one must schedule an appointment with an all-too-scarce translator, which may lead to a 90 minute wait (not the thing to do in an instance of, say, acute chest pain) -Forget this idea altogether unless it can be made real time asap A free class would be beneficial. A need for nurses to be bilingual is evident in this area, but educating nurses to be bilingual should not excuse the non-english speaking community from their responsibility to learn and be able to communicate in English. An option of an online course for those of us in management that have unpredictable hours. Answer to number 15 is all the above also start offering English classes along with citizenship applications Answer to question number 15 is all the above. All people should document whether they are here legally, if not then they should be required to register at that point for entry into the U.S. and make them eligible to receive Medicaid benefits or file for SS As a proficient bilingual Spanish interpreter to educate pts on home care instructions and well any kind of instructions takes a lot of time. Non bilingual staff don't understand that you have to take more time with these pts. Dictionary would be helpful English should be the required language for the USA and citizenship 23
30 Comments Have a translator available when situations arise-time consuming to everyone. Spanish when the need for it is not that great. Hospitals in this area need to have access to a translator on staff or "in house" 24 hours a day Hospitals should be required to have bilingual staff available to interpret for nurses & doctors-24 hours/round the clock. ER's should have at least one nurse on for each shift that can speak SPANISH I actually believe that bilingual nurses should not be used because maybe if there were no one able to speak their language they would finally take the time to learn ours. The burden should be taken off of us and put back on them where it belongs. I already speak Spanish-I don't understand what to do in number 11 I am assuming #11 refers to my own capabilities, not to my clinic as a whole. We have a bilingual receptionist and 1 bilingual nurse. Many patients EXPECT us to utilize them in communicating. There are times when both are unavailable. I am new to this area but I am proficient in both oral and written Spanish. I have a BA in Spanish and have taught Spanish for Nursing through Command Spanish, Inc. I currently am taking my students to a LTAC facility. I believe that appreciation and compensation should be offered by our employer. I believe that some of us that are being used to translate for patients should be compensated, such as with more pay. I believe your survey is addressing an important issue in regards to nursing care vs. being bilingual. Although on some your questions, I feel your choices should have had the option of one or more choices to choose from. I do not think the Spanish speaking community gets the same pt/nurse interaction time as those who speak English I don't believe it is our responsibility to Spanish. Most of these people are in our country illegally. We are already paying for the health care of most of these patients and the children they deliver. Our national language should be English and patients should be required to bring a translator. I feel it is the lack of practice opportunities that limits my use of Spanish. An initial course would be wonderful, but without practice, my language skills will be quickly lost. I feel it would benefit our facility if we hired some "on facility" interpreters that all departments could call on and use when needed. This would cut down on having to "borrow" Spanish speaking staff from other floors in the hospital who usually are not nurses, but dietary, secretaries, or techs. This would make more sense than having all the nurses take classes. I feel that money barriers to entering Bilingual (especially native speaking) nurses are in place. Money-wage based education-knowing about program, availability of ESL geared toward the native speaker wanting to go into 24
31 Comments medical/nursing field. I have lived in several non-english speaking countries. I learned to speak their language in order to communicate. Not once did the other country attempt to accommodate my language. Put your efforts into teaching English to persons coming to live in this country. I have taken a course for my personal growth but I am still not proficient in Spanish. I know it is a need. I have tried to do it.-take Spanish, but I can't. I can get the language well enough to understand their conversation no matter how simple, its their slang -not all of them talk the same. I personally do not think that the nurse should be forced to take a Spanish or any other language course. I strongly feel that if non-english people want to come to our hospital then they should be required to provide a translator at their own convenience I previously worked at WRMC here in Fayetteville and frequently had Spanish speaking patients. I learned enough (on my own through self study) to communicate the essentials but it would have been helpful to have someone on staff there that was bilingual. I really don't feel like I could answer these questions very well, as I am not working in a hospital on a regular basis. Some questions I could not answer at all. I should not have to learn a second language while living in my native country. If a person can not speak the native language of the country they are in they should be required to provide their own translator, not the hospital providing for them. If I was to visit another country, I would be expected to either know their language or to have my own translator. Why is this country so different? I strongly believe that we need to offer English as a second language regularly in all communities, as well as offering Spanish as a second language regularly in the community. I think the difficulties and barriers cross the cultures both ways. I think the Hospital should pay for the Spanish language class, they are the one who will most benefit. The nurses will be doing it for the hospital. I understand this is a critical issue and the most expedient solution is to educate the healthcare workers. However, as a secondary goal, the community and national leaders need to make it known to the non-english speaking people that it is their responsibility. I work as Don of Geriatric Psych unit, and in 4 years have had 1 non-english speaking person If classes were held and paid for many would get involved. Medical conversational Spanish would better help our customers In our department, we have all discharge instructions and most teaching information available in Spanish. My most difficult problem is unable to have question/answer time with patient due to language barrier if no 25
32 Comments translator available. In question #15, all of the answers would motivate me to take the course. I feel that my knowledge really lies somewhere between ''elementary'' and '' proficient'', although closer to elementary. I have personally studied anatomy charts in Spanish. Is there a program to motivate the Spanish speaking to learn English to make their stay more enjoyable and proficient?? It is a very frightening liability issue to care for a non-english speaking patient. We also get very concerned because we are often not able to get a complete history or give thorough education. This is a dangerous situation for the patient and facility. It is extremely difficult to care properly for a patient when they cannot speak English It is somewhat better now than 5 years ago. It is very challenging especially in emergency situations. It is very hard for a non clinical interpreter to know and explain medical facts and conditions. I have found that the nurses tend to spend less time with the Spanish speaking patients and their parents. less attention is given to non English speaking patients, mostly because they do not ask for assistance'' Make English the requirement for those entering the US, not Americans increasing time away from their own families to accommodate them. Need a separate hourly rate given to bilingual RN's Negative effect- for answers are a bit strong. When assessing a patient their history is an essential component of the assessment ~ along with the remainder of the questions. For my response- Negative effect suggests that the care was not optimal. Neither English speaking or Spanish speaking individuals sustain or obtain enough in areas I have work to get or keep anything but minimal communication for medical treatment (i.e. in some interaction there is a fullback to "I don't understand: in two ways 1) there is true misunderstanding and 20 there is a I don't want to accept what is presented so I don't understand can be a blocker or a way out of communication 30 You can take this as a bilingual prejudice but in this date and time it exists-many medical and personal interaction are culturally too uncomfortable on perceived differently to have the openness needed even with language less of a barrier. Is there a need for bilingual now-when that 9mo. plus lady comes in fully ready to give birth, you or anyone could wish she had learned English and Spanish at least before that last hour! I am told to answer yes or no..yes, yes, yes!!! New immigrants should be encouraged to learn the principle language of the country they are migrating to. Non English speaking pt. need to bring an interpreter to stay with them or learn English. 26
33 Comments Patients need someone fluent in their language to be able to communicate needs in the medical area. This should be a standard of care. Pay for class per week/compensate with salary-like CPR or ACIS or any other required education. Phone is not effective when discussing female teaching care or breast feeding when interpreter is male-most don't like to discuss these issues by phone Please consider funding Spanish courses for non-bilingual nurses. It would help provide better care for non-bilingual patients. Please consider making classes available in Benton County or centrally located so that nurses living in Benton County could minimize travel. Question #11 is confusing. I assume it is asking my personal fluency, not my department/hospital. Question #3 not answered, I'm a LPN. I obtained my license through a Vocational School, not considered a degree. Spanish lessons are very needed here at St. Mary's. Thank you for your invitation to participate in this survey. This is a very needed area of concern for myself as I am almost daily faced with non - English clients. I have an elementary knowledge of Spanish and would very much like to learn more. thanks Thanks for their assistance, it is greatly appreciated. The efficiency of care is equal for ALL patients regardless of color, age, and status. The language barrier is a huge inconvenience for all. It is somewhat disturbing to some people because they feel forced to learn Spanish. The hospital needs to have 3-4 employees on call at all times including night and weekends. These employees should have some medical experience/medical terminology. The translation phone is not the easiest to use - its difficult to hear. The percentage of Spanish/Marshallese speaking patients in our agency has increased dramatically in the past 5 years. I am glad to see the NEC addressing this issue. I would like to be kept updated on the progress of this study and see the results. The problem with having a class is that there always needs to be a proficient Spanish speaking or other foreign language speaking person as things can really get messed up. This definitely impacts pt care. The class is not the whole fix to the problem. The Red Phones are better than nothing, but just barely. In our department, many times, we have a male interpreter discussing very personal information with a female, which is culturally inappropriate. Also, the patients seem very uncomfortable using the red phones and are hesitant to ask questions to clarify information. Also-Bilingual staff members should receive monetary incentive, much like critical care pay or certification pay-maybe not as much as the others, but something to acknowledge their value in providing care to the non-english speaking patients. 27
34 Comments There are a few of us who are trying to take courses offered by NWACC. But being a small clinic, only a couple can do this. I would very much like to learn for my personal and professional growth. As well as for the positive effect that it would have. There are so many non-english speaking patients where I work and it hinders the care they receive. It also hinders the care of the other patients because our phone translators do not understand medical terminology. There is a great need for bilingual nurses. These times are not remotely applicable to 120 shift workers. Maybe 1-2 Day week classes that are 3-4 in length This is America, they need to learn English before we even think about learning their language. If these patients are in this country illegally, why are we submitting to their ways. This is greatly needed!!! This is the worst survey I have ever done. If there is a language barrier, of course there will be a lack in care. However, this is America and we speak English. Please stop contributing to the downfall of our great country. Those Bilingual Nurses we currently have should complete some form of certification for their skills and then receive a pay differential because we call on them all the time to interpret for us/doctors, etc. To be added to survey:#1. My county of residence: Newton#2. I will soon graduate as RN in December '06 and take NCLEX in January '07.#3. Will have an associate degree as an RN, but already have BA, MA and ABD PhD in Spanish Lang. and Lit., Anthropology. To become clinically competent in a language is much easier than being conversationally competent in the language. Too subjective!!! Too subjective. I have traveled all over the world. No other country accommodates me. I learned their language to assist my communications. Very Subjective. We all recognize that there is a vast shortage of proficient bi-lingual nursing staff in NW Arkansas. We have got to be able to offer more help/assistance to the Hispanic community to not only commence but more importantly complete the nursing course. We daily do an injustice to our non-english speaking patients. I feel that the hospital should provide an on-staff interpreter to be utilized by staff for all medical needs. This is such a huge need in this community. We have a serious need for more Marshallese translators, a Marshallese language for HCW course and basic pt ed materials in Marshallese. I personally think that all nursing curriculums should require a Spanish medical terms course. We have several trained in-house interpreters which has made it easier to communicate recently. We need help with this situation, badly 28
35 Comments we need to know Spanish We take care of unconscious people and people on ventilators and give great care. It is good to have bilingual individuals around, but it is not absolutely necessary. We use our Hispanic Housekeepers for interpreters-which only works if they have enough English-but they can be very helpful at times-usually there is a pts' family member who speaks English-though they are not always available. We use the red phone a lot however some patients seem to be intimidated by this We work very hard to take care of our non- speaking patients the same way that we would take care of our English speaking patients. Communication between both parties is very important to us and the care that we give is consistent with every patient we care for. What about a hybrid type course that enables the learner to do some work on-line and through watching lessons on a DVD, and then going to class prepared to discuss and validate competency of the lessons that are completed on their own. When Do We Start? When I first started 3 years ago, we saw non-english speaking patients once every couple of months, now we have non-english speaking patients weekly. When people come to live in America, an attempt should be made to learn the language. While caring for non-english speaking patients is stressful and I feel concerned when unable to communicate efficiently with them, I must admit I am not overly motivated to learn a foreign language when I repeatedly deal with individuals that immigrate to this country by choice and by choice make little or no effort to learn the language here. It is one thing to help individuals that make a sincere effort to help themselves, it is quite another to be put in a situation where I am made to feel responsible for accommodating another's poor choices Why is this happening? Why don't we require the Hispanic Population to assimilate as all other immigrants have? What's the deal here? Why not offer English speaking lessons to the Hispanic Population. We are an English speaking nation. You might be interested in the overall nursing shortage data as well as the bilingual experience. As you are well aware, the average age in the profession is well over 40 and the average age for nursing professors is higher than that. 29
36 Patient Survey Description The third piece of this study involved surveying non-english speaking patients in Northwest Arkansas hospitals to ascertain how having or not having access to bilingual nursing staff impacted the quality of their care. In consultation with hospital administrators, the survey instrument went through a large number of revisions. Universally, hospital administrators had two concerns about querying patients concerning the quality of their care. The patient burden of answering questions should be minimized, as people come to the hospital because they are sick. Survey questions that implied patients might receive differential care or that medical information and advice were not sufficiently communicated raise significant legal liability for the hospitals and would not be allowed. The final survey instrument (found in both English and Spanish forms in the Appendix) was designed to address both of these issues, to determine whether the patient had interactions with bilingual nursing staff, and to quantify their perceptions about the value of bilingual nursing staff. A methodology was developed where nurse supervisors would identify (likely) Hispanic, non-english speaking patients and bilingual nursing students (from Northwest Arkansas Community College, NTI, and the University of Arkansas) who have received scholarships from the Nursing Education Consortium would administer a short survey to the patients on days when the students were doing their clinical work. The month of February was chosen for the survey period. Administrators from five out of the six hospitals in Northwest Arkansas agreed to host the survey in one way or another. In some cases, patients from emergency rooms were included, and in others, only admitted patients were surveyed. In no case were patients in Intensive Care situations made available for the survey. The bilingual nursing students administered the survey to 15 patients at the various hospitals. Results Table 37 shows the gender breakdown of the respondents. Two-thirds of the respondents were female and one-third were male. Table 37: What is the patient's gender? Gender Count Percent of Total Female % Male % On average, the patient respondents indicated being born in Table 38 shows the breakdown of respondents by decade of birth. When the patient was a minor, the survey respondent was the adult parent. 30
37 Table 38: In what year were you born? Year Range Count Percent of Total % % % % % Each of the 15 survey respondents self-identified as being of Hispanic ethnicity as is shown in Table 39. Table 39: Please describe your ethnicity. Ethnicity Count Percent of Total Hispanic % Non-Hispanic 0 0.0% Table 40 contains a summary of the reported reasons for the patients being in the hospital. A total of 60.0 percent of the respondents indicated that they were in the hospital for emergency treatment, while 20.0 percent each indicated surgery and inpatient treatment as the reason for their hospital visit. Table 40: Why were you in the hospital? Reason Count Percent of Total Outpatient Treatment 0 0.0% Surgery % Emergency Service % Maternity 0 0.0% Inpatient Treatment % The breakdown of reported country of origin for the non-english speaking patients is found in Table 41. The respondents were split with 60.0 percent coming from Mexico and 40.0 percent coming from El Salvador. Table 41: What is your country (continent) of origin? Country of Origin Count Percent of Total United States 0 0.0% Mexico % Central America (El Salvador) % Europe 0 0.0% Asia 0 0.0% Other 0 0.0% Table 42 shows the distribution of the respondents reported ability to understand medical instructions in English. A little more than half of the patients (53.3 percent) indicated no ability to understand English medical instructions, while the remainder identified their ability as limited. 31
38 Table 42: Which describes your ability to understand medical instructions in English? Ability to Understand Medical Directions in English Count Percent of Total Completely Able 0 0.0% Limitedly Able % Unable % The interactions between non-english speaking patients and bilingual nurses, as reported by the respondents, are detailed in Table percent of the patients indicated some interaction with Spanish speaking nursing staff. The remaining 80 percent did not interact with bilingual nurses. Table 43: Did nursing staff that treated you speak Spanish? Did Nursing Staff Speak Spanish? Count Percent of Total Yes % No % Table 44 describes the reported methods for communicating medical information that the non-english speaking patients experienced. Having a hospital translator was the most common way, but written instructions, telephone translation services, using bilingual friends and family members, as well as receiving no Spanish communication at all were also noted. Table 44: Which answers best describe how you received medical information? Method Count Percent of Total Written Form % Telephone Translator % Hospital Translator % Family Member or Friend % Other (Non Clinical Staff) 1 5.9% Other (Own Limited English) % Table 45 quantifies the results of the query to the non-english speaking patients about what form of communication is most beneficial to them percent indicated that having a hospital translator available was the most beneficial form of communication, as compared to written information, a telephone translator, or a bilingual family member or friend. Table 45: Of all of these forms of communication, which was the most beneficial to you? Method Count Percent of Total Written Form 1 7.1% Telephone Translator 0 0.0% Hospital Translator % Family Member or Friend 1 7.1% Other 0 0.0% 32
39 Finally, Table 46 indicates the perceptions of the non-english speaking patients as to how bilingual nursing staff would have been beneficial. Several respondents chose an all of the above answer, so the response counts are higher than 15. Overall, respondents were most likely to say that one possible benefit of having a bilingual nurse would have been more timely answers to any questions they may have. Table 46: I would consider bilingual nursing staff to be a benefit because: Why? Count Percent of Total It Would Ease Anxiety, Frustration and Concerns % It Would Provide Timelier Answers to Questions % It Would Create More Trust % Other 0 0.0% As with the hospital administrator and nurse surveys, the non-english speaking patients were provided with an open-ended question soliciting any comments that they may have about bilingual nurses. Every comment reiterated the demand of the patient sample for bilingual nursing services to help with communication. Table 47: Are there other comments you would like to make for this survey? Comments (As Interpreted by Interviewer) It would really help to have bilingual nurses because of the fact that there are people that don't speak English and can't understand the nurses and doctors. This makes it more confusing Yes, I think that having an interpreter or bilingual nurse helps because sometimes my family members are too busy to be coming to the hospital to be with me and interpret. A translator would have allowed better communication of symptoms and better treatment. It would have been better to have nurses that speak Spanish. I needed a lot of help because I don't understand English. It is very important to have bilingual nurses That they hire this interviewer to provide nurses that speak Spanish. That the hospital help and open a school for nurses that speak Spanish. Would be appropriate if I could communicate in my own language concerning my health status If someone speaks Spanish it is better for him. Conclusions This study reports the results of surveys administered to three distinct populations: hospital administrators, nurses, and patients. Each group was surveyed to ascertain information concerning both the status and impact of the bilingual nursing population in Northwest Arkansas. When the results of this report are combined with the projections of growth in the Hispanic population in Northwest Arkansas and in the incidence of 33
40 Hispanic nurses, some aspects of the demand for and supply of bilingual nurses can be described. Demand for Bilingual Nurses in Northwest Arkansas In the CBER s 2004 report entitled Nursing Workforce Shortage and Diversity Disparity in Northwest Arkansas, a set of projections were made about the growth of the overall population of the region. In that report, it was projected that the proportion of Hispanics will go from accounting for 9.5 percent of the population in 2005 to 16.0 percent of the population in As noted in that report, It is difficult to define which segment of the population is bilingual. It is almost certain all first generation immigrants speak their own language, but not necessarily true that they are fluent in the language of their adopted country. According to the 2000 Census, people who spoke a language other than English at home accounted for 10.4 percent of the population in the Fayetteville-Springdale-Rogers metropolitan area, and 5.7 percent of the population spoke English less than very well. People who specifically spoke Spanish at home accounted for 7.9 percent of the population in the Fayetteville-Springdale-Rogers metropolitan area, and 4.8 percent spoke English less than very well. Because of the relatively small population of Northwest Arkansas, the U.S. Census Bureau does not have updated annual estimates for people who speak languages other than English at home, but it is reasonable to assume that as the Spanish-speaking population increases as a percent of the population, so too will the proportion of people who speak English less than very well. The results of the surveys of hospital administrators and the nurses in Northwest Arkansas point to some of the reasons non-english speaking patients could be better served by bilingual nurses. A majority of respondents believe that there are negative impacts on several patient care quality measures when non-bilingual nurses interact with non-english speaking patients. In particular, patient assessment stands out as being perceived as adversely affected by both survey samples. Table 48: Comparison of Hospital Administrator and Nurse Perceptions of the Effect of non- Bilingual Nurse Interactions with non-english Speaking Patients Measure Percent of Hospital Administrators Reporting Negative or Strong Negative Effects Percent of Nurses Reporting Negative or Strong Negative Effects Patient Assessment 88.9% 79.7% Standard of Care 77.8% 57.2% Record Confidentiality 44.4% 51.3% Facility Efficiency 30.0% 79.8% According to the results of the non-english speaking patient survey, of all forms of communicating medical information, having hospital translators is most beneficial when compared to receiving medical information in a written form, via a telephone translator, 34
41 or through the interpretation of a friend or family member. In particular, the survey respondents indicated that the primary benefit would be the ability to get timely answers to questions that they may have. Supply of Bilingual Nurses in Northwest Arkansas This study identifies the supply of bilingual nurses in Northwest Arkansas, both quantitatively and qualitatively. Within the six hospitals in Benton and Washington Counties, administrators report that of the 1,497 nursing staff members, 3.5 percent have bilingual capabilities. When queried about their own bilingual skills, 4.5 percent of the sampled RNs indicated they have proficient or fluent oral Spanish skills and 6.7 percent of the sampled LPNs indicated they have proficient or fluent oral Spanish skills. Moreover, an additional 48.8 percent of RNs and 37.5 percent of LPNs indicated they have elementary oral Spanish skills. This implies that there is a basis to build upon beyond Hispanic nurses in terms of improving the Spanish fluency of the overall nursing population. The results of this study were not as promising in terms of increasing the Vietnamese, Marshallese, and other second language skills of the Northwest Arkansas nursing population. Only 2.8 percent of the nurse respondents reported elementary oral Vietnamese skills and 2.1 percent of the nurse respondents reported elementary oral Marshallese skills. Because those languages are not taught in a substantial and organized way in the public schools and because the representation of these ethnicities is relatively small in the general, the nursing population has much less familiarity with the basics of the language. Efforts to recruit nurse trainees from these ethnic populations are probably more likely to be successful relative to training the existing nursing population in Marshallese and Vietnamese. 35

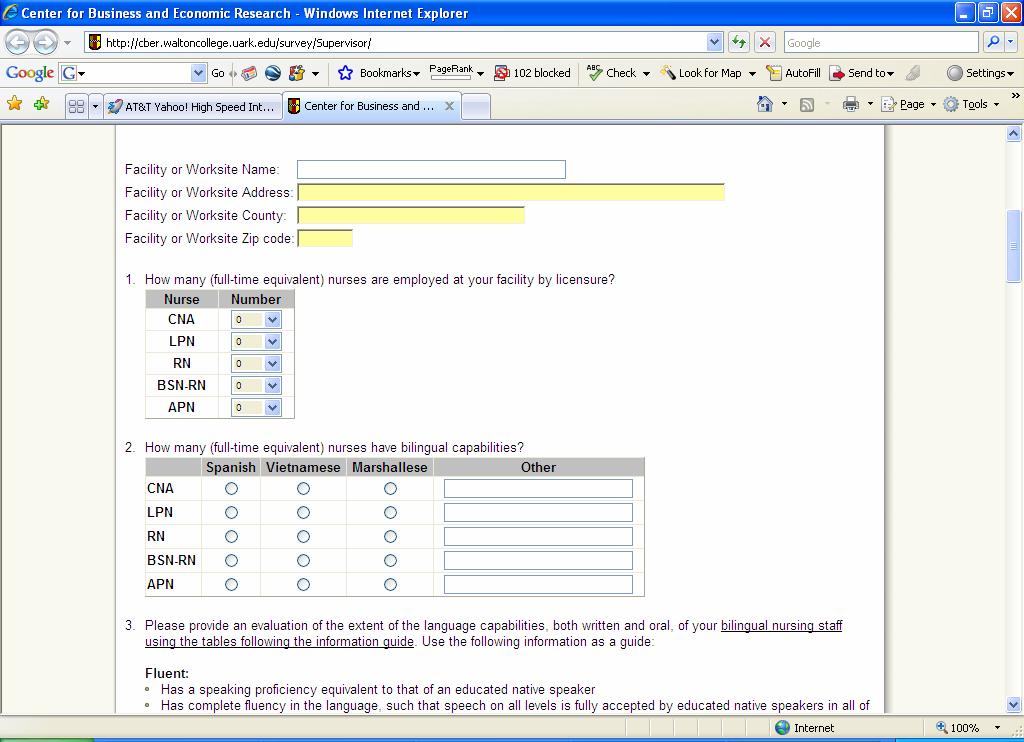
42 Appendix Hospital Administrator Survey 36
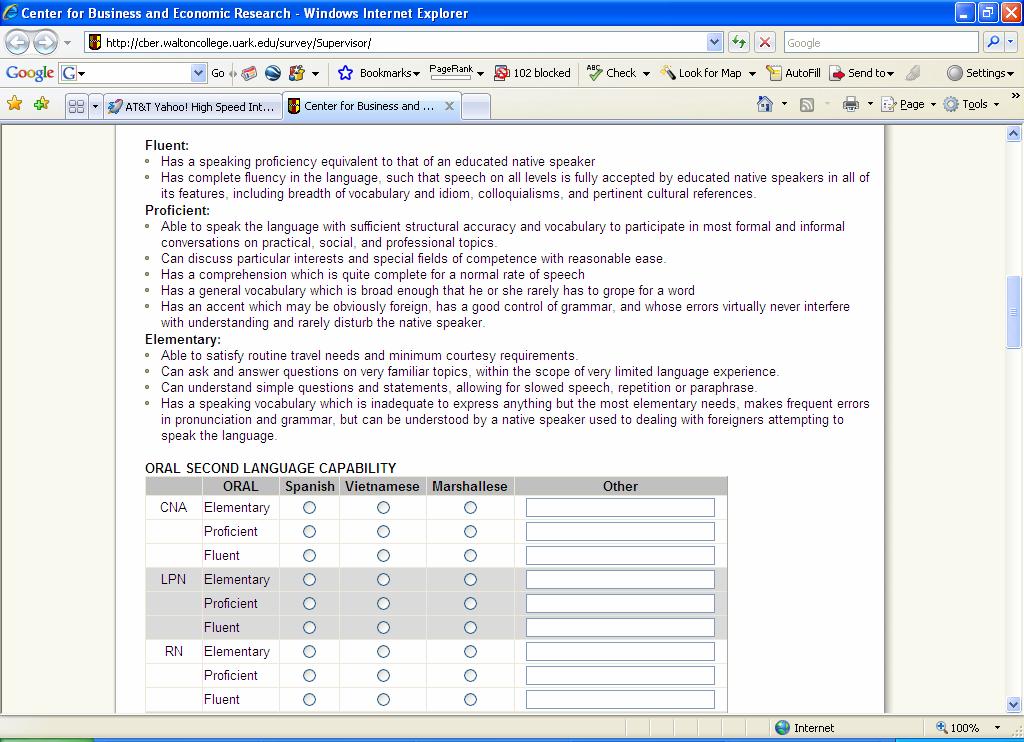
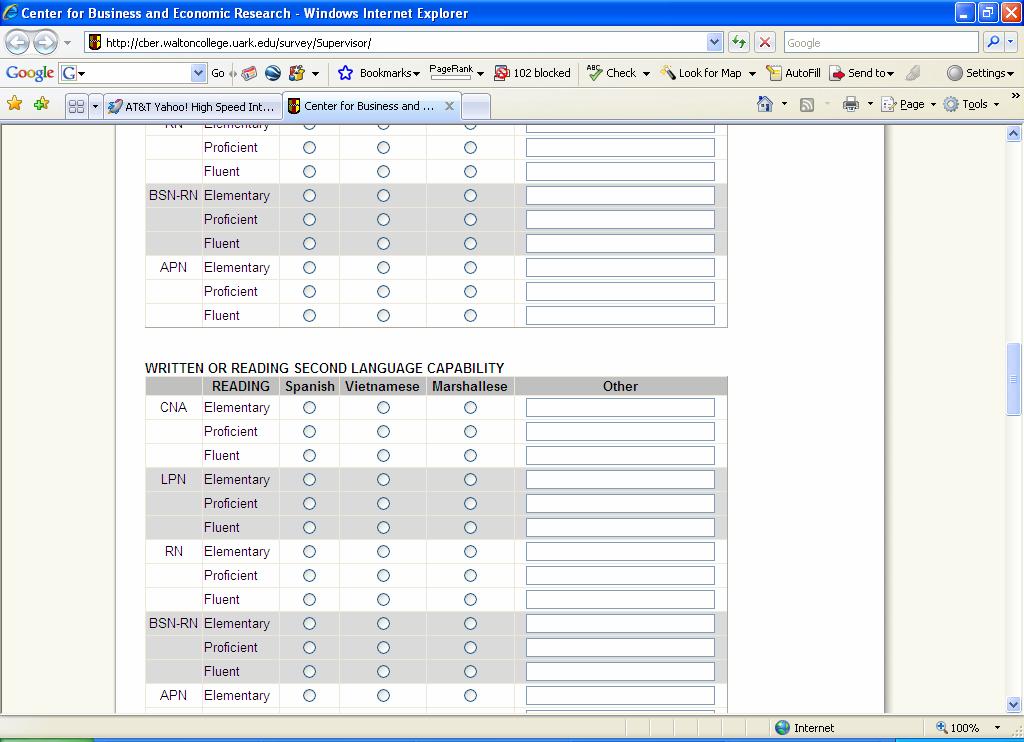
43 37
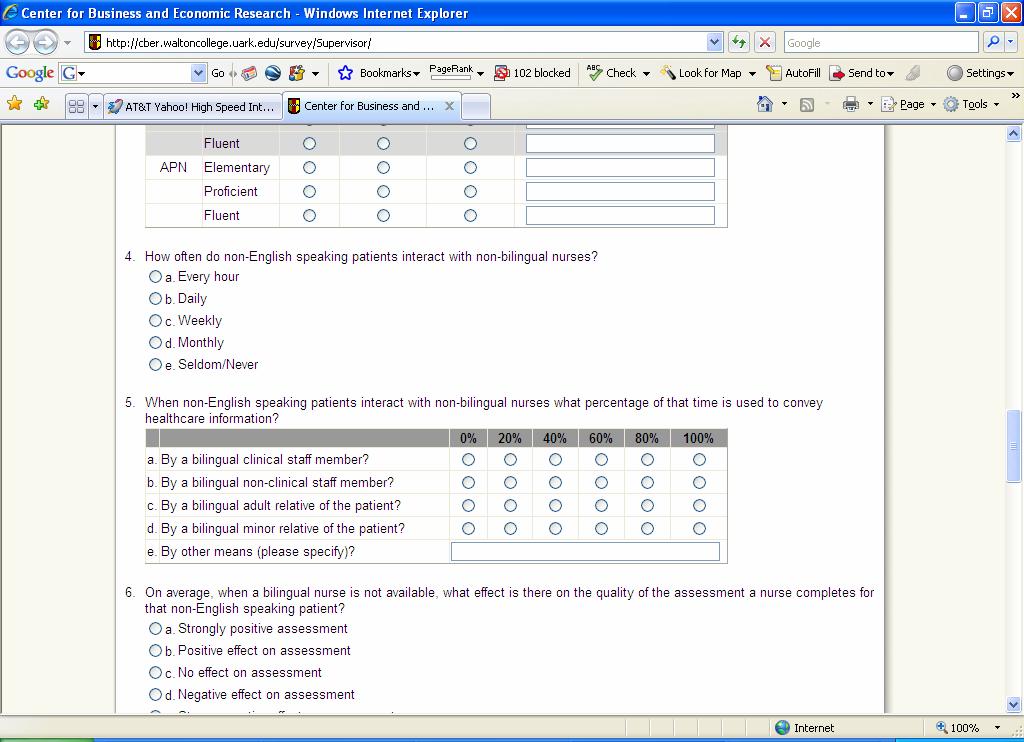
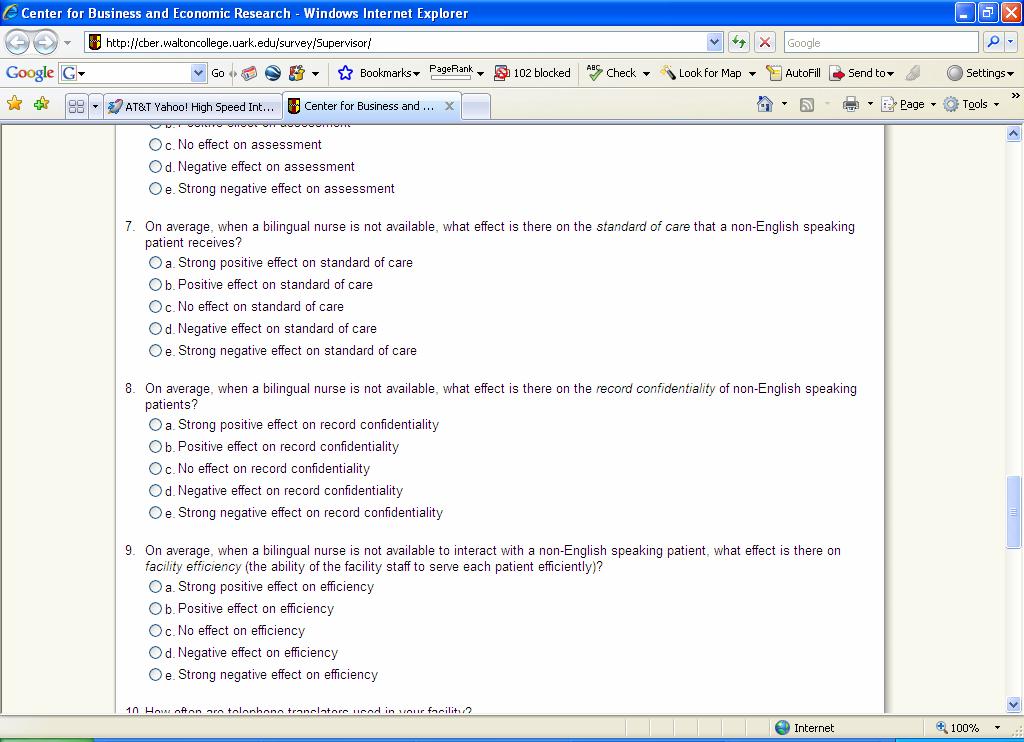
44 38
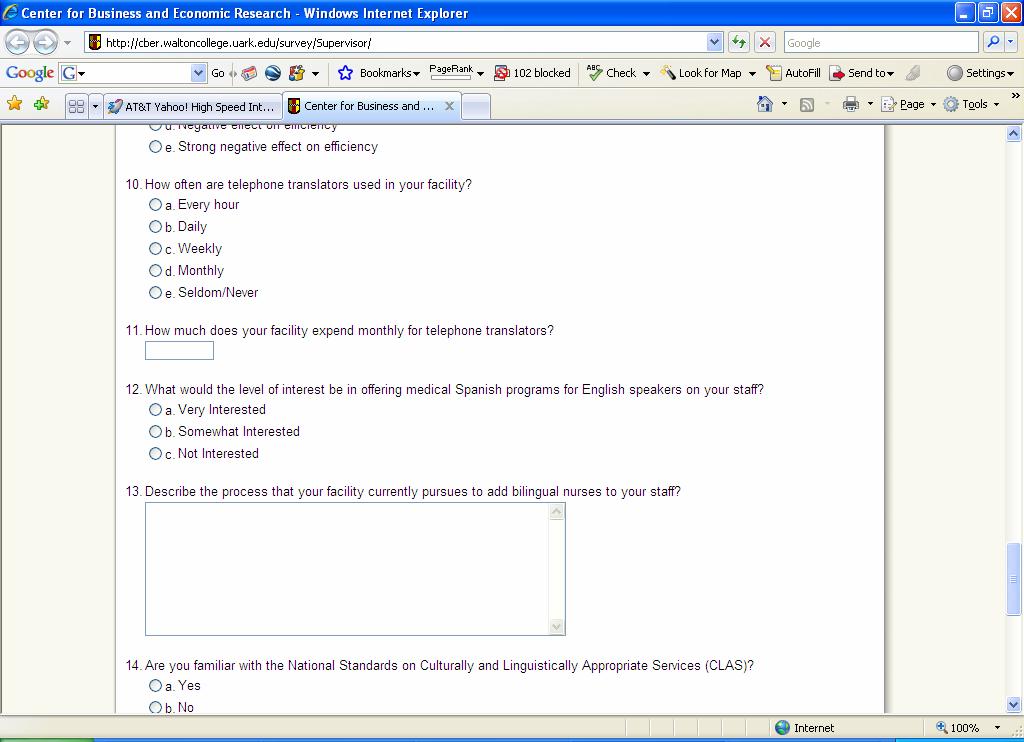
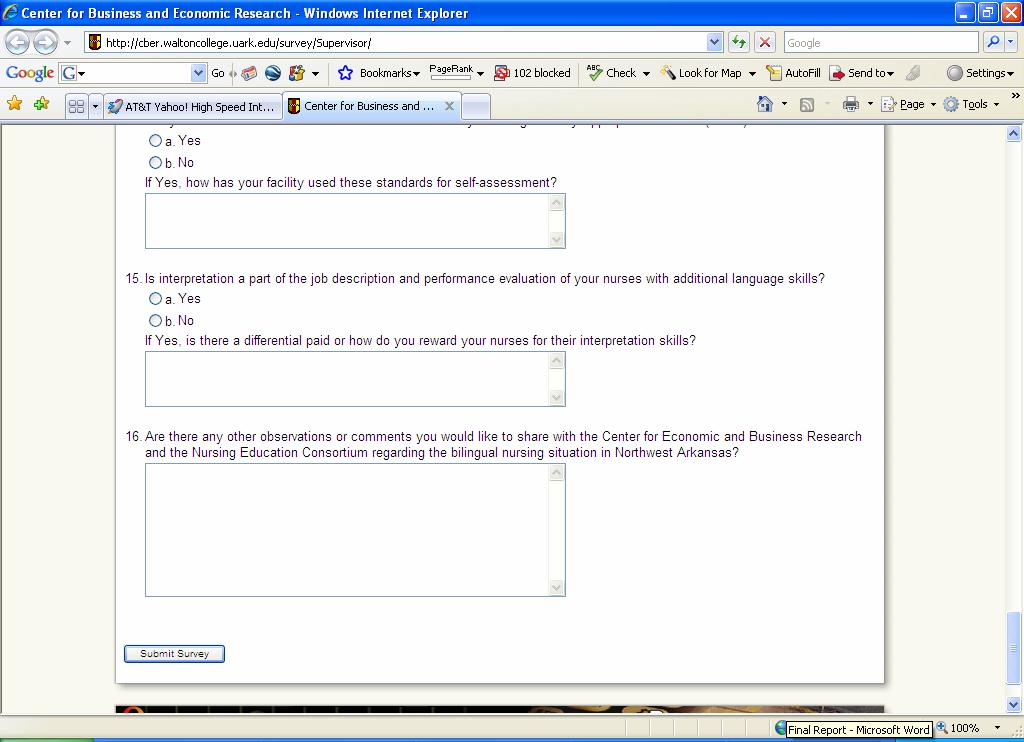
45 39

46 Nurse Survey 40
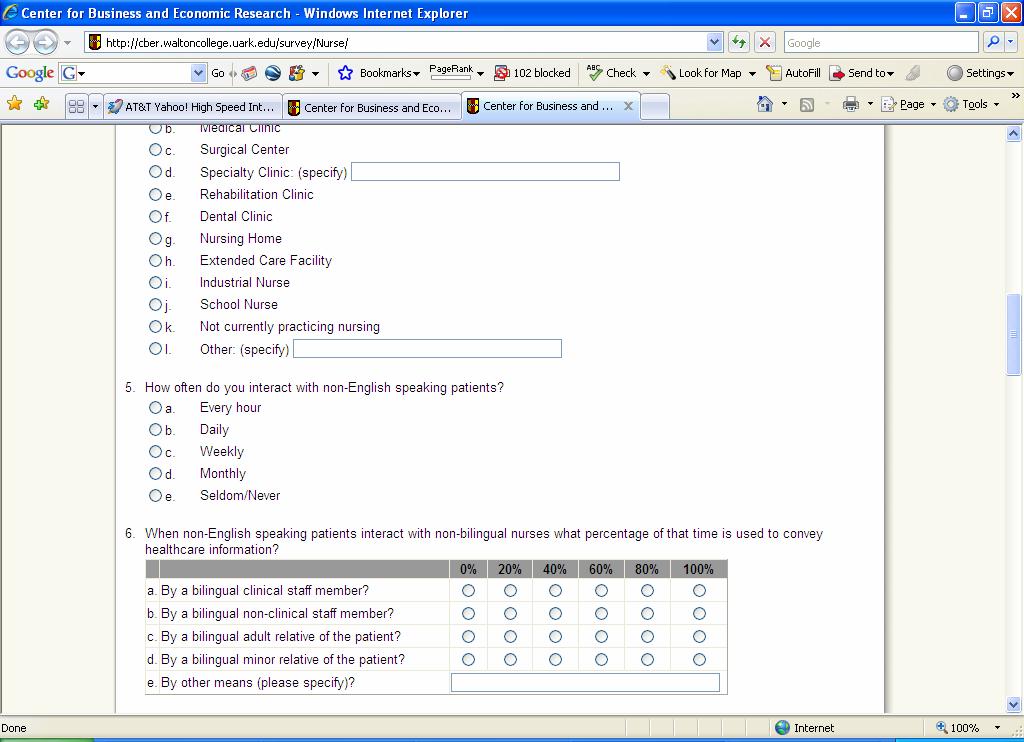

47 41
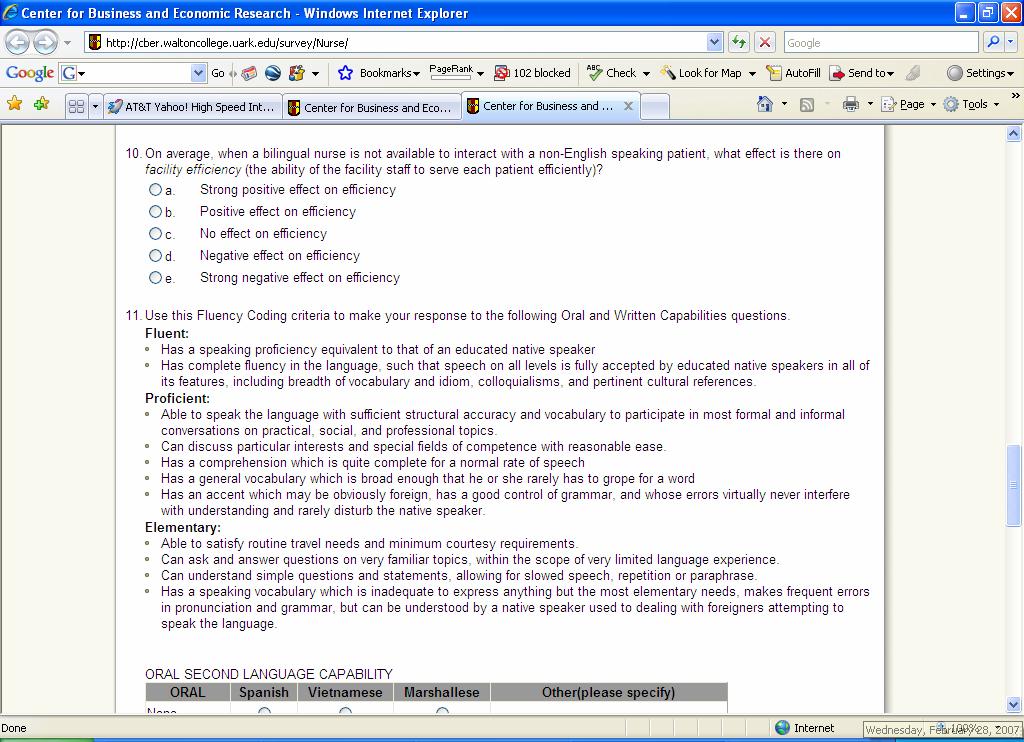
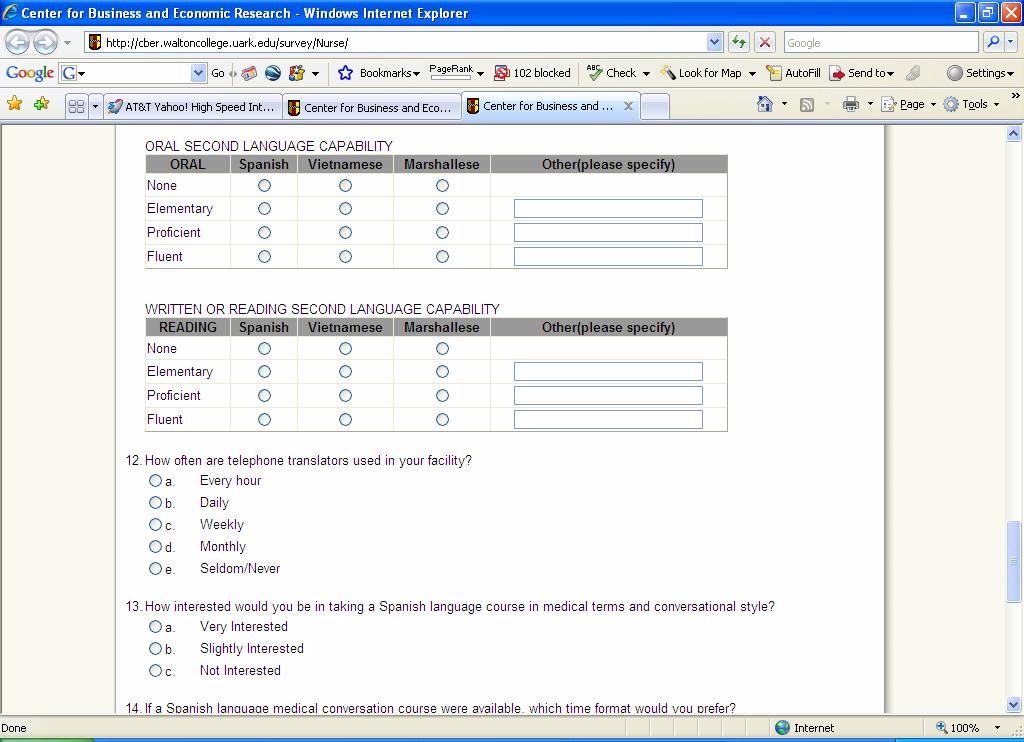
48 42
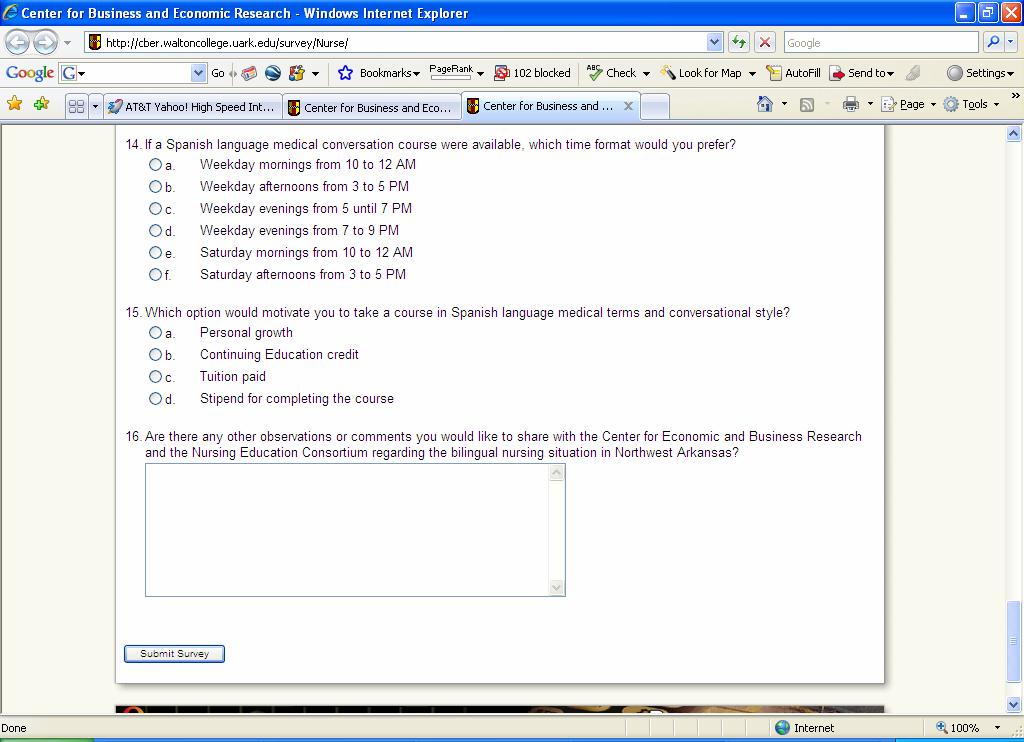
49 43
Research Brief IUPUI Staff Survey. June 2000 Indiana University-Purdue University Indianapolis Vol. 7, No. 1
 Research Brief 1999 IUPUI Staff Survey June 2000 Indiana University-Purdue University Indianapolis Vol. 7, No. 1 Introduction This edition of Research Brief summarizes the results of the second IUPUI Staff
2016 Survey of Michigan Nurses
 2016 Survey of Michigan Nurses Survey Summary Report November 15, 2016 Office of Nursing Policy Michigan Department of Health and Human Services Prepared by the Michigan Public Health Institute Table of
South Carolina Nursing Education Programs August, 2015 July 2016
 South Carolina Nursing Education Programs August, 2015 July 2016 Acknowledgments This document was produced by the South Carolina Office for Healthcare Workforce in the South Carolina Area Health Education
Overview of the Long-Term Care Health Workforce in Colorado
 Overview of the Long-Term Care Health Workforce in Colorado July 17, 2009 FOR MORE INFORMATION, PLEASE CONTACT: Amy Downs, MPP Director for Policy and Research Colorado Health Institute 303.831.4200 x221
Survey of Nurses 2015
 Survey of Nurses 2015 Prepared by Public Sector Consultants Inc. Lansing, Michigan www.pscinc.com There are an estimated... 104,351 &17,559 LPNs RNs onehundredfourteenthousdfourhundredtwentyregisterednursesactiveinmichigan
Cite as: LeVasseur, S.A. (2015) Nursing Education Programs Hawai i State Center for Nursing, University of Hawai i at Mānoa, Honolulu.
 Nursing Education Programs Hawai i State Center for Nursing, University of Hawai i at Mānoa, Honolulu.") Nursing Education Program Capacity 2012-2013 1 Written by: Dr. Sandra A. LeVasseur, PhD, RN Associate Director, Research Hawai i State Center for Nursing University of Hawai i at Mānoa, Honolulu, Hawai
Nursing Education Program Capacity 2012-2013 1 Written by: Dr. Sandra A. LeVasseur, PhD, RN Associate Director, Research Hawai i State Center for Nursing University of Hawai i at Mānoa, Honolulu, Hawai
Licensed Nurses in Florida: Trends and Longitudinal Analysis
 Licensed Nurses in Florida: 2007-2009 Trends and Longitudinal Analysis March 2009 Addressing Nurse Workforce Issues for the Health of Florida www.flcenterfornursing.org March 2009 2007-2009 Licensure Trends
Registered Nurses. Population
 The Registered Nurse Population Findings from the 2008 National Sample Survey of Registered Nurses September 2010 U.S. Department of Health and Human Services Health Resources and Services Administration
Demographic Profile of the Officer, Enlisted, and Warrant Officer Populations of the National Guard September 2008 Snapshot
 Issue Paper #55 National Guard & Reserve MLDC Research Areas Definition of Diversity Legal Implications Outreach & Recruiting Leadership & Training Branching & Assignments Promotion Retention Implementation
2005 Survey of Licensed Registered Nurses in Nevada
 2005 Survey of Licensed Registered Nurses in Nevada Prepared by: John Packham, PhD University of Nevada School of Medicine Tabor Griswold, MS University of Nevada School of Medicine Jake Burkey, MS Washington
CONTRA COSTA MENTAL HEALTH MENTAL HEALTH SERVICES ACT EXECUTIVE SUMMARY
 CONTRA COSTA MENTAL HEALTH MENTAL HEALTH SERVICES ACT Workforce Education & Training Draft Plan December 2008 Background EXECUTIVE SUMMARY The Mental Health Services Act (Prop 63) passed by California
Merced County Department of Mental Health
 Merced County Department of Mental Health MENTAL HEALTH SERVICES ACT COMMUNITY SERVICES AND SUPPORTS THREE YEAR PROGRAM AND EXPENDITURE PLAN [Fiscal Years 2005/06, 2006/07, 2007/08] PART II, SECTION V
Language Assistance Program (LAP) and Cultural Diversity. Employee/ Provider Training Guide
 and Cultural Diversity. Employee/ Provider Training Guide") Language Assistance Program (LAP) and Cultural Diversity Employee/ Provider Training Guide LANGUAGE ASSISTANCE PROGRAM WORKFORCE AND PROVIDERS TRAINING GUIDE Language Assistance Program (LAP) Law Limited
Language Assistance Program (LAP) and Cultural Diversity Employee/ Provider Training Guide LANGUAGE ASSISTANCE PROGRAM WORKFORCE AND PROVIDERS TRAINING GUIDE Language Assistance Program (LAP) Law Limited
Employee Telecommuting Study
 Employee Telecommuting Study June Prepared For: Valley Metro Valley Metro Employee Telecommuting Study Page i Table of Contents Section: Page #: Executive Summary and Conclusions... iii I. Introduction...
The Prior Service Recruiting Pool for National Guard and Reserve Selected Reserve (SelRes) Enlisted Personnel
 Enlisted Personnel") Issue Paper #61 National Guard & Reserve MLDC Research Areas The Prior Service Recruiting Pool for National Guard and Reserve Selected Reserve (SelRes) Enlisted Personnel Definition of Diversity Legal
Issue Paper #61 National Guard & Reserve MLDC Research Areas The Prior Service Recruiting Pool for National Guard and Reserve Selected Reserve (SelRes) Enlisted Personnel Definition of Diversity Legal
Presented by: Jill Budden, PhD
 Findings from the 2015 National Nursing Workforce Study: A Collaboration between the National Council of State Boards of Nursing & The National Forum of State Nursing Workforce Centers Presented by: Jill
2017 SPECIALTY REPORT ANNUAL REPORT
 2017 SPECIALTY REPORT ANNUAL REPORT National Commission on Certification of Physician Assistants Table of Contents Message from the President... 3 About the Data Collection and Methodology...4 All Specialties....
Charlotte Banks Staff Involvement Lead. Stage 1 only (no negative impacts identified) Stage 2 recommended (negative impacts identified)
 Stage 2 recommended (negative impacts identified)") Paper Recommendation DECISION NOTE Reporting to: Trust Board are asked to note the contents of the Trusts NHS Staff Survey 2017/18 Results and support. Trust Board Date 29 March 2018 Paper Title NHS Staff
Paper Recommendation DECISION NOTE Reporting to: Trust Board are asked to note the contents of the Trusts NHS Staff Survey 2017/18 Results and support. Trust Board Date 29 March 2018 Paper Title NHS Staff
Oklahoma Health Care Authority. ECHO Adult Behavioral Health Survey For SoonerCare Choice
 Oklahoma Health Care Authority ECHO Adult Behavioral Health Survey For SoonerCare Choice Executive Summary and Technical Specifications Report for Report Submitted June 2009 Submitted by: APS Healthcare
Predicting Transitions in the Nursing Workforce: Professional Transitions from LPN to RN
 Predicting Transitions in the Nursing Workforce: Professional Transitions from LPN to RN Cheryl B. Jones, PhD, RN, FAAN; Mark Toles, PhD, RN; George J. Knafl, PhD; Anna S. Beeber, PhD, RN Research Brief,
Section 1: General Information
 2017 Patient and Family Advisory Council Annual Report Form The survey questions concern PFAC activities in fiscal year 2017 only: (July 1, 2016 June 30, 2017). Section 1: General Information 1. Hospital
2002 Job Analysis of Nurse Aides
 VOLUME 11 SEPTEMBER 2003 NCSBN Research Brief Report of Findings from the 2002 Job Analysis of Nurse Aides Employed in Nursing Homes, Home Health Agencies and Hospitals June Smith, PhD, RN National Council
2016 Patient and Family Advisory Council Annual Report
 2016 Patient and Family Advisory Council Annual Report Hospital Name: New England Baptist Hospital (NEBH) Date of Report: September 22, 2016 Year Covered by Report: October 1, 2015 September 30, 2016 Year
2016 National NHS staff survey. Results from Surrey And Sussex Healthcare NHS Trust
 2016 National NHS staff survey Results from Surrey And Sussex Healthcare NHS Trust Table of Contents 1: Introduction to this report 3 2: Overall indicator of staff engagement for Surrey And Sussex Healthcare
2017 National NHS staff survey. Results from The Newcastle Upon Tyne Hospitals NHS Foundation Trust
 2017 National NHS staff survey Results from The Newcastle Upon Tyne Hospitals NHS Foundation Trust Table of Contents 1: Introduction to this report 3 2: Overall indicator of staff engagement for The Newcastle
Population Representation in the Military Services
 Population Representation in the Military Services Fiscal Year 2008 Report Summary Prepared by CNA for OUSD (Accession Policy) Population Representation in the Military Services Fiscal Year 2008 Report
Florida Post-Licensure Registered Nurse Education: Academic Year
 Florida Post-Licensure Registered Nurse Education: Academic Year 2016-2017 The information below represents the key findings regarding the post-licensure (RN-BSN, Master s, Doctorate) nursing education
Demographic Profile of the Active-Duty Warrant Officer Corps September 2008 Snapshot
 Issue Paper #44 Implementation & Accountability MLDC Research Areas Definition of Diversity Legal Implications Outreach & Recruiting Leadership & Training Branching & Assignments Promotion Retention Implementation
2017 Tenth National Doctors of Nursing Practice Conference New Orleans
 2017 Tenth National Doctors of Nursing Practice Conference New Orleans Celebrating 10 Years Diversity & Inclusion in Practice ADMINISTRATIVE PRACTICE A NOVICE NURSING FACULTY EVIDENCE- BASED MENTORSHIP
Report on the SREB Council on Collegiate Education for Nursing South Carolina School of Nursing Data
 Office of Health Care Workforce Research for Nursing Report on the SREB Council on Collegiate Education for Nursing South Carolina School of Nursing Data Report Prepared By: Dr. Peggy O. Hewlett, Director
AJL Reporting User Guide
 AJL Reporting User Guide V O L U M E 1 WIOA, TAA, Case Manager, EEO, Provider, Self-Service, Miscellaneous, & Exit Reports America s JobLink Version 13.2 America s Job Link Alliance-Technical Support 1430
East Central Florida Status Report on Nursing Supply and Demand July 2016
 East Central Florida Status Report on Nursing Supply and Demand July 2016 About the East Central Florida Region Regional Reports The Florida Center for Nursing was established in statute to address the
NHS Grampian Equal Pay Monitoring Report
 NHS Grampian Equal Pay Monitoring Report April 2017 This document is also available in large print, and in other formats, upon request. Please contact Corporate Communications on Aberdeen (01224) 552245
2017 National NHS staff survey. Results from London North West Healthcare NHS Trust
 2017 National NHS staff survey Results from London North West Healthcare NHS Trust Table of Contents 1: Introduction to this report 3 2: Overall indicator of staff engagement for London North West Healthcare
TECHNICAL ASSISTANCE GUIDE
 TECHNICAL ASSISTANCE GUIDE COE DEVELOPED CSBG ORGANIZATIONAL STANDARDS Category 3 Community Assessment Community Action Partnership 1140 Connecticut Avenue, NW, Suite 1210 Washington, DC 20036 202.265.7546
Northeast Florida Status Report on Nursing Supply and Demand July 2016
 Northeast Florida Status Report on Nursing Supply and Demand July 2016 About the Northeast Region Regional Reports The Florida Center for Nursing was established in statute to address the nurse workforce
San Francisco Housing Authority Policy: Limited English Proficiency Plan
 San Francisco Housing Authority Policy: Limited English Proficiency Plan TABLE OF CONTENTS 1.0 Date of Implementation, Approval Authority, Policy Number 2.0 Purpose of the Policy and Plan Statement 3.0
Nursing Under Pressure: Workplace Violence in the Illinois Healthcare Industry
 Nursing Under Pressure 2 Nursing Under Pressure: Workplace Violence in the Illinois Healthcare Industry April 23, 2018 Emily E. LB. Twarog, PhD Assistant Professor Labor Education Program Project for Middle
The City University of New York 2013 Survey of Nursing Graduates ( ) Summary Report December 2013
 Summary Report December 2013") The City University of New York 2013 Survey of Nursing Graduates (2007-2012) Summary Report December 2013 Office of the University Dean for Health and Human Services 101 West 31 st Street, 14 th Floor,
The City University of New York 2013 Survey of Nursing Graduates (2007-2012) Summary Report December 2013 Office of the University Dean for Health and Human Services 101 West 31 st Street, 14 th Floor,
School of Public Health University at Albany, State University of New York
 2017 A Profile of New York State Nurse Practitioners, 2017 School of Public Health University at Albany, State University of New York A Profile of New York State Nurse Practitioners, 2017 October 2017
CULTURAL COMPETENCY Section 14. Cultural Competency. Purpose
 Cultural Competency Purpose The purpose of the Cultural Competency program is to ensure that the Plan meets the unique diverse needs of all members in the population; to ensure that the associates of the
North Carolina. CAHPS 3.0 Adult Medicaid ECHO Report. December Research Park Drive Ann Arbor, MI 48108
 North Carolina CAHPS 3.0 Adult Medicaid ECHO Report December 2016 3975 Research Park Drive Ann Arbor, MI 48108 Table of Contents Using This Report 1 Executive Summary 3 Key Strengths and Opportunities
2017 National NHS staff survey. Results from Salford Royal NHS Foundation Trust
 2017 National NHS staff survey Results from Salford Royal NHS Foundation Trust Table of Contents 1: Introduction to this report 3 2: Overall indicator of staff engagement for Salford Royal NHS Foundation
Request for Proposals
 Request for Proposals Aim High: Supporting Out-of-School Time Programs Serving Disadvantaged Middle School Youth RFP Due: Friday, January 26th, 2018 at 5:00 PM ET Submission Information: You may submit
2017 National NHS staff survey. Results from Nottingham University Hospitals NHS Trust
 2017 National NHS staff survey Results from Nottingham University Hospitals NHS Trust Table of Contents 1: Introduction to this report 3 2: Overall indicator of staff engagement for Nottingham University
Minnesota s Physician Assistant Workforce, 2016
 OFFICE OF RURAL HEALTH AND PRIMARY CARE Minnesota s Physician Assistant Workforce, 2016 HIGHLIGHTS FROM THE 2016 PHYSICIAN ASSISTANT SURVEY Table of Contents Minnesota s Physician Assistant Workforce,
2010 Indiana Mental Health Professionals Re-Licensure Survey Report
 2010 Indiana Mental Health Professionals Re-Licensure Survey Report Produced by: The Indiana Center for Health Workforce Studies Bowen Research Center, Department of Family Medicine Indiana University
2017 Louisiana Nursing Education Capacity Report and 2016 Nurse Supply Addendum Report
 217 Louisiana Education Capacity Report and 216 Nurse Supply Addendum Report Louisiana State Board of Center for 217 Louisiana Education Capacity Report and 216 Nurse Supply Addendum Report Executive Summary
BROWARD COUNTY TRANSIT MAJOR SERVICE CHANGE TO 595 EXPRESS SUNRISE - FORT LAUDERDALE. A Title VI Service Equity Analysis
 BROWARD COUNTY TRANSIT MAJOR SERVICE CHANGE TO 595 EXPRESS SUNRISE - FORT LAUDERDALE A Title VI Service Equity Analysis Prepared September 2015 Submitted for compliance with Title VI of the Civil Rights
COMMUNITY DEVELOPMENT BLOCK GRANT PROGRAM YEAR 2016/17
 COMMUNITY DEVELOPMENT BLOCK GRANT PROGRAM YEAR 2016/17 ANNUAL REPORT CDBG subrecipients, please fill in the following tables and answer questions as completely as possible. Submit this report to the City
NURSING SPECIAL REPORT
 2017 Press Ganey Nursing Special Report The Influence of Nurse Manager Leadership on Patient and Nurse Outcomes and the Mediating Effects of the Nurse Work Environment Nurse managers exert substantial
West Central Florida Status Report on Nursing Supply and Demand July 2016
 West Central Florida Status Report on Nursing Supply and Demand July 2016 About the West Central Florida Region Regional Reports The Florida Center for Nursing was established in statute to address the
South Shore Hospital, S. Weymouth, MA
 South Shore Hospital, S. Weymouth, MA 2017 Patient and Family Advisory Council Annual Report Form The survey questions concern PFAC activities in fiscal year 2017 only: (July 1, 2016 June 30, 2017). Section
2016 National NHS staff survey. Results from Wirral University Teaching Hospital NHS Foundation Trust
 2016 National NHS staff survey Results from Wirral University Teaching Hospital NHS Foundation Trust Table of Contents 1: Introduction to this report 3 2: Overall indicator of staff engagement for Wirral
National Survey on Consumers Experiences With Patient Safety and Quality Information
 Summary and Chartpack The Kaiser Family Foundation/Agency for Healthcare Research and Quality/Harvard School of Public Health National Survey on Consumers Experiences With Patient Safety and Quality Information
METHODOLOGY FOR INDICATOR SELECTION AND EVALUATION
 CHAPTER VIII METHODOLOGY FOR INDICATOR SELECTION AND EVALUATION The Report Card is designed to present an accurate, broad assessment of women s health and the challenges that the country must meet to improve
2017 National NHS staff survey. Results from Royal Cornwall Hospitals NHS Trust
 2017 National NHS staff survey Results from Royal Cornwall Hospitals NHS Trust Table of Contents 1: Introduction to this report 3 2: Overall indicator of staff engagement for Royal Cornwall Hospitals NHS
2012 SURVEY OF REGISTERED NURSES AMN HEALTHCARE, INC., 2012 JOB SATISFACTION, CAREER PATTERNS AND TRAJECTORIES
 We ve earned The Joint Commission s Gold Seal of Approval 2012 SURVEY OF REGISTERED NURSES AMN HEALTHCARE, INC., 2012 12400 High Bluff Drive, San Diego, CA 92130 JOB SATISFACTION, CAREER PATTERNS AND TRAJECTORIES
Physician Workforce Fact Sheet 2016
 Introduction It is important to fully understand the characteristics of the physician workforce as they serve as the backbone of the system. Supply data on the physician workforce are routinely collected
2017 National NHS staff survey. Results from Dorset County Hospital NHS Foundation Trust
 2017 National NHS staff survey Results from Dorset County Hospital NHS Foundation Trust Table of Contents 1: Introduction to this report 3 2: Overall indicator of staff engagement for Dorset County Hospital
The Impact of Scholarships on Student Performance
 Research Brief The Impact of Scholarships on Student Performance Introduction This brief examines the number, nature, and dollar amount of scholarships awarded by CCSF from 2005 through 2007. In addition,
Nursing and Personal Care: Funding Increase Survey
 Nursing and Personal Care: Funding Increase Survey Prepared for: Ministry of Health and Long-Term Care Long Term Care Facilities Branch 5 th Floor, Hepburn Block 80 Grosvenor Street Toronto, Ontario Prepared
DoDEA Seniors Postsecondary Plans and Scholarships SY
 DoDEA Seniors Postsecondary Plans and Scholarships SY 2011 12 Department of Defense Education Activity (DoDEA) Research and Evaluation Branch Ashley Griffin, PhD D e p a r t m e n t o f D e f e n s e E
Minnesota s Registered Nurse Workforce
 Minnesota s Registered Nurse Workforce 2015-2016 HIGHLIGHTS FROM THE 2015-2016 RN WORKFORCE SURVEYi Overall Registered nurses, the largest segment of the health care workforce, deliver primary and specialty
Name: The Town of East Haven. Application for Employment. Position: Secretary II, Grade Level 10
 Name: Email: The Town of East Haven Application for Employment Position: Secretary II, Grade Level 10 Instructions: Read each question carefully. Answer every question. If the question does not apply to
CULTURAL COMPETENCY Section 13
 Cultural Competency Purpose The purpose of the Cultural Competency program is to ensure that the Plan meets the unique, diverse needs of all members; to provide that the associates of the Plan value diversity
Appendix A Registered Nurse Nonresponse Analyses and Sample Weighting
 Appendix A Registered Nurse Nonresponse Analyses and Sample Weighting A formal nonresponse bias analysis was conducted following the close of the survey. Although response rates are a valuable indicator
Physical Therapy Assistant Occupation Overview
 Physical Therapy Assistant Occupation Overview Emsi Q1 2018 Data Set March 2018 Western Technical College 400 Seventh Street La Crosse, Wisconsin 54601 608.785.9200 Emsi Q1 2018 Data Set www.economicmodeling.com
ONTARIO EMERGENCY DEPARTMENT PATIENT EXPERIENCE OF CARE SURVEY
 ONTARIO EMERGENCY DEPARTMENT PATIENT EXPERIENCE OF CARE SURVEY (Ontario EDPEC) SURVEY INSTRUCTIONS Answer all the questions by checking the box to the left of your answer. You are sometimes told to skip
Barriers & Incentives to Obtaining a Bachelor of Science Degree in Nursing
 Southern Adventist Univeristy KnowledgeExchange@Southern Graduate Research Projects Nursing 4-2011 Barriers & Incentives to Obtaining a Bachelor of Science Degree in Nursing Tiffany Boring Brianna Burnette
2017 National NHS staff survey. Results from North West Boroughs Healthcare NHS Foundation Trust
 2017 National NHS staff survey Results from North West Boroughs Healthcare NHS Foundation Trust Table of Contents 1: Introduction to this report 3 2: Overall indicator of staff engagement for North West
Full-time Equivalents and Financial Costs Associated with Absenteeism, Overtime, and Involuntary Part-time Employment in the Nursing Profession
 Full-time Equivalents and Financial Costs Associated with Absenteeism, Overtime, and Involuntary Part-time Employment in the Nursing Profession A Report prepared for the Canadian Nursing Advisory Committee
Minnesota s Registered Nurse Workforce
 Minnesota s Registered Nurse Workforce 2013-2014 HIGHLIGHTS FROM THE 2013-2014 RN WORKFORCE SURVEY i Overall Registered nurses are the largest segment of the health care workforce delivering primary and
Minnesota s Respiratory Therapist Workforce, 2016
 OFFICE OF RURAL HEALTH AND PRIMARY CARE Minnesota s Respiratory Therapist Workforce, 2016 HIGHLIGHTS FROM THE 2016 RESPIRATORY THERAPIST SURVEY Table of Contents Minnesota s Respiratory Therapist Workforce,
CER Module ACCESS TO CARE January 14, AM 12:30 PM
 CER Module ACCESS TO CARE January 14, 2014. 830 AM 12:30 PM Topics 1. Definition, Model & equity of Access Ron Andersen (8:30 10:30) 2. Effectiveness, Efficiency & future of Access Martin Shapiro (10:30
Florida Licensed Practical Nurse Education: Academic Year
 # of LPN Programs Florida Licensed Practical Nurse Education: Academic Year 2016-2017 This report presents key findings regarding the Licensed Practical Nursing education system in Florida for Academic
Limited English Proficiency Plan of the Memphis Urban Area Metropolitan Planning Organization
 Limited English Proficiency Plan of the Memphis Urban Area Metropolitan Planning Organization Introduction The Memphis Urban Area Metropolitan Planning Organization (MPO) is responsible for continual,
2017 National NHS staff survey. Results from Oxleas NHS Foundation Trust
 2017 National NHS staff survey Results from Oxleas NHS Foundation Trust Table of Contents 1: Introduction to this report 3 2: Overall indicator of staff engagement for Oxleas NHS Foundation Trust 5 3:
Demographics, Skills Gaps, and Market Dynamics
 Conference Papers Upjohn Research home page 2013 Demographics, Skills Gaps, and Market Dynamics Randall W. Eberts W.E. Upjohn Institute, eberts@upjohn.org Citation Eberts, Randall W. 2013. " Demographics,
Patient-Centered Connected Care 2015 Recognition Program Overview. All materials 2016, National Committee for Quality Assurance
 Patient-Centered Connected Care 2015 Recognition Program Overview All materials 2016, National Committee for Quality Assurance Learning Objectives Introduction to Patient-Centered Connected Care and Eligibility
CALIFORNIA STATE UNIVERSITY, STANISLAUS School Nursing Application to the Pre-licensure Nursing Program
 Updated 01/20/11 CALIFORNIA STATE UNIVERSITY, STANISLAUS School Nursing Application to the Pre-licensure Nursing Program Fall Entry Applicants Application Deadlines University Application - Priority application
Data Report 2015 Indiana Nursing Licensure Survey
 Data Report 2015 Indiana Nursing Licensure Survey May 2016 0 010 0 010 0 0110101010 0110 0 010 011010 010 0 010 0 0110110 0110 0110 0 010 010 0 010 0 01101010 0110 0 010 010 0 010 0 0 N U R S E S 0 010
The Current State of Addiction Treatment
 The Current State of Addiction Treatment Understanding characteristics & needs of the substance abuse treatment workforce in Washington. Jeffrey R.W. Knudsen RMC Research Corporation jknudsen@rmccorp.com
Reenlistment Rates Across the Services by Gender and Race/Ethnicity
 Issue Paper #31 Retention Reenlistment Rates Across the Services by Gender and Race/Ethnicity MLDC Research Areas Definition of Diversity Legal Implications Outreach & Recruiting Leadership & Training
Rising Above the Noise: Making the Case for Equity in Care
 Rising Above the Noise: Making the Case for Equity in Care The headlines are common and the facts are known Unequal Treatment The Demographic Landscape More than 100 million people in the United States
Practice nurses in 2009
 Practice nurses in 2009 Results from the RCN annual employment surveys 2009 and 2003 Jane Ball Geoff Pike Employment Research Ltd Acknowledgements This report was commissioned by the Royal College of Nursing
Available online at Nurs Outlook 66 (2018) 46 55
 46 55") Available online at www.sciencedirect.com Nurs Outlook 66 (2018) 46 55 www.nursingoutlook.org An untapped resource in the nursing workforce: Licensed practical nurses who transition to become registered
Available online at www.sciencedirect.com Nurs Outlook 66 (2018) 46 55 www.nursingoutlook.org An untapped resource in the nursing workforce: Licensed practical nurses who transition to become registered
Careers in Patient Care: A Look at Former Students from Nursing and other Health Programs that Focus on Patient Care
 DACSO Diploma, Associate Degree, & Certificate Student Outcomes Careers in Patient Care: A Look at Former Students from Nursing and other Programs that Focus on Patient Care Every year, B.C. s public post-secondary
Florida s Workforce Supply Characteristics and Trends: Registered Nurses (RN)
") Florida s 2016-2017 Workforce Supply Characteristics and Trends: Registered Nurses (RN) Addressing Nurse Workforce Issues for the Health of Florida www.flcenterfornursing.org Visit our site at: www.flcenterfornursing.org
Florida s 2016-2017 Workforce Supply Characteristics and Trends: Registered Nurses (RN) Addressing Nurse Workforce Issues for the Health of Florida www.flcenterfornursing.org Visit our site at: www.flcenterfornursing.org
SCERC Needs Assessment Survey FY 2015/16 Oscar Arias Fernandez, MD, ScD and Dean Baker, MD, MPH
 INTRODUCTION SCERC Needs Assessment Survey FY 2015/16 Oscar Arias Fernandez, MD, ScD and Dean Baker, MD, MPH The continuous quality improvement process of our academic programs in the Southern California
Guidelines for Title 5 Regulations Section Policies for Prerequisites, Corequisites and Advisories on Recommended Preparation
 Guidelines for Title 5 Regulations Section 55003 Policies for Prerequisites, Corequisites and Advisories on Recommended Preparation Adopted by the California Community Colleges Board of Governors March
Workforce Race Equality Standard (WRES) Data Report 2015/16
 Data Report 2015/16") Workforce Race Equality Standard (WRES) Data Report 2015/16 The NHS has introduced a national Workforce Race Equality Standard (WRES) to ensure employees from black and minority ethnic (BME) backgrounds
Workforce Race Equality Standard (WRES) Data Report 2015/16 The NHS has introduced a national Workforce Race Equality Standard (WRES) to ensure employees from black and minority ethnic (BME) backgrounds
The Impact of Medicaid Primary Care Payment Increases in Washington State
 EXECUTIVE SUMMARY BACKGROUND Enhanced payments for primary care services provided to Medicaid patients in 2013 and 2014, authorized by the federal Patient Protection and Affordable Care Act (ACA) of 2010,
Certified Nursing Assistant (CNA) Program. Fall 2013 Demographics Survey
 Program. Fall 2013 Demographics Survey") Certified Nursing Assistant (CNA) Program Fall 2013 Demographics Survey Prepared by Danielle Pearson Date: 10.17.2013 Introduction The Chaffey College Health Science Demographic Survey was completed by
Certified Nursing Assistant (CNA) Program Fall 2013 Demographics Survey Prepared by Danielle Pearson Date: 10.17.2013 Introduction The Chaffey College Health Science Demographic Survey was completed by
Minnesota s Licensed Marriage & Family Therapist (LMFT) Workforce, 2017 HIGHLIGHTS FROM THE 2016 LMFT SURVEY
 Workforce, 2017 HIGHLIGHTS FROM THE 2016 LMFT SURVEY") Minnesota s Licensed Marriage & Family Therapist (LMFT) Workforce, 2017 HIGHLIGHTS FROM THE 2016 LMFT SURVEY Minnesota s Licensed Marriage & Family Therapist (LMFT) Workforce, 2017 Highlights from the
Minnesota s Licensed Marriage & Family Therapist (LMFT) Workforce, 2017 HIGHLIGHTS FROM THE 2016 LMFT SURVEY Minnesota s Licensed Marriage & Family Therapist (LMFT) Workforce, 2017 Highlights from the
Equal Pay Statement and Gender Pay Gap Information
 Equal Pay Statement and Information As at 31 st March 2017 1 Accessibility If you would like this document in alternative formats such as Braille, large print, audio or in a language of your choice, please
THE STATE OF THE NURSING WORKFORCE IN NEW JERSEY: FINDINGS FROM A STATEWIDE SURVEY OF REGISTERED NURSES
 THE STATE OF THE NURSING WORKFORCE IN NEW JERSEY: FINDINGS FROM A STATEWIDE SURVEY OF REGISTERED NURSES Linda Flynn, Ph.D., RN The New Jersey Collaborating Center for Nursing This survey was conducted
National Regional Extension Centers and Health Information Exchange Summit West
 National Regional Extension Centers and Health Information Exchange Summit West Marcia Thomas-Brown Chief Operating Officer October 2010 San Francisco, CA Introducing NHIT Our Vision To become the premiere,
Survey of Health Care Employers in Arizona: Long-Term Care Facilities, 2015
 Survey of Health Care Employers in Arizona: Long-Term Care Facilities, 2015 June 22, 2016 Prepared by: Lela Chu Joanne Spetz, PhD University of California, San Francisco 3333 California Street, Suite 265
256B.0943 CHILDREN'S THERAPEUTIC SERVICES AND SUPPORTS.
 1 MINNESOTA STATUTES 2016 256B.0943 256B.0943 CHILDREN'S THERAPEUTIC SERVICES AND SUPPORTS. Subdivision 1. Definitions. For purposes of this section, the following terms have the meanings given them. (a)