Metro Performance Report
|
|
|
- Lisa Hill
- 5 years ago
- Views:
Transcription

1 FY2018 Metro Performance Report Fiscal-Year-to-Date Performance 2 Page 1 of 47

2 Quality Service & Security Focus Service reliability improving and crime best in decade 3 Page 2 of 47


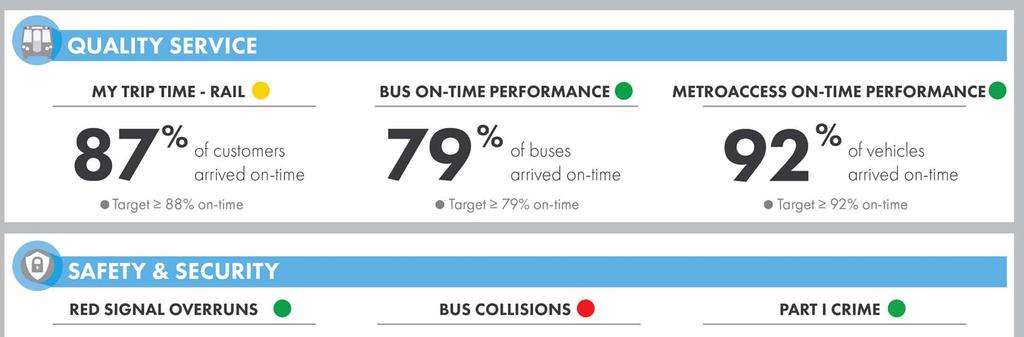
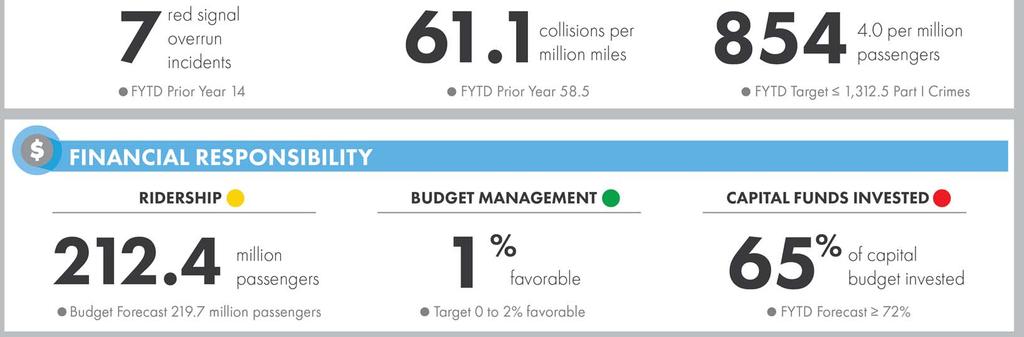
3 Quality Service & Security Focus MyTripTime Rail Customer On-Time Performance MyTripTime Near target Target 88% OTP improved thanks to fewer railcar delays and fewer extended maintenance disruptions 87% 74% 67% 12-Month Trend Key Actions: Implement aggressive rail infrastructure renewal, inspection and preventive maintenance program Accept 7K trains Begin retirement of 5000 series fleet Repair escalators, elevators and fare gates Apr May Jun Jul Aug Sep Oct Nov Dec Jan Feb Mar 4 Page 3 of 47
![Quality Service & Security Focus Rail Fleet Reliability Rail Fleet Reliability [mean distance between delay] Met target Target 85,000 54,968 73,027 86,831 Offloads [due to railcar problems] Decreased](/docs-images/85/92752198/images/4-0.jpg "compared to prior year 1,298 883 559 Reliability surpassed target, reaching eight-year high with offloads down 57% from FYTD16 Key Actions: Accept 7K trains Continue to adjust inspection schedules")
4 Quality Service & Security Focus Rail Fleet Reliability Rail Fleet Reliability [mean distance between delay] Met target Target 85,000 54,968 73,027 86,831 Offloads [due to railcar problems] Decreased compared to prior year 1, Reliability surpassed target, reaching eight-year high with offloads down 57% from FYTD16 Key Actions: Accept 7K trains Continue to adjust inspection schedules and procedures for legacy fleet Identify and address root causes of delays and offloads Begin retirement of 5000 series fleet 5 Page 4 of 47


5 Quality Service & Security Focus Rail Infrastructure Infrastructure Availability Pilot KPI While limited impact on OTP, speed restrictions in downtown core reduced metric New Measure FY17 93% 94% Key Actions: Complete assessment of power draw in downtown core, aiming to lift speed restriction in Summer 2018 Continue preventive maintenance and capital programs Expand pilot waterproofing technique in Red Line tunnels Track inspections to identify and fix degraded conditions 6 Page 5 of 47


6 Quality Service & Security Focus Bus On-Time Performance Bus On-Time Performance Met target Target 79% 78% 76% 79% 12-Month Trend Apr May Jun Jul Aug Sep Oct Nov Dec Jan Feb Mar Met target with best third quarter result since report began in 2010 Key Actions: Actively manage headway routes through dedicated field supervisors and control center specialists Implement technology upgrades for real-time tracking of buses Utilize articulated and strategic buses on high-frequency routes to reduce crowding and improve reliability Continue to implement schedule adjustments on low-performing routes 7 Page 6 of 47

7 Quality Service & Security Focus Bus Fleet Reliability Bus Fleet Reliability Target not met Target 8,000 Impacted by increased use of older, less reliable buses due to out of service buses 8,314 7,773 7,174 Key Actions: Complete safety checks and return to service 164 New Flyer buses Retrofit buses with alternative coolant level sensor Continue evaluation of new products and adjust preventive maintenance cycles Midlife overhaul and preventive maintenance programs Sustain bus procurements 8 Page 7 of 47

8 Quality Service & Security Focus MetroAccess On-Time Performance MetroAccess On-Time Performance OTP is meeting target and improved by 5% compared to the same time last year Met target Target 92% 94% 87% 92% Key Actions: Implement new system tools to provide real-time traffic data Enhance MetroAccess street-level monitoring of service Continue to facilitate and promote the use of subsidized alternatives to MetroAccess 9 Page 8 of 47


9 Quality Service & Security Focus Escalator & Elevator Availability Escalator Availability Met target Target 93% 93% 93% 94% Elevator Availability Met target Target 97% Both met target with escalator availability surpassing target Key Actions: Continue aggressive replacement and rehab efforts, and survey additional escalator units for replacement Establish contract with manufacturer for escalator step mold to ensure steady supply 97% 97% 97% 10 Page 9 of 47

10 Quality Service & Security Focus Crime Part I Crime Met target FYTD18 Target 1, ,282 1, Property Crimes Violent Crimes Part I Crime, per million passengers The Part I crime rate decreased 18% compared to last year, best in years Key Actions: Continue investment in closed circuit television (CCTV) and real-time monitoring Adjust tactics and officer deployments based on crime data analysis Sustain fare evasion initiative Page 10 of 47

11 Safety Focus Rail improving, bus an area of focus 12 Page 11 of 47
12 Safety Focus Red Signal Overruns Red Signal Overruns Decreased compared to prior year Month Trend Apr May Jun Jul Aug Sep Oct Nov Dec Jan Feb Mar 50% decrease compared to FYTD17 Key Actions: Track sign maintenance (cleaning, replacement) Yard safety briefing on each shift by Interlocking Operator Signal head upgrades (LEDs/Lenses/Name Plates) Right-side signal configuration Diverging route signal consistency Line familiarization training for train and equipment operators Improved communications for Roadway Maintenance Machines (headsets) 13 Page 12 of 47
13 Safety Focus Fire Incidents Fire Incidents Decreased compared to prior year 12-Month Trend Arcing Events Non-Electrical Cable Train Component 8% decrease compared to FYTD17 Key Actions: Tunnel leak mitigation project continues Track bed cleaning and drain maintenance Stray current testing Cable securement project in progress on aboveground sections Apr May Jun Jul Aug Sep Oct Nov Dec Jan Feb Mar 14 Page 13 of 47
14 Safety Focus Rail Collisions Rail Collisions 38% decrease compared to FYTD17 Decreased compared to prior year Month Trend Apr May Jun Jul Aug Sep Oct Nov Dec Jan Feb Mar Key Actions: Operator training on safe train movement in yards Efficiency testing Speed compliance Yard safety stops Shop/yard moves Improved roadway maintenance machine communication procedures Revitalized Line familiarization training for train and equipment operators Deployed new training program for flagman and any personnel who may perform this task (e.g. equipment operators, track repairers) 15 Page 14 of 47
15 Safety Focus Derailments Derailments Decreased compared to prior year 12-Month Trend 15% decrease compared to FYTD Apr May Jun Jul Aug Sep Oct Nov Dec Jan Feb Mar Roadway Maintenance Machines Trains Carrying Customers Trains with No Customers Key Actions: Hi-rail vehicle inspection and approval process Tie scanning Base of rail scanning High resolution track scanning cameras Page 15 of 47
16 Safety Focus Bus Collisions Bus Collisions, per million miles Non-Preventable Increased compared to prior year Month Trend Preventable Increased compared to prior year Overall collision rate increase of 4.5%; driven by preventable rate increase of 8% Key Actions: Fixed object collision reduction committee Deceleration light and strobe installation Mirror adjustments/lowering Apr May Jun Jul Aug Sep Oct Nov Dec Jan Feb Mar Apr May Jun Jul Aug Sep Oct Nov Dec Jan Feb Mar 17 Page 16 of 47
17 Safety Focus Bus Pedestrian Strikes Bus Pedestrian Strikes 29% decrease compared to FYTD 2017 Decreased compared to prior year Month Trend Key Actions: Front strobe/marker light installation Line observations by BTRA and SAFE personnel Ride-alongs by supervisory staff Review of DriveCam Incidents Mirror lowering/adjustment Electronic messaging at the divisions to reinforce safe operations Apr May Jun Jul Aug Sep Oct Nov Dec Jan Feb Mar 18 Page 17 of 47
18 Safety Focus Rail Customer Injuries Rail Customer Injuries, per million passengers Non-Preventable Preventable 1% decrease compared to FYTD 2017 Met target Target Month Trend Key Actions: Automated escalator announcements program expansion Replaced and installed new optimal boarding location signage for ADA Installation of platform cameras at Train Operator's position at Silver Spring and Brookland-CUA stations to assist with platform observations All Rail Customer Injuries were preventable Jan Feb Mar Apr May Jun Jul Aug Sep Oct Nov Dec Apr May Jun Jul Aug Sep Oct Nov Dec Jan Feb Mar 19 Page 18 of 47
19 Safety Focus Bus Customer Injuries Bus Customer Injuries, per million passengers Non-Preventable Preventable Non-Preventable vehicle collisions leading cause of 24% increase Target not met Target Month Trend Key Actions: Line observations by BTRA and SAFE personnel Deceleration light installation Emphasis on proper approach angle and berthing position at bus stops Installation of on-board video monitors on all new buses Apr May Jun Jul Aug Sep Oct Nov Dec Jan Feb Mar Apr May Jun Jul Aug Sep Oct Nov Dec Jan Feb Mar 20 Page 19 of 47
20 Safety Focus MetroAccess Customer Injuries MetroAccess Customer Injuries, per 100,000 passengers Non-Preventable Met target Target Month Trend Preventable % decrease in overall customer injuries compared to FYTD 2017 Key Actions: Operator training Occupational therapist Acquisition of new vehicles with improved design Apr May Jun Jul Aug Sep Oct Nov Dec Jan Feb Mar Apr May Jun Jul Aug Sep Oct Nov Dec Jan Feb Mar 21 Page 20 of 47
21 Safety Focus Rail Employee Injuries Rail Employee Injuries, per 100 employees Non-Preventable Met target Target Month Trend Preventable Rail employee injury rate decreased compared FYTD 2017 Key Actions: Fare evasion reduction strategies to reduce assaults on station managers Review and update of work instructions in conjunction with job hazard analyses Continued observation and SAFE support during overnight maintenance Establishment of RWP Compliance Group within SAFE Improved injury investigations among rail and maintenance departments Apr May Jun Jul Aug Sep Oct Nov Dec Jan Feb Mar Apr May Jun Jul Aug Sep Oct Nov Dec Jan Feb Mar 22 Page 21 of 47
22 Safety Focus Bus Employee Injuries Bus Employee Injuries, per 100 employees Non-Preventable Preventable Bus employee injury rate increased compared to FYTD 2017 Target not met Target Month Trend Key Actions: Personal protective equipment evaluation Review of ergonomic factors related to normal bus operations (a leading cause for the increase) Assault prevention actions Officer presence on targeted routes Scenario-based training for operators Operator humanizing campaign Automated fare announcement Apr May Jun Jul Aug Sep Oct Nov Dec Jan Feb Mar Apr May Jun Jul Aug Sep Oct Nov Dec Jan Feb Mar 23 Page 22 of 47

23 Fiscal Responsibility Focus Balancing budget through expense management, as ridership and fare revenues lower than projected 24 Page 23 of 47
24 Fiscal Responsibility Focus Ridership Ridership by Mode, millions Near forecast FYTD18 Budget Forecast Rail ridership levels are similar to last year; Bus ridership has continued to decline, in part driven by the fare increase Rail Bus MetroAccess Key Actions: Sustain improvements in rail and bus on-time performance Promote monthly SelectPass and weekly bus passes and encourage more customers to register SmarTrip cards and use online offerings such as auto-reload Continue Rush Hour Promise, crediting riders experiencing delays of 15 minutes or more during rush hour periods Strengthen SmartBenefits and regional employer relationships 25 Page 24 of 47
25 Fiscal Responsibility Focus Operating Budget Management Operating Budget Management Met target Target 0 to 2% favorable Below budget expenses exceeded revenue shortfalls, resulting in projected balanced budget 2% FYTD18 ($ in millions) -1% 1% Budget Actual Favorable (Unfavorable) Expenses 1,370 1, Revenue (20) Subsidy Net Position 18 Expenses were under budget by $38 million, primarily due to vacant positions and lower spending on services Revenue was below budget by $20 million, primarily due to ridership below budgeted levels The net operating position is $18 million favorable year-to-date; the year-end forecast projects a balanced budget 26 Page 25 of 47
26 Fiscal Responsibility Focus Capital Funds Invested Capital Funds Invested Forecast not met FYTD18 Forecast 72% 85% FY16 30% Q4 55% 99% FY17 25% Q4 74% 65% Actual FYTD % FY18 Forecast 29-35% Q4 Forecast 65% of capital funds were invested FYTD; forecasted pace of investment to increase in Q4 Railcar Continued delivery of 7000 series railcars Rail Systems Radio and cell service projects Track & Structure Red Line Water Mitigation Pilot Station & Passenger Facilities Station Lighting program Replaced escalators and rehabilitated elevators Bus & Paratransit Rehabilitated buses; delayed delivery of new buses Building new Andrews Federal Center bus garage 27 Page 26 of 47
27 Quality Service Performance Data July March 2018 KPI: METRORAIL CUSTOMER ON-TIME PERFORMANCE [TARGET 88%] FY % 72% 78% 80% 69% 71% 74% FY % 69% 64% 65% 61% 63% 66% 71% 70% 75% 76% 79% 67% FY % 89% 87% 88% 87% 86% 86% 87% 88% 87% KPI: METRORAIL CUSTOMER ON-TIME PERFORMANCE BY LINE Red Line 87% 88% 89% 88% 84% 80% 83% 88% 88% 86% Blue Line 82% 87% 81% 84% 85% 86% 83% 85% 86% 84% Orange Line 83% 87% 79% 86% 85% 87% 83% 82% 86% 84% Green Line 92% 93% 94% 94% 92% 95% 92% 90% 94% 93% Yellow Line 85% 92% 91% 90% 88% 91% 88% 89% 89% 89% Silver Line 82% 88% 81% 86% 86% 88% 84% 82% 85% 85% KPI: METRORAIL CUSTOMER ON-TIME PERFORMANCE BY TIME PERIOD AM Rush (5AM-9:30AM) Mid-day (9:30AM-3PM) PM Rush (3PM-7PM) Evening (7PM-9:30PM) Late Night (9:30PM-12AM) Weekend 87% 92% 90% 91% 88% 86% 85% 89% 90% 89% 90% 90% 89% 90% 89% 88% 89% 90% 89% 89% 89% 88% 87% 90% 88% 87% 89% 89% 89% 88% 92% 92% 93% 92% 92% 92% 92% 93% 91% 92% 90% 92% 93% 89% 88% 90% 90% 87% 85% 89% 72% 79% 77% 76% 72% 81% 65% 66% 82% 75% continued Chief Performance Officer 2 Metro Performance Report FY 2018 Page 27 of 47
28 KPI: RAIL INFRASTRUCTURE AVAILABILITY [PILOT KPI] FY % 93% 92% 92% 92% 92% 93% FY % 94% 94% 95% 93% 94% 95% 95% 95% 94% *FY17 and FY18 data have been revised to reflect a manual speed restriction in the downtown core that has been in place since May 2016 KPI: FTA REPORTABLE SPEED RESTRICTIONS [TARGET 2.2%] FY % 12% 14% 16% 16% 15% 10% 10% 13% 11 % 12% 15% 13% FY % 13% 10% 10% 12% 14% 10% 10% 10% 11 % *FY17 and FY18 data have been revised to reflect a manual speed restriction in the downtown core that has been in place since May 2016 TRAIN ON-TIME PERFORMANCE (HEADWAY ADHERENCE) [TARGET 91%] FY % 83% 79% 76% 80% 82% 78% 82% 86% 87% 80% 80% 81% FY % 76% 78% 80% 74% 76% 76% 82% 80% 84% 83% 82% 78% FY % 92% 89% 92% 89% 88% 89% 91% 91% 90% TRAIN ON-TIME PERFORMANCE BY LINE (HEADWAY ADHERENCE) Red Line 91% 92% 92% 93% 87% 81% 90% 92% 92% 90% Blue Line 86% 89% 85% 89% 88% 88% 86% 88% 88% 87% Orange Line 89% 90% 87% 90% 90% 90% 88% 90% 90% 89% Green Line 93% 95% 96% 96% 94% 95% 94% 95% 96% 95% Yellow Line 91% 94% 93% 94% 93% 93% 93% 94% 94% 93% Silver Line 88% 91% 86% 89% 89% 89% 87% 89% 89% 89% TRAIN ON-TIME PERFORMANCE BY TIME PERIOD (HEADWAY ADHERENCE) AM Rush 85% 89% 86% 89% 85% 84% 82% 87% 88% 86% Mid-day 94% 95% 93% 95% 94% 92% 95% 95% 96% 94% PM Rush 88% 89% 87% 90% 88% 86% 87% 89% 89% 88% Evening 94% 93% 96% 91% 90% 94% 94% 93% 91% 93% continued Chief Performance Officer 3 Metro Performance Report FY 2018 Page 28 of 47
29 RAIL FLEET RELIABILITY (RAIL MEAN DISTANCE BETWEEN DELAYS) [TARGET 85,000 MILES] FY ,446 59,196 60,872 65,900 63,564 51,599 39,657 47,239 59,131 80,943 81,278 85,389 54,968 FY ,850 73,246 65,416 86,174 66,697 76,244 79,105 85,489 80, , , ,461 73,027 FY ,927 84,111 84, ,128 80,687 85,310 61,004 95, ,361 86,831 continued RAIL FLEET RELIABILITY (RAIL MEAN DISTANCE BETWEEN DELAYS BY RAILCAR SERIES) 2000 series 266, , ,620 55, ,658 80,823 58,727 66, ,665 93, series 99,654 65, , , ,195 64,770 63,393 53,861 68,176 74, series 43,257 48,454 38,808 51,192 67,836 48,036 35, ,995 78,409 50, series 75, , ,604 73,596 92,913 77,281 48, ,753 73,963 81, series 147, ,557 87, ,484 95, ,596 77, , , ,706 RAIL FLEET RELIABILITY (RAIL MEAN DISTANCE BETWEEN FAILURE) [TARGET 7,500 MILES] FY ,576 4,802 4,738 5,326 4,970 5,693 5,020 4,813 5,336 5,307 5,596 5,259 5,016 FY ,333 4,606 5,538 6,321 6,355 6,819 6,787 7,723 6,878 7,902 8,425 8,215 5,943 FY ,430 8,227 9, ,881 10,376 10,496 10,021 11,280 11,202 9,786 RAIL FLEET RELIABILITY (RAIL MEAN DISTANCE BETWEEN FAILURE BY RAILCAR SERIES) 2000 series 12,682 9,679 11, 378 8,790 10,666 8,598 10,541 10,531 11, , series 7,396 7,362 10,264 11, 375 9,700 8,985 9,260 8,112 8,786 8, series 2,809 3,230 3,234 4,143 5,088 4,367 4,337 5,956 6,309 3, series 8,062 12,085 11,954 8,873 9,369 8,587 7,946 9,204 7,727 9, series 14,936 16,229 17,315 21,527 16,925 20,366 15,961 18,575 17,242 17,331 TRAINS IN SERVICE [TARGET 98%] FY % 96% 92% 99% 94% 98% 97% 97% 96% 97% 96% FY % 99% 98% 101% 99% 99% 97% 98% 98% 99% continued Chief Performance Officer 4 Metro Performance Report FY 2018 Page 29 of 47
30 RAIL LOADING [OPTIMAL PASSENGERS PER CAR (PPC) OF 100, WITH MINIMUM OF 80 AND MAXIMUM OF 120 PPC] AM Rush Max Load Points Oct-16 Nov-16 Dec-16 Jan-17 Oct-17 Nov-17 Dec-17 Jan-18 Gallery Place Red Dupont Circle Pentagon Rosslyn Blue L'Enfant Plaza Court House Orange L'Enfant Plaza Pentagon Yellow Waterfront Green Shaw-Howard Rosslyn Silver L'Enfant Plaza PM Rush Max Load Points Metro Center Red Farragut North Rosslyn Foggy Bottom-GWU Blue Smithsonian Foggy Bottom-GWU Orange Smithsonian L'Enfant Plaza Yellow L'Enfant Plaza Green Mt. Vernon Square Foggy Bottom-GWU Silver L'Enfant Plaza continued Chief Performance Officer 5 Metro Performance Report FY 2018 Page 30 of 47
31 KPI: METROBUS ON-TIME PERFORMANCE [TARGET 79%] FY % 80% 76% 76% 77% 78% 77% 78% 78% 77% 77% 75% 78% FY % 77% 72% 73% 73% 76% 77% 78% 77% 76% 76% 76% 76% FY % 80% 76% 76% 76% 78% 81% 80% 80% 79% KPI: METROBUS ON-TIME PERFORMANCE BY TIME PERIOD AM Early (4AM-6AM) AM Peak (6AM-9AM) Mid Day (9AM-3PM) PM Peak (3PM-7PM) Early Night (7PM-11PM) Late Night (11PM-4AM) 89% 90% 89% 89% 87% 88% 89% 90% 89% 89% 84% 84% 79% 80% 80% 82% 83% 83% 83% 82% 79% 79% 77% 78% 77% 79% 81% 81% 80% 79% 75% 75% 69% 68% 67% 71% 75% 74% 74% 72% 80% 80% 78% 78% 79% 81% 83% 83% 82% 80% 77% 79% 78% 78% 80% 81% 83% 83% 83% 80% BUS FLEET RELIABILITY (BUS MEAN DISTANCE BETWEEN FAILURES) [TARGET 8,000 MILES] FY ,518 7,352 7,542 7,307 9,185 7,893 8,422 8,332 8,359 9,138 8,711 7,736 7,773 FY ,540 7,425 8,428 8,378 8,262 8,421 7,962 9,881 9,254 8,499 7,784 8,350 8,314 FY ,555 7,764 7,571 6,923 7,492 7,776 6,221 6,164 7,485 7,174 BUS FLEET RELIABILITY (BUS MEAN DISTANCE BETWEEN FAILURE BY FLEET TYPE) CNG Average Age 8.4 Hybrid Average Age 6.2 Clean Diesel Average Age 10.3 All Other Average Age ,633 8,270 6,636 6,673 7,020 6,312 5,163 6,455 8,248 6,837 8,201 8,483 8,940 7,949 9,015 9,466 7,423 6,418 7,734 8,086 5,072 4,111 4,981 4,014 4,662 7,212 5,401 4,233 5,313 4,867 3,058 6,673 3,643 3,464 3,050 2,493 2,146 4,021 1,514 3,071 continued Chief Performance Officer 6 Metro Performance Report FY 2018 Page 31 of 47
32 KPI: BUS ON-TIME PERFORMANCE [TARGET 79%] BUS LOADING - Q3/FY 2018 TOP 10 ROUTES BY JURISDICTION Route Service Code Line Name Name DC MD VA Time Period Highest Passenger Load Max Load Factor Performance Threshold Georgia Ave - 7th Street 70 AM Peak Below Threshold < 0.3 Max Load Factor 16th Street S2 AM Peak Standards Compliant Georgia Ave - 7th Street 70 Midday Occasional Crowding th Street 54 PM Peak Recurring Crowding Georgia Ave - 7th Street 79 PM Peak Regular Crowding Georgia Ave - 7th Street 79 AM Peak Continuous Crowding > 1.3 Fort Totten - Petworth 63 AM Peak Highest passenger load = the average of all the Anacostia - Fort Drum A6 PM Peak highest max loads recorded by route, trip and time period 16th Street S9 AM Peak Passenger Loads: 14th Street 59 AM Peak ' Bus (standard size) accommodates 40 sitting New Carrollton - Silver Spring F4 PM Peak and 69 with standing Fairland Georgia Avenue - Maryland New Hampshire Ave - Maryland Annapolis Road Z8 Y8 K6 T18 Midday Midday PM Peak AM Peak ' Bus (articulated) accommodates 61 sitting and 112 with standing * Route has articulated buses, allowing for passenger load above 100 Calverton - Westfarm Z6 Midday Load Factor = highest passenger load divided by actual bus seats used Riggs Road R2 PM Peak Takoma - Fort Totten K6 Midday Viers Mill Road Q4 Midday Annapolis Road T18 PM Peak Alexandria - Fairfax 29K PM Peak Lincolnia - North Fairlington 7Y PM Peak Columbia Pike - Farragut Square 16Y AM Peak Leesburg Pike 28A AM Peak Columbia Pike - Farragut Square 16Y PM Peak Lee Highway - Farragut Square 3Y AM Peak Ballston - Farragut Square 38B PM Peak Ballston - Farragut Square 38B AM Peak Burke Center 18P PM Peak Mt. Vernon Express 11 Y PM Peak continued Chief Performance Officer 7 Metro Performance Report FY 2018 Page 32 of 47
33 KPI: METROACCESS ON-TIME PERFORMANCE [TARGET 92%] FY % 95% 94% 93% 93% 94% 94% 93% 93% 93% 93% 92% 94% FY % 91% 84% 83% 84% 87% 88% 87% 85% 88% 87% 92% 87% FY % 91% 90% 93% 93% 94% 94% 92% 93% 92% ESCALATOR SYSTEM AVAILABILITY [TARGET 93%] FY % 93% 93% 93% 93% 93% 94% 93% 94% 94% 93% 93% 93% FY % 92% 93% 94% 94% 94% 95% 95% 96% 96% 96% 95% 94% FY % 94% 95% 94% 94% 94% 93% 93% 93% 94% ELEVATOR SYSTEM AVAILABILITY [TARGET 97%] FY % 97% 96% 96% 96% 97% 97% 97% 97% 97% 97% 97% 97% FY % 97% 97% 97% 97% 97% 96% 97% 97% 97% 98% 97% 97% FY % 97% 97% 97% 97% 98% 97% 97% 97% 97% KPI: METROBUS CUSTOMER SATISFACTION RATING Q1 Q2 Q3 Q4 FYTD FY % 81% 74% 78% 74% FY % 79% 74% 76% 74% FY % 72% 75% 75% KPI: METRORAIL CUSTOMER SATISFACTION RATING Q1 Q2 Q3 Q4 FYTD FY % 69% 68% 66% 68% FY % 66% 69% 72% 69% FY % 73% 76% 76% continued Chief Performance Officer 8 Metro Performance Report FY 2018 Page 33 of 47


34 Safety & Security Performance Data July - December 2017 RED SIGNAL OVERRUNS FY FY FIRE AND SMOKE INCIDENTS FY Non-Electrical Cable Arcing Insulator Train Component FY Non-Electrical Cable Arcing Insulator Train Component RAIL COLLISIONS FY FY continued Chief Performance Officer 9 Metro Performance Report FY 2018 Page 34 of 47
35 DERAILMENTS FY Trains Carrying Customers Trains with No Customers Roadway Maintenance Machines FY Trains Carrying Customers Trains with No Customers Roadway Maintenance Machines BUS COLLISION RATE [PER MILLION VEHICLE MILES] FY Non-Preventable Preventable FY Non-Preventable Preventable BUS PEDESTRIAN STRIKES [PEDESTRIAN / CYCLIST STRIKES] FY FY continued Chief Performance Officer 10 Metro Performance Report FY 2018 Page 35 of 47
36 CUSTOMER INJURY RATE (PER MILLION PASSENGERS) [TARGET 1.75] FY FY FY *Includes Metrobus, Metrorail, rail transit facilities (stations, escalators and parking facilities) and MetroAccess customer injuries RAIL CUSTOMER INJURY RATE (PER MILLION PASSENGERS) FY Non-Preventable Preventable FY Non-Preventable Preventable FY Non-Preventable Preventable BUS CUSTOMER INJURY RATE (PER MILLION PASSENGERS) FY Non-Preventable Preventable FY Non-Preventable Preventable FY Non-Preventable Preventable continued Chief Performance Officer 11 Metro Performance Report FY 2018 Page 36 of 47
37 METROACCESS CUSTOMER INJURY RATE (PER 100,000 PASSENGERS) FY Non-Preventable Preventable FY Non-Preventable Preventable FY Non-Preventable Preventable continued Chief Performance Officer 12 Metro Performance Report FY 2018 Page 37 of 47
38 EMPLOYEE INJURY RATE (PER 200,000 HOURS) [TARGET 5.1] FY FY FY RAIL EMPLOYEE INJURY RATE (PER 100 EMPLOYEES) FY Non-Preventable Preventable FY Non-Preventable Preventable FY Non-Preventable Preventable BUS EMPLOYEE INJURY RATE (PER 100 EMPLOYEES) FY Non-Preventable Preventable FY Non-Preventable Preventable FY Non-Preventable Preventable continued Chief Performance Officer 13 Metro Performance Report FY 2018 Page 38 of 47
39 KPI: PART I CRIME RATE [PER MILLION PASSENGERS] FY FY FY KPI: PART I CRIMES [TARGET 1,750 PART I CRIMES] FY ,282 FY ,096 FY PART I CRIMES BY TYPE Property Crime Larceny (Snatch/ Pickpocket) Larceny (Other) Burglary Motor Vehicle Theft Attempted M V Theft Arson Violent Crime Aggravated Assault Rape Robbery FY 2018 Part1 Crimes FY 2018 Homicides * Homicides that occur on WMATA property are investigated by other law enforcement agencies. These cases are shown for public information; however, the cases are reported by the outside agency and are not included in MTPD crime statistics. continued Chief Performance Officer 14 Metro Performance Report FY 2018 Page 39 of 47
40 $ Fiscal Responsibility Performance Data July - December 2017 KPI: RIDERSHIP BY MODE [BUDGET FORECAST MILLION] Total Access Bus Rail Forecast 15,529,935 15,886,945 14,994,420 15,708,440 13,566,380 13,209,370 13,209,370 13,030,865 15,708, ,844,165 Actual 15,195,047 15,291,378 14,446,237 15,760,054 13,957,496 12,382,372 13,339,253 12,647,489 15,043, ,062,416 Forecast 9,942,000 10,481,000 10,060,100 10,503,000 9,346,000 9,076,000 9,007,000 8,855,000 9,825,000 87,095,000 Actual 9,375,256 10,042,871 9,798,585 10,182,688 9,171,025 8,404,418 8,505,233 8,310,981 8,826,152 82,617,209 Forecast 195, , , , , , , , ,000 1,767,000 Actual 186, , , , , , , , ,253 1,726,400 Forecast 25,666,935 26,577,945 25,255,420 26,425,440 23,104,380 22,482,370 22,390,370 22,066,865 25, ,706,165 Actual 24,757,002 25,540,263 24,435,872 26,149,149 23,322,495 20,969,701 22,028,107 21,140,941 24,062, ,406,025 KPI: BUDGET MANAGEMENT [TARGET 0 2 % FAVORABLE] Expense Variance ($) Revenue Variance ($) Net Subsidy Variance ($) Expense Variance (%) Revenue Variance (%) Net Subsidy Variance (%) Favorable (+) / Unfavorable (-) ($7) ($25) ($27) ($31) ($32) ($31) ($24) ($27) ($38) ($38) ($2) ($5) ($9) ($10) ($9) ($10) ($9) ($13) ($19) ($19) ($5) ($20) ($19) ($22) ($23) ($21) ($4) ($4) ($12) ($12) -5% -8% -6% -5% -4% -3% -2% -2% -3% -3% -2% -4% -4% -3% -2% -2% -2% -2% -3% -3% -6% -13% -8% -7% -6% -4% -1% -1% -2% -2% 4% 7% 4% 4% 3% 2% 0% 0% 1% 1% continued Chief Performance Officer 15 Metro Performance Report FY 2018 Page 40 of 47
41 KPI: CAPITAL FUNDS INVESTED [TARGET 95% OF CAPITAL BUDGET] FY % 6% 16% 17% 25% 34% 38% 44% 55% 58% 66% 85% 55% FY % 14% 25% 33% 41% 51% 59% 66% 74% 82% 89% 99% 74% FY % 12% 18% 26% 33% 40% 47% 55% 65% 65% *FY2017 includes capital budget amendment ($1.175 billion) VACANCY RATE [TARGET 5%] FY % 6% 7% 7% 7% 7% 7% 7% 7% 7% 7% 7% 7% FY % 5% 5% 5% 5% 5% 5% 5% 5% 5% 6% 7% 5% FY % 7% 7% 6% 7% 7% 6% 6% 7% 7% OPERATIONS CRITICAL VACANCY RATE [TARGET 9%] FY % 11 % 12% 12% 10% 11 % 12% FY % 10% 10% 8% 8% 8% 7% 7% 7% 8% 8% 11 % 7% FY % 12% 13% 12% 12% 12% 11 % 11 % 11 % 11 % continued Chief Performance Officer 16 Metro Performance Report FY 2018 Page 41 of 47
42 WATER USAGE (GALLONS PER VEHICLE MILE) [TARGET 0.84] FY FY FY ENERGY USAGE (BTU/VEHICLE MILE) [TARGET 39,399] FY ,193 41,349 39,798 39,262 37,639 42,240 47,371 43,640 37,952 38,660 37,365 39,565 40,921 FY ,404 39,734 44,477 37,665 38,352 40,112 45,493 42,813 39,927 40,877 36,782 41,244 41,180 FY ,548 38,877 40,337 36,266 38,773 40,066 44,078 42,060 36,393 39,764 GREENHOUSE GAS EMISSIONS PER VEHICLE MILE [TARGET 4.00] FY FY FY continued Chief Performance Officer 17 Metro Performance Report FY 2018 Page 42 of 47
43 Definitions KPI How is it measured? What does this mean and why is it key to our strategy? QUALITY SERVICE Metrorail Customer On-Time Performance Rail Infrastructure Availability FTA Reportable Speed Restrictions (Federal Transit Administration Transit Asset Management Performance Measure) Train On-Time Performance Percentage of customer journeys completed on time Number of journeys completed on time Total number of journeys Percentage of track available for customer travel during operating hours Percentage of track segments with performance restrictions at 9:00 AM the first Wednesday of every month Number of track miles with performance restrictions 234 total miles Number of station stops delivered within the scheduled headway plus 2 minutes during rush (AM/PM) service Total station stops delivered Number of station stops delivered up to 150% of the scheduled headway during non-rush (midday and evening) Total station stops delivered Rail Customer On-Time Performance (OTP) communicates the reliability of rail service, which is a key driver of customer satisfaction. OTP measures the percentage of customers who complete their journey within the maximum amount of time it should take per WMATA service standards. The maximum time is equal to the train run-time + a headway (scheduled train frequency) + several minutes to walk between the fare gates and platform. These standards vary by line, time of day, and day of the week. Actual journey time is calculated from the time a customer taps a SmarTrip card to enter the system, to the time when the SmarTrip card is tapped to exit. Factors that can effect OTP include: railcar availability, fare gate availability, elevator and escalator availability, infrastructure conditions, speed restrictions, single-tracking around scheduled track work, railcar delays (e.g., doors), or delays caused by sick passengers. Rail Infrastructure Availability is a key driver of customer on-time performance. Planned and unplanned maintenance of track, signaling, and traction power can result in single-tracking and/or speed restrictions that slow customer travel throughout the system. This measure includes both the duration and distance of restrictions. Single-tracking events reduce availability to zero for the portion of track impacted. Slow speed restrictions reduce availability of affected track segments by 85%, while medium restrictions reduce availability by 40%. In 2016, the Federal Transit Administration (FTA) issued its Final Rule on Transit Asset Management, which requires transit properties to set targets and report performance on a variety of measures, including guideway condition. Guideway includes track, signals and systems. A performance restriction occurs when there is a speed restriction: the maximum train speed is set below the guideway design speed. Performance restrictions may result from a variety of causes, including defects, signaling issues, construction zones, and maintenance causes. FTA considers performance restrictions to be a proxy for both track condition and the underlying guideway condition. Train on-time performance measures the adherence to weekday headways, or the time customers wait between trains. Factors that can effect on-time performance include: infrastructure conditions, missed dispatches, railcar delays (e.g., doors), or delays caused by sick passengers. Station stops are tracked system-wide, with the exception of terminal and turn-back stations. Chief Performance Officer 18 Metro Performance Report FY 2018 Page 43 of 47
44 KPI How is it measured? What does this mean and why is it key to our strategy? Rail Fleet Reliability Trains in Service Rail Loading Metrobus On-Time Performance Bus Fleet Reliability Mean Distance Between Delays (MDBD) Total railcar revenue miles Number of failures during revenue service resulting in delays of four or more minutes Mean Distance Between Failure (MDBF) Total railcar revenue miles Total number of failures occurring during revenue service Percentage of required trains that are in service at 8:15 AM and 5:00PM Number of Trains in service Total required trains Number of rail passengers per car Total passengers observed on-board trains passing through a station during a rush hour Actual number of cars passing through the same station during the rush hour Trained Metro observers are strategically placed around the system during its busiest times to monitor and report on crowding. Counts are taken at select stations where passenger loads are the highest and in the predominant flow direction of travel on one to two dates each month (from 6 AM to 10 AM and from 3 PM to 7 PM). In order to represent an average day, counts are normalized with rush ridership. Adherence to Schedule Number of time points that arrived on time by route based on a window of 2 minutes early and 7 minutes late Total number of time points scheduled (by route) Mean Distance Between Failures (MDBF) The number of total miles traveled before a mechanical breakdown requiring the bus to be removed from service or deviate from the schedule The number of miles traveled before a railcar experiences a failure. Some car failures result in inconvenience or discomfort, but do not always result in a delay of service (such as hot cars). Mean Distance Between Delay includes those failures that had an impact on customer on-time performance. Mean Distance Between Failure and Mean Distance Between Delay communicate the effectiveness of Metro s railcar maintenance and engineering program. Factors that influence railcar reliability are the age and design of the railcars, the amount the railcars are used, the frequency and quality of preventive maintenance, and the interaction between railcars and the track. Trains in Service is a key driver of customer on-time performance and supports the ability to meet the Board standard for crowding. WMATA s base rail schedule requires 140 trains during rush periods. Fewer trains than required results in missed dispatches, which leads to longer wait times for customers and more crowded conditions. Key drivers of train availability include the size of the total fleet and the number of spares, railcar reliability and average time to repair, operator availability, and balancing cars across rail yards to ensure that the right cars are in the right place at the right time. The Board of Directors has established Board standards of rail passengers per car to measure railcar crowding. Car crowding informs decision making regarding asset investments and scheduling. Additional Board standards have been set for: SSHours of service the Metrorail system is open to service customers SSHeadway scheduled time interval between trains during normal weekday service This indicator illustrates how closely Metrobus adheres to published route schedules on a system-wide basis. Factors that effect on-time performance are traffic congestion, inclement weather, scheduling, vehicle reliability, and operational behavior. Bus on-time performance is essential to delivering quality service to the customer. Mean Distance Between Failures is used to monitor trends in vehicle breakdowns that cause buses to go out of service and to plan corrective actions. Factors that influence bus fleet reliability include vehicle age, quality of maintenance program, original vehicle quality, and road conditions affected by inclement weather and road construction. Chief Performance Officer 19 Metro Performance Report FY 2018 Page 44 of 47
45 KPI How is it measured? What does this mean and why is it key to our strategy? Bus Loading MetroAccess On-Time Performance Elevator and Escalator Availability Customer Satisfaction Ratio of bus seats filled Top load recorded on a route during a time period actual bus seat capacity Adherence to Schedule Number of vehicle arrivals at the pick-up location within the 30 minute on-time widow Total trips delivered In-service percentage Hours in service Operating hours Hours in service = Operating hours Hours out of service Operating hours = Operating hours per unit number of units Survey respondent rating Number of survey respondents with high satisfaction Total number of survey respondents Bus crowding is a factor of bus customer satisfaction. This measure can inform decision making regarding bus service plans. This indicator illustrates how closely MetroAccess adheres to customer pick-up windows on a systemwide basis. Factors that effect on-time performance are traffic congestion, inclement weather, scheduling, vehicle reliability, and operational behavior. MetroAccess on-time performance is essential to delivering quality service to the customer. Escalator/elevator availability is a key component of customer satisfaction with Metrorail service. This measure communicates system-wide escalator and elevator performance (at all stations over the course of the day) and will vary from an individual customer s experience. Availability is the percentage of time that Metrorail escalators or elevators in stations and parking garages are in service during operating hours. Customers access Metrorail stations via escalators to the train platform, while elevators provide an accessible path of travel for persons with disabilities, seniors, customers with strollers, and travelers carrying luggage. An out-of-service escalator requires walking up or down a stopped escalator, which can add to travel time and may make stations inaccessible to some customers. When an elevator is out of service, Metro is required to provide alternative services which may include shuttle bus service to another station. Surveying customers about the quality of Metro s service delivery provides a mechanism to continually identify those areas of the operation where actions to improve the service can maximize rider satisfaction. Customer satisfaction is defined as the percent of survey respondents who rated their last trip on Metrobus or Metrorail as very satisfactory or satisfactory. The survey is conducted via phone with approximately 400 bus and 400 rail customers who have ridden Metro in the past 30 days. Results are summarized by quarter (e.g., January March). SAFETY AND SECURITY Customer Injury Rate Customer injury rate: Number of injuries (Number of passengers 1,000,000) The customer injury rate is based on National Transit Database (NTD) Reporting criteria. It includes injury to any customer caused by some aspect of Metro s operation that requires immediate medical attention away from the scene of the injury. Customer safety is the highest priority for Metro and a key measure of quality service. Customers expect a safe and reliable ride each day. The customer injury rate is an indicator of how well the service is meeting this safety objective. Chief Performance Officer 20 Metro Performance Report FY 2018 Page 45 of 47
46 KPI How is it measured? What does this mean and why is it key to our strategy? Employee Injury Rate Employee injury rate: Number of injuries (Total work hours 200,000) An employee injury is recorded when the injury is (a) work related; and, (b) one or more of the following happens to the employee: 1) receives medical treatment above first aid, 2) loses consciousness, 3) takes off days away from work, 4) is restricted in their ability to do their job, 5) is transferred to another job, 6) death. OSHA recordable injuries are a key indicator of how safe employees are in the workplace. Crime Reported Part I Crimes Part I crimes reported to Metro Transit Police Department for Metrobus (on buses), Metrorail (on trains and in rail stations), or at Metro-owned parking lots in relation to Metro s monthly passenger trips. This measure provides an indicator of the perception of safety and security customers experience when traveling the Metro system. Increases or decreases in crime statistics can have a direct effect on whether customers feel safe in the system. PEOPLE AND ASSETS Ridership Total Metro ridership Metrorail passenger trips + Metrobus passenger boardings + MetroAccess passenger trips Operating Budget Management Percentage favorable or unfavorable comparing actual revenues and subsidy to actual expenses (actual revenues + subsidy actual expenses) actual expenses Ridership is a measure of total service consumed and an indicator of value to the region. Drivers of this indicator include service quality and accessibility. Passenger trips are defined as follows: SS SS SS Metrorail reports passenger trips. A passenger trip is counted when a customer enters through a faregate. In an example where a customer transfers between two trains to complete their travel one trip is counted. Metrobus reports passenger boardings. A passenger boarding is counted at the farebox when a customer boards a Metrobus. In an example where a customer transfers between two Metrobuses to complete their travel two trips are counted. MetroAccess reports passenger trips. A fare paying passenger traveling from an origin to a destination is counted as one passenger trip. *For performance measures and target setting, Metro uses total ridership numbers including passengers on bus shuttles to more fully reflect total passengers served. Metro does not include bus shuttle passenger trips in its budget or published ridership forecasts. This indicator tracks Metro s progress managing its operating revenues and expenses. Chief Performance Officer 21 Metro Performance Report FY 2018 Page 46 of 47
47 KPI How is it measured? What does this mean and why is it key to our strategy? Capital Funds Invested Percentage of capital budget spend Cumulative monthly capital expenditures fiscal year capital budget, including actual rollover from previous fiscal year This indicator tracks spending progress of the Metro Capital Improvement Program. Vacancy Rate Water Usage Energy Usage Greenhouse Gas Emissions Percentage of budgeted positions that are vacant (Number of budgeted positions number of employees in budgeted positions) number of budgeted positions Rate of gallons of water consumed per vehicle mile Total gallons of water consumed Total vehicle miles Rate of British Thermal Units (BTUs) consumed per vehicle mile MBTU(Gasoline + Natural Gas + Compressed Natural Gas + Traction Electricity + Facility Electricity) 1000 Total vehicles miles Rate of metric tons of CO 2 emitted per vehicle mile (CO 2 metric tons generated from gas, CNG and diesel used by Metro revenue and non-revenue vehicles + CO 2 metric tons generated from electricity and natural gas used by facilities and rail services) Total vehicle miles This measure indicates how well Metro is managing its human capital strategy to recruit new employees in a timely manner, in particular operations-critical positions. Factors influencing vacancy rate can include: recruitment activities, training schedules, availability of talent, promotions, retirements, among other factors. This measure reflects the level of water consumption Metro uses to run its operations. Water consumption is a key area of Metro s Sustainability Initiative, which brings focus to Metro s efforts to provide stewardship of the environmental systems that support the region. This measure reflects the level of various types of energy Metro uses to power its operations. Energy consumption is a key area of Metro s Sustainability Initiative, which brings focus to Metro s efforts to provide stewardship of the environmental systems that support the region. Greenhouse Gas emissions reflect how Metro sources its energy used to power its operations, as well as the amount of energy it uses. Reducing Greenhouse Gas emissions is a key area of Metro s Sustainability Initiative, which brings focus to Metro s efforts to provide stewardship of the environmental systems that support the region. Chief Performance Officer 22 Metro Performance Report FY 2018 Page 47 of 47
TRANSIT DEVELOPMENT PLAN: FISCAL YEARS Update
 TRANSIT DEVELOPMENT PLAN: FISCAL YEARS 2014-2019 Update The following will replace Chapter 5 of the Arlington Virginia Transit Development Plan: Fiscal Years 2011-2016 5.0 SIX-YEAR TRANSIT SERVICE AND
Report by Finance and Budget Committee (A) Washington Metropolitan Area Transit Authority Board Action/Information Summary
 Washington Metropolitan Area Transit Authority Board Action/Information Summary") Report by Finance and Budget Committee (A) 06-14-2018 Washington Metropolitan Area Transit Authority Board Action/Information Summary Action Information MEAD Number: 201995 Resolution: Yes No TITLE: FY2019
Report by Finance and Budget Committee (A) 06-14-2018 Washington Metropolitan Area Transit Authority Board Action/Information Summary Action Information MEAD Number: 201995 Resolution: Yes No TITLE: FY2019
Comprehensive Silver Line Plan & Title VI
 Customer Service and Operations Committee Board Action Item III-A April 11, 2013 Comprehensive Silver Line Plan & Title VI Page 3 of 28 Washington Metropolitan Area Transit Authority Board Action/Information
Fiscal Year 2016 Budget and Financial Plan Questions Washington Metropolitan Area Transit Authority
 Fiscal Year 2016 Budget and Financial Plan Questions Washington Metropolitan Area Transit Authority 1) Please provide a copy of WMATA s FY 2014 CAFR (WMATA has indicated that this will be completed in
DISTRICT OF COLUMBIA
 DISTRICT OF COLUMBIA 14TH STREET LINE ROUTES 52, 53, 54 BUDGET $470,000 annual reduction PROPOSED CHANGE Extend Route 52 to serve the Wharf development via 12th Street, Maine Avenue, and 7th Street SW
Metro Transit Police Department Riders Advisory Council Meeting September 21, 2011
 Metro Transit Police Department Riders Advisory Council Meeting September 21, 2011 Chief Michael Taborn Metro Transit Police Department 1 Metro Transit Police Department MISSION The mission of the Metro
Capital Investment Program
 Capital Investment Program FY08-FY13 DRAFT Massachusetts Bay Transportation Authority Draft FY08 FY13 Capital Investment Program Slide 1 Profile of the MBTA Fifth largest transit agency in America 4.5
Staff Recommendation:
 ITEM 14 Action March 29, 2017 Approval to Amend the FY 2017-2022 Transportation Improvement Program (TIP) for the Washington Metropolitan Area Transit Authority (WMATA) Staff Recommendation: Issues: Background:
Transit Operations Funding Sources
 Chapter 7. Funding Operations Funding Funding has increased about 56% in absolute terms between 1999 and 2008. There have been major variations in individual funding sources over this time, including the
LASD/Metro Transit Security Program
 Los Angeles County Metropolitan Transportation Authority LASD/Metro Transit Security Program Board of Directors Meeting December 4, 2008 1 Metro s Proposed Security Model Contract Framework: FTE - based
Part I. Federal Section 5310 Program
 Part I. Federal Section 5310 Program ENHANCED MOBILITY OF SENIORS AND INDIVIDUALS WITH DISABILITIES FY 2017 Solicitation for Proposals 5 PROGRAM GOALS & FUND AVAILABILITY The goals of the Section 5310
Report by Finance and Administration Committee (A) Washington Metropolitan Area Transit Authority Board Action/Information Summary
 Washington Metropolitan Area Transit Authority Board Action/Information Summary") Report by Finance and Administration Committee (A) 07-25-2013 Washington Metropolitan Area Transit Authority Board Action/Information Summary Action Information MEAD Number: 200211 Resolution: Yes No TITLE:
Report by Finance and Administration Committee (A) 07-25-2013 Washington Metropolitan Area Transit Authority Board Action/Information Summary Action Information MEAD Number: 200211 Resolution: Yes No TITLE:
BROWARD COUNTY TRANSIT MAJOR SERVICE CHANGE TO 595 EXPRESS SUNRISE - FORT LAUDERDALE. A Title VI Service Equity Analysis
 BROWARD COUNTY TRANSIT MAJOR SERVICE CHANGE TO 595 EXPRESS SUNRISE - FORT LAUDERDALE A Title VI Service Equity Analysis Prepared September 2015 Submitted for compliance with Title VI of the Civil Rights
On May 21, the TPB approved
 TPBnews A Publication of the National Capital Region Transportation Planning Board Volume XXI, Issue 11 June 2014 Board Approves Transportation Alternatives Projects for Northern Virginia On May 21, the
Call to Order Second Vice-Chair McEntee called the September 11, 2017 Bus and Rail Subcommittee (BRS) meeting to order at 4:00 pm.
 meeting to order at 4:00 pm.") AAC Accessibility Advisory Committee 600 Fifth Street NW Washington, DC 20001 202-962-6060 BUS AND RAIL SUBCOMMITTEE MEETING MINUTES: September 11, 2017 In attendance: Edward McEntee (2nd Vice-Chair),
AAC Accessibility Advisory Committee 600 Fifth Street NW Washington, DC 20001 202-962-6060 BUS AND RAIL SUBCOMMITTEE MEETING MINUTES: September 11, 2017 In attendance: Edward McEntee (2nd Vice-Chair),
SHREWSBURY POLICE DEPARTMENT
 SHREWSBURY POLICE DEPARTMENT 26 ANNUAL REPORT Internationally Recognized Shrewsbury Police 26 Annual Report Part 1 Crimes Part 1 Crimes: 22 23 24 25 26 % Change Criminal Homicide: Murder (non-negligent)
FY 2018 Application Support Guide
 Introduction FY 2018 Application Support Guide The I-66 Commuter Choice Program, as a related effort of the Virginia Department of Transportation s (VDOT) Transform66 Inside the Beltway Project, will leverage
A. Amend the FY LACMTA Budget to add $3,000,000 from Measure R 3% Commuter Rail funds for the Rancho Vista Grade Separation Project
 17 One Gateway Plaza Los Angeles, CA 90012-2952 213.922.2000 Tel metro. net PLANNING AND PROGRAMMING COMMITTEE SEPTEMBER 19, 2012 SUBJECT: ACTION: RANCHO VISTA GRADE SEPARATION AND REGIONAL RAIL UPDATE
ITEM 12 - Information March 18, 2015
 ITEM 12 - Information March 18, 2015 Briefing on the Implementation of the TPB Regional Priority Bus Project under the Transportation Investments Generating Economic Recovery (TIGER) Program Staff Recommendation:
Federal Transit Administration: Section Enhanced Mobility of Seniors and Individuals with Disabilities. Call for Projects.
 Federal Transit Administration: Section 5310 Enhanced Mobility of Seniors and Individuals with Disabilities Call for Projects Fiscal Year 2017 July 24, 2017 TABLE OF CONTENTS ABOUT THE GRANT PROGRAM...
STRATEGIC PLANNING COMMITTEE AGENDA
 Interurban Transit Partnership STRATEGIC PLANNING COMMITTEE MEMBERS Charis Austin Aaron Smith Rosalynn Bliss Paul Troost Jack Hoffman, Chair Michael Verhulst Stephen Kepley STRATEGIC PLANNING COMMITTEE
CITY OF COLUMBIA. Columbia Police Department. Proposed Police Emergency Vehicle Operation and Motor Vehicle Pursuit Policy
 CITY OF COLUMBIA Columbia Police Department February 28, 2013 To: Teresa Wilson, City Manager From: Randy Scott, Chief of Police Re: Proposed Policy The enclosed proposed Policy is submitted to update
FEDERAL FISCAL YEAR TOLEDO OH - MI URBANIZED AREA JOB ACCESS AND REVERSE COMMUTE PROGRAM & NEW FREEDOM PROGRAM REQUEST FOR PROPOSALS
 FEDERAL FISCAL YEAR 2010-11 TOLEDO OH - MI URBANIZED AREA JOB ACCESS AND REVERSE COMMUTE PROGRAM & NEW FREEDOM PROGRAM REQUEST FOR PROPOSALS Section 5316 - Job Access and Reverse Commute Program Section
SECTION 5310 FUNDING APPLICATION Enhanced Mobility of Seniors and Individuals with Disabilities
 SAVE Rail and Public Transit SECTION 5310 FUNDING APPLICATION Enhanced Mobility of Seniors and Individuals with Disabilities Applicant Information I am the Special Transportation Fund Agency... Yes No
Transportation & Parking Advisory Committee
 December 6, 2017 Transportation & Parking Advisory Committee Scott Silsdorf, AICP Director of Transportation and Parking Services Agenda Introductions Department Updates Mobile App is live Spring semester
METRO Blue Line LRT & METRO Green Line LRT (Light Rail) Table of Contents. Operating Grant Worksheets Pages 6-17
 Table of Contents. Operating Grant Worksheets Pages 6-17") METRO Blue Line LRT & METRO Green Line LRT (Light Rail) Table of Contents Operating Grant Application Cover Sheet Pages 1-3 Project Benchmarks and Timeline Pages 4-5 Operating Grant Worksheets Pages 6-17
METRO Blue Line LRT & METRO Green Line LRT (Light Rail) Table of Contents Operating Grant Application Cover Sheet Pages 1-3 Project Benchmarks and Timeline Pages 4-5 Operating Grant Worksheets Pages 6-17
METRO. FY2007 Quarterly Financial & Management Report. First Quarter Ending December 31, 2006 INDEX
 METRO FY2007 Quarterly Financial & Management Report INDEX Page Highlights Route for University Line Narrowed to 3 Alternatives 1 Finalists Selected for METRO Solutions Public Art Program 1 METRO Solutions
Urban Partnership Communications Plan
 Urban Partnership Communications Plan CONTENTS URBAN PARTNERSHIP OVERVIEW 01 COMMUNICATIONS PLAN 02 TOLLING 04 TRANSIT 05 TECHNOLOGY 06 TRANSPORTATION DEMAND MANAGEMENT 07 APPENDICES A: SR 520 Bridge Tolling
Public Hearing Staff Report and Title VI Equity Analysis FY2018 Metrobus Public Hearing
 Finance Committee Information Item III-B November 2, 2017 Public Hearing Staff Report and Title VI Equity Analysis FY2018 Metrobus Public Hearing Washington Metropolitan Area Transit Authority Board Action/Information
2018 POLICY FRAMEWORK FOR PSRC S FEDERAL FUNDS
 2018 POLICY FRAMEWORK FOR PSRC S FEDERAL FUNDS TABLE OF CONTENTS Section 1: Background... 3 A. Policy Framework... 3 B. Development of the 2019-2022 Regional Transportation Improvement Program (TIP)..
2017 CALL FOR PROJECTS & FUNDING APPLICATION
 2017 CALL FOR PROJECTS & FUNDING APPLICATION FOR THE LAREDO URBANIZED AREA ENHANCED MOBILITY OF SENIORS AND INDIVIDUALS WITH DISABILITIES FUNDING PROGRAM (SECTION 5310) 5310 Call for Projects and Funding
SFRTA/TRI-RAIL PAST, PRESENT & FUTURE
 SFRTA/TRI-RAIL PAST, PRESENT & FUTURE Presented by: Joseph Giulietti, Executive Director South Florida Regional Transportation Authority July 25, 2007 Tri-Rail History OVERVIEW South Florida Regional Transportation
ARLINGTON COUNTY, VIRGINIA. County Board Agenda Item Meeting of July 14, 2018
 ARLINGTON COUNTY, VIRGINIA County Board Agenda Item Meeting of July 14, 2018 DATE: July 5, 2018 SUBJECT: Approval to Submit Applications to the Commonwealth of Virginia for the 2018 SMART SCALE Program
Federal Public Transportation Program: In Brief
 Federal Public Transportation Program: In Brief William J. Mallett Specialist in Transportation Policy December 2, 2013 Congressional Research Service 7-5700 www.crs.gov R42706 Contents Introduction...
NEW EMPLOYER CASE STUDIES
 The Commuter Information Source for Maryland, Virginia, and the District of Columbia Issue 4, Volume 18 Fall 2014 WHAT S INSIDE 2 Metro s Silver Line Shines 3 2015 Employer Recognition Awards Call for
Last Updated June 20, Goal: Service Development
 FY Goals, Strategies and Projects Last Updated June 20, MANAGEMENT ACTION PLAN (MAP) Goal: Service Development Strategies (those highlighted in bold indicate highest priority) 1. Provide routes and services
FUNDING SOURCES. Appendix I. Funding Sources
 Appendix I. Funding Sources FUNDING SOURCES planning and related efforts can be funded through a variety of local, state, and federal sources. However, these revenues have many guidelines in terms of how
Texas Department of Transportation Page 1 of 71 Public Transportation. (a) Applicability. The United States Congress revised 49
 Applicability. The United States Congress revised 49") Texas Department of Transportation Page of 0 0 SUBCHAPTER C. FEDERAL PROGRAMS.. Section 0 Grant Program. (a) Applicability. The United States Congress revised U.S.C. 0, with the passage of Moving Ahead
Texas Department of Transportation Page of 0 0 SUBCHAPTER C. FEDERAL PROGRAMS.. Section 0 Grant Program. (a) Applicability. The United States Congress revised U.S.C. 0, with the passage of Moving Ahead
PUBLIC HEARING FY 2017 AND FY 2018 OPERATING AND CAPITAL BUDGET. February 16, 2016 SFMTA Board of Directors
 PUBLIC HEARING FY 2017 AND FY 2018 OPERATING AND CAPITAL BUDGET February 16, 2016 SFMTA Board of Directors 1 Who We Are The SFMTA plans, designs, builds, operates, regulates and maintains one of the most
Telecommuting Patterns and Trends in the Pioneer Valley
 Telecommuting Patterns and Trends in the Pioneer Valley August 2011 Prepared under the direction of the Pioneer Valley Metropolitan Planning Organization Prepared by: Pioneer Valley Planning Commission
FORMULA GRANTS 5307 Urbanized Area 5337 State of Good Repair 5339 Bus and Bus Facilities Board of Directors Committee Meeting
 FORMULA GRANTS 5307 Urbanized Area 5337 State of Good Repair 5339 Bus and Bus Facilities Board of Directors Committee Meeting May 2014 What are 5307 Urbanized Area Formula Funds? Section 5307 formula funds
MID-HUDSON VALLEY TRANSPORTATION MANAGEMENT AREA JOB ACCESS AND REVERSE COMMUTE & NEW FREEDOM PROGRAMS GRANT APPLICATION.
 MID-HUDSON VALLEY TRANSPORTATION MANAGEMENT AREA JOB ACCESS AND REVERSE COMMUTE & NEW FREEDOM PROGRAMS GRANT APPLICATION January 2009 O C T C Introduction The three transportation councils within the Mid-Hudson
Future Trends & Themes Summary. Presented to Executive Steering Committee: April 12, 2017
 Future Trends & Themes Summary Presented to Executive Steering Committee: April 12, 2017 Vision Workshop Regional/Local Themes The region and the Prince William area share the following key themes: Future
REGIONAL TRAVEL TRENDS
 REGIONAL TRAVEL TRENDS Robert Griffiths TPB Planning and Programming Director Transportation Planning Board April 20, 2016 Agenda Item 10 Regional Trend: Populations (Total Population in Millions) 6.00
Virginia Association of Counties
 Transportation in the Commonwealth: A Local Perspective Virginia Association of Counties November 11, 2013 Supervisor Jeff McKay Chairman, Fairfax County Board of Supervisors Transportation and Legislative
Request for Proposals (RFP) An Alternative Fuels Assessment & Feasibility Study
 An Alternative Fuels Assessment & Feasibility Study") Request for Proposals (RFP) An Alternative Fuels Assessment & Feasibility Study VTA Project # 2016-01 From: Subject: Angela E. Grant, Administrator Project VTA #2016-01 Request for Proposals An Alternative
Request for Proposals (RFP) An Alternative Fuels Assessment & Feasibility Study VTA Project # 2016-01 From: Subject: Angela E. Grant, Administrator Project VTA #2016-01 Request for Proposals An Alternative
Clarksville Police Department. Fiscal Year 2017 Budget Presentation
 Clarksville Police Department Fiscal Year 2017 Budget Presentation Objectives 1.Prepare for future growth 2.Safety of the citizens of Clarksville 3.Maintain Updated Technology 4.Maintain the professionalism
Gold Rush Circulator Study Charlotte, North Carolina REQUEST FOR PROPOSALS
 Gold Rush Circulator Study Charlotte, North Carolina REQUEST FOR PROPOSALS September 25, 2012 for the Gold Rush Circulator Study A. Purpose Charlotte Center City Partners (CCCP) and the City of Charlotte
Bureau of Services. Communications Division. Annual Report 2008
 Oakland Police Department Bureau of Services Communications Division Annual Report 2008 Table of Contents I. Division Functions / Responsibilities... 3 II. Staffing... 4 III. Fiscal Management... 6 IV.
National Capital Region Transportation Planning Board
 National Capital Region Transportation Planning Board 777 North Capitol Street, N.E., Suite 300, Washington, D.C. 20002-4290 (202) 962-3310 Fax: (202) 962-3202 Item #5 MEMORANDUM January 8, 2010 To: From:
Operations FY18 Proposed Budget Critical Hire Recommendations. March 27, 2017
 Operations FY18 Proposed Budget Critical Hire Recommendations March 27, 2017 Overview Operations Performance Improvements Since June 2015 Critical hires focused in Power Systems Maintenance, Signals/Communications
FISCAL YEAR TRIENNIAL PERFORMANCE REVIEW REPORT RECEIVE AND FILE FISCAL YEAR TRIENNIAL REVIEW REPORT
 16 One Gateway Plaza Los Angeles, CA 90012-2952 213.922.2000 Tel metro. net FINANCE, BUDGET AND ADUlT COMMITTEE JUNE 19, 2013 SUBJECT: FISCAL YEAR 2010-2012 TRIENNIAL PERFORMANCE REVIEW REPORT ACTION:
APPENDIX B BUS RAPID TRANSIT
 APPENDIX B BUS RAPID TRANSIT Table of Contents TABLE OF CONTENTS What is Bus Rapid Transit?... 2 BRT Features... 2 BRT Variations... 3 Where is BRT Currently Located?... 4 How Much Does BRT Cost?... 4
Sharing Economy for SDGs
 Sharing Economy for SDGs Dr. Li Jianhua Chief Development Officer DiDi world s largest mobility platform >450 million users >25 million rides/day >21 million flexible job opportunities DiDi milestones
Grand Forks. Police Department
 Grand Forks Police Department 2014 Annual Report Produced by: The Office of Professional Standards 701-787-8184 1 CONTENTS Table of Contents. 2 Mission and Values 3 Message from the Chief of Police....
MULTIMODAL TRANSPORTATION DISTRICT ALTERNATIVES ANALYSIS. Executive Summary
 MULTIMODAL TRANSPORTATION DISTRICT ALTERNATIVES ANALYSIS Executive Summary February 2015 Executive Summary 1. Define the Problem This Alternatives Analysis report is submitted as a deliverable for the
Grand Forks Police Department
 Grand Forks Police Department 2016 Annual Report Prepared by the Office of Professional Standards Mission Statement The Grand Forks Police Department, in partnership with a diverse community, is dedicated
METRO Orange Line Extension Planning and Implementation
 METRO Orange Line Extension Planning and Implementation December 9, 2015 Planning has begun for an extension of METRO Orange Line south from Burnsville to the Kenrick Avenue park and ride in Lakeville.
KEY TAKEAWAYS THE STIMULUS BREAKDOWN
 S T I M U L U S F O R G R E A T E R P H I L A D E L P H I A : W H A T I T M E A N S F O R T R A N S P O R T A T I O N I N V E S T M E N T I N T H E R E G I O N KEY TAKEAWAYS Greater Philadelphia will likely
 PUBLIC SAFETY COMMITTEE CRIME BRIEFING INDEX CRIME YEAR TO DATE 02/29/2012 CRIME TYPE Actual YTD Actual LYTD % CHG YTD Violent Crimes Murder 17 16 6.3% Rape 71 56 26.8% Robbery 599 467 28.3% Business 123
Long Range Transportation Plan
 Summary of Policy Governor in 2000. The baseline can The purpose of the Long Range also be considered as the scenario in Transportation Plan (LRTP) is to which no new transportation projects provide decision
REGIONAL TRANSIT FEASIBILITY PLAN
 REGIONAL TRANSIT FEASIBILITY PLAN The Regional Transit Feasibility Plan continues to make progress, having completed Steps One and Two of the process to evaluate opportunities for premium transit within
Valley Regional Transit Strategic Plan
 Valley Regional Transit Strategic Plan 2013-18 Background Valley Regional Transit Voters in Ada and Canyon counties approved the formation of a Regional Public Transit Authority (RPTA) in each of their
Signature: Signed by GNT Date Signed: 11/24/2013
 Atlanta Police Department Policy Manual Standard Operating Procedure Effective Date: December 2, 2013 Applicable To: All employees Approval Authority: Chief George N. Turner Signature: Signed by GNT Date
Job Access Reverse Commute Program & New Freedom Program 2013 FUNDING APPLICATION
 Job Access Reverse Commute Program & New Freedom Program 2013 FUNDING APPLICATION Important Dates 1. Pre-Application Workshop: 9 a.m. CST, Wednesday, February 13, 2013, Mid-America Regional Council, 600
Director Lea Militello Commander Mikail Ali Special Operations/MTA
 SFMTA Municipal Transportation Agency Image: a bus in front of the Palace of the Legion of honor Director Lea Militello Commander Mikail Ali Special Operations/MTA 02 05 2013 SAN FRANCISCO, CALIFORNIA
Agency Information (please print or type) RETURN TO APTA NO LATER THAN MARCH 31, By By fax:
 RETURN TO APTA NO LATER THAN MARCH 31, By By fax:") AMERICAN PUBLIC TRANSPORTATION ASSOCIATION OSP 2011 BUS SAFETY & =APTA-=== SECURITY EXCELLENCE AWARDS Nomination Form Category (check one) 0 Providing fewer than 4 million annual passenger trips IX. Providing
AMERICAN PUBLIC TRANSPORTATION ASSOCIATION OSP 2011 BUS SAFETY & =APTA-=== SECURITY EXCELLENCE AWARDS Nomination Form Category (check one) 0 Providing fewer than 4 million annual passenger trips IX. Providing
Regional Actions Supporting Improved Metrorail Emergency Response
 Regional Actions Supporting Improved Metrorail Emergency Response Update on first responder training, ROCC Liaison, leadership involvement, and the Metro Underground Communications Study Presentation to
Yale University 2017 Transportation Survey Report February 2018
 Walking and riding trollies to Yale Bowl for a football game. Photo courtesy of Yale University. Yale University 2017 Transportation Survey Report February 2018 A campus-wide transportation survey was
MTA Capital Program Amendments Renew. Enhance. Expand.
 MTA Capital Program Amendments Renew. Enhance. Expand. Capital Program Briefing May 2017 2015-2019 Program Amendment Highlights Program size has changed April 2016* May 2017 $29.6 b $32.5 b Level of state
Police - Departmental Performance Report. Police. Community
 - Departmental Performance Report The Mission of the Virginia Beach Department is to remain committed to providing a safe community and improving the quality of life for all people. This is accomplished
Dulles Corridor Metrorail Project
 Dulles Corridor Metrorail Project Proposed Transportation Management Plan Update Charlene Gus Robey Marcia McAllister July 25, 2007 Dulles Rail Project Tysons Situation Analysis 2nd largest business employment
Strategic Plan Objectives July 1, 2018 June 30, 2019
 Priority: Improve City Services and Delivery Goals: Streamline Permit Processing Priority: Efficiency and Smart Economic Growth Plan Goals: Amend Zoning Code Parking Requirements Revitalize East Main Street
Metro Mobility Agency Contract Award. Transportation Committee April 23, 2018
 Metro Mobility Agency Contract Award Transportation Committee April 23, 2018 Metro Mobility Contract Structure Contract Type Service Area Customer Description Trip Purpose Demand Contracts Agency Council
Toronto Animal Services Licence Compliance Targets Need to be More Aggressive: Audit Committee Item 5.3
 STAFF REPORT ACTION REQUIRED Toronto Animal Services Licence Compliance Targets Need to be More Aggressive: Audit Committee Item 5.3 Date: May 15, 2012 To: From: Wards: Reference Number: Licensing and
How Cisco Achieved Environmental Sustainability in the Connected Workplace
 How Cisco Achieved Environmental Sustainability in the Connected Workplace Cisco Connected Workplace aspires toward a green office environment. Cisco IT Case Study / Office Design / Green Office Design:
Fairfax County FY 2019 Advertised Budget The 2018 Economic Outlook Summit April 12, 2018 w w w. f a i r f a x c o u n t y. g o v / b u d g e t
 Fairfax County FY 2019 Advertised Budget The 2018 Economic Outlook Summit April 12, 2018 w w w. f a i r f a x c o u n t y. g o v / b u d g e t FY 2019 Advertised Budget Context Focuses on priority requirements
2018 Regional Project Evaluation Criteria For PSRC s FHWA Funds
 2018 Regional Project Evaluation Criteria For PSRC s FHWA Funds INTRODUCTION As described in the adopted 2018 Policy Framework for PSRC s Federal Funds, the policy focus for the 2018 project selection
Performance and Cost Data. police services
 Performance and Cost Data police services 15 PERFORMANCE MEASURES FOR POLICE SERVICES SERVICE DEFINITION Police Services consists of all police activities performed by sworn and non-sworn personnel. This
City Year Secret Shopper Program
 Customer Services, Operations, and Safety Committee Board Information Item IV-F September 24, 2009 City Year Secret Shopper Program Washington Metropolitan Area Transportation Authority Board Action/Information
Tuesday, April 24, 2018
 Tuesday, April 24, 2018 New Chief of Highway Police Drug Arrest PFC Emrick at the Alma weigh station Traffic Stop results in confiscating 232 pounds of marijuana. University of Arkansas College of Engineering
Global Annual Subway Ridership 1. Tokyo billion 2. Moscow billion 3. Seoul billion 4. New York City 1.
 Background New York City Subways and Buses is comprised of two agencies of the MTA regional transportation network MTA NYC Transit and MTA Bus. The regional network also includes MTA Staten Island Railway,
Peninsula Corridor Joint Powers Board Legislative Program
 Peninsula Corridor Joint Powers Board 2018 Legislative Program Purpose Legislative and regulatory actions have the potential to significantly benefit Peninsula Corridor Joint Powers Board (JPB) programs
RAZORBACK TRANSIT University of Arkansas 131 ADSB 155 Razorback Rd. Fayetteville, AR Phone: (479) Fax: (479)
 Fax: (479)") RAZORBACK TRANSIT University of Arkansas 131 ADSB 155 Razorback Rd. Fayetteville, AR 72701 Phone: (479) 575-6993 Fax: (479) 575-7128 Policies And Procedures For Paratransit Van Services For Disabled Persons
RAZORBACK TRANSIT University of Arkansas 131 ADSB 155 Razorback Rd. Fayetteville, AR 72701 Phone: (479) 575-6993 Fax: (479) 575-7128 Policies And Procedures For Paratransit Van Services For Disabled Persons
2018 and 2020 Regional Congestion Mitigation Air Quality Improvement Program (CMAQ) Grant Application
 Grant Application") 2018 and 2020 Regional Congestion Mitigation Air Quality Improvement Program (CMAQ) Grant Application PROJECT TITLE: INTERCITY TRANSIT BUS STOP ENHANCEMENTS TRPC use only GENERAL PROJECT INFORMATION Agency
2018 and 2020 Regional Congestion Mitigation Air Quality Improvement Program (CMAQ) Grant Application PROJECT TITLE: INTERCITY TRANSIT BUS STOP ENHANCEMENTS TRPC use only GENERAL PROJECT INFORMATION Agency
Virginia Railway Express
 Recommended Budget for Fiscal Year 2017 Amended Budget for Fiscal Year 2016 Six-Year Financial Forecast and Capital Improvement Program December 18, 2015 Table of Contents Recommended FY 2017 Budget Mission
NSL LINCOLNSHIRE HEALTHWATCH PRESENTATION Ambulance NHS Trust Provision of Non- Emergency Patient Transport
 NSL LINCOLNSHIRE HEALTHWATCH PRESENTATION Ambulance NHS Trust Provision of Non- Emergency Patient Transport Agenda An introduction to NSL Lincolnshire Contractual Service KPI s & Current Performance Eligibility
Cass County Rural Task Force Call for Projects Deadline: December 12, 2018
 Cass County Rural Task Force 2020-2023 Call for Projects Deadline: December 12, 2018 The Southwest Michigan Planning Commission (SWMPC) is pleased to announce the Call for Projects for the Cass County
Department of Transportation Governor s FY 2015 and FY 2016 Recommendations. Department of Transportation
 Department of Transportation Governor s FY 2015 and FY 2016 Recommendations Staff Presentation to the House Finance Committee May 7, 2015 Department of Transportation Central Management Director s Office
SUBJECT: REGIONAL RAlL PLANNING AND ENGINEERING BENCH AND REGIONAL RAlL UPDATE. INITIATE PROCESS TO ESTABLISH A REGIONAL RAlL BENCH
 @ Metro Metropolitan Transportation Authority One Gateway Plaza 2i3.9z2.zooo Tel Los Angeles, CA 90012-2952 metro.net PLANNING AND PROGRAMMING COMMITTEE April 18, 2012 SUBJECT: REGIONAL RAlL PLANNING AND
CITY COUNCIL STUDY SESSION MEMORANDUM
 City and County of Broomfield, Colorado CITY COUNCIL STUDY SESSION MEMORANDUM To: From: Prepared By: Mayor and City Council George Di Ciero, City and County Manager Debra Baskett, Transportation Manager
2007 SOLICITATION FOR FEDERAL TRANSPORTATION PROJECT FUNDING
 2007 SOLICITATION FOR FEDERAL TRANSPORTATION PROJECT FUNDING Under the Following Program: JOBS ACCESS REVERSE COMMUTE (JARC) METROPOLITAN COUNCIL MINNEAPOLIS-ST. PAUL METROPOLITAN AREA, MINNESOTA May 9,
Cardinal Bank & George Mason University
 Cardinal Bank & George Mason University 2th Annual Economic Conference Friday, January 13, 212 cra.gmu.edu Cardinal Bank/George Mason University 2 th Annual Economic Conference Is This a Recovery or What?
Appendix H Illinois DOT: Inventory of Services
 Appendix H Illinois DOT: Inventory of Services Downstate Illinois Human Services Transportation Plan Inventory of Services for Region (include Region #) Spring 2007 Reason for the Survey The Safe, Accountable,
FEDERAL FISCAL YEAR 2006 through 2010 TOLEDO OH - MI URBANIZED AREA JOB ACCESS AND REVERSE COMMUTE PROGRAM REQUIREMENTS AND COMPETITIVE APPLICATION
 FEDERAL FISCAL YEAR 2006 through 2010 TOLEDO OH - MI URBANIZED AREA JOB ACCESS AND REVERSE COMMUTE PROGRAM REQUIREMENTS AND COMPETITIVE APPLICATION Section 5316 - Job Access and Reverse Commute Program
Fixing America s Surface Transportation Act: FAST Act Implications for the Region
 Fixing America s Surface Transportation Act: FAST Act Implications for the Region Connie Kozlak Metropolitan Transportation Services Mark Fuhrmann Metro Transit Ed Petrie Metro Transit Metropolitan Council
ADMINISTRATIVE CODE BOARD OF COUNTY COMMISSIONERS
 ADMINISTRATIVE CODE BOARD OF COUNTY COMMISSIONERS CATEGORY: DEVELOPMENT/PLANNING/ZONING TITLE: TRANSPORTATION PROPORTIONATE SHARE CALCULATIONS FOR NEW DEVELOPMENT PROJECTS CODE NUMBER: AC-13-16 ADOPTED:
Results in Brief. Evaluation of the Rhode Island Avenue - Brentwood Station (RIABS) Incidents. OIG April 6, 2018
 Incidents. OIG April 6, 2018") 33 All publicly available OIG reports ( Results in Brief OIG 18 07 April 6, 2018 Why We Did This Review The Office of the Chief Operating Officer (COO), Rail Division, Office of Track and Structures (TRST)
33 All publicly available OIG reports ( Results in Brief OIG 18 07 April 6, 2018 Why We Did This Review The Office of the Chief Operating Officer (COO), Rail Division, Office of Track and Structures (TRST)
Emergency Department Throughput
 Emergency Department Throughput Patient Safety Quality Improvement Patient Experience Affordability Hoag Memorial Hospital Presbyterian One Hoag Drive Newport Beach, CA 92663 www.hoag.org Program Managers:
Grant Program Guidelines
 Expanded Wisconsin Fast Forward and WisDOT Grant Program Employment Transit Assistance Grants for Wisconsin Business Flexible Transportation Solutions for Regional Workforce Advancement Grants BACKGROUND