Improving Health Care Quality and Reducing Costs through Payment and Delivery System Reform
|
|
|
- Rose Crawford
- 5 years ago
- Views:
Transcription
1 Improving Health Care Quality and Reducing Costs through Payment and Delivery System Reform Harold D. Miller President and CEO Network for Regional Healthcare Improvement and Executive Director Center for Healthcare Quality and Payment Reform
2 Health Care Costs are the Core of the National Budget Problem Our health-care problem is our deficit problem. Nothing else even comes close. President Obama September
3 Federal Spending in Billions Medicare+Medicaid is Largest Driver of Future Federal Spending $2,500 $2,250 $2,000 $1,750 $1,500 $1,250 $1,000 $750 $500 $250 $0 -$250 Projected Increases in Federal Spending, Nondefense Discretionary Spending Defense Other Mandatory Spending Social Security Net Interest Medicare + Medicaid Offsetting Receipts 3
4 Federal Cost Containment Policy Choices Cut Services to Seniors? Cut Fees to Providers? MEDICARE SPENDING SERVICES = TO SENIORS X FEES TO PROVIDERS 4
5 If It s A Choice of Rationing or Rate Cuts, Which is More Likely? Cut Services to Seniors? Cut Fees to Providers? MEDICARE SPENDING SERVICES = TO SENIORS X FEES TO PROVIDERS Guess which one they ll try to reduce? 5
6 Past Solutions: Cost-Shifting Gov t Cuts to Private Payers Hospital Payment-to-Cost Ratios for Private Payers, Medicare, and Medicaid, % 130% 120% 110% 100% 90% 80% 70% Private Payer Medicare Medicaid Source: Avalere Health analysis of American Hospital Association Annual Survey data, 2008, for community hospitals. 6
7 Huge Increases in Costs for Both Employers & Workers $14,000 $12,000 $10,000 $8,000 Average Annual Contributions to Health Insurance Premiums Employer Contribution Worker Contribution Employer Contribution More Than Doubled $9,773 $6,000 $4,000 $2,000 $0 $1,878 $4,150 $318 $899 Single Coverage 1999 Single Coverage 2010 Employee Contribution Nearly Tripled $4,247 $1,543 Family Coverage 1999 $3,997 Family Coverage
8 Health Care Costs Have Wiped Out Real Income Gains $9,000 Monthly Income for Typical U.S. Family of Four $8,000 $7,000 $6,000 $5,000 $4,000 $3,000 $2,000 $1,000 $ $ 870 for inflation $ 945 for health care $ 95 for spending $1910 more income Inflation on Non- Health Care Goods Health Care Taxes, Premiums, Expenses Net Available Income Source: "A Decade of Heallth Care Cost Growth Has Wiped Out Real Income Gains For an Average US Family," Health Affairs, September
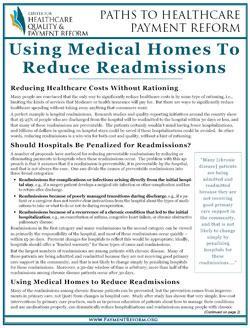
9 What We Need: A Way to Reduce Costs Without Rationing 9
10 What We Need: A Way to Reduce Costs Without Rationing It Can t Be Done from Washington......It Has to Happen at the Local Level, Where Health Care is Delivered. 10
11 Reducing Costs Without Rationing: Can It Be Done?? 11
12 Reducing Costs Without Rationing: Prevention and Wellness Healthy Consumer Continued Health Health Condition 12
13 Reducing Costs Without Rationing: Avoiding Hospitalizations Healthy Consumer Continued Health Health Condition No Hospitalization Acute Care Episode 13
14 Reducing Costs Without Rationing: Efficient, Successful Treatment Healthy Consumer Continued Health Health Condition No Hospitalization Acute Care Episode Efficient Successful Outcome High-Cost Successful Outcome Complications, Infections, Readmissions 14
15 Healthy Consumer Reducing Costs Without Rationing: Is Also Quality Improvement! Continued Health Health Condition Better Outcomes/Higher Quality No Hospitalization Acute Care Episode Efficient Successful Outcome High-Cost Successful Outcome Complications, Infections, Readmissions 15
16 How is Southeast Michigan Doing? Healthy Consumer Continued Health Health Condition No Hospitalization Acute Care Episode Efficient Successful Outcome High-Cost Successful Outcome Complications, Infections, Readmissions 16
17 Portland Sacramento Seattle San Jose San Francisco Minneapolis Washington San Diego Denver Charlotte Phoenix Providence Atlanta Milwaukee Norfolk Kansas City Baltimore Cincinnati Indianapolis Boston Columbus St. Louis Austin Cleveland San Antonio Philadelphia Manhattan Nashville New Orleans Orlando Chicago Las Vegas Pittsburgh Tampa Los Angeles Detroit Houston Dallas Miami Detroit Spends More Per Medicare Beneficiary Than Most Regions $18,000 Price, Age, Sex & Race-Adjusted Medicare Spending, 2008 $16,000 $14,000 $12,000 Detroit $10,000 $8,000 $6,000 $4,000 $2,000 $0 17
18 CA-San Francisco CA-San Jose CA-Sacramento OR-Portland RI-Providence LA-New Orleans CA-San Diego WA-Seattle CA-Los Angeles MA-Boston DC-Washington FL-Miami CO-Denver GA-Atlanta NV-Las Vegas NY-Manhattan TX-San Antonio NC-Charlotte TX-Austin VA-Norfolk IL-Chicago IN-Indianapolis TN-Nashville TX-Dallas PA-Philadelphia MO-Kansas City MN-Minneapolis OH-Cleveland OH-Cincinnati TX-Houston FL-Tampa AZ-Phoenix FL-Orlando WI-Milwaukee MD-Baltimore PA-Pittsburgh MO-St. Louis OH-Columbus MI-Detroit Detroit Residents Get Surgeries More Than Any Major Region All Surgical Discharges per 1,000 Medicare Enrollees (2007) Detroit
19 Bad Joints and Really Bad Hearts in Detroit Compared to U.S.? Rate of Surgery for Medicare Beneficiaries in Detroit vs. U.S., 2007 All Surgeries Hip Fracture Hip Replacement Fixing Bones & Joints Back Surgery Knee Replacement Fixing Hearts CABG PCI -10% 0% 10% 20% 30% 40% 50% 19
20 CA-San Francisco CA-San Jose CA-Los Angeles WA-Seattle CO-Denver CA-San Diego RI-Providence NY-Manhattan FL-Miami NC-Charlotte MA-Boston LA-New Orleans OR-Portland MN-Minneapolis PA-Philadelphia NV-Las Vegas CA-Sacramento DC-Washington IL-Chicago OH-Cincinnati TX-Austin TX-Houston FL-Tampa AZ-Phoenix GA-Atlanta IN-Indianapolis OH-Cleveland TX-Dallas VA-Norfolk MO-Kansas City TX-San Antonio MO-St. Louis PA-Pittsburgh FL-Orlando MD-Baltimore OH-Columbus WI-Milwaukee TN-Nashville MI-Detroit Detroit Does More CABGs Than Any Other Region 6 5 Coronary Artery Bypass Grafting (CABG) per 1,000 Medicare Enrollees (2007) Detroit
21 Seattle San Jose San Francisco Porrtland, OR Phoenix Sacramento Denver San Diego Minneapolis Austin Norfok Washington, DC Milwaukee Las Vegas Charlotte Los Angeles Atlanta Tampa New Orleans San Antonio Cincinnati Indianapolis Orlando Dallas New York Kansas City Boston Houston Providence Baltimore St. Louis Phialadelphia Cleveland Miami Chicago Columbus Nashville Detroit Pittsburgh Detroit Has 2 nd Highest Rate of Chronic Disease Admissions 60 Discharges for Asthma, COPD, Congestive Heart Failure, and Diabetes per 1,000 Medicare Enrollees (2007) Detroit
22 CO - Denver OR - Portland VA - Norfolk IN - Indianapolis GA - Atlanta MN - Minneapolis TX - Austin WI - Milwaukee NC - Charlotte WA - Seattle TX - San Antonio AZ - Phoenix CA - San Diego TX - Dallas CA - Sacramento OH - Columbus TX - Houston National CA - San Francisco FL - Tampa NV - Las Vegas CA - Los Angeles MO - Kansas City LA - New Orleans FL - Orlando RI - Providence OH - Cincinnati CA - San Jose DC - Washington FL - Miami TN - Nashville MA - Boston OH - Cleveland MO - St. Louis PA - Pittsburgh MI - Detroit PA - Philadelphia MD - Baltimore * IL - Chicago NY - Manhattan Above-Average Hospital Readmission Rates in SE MI 30% 30-Day Hospital Readmission Rates for Heart Failure Patients Detroit 25% 20% 15% 10% 5% 0% 22
23 25% of Heart Failure Patients Return to Hospital in 30 Days 30-Day Readmission Rate for Heart Failure Patients, SE MI Hospitals SINAI-GRACE HOSPITAL HENRY FORD HOSPITAL ST MARY MERCY HOSPITAL DETROIT RECEIVING HOSPITAL & UNIV HEALTH CENTER ST JOHN HOSPITAL AND MEDICAL CENTER WILLIAM BEAUMONT HOSPITAL-TROY HARPER UNIVERSITY HOSPITAL HURON VALLEY-SINAI HOSPITAL ST JOHN RIVER DISTRICT HOSPITAL BOTSFORD HOSPITAL OAKWOOD HOSPITAL AND MEDICAL CENTER OAKWOOD HERITAGE HOSPITAL GARDEN CITY HOSPITAL OAKWOOD ANNAPOLIS HOSPITAL PROVIDENCE HOSPITAL AND MEDICAL CENTERS ST JOHN MACOMB-OAKLAND HOSPITAL-MACOMB DOCTOR'S HOSPITAL OF MICHIGAN HENRY FORD MACOMB HOSPITAL LAPEER REGIONAL MEDICAL CENTER EDWARD W SPARROW HOSPITAL POH MEDICAL CENTER WILLIAM BEAUMONT HOSPITAL HENRY FORD WYANDOTTE HOSPITAL PORT HURON HOSPITAL BEAUMONT HOSPITAL, GROSSE POINTE CRITTENTON HOSPITAL MEDICAL CENTER MOUNT CLEMENS REGIONAL MEDICAL CENTER HENRY FORD WEST BLOOMFIELD HOSPITAL OAKWOOD SOUTHSHORE MEDICAL CENTER SAINT JOSEPH MERCY LIVINGSTON HOSPITAL ST JOSEPH MERCY OAKLAND ST JOSEPH MERCY PORT HURON 0% 5% 10% 15% 20% 25% 30% 35% 23
24 There Are Ways to Reduce Costs w/o Rationing in Southeast Mich.! Healthy Consumer Continued Health Health Condition No Hospitalization Acute Care Episode Efficient Successful Outcome High-Cost Successful Outcome Complications, Infections, Readmissions 24
25 Current Payment Systems Reward Bad Outcomes, Not Better Health Healthy Consumer Continued Health $ Health Condition No Hospitalization Acute Care Episode Efficient Successful Outcome High-Cost Successful Outcome Complications, Infections, Readmissions 25
26 Are There Better Ways to Pay for Health Care? Healthy Consumer $? Continued Health Health Condition No Hospitalization Acute Care Episode Efficient Successful Outcome High-Cost Successful Outcome Complications, Infections, Readmissions 26
27 Episode Payments to Reward Value Within Episodes Healthy Consumer Continued Health Health Condition $ A Single Payment For All Care Needed From All Providers in the Episode, With a Warranty For Complications No Hospitalization Acute Care Episode Episode Payment Efficient Successful Outcome High-Cost Successful Outcome Complications, Infections, Readmissions 27
28 Episode Payment = Bundling + Warranty Bundling: Making a single payment to two or more providers who are currently paid separately e.g., services of both a hospital and a physician e.g., both hospital and post-acute care services Warranty: Not charging/being paid more for costs of treating hospital-acquired infections, problems caused by errors, etc. 28
29 Cardiac Care is the Single Largest Category of Hospital Expenditure National Hospital Expenditures by Condition, 2008 Heart conditions Trauma-related disorders Normal birth/live born Cancer Osteoarthritis and other non-traumatic joint COPD, asthma Back problems Pneumonia Skin disorders Other circulatory conditions arteries, veins, Mental disorders Cerebrovascular disease $0 $10,000 $20,000 $30,000 $40,000 $50,000 $60,000 Expenditures in Millions 29
30 Example: Reducing Cost of Implanting Defibrillators COST TYPE TODAY Physician Fee $ 1,200 Device Cost $20,000 Other Hospital Cost $ 9,100 Hosp. Margin (3%) $ 900 Total Hospital Pmt $30,000 Total Cost to Payer $31,200 30
31 Physicians Could Help Hospitals Reduce Cost of Medical Devices COST TYPE TODAY CHANGE Physician Fee $ 1,200 Device Cost $20,000-10% ($2,000) Other Hospital Cost $ 9,100 Hosp. Margin $ 900 Total Hospital Pmt $30,000 Total Cost to Payer $31,200 31
32 Today: All Savings Goes to the Hospital, No Reward for Physician COST TYPE TODAY CHANGE SPLIT Physician Fee $ 1, % Device Cost $20,000-10% ($2,000) Other Hospital Cost $ 9,100 Hosp. Margin $ % ($2000) Total Hospital Pmt $30,000 Total Cost to Payer $31,200-0% 32
33 Bundling: Single Payment to Physicians and Hospital COST TYPE TODAY Physician Fee $ 1,200 Device Cost $20,000 Other Hospital Cost $ 9,100 Hosp. Margin $ 900 Total Cost to Payer $31,200 33
34 Bundling Allows Savings Split Among Docs, Hospital, Payers COST TYPE TODAY CHANGE SPLIT Physician Fee $ 1, % ($600) Device Cost $20,000-10% ($2,000) Other Hospital Cost $ 9,100 Hosp. Margin $ % ($450) Total Cost to Payer $31, % ($950) 34
35 So Defibrillator Implantation is Cheaper, But More Profitable COST TYPE TODAY CHANGE SPLIT NEW Physician Fee $ 1, % ($600) $ 1,800 Device Cost $20,000-10% ($2,000) $18,000 Other Hospital Cost $ 9,100 $ 9,100 Hosp. Margin $ % ($450) $ 1,350 Total Cost to Payer $31, % ($950) $30,250 Win-Win-Win for Physicians, Hospital, & Payer 35

36 $16,000 Variation in Avg Costs of Defibrillators Across CA Hospitals Source: Pacemaker and Implantable Cardioverter-Defibrillator Implant Procedures in California Hospitals, James C. Robinson and Emma L. Dolan, Berkeley Center for Health Technology 36
37 Many Other Savings Opportunities Better scheduling of scarce resources (e.g., surgery suites) to reduce both underutilization & overtime Standardization of equipment and supplies to facilitate bulk purchasing Less wastage of expensive supplies Reduced length of stay Moving procedures to lower-cost settings Etc. 37
38 What If There is Evidence of Overutilization? COST TYPE TODAY 200 Cases Physician Fee $ 1,200 $240,000 Device Cost $20,000 Other Hospital Cost $ 9,100 Hosp. Margin $ 900 $180,000 Total Hospital Pmt $30,000 Assume a study finds that 20% of procedures are unnecessary or can be avoided through medical management Total Cost to Payer $31,200 $6,240,000 38
39 Simply Reducing Utilization Can Hurt Hospitals & Physicians 20% Reduction in Cases COST TYPE TODAY 200 Cases TODAY 160 Cases Chg Physician Fee $ 1,200 $240,000 $ 1,200 $192,000-20% Device Cost $20,000 $20,000 Other Hospital Cost $ 9,100 $ 9,100 Hosp. Margin $ 900 $180,000 $ 900 $144,000-20% Total Hospital Pmt $30,000 $30,000 Total Cost to Payer $31,200 $6,240,000 $31,200 $4,992,000-20% Reducing the Number of Procedures Significantly Reduces Hospital/Physician Revenue 39
40 Bundling + Guidelines Can Avoid Harming Providers While Saving $ 20% Reduction in Cases COST TYPE TODAY 200 Cases NEW 160 Cases Chg Physician Fee $ 1,200 $240,000 $ 1,800 $288, % Device Cost $20,000 $18,000 Other Hospital Cost $ 9,100 $ 9,100 Hosp. Margin $ 900 $180,000 $ 1,350 $216, % Total Cost to Payer $31,200 $6,240,000 $30,250 $4,840,000-22% Reducing the Cost of the Procedure Can Enable Higher Margins Even With Fewer Procedures 40
41 Episode Payment = Bundling + Warranty Bundling: Making a single payment to two or more providers who are currently paid separately e.g., services of both a hospital and a physician e.g., both hospital and post-acute care services Warranty: Not charging/being paid more for costs of treating hospital-acquired infections, problems caused by errors, etc. 41
42 Yes, a Health Care Provider Can Offer a Warranty Geisinger Health System ProvenCare SM A single payment for an ENTIRE 90 day period including: ALL related pre-admission care ALL inpatient physician and hospital services ALL related post-acute care ALL care for any related complications or readmissions Types of conditions/treatments currently offered: Cardiac Bypass Surgery Cardiac Stents Cataract Surgery Total Hip Replacement Bariatric Surgery Perinatal Care Low Back Pain Treatment of Chronic Kidney Disease 42
43 Payment + Process Improvement = Better Outcomes, Lower Costs 43
44 What a Single Physician and Hospital Can Do In 1987, an orthopedic surgeon in Lansing, MI and the local hospital, Ingham Medical Center, offered: a fixed total price for surgical services for shoulder and knee problems a warranty for any subsequent services needed for a two-year period, including repeat visits, imaging, rehospitalization and additional surgery. Results: Surgeon received over 80% more in payment than otherwise Hospital received 13% more than otherwise, despite fewer rehospitalizations Health insurer paid 40% less than otherwise Method: Reducing unnecessary auxiliary services such as radiography and physical therapy Reducing the length of stay in the hospital Reducing complications and readmissions. 44
45 A Warranty is Not an Outcome Guarantee Offering a warranty on care does not imply that you are guaranteeing a cure or a good outcome It merely means that you are agreeing to correct problems at no (additional) charge Most warranties are limited warranties, in the sense that they agree to pay to correct some problems, but not all 45
46 Example: $10,000 Procedure Cost of Procedure $10,000 46
47 Cost of Procedure Actual Average Payment for Procedure is Higher than $10,000 Added Cost of Infection Rate of Infections Average Total Cost $10,000 $20,000 5% $11,000 47
48 Cost of Procedure Starting Point for Warranty Price: Actual Current Average Payment Added Cost of Infection Rate of Infections Average Total Cost Price Charged Change in Net Revenue $10,000 $20,000 5% $11,000 $11,000 $0 48
49 Cost of Procedure Limited Warranty Gives Financial Incentive to Improve Quality Added Cost of Infection Rate of Infections Average Total Cost Price Charged Change in Net Revenue $10,000 $20,000 5% $11,000 $11,000 $0 $10,000 $20,000 4% $10,800 $11,000 $200 Reducing Adverse Events...Reduces Costs... Improves The Bottom Line 49
50 Cost of Procedure Higher-Quality Provider Can Charge Less, Attract More Patients Added Cost of Infection Rate of Infections Average Total Cost Price Charged Change in Net Revenue $10,000 $20,000 5% $11,000 $11,000 $0 $10,000 $20,000 4% $10,800 $11,000 $200 $10,000 $20,000 4% $10,800 $10,800 $0 Enables Lower Prices 50
51 Cost of Procedure A Virtuous Cycle of Quality Improvement & Cost Reduction Added Cost of Infection Rate of Infections Average Total Cost Price Charged Change in Net Revenue $10,000 $20,000 5% $11,000 $11,000 $0 $10,000 $20,000 4% $10,800 $11,000 $200 $10,000 $20,000 4% $10,800 $10,800 $0 $10,000 $20,000 3% $10,600 $10,800 $200 Reducing Adverse Events...Reduces Costs... Improves The Bottom Line 51
52 Cost of Procedure Win-Win-Win for Patients, Payers, and Providers Added Cost of Infection Rate of Infections Average Total Cost Price Charged Change in Net Revenue $10,000 $20,000 5% $11,000 $11,000 $0 $10,000 $20,000 4% $10,800 $11,000 $200 $10,000 $20,000 4% $10,800 $10,800 $0 $10,000 $20,000 3% $10,600 $10,800 $200 $10,000 $20,000 3% $10,600 $10,600 $0 $10,000 $20,000 0% $10,000 $10,600 $600 Quality is Better......Cost is Lower......Providers More Profitable 52
53 Cost of Procedure In Contrast, Non-Payment Alone Creates Financial Losses Added Cost of Infection Rate of Infections Average Total Cost Amount Paid Change in Net Revenue $10,000 $20,000 5% $11,000 $11,000 $0 $10,000 $20,000 5% $11,000 $10,000 -$1,000 $10,000 $20,000 3% $10,600 $10,000 -$600 $10,000 $20,000 0% $10,000 $10,000 $0 Non- Payment for Infections Causes Losses While Improving 53
54 CMS Bundling Initiatives Provide Multiple Opportunities Model 1 (Inpatient Gainsharing, No Warranty) Hospitals can share savings with physicians No actual change in the way Medicare payments are made Model 2 (Virtual Full Episode Bundle + Warranty) Budget for Hospital+Physician+Post-Acute+Readmissions Medicare pays bonus if actual cost < budget Providers repay Medicare if actual cost > budget Model 3 (Virtual Post-Acute Bundle + Warranty) Budget for Post-Acute Care+Physicians+Readmissions Bonuses/penalties paid based on actual cost vs. budget Model 4 (Prospective Inpatient Bundle, No Warranty) Single Hospital + Physician payment for inpatient care 54
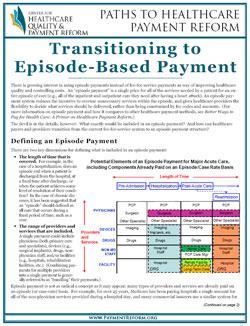
55 The Weakness of Episode Payment Healthy Consumer Continued Health Health Condition How do you prevent unnecessary episodes of care? (e.g., preventable hospitalizations for chronic disease, overuse of cardiac surgery, back surgery, etc.) No Hospitalization Acute Care Episode Episode Payment Efficient Successful Outcome High-Cost Successful Outcome Complications, Infections, Readmissions 55
56 Not Just Better Acute Care, But Reducing the Need for It Healthy Consumer Continued Health Health Condition No Hospitalization Acute Care Episode Efficient Successful Outcome High-Cost Successful Outcome Complications, Infections, Readmissions 56
57 Examples: Significant Reduction in Rate of Hospitalizations Possible 40% reduction in hospital admissions, 41% reduction in ER visits for exacerbations of COPD using in-home & phone patient education by nurses or respiratory therapists J. Bourbeau, M. Julien, et al, Reduction of Hospital Utilization in Patients with Chronic Obstructive Pulmonary Disease: A Disease-Specific Self-Management Intervention, Archives of Internal Medicine 163(5), % reduction in hospitalizations for CHF patients using homebased telemonitoring M.E. Cordisco, A. Benjaminovitz, et al, Use of Telemonitoring to Decrease the Rate of Hospitalization in Patients With Severe Congestive Heart Failure, American Journal of Cardiology 84(7), % reduction in hospital admissions, 21% reduction in ER visits through self-management education M.A. Gadoury, K. Schwartzman, et al, Self-Management Reduces Both Short- and Long-Term Hospitalisation in COPD, European Respiratory Journal 26(5),
58 We Don t Pay for the Things That Will Prevent Overutilization CURRENT PAYMENT SYSTEMS Health Insurance Plan $ $ $ Physician Practice Office Visits Phone Calls Nurse Care Mgr No payment for services that can prevent utilization... ER Visits Avoidable Lab Work/ Imaging Avoidable Hospital Stay Avoidable...No penalty or reward for high utilization elsewhere 58
59 Option 1: Add New Fee Codes for Unreimbursed PCP Services MEDICAL HOME PROGRAM Health Insurance Plan $ $ $ Office Visits ER Visits Hospital Stay Physician Practice Phone Calls Nurse Care Mgr Avoidable Lab Work/ Imaging Avoidable Avoidable Higher payment for primary care $ 59
60 Option 2: Pay for Monthly Care Mgt to Cover Missing Services MEDICAL HOME PROGRAM Health Insurance Plan $ $ $ Physician Practice Higher payment for primary care Office Visits Monthly Care Mgt Payment Phone Calls RN Care Mgr $ ER Visits Avoidable Lab Work/ Imaging Avoidable Hospital Stay Avoidable 60
61 More $ for PCPs, But Any Savings Elsewhere? MEDICAL HOME PROGRAM Health Insurance Plan $ $ $ Physician Practice Higher payment for primary care Office Visits Monthly Care Mgt Payment Phone Calls RN Care Mgr $ ER Visits Avoidable Lab Work/ Imaging Avoidable Hospital Stay Avoidable...But no commitment to reduce utilization elsewhere 61
62 Option 3: Shared Savings (More $ Only If Total Costs Decrease) SHARED SAVINGS MODEL Health Insurance Plan $ $ $...Returned to physician practice after savings determined... Physician Practice $ Office Visits Phone Calls Nurse Care Mgr...but no upfront $ for better care Specialty Consults Avoidable Lab Work/ Imaging Avoidable Hospital Stay Avoidable Portion of savings from reduced spending in other areas... 62
63 Option 4: Resources + Accountability CARE MGT PAYMENT + UTILIZATION P4P $ Physician Practice $ $ $ More $ for PCP Health Insurance Plan $ $ $ Office Visits Monthly Care Mgt Payment Phone Calls RN Care Mgr $ ER Visits Avoidable Lab Work/ Imaging Avoidable P4P Bonus/Penalty Based on Utilization Hospital Stay Avoidable Targets for Reduction In Utilization 63
64 Example: Washington State Medical Home Pilot Program 4-Part Payment Model Current FFS payments for PCP services Additional PMPM pmt for care management $2.50 per patient per month in Year 1 (part of year) $2.00 per patient per month in Years 2 & 3 No restrictions on how money is used Penalty for failure to reduce ER/hospital utilization Focus: Non-urgent ER visits and preventable admissions Reduction targets large enough to repay health plans for upfront payments Penalty for failure: Repayment of up to 50% of PMPM payment Bonus for success in reducing utilization beyond targets 50/50 split of payers savings from reductions in ER visits and/or hospitalizations net of PMPM payment Quality of care must be maintained based on quality measures Implementation Began May health plans (5 commercial, 2 Medicaid) 12 primary care practice sites (8 provider orgs), ~ 25,000 patients 64
65 Example: A Hypothetical Underpaid PCP Practice PRIMARY CARE PRACTICE PCPs 4 ER Visits/ Patients/Physician 2,000 % Preventable 40% PMPY Primary Care Cost $140 Per ER Visit $1,000 Annual Revenue $1,120,000 ER Visit Cost to Payer $640,000 Overhead Costs $400,000 Physician Salary $180,000 Cost of Nurse Practitioner $80,000 Reduction in Prev. ER Visits 40% Other Costs $10,000 Savings $256,000 Total Costs $90,000 Upfront Payment $90,000 Payment to Practice $90,000 Net Savings to Payer $166,000 Share of Savings $83,000 Share to Practice 50% New Physician Salary $200,750 Net Savings to Payer $83,000 Increase in Phys. Salary 12% % Savings to Payer 13% 65
66 Many Patients Are Going to ER Due to Difficulty Seeing PCPs PRIMARY CARE PRACTICE HEALTH PLAN ER EXPENSES PCPs 4 ER Visits/ Patients/Physician 2,000 % Preventable 40% PMPY Primary Care Cost $140 Per ER Visit $1,000 Annual Revenue $1,120,000 ER Visit Cost to Payer $640,000 Overhead Costs $400,000 Physician Salary $180,000 Cost of Nurse Practitioner $80,000 Reduction in Prev. ER Visits 40% Other Costs $10,000 Savings $256,000 Total Costs $90,000 Upfront Payment $90,000 Payment to Practice $90,000 Net Savings to Payer $166,000 Share of Savings $83,000 Share to Practice 50% New Physician Salary $200,750 Net Savings to Payer $83,000 Increase in Phys. Salary 12% % Savings to Payer 13% 66
67 PCPs Could Reduce ER Expenses With Right Resources PRIMARY CARE PRACTICE HEALTH PLAN ER EXPENSES PCPs 4 ER Visits/ Patients/Physician 2,000 % Preventable 40% PMPY Primary Care Cost $140 Per ER Visit $1,000 Annual Revenue $1,120,000 ER Visit Cost to Payer $640,000 Overhead Costs $400,000 Physician Salary $180,000 Cost of Nurse Practitioner $80,000 Reduction in Prev. ER Visits 40% Other Costs $10,000 Savings $256,000 Total Costs $90,000 Upfront Payment $90,000 Payment to Practice $90,000 Net Savings to Payer $166,000 Share of Savings $83,000 Share to Practice 50% New Physician Salary $200,750 Net Savings to Payer $83,000 Increase in Phys. Salary 12% % Savings to Payer 13% 67
68 Upfront Money Could Enable PCPs to Change, If Willing PRIMARY CARE PRACTICE HEALTH PLAN ER EXPENSES PCPs 4 ER Visits/ Patients/Physician 2,000 % Preventable 40% PMPY Primary Care Cost $140 Per ER Visit $1,000 Annual Revenue $1,120,000 ER Visit Cost to Payer $640,000 Overhead Costs $400,000 Physician Salary $180,000 Cost of Nurse Practitioner $80,000 Reduction in Prev. ER Visits 40% Other Costs $10,000 Savings $256,000 Total Costs $90,000 Upfront Payment $90,000 Payment to Practice $90,000 Net Savings to Payer $166,000 Share of Savings $83,000 Share to Practice 50% New Physician Salary $200,750 Net Savings to Payer $83,000 Increase in Phys. Salary 12% % Savings to Payer 13% 68
69 Payer Can Reward PCP for Results and Still Save Money PRIMARY CARE PRACTICE HEALTH PLAN ER EXPENSES PCPs 4 ER Visits/ Patients/Physician 2,000 % Preventable 40% PMPY Primary Care Cost $140 Per ER Visit $1,000 Annual Revenue $1,120,000 ER Visit Cost to Payer $640,000 Overhead Costs $400,000 Physician Salary $180,000 Cost of Nurse Practitioner $80,000 Reduction in Prev. ER Visits 40% Other Costs $10,000 Savings $256,000 Total Costs $90,000 Upfront Payment $90,000 Payment to Practice $90,000 Net Savings to Payer $166,000 Share of Savings $83,000 Share to Practice 50% New Physician Salary $200,750 Net Savings to Payer $83,000 Increase in Phys. Salary 12% % Savings to Payer 13% 69
70 Win-Win-Win for PCPs, Patients, & Premiums PRIMARY CARE PRACTICE HEALTH PLAN ER EXPENSES PCPs 4 ER Visits/ Patients/Physician 2,000 % Preventable 40% PMPY Primary Care Cost $140 Per ER Visit $1,000 Annual Revenue $1,120,000 ER Visit Cost to Payer $640,000 Overhead Costs $400,000 Physician Salary $180,000 Cost of Nurse Practitioner $80,000 Reduction in Prev. ER Visits 40% Other Costs $10,000 Savings $256,000 Total Costs $90,000 Upfront Payment $90,000 Payment to Practice $90,000 Net Savings to Payer $166,000 Share of Savings $83,000 Share to Practice 50% New Physician Salary $200,750 Net Savings to Payer $83,000 Increase in Phys. Salary 12% % Savings to Payer 13% 70
71 But Upfront Payment Reform is Needed So Care Can Be Changed PRIMARY CARE PRACTICE HEALTH PLAN ER EXPENSES PCPs 4 ER Visits/ Patients/Physician 2,000 % Preventable 40% PMPY Primary Care Cost $140 Per ER Visit $1,000 Annual Revenue $1,120,000 ER Visit Cost to Payer $640,000 Overhead Costs $400,000 Physician Salary $180,000 Cost of Nurse Practitioner $80,000 Reduction in Prev. ER Visits 40% Other Costs $10,000 Savings $256,000 Total Costs $90,000 Upfront Payment $90,000 Payment to Practice $90,000 Net Savings to Payer $166,000 Share of Savings $83,000 Share to Practice 50% New Physician Salary $200,750 Net Savings to Payer $83,000 Increase in Phys. Salary 12% % Savings to Payer 13% 71
72 And Outcome Targets Need to Be Things Physicians Can Influence PRIMARY CARE PRACTICE HEALTH PLAN ER EXPENSES PCPs 4 ER Visits/ Patients/Physician 2,000 % Preventable 40% PMPY Primary Care Cost $140 Per ER Visit $1,000 Annual Revenue $1,120,000 ER Visit Cost to Payer $640,000 Overhead Costs $400,000 Physician Salary $180,000 Cost of Nurse Practitioner $80,000 Reduction in Prev. ER Visits 40% Other Costs $10,000 Savings $256,000 Total Costs $90,000 Upfront Payment $90,000 Payment to Practice $90,000 Net Savings to Payer $166,000 Share of Savings $83,000 Share to Practice 50% New Physician Salary $200,750 Net Savings to Payer $83,000 Increase in Phys. Salary 12% % Savings to Payer 13% 72
73 Not Just PCPs, But The Medical Neighborhood, Too Resources & Incentives for More Coordinated Care FFS Payment Based on Volume, Procedures, & Office Visits Primary Care Medical Home (Non-Primary Care) Specialists PATIENT 73
74 Pay Both PCPs & Specialists for Outcomes & Coordination Resources & Incentives for More Coordinated Care Payment for Consultation w/ PCP; Outcomes-Based Payment Primary Care Medical Home (Non-Primary Care) Specialists PATIENT 74
75 Minnesota s DIAMOND Initiative Goal: improve outcomes for patients with depression All payers in Minnesota (except for Medicare) agreed on common payment changes for PCPs & specialists Payment changes: Support for a care manager in the primary care practice Psychiatrists paid to consult with PCP on how to manage patient s care comprehensively, rather than patient having to see psychiatrist separately Result: Dramatic improvement in remission rate 75
76 Option 5: Partial Comprehensive Care Payment PARTIAL GLOBAL PMT (Professional Svcs) Condition- Adjusted Per Person Payment $ PCPs + Specialists $ $ $ Health Insurance Plan $ $ Office Visits Phone Calls Nurse Care Mgr ER Visits Avoidable Lab Work/ Imaging Avoidable Hospital Stay Avoidable P4P Bonus/Penalty Based on Utilization Flexibility and accountability for a condition-adjusted budget covering all professional services 76
77 Option 6: Risk-Adjusted Full Comprehensive Care Payment COMPREHENSIVE CARE/YEAR-LONG EPISODE Health Insurance Plan Condition- Adjusted Per Person Payment $ PCPs + Specialists $ $ $ Office Visits Phone Calls Nurse Care Mgr ER Visits Avoidable Lab Work/ Imaging Avoidable Hospital Stay Avoidable P4P Bonus/Penalty Based on Quality 77
78 CAPITATION (WORST VERSIONS) No Additional Revenue for Taking Sicker Patients Isn t This Capitation? No It s Different COMPREHENSIVE CARE PAYMENT Payment Levels Adjusted Based on Patient Conditions Providers Lose Money On Unusually Expensive Cases Providers Are Paid Regardless of the Quality of Care Provider Makes More Money If Patients Stay Well Limits on Total Risk Providers Accept for Unpredictable Events Bonuses/Penalties Based on Quality Measurement Provider Makes More Money If Patients Stay Well Flexibility to Deliver Highest-Value Services Flexibility to Deliver Highest-Value Services 78
79 Example: BCBS Massachusetts Alternative Quality Contract Single payment for all costs of care for a population of patients Adjusted up/down annually based on severity of patient conditions Initial payment set based on past expenditures, not arbitrary estimates Provides flexibility to pay for new/different services Bonus paid for high quality care Five-year contract Savings for payer achieved by controlling increases in costs Allows provider to reap returns on investment in preventive care, infrastructure Broad participation 14 physician groups/health systems participating with over 400,000 patients, including one primary care IPA with 72 physicians Positive first-year results Higher ambulatory care quality than non-aqc practices, better patient outcomes, lower readmission rates and ER utilization 79
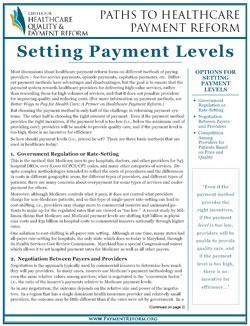
80 Things Needed to Make Comp. Care Payment a Win-Win-Win Trusted, Shared Data on Current Utilization, Cost Physician needs to know current rates of admissions, complications, etc. to set prices appropriately Purchaser/payer needs to know that they re getting a better deal than they are today Protections for Physicians from Insurance Risk Severity adjustment of payment Risk corridors in case costs were mis-estimated Outlier payments for unusually expensive patients Risk exclusions for some patient populations Good Measures of Outcomes Measures meaningful to patients using high-quality data 80


81 Quality Measures Needed to Ensure Low Cost Low Quality Concern: Giving healthcare providers more accountability for costs reduces the incentives for overuse, but raises concerns about whether patients will get too little care Solution: Measure healthcare quality and include incentives for providers to maintain/improve quality as well as reduce costs Puget Sound Health Alliance Ideal: Develop quality measures with participation of physicians and hospitals, as a growing number of regions do Wisconsin Collaborative for Healthcare Quality Greater Detroit Area Health Council 81
82 CARE MGT PAYMENT + UTILIZATION P4P Transitioning to Accountable Care Payment $ Physician Practice $ $ $ More $ for PCP Health Insurance Plan $ $ $ Office Visits Monthly Care Mgt Payment Phone Calls RN Care Mgr $ ER Visits Avoidable Lab Work/ Imaging Avoidable P4P Bonus/Penalty Based on Utilization Hospital Stay Avoidable Targets for Reduction In Utilization Condition- Adjusted Per Person Payment PARTIAL GLOBAL PMT (Professional Svcs) $ Physician Practice $ $ $ Health Insurance Plan $ $ Office Visits Phone Calls Nurse Care Mgr ER Visits Avoidable Lab Work/ Imaging Avoidable Flexibility and accountability for a condition-adjusted budget covering all professional services Hospital Stay Avoidable P4P Bonus/Penalty Based on Utilization FULL COMP. CARE/GLOBAL PMT + QUALITY P4P Condition- Adjusted Per Person Payment $ Physician Practice/ ACO $ $ $ Health Insurance Plan Office Visits Phone Calls Nurse Care Mgr ER Visits Avoidable Lab Work/ Imaging Avoidable Hospital Stay Avoidable P4P Bonus/Penalty Based on Quality 82
83 Michigan BC/BS Physician Group Incentive Program Phase I Phase II Fee-for-Service Fee-for-Service Fee-for-Service P4P for QI P4P for QI Medical Home $ MD MD MD MD MD Virtual MD Group MD MD MD MD Virtual MD Group MD MD MD MD MD MD MD MD MD MD MD MD MD MD MD MD MD MD MD MD MD MD MD MD Virtual MD Group MD MD MD MD MD MD MD MD MD MD MD MD Virtual MD Group MD MD MD MD MD MD MD 83
84 Payment Reform Helps Control Utilization But Not Prices Changing the payment method removes the incentives to increase volume and removes barriers to reducing costs But under any payment method, prices may be too high or too low If the price is (too) high, there are no savings and no incentive to transform care If the price is too low, providers will be unable to deliver high-quality care and risk financial disaster 84

85 Growing Concern That Price, Not Use, is Driving Spending 85

86 Wide Variation in Payments for Same Procedure 86
87 2:1 Price Range for MD Services Across/Within Regions in US Source: Report to the Congress: Medicare and the Health Care Delivery System Medicare Payment Advisory Commission, June
88 How Do You Set the Price? APPROACHES TO SETTING PRICES (All Payer) Regulation Maryland sets all-payer rates for hospital services 88
89 How Do You Set the Price? APPROACHES TO SETTING PRICES (All Payer) Regulation Maryland sets all-payer rates for hospital services Large Payer Dictation Congress/CMS establish the rates Medicare will pay 89
90 How Do You Set the Price? APPROACHES TO SETTING PRICES (All Payer) Regulation Maryland sets all-payer rates for hospital services Large Payer Dictation Small Payer Negotiation Congress/CMS establish the rates Medicare will pay Result varies depending on size of payer vs. provider 90
91 Ability to Negotiate Depends on Market Power PAYER Provider Provider Provider Provider Provider Provider PAYER Provider Provider Provider 91
92 Ability to Negotiate Depends on Market Power PAYER Provider Provider Provider Provider Provider Provider PAYER Provider Provider Provider Payer Payer PROVIDER Payer Payer Payer PROVIDER 92
93 How Do You Set the Price? APPROACHES TO SETTING PRICES (All Payer) Regulation Maryland sets all-payer rates for hospital services Large Payer Dictation Small Payer Negotiation Competition Congress/CMS establish the rates Medicare will pay Result varies depending on size of payer vs. provider Providers set prices in order to attract more patients 93
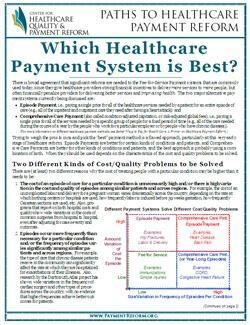
94 Lack of Effective Incentives for Value-Based Choice by Patients Copays, Co-insurance, and High Deductibles do little to encourage patients to be cost-conscious in choosing among high-cost providers and services 94
95 Where Will You Get Your Knee Replaced? Knee Joint Replacement Consumer Share of Surgery Cost Price #1 $23,000 Price #2 $28,000 Price #3 $33,000 95
96 Copayment? Use High Price Provider Knee Joint Replacement Consumer Share of Surgery Cost Price #1 $23,000 Price #2 $28,000 Price #3 $33,000 $1,000 Copayment: $1,000 $1,000 $1,000 96
97 Coinsurance? Use High Price Provider Knee Joint Replacement Consumer Share of Surgery Cost Price #1 $23,000 Price #2 $28,000 Price #3 $33,000 $1,000 Copayment: $1,000 $1,000 $1,000 10% Coinsurance w/$2,000 OOP Max: $2,000 $2,000 $2,000 97
98 High Deductible? Use High Price Provider Knee Joint Replacement Consumer Share of Surgery Cost Price #1 $23,000 Price #2 $28,000 Price #3 $33,000 $1,000 Copayment: $1,000 $1,000 $1,000 10% Coinsurance $2,000 $2,000 $2,000 w/$2,000 OOP Max: $5,000 Deductible: $5,000 $5,000 $5,000 98
99 Pay the Difference in Price? Use the High-Value Provider Knee Joint Replacement Consumer Share of Surgery Cost Price #1 $23,000 Price #2 $28,000 Price #3 $33,000 $1,000 Copayment: $1,000 $1,000 $1,000 10% Coinsurance w/$2,000 OOP Max: $2,000 $2,000 $2,000 $5,000 Deductible: $5,000 $5,000 $5,000 Highest-Value: $0 $5,000 $10,000 99

100 Tiered, Open Network is Better for Patient Than a Narrow Network Knee Joint Replacement Consumer Share of Surgery Cost Price #1 $20,000 Price #2 $25,000 Price #3 $30,000 $1,000 Copayment: $1,000 $1,000 $1,000 10% Coinsurance w/$2,000 OOP Max: $2,000 $2,000 $2,000 $5,000 Deductible: $5,000 $5,000 $5,000 Highest-Value: $0 $5,000 $10,000 Narrow Network: $1,000 $25,000 $30,
101 Blue Cross/Blue Shield of MA Hospital Choice Cost-Share Benefit Low-Cost Hospitals High-Cost Hospitals PCP $20 $20 SPC $35 $35 Inpatient Hospital $500 $1500* Outpatient Hospital Day Surgery $250 $1250 High Tech Radiology $50 $500 Laboratory $0 $35 X-Rays/Other Imaging Tests $0 $100 PT/OT/ST $35 $70 *LOWER INPATIENT COPAY APPLIES IF EMERGENCY ADMISSION 101
102 Today: Hard to Know if Better Price Means Better Value Payment for Procedure Provider 1: $10,000 Added Provider 2: $9,500-5% 102
103 Payment for Procedure Provider 1: What Hidden Costs Accompany the Lower Price? Added Payment for Infection Rate of Infections $10,000 $20,000 5% Provider 2: $9,500 $19,000 10% -5% 103
104 Payment for Procedure Provider 1: Total Spending May Be Higher With the Lower Price Provider Added Payment for Infection Rate of Infections Average Total Payment $10,000 $20,000 5% $11,000 Provider 2: $9,500 $19,000 10% $11,400-5% +4% Provider 2 has a lower starting price, but is more expensive when lower quality is factored in 104
105 Bundled/Episode Payments Allow Comparing Apples to Apples Payment for Procedure Provider 1: Provider 2: Added Payment for Infection Rate of Infections Bundled/ Episode Payment 5% $11,000 Bundled prices show that Provider 1 is the higher-value provider 10% $11,400 +4% 105
106 Lack of Effective Incentives for Value-Based Choice by Patients Copays, Co-insurance, and High Deductibles do little to encourage patients to be cost-conscious in choosing among high-cost providers and services Copays, Co-insurance, and High Deductibles can discourage patients from getting preventive treatments they need 106
107 Example: Important to Coordinate Pharmacy & Medical Benefits Single-minded focus on reducing costs here......could result in higher spending on hospitalizations Pharmacy Benefits Medical Benefits Drug Costs Hospital Costs Physician Costs High copays for brand-names when no generic exists Doughnut holes & deductibles Other Services Principal treatment for most chronic diseases involves regular use of maintenance medication 107
108 Benefit Design Changes Are Also Critical to Success Ability and Incentives to: Improve health Take prescribed medications Allow a provider to coordinate care Choose the highest-value providers and services Benefit Design Patient Payment System Provider Ability and Incentives to: Keep patients well Avoid unneeded services Deliver services efficiently Coordinate services with other providers 108
109 Challenge: Gaining Support from a Critical Mass of Payers Payer Better Payment System Payer Current Payment System Provider Current Payment System Payer Patient Patient Patient Provider is only compensated for changed practices for the subset of patients covered by participating payers 109
110 Payers Need to Truly Align to Allow Focus on Better Care Payer Better Payment System A Payer Better Payment System B Provider Better Payment System C Payer Patient Patient Patient Even if every payer s system is better than it was, if they re all different, providers will spend too much time and money on administration rather than care improvement 110
111 Purchasers Must Support Multi-Payer Payment Reforms Purchaser Purchaser Purchaser Purchaser Payer Better Payment System Payer Better Payment System Provider Better Payment System Payer Patient Patient Patient 111
112 Payer Coordination Is Beginning to Occur Around the Country Examples of Multi-Payer Payment Reforms: Colorado, Maine, Michigan, Minnesota, New York, North Carolina, Oregon, Pennsylvania, Rhode Island,Vermont, and Washington all have multi-payer medical home initiatives A Facilitator of Coordination is Needed State Government (provides anti-trust exemption) Non-profit Regional Health Improvement Collaboratives Medicare Needs to Participate in Local Projects as Well as Define its Own Demonstrations Center for Medicare and Medicaid Innovation (CMMI) created under PPACA provides the opportunity for this Medicare is now participating in eight of the state-led multi-payer medical home initiatives 112
113 Many Different Activities Needed for Success Patient Education/ Engagement Education Materials Value-Based Choice Wellness & Adherence Quality/Cost/ Experience Analysis & Reporting Claims, Clinical & Patient Data Public Reporting Business Case Analysis Reducing Costs Without Rationing Engagement of Purchasers Alignment of Multiple Payers Value-Driven Payment & Benefits Benefit Design Payment System Design Value-Driven Delivery Systems Technical Assistance to Providers Design & Delivery of Care Provider Organization/ Coordination 113
114 How Can These Functions Be Delivered in a Coordinated Way? Education Materials Value-Based Choice Wellness & Adherence Claims, Clinical & Patient Data Public Reporting Business Case Analysis? Engagement of Purchasers Alignment of Multiple Payers Benefit Design Payment System Design Technical Assistance to Providers Design & Delivery of Care Provider Organization/ Coordination 114
115 Role of Regional Health Improvement Collaboratives Education Materials Value-Based Choice Wellness & Adherence Claims, Clinical & Patient Data Public Reporting Business Case Analysis Regional Health Improvement Collaborative Engagement of Purchasers Alignment of Multiple Payers Benefit Design Payment System Design Technical Assistance to Providers Design & Delivery of Care Provider Organization/ Coordination 115
116 ...With Active Involvement of All Healthcare Stakeholders Healthcare Providers Healthcare Payers Regional Health Improvement Collab. Healthcare Purchasers Healthcare Consumers 116
117 Growing Network of Regional Health Improvement Collaboratives Albuquerque Coalition for Healthcare Quality Aligning Forces for Quality South Central PA Alliance for Health Better Health Greater Cleveland California Cooperative Healthcare Reporting Initiative California Quality Collaborative Finger Lakes Health Systems Agency Greater Detroit Area Health Council Health Improvement Collaborative of Greater Cincinnati Healthy Memphis Common Table Institute for Clinical Systems Improvement Integrated Healthcare Association Iowa Healthcare Collaborative Kansas City Quality Improvement Consortium Louisiana Health Care Quality Forum Maine Health Management Coalition Massachusetts Health Quality Partners Midwest Health Initiative Minnesota Community Measurement Minnesota Healthcare Value Exchange Nevada Partnership for Value-Driven Healthcare (HealthInsight) New York Quality Alliance Oregon Health Care Quality Corporation P2 Collaborative of Western New York Pittsburgh Regional Health Initiative Puget Sound Health Alliance Quality Counts (Maine) Quality Quest for Health of Illinois Utah Partnership for Value-Driven Healthcare (HealthInsight) Wisconsin Collaborative for Healthcare Quality Wisconsin Healthcare Value Exchange Network for Regional Healthcare Improvement 117
118 Getting Started on the Road to More Accountable Care Recognize that there is no one-size-fits-all solution or implementation path; the best thing the federal government can do is to support local strategies Get all stakeholders working together to design the kind of healthcare payment, delivery, and benefit structures the community wants to have in 5-7 years to reduce costs and improve quality Develop/implement a strategy for testing/implementing the payment and delivery reforms across the community Measure progress and resolve challenges through an ongoing collaborative, multi-stakeholder community process 118
119 For More Information on Payment and Delivery Reforms 119
120 For More Information: Harold D. Miller President & CEO, Network for Regional Healthcare Improvement and Executive Director, Center for Healthcare Quality and Payment Reform (412)
121 Healthcare Redesign in SE MI: Today s Work Session Topics 1. Improving Outcomes and Reducing Costs for Patients With Chronic Disease A. What should payment/delivery/benefits look like in Southeast Michigan in 5 years? B. How should Southeast Michigan transition to the desired stucture? 2. Improving Outcomes and Reducing Costs for Patients Hospitalized With Cardiac Conditions A. What should payment/delivery/benefits look like in Southeast Michigan in 5 years? B. How should Southeast Michigan transition to the desired stucture? 121
122 Guidelines for Work Sessions Goal A: Design payment systems for ~5 years in the future It won t be possible to make significant broad-based changes within a year or two The need for change is too urgent to wait years Goal B: How should the transition be made You ll get a list of options as a starting point, but you re free to modify them or add new ones There is no right answer -- a compromise that everyone supports is better than an ideal approach that nobody is willing to implement Don t just rehash the problems or recommend more studies work to forge agreement on solutions There are win-win solutions, but everyone will have to change to achieve them; preserving the status quo is impossible Be nice to your facilitator! 122
Pathways for Physician Success in Accountable Care Organizations
 Pathways for Physician Success in Accountable Care Organizations and Healthcare Reform Harold D. Miller Executive Director Center for Healthcare Quality and Reform July 16, 2011 Everybody s Talking About
The Official Definition FROM VOLUME TO VALUE: and How to Get There. What is an Accountable Care Organization?
 FROM VOLUME TO VALUE: Better Ways to Pay for Health Care, and How to Get There Harold D. Miller Executive Director Center for Healthcare Quality and Reform and President and CEO Network for Regional Healthcare
WIN-WIN-WIN APPROACHES TO ACCOUNTABLE CARE How Physicians, Hospitals, Patients, and Payers Can All Benefit From Healthcare Payment & Delivery Reform
 WIN-WIN-WIN APPROACHES TO ACCOUNTABLE CARE How Physicians, Hospitals, Patients, and Payers Can All Benefit From Healthcare Payment & Delivery Reform Harold D. Miller President and CEO Center for Healthcare
Mr. Chairman and Members of the Committee:
 Testimony of Harold D. Miller Executive Director, Center for Healthcare Quality and Payment Reform and President & CEO, Network for Regional Healthcare Improvement to the Subcommittee on Health, Committee
What the blue star means for you A guide to the Aexcel specialist performance network
 Quality health plans & benefits Healthier living Financial well-being Intelligent solutions What the blue star means for you A guide to the Aexcel specialist performance network www.aetna.com 38.02.314.1
Online Job Demand Up 255,000 in December, The Conference Board Reports
 News Release For further information: Frank Tortorici (212) 339-0231 Gad Levanon (212) 339-0317 June Shelp (212) 339-0369 For Immediate Release 10:00 AM ET, Wednesday, January 6, 2010 Release #5397 Online
Online Job Demand Up 169,000 in August, The Conference Board Reports
 News Release For further information: Frank Tortorici (212) 339-0231 Gad Levanon (212) 339-0317 June Shelp (212) 339-0369 For Immediate Release 10:00 AM ET, Monday, August 31, 2009 Release #5362 Online
Online Job Demand Down 83,200 in October, The Conference Board Reports
 News Release For further information: Frank Tortorici (212) 339-0231 Gad Levanon (212) 339-0317 June Shelp (212) 339-0369 For Immediate Release 10:00 AM ET, Monday, November 2, 2009 Release #5378 Online
Online Job Demand Up 106,500 in November, The Conference Board Reports
 News Release For further information: Frank Tortorici (212) 339-0231 Gad Levanon (212) 339-0317 June Shelp (212) 339-0369 For Immediate Release 10:00 AM ET, Wednesday, December 2, 2009 Release #5390 Online
The Conference Board Reports Online Job Demand Drops 507,000 in December
 News Release For further information: Frank Tortorici (212) 339-0231 Gad Levanon (212) 339-0317 June Shelp (212) 339-0369 For Immediate Release 10:00 AM ET, Wednesday, January 7, 2009 The Conference Board
WIN-WIN-WIN APPROACHES TO ACCOUNTABLE CARE
 WIN-WIN-WIN APPROACHES TO ACCOUNTABLE CARE How Providers, Hospitals, Employers, and Patients Can All Benefit from Healthcare Payment and Delivery Reform Harold D. Miller President and CEO Center for Healthcare
For further information: Frank Tortorici: / board.org Release #5458
 News Release Follow The Conference Board For further information: Frank Tortorici: 212 339 0231 / f.tortorici@conference board.org Release #5458 For Immediate Release 10:00 AM ET, Wednesday, September
For further information: Carol Courter / Release #5952. Online Job Ads Increased 195,600 in May
 News Release Follow The Conference Board For further information: Carol Courter 212-339-0232 / courter@conference-board.org Release #5952 For Immediate Release 10:00 AM ET, Wednesday, May 31, 2017 Online
For further information: Carol Courter / Release #5990. Online Job Ads Increased 229,700 in December
 News Release Follow The Conference Board For further information: Carol Courter 212-339-0232 / courter@conference-board.org Release #5990 For Immediate Release 10:00 AM ET, Wednesday, January 3, 2018 Online
For further information: Carol Courter / Release #5985. Online Job Ads Increased 137,100 in November
 News Release Follow The Conference Board For further information: Carol Courter 212-339-0232 / courter@conference-board.org Release #5985 For Immediate Release 10:00 AM ET, Wednesday, December 6, 2017
For further information: Carol Courter / Release #5942. Online Job Ads Increased 102,000 in March
 News Release Follow The Conference Board For further information: Carol Courter 212-339-0232 / courter@conference-board.org Release #5942 For Immediate Release 10:00 AM ET, Wednesday, April 5, 2017 Online
For further information: Carol Courter / Release #5996. Online Job Ads Increased 1,200 in January
 News Release Follow The Conference Board For further information: Carol Courter 212-339-0232 / courter@conference-board.org Release #5996 For Immediate Release 10:00 AM ET, Wednesday, January 31, 2018
For further information: Carol Courter / Release #5967. Online Job Ads Decreased 125,900 in August
 News Release Follow The Conference Board For further information: Carol Courter 212-339-0232 / courter@conference-board.org Release #5967 For Immediate Release 10:00 AM ET, Wednesday, August 30, 2017 Online
For further information: Carol Courter / Release #6029. Online Job Ads Increased 170,800 in July
 News Release Follow The Conference Board For further information: Carol Courter 212-339-0232 / courter@conference-board.org Release #6029 For Immediate Release 10:00 AM ET, Wednesday, August 1, 2018 Online
For further information: Carol Courter / Release #6016. Online Job Ads Decreased 69,300 in April
 News Release Follow The Conference Board For further information: Carol Courter 212-339-0232 / courter@conference-board.org Release #6016 For Immediate Release 10:00 AM ET, Wednesday, May 2, 2018 Online
For further information: Carol Courter / Release #5963. Online Job Ads Decreased 157,700 in July
 News Release Follow The Conference Board For further information: Carol Courter 212-339-0232 / courter@conference-board.org Release #5963 For Immediate Release 10:00 AM ET, Wednesday, August 2, 2017 Online
For further information: Carol Courter / Release #5980. Online Job Ads Increased 81,500 in October
 News Release Follow The Conference Board For further information: Carol Courter 212-339-0232 / courter@conference-board.org Release #5980 For Immediate Release 10:00 AM ET, Wednesday, November 1, 2017
For further information: Carol Courter / Release #5916
 News Release Follow The Conference Board For further information: Carol Courter 212-339-0232 / courter@conference-board.org Release #5916 For Immediate Release 2:00 PM ET, Monday, November 7, 2016 Online
For further information: Carol Courter / Release #5931
 News Release Follow The Conference Board For further information: Carol Courter 212-339-0232 / courter@conference-board.org Release #5931 For Immediate Release 10:00 AM ET, Wednesday, February 1, 2017
Online Labor Demand up 232,000 in June
 News Release Follow The Conference Board For further information: Peter Tulupman 212-339-0231 / peter.tulupman@conference-board.org Release #5594 Jonathan Liu 212-339-0257 / jonathan.liu@conference-board.org
For further information: Carol Courter / Release #5862
 News Release Follow The Conference Board For further information: Carol Courter 212-339-0232 / courter@conference-board.org Release #5862 For Immediate Release 10:00 AM ET, Wednesday, February 3, 2016
For further information: Carol Courter / Release #5486
 News Release Follow The Conference Board For further information: Carol Courter 212 339-0232 / courter@conference-board.org Release #5486 For Immediate Release 10:00 AM ET, Monday January 31, 2011 Online
Online Labor Demand Rises 164,600 in August
 News Release Follow The Conference Board For further information: Jonathan Liu 212-339-0257 / jonathan.liu@conference-board.org Release #5759 Carol Courter 212-339-0232 / courter@conference-board.org For
For further information: Carol Courter / Release #5806. Online Labor Demand Dropped 104,500 in April
 News Release Follow The Conference Board For further information: Carol Courter 212-339-0232 / courter@conference-board.org Release #5806 For Immediate Release 10:00 AM ET, Wednesday, May 6, 2015 Online
REDESIGNING HEALTH CARE FROM THE BOTTOM UP INSTEAD OF FROM THE TOP DOWN
 REDESIGNING HEALTH CARE FROM THE BOTTOM UP INSTEAD OF FROM THE TOP DOWN Supporting Collaborative Regional Approaches to Sustainable High-Value Healthcare Harold D. Miller President and CEO Center for Healthcare
Patient-Centered Primary Care
 Patient-Centered Primary Care Greg Moody, Director Office of Health Transformation July 30, 2014 www.healthtransformation.ohio.gov Agenda 1. Health System Challenges 2. Health System Trends in Primary
Health Reform and The Patient-Centered Medical Home
 THE COMMONWEALTH FUND Health Reform and The Patient-Centered Medical Home Melinda Abrams The Commonwealth Fund November 3, 2011 Grantmakers in Health Fall Forum Primary Care Foundation At Risk: Patient
Making the Business Case
 Making the Business Case for Payment and Delivery Reform Harold D. Miller Center for Healthcare Quality and Payment Reform To learn more about RWJFsupported payment reform activities, visit RWJF s Payment
Value based care: A system overhaul
 Value based care: A system overhaul Lee A. Fleisher, M.D. Robert D. Dripps Professor and Chair of Anesthesiology Perelman School of Medicine at the University of Pennsylvania Email: lee.fleisher@uphs.upenn.edu
NSTC COMPETITIVE AREA DEFINITIONS. UIC Naval Service Training Command (NSTC), Great Lakes, IL
, Great Lakes, IL") NSTC COMPETITIVE AREA DEFINITIONS UIC 00210 Naval Service Training Command (NSTC), Great Lakes, IL UIC 00210 NSTC, N8, Pensacola, FL UIC 0763A Recruit Training Command, Great Lakes, IL NSTC Pensacola Programs,
NSTC COMPETITIVE AREA DEFINITIONS UIC 00210 Naval Service Training Command (NSTC), Great Lakes, IL UIC 00210 NSTC, N8, Pensacola, FL UIC 0763A Recruit Training Command, Great Lakes, IL NSTC Pensacola Programs,
2017 Competitiveness REDBOOK. Key Indicators of North Carolina s Business Climate
 2017 Competitiveness REDBOOK Key Indicators of North Carolina s Business Climate 2017 Competitiveness REDBOOK The North Carolina Chamber Foundation works to promote the social welfare of North Carolina
The MetLife Market Survey of Nursing Home & Home Care Costs September 2004
 The MetLife Market Survey of Nursing Home & Home Care Costs September 2004 Mature Market Institute The MetLife Mature Market Institute is the company s information and policy resource center on issues
Lead the way Your guide to Aexcel
 Lead the way Your guide to Aexcel For designations effective January 1, 2018 38.02.800.1 G (6/17) aetna.com We re helping build a better health care system one that is more transparent to you and to your
Healthcare Clinic at Walgreens Access to Care Innovations Panel March 5, 2014
 Healthcare Clinic at Walgreens Access to Care Innovations Panel March 5, 2014 Dr. Alan London Vice President, Strategic Clinical Partnerships 2014 Walgreen Co. All rights reserved. Walgreens is Well-Positioned
MACRA for Critical Access Hospitals. Tuesday, July 26, 2016 Webinar
 MACRA for Critical Access Hospitals Tuesday, July 26, 2016 Webinar MACRA presenters Harold D. Miller, President & CEO CHQPR Claudia Sanders, Sr. Vice President, Policy Development Andrew Busz, Policy Director,
Transforming Payment for a Healthier Ohio
 Transforming Payment for a Healthier Ohio Greg Moody, Director Governor s Office of Health Transformation Legislative Joint Medicaid Oversight Committee August 20, 2014 www.healthtransformation.ohio.gov
Framework for Post-Acute Care: Current and Future Issues for Providers
 Framework for Post-Acute Care: Current and Future Issues for Providers Alan G. Rosenbloom Alliance for Quality Nursing Home Care March 2012 Overview of Presentation Post-Acute Care: Background and Trends
BETTER WAYS TO PAY FOR HEALTH CARE
 From VOLUME tovalue Transforming Health Care Payment and Delivery Systems to Improve Quality and Reduce s NRHI Healthcare Payment Reform Series BETTER WAYS TO PAY FOR HEALTH CARE A Primer on Healthcare
CREATING A PHYSICIAN-LED HEALTHCARE FUTURE Better Care for Patients, Lower Healthcare Spending, & Financially Viable Physician Practices & Hospitals
 CREATING A PHYSICIAN-LED HEALTHCARE FUTURE Better Care for Patients, Lower Healthcare Spending, & Financially Viable Physician Practices & Hospitals Harold D. Miller President and CEO Center for Healthcare
Partners in the Continuum of Care: Hospitals and Post-Acute Care Providers
 Partners in the Continuum of Care: Hospitals and Post-Acute Care Providers Presented to the Wisconsin Association for Home Health Care November 3, 2017 By: Laura Rose WHA Vice President, Policy Development
Creating a Patient-Centered Payment System to Support Higher-Quality, More Affordable Health Care. Harold D. Miller
 Creating a Patient-Centered Payment System to Support Higher-Quality, More Affordable Health Care Harold D. Miller First Edition October 2017 CONTENTS EXECUTIVE SUMMARY... i I. THE QUEST TO PAY FOR VALUE
Episode Payment Models:
 Episode Payment Models: Cardiac Bundle Initiative HFMA Florida Chapter (North Florida) October 25, 2016 Robert Howey MBA, MHA, CPA Revenue Cycle Manager 2016 MFMER slide-1 Objective After the session,
FBI Field Offices. Louisville Division Room Martin Luther King Jr. Place Louisville, Kentucky (502)
") FBI Field Offices Alabama Kentucky North Dakota Birmingham Division Room 1400 2121 8 th Ave. North Birmingham, Alabama 35203-2396 (205) 326-6166 Mobile Division One St. Louis Street, 3 rd Floor Mobile,
FBI Field Offices Alabama Kentucky North Dakota Birmingham Division Room 1400 2121 8 th Ave. North Birmingham, Alabama 35203-2396 (205) 326-6166 Mobile Division One St. Louis Street, 3 rd Floor Mobile,
Arts and Culture in Metro Atlanta: By the Numbers. February 21, 2018
 Arts and Culture in Metro Atlanta: By the Numbers February 21, 2018 Graphic of numbers The Internet, 2014 Most Populous Metro Regions 01. New York 02. Los Angeles 03. Chicago 04. Dallas 05. Houston 06.
The NALC Auxiliary Collection
 Finding Aid The NALC Auxiliary Collection 1905-1994 4.5 Linear Feet Accession No. 1922 1 The NALC Auxiliary Collection 1905-1994 Accession No. 1922 The records of the National Ladies Auxiliary, known today
College Profiles - Navy/Marine ROTC
 Page 1 of 6 The U.S. Navy and Marine Corps are a team that provides for our national defense. The men and women who serve are called on to provide support at sea, in the air and on land. The Navy-Marine
The long and winding road to Accountable Care
 The long and winding road to Accountable Care Elliott Fisher, MD, MPH Director, The Dartmouth Institute John E. Wennberg Distinguished Professor Geisel School of Medicine The long and winding road Past
Shifting from Volume to Value: The Future is Now
 Shifting from Volume to Value: The Future is Now Kevin J. Bozic, MD, MBA Professor and Chair, Department of Surgery and Perioperative Care Dell Medical School at the University of Texas at Austin Visiting
Dashboard. Campaign for Action. Welcome to the Future of Nursing:
 Welcome to the Future of Nursing: Campaign for Action Dashboard About This Dashboard: These graphs and charts show goals by which the Campaign evaluates its efforts to implement recommendations in the
Curley s Secret of Life : VBID and Payment Reform
 1 Curley s Secret of Life : VBID and Payment Reform Lewis G. Sandy MD SVP, Clinical Advancement, UnitedHealth Group UnitedHealth Center for Health Reform and Modernization University of Michigan Center
Physician Compensation for Quality Within Groups: Complying with Stark and State of The Art. Traditional Physician Compensation Models
 Physician Compensation for Quality Within Groups: Complying with Stark and State of The Art Alice G. Gosfield, Esq. Medicare and Medicaid Institute American Health Lawyers Association March 29, 2012 c.2012,
Health Plans and LTSS. NASUAD April 20,2011 Mary Kennedy, ACAP Medicare Vice President 1
 Health Plans and LTSS NASUAD April 20,2011 Mary Kennedy, ACAP Medicare Vice President 1 Agenda ACAP Background Health Plan Interest in LTSS Developing Plan Capacity Relationship Building What should states
PHCA Webinar January 30, Latsha Davis & McKenna, P.C. Kimber L. Latsha, Esq.
 PHCA Webinar January 30, 2014 Latsha Davis & McKenna, P.C. Kimber L. Latsha, Esq. 1 2 Intended to: Encourage the development of ACOs in Medicare Promotes accountability for a patient population and coordinates
Introduction. You choose your doctor. This guide can help. WHO WE ARE WHAT YOU CAN EXPECT ABOUT THIS DIRECTORY
 Introduction 3 Introduction WHO WE ARE CIGNA strives to keep our customers healthy and productive. We are committed to giving you access to technology, information and support in reaching health care decisions.
A physician s guide to Aexcel
 Quality health plans & benefits Healthier living Financial well-being Intelligent solutions A physician s guide to Aexcel www.aetna.com For designations effective January 1, 2014 38.02.800.1 E (5/13) We
Intro to Global Budgeting
 Intro to Global Budgeting Jim Hester House Health Care Committee & Senate Health & Welfare Committee 1/21/10 Agenda Goal of global budgeting Global budget models and examples Global payment model and examples
How to Win Under Bundled Payments
 How to Win Under Bundled Payments Donald E. Fry, M.D., F.A.C.S. Executive Vice-President, Clinical Outcomes MPA Healthcare Solutions Chicago, Illinois Adjunct Professor of Surgery Northwestern University
Exhibit 1. Medicare Shared Savings Program: Year 1 Performance of Participating Accountable Care Organizations (2013)
") Exhibit 1. Medicare Shared Savings Program: Year 1 Performance of Participating Accountable Care Organizations (2013) 24 percent (52 ACOs) earned shared savings bonus 27 percent (60 ACOs) reduced spending,
Exhibit 1. Medicare Shared Savings Program: Year 1 Performance of Participating Accountable Care Organizations (2013) 24 percent (52 ACOs) earned shared savings bonus 27 percent (60 ACOs) reduced spending,
What s Wrong with Healthcare?
 What s Wrong with Healthcare? Dan Murrey, MD, MPP Chief Executive Officer Agenda What s wrong with healthcare in the US? What would make it better? How can you help? What s wrong with US healthcare? What
HEALTH CARE REFORM IN THE U.S.
 HEALTH CARE REFORM IN THE U.S. A LOOK AT THE PAST, PRESENT AND FUTURE Carolyn Belk January 11, 2016 0 HEALTH CARE REFORM BIRTH OF THE AFFORDABLE CARE ACT Health care reform in the U.S. has been an ongoing
Joseph W. Thompson, MD, MPH Arkansas Surgeon General Director, Arkansas Center for Health Improvement
 Joseph W. Thompson, MD, MPH Arkansas Surgeon General Director, Arkansas Center for Health Improvement Arkansas Health System Improvement Workforce Payment System Health Information Technology Insurance
Driving Change with the Health Care Spending Benchmark
 Driving Change with the Health Care Spending Benchmark Delaware s Road to Value Kara Odom Walker, MD, MPH, MSHS Cabinet Secretary LIFE Conference, January 24, 2018 1 Join us on Twitter: @Delaware_DHSS
Key Vocabulary Use this space to write key vocabulary words/terms for quick reference later
 Block Name Today s Date Due Date Intro to US History & Regions of the United States USII.2c Special Note: page 3 is the Essential Knowledge of this SOL. It is your responsibility to study this information,
The Pain or the Gain?
 The Pain or the Gain? Comprehensive Care Joint Replacement (CJR) Model DRG 469 (Major joint replacement with major complications) DRG 470 (Major joint without major complications or comorbidities) Actual
Comprehensive Care for Joint Replacement (CJR) Readiness Kit
 Readiness Kit") Comprehensive Care for Joint Replacement (CJR) Readiness Kit Contents CMS Announces Shift From Volume To Value...2 Top Things To Know About CJR Final Rule...3 Proposed Timeline For CJR...4 Who Is Impacted?...5
Comprehensive Care for Joint Replacement (CJR) Readiness Kit Contents CMS Announces Shift From Volume To Value...2 Top Things To Know About CJR Final Rule...3 Proposed Timeline For CJR...4 Who Is Impacted?...5
CONNECTICUT: ECONOMIC FUTURE WITH EDUCATIONAL REFORM
 CONNECTICUT: ECONOMIC FUTURE WITH EDUCATIONAL REFORM This file contains detailed projections and information from the article: Eric A. Hanushek, Jens Ruhose, and Ludger Woessmann, It pays to improve school
Putting Nanotechnology on the Map
 Executive Summary Putting Nanotechnology on the Map Nanotechnology has the potential to play a key role in local economic development throughout the world over the coming decades. The emergence of nanotechnology
ACOs the Medicare Shared Savings Program And Other Healthcare Reform Payment Methods
 A unique vision for an ever-changing healthcare environment ACOs the Medicare Shared Savings Program And Other Healthcare Reform Payment Methods Presented by Joe Laden, President, ORVA, LLC The Environment
New Models in Payment: Joint Replacements. Sharon Eloranta, MD February 18, 2016
 New Models in Payment: Joint Replacements Sharon Eloranta, MD February 18, 2016 Qualis Health A leading national population health management organization The Medicare Quality Innovation Network - Quality
CHAPTER CHAPTER DUES CANDIDATE & NEW REGULAR RETIRED DESIGNEE DUES
 Listed below are the chapter dues associated with each member type. Chapter dues pricing is set by each chapter and is subject to change. CHAPTER CHAPTER DUES CANDIDATE & NEW REGULAR RETIRED Alabama Central
Contingency Planning. Medicare Competitive Bidding. for. Mike Tootell Harvard Medical Device Congress March 29, 2007
 Contingency Planning for Medicare Competitive Bidding Mike Tootell Harvard Medical Device Congress March 29, 2007 Necessary Disclaimer Speaking as individual Not representative of Abbott Laboratories Medicare
Forces of Change- Seeing Stepping Stones Not Potholes
 May 19, 2014 Forces of Change- Seeing Stepping Stones Not Potholes 2 3 4 Overview Demographics Long Term Care Financing Challenges Broad Health System Challenges Payment Reform Delivery System Reform Where
Medicaid Managed Care 2012 Fiscal Analysts Seminar August 30, 2012
 Medicaid Managed Care 2012 Fiscal Analysts Seminar August 30, 2012 National Conference of State Legislatures Neva Kaye Managing Director for Health System Performance National Academy for State Health
ON THE GLOBAL, REGIONAL & LOCAL ECONOMIC CLIMATE
 ON THE GLOBAL, REGIONAL & LOCAL ECONOMIC CLIMATE ARC Regional Leadership Institute Roger Tutterow, Ph.D. Professor of Economics Mercer University Tutterow_RC@Mercer.edu Saint Simons Island, GA September
Cesarean Delivery Model Meeting the challenge to reduce rates of Cesarean delivery
 Cesarean Delivery Model Meeting the challenge to reduce rates of Cesarean delivery Alan Mills FSA MAAA ND November 13, 2014 Agenda 1. Background 2. The U.S. Cesarean delivery challenge 3. Cesarean Delivery
Improving Care and Managing Costs: Team-Based Care for the Chronically Ill
 Improving Care and Managing Costs: Team-Based Care for the Chronically Ill Cathy Schoen Senior Vice President The Commonwealth Fund www.commonwealthfund.org cs@cmwf.org High Cost Beneficiaries: What Can
1.01 Government Programs: CMS and Pay for Performance: Current Issues. CMS Regional Administrator March 2009
 1.01 Government Programs: CMS and Pay for Performance: Current Issues David Saÿen CMS Regional Administrator March 2009 Overview Why value-based purchasing? What demonstrations are underway? Hospital demonstrations
Value-Based Health Care Delivery: Reimbursement, System Integration, and Growth
 Value-Based Health Care Delivery: Reimbursement, System Integration, and Growth Professor Michael E. Porter Harvard Business School DHCS Health Care Seminar June 4, 2010 This presentation draws on Michael
Listed below are the states in which GIFT has registered to solicit charitable donations and includes the registration number assigned by each state.
 Listed below are the states in which GIFT has registered to solicit charitable donations and includes the registration number assigned by each state. Alabama: AL16-188 Consumer Protection 501 Washington
Reforming Health Care with Savings to Pay for Better Health
 Reforming Health Care with Savings to Pay for Better Health Mark McClellan, MD PhD Director, Initiative on Health Care Value and Innovation Senior Fellow, Economic Studies October 2014 National Forum on
2017 ANNUAL CONFERENCE & LEADERSHIP MEETING REQUEST FOR PROPOSALS
 2017 ANNUAL CONFERENCE & LEADERSHIP MEETING REQUEST FOR PROPOSALS Introduction This is a request for proposal (RFP) for cities interested in hosting the 2017 Sister Cities International Annual Conference.
MEMORANDUM Texas Department of Human Services * Long Term Care/Policy
 MEMORANDUM Texas Department of Human Services * Long Term Care/Policy TO: FROM: LTC-R Regional Directors Section/Unit Managers Marc Gold Section Manager Long Term Care Policy State Office MC: W-519 SUBJECT:
Models of Accountable Care
 Models of Accountable Care Medical Home, Episodes and ACOs Making it work Elliott Fisher, MD, MPH Director, Population Health and Policy The Dartmouth Institute for Health Policy and Clinical Practice
State Innovations in Value-Based Care: ACOs and Beyond
 Advancing innovations in health care delivery for low-income Americans State Innovations in Value-Based Care: ACOs and Beyond Rachael Matulis, Senior Program Officer National Academy of Medicine Value
U.S. Psychology. Departments
 Table of Contents Department Ratings Links Home U.S. Psychology Distinguished Strong Good Departments This page ranks United States doctoral programs in psychology based on the 1995 study conducted by
UNITED STATES HEALTH CARE REFORM: EARLY LESSONS FROM ACCOUNTABLE CARE ORGANIZATIONS
 UNITED STATES HEALTH CARE REFORM: EARLY LESSONS FROM ACCOUNTABLE CARE ORGANIZATIONS Stephen M. Shortell, Ph.D., M.P.H, M.B.A. Blue Cross of California Distinguished Professor of Health Policy and Management
Paying for Outcomes not Performance
 Paying for Outcomes not Performance 1 3M. All Rights Reserved. Norbert Goldfield, M.D. Medical Director 3M Health Information Systems, Inc. #Health Information Systems- Clinical Research Group Created
BETTER CARE AT LOWER COST THROUGH PHYSICIAN LEADERSHIP
 BETTER CARE AT LOWER COST THROUGH PHYSICIAN LEADERSHIP Redesigning Care Delivery, Payment Systems, & Benefit Designs so Physicians, Hospitals, Patients, & Purchasers All Benefit Harold D. Miller President
Aetna at a Glance. Over 35,000 Aetna employees worldwide million medical members million dental members million pharmacy members
 Aetna s Pay for Performance Initiatives Driving Improvement Opportunities Aetna at a Glance People Membership Over 35,000 Aetna employees worldwide 17.467 million medical members 14.166 million dental
Pioneer Accountable Care Organization Model: General Fact Sheet May 22, 2012
 Pioneer Accountable Care Organization Model: General Fact Sheet May 22, 2012 The Pioneer ACO Model is a CMS Innovation Center initiative designed to support organizations with experience operating as Accountable
Figure 10: Total State Spending Growth, ,
 26 Reason Foundation Part 3 Spending As with state revenue, there are various ways to look at state spending. Total state expenditures, obviously, encompass every dollar spent by state government, irrespective
Holding the Line: How Massachusetts Physicians Are Containing Costs
 Holding the Line: How Massachusetts Physicians Are Containing Costs 2017 Massachusetts Medical Society. All rights reserved. INTRODUCTION Massachusetts is a high-cost state for health care, and costs continue
Certificate of Need: Protecting Consumer Interests
 Certificate of Need: Protecting Consumer Interests a perspective of the American Health Planning Association and a variety of state certificate of need programs Thomas R. Piper Director, Missouri Certificate
Ohio SIM: Episode-based Payment Update. Webinar September 21, 2017
 Ohio SIM: Episode-based Payment Update Webinar September 21, 2017 www.healthtransformation.ohio.gov Ohio was awarded a federal grant to test multi-payer, value-based payment models HI WA OR NV CA ID AZ
Tennessee Health Care Innovation Initiative
 Tennessee Health Care Innovation Initiative More information available at: http://www.tn.gov/hcfa/strategic.shtml State Innovation Model grant 2 1 State Innovation Model (SIM) funding Last week the Centers