Value Equation for Healthcare
|
|
|
- Caren Pope
- 5 years ago
- Views:
Transcription
1 Value Equation for Healthcare Value = (Outcomes + Patient Experience) x Appropriateness Cost + Hassle Factor
2 What Do Patients Hire Us to Provide What do they call Value Make the Right Diagnosis Deliver the Correct Therapy / Treatment Outcomes Prevent Complications or Errors in Care Deliver Safe Care regardless of the Inherent Risks Safety Get Me Home, Keep me at Home Respect my needs Give me my Money s Worth Patient / Family Experience Value This is all FLOW management it is essential for SAFETY, PATIENT / FAMILY EXPERIENCE and QUALITY DELIVERY
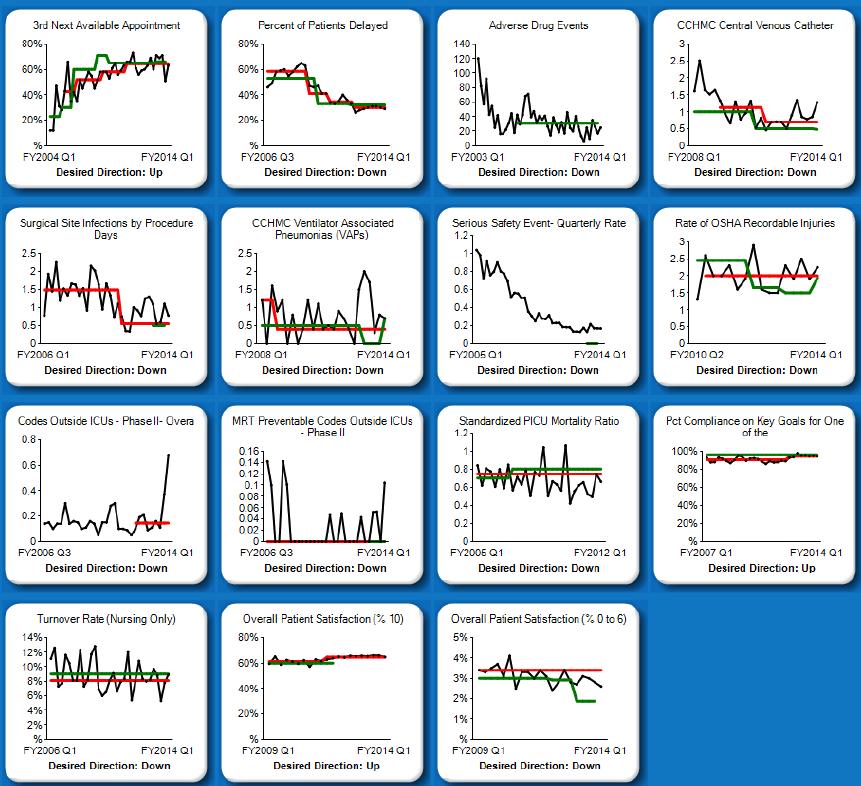
3 Health Care Delivery System Transformation Strategic Improvement Priorities and System Level Measures ACCESS, FLOW, PRODUCTIVITY PATIENT AND EMPLOYEE SAFETY CLINICAL EXCELLENCE, OUTCOMES TEAM WELLBEING PATIENT AND FAMILY EXPERIENCE 3 rd next available appointment % of patients delayed: ED, PICU, PACU Touch Time for care givers Adverse drug events Bloodstream infection rate Surgical site infection rate Infection rates: VAP Serious Safety Events OSHA recordable injury rate Codes outside the ICU rate/1,000 days MRT preventable codes outside the ICU Standardized PICU Mortality Ratio Expected/ Actual % use of Evidence-Based Care for eligible patients Staff Satisfaction Nursing turnover rate Overall Rating: Patient Satisfaction (best possible) Patient Satisfaction (0-6 ) Overall, Inpatient, Outpatient, ED, Urgent Cares, Ambulatory Surgery, Home Health 3


4 4

5 5


6 Hospital Flow - Challenge of Team E D E D Families Nursing O R Patients Medical Staff Housestaff OutPatients I C U InPatients Multiple Sites All Interactive / Interdependent 6
7 Flow is a Safety Initiative Prediction Framework for Safety Getting the Rights Right Right Diagnosis and Treatment Right Patient in Right Bed Location Right Nursing Staff and Staffing Expertise Disease Specific Expertise Equipment Expertise Best Care Model Requires ability to Predict future needs, and manage present capacity control variability Operations Management techniques to understand and manage variability are the key to success
8 Opt Surgery Saturday Surgery Hospital Wide Flow Smoothing OR Schedule Pediatric Adm Schedule More Cases Scheduled Smoothing OR Schedule (Elective Cases) Optimal Use of Inpatient Beds ICU Inflow Smoothing Elective Cases Smoothing Outpatient Admissions Demand : Capacity Matching ICU Outflow Prediction Model Heme Onc Discharge Predictions All Patients Optimal Use of ICU Beds

9 Block with Urgent Access Assured Predictive system Urgent Cases in Defined Rooms with Scheduled Teams Resources needed can be modeled Care based on Urgency / Medical Need
10 Key Drivers for Capacity Management IHI Drivers CCHMC Initiative Operations Possibilities Shape / Reduce Demand Predictable Care Delivery Management of Variability Best Practices, Analysis of ALOS and outliers, Standardize then Customize, Eliminate unnecessary care Identify Patient Streams Inpatient/Outpatient/OR Manage System Variation D/C Match Optimization of Flow Delivery Capacity Prediction Placement initiatives D:C Matching plans Discharge prediction and planning, Home Care, Parent Initiatives Integration of simulation modeling and planning Environmental Impact Reports for growth programs System Re-Design Capacity Management Flow:Safety Matching Simulation for design and patient placement Environments Impact Planning Flow Failure Analysis, GARDiANS
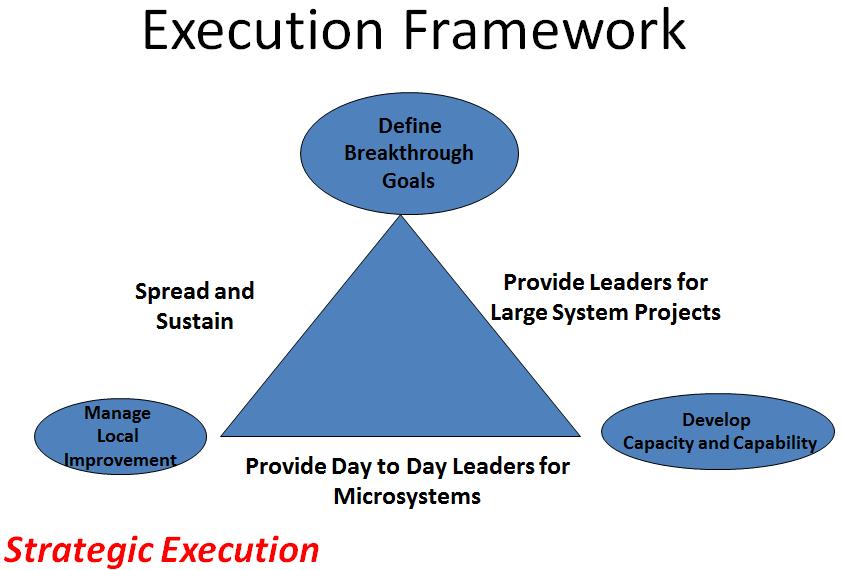
11 Organizing for Transformation Board Oversight Senior Leadership Focus System-Wide Goals CSI Goals Division/Microystem-Based Goals Individual Performance 11
12 Clinical Systems Improvement PATIENT/FAMILY Microsystems: Monitor & act on a dashboard of measures Inpatient Team Outpatient Team ED Team Peri-Op Team Home Care Team Mental Health Team Clinical & Non-Clinical Support Processes Develop, monitor & act on a dashboard of measures Comprised of Patient Services, Faculty, Administrative and Community Physician Leadership Develops, reviews & acts on System Level Measures Clinical System Improvement Integrating Team Board/ Leadership Team Provides strategic priority setting, resource allocation, organizational alignment Serves as champions/coaches to the Clinical Systems Improvement Teams and Sub-teams The Clinical System Improvement reports to the Patient Care Committee of the Board 12
13 Overview Operational & Experience Excellence: The CCHMC Way Objective: To achieve unprecedented performance in safety, flow, experience and outcomes across the inpatient system using high reliability concepts and key process reliability. Hypothesis: Strong integrated unit-based leadership teams, uniformly and reliably applying focused safety, leadership and staffing principles, coupled with key process reliability, advanced situation awareness and risk prediction tools, will dramatically improve patient care and safety while delivering better outcomes and patient experience. Objective: Determine key processes most critical to unit s work and sustain high reliability through leadership reinforcement, engagement & team member competency. Objective: Create a front-line driven system that comprehensively and efficiently presents information necessary for microsystem leadership to effectively manage their units. GARDIANS Daily Risk Management Reliably Execute Key Processes Build Engaged & Committed Teams Objective: Ensure clear understanding, competency and performance of predetermined fundamental behaviors for all team members on every inpatient unit. Patients & Families Objective Reliably implement situation awareness models and tools for successful implementation in both ICUs and non-icus. Reliably Implement Situation Awareness Maintain Resilient Staffing Develop Empowered & Accountable Microsystem Leadership Objective: Identify and develop leaders to achieve high reliability microsystem performance in a structure which is both empowering and accountable. Objective: Ensure staffing effectiveness by making realtime adjustments as needed Key Process Reliability Culture Risk Management & Prediction All areas 2
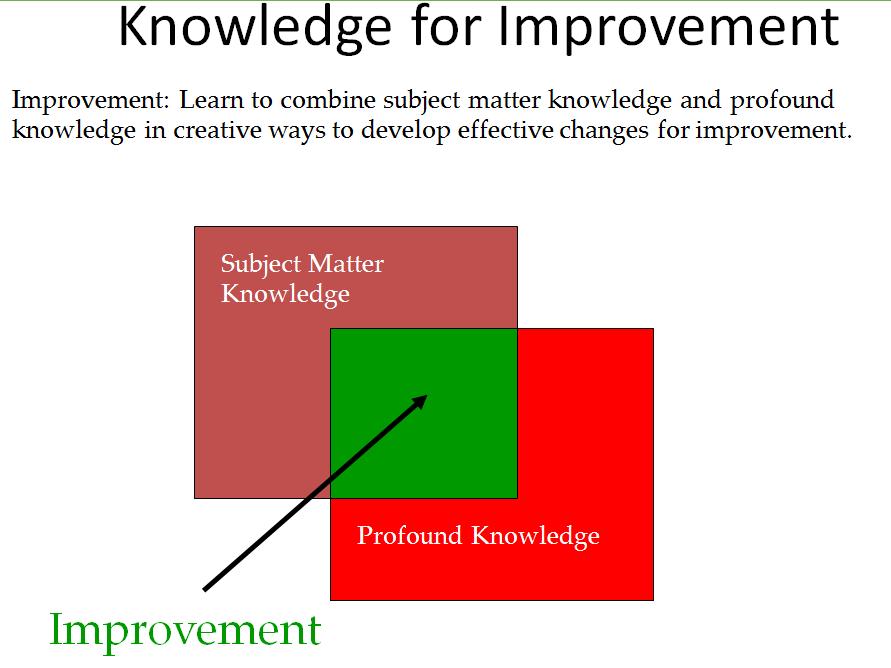
14 Operating Assumptions- Improvement Capability and capacity Building improvement capability at CCHMC goes beyond acquisition of knowledge and skills to action-oriented improvement that achieves critical results and accelerates transformation. As an Academic Medical Center, CCHMC s strategy for building improvement capability focuses on engaging and developing faculty as improvement leaders, educating trainees and advancing the scholarship of health care improvement through rigorous methods and quality improvement research. Different groups of people will have different levels of need for improvement knowledge and skill to achieve results, and each group should receive the training they need when they need it and in the appropriate amount. All members of the organization should incorporate improvement into their daily work and have the ability to advance their improvement knowledge and skills to achieve critical results, and function at any level of the CCHMC improvement ladder.
15

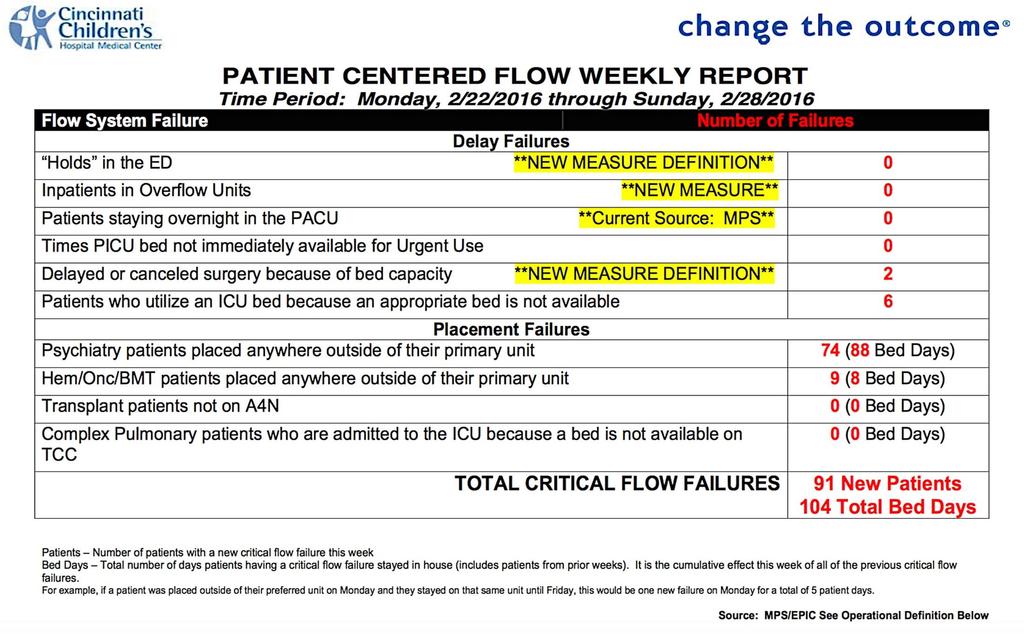
16 Critical Flow Failures 38 Months 39 Months 1 in 38 Months 39 Months
17

18 Delivering on Operations Reliably in a Mesosystem PeriOp Virtual Site Visit B\\Barbara Tofani, RN Frederick C. Ryckman, MD.

19 ICU Admission Model Elective Cases Short Stay Cases Access Cap # Cases on Schedule / Day Long Stay Cases Fixed # Beds
20 ICU Bed Availability ICU Scheduling Category Case Statistics by Category Total PICU Days Case Count ALOS Short (61%) 1.27 (27%) Medium (28%) 3.72 (37%) Long (11%) 9.76 (36%) Grand Total
21

22 Spread Plan

23 Patients who Utilize an ICU bed because an Appropriate Floor Bed is Not Available

24 Strategies for Patient Placement Early Day Beds PICU, CICU Critical Units Later Day Beds All units Demand : Capacity Match Opportunistic with Forethought Specific Bed D:C Match Unit Bed Awareness

25 Critical Care Bed Predictions 2 Types of Demand SCHEDULED: Demand that we know about ahead of time because we have scheduled it (i.e. a planned admission or a planned elective surgical case) UNSCHEDULED: Demand that we don t know about ahead of time. This unscheduled demand is a random pattern that happens every day or year and may or may not be seasonal. ANALYTICS TO IMPROVE FLOW Determine method to control flow Can t control UNSCHEDULED but can understand it better Develop plan for SCHEDULED demand SIMULATION MODELS Determine beds needed for UNSCHEDULED Daily CAP for SCHEDULED procedures to utilize remaining capacity

26 Critical Care Bed Predictions
27

28 Predicting ICU Discharge
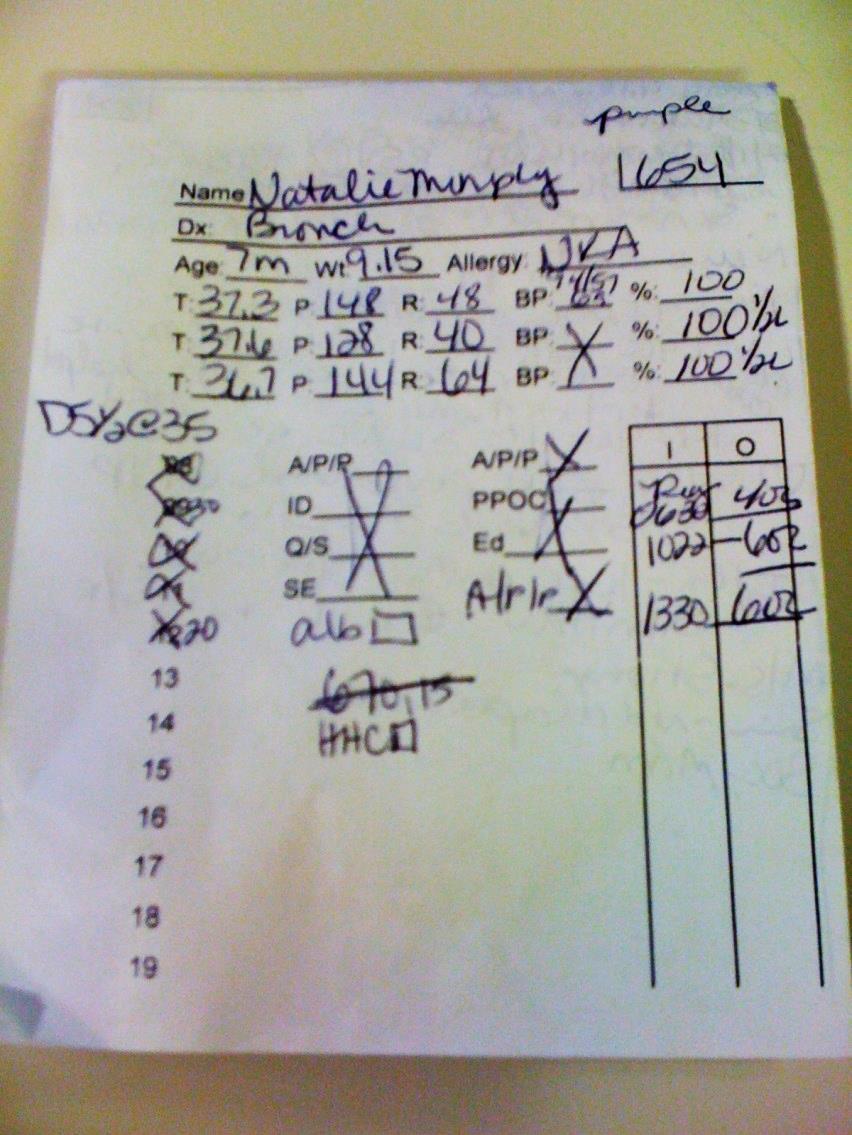
29 Respiratory Care Outside ICU Asthma: Continuous Albuterol On A6S x 5 years On LA-4 x 1 year Bronchiolitis: High Flow Nasal Cannula A6S and LA-4 initiated last respiratory season
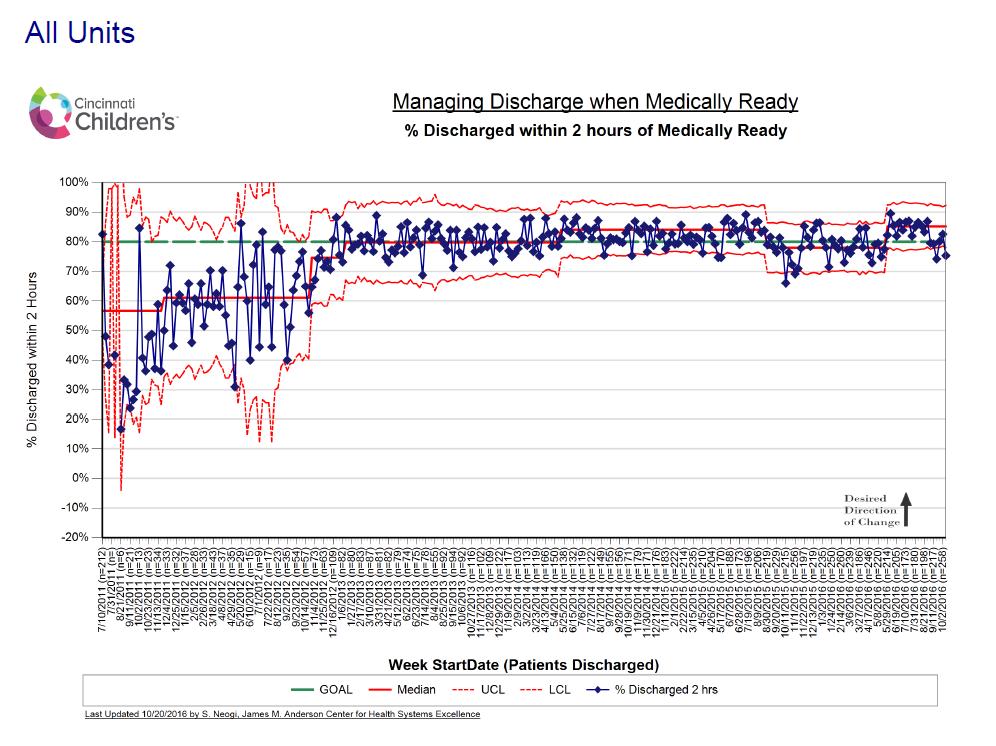
30 Mar-13, n=471 Apr-13, n=582 May-13, n=599 Jun-13, n=571 Jul-13, n=610 Aug-13, n=579 Sep-13, 9/13: n=514 Non-verbal report spread complete Oct-13, n=523 Nov-13, n=492 Dec-13, n=533 Jan-14, n=495 Feb-14, n=463 Mar-14, n=490 Apr-14, n=599 May-14, n=578 Jun-14, n=620 Jul-14, n=624 Aug-14, n=559 Sep-14, n=496 Oct-14, n=564 Nov-14, n=461 Dec-14, n=514 Jan-15, n=477 Feb-15, n=382 2/4/15: Epic transport go live Mar-15, n=479 Apr-15, n=515 May-15, n=514 Jun-15, n=612 Jul-15, n=630 Aug-15, n=593 Sep-15, n=561 Oct-15, n=549 Nov-15, n=517 Dec-15, n=523 Jan-16, n=457 Feb-16, n=533 Mar-16, n=578 Apr-16, n=573 May-16, n=567 Jun-16, n=597 Jul-16, n=535 Aug-16, n=579 5/13: Pend transport within 5 minutes of criteria met 6/13: Standardized phone script 3/14: Eliminated inpatient RN call-back 100% Percent of patients for whom transport is requested by nurse within 5 minutes of meeting discharge criteria Population: Inpatient and short stay surgical patients with a PACU stay who are admitted Desired direction 95% 90% 85% 80% 75% 70% 65% 60% 55% 50% Last updated 9/6/16 by Mike Platt, James M. Anderson Center Month, patients Pct pended within 5 mins Center line = 72.9% (trial) Control limits Goal (66%)
31 Unit/Dept. Calls TT for a Transport Unit/ Dept.(limited) Request Transport via Order Entry (RDE) Transport Tracking Flow Process with TeleTracking System Pages Next Available Escort Closest to the Origin Zone Escort Receives Page and Calls System (2-9616) Call is Accepted and Goes into Dispatched Mode Escort Arrives at Unit/Dept. of Origin Proper Transport or Patient is Set Up and RN is Notified, Escort Call System to Go In-progress Pending Calls in System Transporter notifies system of any delays Idle till next Request Escort becomes Idle Patient Is Received by Receiving Unit/Dept. Escort calls System Call is then Completed
32 Average Minutes ~ Request to Completed I2S2 Patient Escort Improvement Project Baseline 38 Minutes with Manual Dispatch process Automated Dispatch Process 9/4/2006 9/18/ /2/2006 Cancel after 15 minutes 10/16/ /30/ /13/2006 Updated February 4, 2008 Aditional Staff on Friday 11/27/ /11/ Goal 20 Minutes 12/25/2006 PDSA Ramp Reschedule Pt Delays Peri-op PDSA Ramp /8/2007 Supervisor Team Lead Assess & Dispatch 1/22/ /5/2007 2/19/2007 Weekend 3/4/2007 Weekend Alert/ Notification Staffing Adjustment /19/2007 Weekend Radiology Roundtrip's D/C'd 4/2/2007 4/16/2007 Alert/ Notificatio Key Staff, All Shifts 6 Months of Improvement 4/30/2007 5/14/2007 5/28/07 Week of Training for Alert/ Notificatio All Staff, All Shifts 6/11/07 Sustainability Measures Further Reinforced & Solidified 6/25/07 7/9/07 7/23/07 ER Data Feedback 8/6/07 8/20/07 ER Delay Data Collection 3-Sep 9/17/2007 A6S All D/C's PDSA Ramp Begins 9/23/ /7/2007 MRI Rooms #'s Added 10/21/ /3/ /18/2007 D/C's Improvement Project Spread to A6N 12/2/ /16/2007 D/C's Improvement Project Spread to A3N & A7 Almost 11 Months of Sustainability (n = 65,000 trips) 12/30/2007 Temp Handoff Process Audit 100% 1/13/2008 1/27/2008
33
34
35
36 FY17 Operations Management Scorecard OBJECTIVE: Optimize use of facilities and staff and improve patient flow to achieve 20% greater utilization of existing assets Site of Care Sub-Domain Measure FY15 FY16 FY17 Target July Aug Sept Q1 Q2 Q3 Q4 '16 TOT 2016 In-Patient Producti vity (Clinici Physician wrvu/clinical FTE: % Divisions above the 75th Percentile (Pediatrics) Physician wrvu/clinical FTE: % Divisions above the 55% 78% 65% 75% 55% 33% 65% 56% 65% 67% 62% 52% divisi on specif an) 75th Percentile (Surgical Services) ic Pt. Services = Hours per Patient Day % (Target) Space Utilization % Occupancy (All CCHMC w. sub-locations) 81% 77% 71% 68% 74% 71% tbd Critical Care - PICU 80% 78% 75% 65% 68% 69% Critical Care - CICU 75% 70% 75% 84% 87% 82% Critical Care - NICU 90% 89% 93% 82% 93% 92% Acute Care - Main Campus Peds 80% 75% 76% 70% 73% 73% Acute Care - Liberty Campus 50% 35% 30% 33% 34% 32% Acute Care - CBDI 85% 89% 71% 62% 67% 66% Specialty Care - TCC 91% 87% 73% 64% 86% 74% Specialty Care - Rehab 78% 77% 81% 73% 68% 74% Specialty Care - Psych (inpatient only) 83% 83% 61% 69% 86% 72% Flow Critical Flow Failures: Total Holds in the ED PACU Overnight Holds Patients in Other Overflow Units Patients Using ICU Bed Psych Patients Not on Primary Unit HemOnc/BMT Patients Not on Primary Unit System Transfer Delays: Percent of patients delayed 32% 27% 23% 24% 20% 22% 32% (20% ) % of Patients waiting > 2 hours to transfer from the ICU 62% 65% 58% 67% 65% 63% 60% to an inpatient unit % of ED Patients Waiting 1 hour or more for admission 23% 18% 11% 14% 12% 12% 32% Percent of PACU transfers to inpatient units at Base 34% 26% 22% 22% 16% 20% 33% >waiting 20 minutes or more Readmissions - 7 day all cause 4.6% 4.7% 4.6% 4.4% % of patients discharged within 2 hrs of being Medically Ready 82% 80% 86% 86% 85% 86% 80%
37 FY17 Operations Management Scorecard OBJECTIVE: Optimize use of facilities and staff and improve patient flow to achieve 20% greater utilization of existing assets Site of Care Sub-Domain Measure FY15 FY16 FY17 Target July Aug Sept Q1 Q2 Q3 Q4 '16 TOT 2016 Outpatient Space Utilization % Space Utilized (Tot mins of room usage / avail room mins) 67% 71% 72% 68% 70% 70% 70% 70-85% Flow Percent of clinics that start on time (across all locations) 62% 63% 65% 64% 62% 64% 64% 95% Access: Wait for 3rd next available appointment for new visits - % Divisions <=10 days (under development) 66% 61% tbd Productivity Pt. Services = OR Worked Hours to OR Case Hours***'**** (20% ) Space Utilization OR Utilization Rate - Base 74% 75% 76% 76% 74% 75% 75% 75% OR Utilization Rate - Liberty 60% 64% 67% 62% 64% 64% 64% 65% Block Time Utilization - Base 72% 75% 72% 75% Block Time Utilization - Liberty 66% 72% 74% 75% Flow Percent of first cases that start on time 65% 76% 75% 77% 77% 76% 70% OR Flow Failures: Total # of delayed or canceled surgery due to bed capacity failures Flow Median Length of Stay (Hours): Base - Admits Median Length of Stay (Hours): Base - Discharges Median Length of Stay (Hours): Liberty - Admits Median Length of Stay (Hours): Liberty - Discharges % of Patients Left Without Being Seen: Base 3.01% 3.60% 0.71% 1.80% 2.26% 1.63% 2% % of Patients Left Without Being Seen: Liberty 1.15% 2.23% 0.39% 1.25% 1.85% 1.24% 2% Time to First MD (Minutes): Base Time to First MD (Minutes): Liberty Flow Flow Flow Failures: % of ED patients waiting 60 minutes or more for admission to College Hill Flow Failures: % of ED Patients Waiting 60 Minutes or More for Admission to A4C2 - Adolescent Psych Psych Flow Failures: Total # of Psychiatry Patients Placed Outside of Their Primary Unit Flow Failure: # of Patients N-TUC (Not Taken Under Care) Due to Inability to Staff (SUSTAIN) 58% 45% 24% 39% 38% 34% 42% 18% 7% 0% 13% 0% 4% 32% 525 1,
38 Flow as a Safety Initiative Prediction Framework for Safety Getting the Rights Right Right Diagnosis and Treatment Right Patient in Right Bed Location Right Nursing Staff and Staffing Expertise Disease Specific Expertise Equipment Expertise Best Care Model Requires ability to Predict future needs, and manage present capacity - control variability Operations Management techniques to understand and manage variability are the key to success
39 Anticipated Recovery Clinical status Admission Assessment Systematic identification & Mitigation Early Warning Score Medical Emergency Team Effort needed to return to recovery CPR Brady Hospital Pediatrics 2014 Time
40 System that improved situation awareness and reduced untreated clinical deterioration would reliably: Proactively identify patients at risk Through PEWS, gut feeling ( watchers ), high-risk therapies, etc. Mitigate risk on the unit through primary team With specific, time-bound plans and predictions Escalate risk that is not fully addressed Through rapid response teams and scheduled huddles Brady Pediatrics 2013

41 Situation Awareness 1. Gather Information Perception What? 2. Recognize & Understand Comprehension So What? 3. Anticipate Projection What Now? Decide Act Brady Hospital Pediatrics 2014
42 Situation Awareness Model Family concerns Bedside Team Microsystem Team Organization Team High risk therapies Intern Watchstander Senior Resident MRT PEWS>5 Watcher Bedside nurse Watchstander PCF/Manager Safety Team (MPS and SOD) at 800, 1600 & 100 Communication concern Attending Reliable escalation of risk Rapid assessment and communication with primary team

43 Patient List Screen
44 Huddles Short, structured briefings designed to: look back on recent events look forward to upcoming events/emerging threats We integrate 3 tiers of huddles: Microsystem (e.g. general pediatric unit) Mesosystem (e.g. inpatient system) Macrosystem (organizational) Goldenhar BMJ Quality and Safety 2013
45 3 Level High Reliability Huddle System MICRO LEVEL (Unit Huddle) Look back: individual providers report on unexpected events, medical response team calls Look forward: individual providers report on individual patients at risk for safety events Integration: charge nurse considers overall unit status, planned discharges, staffing needs MESO LEVEL (Inpatient Huddle) Look back: charge nurses from each microsystem report on unexpected events, transfers to higher levels of care Look forward: individual microsystems report on higher risk patients in mesosystem, overall unit status Integration Manager of Patient Services (MPS) works with charge nurses to develop plans and predictions for highest risk patients, develop capacity plan through system, predict and mitigate experience failures MACRO LEVEL (Daily Operations Brief) Look back: mesosystem leaders report on unexpected outcomes over last 24 hours, resolution of concerns raised at previous brief Look forward: mesosystem leaders predict and plan for big issues of day with focus on problems at intersections of mesosystems Integration: administrator of the day identifies responsible party(ies) for each concerns and sets clear follow-up

46 Proactive escalation through mesosystem huddle Three times daily discussion of any concerns not fully addressed and any predicted MRTs Includes: Charge nurse from each unit Nurse manager Senior attending Safety Officer Nurse manager and safety officer coach charge nurses
")
47 Safety officer of the day (SOD) Attending-level physician with: gray hair Clinical expertise Organizational expertise Gravitas Skilled communicator and teacher OR maybe? More junior physician with clear access to and authority given from senior leader (e.g., Chief of Staff, CMO)

48 Robust Planning Tool Identifying the problem or concern Making responsible parties aware Forming a plan Predicting an expected outcome Setting a deadline Deciding on an escalation plan if outcome is not met
49

50 Brady Pediatrics 2013 Defined as any patient that is transferred from unit to ICU and within 1 hour is: Intubated Placed on inotropes OR Given 3 or more fluid boluses
51 3/1/2010: Inpatient Situation Awareness 9/1/2010: Surgery Situation Awareness Last 8-10 Years Rate has Decreased 80%

52 Staff were busy and saw Joshua in brief snaps shots of time. The one constant throughout these critical hours was my wife and I. Our observations of Joshua were made with a full understanding of the history and context of his birth and on a continuous basis. As well as knowing their child better than anyone else, parents of children in hospital will always have this continuity and context on their side. BMJ Qual Saf Mar;24(3): doi: /bmjqs Epub 2015 Jan 29


53 Journals from families
54 Conceptual Model: How families identify and communicate about child s evolving illness in hospital Familyfacing factors Evolution of expertise: -Experience with child and child s illnesses -Gateway skills: learned strategies for navigating and communicating -Advocacy skills and confidence Roadblocks and challenges to applying expertise: -Complex system barriers (long processes, large teams) -Medical cultural barriers -Emotional barriers (stress, fear, exhaustion) Communication strategies and skills: -Face-to-face communication -Facilitating a shared understanding with clear and explicit plan of care There s Parent not really anything else for me, except to watch expertise him. You feel like Hospital that s all you do is focus on him and you are frightened system of because We need a plan. And I kind care it s just of joke that, OK, if Partnership the two of you. you don t have the plan, I need a plan to make with clinicians a plan. Shared understanding of child and family status and needs Factors at intersection between families and clinicians Elements of a successful partnership: -Checking assumptions from textbook -Listening and collaboration skills -Respect and empathy Tension with expertise and role: -Unclear role for families that provide care at home -Occasionally competing expertise -Many new faces of clinicians Clinician/system facilitators of improved navigation: -More direct access to the right doctor -Tools/technology to record and share plan -Better continuity of care team and problem list
55 Interventions checklist Item Definition Example Briefing The charge nurse describes situation fully and allows for feedback Charge Nurse: Our watcher is a little 22-month-old. He s a short gut. He just came down from PICU two days ago. He was there for over a week - line infection. They just stopped antibiotics last night and he has spiked again. Verbalize expected time frame Escalation plan is predicted A clear and specific time frame is stated and agreed to during huddle A clear escalation plan (most commonly calling MRT) is stated and the need for it is explicitly predicted Charge Nurse: We are going to re-evaluate at 5. Charge Nurse: If he bradys or is difficult to arouse again, we will call an MRT and get him to the PICU.
56
57 CBDI: Quantitative Measures Identify Volume
58 July_11 (n=1247) Aug_11 (n=1094) Sept_11 (n=1122) Oct_11 (n=1238) Nov_11 (n=1295) Dec_11 (n=1380) Jan_12 (n=1526) Feb_12 (n=1362) Mar_12 (n=1434) Apr_12 (n=1550) May_12 (n=1352) Jun_12 (n=1410) Jul_12 (n=1501) Aug_12 (n=1415) Sep_12 (n=1240) Oct_12 (n=1280) Nov_12 (n=1058) Dec_12 (n=1136) Jan_13 (n=1228) Feb_13 (n=1081) Mar_13 (n=1234) Apr_13 (n=1314) May_13 (n=1368) June_13 (n=1246) Jul_13 (n=1695) Aug_13 (n=1652) Sep_13 (n=1456) Oct_13 (n=1606) Nov_13 (n=1473) Dec_13 (n=1414) Jan_14 (n=1553) Feb_14 (n=1426) Mar_14 (n=1774) Apr_14 (n=2157) May_14 (n=2222) Primary BSI Rate per 1000 line days CBDI: Quantitative Measures Identify Acuity 4.0 Primary BSI Rate in CCHMC CBDI (July 2011-May 2014) Month Monthly Primary BSI Rate Median BSI rate Control Limits
59 Blood Stream Infections per 1000 Line Days Jul-11 (n=1247) Aug-11 (n=1094) Sep-11 (n=1122) Oct-11 (n=1238) Nov-11 (n=1295) Dec-11 (n=1380) Jan-12 (n=1526) Feb-12 (n=1362) Mar-12 (n=1434) Apr-12 (n=1550) May-12 (n=1352) Jun-12 (n=1410) Jul-12 (n=1501) Aug-12 (n=1415) Sep-12 (n=1240) Oct-12 (n=1280) Nov-12 (n=1058) Dec-12 (n=1136) Jan-13 (n=1228) Feb-13 (n=1081) Mar-13 (n=1234) Apr-13 (n=1314) May-13 (n=1368) Jun-13 (n=1246) Jul-13 (n=1695) Aug-13 (n=1652) Sep-13 (n=1456) Oct-13 (n=1606) Nov-13 (n=1473) Dec-13 (n=1414) Jan-14 (n=1553) Feb-14 (n=1426) Mar-14 (n=1774) Apr-14 (n=2157) May-14 (n=2222) Jun-14 (n=2143) Jul-14 (n=1437) Aug-14 (n=1680) Sep-14 (n=1560) Oct-14 (n=1678) Nov-14 (n=0800) Stressed Microsystem: CBDI Outcome Primary Blood Stream Infection Rate in the Cancer and Blood Disease Institute (Infections / 1000 line days) Acute increase in census, phase 1 patients, relapsed refractory patients, national and Increased percentage of floating and inexperienced nursing Implementation of: Identification of high risk patients Improved daily CHG bathing/oral care compliance Increased awareness of high BSI-risk patients Assistance for nurses performing high BSIrisk procedures System to improve allocation of resources 0.0 Month (number of line days) Monthly Blood Stream Infection Rate Average Rate of Blood Stream Infections Control Limits
60 Stressed Microsystem: CBDI Mitigate Interventions Unit Inpatient System Serious Harm: BSI Stabilization of current processes 2 person dressing changes Daily prevention standard rounding with real time feedback Increased education to float staff and review of CVC care by all staff Physician engagement in BSI prevention work Pre assignment of float staff Organization Implementation of a system to improve allocation of resources and support to deescalate system stress Implementation of a experienced based knowledge bonus
61 Blood Stream Infections per 1000 Line Days Jul-11 (n=1247) Aug-11 (n=1094) Sep-11 (n=1122) Oct-11 (n=1238) Nov-11 (n=1295) Dec-11 (n=1380) Jan-12 (n=1526) Feb-12 (n=1362) Mar-12 (n=1434) Apr-12 (n=1550) May-12 (n=1352) Jun-12 (n=1410) Jul-12 (n=1501) Aug-12 (n=1415) Sep-12 (n=1240) Oct-12 (n=1280) Nov-12 (n=1058) Dec-12 (n=1136) Jan-13 (n=1228) Feb-13 (n=1081) Mar-13 (n=1234) Apr-13 (n=1314) May-13 (n=1368) Jun-13 (n=1246) Jul-13 (n=1695) Aug-13 (n=1652) Sep-13 (n=1456) Oct-13 (n=1606) Nov-13 (n=1473) Dec-13 (n=1414) Jan-14 (n=1553) Feb-14 (n=1426) Mar-14 (n=1774) Apr-14 (n=2157) May-14 (n=2222) Jun-14 (n=2143) Jul-14 (n=1437) Aug-14 (n=1680) Sep-14 (n=1560) Oct-14 (n=1678) Nov-14 (n=0800) Stressed Microsystem: CBDI Outcome Primary Blood Stream Infection Rate in the Cancer and Blood Disease Institute (Infections / 1000 line days) Acute increase in census, phase 1 patients, relapsed refractory patients, national and Increased percentage of floating and inexperienced nursing Implementation of: Identification of high risk patients Improved daily CHG bathing/oral care compliance Increased awareness of high BSI-risk patients Assistance for nurses performing high BSIrisk procedures System to improve allocation of resources 0.0 Month (number of line days) Monthly Blood Stream Infection Rate Average Rate of Blood Stream Infections Control Limits
62 Stressed Microsystem: CBDI Key Findings Decrease in primary BSI rate from 1.8 primary BSIs per 1000 line days to 0.21 BSIs per 1000 line days. Prolonged stress in complex systems with high-risk patients can contribute to increased BSI rates. Identifying key processes and executing mitigation strategies at the unit, microsystem and organizational levels can stabilize outcomes when under stress. Building on continued learnings from CBDI helped to identify the next stressed microsystem: NICU.

63 Stressed Microsystem: NICU Mitigate Interventions Unit PICC Team Targeted rounding Prediction (Watchers) Multi disciplinary Huddles 4 times per day Inpatient System Leadership Prevention Standard Rounds: all patients on all units. Weekly report out on all serious harm in leadership meeting. Pre-assignment of float staff. Organization Implementation of a system to improve allocation of resources Organizational support to deescalate system stress Implementation of a experienced based knowledge bonus Added FTE s
64 System Level Key Diagram Team Name: Stressed Microsystems Team Date: September 14, 2015 Revision: 11 Primary Key Drivers Global Aim Develop a system to identify, mitigate and predict microsystem stress in order to prevent serious harm (and other undesirable outcomes). Right factors (quantitative* and qualitative) are identified, validated, then utilized Timely access to the right data representing right factors Effective data analysis, review and data driven decisions Roles and processes for management and decisionmaking are clear Sub-Projects Identification and validation of quantitative factors Volume Staffing Patient Acuity Identification and validation of quantitative factors Duration Stressed System Identification and validation of qualitative factors Assessment of stress level by nursing Appropriate oversight and support by leadership Mitigation and Prediction Strategies KEY Gray box = completed intervention Green box = what we re working on right now White box = future work
65

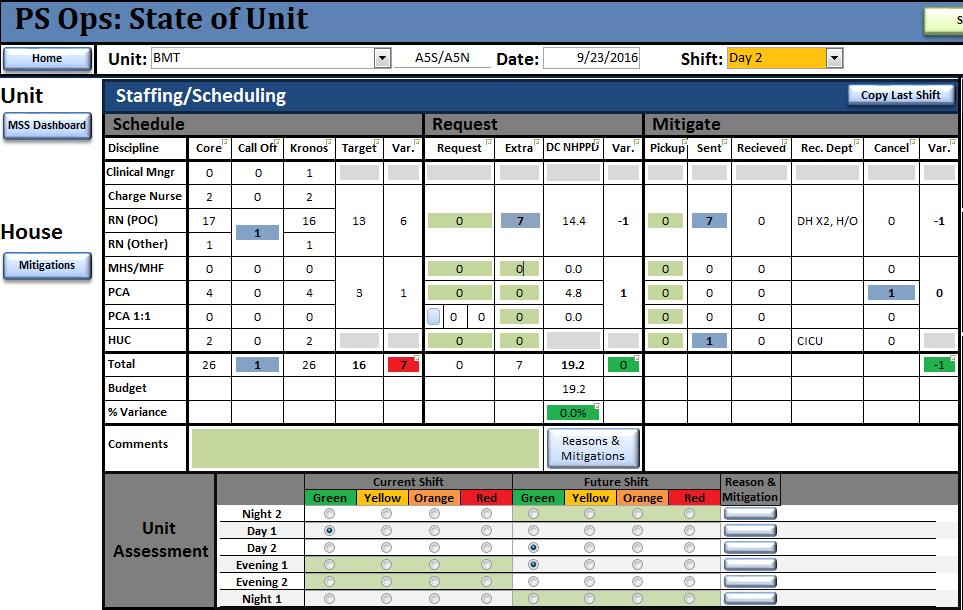
66 Quantitative Factors: Staffing Predict Pick correct shift Add requests for needed staff

67 Quantitative Factors: Staffing Predict NHPPD


68 NICU: Qualitative Pilot Identify Family Stress
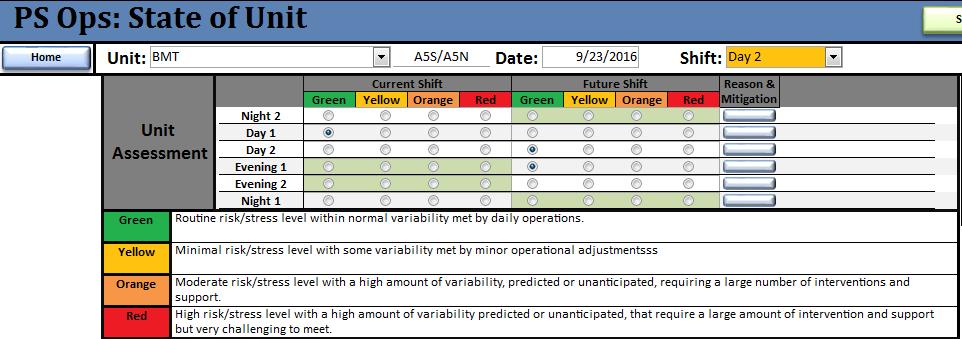
69 Qualitative Scoring Predict IS YOUR UNIT..... GREEN: Routine risk/stress level within normal variability met by daily operations YELLOW: Minimal risk/stress level with some variability met by minor operational adjustments ORANGE: Moderate risk/stress level with high level of variability, predicted or unanticipated that require considerable number of interventions and support RED: High risk/stress level with a high amount of variability predicted or unanticipated, that require a large amount of intervention and support but very challenging to meet.
70 Microsystem Stress: Qualitative Predict Capturing Impact of Stress on Staff Current Process Charge nurses determine overall color rating each shift with input from staff and key roles on their unit Rating is entered into automated system every 4 hours and comment entered if rated orange or red Comments provide information for resource allocation Comments also give insight into why the unit feels stressed Shift and aggregate data is utilized for real-time decisions and weekly trending

71 System Level Qualitative Data Predict Can see the entire day in 4 hour blocks
72 Inpatient Unit Level I Interventions Green Yellow Orange Red Attend bed huddle and Safety meeting. Match clinical resources to patient acuity and care needs. Offer any additional staff to the house. Continue with standard unit practices. Predict & plan for admissions, discharges, and other flow factors today & looking forward. Smooth resources & post shifts not at core and also ask clinical staff and standby to pick up extra shifts based on volume. D/C patients that meet criteria in a timely manner. Predict operational vacancy and staffing impact short term and long term. Strategize for increased RN hiring and orientation for large numbers of open positions. Utilize creative methodologies that expand beyond the unit. Assess available clinical resources and ability to care for patients based on acuity and care needs. Ask available current staff to work additional 4 hours Ask staff to work extra for defined shift with resource need. Ask available current staff to work an additional 4 hours. Request appropriate SRU/float staff for support such as RN, PCA, HUC, and Sitter. Evaluate the need to move support roles into charge or the direct care role. Unit level clinical and medical operational leaders to work on screening admissions and patient placement in collaboration with flow coordinators/mps lead. Make AVP aware of staffing and unit operations. Increase leadership rounding. Evaluate need to move manager into charge or direct care roll Evaluate the need to cancel OPT/Education if resource needs are not satisfactorily met. Evaluate the need to move a manager into charge or direct care role. Evaluate the ability to adjust Assignment with Preceptor/Orientee for Phase IV orientees close to completing orientation. Temporarily increase staff FTE as open positions filled Evaluate the need to cancel unit meetings or cancel staff attendance to department and division meetings. Evaluate the need for additional support from Pastoral services or other resources Consider purchasing food for staff. Evaluate the need for Organizational Support if Ongoing Orange. Unit level clinical and medical operational leaders discuss/determine need to reschedule pre-admissions and/or defer pts. Unit level clinical and medical operational leaders discuss ability to stop admissions and/or transferring patients to another facility. Evaluate the need for the Director to take charge/support role or continue with unit leadership activities to address unit operations. All hands on deck and attending meetings and other activities based on patient care needs and safety being met. All meetings and other non clinical activities cancelled and resources reassigned
73 Inpatient Unit Level II Interventions Green Yellow Orange Red Maintain current processes with distribution of SRU/Float Resources. Consider microsystems that have been stressed for over a week in distribution of resources. Include AVP/VP in discussion around support for unit microsystem. Implement all applicable interventions denoted at Orange level. Evaluate the ability to partner with another unit with similar competency and has a lower volume or more positive operational vacancy. Evaluate the need to pre-assign some SRU resources to promote consistency in support and decrease the staffing Evaluate the need for a special pay program based on prediction of gap. Increase Month s Team support. Evaluate the need for a special pay program based on prediction of operational vacancy and longer term staffing gaps. operational vacancy and longer term staffing gaps. Support manager and educators working extra clinical shifts. Evaluate the need to increase RN and Allied Health resources permanently related to new trends in ADC. Implement if appropriate. Evaluate the ability to cancel or hold off on accepting Destination and Tertiary Patients depending on clinical need, impact on program, etc. Evaluate the need for the use of Supplemental staff. Post positions if needed. Provide support to providers to assist with rounding and other clinical work.


74 From Disparate Data HIGH RELIABILITY DATA STRATEGY To Actionable Intelligence Data reported via multiple mechanisms due to sources and systems Data is reported as a single point in time Data is retrospective with little ability to identify opportunities to act Frequency of data review is reviewed monthly or quarterly Budgeted AWC AWC % Occupancy To Budgeted ADC % Occupancy to Capacity % 86.2% Performance report cards sent several weeks following monthly/quarterly close Data exists in one place, or automatically linked Data is trended over time with centerlines Data are routinely being used to predict performance and drive real-time decisions Frequency of data review is weekly or daily Performance report sent ahead or accessed real-time during huddles and other planning meetings
75 Unit level harm and stress Time Period of Stress Data Special Cause Last Updated 3/9/2015 by A. Anneken, James M. Anderson Center for Health Systems Excellence

76 Microsystem Dashboard CONCEPT Microsystem Outcomes Composite Measure Microsystem Key Processes (Nursing) Capacity Demand DRAFT Some measures are not completely operationalized. Measures are owned by various groups.
77 Qualitative Scoring Predict IS YOUR UNIT..... GREEN: Routine risk/stress level within normal variability met by daily operations YELLOW: Minimal risk/stress level with some variability met by minor operational adjustments ORANGE: Moderate risk/stress level with high level of variability, predicted or unanticipated that require considerable number of interventions and support RED: High risk/stress level with a high amount of variability predicted or unanticipated, that require a large amount of intervention and support but very challenging to meet.
78

79 Microsystem Stress Report Predict B4 NICU % % 88.5% % 9.0% % % 7 1.4% 4.8% 0.0% 4.8%
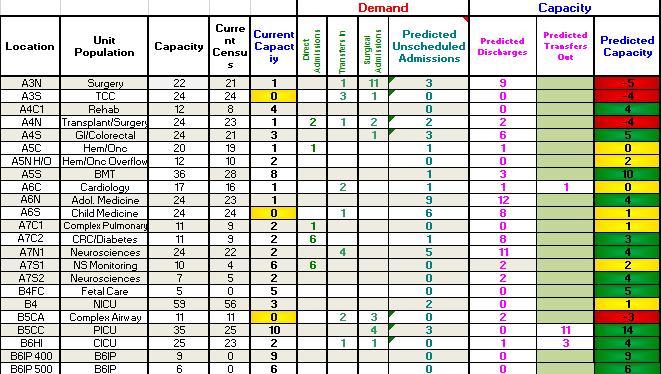
80 Week of: 9/11/2016 to 9/17/2016 Microsystem Stress Report Location Unit Population Capacity % Budgeted Occupancy Budgeted ADC Demand - Occupancy ADC % Occupancy To Budgeted ADC % Occupancy to Capacity Budgeted Bedside Care NHPPD Actual Average Direct Care NHPPD Variance to Direct Care NHPPD % Variance of Direct Care NHPPD Capacity - Staffing % Operational Vacancy Hours of Float Staff % Float Staff Hours Orientation % Orientatin Hours # of >13 hour Shift % 13 hour Shifts CN Assessment % Orange Shifts % Red Shifts % Orange and Red Shifts A3N Surgery % % 71.5% % 10.69% % % 2 2.2% 0.0% 0.0% 0.0% A3S TCC % % 79.0% % 19.43% % % 4 2.4% 7.1% 0.0% 7.1% A4C1 Rehab % % 55.4% % -7.50% % 0 0.0% 0 0.0% 0.0% 0.0% 0.0% A4N Transplant/Surgery % % 62.6% % 7.54% % % 1 0.9% 0.0% 0.0% 0.0% A4S GI/Colorectal % % 64.5% % 5.68% % % 1 0.8% 0.0% 0.0% 0.0% A5C Hem/Onc % % 85.1% % 2.67% % % 2 1.0% 0.0% 0.0% 0.0% A5S BMT % % 52.6% % 22.32% % % 1 0.5% 0.0% 0.0% 0.0% A6C Cardiology % % 77.2% % 23.08% % % 4 3.5% 2.4% 0.0% 2.4% A6N Adol. Medicine % % 77.1% % 2.67% % % 3 2.7% 0.0% 0.0% 0.0% A6S Child Medicine % % 75.0% % 9.42% % 0 0.0% 2 1.6% 4.8% 0.0% 4.8% A7C1 Complex Pulmonary % % 74.7% % 13.81% % % 1 1.8% 0.0% 2.4% 2.4% A7C2 CRC/Diabetes % % 45.0% % 40.18% % 0 0.0% 0 0.0% 0.0% 0.0% 0.0% A7NS Neurosciences % % 66.7% % 9.86% % % 5 2.5% 0.0% 7.1% 7.1% B4 NICU % % 93.3% % 9.75% % % % 9.5% 0.0% 9.5% B5CA Complex Airway % % 56.1% % 1.54% % 0 0.0% 0 0.0% 0.0% 0.0% 0.0% B5CC PICU % % 73.7% % 18.37% % % 6 1.7% 0.0% 0.0% 0.0% B6HI CICU % % 88.3% % % % % 9 3.0% 16.7% 21.4% 38.1% LA4-1 Lib CBDI % % 14.0% % 0.00% % 0 0.0% 0 0.0% 0.0% 0.0% 0.0% LA4-2 Lib Hosp Med % % 32.7% % 0.00% % 0 0.0% 0 0.0% 0.0% 0.0% 0.0% Total % % 69.4% % % % 2.1% 1.6% 3.8% Status Criteria Red Yellow Green < 90%; > 105% 90% - 95%; 100% - 105% 95% - 100% < -5% > 12% > 15% > 10 % Microsystem Stress Report
81 How Are We Using This Information? Identify Mitigate Predict Guides drill-downs into the data, why are the number high or low and do we have opportunity? Initiative around sitter use Supports responding to trended data: Increase and/or reissuing RN FTEs Increase SRU RNs preassigned to an area Implement additional staffing interventions Utilize in decision making around distribution of resources from SRU Helps to predict intervention needs and explain current state Trended data helps to show duration
82 Impact of Growth on Critical Care Bed Needs PICU Growth Bone Marrow Transplant Neurosurgery ENT/ Airway Oncology Organ Transplants How many Critical Care Beds do we need to support growth and effectively utilize our facilities? What will happen if areas exceed their targets? When will we begin to run out of critical care beds? CICU Growth Heart Transplant Cardiomyopathy Adult Cardiothoracic Surgery Non-Surgical

83 Short Term Bed Prediction The ability to predict inpatient bed demand aids in determining appropriate clinical staffing and planning for overflow needs The scope of this project is to predict census, admissions, and discharges on seventeen inpatient units providing 10 day view of bed demand We have flow failures each week. Could we have predicted these failures and intervened? Can we insure that we have adequate staffing and resources available for our future demand? 83

84 Critical Care Bed Growth Analysis

85 Make it Personal Don t let the Data Drown out the Dream Stories not Statistics Names and Faces Accountability is Personal Group Responsibility & Collective Mission/Vision Cincinnati Children s Hospital Medical Center 2013
4/12/2016. High Reliability and Microsystem Stress. We have no financial, professional or personal conflict of interest to disclose.
 High Reliability and Microsystem Stress Helping leaders identify and mitigate unit level stress: Next steps towards the journey of high reliability Whittney Brady RN, DNP Jackie Hausfeld, RN, MSN, NEA-BC
Building Systems and Leadership for Transformation
 Building Systems and Leadership for Transformation April 7, 2016 Dr. Uma Kotagal Senior Fellow Executive Leader, Population and Community Health Efforts Cincinnati Children s Hospital Medical Center "It
Increased situational awareness to reduce undetected deterioration
 Increased situational awareness to reduce undetected deterioration SPSP Paediatric Care WebEx Patrick W. Brady, MD, MSc Associate Professor of Pediatrics Division of Hospital Medicine Objectives Understand
Shaping Demand: Managing Elective OR Schedules and Predicting Downstream Demand
 This presenter has nothing to disclose. Shaping Demand: Managing Elective OR Schedules and Predicting Downstream Demand Flow Symposium Nov. 2016 Frederick C. Ryckman, MD Professor of Surgery / Transplantation
Matching Capacity and Demand:
 We have nothing to disclose Matching Capacity and Demand: Using Advanced Analytics for Improvement and ecasting Denise L. White, PhD MBA Assistant Professor Director Quality & Transformation Analytics
Hospital Flow Case Study: Cincinnati Children s Hospital
 Hospital Flow Case Study: Cincinnati Children s Hospital Frederick C. Ryckman, MD Professor of Surgery / Transplantation Sr. Vice President Medical Operations Cincinnati Children s Hospital Cincinnati,
Welcome Aboard: A Children s Adventure
 IHI um Virtual Site Visit to Cincinnati Children s Hospital Medical Center 1 Welcome Aboard: A Children s Adventure 2 1 The Transformation Journey: Improvement, Caring, Integration, Transparency Uma Kotagal,
2017/18 Quality Improvement Plan Improvement Targets and Initiatives
 2017/18 Quality Improvement Plan Improvement Targets and Initiatives AIM Measure Change Effective Effective Care for Patients with Sepsis % Eligible Nurses who have Completed the Sepsis Education Bundle
Putting It All Together: Strategies to Achieve System-Wide Results
 1 Putting It All Together: Strategies to Achieve System-Wide Results Katharine Luther, Lloyd Provost, Pat Rutherford Hospital Flow Professional Development Program April 4-7, 2016 Cambridge, MA Session
1. November RN VACANCY RATE: Overall 2320 RN vacancy rate for areas reported is 12.5%
 PATIENT CARE SERVICES REPORT Submitted to the Joint Conference Committee, December 2013 Terry Dentoni, RN, MSN, CNL, Interim Chief Nursing Officer 1. November 2013-2320 RN VACANCY RATE: Overall 2320 RN
8/31/2015. Session C826 Evidence-Based Staffing Strategies Support Healthy Work-Life Balance Rachael Schweikert, RN Kevin Schwedhelm MSN RN
 Session C826 Evidence-Based Staffing Strategies Support Healthy Work-Life Balance Rachael Schweikert, RN Kevin Schwedhelm MSN RN Nurse Staffing Core vs. Float Staff 30 years ago 20-10 years ago 5 yrs Prior
Driving High-Value Care via Clinical Pathways. Andrew Buchert, MD Gabriella Butler, MSN, RN
 Driving High-Value Care via Clinical Pathways Andrew Buchert, MD Gabriella Butler, MSN, RN 1 Andrew Buchert, MD Medical Director, Clinical Resource Management Children s Hospital of Pittsburgh of UPMC
Why Do Flow? The Cincinnati Children s Hospital Journey. December 11, 2017
 December 11, 2017 Why Do Flow? The Cincinnati Children s Hospital Journey Frederick C. Ryckman, MD Professor of Surgery / Transplantation - Retired Sr. Vice President Medical Operations Cincinnati Children
Page 347. Avg. Case. Change Length
 Page 345 EP 8 How nurses use trended data to formulate the staffing plan and acquire necessary resources to assure consistent application of the Care Delivery Model(s). The development of operational budgets
Why Do Flow? The Cincinnati Children s Hospital Journey
 Why Do Flow? The Cincinnati Children s Hospital Journey Frederick C. Ryckman, MD Professor of Surgery / Transplantation Retired; Sr. Vice President Medical Operations, Cincinnati Children s Hospital, University
Advancing Accountability for Improving HCAHPS at Ingalls
 iround for Patient Experience Advancing Accountability for Improving HCAHPS at Ingalls A Case Study Webconference 2 Managing your audio Use Telephone If you select the use telephone option please dial
Using Quality Improvement to Optimize Pediatric Discharge Efficiency
 This presenter has nothing to disclose Using Quality Improvement to Optimize Pediatric Discharge Efficiency Christine White MD, MAT Associate Professor-Hospital Medicine Cincinnati Children s Hospital
1. March RN VACANCY RATE: Overall 2320 RN vacancy rate for areas reported is 13.8%
 PATIENT CARE SERVICES REPORT Submitted to the Joint Conference Committee, April 2014 Terry Dentoni, RN, MSN, CNL, Interim Chief Nursing Officer 1. March 2014-2320 RN VACANCY RATE: Overall 2320 RN vacancy
REASSESSING THE BED COORDINATOR S ROLE SHADY GROVE ADVENTIST HOSPITAL
 Publication Year: 2008 REASSESSING THE BED COORDINATOR S ROLE SHADY GROVE ADVENTIST HOSPITAL Summary: Creation of Bed Coordinator position to improve patient flow throughout the entire hospital Hospital:
CAMDEN CLARK MEDICAL CENTER:
 INSIGHT DRIVEN HEALTH CAMDEN CLARK MEDICAL CENTER: CARE MANAGEMENT TRANSFORMATION GENERATES SAVINGS AND ENHANCES CARE OVERVIEW Accenture helped Camden Clark Medical Center, (CCMC), a West Virginia-based
Departments to Improve. February Chad Faiella RN, Terri Martin RN. 1 Process Excellence
 Coordination of Multiple Departments to Improve ED Throughput February 2011 Chad Faiella RN, Terri Martin RN 1 Agenda OhioHealth information Grant Medical Center facts Bed assignment process Key takeaways
Massachusetts ICU Acuity Meeting
 Massachusetts ICU Acuity Meeting Acuity Tool Certification and Reporting Requirements Acuity Tool Certification Template Suggested Guidance Acuity Tool Submission Details Submitting your acuity tool for
PATIENT CARE SERVICES REPORT Submitted to the Joint Conference Committee, February 2013 Terry Dentoni, RN, MSN, CNL, Interim Chief Nursing Officer
 PATIENT CARE SERVICES REPORT Submitted to the Joint Conference Committee, February 2013 Terry Dentoni, RN, MSN, CNL, Interim Chief Nursing Officer 1. 2320 RN Vacancy Rates for the Month of January 2013
Moving the Needle on Hospital Throughput: Breaking Through the Status Quo. Session ID: 325
 Moving the Needle on Hospital Throughput: Breaking Through the Status Quo Session ID: 325 Objectives Objective 1: Demonstrate how two common strategies can be deployed to maximum benefit to support improvements
Relational Coordination: An Imperative Influencing our Capacity to Reach the Core
 Relational Coordination: An Imperative Influencing our Capacity to Reach the Core Linda Q. Everett, PhD, RN, NEA-BC, FAAN Executive Vice President & Chief Nurse Executive Indiana University Health 12/7/2012
Hip Today Home Tomorrow:
 Hip Today Home Tomorrow: A Collaborative Effort between an Orthopedic Practice and a Hospital to Create an Innovative Outpatient Total Hip Replacement Program Kimberley Murray RN MS CNS-CNOR Kelly Keenan
MINISTRY/LHIN ACCOUNTABILITY AGREEMENT (MLAA) MLAA Performance Assessment Dashboard /10 Q3
 MLAA Performance Assessment Dashboard /10 Q3") MINISTRY/LHIN ACCOUNTABILITY AGREEMENT (MLAA) MLAA Performance Assessment Dashboard - 29/1 Q3 README The 29/1 MLAA Dashboard has been designed to reflect various reporting fiscal periods as well as the
MINISTRY/LHIN ACCOUNTABILITY AGREEMENT (MLAA) MLAA Performance Assessment Dashboard - 29/1 Q3 README The 29/1 MLAA Dashboard has been designed to reflect various reporting fiscal periods as well as the
Improvements & Sustained Change through the Implementation of High Reliability Units
 Improvements & Sustained Change through the Implementation of High Reliability Units Tammy Van Dyk, MSN, RN, CPEN Quality Management & Patient Safety Manager Objective Describe how high reliability principles
The Case for Optimal Staffing: A Call to Action
 The Case for Optimal Staffing: A Call to Action 2015 ANCC National Magnet Conference October 7, 2015 2:30 3:30pm Session C721 Mary Jo Assi, DNP, RN, NEA BC, FNP BC Director of Nursing Practice and Work
Enhancing Communication Skills: A Catalyst for Organizational Cultural Transformation Presented by William Maples, MD, Chief Medical Officer,
 Enhancing Communication Skills: A Catalyst for Organizational Cultural Transformation Presented by William Maples, MD, Chief Medical Officer, Professional Research Consultants and Executive Director, The
Fee: The fee for the 12-month renewal is $10,000.
 CHILDHOOD CANCER AND BLOOD DISORDERS NETWORK 2017 RENEWAL TOOLS HOW TO Renew To renew, simply submit a completed Childhood Cancer & Blood Disorders Network Renewal Form to Gena Paulk via email at gena.paulk@childrenshospitals.org.
SOUTHAMPTON UNIVERSITY HOSPITALS NHS TRUST Trust Key Performance Indicators May Regular report to Trust Board
 SOUTHAMPTON UNIVERSITY HOSPITALS NHS TRUST Trust Key Performance Indicators May 20 Report to: Trust Board July 20 Report from: Sponsoring Executive: Aim of Report/Principle Topic: Review History to date:
Quality Improvement Plan (QIP) Narrative for Health Care Organizations in Ontario
 Narrative for Health Care Organizations in Ontario") Quality Improvement Plan (QIP) Narrative for Health Care Organizations in Ontario 4/1/2014 This document is intended to provide health care organizations in Ontario with guidance as to how they can develop
Quality Improvement Plan (QIP) Narrative for Health Care Organizations in Ontario 4/1/2014 This document is intended to provide health care organizations in Ontario with guidance as to how they can develop
Leveraging the Accountable Care Unit Model to create a culture of Shared Accountability
 Leveraging the Accountable Care Unit Model to create a culture of Shared Accountability How we improved Patient Safety and Quality Outcomes at Northwest Hospital Our Journey to Shared Accountability Implementation
Strategies to Achieve System-Wide Hospital Flow
 M15 This presenter has nothing to disclose Strategies to Achieve System-Wide Hospital Flow Katharine Luther and Pat Rutherford IHI s 26th Annual National Forum on Quality Improvement in Health Care December
Nottingham University Hospitals Emergency Department Quality Issues Related to Performance
 RCCG/GB/14/123 Nottingham University Hospitals Emergency Department Quality Issues Related to Performance Introduction NUH have failed to meet the 95% 4 hour wait standard for a number of consecutive months.
National Readmissions Summit Safe and Reliable Transitions: An Integrated Approach Reducing Heart Failure Readmissions
 National Readmissions Summit Safe and Reliable Transitions: An Integrated Approach Reducing Heart Failure Readmissions Michael Kanter, MD, Medical Director Quality and Clinical Analysis Patti Harvey, RN,
Redesign of Front Door
 Redesign of Front Door Transforming Acute and Urgent Care Strategic Background and Context Our Change and Improvement Programme What have we achieved and how? What did we learn? Ian Aitken, General Manager
Session 92AB Improving Patient Experience and Outcomes Using Real-Time Care Rounding Technology
 Prepared for the Foundation of the American College of Healthcare Executives Session 92AB Improving Patient Experience and Outcomes Using Real-Time Care Rounding Technology Presented by: Sue Murphy Alison
Quality and Efficiency Support Team (QuEST) Directorate for Health Workforce and Performance
 Directorate for Health Workforce and Performance") Quality and Efficiency Support Team (QuEST) Directorate for Health Workforce and Performance A Whole System Approach to Patient Flow for Scotland Our Quality Improvement Approach Jane Murkin Programme
Quality and Efficiency Support Team (QuEST) Directorate for Health Workforce and Performance A Whole System Approach to Patient Flow for Scotland Our Quality Improvement Approach Jane Murkin Programme
Introduction. Staffing to demand increases bottom line revenue for the facility through increased volume and throughput and elimination of waste.
 Learning Objectives Define a process to determine the appropriate number of rooms to run per day based on historical inpatient and outpatient case volume. Organize a team consisting of surgeons, anesthesiologists,
Improving Pain Center Processes utilizing a Lean Team Approach
 Improving Pain Center Processes utilizing a Lean Team Approach Organization Name: St. Joseph Medical Center Type: Acute Care Hospital Contact Person: Sue Mitchell Title: Nurse Mgr Pain Mgmt Center E-Mail:
RTT Recovery Planning and Trajectory Development: A Cambridge Tale
 RTT Recovery Planning and Trajectory Development: A Cambridge Tale Linda Clarke Head of Operational Performance Addenbrooke s Hospital I Rosie Hospital Apr 2014 May 2014 Jun 2014 Jul 2014 Aug 2014 Sep
9/15/2017 THROUGHPUT. IT S NOT JUST AN EMERGENCY DEPARTMENT ISSUE LEARNING OBJECTIVES
 THROUGHPUT. IT S NOT JUST AN EMERGENCY DEPARTMENT ISSUE D O N N A C R I M M I N S - B O N N E L L, B S N, M H S M, C P H Q, L S S G B LEARNING OBJECTIVES 1) Define who is affected by inefficiency in throughput
From Implementation to Optimization: Moving Beyond Operations
 From Implementation to Optimization: Moving Beyond Operations Session 260, March 8, 2018 Scott Aikey, Sr. Director, Core Clinical Applications Children s Hospital of Philadelphia 1 Conflict of Interest
Carol Dwyer Chris Slaughter. 50th percentile NDNQI. Jan-16 Plans in place. 80th percentile May-15 (Hospital target)
") PEOPLE People A: Work Place Satisfaction and Quality of Life 1. Conduct annual RN satisfaction survey with focus on nursing practice scale. 2. Develop effective strategies and skills for powerful Nurse
PEOPLE People A: Work Place Satisfaction and Quality of Life 1. Conduct annual RN satisfaction survey with focus on nursing practice scale. 2. Develop effective strategies and skills for powerful Nurse
Building a Smarter Healthcare System The IE s Role. Kristin H. Goin Service Consultant Children s Healthcare of Atlanta
 Building a Smarter Healthcare System The IE s Role Kristin H. Goin Service Consultant Children s Healthcare of Atlanta 2 1 Background 3 Industrial Engineering The objective of Industrial Engineering is
Managing Healthcare Payment Opportunity Fundamentals CENTER FOR INDUSTRY TRANSFORMATION
 Managing Healthcare Payment Opportunity Fundamentals dhgllp.com/healthcare 4510 Cox Road, Suite 200 Glen Allen, VA 23060 Melinda Hancock PARTNER Melinda.Hancock@dhgllp.com 804.474.1249 Michael Strilesky
Balanced Scorecard Highlights
 Balanced Scorecard Highlights Highlights from 2011-12 fourth quarter (January to March) Sick Time The average sick hours per employee remains above target this quarter at 58. Human Resources has formed
HIMSS Nicholas E. Davies Award of Excellence Case Study Nebraska Medicine October 10, 2017
 HIMSS Nicholas E. Davies Award of Excellence Case Study Nebraska Medicine October 10, 2017 Nebraska Medicine $1.2 billion academic health system 8,000 employees More than 1,000 affiliated physicians Primary
Winning at Care Coordination Using Data-Driven Partnerships
 Idriz Limaj, LNHA, RN Chief Operating Officer Winning at Care Coordination Using Data-Driven Partnerships Session #166, February 22, 2017 1 Steven Littlehale, MS, GCNS-BC EVP & Chief Clinical Officer Speaker
ASCO s Quality Training Program
 ASCO s Quality Training Program Project Title: Reduction of Time from Admission to Initiation of Chemotherapy on Inpatient Hematology and Bone Marrow Transplant Services Presenter s Name: Ryan J. Mattison,
PATIENT CARE SERVICES REPORT Submitted to the Joint Conference Committee, March 2018
 Report Contents: PATIENT CARE SERVICES REPORT Submitted to the Joint Conference Committee, March By: Terry Dentoni, MSN, RN, CNL - ZSFG Chief Nursing Officer 1. Professional Nursing......1-2 2. Emergency
Improving Outcomes for High Risk and Critically Ill Patients
 Improving Outcomes for High Risk and Critically Ill Patients KP Woodland Hills Medical Center Presented by: Sharon M. Kent RN BSN, CCRN Lynne M. Agocs-Scott RN MN, CCRN CCNS Introduction of the IHI The
Standardising Acute and Specialised Care Theme 3 Governance and Approach to Hospital Based Services Strategy Overview 28 th July 2017
 Standardising Acute and Specialised Care Theme 3 Governance and Approach to Hospital Based Services Strategy Overview 28 th July 2017 Background Theme 3 builds upon previous key strategic commissioning
Board Briefing. Board Briefing of Nursing and Midwifery Staffing Levels. Date of Briefing August 2017 (July 2017 data)
") Board Briefing Board Briefing of Nursing and Midwifery Staffing Levels Date of Briefing August 2017 (July 2017 data) This paper is for: Sponsor: Chief Nurse- Dame Eileen Sills (DBE) Decision Author: Workforce
Board Briefing Board Briefing of Nursing and Midwifery Staffing Levels Date of Briefing August 2017 (July 2017 data) This paper is for: Sponsor: Chief Nurse- Dame Eileen Sills (DBE) Decision Author: Workforce
Safer Nursing and Midwifery Staffing Recommendation The Board is asked to: NOTE the report
 To: Board of Directors Date of Meeting: 26 th July 20 Title Safer Nursing and Midwifery Staffing Responsible Executive Director Nicola Ranger, Chief Nurse Prepared by Helen O Dell, Deputy Chief Nurse Workforce
Introduction. Singapore. Singapore and its Quality and Patient Safety Position 11/9/2012. National Healthcare Group, SIN
 Introduction Singapore and its Quality and Patient Safety Position Singapore 1 Singapore 2004: Top 5 Key Risk Factors High Body Mass (11.1%; 45,000) Physical Inactivity (3.8%; 15,000) Cigarette Smoking
Catherine Porto, MPA, RHIA, CHP Executive Director HIM. Madelyn Horn Noble 3M HIM Data Analyst
 1 Catherine Porto, MPA, RHIA, CHP Executive Director HIM Madelyn Horn Noble 3M HIM Data Analyst University of New Mexico Hospitals» The state s only academic medical center» The primary teaching hospital
From Big Data to Big Knowledge Optimizing Medication Management
 From Big Data to Big Knowledge Optimizing Medication Management Session 157, March 7, 2018 Dave Webster, RPh MSBA, Associate Director of Pharmacy Operations, URMC Strong Maria Schutt, EdD, Director Education
Multi disciplinary Team Communication and Effective Handoffs
 Multi disciplinary Team Communication and Effective Handoffs Lauren Destino, MD Clinical Associate Professor Associate Medical Director of the Pediatric Hospital Medicine Division Stanford University,
Board Briefing. Board Briefing of Nursing and Midwifery Staffing Levels. Date of Briefing January 2018 (December 2017 data)
") Board Briefing Board Briefing of Nursing and Midwifery Staffing Levels Date of Briefing January 2018 (December 2017 data) This paper is for: Sponsor: Chief Nurse- Dame Eileen Sills (DBE) Decision Author:
Board Briefing Board Briefing of Nursing and Midwifery Staffing Levels Date of Briefing January 2018 (December 2017 data) This paper is for: Sponsor: Chief Nurse- Dame Eileen Sills (DBE) Decision Author:
Countywide Emergency Department Ambulance Patient Transfer of Care Report Performance Report
 Countywide Emergency Department 9-1-1 Ambulance Patient Transfer of Care Report Performance Report Prepared by: Contra Costa Emergency Medical Services Visit us at www.cccems.org 2/11/2016 Contra Costa
Pharmaceutical Services Report to Joint Conference Committee September 2010
 Pharmaceutical Services Report to Joint Conference Committee September 21 Background: Pharmaceutical Services staffing has increased by 31 FTE from 26 due to program changes and to comply with regulatory
Decreasing Environmental Services Response Times
 Decreasing Environmental Services Response Times Murray J. Côté, Ph.D., Associate Professor, Department of Health Policy & Management, Texas A&M Health Science Center; Zach Robison, M.B.A., Administrative
Sheffield Teaching Hospitals NHS Foundation Trust
 Sheffield Teaching Hospitals NHS Foundation Trust @seamlesssurgery Seamless Surgery Team Sheffield Teaching Hospitals NHS Foundation Trust July 2017 PROUD TO MAKE A DIFFERENCE PROUD TO MAKE A DIFFERENCE
Emergency Department Throughput
 Emergency Department Throughput Patient Safety Quality Improvement Patient Experience Affordability Hoag Memorial Hospital Presbyterian One Hoag Drive Newport Beach, CA 92663 www.hoag.org Program Managers:
Taming Length of Stay Challenges Through Analytics
 Taming Length of Stay Challenges Through Analytics March 3, 2016 Dr. Michelle Pezzani, Medical Director Utilization Management at El Camino Hospital & Palo Alto Medical Foundation (PAMF) Petrina Griesbach
Preventing Health Care Associated Infections. PJ Brennan, MD Chief Medical Officer University of Pennsylvania Health System August 16, 2011.
 Preventing Health Care Associated Infections PJ Brennan, MD Chief Medical Officer University of Pennsylvania Health System August 16, 2011 Lind 2 Gaps in Knowldege? Pathogenesis Epidemiology Prevention
Section XIII Capacity Management / Throughput
 Section XIII Capacity Management / Throughput Summary of Recommendations Assessment Methodology Observations of Patient Throughput Processes Common Themes Assessment and Recommendations Case Management
LESSONS LEARNED IN LENGTH OF STAY (LOS)
") FEBRUARY 2014 LESSONS LEARNED IN LENGTH OF STAY (LOS) USING ANALYTICS & KEY BEST PRACTICES TO DRIVE IMPROVEMENT Overview Healthcare systems will greatly enhance their financial status with a renewed focus
FEBRUARY 2014 LESSONS LEARNED IN LENGTH OF STAY (LOS) USING ANALYTICS & KEY BEST PRACTICES TO DRIVE IMPROVEMENT Overview Healthcare systems will greatly enhance their financial status with a renewed focus
BEDSIDE REGISTRATION CAPE CANAVERAL HOSPITAL
 Publication Year: 2004 BEDSIDE REGISTRATION CAPE CANAVERAL HOSPITAL Summary: Cape Canaveral hospital implemented a streamlined bedside registration process in order to reduce the time patients spent waiting
Integrating Quality Into Your CDI Program: The Case for All-Payer Review
 7th Annual Association for Clinical Documentation Improvement Specialists Conference Integrating Quality Into Your CDI Program: The Case for All-Payer Review Katy Good, RN, BSN, CCDS, CCS CDI Program Coordinator
Strategic KPI Report Performance to December 2017
 Strategic KPI Report Performance to December 2017 Trust Board 25 th January 2018 Strategic KPI summary SROs: All Directors Objective KPI SRO Target Apr May Jun Jul Aug Sep Oct Nov Success Is Deliver A
Session 183, March 7, 2018 Sue Murphy, RN, BSN, MS, Chief Experience Officer, UChicago Medicine
 Chief Experience Officer: The New Leader Driving Innovation to Transform Healthcare for Patients, Families and Care Teams Session 183, March 7, 2018 Sue Murphy, RN, BSN, MS, Chief Experience Officer, UChicago
UNIVERSITY OF ILLINOIS HOSPITAL & HEALTH SCIENCES SYSTEM HOSPITAL DASHBOARD
 September 8, 20 UNIVERSITY OF ILLINOIS HOSPITAL & HEALTH SCIENCES SYSTEM HOSPITAL DASHBOARD UI Health Metrics FY Q4 Actual FY Q4 Target FY Q4 Actual 4th Quarter % change FY vs FY Average Daily Census (ADC)
Bold Goal PI Radar Dashboard
 Bold Goal PI Radar Dashboard Helen Macfie, Pharm.D., FABC Chief Transformation Officer Certified Lean Leader For IHI Patient Safety Executive Development Course, September, 2016 This presenter has nothing
Establishing a Culture of Quality and Safety and the Journey to High Reliability
 Establishing a Culture of Quality and Safety and the Journey to High Reliability Becker s Hospital Review May 9, 2013 Charles D. Stokes System Chief Operating Officer M. Michael Shabot, M.D. System Chief
PRISM Collaborative: Transforming the Future of Pharmacy PeRformance Improvement for Safe Medication Management
 PRISM Collaborative: Transforming the Future of Pharmacy PeRformance Improvement for Safe Medication Management Mission: To improve the health of the people of Connecticut through safe and effective medication
Heart Failure Order Sets. Standardizing Care for the Heart Failure Patient 2012
 Heart Failure Order Sets Standardizing Care for the Heart Failure Patient 2012 Objectives: Standardize care for all heart failure patients in Legacy Base Practice on American Heart Association Guidelines
Quality Improvement Plans (QIP): Progress Report for the 2016/17 QIP
: Progress Report for the 2016/17 QIP") Quality Improvement Plans (QIP): Progress Report for the QIP Medication Reconciliation ID Measure/Indicator from as stated on QIP 2017 1 Best possible medication history(bpmh) completion: The total number
Quality Improvement Plans (QIP): Progress Report for the QIP Medication Reconciliation ID Measure/Indicator from as stated on QIP 2017 1 Best possible medication history(bpmh) completion: The total number
Residency Completion Record
 Residency Completion Record The following is a list of minimum requirements each resident must successfully complete in order to be considered for graduation from their residency program. If a resident
CLABSI Prevention Hardwiring Improvement
 CLABSI Prevention Hardwiring Improvement Brian Koll MD, FACP, FIDSA Executive Director, Infection Prevention Mount Sinai Health System Professor of Medicine, Icahn School of Medicine September 29, 2014
Improving Hospital Performance Through Clinical Integration
 white paper Improving Hospital Performance Through Clinical Integration Rohit Uppal, MD President of Acute Hospital Medicine, TeamHealth In the typical hospital, most clinical service lines operate as
Using Care Bundles to Reduce Catheter Associated Blood Stream Infections in the NICU. Dr David Ng Paediatric Medical Officer Sarawak General Hospital
 Using Care Bundles to Reduce Catheter Associated Blood Stream Infections in the NICU Dr David Ng Paediatric Medical Officer Sarawak General Hospital Outline of Presentation Introduction Definition of CABSI
Rapid Assessment and Treatment (R.A.T.) Team to the Rescue. The Development and Implementation of a Rapid Response Program at a Regional Facility
 Team to the Rescue. The Development and Implementation of a Rapid Response Program at a Regional Facility") Rapid Assessment and Treatment (R.A.T.) Team to the Rescue The Development and Implementation of a Rapid Response Program at a Regional Facility Dynamics 2013 Lethbridge Chinook Regional Hospital 276 Bed
Rapid Assessment and Treatment (R.A.T.) Team to the Rescue The Development and Implementation of a Rapid Response Program at a Regional Facility Dynamics 2013 Lethbridge Chinook Regional Hospital 276 Bed
April Clinical Governance Corporate Report Narrative
 April 14 - Clinical Governance Corporate Report Narrative ITEM 7B Narrative has been provided where there is something of note in relation to a specific metric; this could be positive improvement, decline
Transitions in Care. Discharge Planning Pathway & Dashboard
 Transitions in Care Discharge Planning Pathway & Dashboard Scott Jarrett Executive Vice President and Chief of Clinical Programs Humber River Hospital Carol Hatcher Vice President Clinical Programs Humber
Creating Data-driven Strategies to Improve Hospital Outcomes
 Annual National Institute October 16, 2014 Creating Data-driven Strategies to Improve Hospital Outcomes A Case Manager s Guide Information Data Knowledge 1 2014 Conifer Health Solutions, LLC. All Rights
Results from Contra Costa Regional Medical Center
 Results from Contra Costa Regional Medical Center Karin Stryker, MBA DSRIP Manager, Health Services Administrator Chris Farnitano, MD Medical Director, Ambulatory Care High Impact Interventions Sepsis
PATIENT CARE SERVICES REPORT Submitted to the Joint Conference Committee, May 2010 Sharon McCole-Wicher, RN, MS, Chief Nursing Officer
 PATIENT CARE SERVICES REPORT Submitted to the Joint Conference Committee, May 2010 Sharon McCole-Wicher, RN, MS, Chief Nursing Officer 1. April 2010 2320 RN VACANCY RATE: Overall 2320 RN vacancy rate for
Riverside s Vigilance Care Delivery Systems include several concepts, which are applicable to staffing and resource acquisition functions.
 1 EP8: Describe and demonstrate how nurses used trended data to formulate the staffing plan and acquire necessary resources to assure consistent application of the Care Delivery System(s). Riverside Medical
Minnesota Perspective: Fairview Health Services. National Accountable Care Organization Congress October 25, 2010
 Minnesota Perspective: Fairview Health Services National Accountable Care Organization Congress October 25, 2010 Fairview Overview Not-for-profit organization established in 1906 Partner with the University
Quality Improvement Plan (QIP) Narrative for Health Care Organizations in Ontario
 Narrative for Health Care Organizations in Ontario") Quality Improvement Plan (QIP) Narrative for Health Care Organizations in Ontario 3/31/2016 This document is intended to provide health care organizations in Ontario with guidance as to how they can develop
Quality Improvement Plan (QIP) Narrative for Health Care Organizations in Ontario 3/31/2016 This document is intended to provide health care organizations in Ontario with guidance as to how they can develop
Hospital Patient Flow Capacity Planning Simulation Model at Vancouver Coastal Health
 Hospital Patient Flow Capacity Planning Simulation Model at Vancouver Coastal Health Amanda Yuen, Hongtu Ernest Wu Decision Support, Vancouver Coastal Health Vancouver, BC, Canada Abstract In order to
Stakeholder input is gathered in several ways. Patients are given the opportunity to provide feedback, the SWOT analysis is based on information from
 Strategic Plan 27 Executive Summary The following is a summary of the information shared in this Operations Review and Plan. This plan highlights operational achievements and challenges, clinical outcomes
Greetings from Michelle & Katie QUALITY IMPROVEMENT DIVISION OF HOSPITAL MEDICINE
 IN THIS ISSUE: Create Raving Fans of Your Idea P. 1 Where is our waste? P. 1 Sepsis Update P. 3 Quality Updates P. 4 APeX quality tips P.5 Division Incentive Metrics P. 6 Focus Group Findings P. 2 The
Translating Evidence to Safer Care
 Translating Evidence to Safer Care Patient Safety Research Introductory Course Session 7 Albert W Wu, MD, MPH Former Senior Adviser, WHO Professor of Health Policy & Management, Johns Hopkins Bloomberg
Benchmarking and Key Metrics Utilized by HSCT Administrators. Clint Divine, MBA, MSM Administrative Director, BMT
 Benchmarking and Key Metrics Utilized by HSCT Administrators Clint Divine, MBA, MSM Administrative Director, BMT 1 When you ve seen one HSCT program, you ve seen one HSCT program Although, there are many
Financial Disclosure. Learning Objectives. Reducing GI Surgery Re-Admissions, While Increasing Patient Satisfaction
 Reducing GI Surgery Re-Admissions, While Increasing Patient Satisfaction Michelle Guibault, BSN, BS, RN Co-Author: D. Leigh Webb, MPH, CTR WellStar Health System, Marietta, GA Nothing to disclose Financial