AN ANALYSIS OF FACTORS AFFECTING HCAHPS SCORES AND THEIR IMPACT ON MEDICARE REIMBURSEMENT TO ACUTE CARE HOSPITALS THESIS
|
|
|
- Loraine Hampton
- 6 years ago
- Views:
Transcription
1 AN ANALYSIS OF FACTORS AFFECTING HCAHPS SCORES AND THEIR IMPACT ON MEDICARE REIMBURSEMENT TO ACUTE CARE HOSPITALS THESIS Presented to the Graduate Council of Texas State University-San Marcos in Partial Fulfillment of the Requirements for the Degree Master of BUSINESS ADMINISTRATION by Amy Mandaville, B.S., M.A. San Marcos, Texas December 2012
2 AN ANALYSIS OF FACTORS AFFECTING HCAHPS SCORES AND THEIR IMPACT ON MEDICARE REIMBURSEMENT TO ACUTE CARE HOSPITALS Committee Members Approved: William Chittenden, Chair Francis Méndez Ravi Jillapalli Approved: J. Michael Willoughby Dean of the Graduate College
3 COPYRIGHT by Amy Mandaville 2012
4 FAIR USE AND AUTHOR S PERMISSION STATEMENT Fair Use This work is protected by the Copyright Laws of the United States (Public Law , section 107). Consistent with fair use as defined in the Copyright Laws, brief quotations from this material are allowed with proper acknowledgement. Use of this material for financial gain without the author s express written permission is not allowed. Duplication Permission As the copyright holder of this work, I, Amy Mandaville, authorize duplication of this work, in whole or in part, for educational or scholarly purposes only.
5 ACKNOWLEDGEMENTS The author acknowledges the committee members whose knowledge and support were invaluable in the completion of this paper. She also is grateful to her husband, Kevin Mandaville, for his tireless encouragement. Finally, she would like to mention her colleagues at University Medical Center at Brackenridge who inspired her to pursue additional academic endeavors. This manuscript was submitted on October 21, v
6 TABLE OF CONTENTS Page ACKNOWLEDGEMENTS...v LIST OF TABLES... viii LIST OF FIGURES...x ABSTRACT... xi CHAPTER I. INTRODUCTION...1 II. REVIEW OF THE LITERATURE...3 III. PURPOSE OF THE STUDY...6 IV. RESEARCH OBJECTIVES...7 V. SURVEY DATA...8 Description of the sample...9 Incompatibilities between samples...21 VI. METHODS Factor Analysis...22 General Linear Regression Analysis and ANOVA...22 Nonparametric Analysis...23 Quantile Analysis...24 vi
7 VII. RESULTS Page Factor Analysis...25 General Linear Regression Analysis and ANOVA...27 Nonparametric Analysis...47 Quantile Regression...51 VIII. CONCLUSION...63 IX. APPENDIX A: HCAHPS SURVEY...66 X. APPENDIX B: DATA CODES...70 XI. APPENDIX C: QUANTILE ANALYSIS RESULTS TABLES...73 XII. BIBLIOGRAPHY...83 vii
8 Table LIST OF TABLES Page 1. AGE DISTRIBUTION HOSPITAL SIZE DISTRIBUTION AGE DISTRIBUTION HOSPITAL SIZE DISTRIBUTION AGE DISTRIBUTION HOSPITAL SIZE DISTRIBUTION TOTAL AGE DISTRIBUTION TOTAL HOSPITAL SIZE DISTRIBUTION TEACHING STATUS DISTRIBUTION LANGUAGE DISTRIBUTION RACE DISTRIBUTION CORRELATION COEFFICIENTS (KENDALL TAU) FACTOR LOADINGS (VARIMAX ROTATION) MODEL 1 RESULTS MODEL 2 RESULTS MODEL 3 RESULTS MODEL 1 RESULTS MODEL 2 RESULTS MODEL 3 RESULTS MODEL 1 RESULTS MODEL 2 RESULTS MODEL 3 RESULTS...43 viii
9 Table Page 23. MODEL GOODNESS OF FIT RESULTS FOR MODEL GOODNESS OF FIT RESULTS FOR MODEL GOODNESS OF FIT RESULTS FOR ROBUST MEASURES OF CENTER AND DISPERSION, ROBUST MEASURES OF CENTER AND DISPERSION, ROBUST MEASURES OF CENTER AND DISPERSION, QUANTILE SUMMARY FOR TEACHING QUANTILE REGRESSION COMPARISONS QUANTILE SUMMARY FOR TEACHING QUANTILE REGRESSION COMPARISONS QUANTILE SUMMARY FOR th QUANTILE REGRESSION RESULTS th QUANTILE REGRESSION RESULTS th QUANTILE REGRESSION RESULTS th QUANTILE REGRESSION RESULTS th QUANTILE REGRESSION RESULTS th QUANTILE REGRESSION RESULTS th QUANTILE REGRESSION RESULTS th QUANTILE REGRESSION RESULTS th QUANTILE REGRESSION RESULTS...82 ix
10 Figure LIST OF FIGURES Page 1. Distribution of Hospital Ratings Scree Plot for 2005 Survey Comparison of Ratings for Comparison of Ratings for Comparison of Ratings for Base Case Quantile Comparison Chart Pain Control Quantile Comparison Chart Base Case Quantile Comparison Chart Pain Control Quantile Comparison Chart Base Case Quantile Comparison Chart Pain Control Quantile Comparison Chart Teaching Quantile Comparison Chart...61 x
11 ABSTRACT AN ANALYSIS OF FACTORS AFFECTING HCAHPS SCORES AND THEIR IMPACT ON MEDICARE REIMBURSEMENT TO ACUTE CARE HOSPITALS by Amy Mandaville, B.S., M.A. Texas State University-San Marcos December 2012 SUPERVISING PROFESSOR: WILLIAM CHITTENDEN Patient responses to the Hospital Consumer Assessment of Healthcare Providers and Systems (HCAHPS) for 2005, 2006, and 2007 were analyzed to determine if a pattern of responses correlated with overall acute care hospital ratings. Although a statistically significant difference was noted between major teaching hospitals, minor teaching hospitals, and non-teaching hospitals, there was no practical significance observed when other variables were added. Pain control and nurse interaction with patients were the variables found to be most closely correlated with overall hospital ratings. xi
12 I. INTRODUCTION Medicare is a national health insurance program passed into law in 1965 to provide guaranteed medical coverage for aged and disabled citizens. Medicare is administered by the federal government and currently provides healthcare coverage for U.S. citizens 65 years or older, as well as younger individuals with disabilities and those with permanent kidney disease. It is funded by employee/employer payroll taxes and by premiums deducted from Social Security checks. Medicare is divided into four defined benefits. Part A covers hospital care, Part B provides outpatient services, Part C (or Medicare Advantage) allows participation in a federally subsidized private health plan, and Part D encompasses prescription drug coverage (Social Security 2012). Medicare is the single largest source of reimbursement for medical services in the United States, paying $318,009,000,000 to healthcare providers in Most recipients of Medicare services are over 65 years old, but 16.85% of Medicare patients are younger and disabled (U.S. Social Security Administration 2011). Starting in October 2012, Medicare will begin reimbursing hospitals based on patient satisfaction survey scores. Under the CMS's (Centers for Medicare and Medicaid Services) proposal, Medicare will begin withholding 1% of its payments to hospitals starting in October That money $850 million in the first year will go into a pool to be doled out as bonuses to hospitals that score above average on several measures. Patient survey scores would determine 30% of the bonuses, while clinical measures for basic quality care would set 1
13 2 the rest (Rau 2011). Medicare will increase hospital payments withholding to 2% in 2017 (Adamy 2012). The implications of this funding change may be significant for hospitals that serve patients who are not likely to report high patient satisfaction. Examination of differences in patient satisfaction scores between different types of hospitals and factors measured may yield useful information about adjustments that might be considered to render more equitable distribution of funds under the new system.
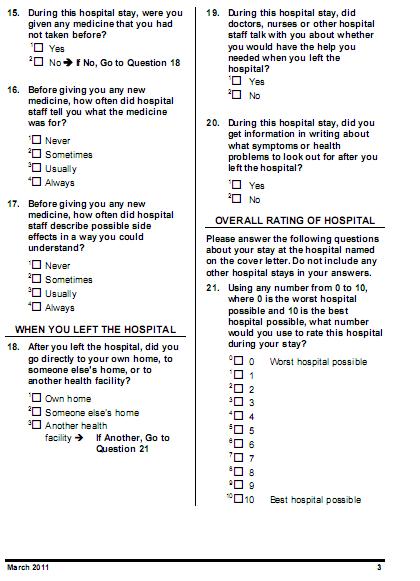
14 II. REVIEW OF THE LITERATURE Although patient satisfaction surveys have been used in the healthcare community for many years, there was not an approved standardized instrument to compare different facilities before In addition, the information from the surveys was not publicly reported. In September 1999, an organization was founded to improve national healthcare quality, including standardizing health quality measurement and reporting, called the National Quality Forum (NQF) (National Quality Forum 2011). With the consensus of a variety of stakeholders and in cooperation with RAND, Harvard Medical School, and the American Institutes for Research (Gage 2008), NQF formally endorsed the Hospital Consumer Assessment of Healthcare Providers and Systems (HCAHPS) Survey as an instrument that would produce comparable, reportable data about patient care perceptions in May 2005 (Services 2011). The HCAHPS is a patient satisfaction survey consisting of 27 questions that can be administered by four possible methods or modes: mail, telephone, mail followed by telephone, or active interactive voice response (IVR). Eighteen of the questions are patient rating items that cover communication with doctors, communication with nurses, responsiveness of hospital staff, pain management, communication about medicines, discharge information, cleanliness of environment, and quietness of the hospital environment (Services 2011). Additional questions include screener items, such as 3
15 4 overall hospital rating and whether the patient would recommend the hospital demographic items to assist with analysis of the information collected. The survey is available in English, Spanish, Chinese, Russian, and Vietnamese. A copy of the English survey is included in Appendix A (HCAHPS Hospital Survey 2012). It is well documented (Young 2000) (Fenton 2012) that different demographics of patients respond differently to patient satisfaction survey questions, which will now affect hospital reimbursement. Patient characteristics, as well as mode of survey, were considered in a study by O Malley in 2005 to develop a model for case-mix adjustment and not penalize hospitals unfairly for types of patients and disorders that present to the hospital. The study indicated that hospital service (surgery, obstetric, medical), age, race (non-hispanic black), education, general health status, speaking Spanish at home, having a circulatory disorder, and interactions of each of these variables with service modestly but significantly affected patient satisfaction ratings (O'Malley 2005, 2162). More recent information indicated that ratings of nurses, doctors, and pain management had the most impact on HCAHPS scores (Maxfield 2012). Identical results were determined in the findings of this study. Other healthcare facilities have conducted research into variables affecting patient satisfaction scores. Dr. James Merlino, chief experience officer at the Cleveland Clinic, which scores below average on seven of nine key patient-satisfaction questions, tells Kaiser Health News that doctors and nurses have done their own studies and concluded that very sick and depressed patients give skewed views. Very ill patients are less likely to report that nurses check in on them every hour even when logs prove they did, he says (Suttell 2011). It was also found that patients who receive emergency care are
16 5 more likely to rate their experiences poorly than patients who receive scheduled care (Gage 2008). Based on the studies of patient characteristics, CMS determined that an adjustment for mode of survey and patient mix, including emergency room admission (HCAHPS - Hospital Care Quality Care Information from the Customer Perspective 2008), prior to reporting the data on was warranted (Hospital Compare 2012). The adjustment appeared to have a lesser impact on scores than on overall hospital rating, but CMS felt that the adjustment reduced bias in the comparison of hospitals, particularly for hospitals that served lower socio-economic patients and those with multiple co-morbidities affecting overall health (Gage 2008). However, there is concern in the medical community that all variables that contribute to patient satisfaction scores have not been considered. For example, teaching hospitals, which provide educational experience to the next generation of physicians, are 33% more costly than non-teaching hospitals (Cameron 1985) and only 10% of them reportedly can compete with non-teaching hospitals based on the provision of patient services (Grosskopf 2001) (Weissman 2002) (Khuri 2001). Although some studies indicate improved patient survival rates and measures of quality care in teaching hospitals (Allison 2011), perceptions of patient satisfaction are not necessarily correlated to better medical care (Fenton 2012). In fact, some research shows that teaching hospital and other large hospitals receive worse patient evaluations than other hospitals, a factor that CMS will not consider in its funding decisions (Weaver 2011).
17 III. PURPOSE OF THE STUDY The HCAHPS survey is being used to measure hospital patient satisfaction nationally, and the results will be utilized to determine Medicare funding within the next year. Research about survey mode and patient-mix has resulted in adjustment to scores to accommodate factors that might unfairly lead to lower scores. However, no research has addressed whether or not scores for teaching hospitals have statistically significantly lower scores than the average score of non-teaching hospitals, despite literature to indicate that teaching hospitals may indeed have lower scores and require higher costs to operate than non-teaching hospitals. Changes in Medicare funding will negatively affect teaching hospitals ability to train new physicians, impacting healthcare across the country. Additional factors, such as pain control, nurse interactions and physician interactions, and their affects on hospital ratings, have not been extensively examined. This study, then, will examine the relationship between factors such as teaching hospitals patient satisfaction survey scores and those of non-teaching hospitals, pain control variables, and nurse and physician interactions with patients. A statistically significant difference between these factors may allow CMS to examine adjustment to HCAHPS scores prior to posting them publicly and adjusting levels of reimbursement accordingly. This information is significant for healthcare providers, healthcare administrators, and any individual who will access hospital healthcare services. 6
18 IV. RESEARCH OBJECTIVES In order to determine whether HCAHPS scores vary by different factors, a description of the responses and the population of respondents will be presented. A descriptive analysis of the data will be performed in order to determine the characteristics of the hospitals in the sample. The composition of the sample will be compared to the composition of the target population of hospitals. A factor analysis will be performed to observe how consistently the individual items load with groupings designated by HCAHPS as nurse care and MD care. These groups will be analyzed separately. The study will present analysis of how these sources of care and the general hospital experience are related to overall quality ratings. As noted in the literature review, quality ratings can be influenced by patients overall health rating, educational level, race/ethnicity, language spoken in the home, age, and gender. Pain management was not included in previous research (O'Malley 2005), but it will be included in this study as a possible predictor of patient satisfaction. Size of hospital and hospital ownership are not variables that have been suggested to influence patient satisfaction ratings significantly, and they will not be included in the study. In addition, teaching hospitals are suggested by the literature to have lower patient satisfaction scores and higher costs than non-teaching hospitals and are one focus of this investigation. 7
19 V. SURVEY DATA Raw data from HCAHPS surveys from 2005, 2006, and 2007 were obtained from the CAHPS database in Rockville, MD. Current information indicates that HCAHPS survey responses have remained essentially flat over the last five years, varying no more than 8% from year to year (Maxfield 2012), indicating that the raw data obtained from should be valid for current analysis. The data required some manipulation in order to complete the analyses. Unlike the HCAHPS surveys response files for 2006 and 2007, the data from 2005 surveys were not coded with hospital size, ownership, or teaching status in the same data set; therefore, those hospital codes were added to the 2005 data to facilitate the comparison and the analysis. For the variable age, the code 999 was used as a nonresponse or missing data flag. The 999s were replaced with the missing data identifier used in R language ( NA ). Finally, some of the data utilized actual ages of the patient, while other data were coded as age ranges. Since for the 2006 and 2007 files only ranges are available, the actual ages in the 2005 data were categorized following the same convention of the files for 2006 and All question responses on the HCAHPS survey were recoded from negative to positive, with the exception of Overall Health rating in the survey. In order to compare items during analysis, the Overall Health rating responses were recoded to place the most negative rating as the first 8
20 9 possible response and the most positive rating as the last possible response. The teaching status, hospital size, hospital ownership, and age range codes can be found in Appendix B. Finally, hospital service (obstetric, medical, or surgical) was not coded in the 2005 data but was available for the 2006 and 2007 data. Description of the sample The 2005 HCAHPS data consist of 151,296 responses from 254 hospitals. 52,322 (34.58%) of respondents were male and 96,912 (64.05%) respondents were female. Gender was not specified in 2062 (1.36%) cases. A total of 26,849 (17.75%) responses were from major teaching hospitals, 49,487 (32.70%) were from minor teaching hospitals, and 74,960 (49.55%) were from non-teaching hospitals. A total of 3,332 (2.20%) responses were from non-profit hospitals, 114,433(75.64%) were from for-profit hospitals, and 33,531(22.16%) were from non-federal government hospitals. A total of 182 respondents in this data set were minor children, under the age of 18. These responses for minor children were eliminated from the study because they will not be included in Medicare reimbursement changes in the future. The following tables show age distributions and hospital size in the 2005 data set:
21 10 TABLE 1: AGE DISTRIBUTION 2005 Age Number of Respondents Percentage of Respondents % % % % % % % % % % % % % % % Totals % TABLE 2: HOSPITAL SIZE DISTRIBUTION 2005 Bedsize Number of Respondents Percentage of Respondents % % % % % % % % Totals % Additional information about the respondents was obtained from the data, including educational level, race, ethnicity, and survey language. Educational level for
22 11 the 2005 data included 4,615 (5.61%) of respondents having less than an 8 th grade education, 8,943 (10.86%) with some high school, 25,886 (31.45%) reporting to be high school graduates or obtaining G.E.D.s, 22,934 (27.86%) with some college or a two year degree, 10,950 (13.30%) with four year college degrees, and 8,993 (10.92%) with education beyond a four year college degree. The number of respondents who completed the survey in a given language was 76,738 (92.66%) for English, 4,754 (5.74%) for Spanish, and 1,322 (1.60%) for Chinese. Ethnicity was described as 9,052 (11.48%) Spanish/Hispanic/Latino and 69,818 (88.52%) not Spanish/Hispanic/Latino. Race was categorized as 41,267(27.28%) Caucasian/White; 7,678 (5.07%) African- American/Black; 1,131 (0.75%) Asian-American; 260 (0.19%) Pacific Islander; 961 (0.64%) American Indian or Alaska native; and 5,775 (3.82%) Other. The remainder of the data was not coded for race, which included 94,224 (62.28%) respondents in the 2005 data set. The 2006 HCAHPS data consist of 190,690 responses from 935 hospitals. A total of 67,112 (35.28%) of respondents were male and 123,090 (64.72%) respondents were female, comparable to the composition of Gender was not specified in 488 (0.26%) cases. A total of 18,423 (9.66%) responses were from major teaching hospitals, 28,452 (14.92%) were from minor teaching hospitals, and 143,815 (75.42%) were from non-teaching hospitals. A total of 10,593 (5.56%) responses were from non-federal government hospitals, 109,652 (57.50%) were from non-profit hospitals, 68,892 (36.13%) were from for-profit hospitals, and 1553 (0.81%) were from federal government hospitals. The following table shows age distributions in the 2006 data set:
23 12 TABLE 3: AGE DISTRIBUTION 2006 Age Number of Respondents Percentage of Respondents % % % % % % % % % % % % % % % Totals % The size of the hospital was coded by number of beds. The following table shows the distribution of hospital size in the 2006 data set. TABLE 4: HOSPITAL SIZE DISTRIBUTION 2006 Bedsize Number of Respondents Percentage of Respondents % % % % % % % % Totals %
24 13 Educational level for the 2006 data included 11,947 (6.57%) of respondents having less than an 8thgrade education, 18,456 (10.15%) with some high school, 54,510 (29.96%) reporting to be high school graduates or obtaining G.E.D.s, 52,226 (28.71%) with some college or a two year degree, 22,910 (12.59%) with four year college degrees, and 21,873 (12.02%) with education beyond a four year college degree. The number of respondents who completed the survey in a given language was 167,503 (91.65%) for English, 11,401(6.24%) for Spanish, and 3,867 (2.12%) for Chinese. Ethnicity was described as 131,562 (76.58%) not Spanish/Hispanic/Latino; 25,037(14.57%) Puerto Rican; 7,789 (4.53%) Mexican-American/Chicano; 574 (0.33%) Cuban; or 6834 (3.98%) other Spanish/Hispanic/Latino. Race was categorized as 148,801 (78.03%) Caucasian/White; 15,650 (8.21%) African-American/Black; 6,965 (3.65%) Asian-American; 1,303 (0.68%) Pacific Islander; 3,877 (2.03%) American Indian or Alaska native and 14,094 (7.39%) Other. In addition, since the 2006 and 2007 data include principal reason for hospital admission, 22,661(16.10%) was obstetric, 69,561(49.43%) was medical, and 48,500 (34.47%) was surgical for the 2006 data. The 2007 HCAHPS data consist of 547,391 responses from 1325 hospitals. 191,027 (35.38%) of respondents were male and 348,921(64.62%) respondents were female; a similar distribution to the ones from 2005 and Gender was not specified in 7,443 (1.36%) cases. A total of 54,671 (9.99%) responses were from major teaching hospitals, 102,672 (18.76%) were from minor teaching hospitals, and 390,047 (71.26%) were from non-teaching hospitals. A total of 345,467 (63.11%) responses were from non-profit hospitals, 159,683 (29.17%) were from for-profit hospitals, 40,036 (7.31%)
25 14 were from non-federal government hospitals, and 2204 (0.40%) were from federal government hospitals. The following table shows age distributions in the 2007 data set: TABLE 5: AGE DISTRIBUTION 2007 Age Number of Percentage of Respondents Respondents % % % % % % % % % % % % % % % Totals % The size of the hospital was coded by number of beds. The following table shows the distribution of hospital size in the 2007 data set.
26 15 TABLE 6: HOSPITAL SIZE DISTRIBUTION 2007 Bedsize Number of Percentage of Respondents Respondents % % % % % % % % Totals % Educational level for the 2007 data was delineated with 35,206 (6.76%) of respondents having less than an 8 th grade education, 54,373(10.43%) with some high school, 160,180 (30.74%) reporting to be high school graduates or having obtained G.E.D.s, 148,795 (28.55%) with some college or a two year degree, 63,040 (12.10%) with four year college degrees, and 59,522 (11.42%) with education beyond a four year college degree. The number of respondents who completed the survey in a given language was 487,809 (92.90%) for English, 27,861 (5.31%) for Spanish, and 9,425 (1.79%) for Chinese. Ethnicity was described as 431,514 (88.11%) not Spanish/Hispanic/Latino; 5,331(1.09%) Puerto Rican; 29,435 (6.01%) Mexican-American/Chicano; 3,269 (0.67%) Cuban; or 20,216 (4.13%) other Spanish/Hispanic/Latino. Race was categorized as 434,348 (79.35%) Caucasian/White; 47,335 (8.65%) African-American/Black; 17,299 (3.16%) Asian-American; 4,363 (0.80%) Pacific Islander; 11,628 (2.12%) American Indian or Alaska native and 32,418 (5.92%) Other. In conclusion, hospital service was coded as 82,911 (16.59%) obstetric, 246,658 (49.36%) medical, and 170,093 (34.04%) surgical for the 2007 data.
27 16 TABLE 7 shows a comparison of the composition of the age distributions for the samples of 2005, 2006 and Although age distribution appears to be fairly consistent across data samples, the 2006 and 2007 respondents appear to be slightly older than the respondents from the 2005 data sample. Beginning at the year age range, the survey participants appear to be 1-2% more prevalent in the 2006 and 2007 data sets than in the 2005 data set. In the younger age ranges, respondents appear with 1-2% less frequency in the data sets than those in the 2005 data sample. It should be noted that the 2005 data set was significantly smaller than the 2006 and 2007 data sets, and older participants may not have been as readily available at that time. TABLE 7: TOTAL AGE DISTRIBUTION Percentage of Respondents Age % 6.08% 5.94% % 6.33% 6.38% % 5.95% 5.82% % 4.63% 4.05% % 4.15% 4.05% % 5.13% 5.19% % 6.17% 6.33% % 7.42% 7.56% % 7.90% 8.56% % 9.28% 9.70% % 9.94% 10.09% % 10.69% 10.31% % 8.97% 8.74% % 5.11% 5.10% % 2.24% 2.19% Totals % % %
28 17 TABLE 8 shows a comparison of the composition of the hospital bedsize distributions for the samples of 2005, 2006 and There were more hospitals at the bed range and the bed range in the data sets than there were TABLE 8 shows a comparison of the composition of the hospital bedsize distributions for the samples of 2005, 2006 and There were more hospitals at the bed range and the bed range in the data sets than there were in the 2005 data set. There were fewer beds in the 300+ bed range in the data sets than there were in the 2005 data set. There is no apparent reason for this variation, other than which hospitals agreed to participate in the survey. Responses for year 2005 had a larger participation for larger hospitals than the ones in 2006 and TABLE 8: TOTAL HOSPITAL SIZE DISTRIBUTION Bedsize % 0.38% 1.04% % 3.88% 5.73% % 11.77% 12.59% % 30.14% 26.35% % 20.44% 21.13% % 14.49% 13.94% % 8.62% 6.92% % 10.28% 12.30% Totals % % % A table comparing distribution of teaching and non-teaching hospitals was included as this variable is one of the subjects of investigation. Major Teaching hospital refers to a facility with a large number of physician residency programs and is typically affiliated with a medical school. Minor Teaching hospital refers to a facility with a small
29 18 number of physician residency programs and may or may not be directly affiliated with a medical school. Non-teaching hospitals are those that do not provide clinical education to student physicians. TABLE 9 shows a comparison of the composition of the teaching status distributions for the samples of 2005, 2006 and Fewer teaching hospitals (both major and minor) participated in the 2006 and 2007 surveys than did in the 2005 surveys. TABLE 9: TEACHING STATUS DISTRIBUTION Hospital Status Major Teaching 17.75% 9.66% 9.99% Minor Teaching 32.70% 14.92% 18.76% Non-Teaching 49.55% 75.42% 71.25% Total % % % TABLE 10 shows a comparison of the composition of language distributions for the samples of 2005, 2006 and No significant difference in language distribution was observed throughout the data sets. TABLE 10: LANGUAGE DISTRIBUTION Language English 92.66% 91.64% 92.90% Spanish 5.74% 6.24% 5.31% Chinese 1.60% 2.12% 1.79% Total % % %
30 19 TABLE 11 shows a comparison of the composition of race distributions for the samples of 2005, 2006, and Since race was not coded for the majority of the 2005 data sample, comparison between 2005 and 2006/2007 would not be accurate. However, race appears to be consistently distributed between data sets of 2006 and Most of the observations for 2005 appear not coded for race (62.28%); therefore, skewed results were expected concerning this variable. TABLE 11: RACE DISTRIBUTION Race White/Caucasian 27.28% 78.03% 79.35% Black/African-American 5.07% 8.21% 8.65% Asian 0.74% 3.65% 3.16% Pacific Islander/Native Hawaiian 0.18% 0.68% 0.80% Native American/Native Alaskan 0.63% 2.03% 2.12% Other 3.82% 7.40% 5.92% Not Coded 62.28% 0.00% 0.00% Total % % % In addition, the initial data analysis revealed the data to be negatively skewed, meaning patients were more likely to rate a hospital, nurse, doctor, etc. favorably, rather than unfavorably. This finding presented challenges, since most regressions and other statistical methods assume data to be normally distributed. Some examples of the negative skew in the data are illustrated in figures below: Figure 1 shows the Data Distribution of Hospital Ratings (where 1 is worst hospital possible and 10 is best hospital possible) for years 2005, 2006, and 2007.
, 2006 (top right) and 2007 (bottom left).")
31 20 Figure 1: Distribution of Hospital Ratings 2005 (top left), 2006 (top right) and 2007 (bottom left).
32 21 Incompatibilities between surveys Several incompatibilities were found between the 2005 HCAHPS survey and the subsequent 2006 and 2007 surveys. For instance, hospital service (obstetric, medical, or surgical) was absent from the 2005 data and could not be included in our models. In addition, mental health status and major diagnostic categories were not available for any of the data and were excluded from analysis. It should also be noted that in O Malley (2005), nurse, doctor, and hospital were each rated on a single ten-point scale. In the data, nurse and doctor ratings were obtained from three questions, given a four-point scale. The 2006 and 2007 nurse/doctor questions on the HCAHPS are as follows: 1) During this hospital stay, how often did nurses/doctors treat you with courtesy and respect?; 2) During this hospital stay, how often did nurses/doctors listen carefully to you?; 3) During this hospital stay, how often did nurses/doctors explain things in a way you could understand? Possible ratings were Never, Sometimes, Usually, and Always.
33 VI. METHODS Factor Analysis Factor analysis (FA) is one of several methods that can be used for data reduction. Beginning with a set of measures on a number of observed variables, a smaller set of artificial variables (factors) accounting for a fraction of the variability in the observed variables is developed. The underlying rationale is that observed variables correlating with a factor are measuring the same construct (Jobson 1992) (Patefield 1991) (Hope 1968). A Cronbach s α was reported for each factor or subgroup of items being considered. The Cronbach s α is a measure of association studied to assess the consistency (reliability) of the responses within each factor. The absolute value of the coefficient ranges from 0 to 1. The closer the value of the Cronbach s α is to one, the more consistent the responses associated with the factor. Literature in the social sciences usually reports an α of 0.70 or higher to be adequate (Nunnally 1978). General Linear Regression and ANOVA Linear regressions were completed to determine which independent variables affected the dependent variable of Hospital Rating. Regressions were completed with individual independent variables to determine which were significant in relation to the 22
34 23 dependent variable, and multiple regressions were completed to develop three separate models for analysis. Model 1 is a linear model that included variables found to be significant in the original case-mix study (O Malley 2005) and did not contribute to multicollinearity. Model 2 was identical to Model 1, with the addition of a Pain Control variable, which was not included in the original case-mix study. Model 3 consisted of Model 2, plus the Teach indicator variable, which is the focus of this investigation. An ANOVA was completed for each dataset to determine if changes in hospital ratings could be attributed to three different teaching hospital conditions: Major Teaching Hospital, Minor Teaching Hospital, or Non-teaching Hospital. Both Tukey and Bonferroni confidence interval tests were employed in the event that one correction method revealed different results than the other. Nonparametric Analysis A nonparametric measure of Kruskal-Wallis was utilized since it does not assume normally distributed data. The Kruskal-Wallis test is a one-way analysis of variance by ranks. It determines if the different subgroups in the sample have the same median or not. The assumptions in this technique are less restrictive than linear models and may provide additional information about the data that could not be realized utilizing parametric methods.
35 24 Quantile Analysis Finally, since the distribution of the response variable, satisfaction rating, shows a skewed distribution, a quantile regression analysis for Model 3 of each dataset was performed at the 50 th, 25 th, and 75 th quantile to estimate the conditional median (25 th and 75 th percentiles too), rather than mean. Quantile regression was utilized to employ a different measure of central tendency (median) and statistical dispersion to obtain a more comprehensive analysis of the relationship between the variables, given the negative skewed pattern of the data. This technique was also selected because it makes no distributional assumptions about the error term in the model, which is expected to be non- Gaussian.
36 VI. RESULTS Factor Analysis A factor analysis was performed on the responses to items related to care received from nurses and care received from doctors. The purpose of the factor analysis was to confirm if these items, as a group, reflect the respondents perception about the care received and the consistency of the responses to these perceptions. Items 1 through 4 in the survey referred to care received from nurses. Items 5 through 7 referred to care received from doctors (see Appendix A). A correlation analysis revealed some evidence that the responses for items referring to care received from nurses were positively correlated. Likewise, there was some evidence of responses corresponding to care received from doctors being positively correlated. However, there seemed to be little evidence of a correlation between responses to care received from nurses and responses to care received from doctors. TABLE 12: CORRELATION COEFFICIENTS (KENDALL TAU) Q01 Q02 Q03 Q04 Q05 Q06 Q07 Q Q Q Q Q Q Q
37 26 Figure 2: Scree Plot for 2005 Survey A scree plot suggests that three or four components explain most of the variability in the responses (see Figure 2). A factor analysis with three components (varimax rotation) was then evaluated. TABLE 13: FACTOR LOADINGS (VARIMAX ROTATION) Factor1 Factor2 Factor3 Q Q Q Q Q Q Q Three factors explained 66% of the variability in responses. A hypothesis test revealed that three factors were not sufficient to explain the variability in the data. However, there is some evidence supporting the findings from the correlation analysis (see Tables 12 and 13). Table 13 shows that items 1, 2, 3 and 4 load in the first
38 27 component (Cronbach alpha = 0.80). The Cronbach alpha constitutes evidence of consistency in the responses for care received from nurses. Items 5 and 6 load on the second component (Cronbach alpha = 0.79) and item 7 loads on a third component; these were the responses for care received from doctors. The items with nurses correlate well to the first component. A large percentage of the variation in performance is explained by the nurses performance, implying that the survey performance is consistent. Doctor performance is loaded over two components, in which listening is relevant to both. General Linear Regression Model and ANOVA O Malley (2005) found that hospital service, age, race, education, general health status, circulatory disorder, and language are important case-mix variables and consistent with overall ratings of nurse, doctor, and hospital. The available variables from the 2005 data were included in the initial analysis presented in the manuscript. Age and educational level were excluded from the initial model as being too closely correlated to hospital ratings to yield additional information to the investigation. The first model (1) to analyze is one in which hospital rating is expressed as a function of the following explanatory variables: Nurse Courtesy, Nurse Listening, Nurse Explaining, Doctor Courtesy, Doctor Listening, Doctor Explaining, Overall Health, Race, and Language of the patient. Nurse Courtesy refers to the question During this hospital stay, how often did nurses treat you with courtesy and respect?. Nurse Listening refers to the question During this hospital stay, how often did nurses listen carefully to you?. Nurse Explaining refers to the question During this hospital stay, how often did nurses explain
39 28 things in a way you could understand?. Doctor Courtesy, Doctor Listening, and Doctor Explaining were posed as identical questions to the nurse questions with doctor substituted for nurse. All of the aforementioned questions were rated as Never, Sometimes, Usually, or Always. Overall Health refers to the question, In general, how would you rate your overall health?. Possible responses were Excellent, Very good, Good, Fair, or Poor. Race was coded by self-report as White, Black (or African American), Asian, Pacific Islander (including Native Hawaiian), or Native American (including Alaska Native). Finally, Language refers to self-reported primary language of the home, including English, Spanish, Chinese, Russian, Vietnamese, or Other. For all models, English was the base case against which other languages were compared. For model 2, the rating of pain management was included, as it was determined to be an important variable in the patient s overall hospital rating (Maxfield 2012). O Malley (2005) did not address the pain variable in the original case mix study. This analysis found that if pain was not well managed, overall patient satisfaction ratings were decreased. The inclusion of pain management in this analysis is justified based on an increased Adjusted R 2 when the pain variable was included. There are three items that encompass characteristics of doctors and nurses that relate to the hospital quality rating, including dimensions of courtesy/respect, listening, and explaining. The reduced model (model 1: TABLE 14) for 2005 is based on O Malley (2005) models: Nurse Courtesy, Nurse Listening, Nurse Explaining, Doctor Courtesy, Doctor Listening, Doctor Explaining, Overall Health, Race, and Language.
40 29 TABLE 14: 2005 MODEL 1 RESULTS Variable Estimate Std. Error t value Pr(> t ) (Intercept) < 2e-16 *** Nurse Courtesy Sometimes Nurse Courtesy Usually < 2e-16 *** Nurse Courtesy Always < 2e-16 *** Nurse Listening Sometimes < 2e-16 *** Nurse Listening Usually < 2e-16 *** Nurse Listening Always < 2e-16 *** Nurse Explaining Sometimes < 2e-16 *** Nurse Explaining Usually < 2e-16 *** Nurse Explaining Always < 2e-16 *** Doctor Courtesy Sometimes ** Doctor Courtesy Usually e-08 *** Doctor Courtesy Always < 2e-16 *** Doctor Listening Sometimes < 2e-16 *** Doctor Listening Usually < 2e-16 *** Doctor Listening Always < 2e-16 *** Doctor Explaining Sometimes *** Doctor Explaining Usually e-09 *** Doctor Explaining Always < 2e-16 *** Overall Health Fair Overall Health Good Overall Health Very Good Overall Health Excellent e-10 *** Race White < 2e-16 *** Race Black < 2e-16 *** Race Asian < 2e-16 *** Race Pacific Islander e-07 *** Race Native American < 2e-16 *** Language Spanish < 2e-16 *** Language Chinese e-08 *** Signif. codes: 0 *** ** 0.01 * Residual standard error: on degrees of freedom (74276 observations deleted due to missingness) Multiple R-squared: , Adjusted R-squared: F-statistic: 2332 on 29 and DF, p-value: < 2.2e-16
41 30 In general, the evidence in 2005 Model 1 supports O Malley s (2005) findings of race, overall health status (when the rating was Excellent), and speaking Spanish at home as important case-mix variables. Nurse and doctor ratings also appear relevant, with the exception of the nurse question about treating the patient with courtesy and respect, when the rating was Sometimes. There was no statistically significant difference between a patient indicating that they had Never been treated with courtesy and respect and when they had Sometimes been treated courteously by the nurse. However, overall nurse ratings appear to be most relevant, based on the magnitude of the coefficients. Model 2 includes all variables in Model 1 with the pain management question added. Maxfield (2012) reported that the quality of pain management would be associated with the overall quality rating provided by the patient. Pain Control refers to the question During this hospital stay, how often was your pain well controlled? Ratings included Never, Sometimes, Usually, or Always. In relation to pain management and the mean ratings obtained, the results for model 2 show that the addition of the pain variable increased the adjusted R 2 from to , indicating that the pain variable contributes to the explanatory power of the model.
42 31 TABLE MODEL 2 RESULTS Variable Estimate Std. Error t value Pr(> t ) (Intercept) ** Nurse Courtesy Sometimes Nurse Courtesy Usually < 2e-16 *** Nurse Courtesy Always < 2e-16 *** Nurse Listening Sometimes < 2e-16 *** Nurse Listening Usually < 2e-16 *** Nurse Listening Always < 2e-16 *** Nurse Explaining Sometimes < 2e-16 *** Nurse Explaining Usually < 2e-16 *** Nurse Explaining Always < 2e-16 *** Doctor Courtesy Sometimes * Doctor Courtesy Usually e-05 *** Doctor Courtesy Always e-10 *** Doctor Listening Sometimes < 2e-16 *** Doctor Listening Usually < 2e-16 *** Doctor Listening Always < 2e-16 *** Doctor Explaining Sometimes Doctor Explaining Usually ** Doctor Explaining Always e-06 *** Overall Health Fair Overall Health Good Overall Health Very Good ** Overall Health Excellent Race White < 2e-16 *** Race Black < 2e-16 *** Race Asian < 2e-16 *** Race Pacific Islander *** Race Native American < 2e-16 *** Language Spanish < 2e-16 *** Language Chinese e-10 *** Pain Control Sometimes < 2e-16 *** Pain Control Usually < 2e-16 *** Pain Control Always < 2e-16 *** Signif. codes: 0 *** ** 0.01 * Residual standard error: on degrees of freedom (95610 observations deleted due to missingness) Multiple R-squared: , Adjusted R-squared: F-statistic: 1754 on 32 and DF, p-value: < 2.2e-16
43 32 Variables not found to be significant in the 2005 Model 2 included Nurse Courtesy Sometimes as was observed in Model 1, but this model also found Doctor Courtesy Sometimes and Doctor Explaining Sometimes to be insignificant (p<0.01). Overall Health ratings of Fair, Good, and Excellent were not significant, but a rating of Very Good was significant. In Model 1, only a rating of Excellent was significant. Then, Model 3 was fitted to include the teaching variable, with the following codes: Major Teaching hospital (Teach 1), Minor Teaching hospital (Teach 2), and Non-teaching hospital (Teach 3).
44 33 TABLE MODEL 3 RESULTS --- Variable Estimate Std. Error t value Pr(>[t]) (Intercept) e-05 *** Minor Teaching e-11 *** Non-teaching e-11 *** Nurse Courtesy Sometimes Nurse Courtesy Usually < 2e-16 *** Nurse Courtesy Always < 2e-16 *** Nurse Listening Sometimes < 2e-16 *** Nurse Listening Usually < 2e-16 *** Nurse Listening Always < 2e-16 *** Nurse Explaining Sometimes < 2e-16 *** Nurse Explaining Usually < 2e-16 *** Nurse Explaining Always < 2e-16 *** Doctor Courtesy Sometimes * Doctor Courtesy Usually *** Doctor Courtesy Always e-10 *** Doctor Listening Sometimes < 2e-16 *** Doctor Listening Usually < 2e-16 *** Doctor Listening Always < 2e-16 *** Doctor Explaining Sometimes Doctor Explaining Usually ** Doctor Explaining Always e-06 *** Overall Health Fair Overall Health Good Overall Health Very Good ** Race White < 2e-16 *** Race Black < 2e-16 *** Race Asian < 2e-16 *** Race Pacific Islander e-05 *** Race Native American < 2e-16 *** Language Spanish < 2e-16 *** Language Chinese e-10 *** Pain Control Sometimes < 2e-16 *** Pain Control Usually < 2e-16 *** Pain Control Always < 2e-16 *** Signif. codes: 0 *** ** 0.01 * Residual standard error: on degrees of freedom (95610 observations deleted due to missingness) Multiple R-squared: , Adjusted R-squared: F-statistic: 1654 on 34 and DF, p-value: < 2.2e-16
45 Model 3 found insignificant variables identical to 2005 Model 2. Nurse Courtesy Sometimes, Doctor Courtesy Sometimes, Doctor Explaining Sometimes, and Overall Health Ratings of Fair, Good, and Excellent were all found not to be significant (p<0.01) in this model. These findings indicate that adding the Variable Teach did not change the interaction of the other variables in the regression or add to the predictive value of the model. However, there are statistically significant differences between Major and Minor Teaching hospitals, indicating that Minor Teaching hospitals were more likely to correlate negatively to hospital ratings than Major Teaching Hospitals were. It should also be noted that nursing performance across models was the variable most highly correlated with hospital rating. An ANOVA analysis indicated that there was a significant difference between teaching hospitals and non-teaching hospitals in the 2005 data. Minor teaching hospital and non-teaching hospital indicated a decrease in hospital ratings, relative to the reference Major Teaching hospital. However, although the differences between Teaching hospitals and non-teaching hospitals were statistically significant in the analysis of variance, none of the changes appear to be practically significant in the linear regression model. Analysis of Variance Source SS df MS F Prob > F Between groups Within groups Total Bartlett's test for equal variances: chi2(2) = Prob>chi2 = Comparison of Q21 by Teach (Bonferroni) Row Mean- Col Mean
46 Data regressions were then completed using Models 1, 2, and 3 to determine if any differences could be determined between the datasets. As noted previously, Model 1 included Nurse Courtesy, Nurse Listening, Nurse Explaining, Doctor Courtesy, Doctor Listening, and Doctor Explaining, Overall Health rating, Race, and Language. Model 2 included the previous variables listed with pain control added, and Model three included all aforementioned variables in addition to teach. The results are outlined below: TABLE MODEL 1 RESULTS Estimate Std. Error t value Pr(>[t]) Variable (Intercept) e-09 *** Nurse Courtesy Sometimes e-09 *** Nurse Courtesy Usually < 2e-16 *** Nurse Courtesy Always < 2e-16 *** Nurse Listening Sometimes < 2e-16 *** Nurse Listening Usually < 2e-16 *** Nurse Listening Always < 2e-16 *** Nurse Explaining Sometimes < 2e-16 *** Nurse Explaining Usually < 2e-16 *** Nurse Explaining Always < 2e-16 *** Doctor Courtesy Sometimes < 2e-16 *** Doctor Courtesy Usually < 2e-16 *** Doctor Courtesy Always < 2e-16 *** Doctor Listening Sometimes e-13 *** Doctor Listening Usually < 2e-16 *** Doctor Listening Always < 2e-16 *** Doctor Explaining Sometimes ** Doctor Explaining Usually e-07 *** Doctor Explaining Always e-14 *** Overall Health Fair *** Overall Health Good * Overall Health Very Good e-05 *** Overall Health Excellent < 2e-16 *** Race White ** Race Black Race Asian Race Pacific Islander * Race Native American Language Spanish < 2e-16 *** Language Chinese
47 36 TABLE MODEL 1 RESULTS (CONTINUED) Signif. codes: 0 *** ** 0.01 * Residual standard error: 1.41 on degrees of freedom (37559 observations deleted due to missingness) Multiple R-squared: , Adjusted R-squared: F-statistic: 4905 on 29 and DF, p-value: < 2.2e-16 The evidence in 2006 Model 1 supports O Malley s (2005) findings of nurse performance, doctor performance, and speaking Spanish at home as important case-mix variables. However, in 2006 Model 1, indicating an Overall Health Rating of Good, and Race of Black, Asian, Pacific Islander, and Native American descent were not found to be significant. Speaking Chinese at home was also not found to be significant, as had been noted in the previous study.
48 37 TABLE MODEL 2 RESULTS Variable Estimate Std. Error t value Pr(>[t]) (Intercept) ** Nurse Courtesy Sometimes e-10 *** Nurse Courtesy Usually < 2e-16 *** Nurse Courtesy Always < 2e-16 *** Nurse Listening Sometimes < 2e-16 *** Nurse Listening Usually < 2e-16 *** Nurse Listening Always < 2e-16 *** Nurse Explaining Sometimes < 2e-16 *** Nurse Explaining Usually < 2e-16 *** Nurse Explaining Always < 2e-16 *** Doctor Courtesy Sometimes e-10 *** Doctor Courtesy Usually < 2e-16 *** Doctor Courtesy Always < 2e-16 *** Doctor Listening Sometimes e-10 *** Doctor Listening Usually < 2e-16 *** Doctor Listening Always < 2e-16 *** Doctor Explaining Sometimes *** Doctor Explaining Usually e-06 *** Doctor Explaining Always e-09 *** Overall Health Fair Overall Health Good *** Overall Health Very Good ** Overall Health Excellent * Race White ** Race Black Race Asian Race Pacific Islander Race Native American Language Spanish < 2e-16 *** Language Chinese Pain Control Sometimes < 2e-16 *** Pain Control Usually < 2e-16 *** Pain Control Always < 2e-16 *** -- Signif. codes: 0 *** ** 0.01 * Residual standard error: on degrees of freedom (83826 observations deleted due to missingness) Multiple R-squared: 0.523, Adjusted R-squared: F-statistic: 3660 on 32 and DF, p-value: < 2.2e-16 Variables not found to be significant in the 2006 Model 2 included Overall Health ratings of Fair and Excellent (p<0.01), which were not observed in 2006 Model 1. Race
49 38 of Black, Asian, Pacific Islander or Native American were again found to be insignificant, and Chinese language continued to be insignificant in 2006 Model 2, as had been observed in Model 1. TABLE MODEL 3 RESULTS Variable Estimate Std. Error t value Pr(>[t]) (Intercept) Minor Teaching e-11 *** Non-teaching e-16 *** Nurse Courtesy Sometimes e-10 *** Nurse Courtesy Usually < 2e-16 *** Nurse Courtesy Always < 2e-16 *** Nurse Listening Sometimes < 2e-16 *** Nurse Listening Usually < 2e-16 *** Nurse Listening Always < 2e-16 *** Nurse Explaining Sometimes < 2e-16 *** Nurse Explaining Usually < 2e-16 *** Nurse Explaining Always < 2e-16 *** Doctor Courtesy Sometimes e-10 *** Doctor Courtesy Usually < 2e-16 *** Doctor Courtesy Always < 2e-16 *** Doctor Listening Sometimes e-10 *** Doctor Listening Usually < 2e-16 *** Doctor Listening Always < 2e-16 *** Doctor Explaining Sometimes *** Doctor Explaining Usually e-06 *** Doctor Explaining Always e-09 *** Overall Health Fair Overall Health Good *** Overall Health Very Good ** Overall Health Excellent * Race White ** Race Black Race Asian Race Pacific Islander Race Native American Language Spanish < 2e-16 *** Language Chinese Pain Control Sometimes < 2e-16 *** Pain Control Usually < 2e-16 *** Pain Control Always < 2e-16 ***
50 39 TABLE MODEL 3 RESULTS (CONTINUED) ---Signif. codes: 0 *** ** 0.01 * Residual standard error: on degrees of freedom (83826 observations deleted due to missingness) Multiple R-squared: , Adjusted R-squared: F-statistic: 3449 on 34 and DF, p-value: < 2.2e Model 3 found insignificant variables identical to 2006 Model 2. Overall Health of Fair and Excellent, Black Race, Asian Race, Pacific Islander Race, Native American Race, and Chinese Language were all found to lack significance in the model. These findings indicate that adding the Variable Teach did not change the interaction of the other variables in the regression or add to the predictive value of the model. An ANOVA analysis indicated that there was a significant difference between teaching hospitals and non-teaching hospitals in the 2006 data. Minor teaching hospitals and non-teaching hospitals indicate a decrease in hospital ratings, relative to the reference Major Teaching hospitals. However, none of the changes appear to be significant in the linear regression model. Analysis of Variance Source SS df MS F Prob > F Between groups Within groups Total Bartlett's test for equal variances: chi2(2) = Prob>chi2 = Comparison of Q21_06 by FINAL_TEACHING (Bonferroni) Row Mean- Col Mean
51 Model Comparisons Qualitative analysis between results of linear regression models for 2005 and 2006 revealed similarities and differences between the two datasets. For all models for 2006, Chinese as the primary language of the home was found to be insignificant (p>0.01), but it was significant for all models in All findings for race were significant in the 2005 data set, but Black, Asian, Pacific Islander, and Native American were insignificant (p>0.01) for all models in the 2006 data. Self-report of Fair or Good health was not found to be significant (p>0.01) for all models in the 2005 dataset, and Excellent health was not significant in Models 2 and 3, while Very Good health was not significant in Model 1. In the 2006 data set, Good health was not significant in Model 1, and Fair and Excellent health were not significant in Models 2 and 3. A rating of nurse treating the patient with courtesy and respect Sometimes was found not to be significant in all three models of the 2005 dataset. Finally, doctor ratings of Sometimes treating patients with courtesy/respect and explaining to patients was not significant for Models 2 and 3 for the 2005 data set, but these ratings were significant for Model 1 in 2005 and all models in Finally, 2007 Data regressions were completed using Models 1, 2, and 3 to determine if any differences could be determined between the datasets. Identical to procedures for datasets 2005 and 2006, Model 1 included Nurse Courtesy, Nurse Listening, Nurse Explaining, Doctor Courtesy, Doctor Listening, and Doctor Explaining, Overall Health rating, Race, and Language. Model 2 added the variable pain control, and Model 3 added the teaching variable to the variables from Model 2. The results are outlined below:
52 41 TABLE MODEL 1 RESULTS Variable Estimate Std. Error t value Pr(>[t]) (Intercept) < 2e-16 *** Nurse Courtesy Sometimes < 2e-16 *** Nurse Courtesy Usually < 2e-16 *** Nurse Courtesy Always < 2e-16 *** Nurse Listening Sometimes < 2e-16 *** Nurse Listening Usually < 2e-16 *** Nurse Listening Always < 2e-16 *** Nurse Explaining Sometimes < 2e-16 *** Nurse Explaining Usually < 2e-16 *** Nurse Explaining Always < 2e-16 *** Doctor Courtesy Sometimes e-15 *** Doctor Courtesy Usually < 2e-16 *** Doctor Courtesy Always < 2e-16 *** Doctor Listening Sometimes < 2e-16 *** Doctor Listening Usually < 2e-16 *** Doctor Listening Always < 2e-16 *** Doctor Explaining Sometimes e-12 *** Doctor Explaining Usually < 2e-16 *** Doctor Explaining Always < 2e-16 *** Overall Health Fair e-08 *** Overall Health Good e-05 *** Overall Health Very Good e-11 *** Overall Health Excellent < 2e-16 *** Race White e-15 *** Race Black < 2e-16 *** Race Asian e-10 *** Race Pacific Islander e-09 *** Race Native American e-13 *** Language Spanish < 2e-16 *** Language Chinese e-05 *** ---Signif. codes: 0 *** ** 0.01 * Residual standard error: on degrees of freedom (91981 observations deleted due to missingness) Multiple R-squared: , Adjusted R-squared: F-statistic: 1.067e+04 on 29 and DF, p-value: < 2.2e-16 The 2007 Model 1 found all variables to be significant. Nurse Courtesy, Nurse Listening, Nurse Explaining, Doctor Courtesy, Doctor Listening, Doctor Explaining,
53 42 Overall Health, Race, and Language were all significant for each rating within each question. TABLE MODEL 2 RESULTS Variables Estimate Std. Error t value Pr(>[t]) (Intercept) Nurse Courtesy Sometimes e-12 *** Nurse Courtesy Usually < 2e-16 *** Nurse Courtesy Always < 2e-16 *** Nurse Listening Sometimes < 2e-16 *** Nurse Listening Usually < 2e-16 *** Nurse Listening Always < 2e-16 *** Nurse Explaining Sometimes < 2e-16 *** Nurse Explaining Usually < 2e-16 *** Nurse Explaining Always < 2e-16 *** Doctor Courtesy Sometimes e-10 *** Doctor Courtesy Usually < 2e-16 *** Doctor Courtesy Always < 2e-16 *** Doctor Listening Sometimes < 2e-16 *** Doctor Listening Usually < 2e-16 *** Doctor Listening Always < 2e-16 *** Doctor Explaining Sometimes e-08 *** Doctor Explaining Usually < 2e-16 *** Doctor Explaining Always < 2e-16 *** Overall Health Fair Overall Health Good ** Overall Health Very Good * Overall Health Excellent e-10 *** Race White e-10 *** Race Black < 2e-16 *** Race Asian *** Race Pacific Islander e-05 *** Race Native American e-06 *** Language Spanish < 2e-16 *** Language Chinese e-08 *** Pain Control Sometimes < 2e-16 *** Pain Control Usually < 2e-16 *** Pain Control Always < 2e-16 *** ---Signif. codes: 0 *** ** 0.01 * Residual standard error: on degrees of freedom ( observations deleted due to missingness) Multiple R-squared: , Adjusted R-squared: F-statistic: 7897 on 32 and DF, p-value: < 2.2e-16
54 43 While 2007 Model 1 found all variables to be significant, Model 2 indicated that Overall Health Ratings of Fair and Very Good were not significant (p<0.01). Adding the pain control variable appears to have influenced how health ratings can be utilized to determine overall hospital ratings by patients. TABLE MODEL 3 RESULTS Variable Estimate Std. Error t value Pr(>[t]) (Intercept) e-09 *** Minor Teaching < 2e-16 *** Non-teaching < 2e-16 *** Nurse Courtesy Sometimes e-12 *** Nurse Courtesy Usually < 2e-16 *** Nurse Courtesy Always < 2e-16 *** Nurse Listening Sometimes < 2e-16 *** Nurse Listening Usually < 2e-16 *** Nurse Listening Always < 2e-16 *** Nurse Explaining Sometimes < 2e-16 *** Nurse Explaining Usually < 2e-16 *** Nurse Explaining Always < 2e-16 *** Doctor Courtesy Sometimes e-11 *** Doctor Courtesy Usually < 2e-16 *** Doctor Courtesy Always < 2e-16 *** Doctor Listening Sometimes < 2e-16 *** Doctor Listening Usually < 2e-16 *** Doctor Listening Always < 2e-16 *** Doctor Explaining Sometimes e-09 *** Doctor Explaining Usually < 2e-16 *** Doctor Explaining Always < 2e-16 *** Overall Health Fair Overall Health Good ** Overall Health Very Good Overall Health Excellent e-11 *** Race White e-10 *** Race Black e-13 *** Race Asian *** Race Pacific Islander *** Race Native American e-05 *** Language Spanish < 2e-16 *** Language Chinese e-09 *** Pain Control Sometimes < 2e-16 *** Pain Control Usually < 2e-16 *** Pain Control Always < 2e-16 ***
55 44 TABLE MODEL 3 RESULTS (CONTINUED) ---Signif. codes: 0 *** ** 0.01 * Residual standard error: on degrees of freedom ( observations deleted due to missingness) Multiple R-squared: , Adjusted R-squared: F-statistic: 7526 on 34 and DF, p-value: < 2.2e Model 3 found insignificant variables identical to 2007 Model 2. Overall Health of Fair and Very Good were found to lack significance in the model. These findings indicate that adding the Variable Teach did not change the interaction of the other variables in the regression or add to the predictive value of the model. An ANOVA analysis indicated that there was a significant difference between teaching hospitals and non-teaching hospitals in the 2007 data. Minor teaching hospital and non-teaching hospital factors indicate an increase in hospital ratings, relative to the reference Major Teaching hospital. However, none of the changes appear to be significant in the linear regression model. Analysis of Variance Source SS df MS F Prob > F Between groups Within groups Total Bartlett's test for equal variances: chi2(2) = 1.2e+04 Prob>chi2 = Comparison of Q21_07 by FINAL_TEACHING (Bonferroni) Row Mean- Col Mean
56 , 2006 and 2007 Model Comparisons Qualitative analysis between results of linear regression models for 2005, 2006, and 2007 revealed that most of the differences were between the 2006 and the other two datasets. For example, Chinese language was a significant predictor for all models in 2005 and 2007, but not for 2006, even though the proportion of Chinese respondents is greater for 2006 than for other years. All findings for race were significant in the 2005 and 2007 data sets, but Black, Asian, Pacific Islander, and Native American were insignificant (p>0.01) for all models in the 2006 data. Self-report of Fair or Good health (item 23) was not found to be significantly (p>0.01) different from respondents reporting Poor health for all models in the 2005 dataset, and Excellent health was not significant in Models 2 and 3, while Very Good health was not significantly different from those responding having poor health in Model 1. In the 2006 data set, Good health was not significant in Model 1. Fair and Excellent health ratings were not significantly different from poor health in Models 2 and 3. In the 2007 dataset, Fair and Very Good health ratings were not significantly different from those responding poor health in Models 2 and 3, but all health ratings were otherwise significantly different. A rating of nurse treating the patient with courtesy and respect Sometimes was found not to be significantly different from those responding Never in all three models of the 2005 and 2007 datasets. Finally, doctor ratings of Sometimes treating patients with courtesy/respect and explaining to patients was not significantly different from those reporting Never for Models 2 and 3 for the 2005 data set, but these ratings were significantly different from those reporting Never for Model 1 in 2005 and all models in
57 and The following are result tables for Models 1, 2 and 3 for 2005, 2006, and 2007 datasets: TABLE 23- MODEL GOODNESS OF FIT RESULTS FOR Data R² Adjusted R² Standard Error Degrees of Freedom Model Model Model TABLE 24 MODEL GOODNESS OF FIT RESULTS FOR Data R² Adjusted R² Standard Error Degrees of Freedom Model Model Model TABLE 25: MODEL GOODNESS OF FIT RESULTS FOR Data R² Adjusted R² Standard Error Degrees of Freedom Model Model Model
58 47 The above tables demonstrate evidence of an improvement in model fit with the addition of the pain variable in Model 2 and the Teach variable in Model 3 for each year of data examined. NONPARAMETRIC ANALYSES Analysis of 2005 Dataset TABLE 26: ROBUST MEASURES OF CENTER AND DISPERSION, 2005 Teaching Rating Major Minor None Mode Median IQR Figure 3: Comparison of Ratings for 2005 Figure 3 and Table 26 show that the typical rating for minor teaching hospitals is
59 48 slightly lower than the typical rating for the major teaching and non-teaching hospitals. Kruskal-Wallis equality-of-populations rank test teach Obs Rank Sum e e e+09 chi-squared = with 2 d.f. probability = chi-squared with ties = probability = with 2 d.f. A non-parametric analysis of variance (Kruskal-Wallis) show statistical evidence of a difference among the median ratings for each type of hospital (p-value=0.0001), in Table 26 and Figure 3 show that there is no pronounced difference in the shape of the distribution of ratings; the three distributions are negatively skewed. This supports the idea that the finding from the Kruskal-Wallis test for equality in median ratings is due to a difference in the median ratings and not due to a difference in the shape of the distributions. Analysis of 2006 Dataset TABLE 27: ROBUST MEASURES OF CENTER AND DISPERSION, 2006 Teaching Rating Major Minor None Mode Median IQR 2 2 2
60 49 Figure 4: Comparison of Ratings for 2006 Kruskal-Wallis equality-of-populations rank test final_~g Obs Rank Sum e e e+10 chi-squared = with 2 d.f. probability = chi-squared with ties = probability = with 2 d.f. A non-parametric analysis of variance (Kruskal-Wallis) shows statistical evidence of a difference among the median ratings for each type of hospital (p-value=0.0001), in There is no pronounced difference in the shape of the distribution of ratings; the three distributions are negatively skewed. This supports the idea that the finding from the
61 50 Kruskal-Wallis was due to a difference in the median ratings and not due to a difference in the shape of the distributions. Analysis of the 2007 Dataset Figure 5: Comparison of Ratings for 2007 TABLE 28: ROBUST MEASURES OF CENTER AND DISPERSION, Teaching Rating Major Minor None Mode Median IQR 3 2 2
62 51 Kruskal-Wallis equality-of-populations rank test final_~g Obs Rank Sum e e e+11 chi-squared = with 2 d.f. probability = chi-squared with ties = probability = with 2 d.f. A non-parametric analysis of variance (Kruskal-Wallis) showed statistical evidence of a difference among the median ratings for each type of hospital (pvalue=0.0001), in There was no pronounced difference in the shape of the distribution of ratings; the three distributions were negatively skewed. This supports the idea that the finding from the Kruskal-Wallis was due to a difference in the median ratings and not due to a difference in the shape of the distributions. These findings indicate that there was a significant difference between the median scores for Major Teaching hospitals, Minor Teaching hospitals, and Non-teaching hospitals for all three datasets. The next section shows a nonparametric analysis, which incorporated the covariates used in the previous regression analyses. Most of these covariates were the same ones that O Malley (2005) study used to condition the quality rating responses. Quantile Regression Quantile regressions at the 25 th, 50 th, and 75 th quantile were completed for Models 1, 2, and 3 for all datasets to attempt to condition the analysis due to the fact that the responses to the quality rating item appeared to be negatively skewed throughout all
63 52 samples. The teaching variable was not found to be a factor related to quality responses in any of the OLS (ordinary least squares) linear regression models, but since the quality ratings were not normally distributed, the findings may be misleading. Utilizing quantile regression at the 25th th, 50th th, and 75 th quantile for Models 1, 2, and 3 for 2005, 2006, and 2007 datasets revealed that analyzing the data at different quantiles did not affect the results of the linear regression in a manner that revealed the teaching variable to be associated with hospital satisfaction ratings. Tables 29, 31, and 33 summarize the coefficients for the years of 2005, 2006, and 2007.
64 53 TABLE 29: QUANTILE SUMMARY FOR Comparison Coefficients Covariate 25th quantile 50th quantile 75th quantile Constant Pain Control Sometimes Pain Control Usually Pain Control Always Minor Teaching Non-teaching Nurse Courtesy Sometimes Nurse Courtesy Usually Nurse Courtesy Always Nurse Listening Sometimes Nurse Listening Usually Nurse Listening Always Nurse Explaining Sometimes Nurse Explaining Usually Nurse Explaining Always Doctor Courtesy Sometimes Doctor Courtesy Usually Doctor Courtesy Always Doctor Listening Sometimes Doctor Listening Usually Doctor Listening Always Doctor Explaining Sometimes Doctor Explaining Usually Doctor Explaining Always Overall Health Fair Overall Health Good Overall Health Very Good Overall Health Excellent Race White Race Black Race Asian Race Pacific Islander Race Native American Language Spanish Language Chinese
65 54 The base case for all three data sets is a patient at a major teaching hospital who never had pain control, never had nurse or doctor courtesy, listening, or explaining, rated their overall health as poor, and spoke English. The 2005 findings indicate that the 50 th quantile (median) falls below the linear regression (overall mean) for the base case, with significant variation noted at the 25 th and 75 th quantiles. Figure 6 below illustrates the variation observed with quantile regression. Constant th quantile 50th quantile 75th quantile Constant Figure 6: 2005 Base Case Quantile Comparison Chart Analysis of the quantile regressions indicate that the variable Pain Control Sometimes changes minimally across the quantiles (and in the linear regression), but Pain Control Usually decreases at the 50 th quantile, and Pain Control Always decreases significantly at the 75 th quantile. Therefore, the influence of pain control diminishes towards the 75 th quantile. The lower 25 th and 50 th quantiles of the respondents (low raters) are associated with Pain Control Always in a more significant and important way.
66 55 For people who rate Pain Control lower, having Pain Control Always increases their hospital satisfaction rating 1.6 points on average (see Figure 7 below) for this data set. Pain Control Sometimes th quantile 50th quantile 75th quantile Pain Control Usually Pain Control Always Figure 7: 2005 Pain Control Quantile Comparison Chart TABLE 30: 2005 TEACHING QUANTILE REGRESSION COMPARISONS Quantile Regressions Variable 25th quantile 50th quantile 75th quantile Linear Regression Minor Teaching Non-Teaching No significant differences were noted between different quantile conditions and the original linear regression, indicating that there is no essential difference in patient satisfaction ratings between Major, Minor, and Non-teaching hospitals for the 2005 data.
67 56 TABLE 31: QUANTILE SUMMARY FOR Comparison Coefficients Covariate 25th quantile 50th quantile 75th quantile Constant Minor Teaching Non-Teaching Nurse Courtesy Sometimes Nurse Courtesy Usually Nurse Courtesy Always Nurse Listening Sometimes Nurse Listening Usually Nurse Listening Always Nurse Explaining Sometimes Nurse Explaining Usually Nurse Explaining Always Doctor Courtesy Sometimes Doctor Courtesy Usually Doctor Courtesy Always Doctor Listening Sometimes Doctor Listening Usually Doctor Listening Always Doctor Explaining Sometimes Doctor Explaining Usually Doctor Explaining Always Pain Control Sometimes Pain Control Usually Pain Control Always Overall Health Fair Overall Health Good Overall Health Very Good Overall Health Excellent Race White Race Black Race Asian Race Pacific Islander Race Native American Language Spanish Language Chinese
68 57 Constant th quantile 50th quantile 75th quantile Constant Figure 8: 2006 Base Case Quantile Comparison Chart These findings (in Figure 8) indicate that the 50 th quantile (median) falls above the linear regression (mean), with significant variation noted at the 25 th and 75 th quantiles. It should be noted that the differences for the base case in this data set are not extensive. Pain Control Sometimes th quantile 50th quantile 75th quantile Pain Control Usually Pain Control Always Figure 9: 2006 Pain Control Quantile Comparison Chart
69 58 Analysis of the quantile regressions indicate that the variable Pain Control Sometimes changes minimally across the quantiles (and in the linear regression), but Pain Control Usually increases substantially at the 50 th quantile and is significantly different from Pain Control Sometimes and Pain Control Always. Pain Control Always decreases significantly at the 50 th quantile. Therefore, the 50 th quantile of the respondents are associated with Pain Control Usually in a more significant way for the 2006 data (see Figure 9 above). TABLE 32: 2006 TEACHING QUANTILE REGRESSION COMPARISONS Quantile Regressions Variable 25th quantile 50th quantile 75th quantile Linear Regression Minor Teaching Non-Teaching No significant differences were noted between different quantile conditions and the linear regression.
70 59 TABLE 33: QUANTILE SUMMARY FOR Comparison Coefficients Covariate 25th quantile 50th quantile 75th quantile Constant Minor Teaching Non-Teaching Nurse Courtesy Sometimes Nurse Courtesy Usually Nurse Courtesy Always Nurse Listening Sometimes Nurse Listening Usually Nurse Listening Always Nurse Explaining Sometimes Nurse Explaining Usually Nurse Explaining Always Doctor Courtesy Sometimes Doctor Courtesy Usually Doctor Courtesy Always Doctor Listening Sometimes Doctor Listening Usually Doctor Listening Always Doctor Explaining Sometimes Doctor Explaining Usually Doctor Explaining Always Pain Control Sometimes Pain Control Usually Pain Control Always Overall Health Fair Overall Health Good Overall Health Very Good Overall Health Excellent Race White Race Black Race Asian Race Pacific Islander Race Native American Language Spanish Language Chinese
71 60 These findings indicate that the 50 th quantile (median) is significantly above the linear regression (mean) for the base case, with variation noted at the 25 th and 75 th quantiles. Figure 10 below illustrates the variation observed with quantile regression. Constant th quantile 50th quantile 75th quantile Constant Figure 10: 2007 Base Case Quantile Comparison Chart Analysis of the quantile regressions indicate that the variable Pain Control Sometimes changes minimally across the quantiles (and in the linear regression), but Pain Control Usually increases substantially at the 50 th quantile and is significantly different from Pain Control Sometimes and Pain Control Always. Pain Control Always decreases at the 50 th quantile. Therefore, 50 th quantile of the respondents are associated with Pain Control Usually in a more significant way in the 2007 data (see Figure 11 below). These findings are similar to the findings of the 2006 data.
72 61 Pain Control Sometimes th quantile 50th quantile 75th quantile Pain Control Usually Pain Control Always Figure 11: 2007 Pain Control Quantile Comparison Chart th quantile 50th quantile 75th quantile Minor Teaching Non-Teaching Figure 12: 2007 Teaching Quantile Comparison Chart
73 62 No significant differences were noted at the 25 th and 50 th quantile conditions between Major, Minor, and Non-teaching hospitals for the 2007 data, but findings at the 75 th quantile approach the findings of the linear regression, indicating that high raters scores were more consistent with the mean ratings for Minor and Non-teaching hospitals. At the 95% confidence interval, the differences are statistically different, but they represent no practical difference between the Teach conditions. It should be noted that in the data sets, Pain Control Usually leads to higher hospital ratings across all respondents. Pain Control Always leads to lower hospital ratings at the 25 th and 50 th quantiles. The reasons for this difference are unclear, but one possibility might be that patients whose pain was well managed were not as severely injured or ill as those whose pain could only be managed in most instances. The more severely injured or ill patients might rate hospitals more highly, given the dire medical situation in which they found themselves.
74 VIII. CONCLUSION The purpose of this study was to examine differences in patient satisfaction scores between different types of hospitals (major teaching, minor teaching, and non-teaching) and other factors measured in the Hospital Consumer Assessment of Healthcare Providers and Systems (HCAHPS) survey, given that Medicare begins distributing and withholding funds based on this patient satisfaction survey in October An initial case-mix study by O Malley (2005) indicated that type of hospital service, age, race, education, general health rating, speaking Spanish, and a circulatory disorder diagnosis affected patient satisfaction ratings. Medicare will make adjustments for these factors in an attempt to make fund distribution more equitable. Other factors that will be given consideration are survey method and whether the patient was admitted through the emergency room. Type of hospital, pain control, and nurse/physician interactions with patients have not yet been examined in detail and are the focus of the current investigation. Although there is a statistically significant difference between hospital ratings by major teaching hospitals, minor teaching hospitals, and non-teaching hospitals, the difference appears to lose practical significance in relation to other variables, such as nurse and doctor patient interaction, overall health of the patient, pain control, race, and language. The findings do not contradict those of the original study by O Malley (2005). 63
75 64 Therefore, HCAHPS ratings adjustments based on the O Malley (2005) case-mix study appear to be appropriate. Addition of the teaching variable does not add value to the ratings adjustment, and no evidence of teaching hospitals being unjustly penalized by HCAHPS ratings was found. All nurse interactions have more impact on hospital ratings than any patient interactions with physicians. It is hypothesized that nurses spend a greater percentage of time with patients than doctors do and would have a greater impact on patient satisfaction. There may be other explanations which have not been explored. The pain control variable does appear to have a significant contribution to hospital ratings. By definition, patients in acute care hospitals are receiving short-term medical treatment for an acute illness or injury or are recovering from surgery. The patient s pain is likely to be the most intense and severe during that hospitalization, and pain management would likely influence the patient s perception of a hospital stay. This study has limitations in the large volume of missing data and that the most recent data supplied is five years old. The 2005 data appear to be fundamentally different from the 2006 and 2007 data, in that it has larger hospitals and more teaching hospitals than the other two data sets. Also, most respondents did not code race in the 2005 data, whereas most respondents coded race in 2006 and In addition, the patient population surveyed across data sets is not representative of the majority of Medicare recipients, with 65% of the patients surveyed being younger than 65 years of age. Approximately 83.15% of Medicare recipients are older than 65, and only 16.85% of patients younger than 65 were receiving Medicare in 2010 due to disability.
76 65 Another limitation of the study is observed in the quantile regressions for pain management findings. The interpretations are made for point estimates, leading to statements about practical significance, as opposed to statistical significance. It is also unclear why respondents who indicate that their pain was Usually controlled rating hospitals more highly than respondents who indicated that their pain was Always controlled. Further research based on these findings should be conducted with more current data than those obtained for Nurse interaction may be studied in more depth to determine what types of behavior lead patients to indicate that they have been treated courteously, were listened to, and had their treatment explained. Physician interaction with patients might be studied in a similar manner. Another factor that may be considered is the role of gender in patient interactions. Currently in the United States, the majority of nurses are female (90%) and the majority of physicians are male (68%) (Ulrich 2010). Separating interactions by gender, as well as by discipline, might yield additional information about gender-based communication styles as they relate to patient satisfaction. Finally, pain control ratings might be examined based on pain location, mechanism of injury, and number of injuries. Specific types of injuries, location of injuries, or having multiple injuries at once (typically observed in trauma patients), may result in higher reports of pain and decreased pain management. Therefore, these proposed findings may lead to a better understanding of why patients rate hospitals more favorably when their pain is only Usually controlled.

77 IX. APPENDIX A HCAHPS Survey 66
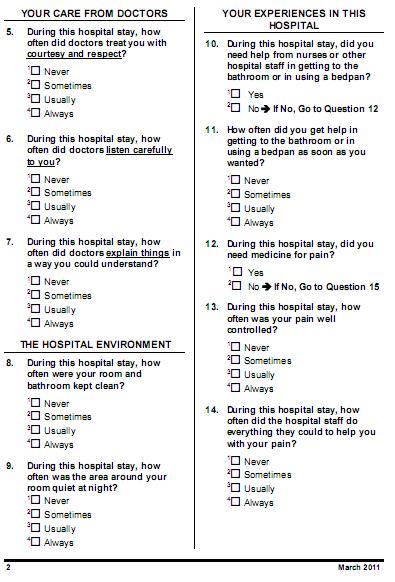
78 67
79 68
Hospital Consumer Assessment of Healthcare Providers and Systems (HCAHPS) MBQIP Educational Session One Phase Two, January 2013
 MBQIP Educational Session One Phase Two, January 2013") Hospital Consumer Assessment of Healthcare Providers and Systems (HCAHPS) MBQIP Educational Session One Phase Two, January 2013 Overview HCAHPS (Hospital Consumer Assessment of Healthcare Providers and
Hospital Consumer Assessment of Healthcare Providers and Systems (HCAHPS) MBQIP Educational Session One Phase Two, January 2013 Overview HCAHPS (Hospital Consumer Assessment of Healthcare Providers and
HCAHPS Survey SURVEY INSTRUCTIONS
 HCAHPS Survey SURVEY INSTRUCTIONS You should only fill out this survey if you were the patient during the hospital stay named in the cover letter. Do not fill out this survey if you were not the patient.
HCAHPS Survey SURVEY INSTRUCTIONS
 HCAHPS Survey SURVEY INSTRUCTIONS You should only fill out this survey if you were the patient during the hospital stay named in the cover letter. Do not fill out this survey if you were not the patient.
Patient-mix Coefficients for December 2017 (2Q16 through 1Q17 Discharges) Publicly Reported HCAHPS Results
 Publicly Reported HCAHPS Results") Patient-mix Coefficients for December 2017 (2Q16 through 1Q17 Discharges) Publicly Reported HCAHPS Results As noted in the HCAHPS Quality Assurance Guidelines, V12.0, prior to public reporting, hospitals
Patient-mix Coefficients for December 2017 (2Q16 through 1Q17 Discharges) Publicly Reported HCAHPS Results As noted in the HCAHPS Quality Assurance Guidelines, V12.0, prior to public reporting, hospitals
Oklahoma Health Care Authority. ECHO Adult Behavioral Health Survey For SoonerCare Choice
 Oklahoma Health Care Authority ECHO Adult Behavioral Health Survey For SoonerCare Choice Executive Summary and Technical Specifications Report for Report Submitted June 2009 Submitted by: APS Healthcare
Supporting Statement for the National Implementation of the Hospital CAHPS Survey A 1.0 CIRCUMSTANCES OF INFORMATION COLLECTION
 Supporting Statement for the National Implementation of the Hospital CAHPS Survey A.0 CIRCUMSTANCES OF INFORMATION COLLECTION A. Background This Paperwork Reduction Act submission is for national implementation
Demographic Profile of the Officer, Enlisted, and Warrant Officer Populations of the National Guard September 2008 Snapshot
 Issue Paper #55 National Guard & Reserve MLDC Research Areas Definition of Diversity Legal Implications Outreach & Recruiting Leadership & Training Branching & Assignments Promotion Retention Implementation
HCAHPS. Active Interactive Voice Response Script (English) Effective January 1, 2018 Discharges and Forward
 Effective January 1, 2018 Discharges and Forward") HCAHPS Active Interactive Voice Response Script (English) Effective January 1, 2018 Discharges and Forward Overview This active interactive voice response (IVR) interview script is provided to assist operators
HCAHPS Active Interactive Voice Response Script (English) Effective January 1, 2018 Discharges and Forward Overview This active interactive voice response (IVR) interview script is provided to assist operators
Summary Report of Findings and Recommendations
 Patient Experience Survey Study of Equivalency: Comparison of CG- CAHPS Visit Questions Added to the CG-CAHPS PCMH Survey Summary Report of Findings and Recommendations Submitted to: Minnesota Department
Patient-mix Coefficients for July 2017 (4Q15 through 3Q16 Discharges) Publicly Reported HCAHPS Results
 Publicly Reported HCAHPS Results") Patient-mix Coefficients for July 2017 (4Q15 through 3Q16 Discharges) Publicly Reported HCAHPS Results As noted in the HCAHPS Quality Assurance Guidelines, V11.0, prior to public reporting, hospitals HCAHPS
Patient-mix Coefficients for July 2017 (4Q15 through 3Q16 Discharges) Publicly Reported HCAHPS Results As noted in the HCAHPS Quality Assurance Guidelines, V11.0, prior to public reporting, hospitals HCAHPS
Please answer the survey questions about the care the patient received from this hospice: [NAME OF HOSPICE]
![Please answer the survey questions about the care the patient received from this hospice: [NAME OF HOSPICE]](/thumbs/79/80331294.jpg "Please answer the survey questions about the care the patient received from this hospice: [NAME OF HOSPICE]") CAHPS Hospice Survey Please answer the survey questions about the care the patient received from this hospice: [NAME OF HOSPICE] All of the questions in this survey will ask about the experiences with
CAHPS Hospice Survey Please answer the survey questions about the care the patient received from this hospice: [NAME OF HOSPICE] All of the questions in this survey will ask about the experiences with
Appendix A Registered Nurse Nonresponse Analyses and Sample Weighting
 Appendix A Registered Nurse Nonresponse Analyses and Sample Weighting A formal nonresponse bias analysis was conducted following the close of the survey. Although response rates are a valuable indicator
HCAHPS. Telephone Script (English) Effective January 1, 2018 Discharges and Forward
 Effective January 1, 2018 Discharges and Forward") HCAHPS Telephone Script (English) Effective January 1, 2018 Discharges and Forward Overview This telephone interview script is provided to assist interviewers while attempting to reach the patient. The
HCAHPS Telephone Script (English) Effective January 1, 2018 Discharges and Forward Overview This telephone interview script is provided to assist interviewers while attempting to reach the patient. The
2/5/2014. Patient Satisfaction. Objectives. Topics of discussion. Quality for the non-quality Manager Session 3 of 4
 Patient Satisfaction Quality for the non-quality Manager Session 3 of 4 Presented by Paul E. Frigoli, Ph.D.(c), R.N., C.P.H.Q., C.S.S.B.B. Certified Lean Six Sigma Master Black Belt Objectives At the end
Research Brief IUPUI Staff Survey. June 2000 Indiana University-Purdue University Indianapolis Vol. 7, No. 1
 Research Brief 1999 IUPUI Staff Survey June 2000 Indiana University-Purdue University Indianapolis Vol. 7, No. 1 Introduction This edition of Research Brief summarizes the results of the second IUPUI Staff
CER Module ACCESS TO CARE January 14, AM 12:30 PM
 CER Module ACCESS TO CARE January 14, 2014. 830 AM 12:30 PM Topics 1. Definition, Model & equity of Access Ron Andersen (8:30 10:30) 2. Effectiveness, Efficiency & future of Access Martin Shapiro (10:30
Demographic Profile of the Active-Duty Warrant Officer Corps September 2008 Snapshot
 Issue Paper #44 Implementation & Accountability MLDC Research Areas Definition of Diversity Legal Implications Outreach & Recruiting Leadership & Training Branching & Assignments Promotion Retention Implementation
Measuring healthcare service quality in a private hospital in a developing country by tools of Victorian patient satisfaction monitor
 ORIGINAL ARTICLE Measuring healthcare service quality in a private hospital in a developing country by tools of Victorian patient satisfaction monitor Si Dung Chu 1,2, Tan Sin Khong 2,3 1 Vietnam National
Technical Notes for HCAHPS Star Ratings (Revised for April 2018 Public Reporting)
") Technical Notes for HCAHPS Star Ratings (Revised for April 2018 Public Reporting) Overview of HCAHPS Star Ratings As part of the initiative to add five-star quality ratings to its Compare Web sites, the
Technical Notes for HCAHPS Star Ratings (Revised for April 2018 Public Reporting) Overview of HCAHPS Star Ratings As part of the initiative to add five-star quality ratings to its Compare Web sites, the
Technical Notes for HCAHPS Star Ratings (Revised for October 2017 Public Reporting)
") Technical Notes for HCAHPS Star Ratings (Revised for October 2017 Public Reporting) Overview of HCAHPS Star Ratings As part of the initiative to add five-star quality ratings to its Compare Web sites,
Technical Notes for HCAHPS Star Ratings (Revised for October 2017 Public Reporting) Overview of HCAHPS Star Ratings As part of the initiative to add five-star quality ratings to its Compare Web sites,
CAHPS Hospital Survey Podcast Series Transcript
 CAHPS Hospital Survey Podcast Series Transcript HCAHPS Score Calculations Part II: Patient-Mix Adjustment Slide 1-HCAHPS Score Calculations Part II: Patient-Mix Adjustment (PMA) Welcome to the CAHPS Hospital
The Determinants of Patient Satisfaction in the United States
 The Determinants of Patient Satisfaction in the United States Nikhil Porecha The College of New Jersey 5 April 2016 Dr. Donka Mirtcheva Abstract Hospitals and other healthcare facilities face a problem
PRC EasyView Training HCAHPS Application. By Denise Rabalais, Director Service Measurement & Improvement
 PRC EasyView Training HCAHPS Application By Denise Rabalais, Director Service Measurement & Improvement PRCEasyView Web Address: https://www.prceasyview.com/vanderbilt Go to: My Studies HCAHPS C Master
2017 SPECIALTY REPORT ANNUAL REPORT
 2017 SPECIALTY REPORT ANNUAL REPORT National Commission on Certification of Physician Assistants Table of Contents Message from the President... 3 About the Data Collection and Methodology...4 All Specialties....
APPENDIX O: XML DATA FILE LAYOUT FOR DISPROPORTIONATE STRATIFIED RANDOM SAMPLING
 APPENDIX O: XML DATA FILE LAYOUT FOR DISPROPORTIONATE STRATIFIED RANDOM SAMPLING Centers for Medicare & Medicaid Services Appendix O: XML File Layout for Disproportionate Stratified Random Sampling January
INPATIENT SURVEY PSYCHOMETRICS
 INPATIENT SURVEY PSYCHOMETRICS One of the hallmarks of Press Ganey s surveys is their scientific basis: our products incorporate the best characteristics of survey design. Our surveys are developed by
Comparison of New Zealand and Canterbury population level measures
 Report prepared for Canterbury District Health Board Comparison of New Zealand and Canterbury population level measures Tom Love 17 March 2013 1BAbout Sapere Research Group Limited Sapere Research Group
Web Appendix: The Phantom Gender Difference in the College Wage Premium
 Web Appendix: The Phantom Gender Difference in the College Wage Premium William H.J. Hubbard whubbard@uchicago.edu Summer 2011 1 Robustness to Sample Composition and Estimation Specification 1.1 Census
Running Head: READINESS FOR DISCHARGE
 Running Head: READINESS FOR DISCHARGE Readiness for Discharge Quantitative Review Melissa Benderman, Cynthia DeBoer, Patricia Kraemer, Barbara Van Der Male, & Angela VanMaanen. Ferris State University
Engaging Students Using Mastery Level Assignments Leads To Positive Student Outcomes
 Lippincott NCLEX-RN PassPoint NCLEX SUCCESS L I P P I N C O T T F O R L I F E Case Study Engaging Students Using Mastery Level Assignments Leads To Positive Student Outcomes Senior BSN Students PassPoint
Studying HCAHPS Scores and Patient Falls in the Context of Caring Science
 Studying HCAHPS Scores and Patient Falls in the Context of Caring Science STTI 26 th Research Congress: San Juan, Puerto Rico July 26, 2015 Presented by: Mary Ann Hozak, MA, RN, St. Joseph Health System
Minnesota s Physician Workforce, 2015
 Minnesota s Physician Workforce, 2015 HIGHLIGHTS FROM THE 2015 PHYSICIAN WORKFORCE SURVEY i Overall According to the Minnesota Board of Medical Practice, as of November 2015, there were 22,353 actively
HCAHPS Update Training
 HCAHPS Update Training Welcome! In the Update Training sessions, we will present: HCAHPS Program Updates Updates on HCAHPS Quality Assurance Guidelines V 6.0 Calculation of HCAHPS Scores: From Raw Data
Population Representation in the Military Services
 Population Representation in the Military Services Fiscal Year 2008 Report Summary Prepared by CNA for OUSD (Accession Policy) Population Representation in the Military Services Fiscal Year 2008 Report
A comparison of two measures of hospital foodservice satisfaction
 Australian Health Review [Vol 26 No 1] 2003 A comparison of two measures of hospital foodservice satisfaction OLIVIA WRIGHT, SANDRA CAPRA AND JUDITH ALIAKBARI Olivia Wright is a PhD Scholar in Nutrition
2013 Workplace and Equal Opportunity Survey of Active Duty Members. Nonresponse Bias Analysis Report
 2013 Workplace and Equal Opportunity Survey of Active Duty Members Nonresponse Bias Analysis Report Additional copies of this report may be obtained from: Defense Technical Information Center ATTN: DTIC-BRR
2016 Survey of Michigan Nurses
 2016 Survey of Michigan Nurses Survey Summary Report November 15, 2016 Office of Nursing Policy Michigan Department of Health and Human Services Prepared by the Michigan Public Health Institute Table of
Palomar College ADN Model Prerequisite Validation Study. Summary. Prepared by the Office of Institutional Research & Planning August 2005
 Palomar College ADN Model Prerequisite Validation Study Summary Prepared by the Office of Institutional Research & Planning August 2005 During summer 2004, Dr. Judith Eckhart, Department Chair for the
2017 CAHPS Child Medicaid Survey Summary Report
 2017 CAHPS Child Medicaid Survey Summary Report June 2017 Morpace research is completed in compliance with ISO 20252 Table of Contents Executive Highlights........................................ Background,
MEDICARE ENROLLMENT, HEALTH STATUS, SERVICE USE AND PAYMENT DATA FOR AMERICAN INDIANS & ALASKA NATIVES
 American Indian & Alaska Native Data Project of the Centers for Medicare and Medicaid Services Tribal Technical Advisory Group MEDICARE ENROLLMENT, HEALTH STATUS, SERVICE USE AND PAYMENT DATA FOR AMERICAN
Minnesota s Physical Therapist Assistant Workforce, 2015
 Minnesota s Physical Therapist Assistant Workforce, 2015 HIGHLIGHTS FROM THE 2015 PHYSICAL THERAPIST ASSISTANT WORKFORCE SURVEY i Overall According to the Minnesota Board of Physical Therapy, as of April
IMPROVING HCAHPS, PATIENT MORTALITY AND READMISSION: MAXIMIZING REIMBURSEMENTS IN THE AGE OF HEALTHCARE REFORM
 IMPROVING HCAHPS, PATIENT MORTALITY AND READMISSION: MAXIMIZING REIMBURSEMENTS IN THE AGE OF HEALTHCARE REFORM OVERVIEW Using data from 1,879 healthcare organizations across the United States, we examined
The Hashemite University- School of Nursing Master s Degree in Nursing Fall Semester
 The Hashemite University- School of Nursing Master s Degree in Nursing Fall Semester Course Title: Statistical Methods Course Number: 0703702 Course Pre-requisite: None Credit Hours: 3 credit hours Day,
Home Health Quality Improvement Campaign
 Home Health Quality Improvement Campaign Description of Monthly Report for Improvement in Oral Medications Monthly Report for Improvement in Management of Oral Medications All data displayed illustrate
Collection of Race, Ethnicity, and Language Data at Henry Ford Health System
 Collection of Race, Ethnicity, and Language Data at Henry Ford Health System David R. Nerenz, Ph.D. Director, Center for Health Policy and Health Services Research National Initiatives Healthy People 2010
SEPTEMBER O NE-YEAR S URVEY SURVEY REPORT. Bachelor s Degree in Nursing Program
 SEPTEMBER 2017 O NE-YEAR S URVEY SURVEY REPORT Bachelor s Degree in Nursing Program Report of Survey Results: One-year Survey Bachelor's Degree in Nursing Report Generated: September 26, 2017 For All Graduates
Predicting Medicare Costs Using Non-Traditional Metrics
 Predicting Medicare Costs Using Non-Traditional Metrics John Louie 1 and Alex Wells 2 I. INTRODUCTION In a 2009 piece [1] in The New Yorker, physician-scientist Atul Gawande documented the phenomenon of
POSITIVE ASPECTS OF ALZHEIMER S CAREGIVING: THE ROLE OF ETHNICITY
 POSITIVE ASPECTS OF ALZHEIMER S CAREGIVING: THE ROLE OF ETHNICITY by Kang Sun M.D., Beijing Medical University, 1998 Submitted to the Graduate Faculty of The Graduate School of Public Health in partial
time to replace adjusted discharges
 REPRINT May 2014 William O. Cleverley healthcare financial management association hfma.org time to replace adjusted discharges A new metric for measuring total hospital volume correlates significantly
The Prior Service Recruiting Pool for National Guard and Reserve Selected Reserve (SelRes) Enlisted Personnel
 Enlisted Personnel") Issue Paper #61 National Guard & Reserve MLDC Research Areas The Prior Service Recruiting Pool for National Guard and Reserve Selected Reserve (SelRes) Enlisted Personnel Definition of Diversity Legal
Issue Paper #61 National Guard & Reserve MLDC Research Areas The Prior Service Recruiting Pool for National Guard and Reserve Selected Reserve (SelRes) Enlisted Personnel Definition of Diversity Legal
Patient Selection Under Incomplete Case Mix Adjustment: Evidence from the Hospital Value-based Purchasing Program
 Patient Selection Under Incomplete Case Mix Adjustment: Evidence from the Hospital Value-based Purchasing Program Lizhong Peng October, 2014 Disclaimer: Pennsylvania inpatient data are from the Pennsylvania
Patient Experience & Satisfaction
 Patient Experience & Satisfaction Inpatient Satisfaction Inpatient Experience Hancock Regional Hospital conducts phone surveys from patients who have received care from us. Find out what they are saying
Survey of Nurses 2015
 Survey of Nurses 2015 Prepared by Public Sector Consultants Inc. Lansing, Michigan www.pscinc.com There are an estimated... 104,351 &17,559 LPNs RNs onehundredfourteenthousdfourhundredtwentyregisterednursesactiveinmichigan
Member Satisfaction Survey Evaluation Table 19: Jai Medical Systems Member Satisfaction Survey : Overall Ratings
 Member Satisfaction Survey Evaluation JMSMCO conducted an annual survey of its members to determine member satisfaction and to identify areas that needed improvement. Through survey results JMSMCO was
Colorado Community College System ACADEMIC YEAR NEED-BASED FINANCIAL AID APPLICANT DEMOGRAPHICS BASED ON 9 MONTH EFC
 Colorado Community College System ACADEMIC YEAR 2010-2011 NEED-BASED FINANCIAL AID APPLICANT DEMOGRAPHICS BASED ON 9 MONTH EFC SEPTEMBER 2013 1 2010-2011 Aid Recipients and Applicants For the academic
Colorado Community College System ACADEMIC YEAR NEED-BASED FINANCIAL AID APPLICANT DEMOGRAPHICS BASED ON 9 MONTH EFC
 Colorado Community College System ACADEMIC YEAR 2011-2012 NEED-BASED FINANCIAL AID APPLICANT DEMOGRAPHICS BASED ON 9 MONTH EFC SEPTEMBER 2013 1 2011-2012 Aid Recipients and Applicants For academic year
Nazan Yelkikalan, PhD Elif Yuzuak, MA Canakkale Onsekiz Mart University, Biga, Turkey
 UDC: 334.722-055.2 THE FACTORS DETERMINING ENTREPRENEURSHIP TRENDS IN FEMALE UNIVERSITY STUDENTS: SAMPLE OF CANAKKALE ONSEKIZ MART UNIVERSITY BIGA FACULTY OF ECONOMICS AND ADMINISTRATIVE SCIENCES 1, (part
Officer Retention Rates Across the Services by Gender and Race/Ethnicity
 Issue Paper #24 Retention Officer Retention Rates Across the Services by Gender and Race/Ethnicity MLDC Research Areas Definition of Diversity Legal Implications Outreach & Recruiting Leadership & Training
Hospital Compare Quality Measures: 2008 National and Florida Results for Critical Access Hospitals
 Hospital Compare Quality Measures: National and Results for Critical Access Hospitals Michelle Casey, MS, Michele Burlew, MS, Ira Moscovice, PhD University of Minnesota Rural Health Research Center Introduction
Quality of Care of Medicare- Medicaid Dual Eligibles with Diabetes. James X. Zhang, PhD, MS The University of Chicago
 Quality of Care of Medicare- Medicaid Dual Eligibles with Diabetes James X. Zhang, PhD, MS The University of Chicago April 23, 2013 Outline Background Medicare Dual eligibles Diabetes mellitus Quality
For More Information
 CHILDREN AND FAMILIES EDUCATION AND THE ARTS ENERGY AND ENVIRONMENT HEALTH AND HEALTH CARE INFRASTRUCTURE AND TRANSPORTATION INTERNATIONAL AFFAIRS LAW AND BUSINESS NATIONAL SECURITY POPULATION AND AGING
Patient survey report Survey of people who use community mental health services gether NHS Foundation Trust
 Patient survey report 2014 Survey of people who use community mental health services 2014 National NHS patient survey programme Survey of people who use community mental health services 2014 The Care
Fleet and Marine Corps Health Risk Assessment, 02 January December 31, 2015
 Fleet and Marine Corps Health Risk Assessment, 02 January December 31, 2015 Executive Summary The Fleet and Marine Corps Health Risk Appraisal is a 22-question anonymous self-assessment of the most common
Suicide Among Veterans and Other Americans Office of Suicide Prevention
 Suicide Among Veterans and Other Americans 21 214 Office of Suicide Prevention 3 August 216 Contents I. Introduction... 3 II. Executive Summary... 4 III. Background... 5 IV. Methodology... 5 V. Results
Minnesota s Marriage & Family Therapist (MFT) Workforce, 2015
 Workforce, 2015") OFFICE OF RURAL HEALTH AND PRIMARY CARE Minnesota s Marriage & Family Therapist (MFT) Workforce, 2015 HIGHLIGHTS FROM THE 2015 MFT WORKFORCE SURVEY i Overall According to the Board of Marriage and Family
OFFICE OF RURAL HEALTH AND PRIMARY CARE Minnesota s Marriage & Family Therapist (MFT) Workforce, 2015 HIGHLIGHTS FROM THE 2015 MFT WORKFORCE SURVEY i Overall According to the Board of Marriage and Family
Cite as: LeVasseur, S.A. (2015) Nursing Education Programs Hawai i State Center for Nursing, University of Hawai i at Mānoa, Honolulu.
 Nursing Education Programs Hawai i State Center for Nursing, University of Hawai i at Mānoa, Honolulu.") Nursing Education Program Capacity 2012-2013 1 Written by: Dr. Sandra A. LeVasseur, PhD, RN Associate Director, Research Hawai i State Center for Nursing University of Hawai i at Mānoa, Honolulu, Hawai
Nursing Education Program Capacity 2012-2013 1 Written by: Dr. Sandra A. LeVasseur, PhD, RN Associate Director, Research Hawai i State Center for Nursing University of Hawai i at Mānoa, Honolulu, Hawai
Minnesota s Registered Nurse Workforce
 Minnesota s Registered Nurse Workforce 2013-2014 HIGHLIGHTS FROM THE 2013-2014 RN WORKFORCE SURVEY i Overall Registered nurses are the largest segment of the health care workforce delivering primary and
Barriers & Incentives to Obtaining a Bachelor of Science Degree in Nursing
 Southern Adventist Univeristy KnowledgeExchange@Southern Graduate Research Projects Nursing 4-2011 Barriers & Incentives to Obtaining a Bachelor of Science Degree in Nursing Tiffany Boring Brianna Burnette
SEPTEMBER O NE-YEAR S URVEY SURVEY REPORT. Master of Science in Nursing Program
 SEPTEMBER 2017 O NE-YEAR S URVEY SURVEY REPORT Master of Science in Nursing Program Report of Survey Results: One-year Survey Master of Science in Nursing Report Generated: September 26, 2017 For All Graduates
SEPTEMBER E XIT S URVEY SURVEY REPORT. Associate Degree in Nursing Program
 SEPTEMBER 2017 E XIT S URVEY SURVEY REPORT Associate Degree in Nursing Program Report of Survey Results: Exit Survey Associate's Degree in Nursing Report Generated: September 26, 2017 For All Graduates
The Centers for Medicare & Medicaid Services (CMS) strives to make information available to all. Nevertheless, portions of our files including
 strives to make information available to all. Nevertheless, portions of our files including") The Centers for Medicare & Medicaid Services (CMS) strives to make information available to all. Nevertheless, portions of our files including charts, tables, and graphics may be difficult to read using
The Centers for Medicare & Medicaid Services (CMS) strives to make information available to all. Nevertheless, portions of our files including charts, tables, and graphics may be difficult to read using
CHAPTER 5 AN ANALYSIS OF SERVICE QUALITY IN HOSPITALS
 CHAPTER 5 AN ANALYSIS OF SERVICE QUALITY IN HOSPITALS Fifth chapter forms the crux of the study. It presents analysis of data and findings by using SERVQUAL scale, statistical tests and graphs, for the
PG snapshot Nursing Special Report. The Role of Workplace Safety and Surveillance Capacity in Driving Nurse and Patient Outcomes
 PG snapshot news, views & ideas from the leader in healthcare experience & satisfaction measurement The Press Ganey snapshot is a monthly electronic bulletin freely available to all those involved or interested
Survey of people who use community mental health services Leicestershire Partnership NHS Trust
 Survey of people who use community mental health services 2017 Survey of people who use community mental health services 2017 National NHS patient survey programme Survey of people who use community mental
Minnesota s Registered Nurse Workforce
 Minnesota s Registered Nurse Workforce 2015-2016 HIGHLIGHTS FROM THE 2015-2016 RN WORKFORCE SURVEYi Overall Registered nurses, the largest segment of the health care workforce, deliver primary and specialty
DoDEA Seniors Postsecondary Plans and Scholarships SY
 DoDEA Seniors Postsecondary Plans and Scholarships SY 2011 12 Department of Defense Education Activity (DoDEA) Research and Evaluation Branch Ashley Griffin, PhD D e p a r t m e n t o f D e f e n s e E
Selected Measures United States, 2011
 Disparities in Nursing Home Quality Selected Measures United States, 2011 Disparities National Coordinating Center Spring 2014 This material was prepared by the Delmarva Foundation for Medical Care (DFMC)
CALIFORNIA HEALTHCARE FOUNDATION. Medi-Cal Versus Employer- Based Coverage: Comparing Access to Care JULY 2015 (REVISED JANUARY 2016)
") CALIFORNIA HEALTHCARE FOUNDATION Medi-Cal Versus Employer- Based Coverage: Comparing Access to Care JULY 2015 (REVISED JANUARY 2016) Contents About the Authors Tara Becker, PhD, is a statistician at the
CALIFORNIA HEALTHCARE FOUNDATION Medi-Cal Versus Employer- Based Coverage: Comparing Access to Care JULY 2015 (REVISED JANUARY 2016) Contents About the Authors Tara Becker, PhD, is a statistician at the
CHAPTER 3. Research methodology
 CHAPTER 3 Research methodology 3.1 INTRODUCTION This chapter describes the research methodology of the study, including sampling, data collection and ethical guidelines. Ethical considerations concern
COMMUNITY DEVELOPMENT BLOCK GRANT PROGRAM YEAR 2016/17
 COMMUNITY DEVELOPMENT BLOCK GRANT PROGRAM YEAR 2016/17 ANNUAL REPORT CDBG subrecipients, please fill in the following tables and answer questions as completely as possible. Submit this report to the City
Analysis of 340B Disproportionate Share Hospital Services to Low- Income Patients
 Analysis of 340B Disproportionate Share Hospital Services to Low- Income Patients March 12, 2018 Prepared for: 340B Health Prepared by: L&M Policy Research, LLC 1743 Connecticut Ave NW, Suite 200 Washington,
Attrition Rates and Performance of ChalleNGe Participants Over Time
 CRM D0013758.A2/Final April 2006 Attrition Rates and Performance of ChalleNGe Participants Over Time Jennie W. Wenger Cathleen M. McHugh with Lynda G. Houck 4825 Mark Center Drive Alexandria, Virginia
Licensed Nurses in Florida: Trends and Longitudinal Analysis
 Licensed Nurses in Florida: 2007-2009 Trends and Longitudinal Analysis March 2009 Addressing Nurse Workforce Issues for the Health of Florida www.flcenterfornursing.org March 2009 2007-2009 Licensure Trends
DAHL: Demographic Assessment for Health Literacy. Amresh Hanchate, PhD Research Assistant Professor Boston University School of Medicine
 DAHL: Demographic Assessment for Health Literacy Amresh Hanchate, PhD Research Assistant Professor Boston University School of Medicine Source The Demographic Assessment for Health Literacy (DAHL): A New
The development and testing of a conceptual model for the analysis of contemporry developmental relationships in nursing
 University of Wollongong Research Online University of Wollongong Thesis Collection 1954-2016 University of Wollongong Thesis Collections 1992 The development and testing of a conceptual model for the
HCAHPS, HSOPS, HACs and HIQRP Connecting the Dots
 HCAHPS, HSOPS, HACs and HIQRP Connecting the Dots Sharon Burnett, R.N., BSN, MBA Vice President of Clinical and Regulatory Affairs Missouri Hospital Association Objectives Discuss how the results of the
Presented by: Jill Budden, PhD
 Findings from the 2015 National Nursing Workforce Study: A Collaboration between the National Council of State Boards of Nursing & The National Forum of State Nursing Workforce Centers Presented by: Jill
SCHOOL - A CASE ANALYSIS OF ICT ENABLED EDUCATION PROJECT IN KERALA
 CHAPTER V IT@ SCHOOL - A CASE ANALYSIS OF ICT ENABLED EDUCATION PROJECT IN KERALA 5.1 Analysis of primary data collected from Students 5.1.1 Objectives 5.1.2 Hypotheses 5.1.2 Findings of the Study among
2005 Survey of Licensed Registered Nurses in Nevada
 2005 Survey of Licensed Registered Nurses in Nevada Prepared by: John Packham, PhD University of Nevada School of Medicine Tabor Griswold, MS University of Nevada School of Medicine Jake Burkey, MS Washington
Reenlistment Rates Across the Services by Gender and Race/Ethnicity
 Issue Paper #31 Retention Reenlistment Rates Across the Services by Gender and Race/Ethnicity MLDC Research Areas Definition of Diversity Legal Implications Outreach & Recruiting Leadership & Training
SEPTEMBER O NE-YEAR S URVEY SURVEY REPORT. Associate Degree in Nursing Program
 SEPTEMBER 2017 O NE-YEAR S URVEY SURVEY REPORT Associate Degree in Nursing Program Report of Survey Results: One-year Survey Associate's Degree in Nursing Report Generated: September 26, 2017 For All Graduates
Final Report: Estimating the Supply of and Demand for Bilingual Nurses in Northwest Arkansas
 Final Report: Estimating the Supply of and Demand for Bilingual Nurses in Northwest Arkansas Produced for the Nursing Education Consortium Center for Business and Economic Research Reynolds Center Building
Patient survey report National children's inpatient and day case survey 2014 The Mid Yorkshire Hospitals NHS Trust
 Patient survey report 2014 National children's inpatient and day case survey 2014 National NHS patient survey programme National children's inpatient and day case survey 2014 The Care Quality Commission
Salary and Demographic Survey Results
 Salary and Demographic Survey Results Executive Summary In July of 2010, Grant Professionals Association (GPA formerly AAGP) conducted a salary and demographic survey of grant professionals. The survey
UNIVERSITY OF NORTH DAKOTA PHYSICIAN ASSISTANT PROGRAM
 Student Applicant s Name: preceptor profile UNIVERSITY OF NORTH DAKOTA PHYSICIAN ASSISTANT PROGRAM School of Medicine and Health Sciences, Department of Physician Assistant Studies PERSONAL DATA 501 North
Table of Contents. Overview. Demographics Section One
 Table of Contents Overview Introduction Purpose... x Description... x What s New?... x Data Collection... x Response Rate... x How to Use This Report Report Organization... xi Appendices... xi Additional
Determining Like Hospitals for Benchmarking Paper #2778
 Determining Like Hospitals for Benchmarking Paper #2778 Diane Storer Brown, RN, PhD, FNAHQ, FAAN Kaiser Permanente Northern California, Oakland, CA, Nancy E. Donaldson, RN, DNSc, FAAN Department of Physiological
Research Design: Other Examples. Lynda Burton, ScD Johns Hopkins University
 This work is licensed under a Creative Commons Attribution-NonCommercial-ShareAlike License. Your use of this material constitutes acceptance of that license and the conditions of use of materials on this
Patient survey report Outpatient Department Survey 2011 County Durham and Darlington NHS Foundation Trust
 Patient survey report 2011 Outpatient Department Survey 2011 County Durham and Darlington NHS Foundation Trust The national survey of outpatients in the NHS 2011 was designed, developed and co-ordinated
Patient-Mix Adjustment Factors for Home Health Care CAHPS Survey Results Publicly Reported on Home Health Compare in July 2017
 Patient-Mix Adjustment Factors for Home Health Care CAHPS Survey Results Publicly Reported on Home Health Compare in July 2017 Home Health Care CAHPS (HHCAHPS) Survey results will be refreshed or updated