California ED Diversion Project Evaluation Final Report
|
|
|
- Daniella Blake
- 6 years ago
- Views:
Transcription


1 California ED Diversion Project Evaluation Final Report February 2009 Edward M. Castillo, Ph.D., MPH Gary M. Vilke, M.D. Theodore C. Chan, M.D. University of California, San Diego Department of Emergency Medicine Supported by a grant from the California HealthCare Foundation, based in Oakland, California
2 TABLE OF CONTENTS TABLE OF CONTENTS...1 PROJECT BACKGROUND...3 STATEWIDE DIVERSION TRENDS, CEDDP COLLABORATIVE COMMUNITIES...8 Evaluation Process...9 Overall Survey Findings...9 Overall Impact on Diversion Los Angeles Region Inland Counties Region Ventura Region Santa Clara Region Summary of Ambulance Diversion Mitigation Practices & ED Capacity Initiatives Evaluation Limitations REFERENCES APPENDICES Appendix A: Summit Survey Tool Appendix B: Standardized Site Visit Questions Appendix C: Project Key Performance Indicators (KPIs) TABLES Table 1. Diversion Hours and Change from 2003 to Table 2. Diversion Hours Percent Change by Year and from 2003 to Table 3. Total Diversion Hours and Change from 2003 to 2007 for Los Angeles, Inland Counties and All Other Regions...6 Table 4. Total Diversion Hours Percent Change by Year and from 2003 to 2007 for Los Angeles, Inland Counties and All Other Regions...6 Table 5. Participating EMS Regions and Partner Hospitals...8 Table 6. Diversion Hours and Change from 2003 to 2007 by Collaboration Participation...8 Table 7. Diversion Hours Percent Change by Year and from 2003 to 2007 by Collaboration Participation...9 Table 8. Los Angeles Region Diversion Hours and Percent Change, Table 9. Inland Counties Region Diversion Hours and Percent Change, Table 10. Ventura Region Diversion Hours and Percent Change, Table 11. Santa Clara Region Diversion Hours and Percent Change,
3 FIGURES Figure 1. Percent Contribution to Decreased Diversion Hours from Figure 2. Decrease in Diversion Hours by Year for Select Regions, Figure 3. Total ED Diversion Hours for Participating Hospitals, May 2006 August Figure 4. Total ED Diversion Hours for Participating Hospitals, Los Angeles Region, May 2006 August Figure 5. ED Diversion Hours for Participating Hospitals, Los Angeles Region, May 2006 August Figure 6. Total ED Diversion Hours for Participating Hospitals, Inland Counties Region, May 2006 August Figure 7. ED Diversion Hours for Participating Hospitals, Inland Counties Region, May 2006 August Figure 8. ED Diversion Hours for Participating Hospitals, Ventura Region, May 2006 August Figure 9. ED Diversion Hours for Participating Hospitals, Ventura Region, May 2006 August Figure 10. ED Diversion Hours for Participating Hospitals, Santa Clara (RMC SJ), May 2006 August
4 PROJECT BACKGROUND The goal of this report is to provide an independent evaluation of the California Emergency Department Diversion Project (CEDDP). CEDDP was a two year project ( ) conducted by The Abaris Group with funding from the California HealthCare Foundation (CHCF). The goal of CEDDP was to measure and publicly report the extent of ambulance diversion by EMS area and hospital, identify best practices to minimize diversion, and create a collaborative of a select group of California communities to implement a series of best practices and measure their outcomes. ED capacity and ambulance diversion continues to be a growing problem world wide, receiving increasing attention from the medical literature, professional organizations, and the media. 1 4 When patients do not reach requested facilities, challenges in care are compounded by lack of available medical records and delays in transferring admitted patients back to the originally requested facility. Ambulance diversion has repeatedly been shown to have negative impact on patient care, including timeliness of medical attention as well as overall health outcomes. 5 7 CEDDP had four major phases. First, data were collected, analyzed and reported from all 36 of California s local Emergency Medical Services Agencies (EMSAs) to describe the nature and extent of diversion throughout the state. Second, through a variety of methods, an inventory of hospital practices and diversion mitigation efforts was created and best practices identified. Third, a collaborative was formed with four EMSAs and selected hospitals in their regions to develop and implement best practices, and measure the impact of these processes on ED capacity and ambulance diversion. Much of this collaborative effort was based on the national Robert Wood Johnson Urgent Matters program ( Fourth, subsequent data were collected, analyzed and reported on ambulance diversion for the collaborative as well as statewide. This report outlines results from an independent evaluation of the CEDDP. Specific objectives were developed, incorporating quantitative and qualitative data collection techniques, to measure and analyze the impact of the project. These specific objectives were: 1. Analyze quantitative data collected and reported by CEDDP on the following levels: statewide data collected initially and at project end; regional EMS data collected from the four regions of the collaboration; and specific hospital ED and diversion data collected from participating hospitals. 2. Assess the collaborative using qualitative data collection and analysis methods in terms of program development, implementation and overall success, as well as outcomes for each of the four participating regions. 3. Assess the impact, sustainability and exportability of specific ED capacity and ambulance diversion mitigation practices implemented within the collaborative. This assessment will include quantitative and qualitative methods utilized in both specific objectives 1 and 2. 3
5 STATEWIDE DIVERSION TRENDS, The goal of the first phase of CEDDP was to collect ED diversion data for the EMS regions throughout California. Table 1 reports diversion hours and the change from 2003 to Data were collected from multiple sources including EMS agencies and California Office of Statewide Health Planning Department (OSHPD). Table 1. Diversion Hours and Change from 2003 to 2007 EMS Region Alameda 3,496 1,764 1,319 1, ,782 Central California Coastal Valleys 229 2,990 2, Contra Costa ,674 El Dorado Imperial 806 1,276 1, , Inland Counties* 52,387 37,114 32,661 22,318 19,224 33,163 Kern 1,532 1,368 1,905 1, Los Angeles* 166, , , ,609 81,741 84,418 Marin Merced Monterey Mountain Valley 2, ,089 1,206 North Coast 0 0 Northern California Orange 14,561 10,767 10,608 9,821 7,197 7,364 Riverside 6,712 3,216 3,847 2,573 2,423 4,289 Sacramento 6,380 7,785 5,811 6,644 3,905 2,475 San Benito San Diego 23,084 22,063 18,841 21,771 24,458 1,374 San Francisco 13,582 8,015 7,106 4,725 6,477 7,105 San Joaquin San Luis Obispo San Mateo 1,948 2,160 2,458 2,079 2, Santa Barbara 0 3 1, Santa Clara* 2,084 3,077 2,638 2,546 2, Santa Cruz , Sierra Sacramento ,516 1, Solano 0 Toulumne Ventura* 4,819 9,257 9,521 10,836 7,400 2,581 *Regions participating in the CEDDP Collaborative Data not available 4
6 Table 2 reports the yearly percentage change from 2003 to 2004 as well as 2003 to Data were complete for the majority of regions for the specific time period, include those who participated in the collaborative. Table 2. Diversion Hours Percent Change by Year and from 2003 to 2007 EMS Region Alameda 49.5% 25.2% 18.7% 33.5% 79.6% Central California Coastal Valleys % 8.1% 91.3% Contra Costa 32.5% 96.9% 230.8% El Dorado Imperial 58.3% 15.9% 51.7% 116.2% 39.0% Inland Counties* 29.2% 12.0% 31.7% 13.9% 63.3% Kern 10.7% 39.3% 46.5% 39.1% 59.5% Los Angeles* 0.7% 6.0% 41.4% 20.3% 50.8% Marin ** 108.2% 38.2% 48.4% ** Merced Monterey 406.7% 29.0% Mountain Valley 91.0% 22.2% 145.8% 75.1% 52.5% North Coast 0.0% Northern California 78.0% 21.9% 202.6% 0.2% 321.3% Orange 26.1% 1.5% 7.4% 26.7% 50.6% Riverside 52.1% 19.6% 33.1% 5.8% 63.9% Sacramento 22.0% 25.4% 14.3% 41.2% 38.8% San Benito San Diego 4.4% 14.6% 15.6% 12.3% 6.0% San Francisco 41.0% 11.3% 33.5% 37.1% 52.3% San Joaquin 12.4% 2.2% 49.6% 63.3% 109.2% San Luis Obispo 15.8% 0.0% 62.5% % 559.6% San Mateo 10.9% 13.8% 15.4% 20.2% 28.3% Santa Barbara ** ** 60.0% 41.3% ** Santa Clara* 47.6% 14.3% 3.5% 2.1% 24.8% Santa Cruz 22.5% 85.7% 0.4% 109.9% 200.6% Sierra Sacramento 18.7% 143.3% 20.4% 62.7% 11.1% Solano Toulumne 0.0% 75.0% Ventura* 92.1% 2.9% 13.8% 31.7% 53.6% *Regions participating in the CEDDP Collaborative **Increased from 0 or near 0 Data not available 5
7 A total of 21 EMS Agencies had complete yearly diversion data from 2003 to The ten regions with incomplete data were Central California, Coastal Valleys, Contra Costa, El Dorado, Merced, Monterey, North Coast, San Benito, Solano, and Toulumne and are not included in the following analysis. The Los Angles and Inland Counties regions both had changes of over 10,000 hours between 2003 and 2007 (Table 3). The next two largest decreases over the same time period were seen in the Orange and San Francisco regions each with about 7,000 hours. The remaining regions accounted for very little change in diversion hours. Table 3. Total Diversion Hours and Change from 2003 to 2007 for Los Angeles, Inland Counties and All Other Regions EMS Region Los Angeles and Inland Counties 218, , , , , ,581 All Other Regions 82,895 72,483 69,168 68,074 64,215 18,680 Table 4 shows where the largest year to year percentage changes are in the Los Angeles and Inland Counties regions. There were two years with large drops in diversion hours, and Table 4. Total Diversion Hours Percent Change by Year and from 2003 to 2007 for Los Angeles, Inland Counties and All Other Regions EMS Region Los Angeles and Inland Counties 7.5% 2.7% 39.8% 19.2% 53.8% All Other Regions 12.6% 4.6% 1.6% 5.7% 22.5% Figure 1 illustrates the percent contribution to the decrease in statewide diversion hours from 2003 to The decrease in diversion hours in the Los Angeles region contributed to 62% of the total statewide decrease. The Inland County region was responsible for 24% of the total decrease. 6


8 Figure 1. Percent Contribution to Decreased Diversion Hours Statewide from All Other Regions 14% Inland Counties 24% Los Angeles 62% Figure 2 illustrates the decrease in the Los Angeles, Inland Counties and All Other Regions by year from 2003 to The largest decrease in Los Angeles occurred from 2005 and The Inland Counties region decreased consistently over the time period. All Other Regions combined had the largest decrease from 2003 to ,000 Figure 2. Decrease in Diversion Hours by Year for Select Regions, , ,000 Los Angeles 125, ,000 All Other Regions 75,000 50,000 25,000 Inland Counties
9 CEDDP COLLABORATIVE COMMUNITIES There were four EMAs selected for participation in the CEDDP collaborative, each of which included three to four hospital participants. Santa Clara EMSA was originally included in the collaborative, but later dropped from the project and data were only available from the one hospital that had started. The goal of the collaborative was to develop and implement best practices and measure the impact of these processes on ED capacity and ambulance diversion for the participants and the region as a whole. The list of the CEDDP Collaborative Regions and Participants are listed in Table 5 below. Table 5. Participating EMS Regions and Partner Hospitals EMS Region Los Angeles Inland Counties Ventura Santa Clara Partner Hospitals St. Francis Medical Center, Presbyterian Intercommunity Hospital, Methodist Hospital Arrowhead Regional Medical Center, Loma Linda University, St. Mary s Medical Center Community Memorial Hospital, Simi Valley Hospital, St. John s Regional Medical Center, Ventura County Medical Center Regional Medical Center of San Jose In reviewing the data from prior to participation, these four communities combined had significant decreases in diversion hours BEFORE the collaborative was initiated even when compared to other counties. However, much of this decrease can be explained as noted in the section above by the inclusion of both Los Angeles and Inland Counties, the EMSAs with the largest decreases in diversion during the 5 year time period before the collaborative (Table 6). Table 6. Diversion Hours and Change from 2003 to 2007 by Collaboration Participation EMS Region Not in 75,992 60,149 57,009 54,692 54,215 21,777 Collaborative In Collaborative 225, , , , , ,484 Inland Counties 52,387 37,114 32,661 22,318 19,224 33,163 Los Angeles 166, , , ,609 81,741 84,418 Santa Clara 2,084 3,077 2,638 2,546 2, Ventura 4,819 9,257 9,521 10,836 7,400 2,581 Table 7 reports percent changes in diversion hours by year. The changes in the regions with participating hospitals were largest between 2005 and
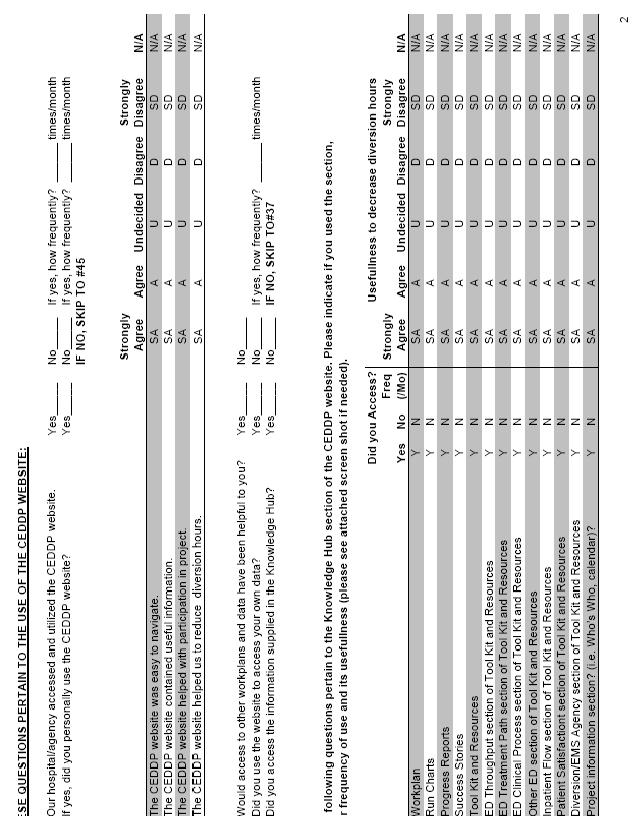
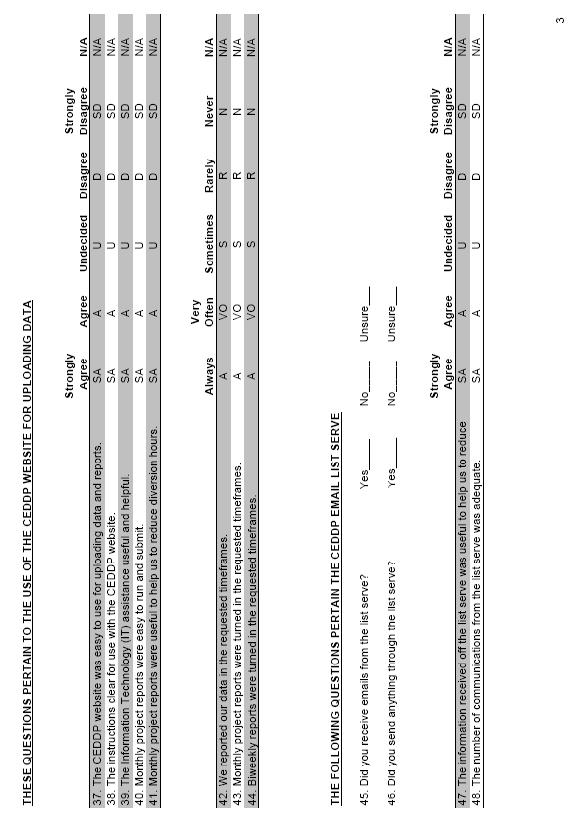
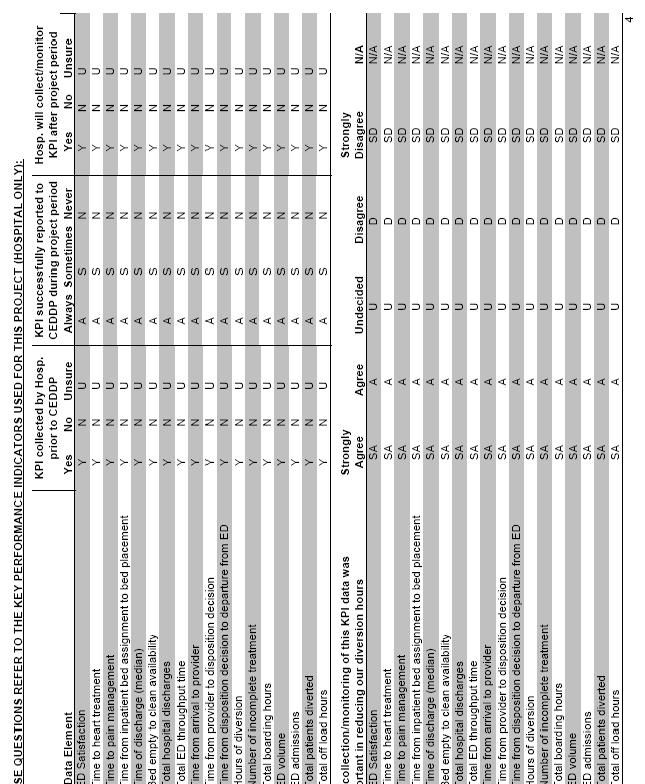
10 Table 7. Diversion Hours Percent Change by Year from 2003 to 2007 by Collaboration Participation EMS Region Not In Collaborative 20.8% 5.2% 4.1% 0.9% 28.7% In Collaborative 4.9% 2.5% 37.1% 19.8% 50.8% Inland Counties 29.2% 12.0% 31.7% 13.9% 63.3% Los Angeles 0.7% 6.0% 41.4% 20.3% 50.8% Santa Clara 47.6% 14.3% 3.5% 2.1% 24.8% Ventura 92.1% 2.9% 13.8% 31.7% 53.6% Evaluation Process Each region was evaluated on a quantitative and qualitative level. Data were collected from the State EMS agency as well as local EMSA and participating hospitals. An initial standardized survey tool was administered to all participants including the EMSA and hospital staff involved in the collaborative (Appendix A). On site visits were conducted by the evaluation team at each of the four regions with the lead EMSA, as well as participating hospitals, if available, using a standardized interview format (Appendix B). Follow up telephone interviews were conducted for the remaining hospitals that were not able to participate in the on site evaluations. The reminder of the report will focus on the results of the site visit surveys collected by the evaluation team and the reported diversion hours in participating EMSAs and participating hospitals collected by the Abaris Group from May 2006 through August Overall Survey findings Data Collection and Reporting Issues There were several data collection and reporting challenges that were identified during the course of this project, many of which focused on the project s key performance indicators (KPIs) (see Appendix C). First, many participating hospitals felt that too many KPIs were collected, and that not all of the KPIs had a direct relationship to ambulance diversion (such as the KPI to measure time to pain management in the ED). Second, although data definitions and reporting parameters were defined initially, the process of collecting the data was challenging for many hospitals, requiring resources and staff time, particularly for those participants relying on manual data extraction. In addition, the frequency of data collection (twice monthly or every 2 weeks) was also challenging for many participants. As a result, data reporting was often incomplete or delayed. Third, many participants noted that even when they had collected data in a timely manner, reporting their results via the collaborative s website proved challenging, particularly at the beginning of the 9
11 project year. This difficulty was related to problems getting the website up and running, as well as some challenges with entering data initially. In particular, the collection of ambulance off load times should be highlighted. Despite the developed data definitions and ongoing consultation throughout the project, the actual definition used by the varying regions was still challenging to determine. Different EMSAs, agencies and hospitals had different definitions for the off load time (aka wall time ). For some participants, it was defined as the time from ambulance arrival at the hospital to transfer of patient to the ED bed; for others it was the time from arrival to the time the ambulance was reported ready for a new call; and for others it was defined simply as a standard 20 minutes. Because of this variability in the definition, no conclusions can be made regarding the potential impact of efforts to reduce ambulance diversion by hospitals on the potential for increasing off load times for ambulances once they arrive to a hospital with a full ED. Abaris Coaching It was apparent throughout the evaluation that the Abaris staff provided excellent consultation and were very responsive and willing to assist participants whenever possible. However, as is not unexpected with this type of project, many participants expressed that their initial expectation was that the Abaris group would have provided more of the actual efforts involved in instituting changes at their facilities. Many felt that participation was too labor intensive on the hospital side. In essence, staff at many hospitals had hoped for more consulting in the form of live meetings and engagement of inhospital personnel, leadership and administration, to initiate change. ED staff involved in the project appreciated the Abaris coaching, and its emphasis on ED crowding being a hospital wide problem, not just one solely occurring in the ED. The Abaris staff was instrumental in gaining the support of hospital leadership at the start of the collaborative. However, participants did emphasize that they needed to have the continuous support of non ED hospital staff and leadership throughout the project year; with some noting that enthusiasm at this level waned over time as the Abaris staff engagement decreased. Overall Benefit The overall benefits of the CEDDP were evident through the evaluation process. Prior to the collaborative, many agencies and hospitals were not tracking diversion and throughput data. With participation, many agencies and hospitals improved their collection, tracking and utilization of data providing a strong basis for data driven decision making. For the most part, all participants stated they would continue collecting the KPI data as performance measures, though to a lesser frequency than during the collaborative year. Participation in the project also helped staff realize that diversion is not necessarily a solution to overcrowding. As a result, many expressed a willingness to try no diversion provided their hospital leadership would agree, and that other area hospitals would do the same. Similarly, a number of EMSAs reported that they are more strongly considering a no diversion practice based on participating in the CEDDP. Although the project has assisted many agencies and hospitals to improve data collection and tracking of important factors, the actual impact of the project of the project on diversion hours remains unclear. Much of the data collected were only done so for the project period and when comparing these types of 10
12 data, there are many factors that confound the measure such as seasonal trends. Comparing measures between month of differing seasons and even the same month between different years can lead to ecological fallacy and misinterpretation. There were also participation factors that affect the ability to generalize the methods used and make the benefit of the CEDDP challenging to quantify. Regions and hospitals were asked to participate based on their willingness and desire to address the issue of ambulance diversion. Most participants already had plans for implementing various changes and initiatives prior to participating in the project and diversion was already trending lower in the years leading into the project. Additionally, the geographic location of participants provided a further challenge for determining the success of the project. Diversion is impacted by neighboring EMS agencies and hospitals. The affect of the nonparticipating hospitals on those participating is unknown. This is even further diluted because although the majority of participating hospitals were decreasing diversion over time, the statewide data showed similar trends. Therefore, it appears that non participating hospitals were also decreasing their diversion hours. Although the direct benefit is difficult to quantify based on the factors reported above, the majority of participants reported a benefit to participating in the program. It was noted that the project helped bring raise the issue of ambulance diversion as a major concern to their leadership, and provided a platform for cooperation and collaboration with other hospitals and the EMSAs. While many hospitals already had plans for implementing various initiatives, participation in the collaborative seemed to focus the energy and enthusiasm to make these efforts a reality. The resources provided by Abaris were useful in modifying their current practices as well as considering and implementing new ideas. Many participants indicated that they will continue after the collaborative in implementing new initiatives at their facilities. Overall Impact on Diversion As noted above, it is difficult to measure the full impact of CEDDP on ambulance diversion. First, as previously described, ambulance diversion throughout the State, as well as within the 4 EMSA areas was decreasing in the years prior to the collaborative and this trend continued during the project year. Second, hospital and EMSA diversion hours were subject to seasonal trends, such as the winter flu season, which impacted the analysis of the 9 months of data available from the collaborative. Third, because diversion is greatly affected by neighboring hospitals, and it appears that hours decreased both with participating and non participating hospitals (as evidenced by the EMSA diversion data), the exact impact of CEDDP participation within a given region is difficult to determine. Figure 3 reports the total ED diversion hours for participating hospitals from May 2006 through August There was a decreasing trend in hours among participants with a more dramatic decrease toward the end of the project period (April 2008 through May 2008) when compared to previous years. The typical seasonal trend in ED utilization and diversion is demonstrated in the increased hours during the winter months. The increase in the most recent winter season was likely due to a higher than normal incidence of influenza during that year. 11
13 3,000 Figure 3. Total ED Diversion Hours for Participating Hospitals, May August 2008 Project Period (9/07-6/08) 2,500 2,000 1,500 1, May-06 Jul-06 Sep-06 Nov-06 Jan-07 Mar-07 May-07 Jul-07 Sep-07 Nov-07 Jan-08 Mar-08 May-08 Jul-08 12
14 Los Angeles Region Los Angeles County has the highest diversion hours annually in the State. As noted above, this county also had the largest drop in ambulance diversion hours in the years preceding the CEDDP collaborative (Table 8). Table 8. Los Angeles Region Diversion Hours and Percent Change, Diversion Hours 166, , , ,609 81,741 84, Percent Change 0.7% 6.0% 41.4% 20.3% 50.8% For the 9 months of data available during the collaborative (September 2007 June 2008), there was an increase initially in diversion hours, followed by a decrease (Figure 4). Although this change appears to mirror seasonal variations reported with ambulance diversion previously, the decrease is larger and appears to be sustained longer than previous years. Overall, the changes during 2007 in terms of ambulance diversion continued an ongoing trend in Los Angeles of decreasing diversion over the past several years with a larger decrease toward the end of the project period Figure 4. Total ED Diversion Hours for Participating Hospitals, Los Angeles Region, May August 2008 Project Period (9/07-6/08) May-06 Jun-06 Jul-06 Aug-06 Sep-06 Oct-06 Nov-06 Dec-06 Jan-07 Feb-07 Mar-07 Apr-07 May-07 Jun-07 Jul-07 Aug-07 Sep-07 Oct-07 Nov-07 Dec-07 Jan-08 Feb-08 Mar-08 Apr-08 May-08 Jun-08 Jul-08 Aug-08 13
15 Los Angeles County EMS LA EMSA staff believed that participation in CEDDP was valuable. Their initial hope was to address the impact of the threatened closure of hospitals in East Los Angeles County. Unfortunately, just before the start of the collaborative, Martin Luther King Medical Center closed. Subsequently, Downey Hospital, located in close proximity to MLK, withdrew from the collaborative. In general, EMSA staff felt that the process and outcomes would have been more useful if more hospitals in the given geographic region would have participated in the collaborative, as one hospital diversion is greatly influenced by the status of neighboring institutions. 9 As to the specifics of the collaborative, staff felt that the data collected was robust and comprehensive, but presented challenges because of short time requirements for data submission and variable website reliability early on in the project. The staff did note that the data collection process improved significantly over the months of the collaborative. Two data elements proved to be particularly challenging for the agency. These were the off load times (also known as wall time, the time from ambulance hospital arrival to patient transfer or ambulance ready status), which some of the EMS providers did not track; and numbers of patients diverted, which was manually collected at a number of the hospital EMS bases. However, the EMS staff did note that the data reporting requirements of the collaborative were useful in highlighting the problem of ambulance diversion and its various components such as off load times, to area EMS agencies and hospitals. LA EMSA did not institute new policy changes as a direct result of the collaborative. However, they plan on continuing the data collection, as well as periodic audits of performance measures. The do plan to use their IT system (READINET) to mandate a 15 minute period after one hour of diversion where the hospital cannot go back on diversion. In terms of wall time, the agency is considering policy changes to address the issue of ambulance stacking at various hospitals, including allowing real time access to READINET data on wall time for EMS providers. Staff also felt the collaborative was useful in getting hospitals to consider a no diversion policy, but also felt that the agency itself could not mandate such a policy without some means of enforcement. Los Angeles County Hospitals Similar to the overall Los Angeles EMS County data, ambulance diversion varied seasonally, but appeared to follow a general trend toward decreasing diversion (Figure 5). There was a significant drop in diversion for all 3 remaining participating hospitals in April 2008 which was sustained through the end of the collaborative. In particular, the decrease was most notable for one of the participating hospitals (St. Francis Medical Center). 14
16 Figure 5. ED Diversion Hours for Participating Hospitals, Los Angeles Region, May August MHSC PIH SFM Project Period (9/07-6/08) May-06 Jun-06 Jul-06 Aug-06 Sep-06 Oct-06 Nov-06 Dec-06 Jan-07 Feb-07 Mar-07 Apr-07 May-07 Jun-07 Jul-07 Aug-07 Sep-07 Oct-07 Nov-07 Dec-07 Jan-08 Feb-08 Mar-08 Apr-08 May-08 Jun-08 Jul-08 Aug-08 Presbyterian Intercommunity Hospital (PIH) PIH is a moderate sized hospital with a fairly busy ED (200 patients seen daily). The institution already had fairly low diversion hours and they believed they were selected to serve as a model for other collaborative participants. PIH staff did not feel the collaborative had a significant impact on their institution s diversion hours which were low already, but they did feel that participation was very useful. As a results of the collaborative, PIH initiated a number of changes to improve patient flow including adopting a new triage process and culture in the ED, implementing an electronic bed request system, and creating a bed capacity alert process. In addition, staff felt there were significant benefits from the networking that occurred with the collaborative, introducing new ideas, such as a physician at triage, that PIH is considering. PIH did note a number of challenges to participating in the collaborative. Similar to other hospitals, data collection was challenging because of the number of different KPIs to be collected, the short time frame in which to report the data, and initial difficulty with the online system. In particular, the specific breakdown of the admission Length of Stay process proved difficult. In addition, at the time of the collaborative, the hospital implemented a new IT system which diverted resources from the collaborative. Methodist Hospital Methodist Hospital in Arcadia is a moderate sized hospital with a high acuity, medium volume ED (110 patients seen daily). Nearly one third of all ED patients are admitted to the hospital at Methodist. Staff believed participation in the collaborative was useful, particularly in highlighting and addressing issues of admission patient flow to others at their institution. 15
17 Participation in the collaborative led directly to the implementation of daily bed meetings and a colorcoded alert system highlighting inpatient bed status. A new bed czar RN was initiated to manage patient flow and make bed assignments; and a 30 minute rule was adopted for time from ED admission decision to inpatient bed. Staff felt that these improvements in the admission process would be sustainable. Other initiatives undertaken with variable success including adding additional triage RN staff, implementing universal ED beds, and attempting to improve inpatient bed turnaround times. Methodist staff noted similar challenges of other hospital participants in terms of data collection and reporting. In particular, because less data were electronic, collection was difficult and required manual processes conducted on a randomized sample of patient charts. In addition, Methodist experienced an increased admission rate which has continued. During the collaborative period, the ED also was hit with a busy flu season resulting in an increase of 20 30% in ED volume during those months. St. Francis Medical Center St. Francis Medical Center had the highest diversion hours of the participating hospitals in the LA EMSA. During the collaborative period, the institution had a dramatic decrease in diversion hours. Interestingly, the staff felt that many of the processes driving toward this improvement were in place or planned before the collaborative started, and that participation did not make any appreciable impact. Administrative staff did feel that participation was useful in terms of networking with other hospitals to see what efforts others were making to improve patient flow and reduce diversion. In particular, the hospital plans on studying the utility of hallway inpatient beds to address admission patient flow in the future. Downey Hospital Unfortunately, Downey Hospital withdrew from participation in the collaborative early on. It is unclear as to the specific reasons for withdrawal, but may have been related to the closure of MLK. 16
18 Inland Counties Region Inland Counties has the second highest diversion hours annually in the State. As noted above, this county had the second largest drop in ambulance diversion hours in the years preceding the CEDDP collaborative (Table 9). Table 9. Inland Counties Region Diversion Hours and Percent Change, Diversion Hours 52,387 37,114 32,661 22,318 19,224 33, Percent Change 29.2% 12.0% 31.7% 13.9% 63.3% For the 9 months of data available during the collaborative (September 2007 June 2008), there was an increase initially in diversion hours, followed by a decrease (Figure 6). This transient increase likely reflects flu seasonal variation with the continued trend during the warmer months. Overall, the changes during 2007 in terms of ambulance diversion continued an ongoing trend in Inland Counties of decreasing diversion over the past several years Figure 6. Total ED Diversion Hours for Participating Hospitals, Inland Counties Region, May August 2008 Project Period (9/07-6/08) May-06 Jun-06 Jul-06 Aug-06 Sep-06 Oct-06 Nov-06 Dec-06 Jan-07 Feb-07 Mar-07 Apr-07 May-07 Jun-07 Jul-07 Aug-07 Sep-07 Oct-07 Nov-07 Dec-07 Jan-08 Feb-08 Mar-08 Apr-08 May-08 Jun-08 Jul-08 Aug-08 17
19 Inland Counties EMS Inland Counties incorporates a three county area which is diverse and tremendous in area and includes basin, high desert and isolated rural areas and mountains. Inland Counties EMSA reported a long history of issues with ambulance diversion and was eager to try to utilize participation in CEDDP to assist with diversion process changes. In fact, three rural area hospitals in the region already have no diversion practices because there is literally nowhere else for ambulances to go. With participation in CEDDP, the EMSA staff saw the project as an opportunity for the hospitals to look at key practices, make change and reassess practices. Their goal was to eliminate diversion. The EMSA chose two major trauma centers in the area, Loma Linda, Arrowhead Regional (County hospital) and also asked St. Mary s Hospital, as representative of high desert, to participate. They reported that they would have included more hospitals, but were limited to 2 or 3 based on the structure of the CEDDP. They report the process was followed closely by community and the County Board of Supervisors and reported to the community oversight committees monthly. One of the biggest benefits of the study as reported by the EMSA included the ability to work with hospitals to think outside the box to improve patient movement within the hospital. Additionally the project enabled the EMSA the ability to make diversion a countywide issue to be addressed and increase the awareness of the problem for hospital administrators. Data collection challenges included that there was no mechanism to collect numbers of actual patients bypassed initially (but was later addressed in the electronic record system). One of the two large agencies reported data for ambulance offload time, but the other did not. There was question as to the reliability and consistency of the off load time data being collected. Ultimately, they reported no significant changes in offload times. The EMSA did not institute new policies as a result of participation in the collaborative and are unlikely to go directly to a no divert policy, but hope to use the data and increased awareness to tighten the current policy and practice. Of note, the EMSA also reported that the neighboring county, Riverside, recently went to a No Divert Policy which has impacted bordering hospitals in Inland Counties. Inland Counties Hospitals In Inland Counties, ambulance diversion varied seasonally, but appeared to follow a general trend toward decreasing diversion over several years and including the CEDDP period (Figure 7). There was a significant drop in diversion for two of the three participating hospitals at the start of the program with a bump in January and February, consisted with flu season, which then came down to even lower levels for the last several months of the program. Of note, the decrease in ambulance diversion was most dramatic for one of the participating hospitals (Loma Linda Medical Center). 18
20 Figure 7. ED Diversion Hours for Participating Hospitals, Inland Counties Region, May August Arrowhead Loma Linda St. Mary Project Period (9/07-6/08) May-06 Jun-06 Jul-06 Aug-06 Sep-06 Oct-06 Nov-06 Dec-06 Jan-07 Feb-07 Mar-07 Apr-07 May-07 Jun-07 Jul-07 Aug-07 Sep-07 Oct-07 Nov-07 Dec-07 Jan-08 Feb-08 Mar-08 Apr-08 May-08 Jun-08 Jul-08 Aug-08 Arrowhead Hospital Because the large majority of admissions are through the ED (89%), the ED in particular, and hospital staff in general were very interested in the collaborative. They saw participation in CEDDP as a chance to bring patient flow issues and the holding of admissions in the ED to attention of hospital administration. They report rollout challenges revolving around buy in. The ED leadership and staff supported the program, but felt that the actual roll out was a bit disorganized, citing lack of definitions, no formal training on how to enter data, and that the website was not up initially. Just as important, staff felt that meetings with hospital leadership were lacking. The ED staff had hoped to get the hospital in alignment on the common goals of improving patient flow, decreasing admission bordering time and in turn, decrease ambulance diversion hours. Ultimately they report that there was no inpatient champion, nor buy in from hospital leadership. The hospital would have preferred on site visits instead of just coaching calls as they felt they really needed a third party to assist with aligning hospital leadership. The calls were reported as productive, but not really shedding any new wisdom. The hospital reported challenges in data collection. They had to acquire data from several different sources, including the ED physician group for physician times, EMS run sheets, inpatient charts; most of which had to be collected manually as there was no electronic system. Admission boarding hours had to be calculated based on admit orders times compared with the time of leaving the ED which had to be collected manually for every admitted patient. They received the offload hours from the ambulance 19
21 provider but staff questioned its accuracy, and did not have a way of easily validating these times. Additionally, they did not collect the number of patients diverted. Though they felt that the program did not change anything internally for their hospital specifically, they thought participation was beneficial for increasing awareness. They report that during the year, they had already initiated their own processes that were in works before CEDDP was initiated, and believe it was these efforts, as opposed to participation in the collaborative, that led to the continuing downward trend in ambulance diversion hours. Loma Linda Medical Center Loma Linda Medical Center had the highest numbers of ambulance diversion hours of the three participating hospitals. It is a level I trauma center and burn center with a large urban indigent population. They report that they utilize hallway beds a day The hospital reports that participation was decided by the CEO and was then handed over to ED staff to complete. The hospital reported challenges with initiation of the program in that many of the data definitions differed between the way the hospital collected these data points compared with what was being requested (i.e. door to disposition was a different time set). Some data were collected electronically and some manually. The requested reporting time frames were challenging as some of the requested data were not available until a few weeks after the end of each month. Though initiated by the CEO, they felt that the hospital leadership while encouraging, did not empower staff to initiate improvements. The hospital felt that the success stories from the website were useful and of high quality. Staff also appreciated the data from other sites and frequently looked to compare themselves to others as a form of friendly competition with Arrowhead Medical Center. The data increased awareness and the ability to change staff behavior in following the diversion policy. They did note that it would have been more helpful if the hospitals participants were more regionalized rather than spread out. One area internally that they report coming from the collaborative was that it gave the hospital the impetus to start a hospital wide Code Capacity process, to increase inpatient service awareness of ED capacity issues to hopefully encourage more rapid discharging of inpatients. This initiative was scheduled to start after the project timeframe. Areas that staff still feel need for improvement include solving ED outflow issue and getting admitted patients upstairs in a more timely manner. Staff also felt that ambulance offload times remain a major problem. St. Mary s Medical Center The evaluation team was unable to contact staff at St. Mary s Medical Center for evaluation purposes. 20
22 Ventura Region In the years prior to the collaborative, Ventura County experienced dramatic increase in the cumulative hours of diversion (53% over 5 years as noted in Table 10). As a result, the EMSA was a more than willing participant in CEDDP. Table 10. Ventura Region Diversion Hours and Percent Change, Diversion Hours 4,819 9,257 9,521 10,836 7,400 2, Percent Change 92.1% 2.9% 13.8% 31.7% 53.6% Figure 8 illustrates ED diversion hours for the Ventura region. Interestingly, just prior to the collaborative, one hospital, St. John s underwent tenting for mold for a 1 month time period. During that time, the EMS agency enforced a no diversion policy for all hospitals. Area hospitals also adopted a number of changes and increased their resources as a part of the planning for St. Johns closure. As a result, hours on diversion significantly declined for that one month (August 2007) and the EMSA reported that the temporary policy was a success. A number of hospitals objected to the idea of continuing the no divert policy and the policy was rescinded once St. Johns was again operational. 1,200 Figure 8. ED Diversion Hours for Participating Hospitals, Ventura Region, May August 2008 Project Period (9/07-6/08) 1, May-06 Jun-06 Jul-06 Aug-06 Sep-06 Oct-06 Nov-06 Dec-06 Jan-07 Feb-07 Mar-07 Apr-07 May-07 Jun-07 Jul-07 Aug-07 Sep-07 Oct-07 Nov-07 Dec-07 Jan-08 Feb-08 Mar-08 Apr-08 May-08 Jun-08 Jul-08 Aug-08 21
23 Ventura County EMS Ventura County EMS staff believed participation in the CEDDP collaborative was valuable from a number of standpoints. First, the collaborative provided the impetus for collecting hard data on ED ambulance diversion and hospital patient flow. The EMS director felt this was particularly important in basing decisions on more comprehensive data rather than anecdote. Second, CEDDP forced collaboration between the EMSA, EMS providers and hospitals to not only collect data, but review patient care flow processes. As a result, regular monthly meetings have been instituted, incorporating both administrative and front line ED leadership. The main challenges for the EMSA were in getting hospitals to participate and in collecting data. The agency had some difficulty in convincing the 3 rd and 4 th hospitals to participate in the program. Data collection was difficult because of the number of different dispatch centers (3) and EMS agency providers. As a result, the definition and reporting of off service In addition, while the EMSA utilizes a READINET and CAD system for data collection, there was no universal system for tracking and collecting hospitals times. In fact, the EMSA questioned the validity of some of the hospital data points collected as EMS and hospital data often differed as to diversion time and number of patients diverted. Finally, EMSA noted that while diversion hours decreased over the project year, numbers of patients diverted actually increased. The EMSA believes participation in the collaborative, along with the 1 month no diversion trial as a result of temporary closure of one hospital, has laid a foundation upon which a no diversion policy may be implemented in the future. However, they acknowledge that such a policy is fraught with political ramifications and that the administrative leadership of a number of hospitals would be opposed to such a policy. Ultimately, the issue of ED diversion may be better addressed at the level of a regional hospital association opposed to the local EMSA. Ventura County Hospitals While seasonal variation in diversion hours occurred for the hospitals similar to the EMS aggregate data, the decrease in diversion in August 2007 as a result of the temporary closure of St. Johns just prior to the start of the collaborative is remarkable (Figure 9). As noted above, anticipation and preparation of this closure led to surge capacity planning for the EMSA and local area hospitals, as well as implementation of a no diversion policy during the time period of the closure. Hospital increased resources, staffing and space to address the anticipated increase in patient loads. However, these efforts were not sustained and as such, once the policy was lifted, diversion hours dramatically rose in concert with expected seasonal increases, followed by a decrease over the latter half of the collaborative project time frame. 22
24 Figure 9. ED Diversion Hours for Participating Hospitals, Ventura Region, May August 2008 Community Simi St. John's Ventura County MC Project Period (9/07-6/08) May-06 Jun-06 Jul-06 Aug-06 Sep-06 Oct-06 Nov-06 Dec-06 Jan-07 Feb-07 Mar-07 Apr-07 May-07 Jun-07 Jul-07 Aug-07 Sep-07 Oct-07 Nov-07 Dec-07 Jan-08 Feb-08 Mar-08 Apr-08 May-08 Jun-08 Jul-08 Aug-08 Community Memorial Hospital Community Memorial Hospital had generally low diversion hours at baseline and were more interested in improving their patient flow and admission process with participation in the collaborative. The staff had an ED throughput project in place for a number of years prior to the collaborative and continued these processes during the project timeframe. At the start of the project, ED staff felt the collaborative had done an excellent job of getting the buy in from administrative leadership, particularly the Chief Nursing Officer (CNO), but that this momentum waned over time due to personnel changes and lack of engagement between the collaborative staff and the CEO and COO of the hospital. In terms of data collection, hospital staff faced similar challenges that of other hospitals. In particular, staff felt that the bimonthly or 2 week reports were too frequent and redundant, requiring resources and time from staff that could be spent elsewhere moving the project forward. The staff appreciated the guidance from the Abaris staff, but felt that the collaborative could have been more useful in terms of maintaining leadership buy in to initiate and move changes forward. The staff felt that the collaborative was useful in exposing them to other ideas to improve patient flow. In particular, the idea of hallway inpatient beds was particularly noteworthy. In addition, they intend to implement some of the changes highlighted by others including fax reporting and holding orders. In general, however, Community Memorial staff felt that the planning and implementation of measures to prepare for the temporary closure of St. Johns proved to be more useful than the collaborative in terms of improving ED patient flow and providing support for a no diversion policy implementation. Ventura County Medical Center Ventura County Medical Center s diversion hours have waxed and waned relative to overall ED census over the past few years according to staff. Participation in the collaborative was useful in gaining 23
25 support for a number of initiatives which had proposed previously. Specifically, staff were able to initiate a standard page to all MDs to discharge patients whenever hospital capacity was reached. These calls also went to the Medical Directors to facilitate disposition of patients. Other efforts included measures to improve flow of patients from the waiting room to open ED beds. However, ED RN staff, citing the State s current Nurse Patient Ratio law, resisted this measure and it did not result in any measurable success. Other measures included the requirement that the CNO be contacted before going on diversion which resulted in blocking diversion 75% of the time according to staff. Ventura County Medical Center encountered significant obstacles to the data collection. Because data were not electronic, all data were manually collected. In addition, the staff felt that some of the suggestions from the Abaris staff were unrealistic and did not take into account the underlying conditions at the facility. Overall, however, it was felt that participation in the collaborative allowed staff to measure and highlight the diversion and crowding problem, and to see that a no diversion policy may not be completely out of reach. Simi Valley Hospital Simi Valley Hospital experienced a change in project champions midway through the collaborative. As a result, their impression of the results of the institution s participation was mixed. Staff did implement a number of initiatives during the project year including triage bypass, bedside registration, and a monthly ED working group focused on patient flow issues. Efforts were conservative by their own admission, in order to insure sustainability over the long term. Data collection remains a challenge for staff. In fact, not all data elements were collected by the end of the project period. Staff felt that too many data elements with too great a frequency were required by the collaborative. While not all data elements were felt to be related to improving diversion hours, staff did indicate that the KPIs were useful in assessing overall ED performance. St. John s Regional Medical Center As noted above, St. John s Regional Medical Center experienced a temporary closure just prior to the collaborative. Following this closure, diversion hours increased remarkable in concert with seasonal increases, then decreased over the collaborative period. Similar to Simi Valley Hospital, St. John s experienced a change in staffing midway through the project time period. Efforts to improve patient flow over this time period focused the initiation of a rapid care fast track, staffing triage with a nurse practitioner, and faxed reporting for admitted patients; all of which staff felt had a measurable impact on patient flow parameters. In terms of challenges, St. John s data collection was completely manual and relied on review of paper charts and logs, including ambulance times. As a result, data collection was time and resource intensive. In terms of the Abaris coaching, staff felt that too much focus was placed on the data collection and the mechanics of the project, rather than directly addressing the diversion and patient flow issues. Ultimately, while staff felt that a no diversion policy was a good idea, they believed that implementation would not be successful unless their hospital s patient flow processes were addressed first. 24
26 Santa Clara Region Unlike statewide trends, diversion in hours in Santa Clara County increased over the 2003 to 2007 time period. This trend was notable for a marked increase in diversion hours in 2004 following the closure of San Jose Medical Center (Table 11). Participation in CEDDP was felt to be an opportunity to bring the issue to light to the community at large. Table 11. Santa Clara Region Diversion Hours and Percent Change, Diversion Hours 2,084 3,077 2,638 2,546 2, Percent Change 47.6% 14.3% 3.5% 2.1% 24.8% For the 9 months of data available during the collaborative (September 2007 June 2008), there was a transient increase in diversion hours, likely related to seasonal changes, followed by a decrease (Figure 10). Overall, the changes during 2007 at the only participating hospital, Regional Medical Center, followed a similar trend to the rest of Santa Clara County. 35 Figure 10. ED Diversion Hours for Participating Hospitals, Santa Clara (RMC-SJ), May August Project Period (9/07-6/08) Jan-06 Feb-06 Mar-06 Apr-06 May-06 Jun-06 Jul-06 Aug-06 Sep-06 Oct-06 Nov-06 Dec-06 Jan-07 Feb-07 Mar-07 Apr-07 May-07 Jun-07 Jul-07 Aug-07 Sep-07 Oct-07 Nov-07 Dec-07 Jan-08 Feb-08 Mar-08 Apr-08 May-08 Jun-08 Jul-08 Aug-08 25
27 Santa Clara County EMS Santa Clara County runs 95,000 EMS calls a year for a population of 2 million persons. In 2004, San Jose Medical Center closed with a notable increase in ambulance diversion as described above. As a result, the EMSA conducted an impact report was done from an EMS perspective to assess flow of patients to the remaining hospitals. In 2005, the diversion policy was revised to tighten it up. The EMSA wanted to participate because of the impact of SJMC closure had on ambulance diversion and they saw this as an opportunity to bring the issue to the higher levels in the hospitals. The EMSA reported that the biggest issues they had with the program were that the ongoing requirements were more than what they were expecting. Initially Stanford, Santa Clara Valley Medical Center and Regional Medical Center planned to participate in the collaborative. The biggest issues the participants had with the collaborative were that they felt the data collection and reporting were much more time and resource intensive that originally anticipated. They were under the impression that they would be using previously collected data, but as the program moved forward, they felt additional new requirements were being added including new and different data elements to be collected. The EMSA was also hoping the collaborative would lead to more interaction with hospital administration to align efforts to address diversion, but report that only a single meeting was held with participating hospital leaders. Finally, there was a cost to participate in the program by the EMSA and hospitals and they believe there was to be reimbursement including funding for travel and participation in summits, but in the end report that that ultimately, no funding was forthcoming. Given the challenges, in the end, only one hospital submitted data to the EMSA, Regional Medical Center In summary, they felt positive about the community oversight committee that was initiated, which was a good start, but ultimately the overall program was not what Santa Clara needed as it was too resource intensive and costly according to EMSA staff. 26
28 Summary of Ambulance Diversion Mitigation Practices & ED Capacity Initiatives During the collaborative, both EMSAs and hospital initiated multiple strategies and mitigation efforts to address ambulance diversion and ED capacity. Although this list is not exhaustive, nor necessarily identified as best practices, they were noted by participants as real efforts implemented during the project year. In general, while the details of these initiatives were often specific to their institutions, the conceptual underpinnings of most are largely exportable to other settings. Ambulance Diversion Mitigation Initiatives Most EMSAs have established diversion policies. These measures vary from limiting the amount of time a hospital can go on diversion (ie. 60 minutes), to requiring a certain time for a given hospital to be completely off diversion (ie. 15 minutes) when coming off a diversion period. These types of policies have been implemented with a dramatic effect in Los Angeles County as well as San Diego County. 10 Participants of the collaborative often expressed the desire to tighten up their existing diversion policies, but noted some resistance from hospitals as well as EMS providers. In addition, most EMSAs felt that the sustainability of these measures depended on the resources to audit and track hospital compliance, as well as the ability to enforce such measures. The use of electronic real time tracking of EMS data has been utilized to good effect to address these issues by some EMSAs. A number of EMSAs expressed a desire to move to a true No Diversion policy in the future. Indeed, there appeared to be a shift in the openness of ED and hospital staffs who participated in the collaborative to such a No Diversion idea. Many staff felt that participation in the collaborative along with reviewing their own institution s data indicated to them that diversion itself was no solution to the ED crowding problem. However, staff also expressed that there were political dynamics and resistance from their own hospital leadership that must be overcome prior to any real movement to no diversion. Moreover, such a policy would likely be sustainable only if other area hospitals also agreed to a no diversion policy such that no institution would bear the brunt of a potential large influx of ambulance patients by itself. These issues go across regional boundaries as evidenced by Inland Counties EMSA staff concerns regarding the adoption of a no diversion policy by neighboring Riverside County. In addition, the impact of no diversion policies and hospital diversion decisions on ambulance off load times remains to be determined as participants reported, when tracked, significant variability in these times. ED Capacity Initiatives Asplin et al. have propose a conceptual model of ED patient flow three interdependent components providing an operations management framework for understanding the causes of and potential solutions to overcrowding. 11 These components are Input (ambulatory patient and ambulance arrivals to the ED); Throughput (patient length of stay in the ED including wait time, placement, evaluation and care time); and Output (patient disposition including admission, transfer, and discharge). During the 27
29 collaborative year, participants implemented or planned a number of initiatives targeting improvements in flow in each of these three components. In general, none of the projects implemented by the hospitals were particularly innovative as most focused on well established initiatives previously reported in the literature (unlike the Urgent Matters program which highlighted a number of ED flow innovations). However, the collaborative did provide many hospitals the impetus with which to implement these practices during the year. It is also important to remember, that while ED capacity overall plays an important role in diversion decisions, the impact of each of these measures on mitigating ambulance diversion has yet to be determined. Input Initiatives A number of hospital participants implemented efforts to speed the entry of patients into the ED for care. Many efforts focused on eliminating the sequential queuing that occurs upon patient arrival to the ED including process steps of sign in, registration, triage, and waiting for open ED bed. Bedside registration was implemented to eliminate waits for registration on patient arrival. This initiative is likely exportable and sustainable, provided adequate resources including staff are available, and in fact may be enhanced by informatics resources such as wireless capabilities. Other efforts included increased staffing at triage with RNs and nurse practitioners to more rapidly triage patients, as well as the potential to initiate actual evaluation and care at the patient entry point. Again, these measures are likely sustainable and exportability provided resources such as staff and space are in fact available. One input initiative that met with mixed success were efforts to facility triage to bed patient movement. These efforts focused on moving patients directly from triage to an ED bed for evaluation. At one institution, resistance came from RN staff who cited California state nurse ratio laws that limited the number of patients who could be placed in ED beds at any one time. Ironically, while this law was designed to improve patient safety, its unclear how having patients stay in crowded waiting rooms rather than be placed in open ED beds improves patient safety in the long run. Throughput Initiatives Initiatives to improve patient care times in the ED included on surge capacity planning with expanded resources and staff (such as occurred in Ventura County in preparation for the closure of St. Johns) to meet the needs of an anticipated increased inflow of patients. These efforts could potentially be sustained and exportable provided resources are available, but as was demonstrated with the St. Johns planning, no effort was made to continue the surge effort once that hospital reopened. Another initiative implemented was the creation of an urgent care or fast track to expedite low acuity patients through the ED. These measures have proven to be successful in improving ED care times for select patients provided space and resources are made available. However, the actual impact of fast track on ambulance diversion remains unknown. 28
30 Output Initiatives A major focus of all hospital participants of the collaborative was improving inpatient flow to reduce ED boarding of admitted patients, recognized as a major component of ED crowding and, by inference, ambulance diversion. 12 Efforts of the collaborative essentially targeted improving overall hospital inpatient bed management and expediting patient flow from the ED to inpatient beds. Bed management initiatives included the creation of a bed czar(ina) or flow master in the hospital to manage and direct inpatient admissions and discharges; establishing bed huddles of ED and inpatient RN staff so that information and communication regarding inpatient bed availability and needs could be matched in real time; and the adoption of informatics tools and electronic bed tracking systems so that again needs and availabilities could be matched. Essentially these measures address a universal problem for many hospitals which is the lack of accessible, real time information regarding inpatient bed needs and availabilities, as well as a single decision making authority to assign beds appropriately. Efforts to expedite patient flow from the ED focused on process improvements to remove potential obstacles including the adoption of holding orders (for use when physicians were delayed in writing inpatient orders), and faxing of nurse reports (for use when inpatient nurses were not available to take a telephone report). In addition, use of hallway beds on inpatient floors as has been done at other institutions was considered by a number of collaborative partners, but was felt to be problematic to implement due to regulatory concerns. Evaluation Limitations Limitations of the objective evaluation are predicated on the limitations of the original CEDDP work, as the data evaluated quantitatively were obtained from this report. The CEDDP statewide data were obtained from EMSAs when available and then supplemented with OSHPD data when not available. There were several regions where data were not available from either source, thus limiting the data comprehensiveness and evaluation. Obviously, data are as useful as the reliability and accuracy with which they were collected and reported. Certain KPIs were not defined nor collected in the same manner (i.e. ambulance offload times) and thus impact any subsequent analysis and resulting interpretation. In addition, the evaluation of statewide data was limited by time period. As noted above, diversion hours were trending downward statewide prior to the start of the collaborative. While it appears this trend continued, if not accelerated, during the collaborative year, no data were available to assess the whether the trend continued beyond just the few months after the collaborative ended. To fully assess the impact of the collaborative would require data for 2009 to adjust for seasonal fluctuations, as well as to assess the sustainability of any long term improvements. Evaluation of the overall impact on ambulance diversion were limited region by region in that the predetermined plan of the collaborative was to work with 3 4 hospitals in a region and evaluate four regions, rather than focus on a couple of regions and the geographically associated hospitals. There 29
31 were several areas in which hospitals were spread out and participating hospitals were being impacted by non participating hospitals. In certain participating regions, there were unexpected events (i.e. mold tenting at one hospital) that, although part of doing EMS business, has an impact on patient flow and the data being collected. There were potential limits to the administered survey tool and on site evaluations in that, although most hospitals and EMS Agencies seemed to answer candidly and openly, there may have been some comments limited out of political concerns. Additionally, although representatives from all EMSAs and the majority or participating hospitals responded to our inquiries, some did not. Although their participation would have added to this evaluation report, it is unlikely that they would have changed its content dramatically. Their non participation was likely based on time availability and other commitments and less on their satisfaction with the project. 30
32 REFERENCES 1. Brennan JA, Allin DM, Calkins AM, Enguidanos ER, Heimbach LJ, Pruden JN Sr, Stilley DG. Guidelines for ambulance diversion. American College of Emergency Physicians. Ann Emerg Med. 2000;36(4): Glushak C, Delbridge TR, Garrison HG. Ambulance diversion. Standards and Clinical Practices Committee, National Association of EMS Physicians. Prehosp Emerg Care. 1997;1(2): Asplin BR. Does ambulance diversion matter? Ann Emerg Med. 2003;41(4): NBC News. F.D. Ambulances Turned Away From 16 Chicago Hospitals. February Available online at 5. Schull MJ, Morrison LJ, Vermeulen M, Redelmeier DA. Emergency department gridlock and out ofhospital delays for cardiac patients. Acad Emerg Med. 2003;10(7): Schull MJ, Morrison LJ, Vermeulen M, Redelmeier DA. Emergency department overcrowding and ambulance transport delays for patients with chest pain. CMAJ. 2003;168(3): Begley CE, Chang Y, Wood RC, Weltge A. Emergency department diversion and trauma mortality: evidence from Houston, Texas. J Trauma. 2004;57(6): Henderson SO. Academic Productivity in Emergency Medicine. Journal of Emergency Medicine 2001;21(1): Vilke GM, Brown L, Skogland P, Simmons C, Guss DA: Approach to decreasing emergency department ambulance diversion hours. J Emerg Med 2004;26(2): Vilke, GM, Castillo EM, Metz MA, Upledger Ray L, Murrin PA, Lev R, Chan TC. Community trial to decrease ambulance diversion hours: the San Diego County patient destination trial. Ann Emerg Med 2004; 44(4): Asplin BR, Magid DJ, Rhodes KV, Solberg LI, Lurie N, Carmargo CA: A conceptual model of emergency department crowding. Ann Emerg Med 2003;42: General Accounting Office. Hospital Emergency Departments: Crowded Conditions Vary among Hospitals and Communities. Washington, DC: General Accounting Office;
33 Appendix A: Summit Survey Tool 32
34 33
35 34
36 35
Survey of Nurse Employers in California
 Survey of Nurse Employers in California Spring 2012 July 23, 2012 Prepared by: Tim Bates, MPP Dennis Keane, MPH Joanne Spetz, PhD University of California, San Francisco 3333 California Street, Suite 265
Countywide Emergency Department Ambulance Patient Transfer of Care Report Performance Report
 Countywide Emergency Department 9-1-1 Ambulance Patient Transfer of Care Report Performance Report Prepared by: Contra Costa Emergency Medical Services Visit us at www.cccems.org 2/11/2016 Contra Costa
Countywide Emergency Department Ambulance Patient Transfer of Care Report Performance Report
 Countywide Emergency Department 9-1-1 Ambulance Patient Transfer of Care Report Performance Report Prepared by: Contra Costa Emergency Medical Services Visit us at www.cccems.org 2/28/2017 Patient Transfer
The PES Crisis Stabilization and Evaluation for All
 The PES Crisis Stabilization and Evaluation for All Regional Dedicated Psychiatric Emergency Services (PES) Dedicated Psychiatric/Substance Use Disorder Emergency Department Too often, individuals with
Project Report Health Information Exchange Readiness Assessment/Survey
 Prepared for California Emergency Medical Services Authority Project Report Health Information Exchange Readiness Assessment/Survey RFO#: EMS-1324 Submission Date: December 13, 2013 Submitted by: Lumetra
wall time collaborative
 wall time collaborative a partnership to reduce ambulance patient off-load delays The 8 th Annual Behavioral Health Care Symposium December 9, 2013 wall time collaborative a partnership to reduce ambulance
SACRAMENTO COUNTY: DATA NOTEBOOK 2014 MENTAL HEALTH BOARDS AND COMMISSIONS FOR CALIFORNIA
 SACRAMENTO COUNTY: DATA NOTEBOOK 2014 FOR CALIFORNIA MENTAL HEALTH BOARDS AND COMMISSIONS Prepared by California Mental Health Planning Council, in collaboration with: California Association of Mental
Emergency Department Throughput
 Emergency Department Throughput Patient Safety Quality Improvement Patient Experience Affordability Hoag Memorial Hospital Presbyterian One Hoag Drive Newport Beach, CA 92663 www.hoag.org Program Managers:
REASSESSING THE BED COORDINATOR S ROLE SHADY GROVE ADVENTIST HOSPITAL
 Publication Year: 2008 REASSESSING THE BED COORDINATOR S ROLE SHADY GROVE ADVENTIST HOSPITAL Summary: Creation of Bed Coordinator position to improve patient flow throughout the entire hospital Hospital:
Northern California Environmental Grassroots Fund Statistical Evaluation of the Past Year January December 2015
 Statistical Evaluation of the Past Year January December 2015 # Applied # Funded % Funded Total Applications/Grants Awarded 100 60 60% Grant Cycle Spring 2015 $53,500 21 14 67% Summer 2015 $45,500 17 12
PATIENT CARE SERVICES REPORT Submitted to the Joint Conference Committee, August 2016
 Report Contents: PATIENT CARE SERVICES REPORT Submitted to the Joint Conference Committee, August By: Terry Dentoni, MSN, RN, CNL, SFGH Chief Nursing Officer 1. Professional Nursing..1 2. Emergency Department
CA Duals Demonstration: Bringing Coordination to a Fragmented System
 CA Duals Demonstration: Bringing Coordination to a Fragmented System Martha Smith Health Net s Chief Dual Eligible Program Officer Integrated Healthcare Association & California Association of Physician
Appendix 11 CCS Physician Survey Tool. CCS Provider Survey
 CCS Provider Survey Q58 The California Children s Services program (otherwise known as CCS), is an important program serving some of our state s most vulnerable children. Federal requirements stipulate
North Central Sectional Council. What is it?
 North Central Sectional Council What is it? The Real Question Why should I get up at 5am on a Saturday morning Drive two hours each way for another meeting (as if I don t already have enough of these)
Community Leadership Project Request for Proposals August 31, 2012
 Community Leadership Project Request for Proposals August 31, 2012 We are pleased to invite proposals for a second phase of the Community Leadership Project, a funding partnership between the Packard,
CDC s Maternity Practices in Infant and Care (mpinc) Survey. Using mpinc Data to Support
 Survey. Using mpinc Data to Support") CDC s Maternity Practices in Infant and Care (mpinc) Survey Nutrition Efforts in California Hospitals Carina Saraiva, MPH Research Scientist California Department of Public Health, Center for Family Health
CDC s Maternity Practices in Infant and Care (mpinc) Survey Nutrition Efforts in California Hospitals Carina Saraiva, MPH Research Scientist California Department of Public Health, Center for Family Health
UC MERCED. Sep-2017 Report. Economic Impact in the San Joaquin Valley and State (from the period of July 2000 through August 2017 cumulative)
") UC MERCED Economic Impact in the Valley and State (from the period of July 2000 through August 2017 cumulative) Update # 57 9/27/2017 Sep-2017 Report UC Merced employees as of August 2017 totals 3587 (includes
UC MERCED Economic Impact in the Valley and State (from the period of July 2000 through August 2017 cumulative) Update # 57 9/27/2017 Sep-2017 Report UC Merced employees as of August 2017 totals 3587 (includes
CALIFORNIA S URBAN CRIME INCREASE IN 2012: IS REALIGNMENT TO BLAME?
 CALIFORNIA S URBAN CRIME INCREASE IN 2012: IS REALIGNMENT TO BLAME? Introduction By Mike Males, Ph.D., Senior Research Fellow Lizzie Buchen, M.S., Post-Graduate Fellow For nearly two decades, California
Outreach & Sales Division Business Development Unit Introduction to the Outreach & Sales Division Field Team Webinar
 Outreach & Sales Division Business Development Unit Introduction to the Outreach & Sales Division Field Team Webinar Tuesday, August 18, 2015 11am to 12noon Webinar Housekeeping Webinar link: http://hbex.coveredca.com/stakeholders/webinar/
Beau Hennemann IHSS Program Manager
 Beau Hennemann IHSS Program Manager Consumer, Family and Caregiver Forum February 1, 2013 L.A. Care is the nation s largest public health plan, with more than 1 million members. L.A. Care is governed by
Equipping California Investors for Tomorrow s Challenges
 Equipping California Investors for Tomorrow s Challenges Headline Roundup Real estate news Law changes Foreclosures Builder news Realtor news Mortgage news Radio Show Leslie Appleton-Young, CAR Frank Nothalf,
Survey of Nurse Employers in California, Fall 2016
 UCSF Health Workforce Research Center on Long-Term Care Research Report Survey of Nurse Employers in California, Fall 2016 Prepared by: Lela Chu, BA Joanne Spetz, PhD Tim Bates, MPP July 13, 2017 This
SECTION 7. The Changing Health Care Marketplace
 SECTION 7 The Changing Health Care Marketplace This section provides an overview of the health care markets in and the, including data on HMO enrollment, trends and information about hospitals and nursing
Case Study: Cass Regional Medical Center
 Case Study: Cass Regional Medical Center CASS REGIONAL MEDICAL CENTER, A COUNTY HOSPITAL SERVING BOTH SUBURBAN AND RURAL COMMUNITIES, PURCHASED A NEW NURSE CALL PLATFORM TO SUPPORT THEIR GOALS TO IMPROVE
2018 LEAD PROGRAM PACKET INSTRUCTIONS
 2018 LEAD PROGRAM PACKET INSTRUCTIONS In this packet you will find all the trainings and signature forms required to participate in AGA's lead program. Please follow the instructions below: Complete Lead
Medi-Cal Managed Care Time and Distance Standards for Providers
 California s protection & advocacy system Medi-Cal Managed Care Time and Distance Standards for Providers May 2018, Pub. #5610.01 Medi-Cal Managed Care Time and Distance Standards for Providers To ensure
Executive Summary MEDICARE FEE-FOR-SERVICE (FFS) HOSPITAL READMISSIONS: QUARTER 4 (Q4) 2012 Q STATE OF CALIFORNIA
 HOSPITAL READMISSIONS: QUARTER 4 (Q4) 2012 Q STATE OF CALIFORNIA") MEDICARE FEE-FOR-SERVICE (FFS) HOSPITAL READMISSIONS: QUARTER 4 (Q4) 2012 Q3 2013 Executive Summary STATE OF CALIFORNIA The Centers for Medicare & Medicaid Services (CMS) has tasked Health Services Advisory
MEDICARE FEE-FOR-SERVICE (FFS) HOSPITAL READMISSIONS: QUARTER 4 (Q4) 2012 Q3 2013 Executive Summary STATE OF CALIFORNIA The Centers for Medicare & Medicaid Services (CMS) has tasked Health Services Advisory
- WELCOME TO THE NETWORK-
 - WELCOME TO THE NETWORK- Green Business and RMDZ Green Business Program Basics: Incentive based program Recognizes and promotes environmental leaders, best Green Business practices Provides education
COMPARING FULL SERVICE CALIFORNIA HMO ENROLLMENT FOR MARCH 31, 2014 AND MARCH 31, 2015 (see Notes, pg 8)
") COMPARING FULL SERVICE CALIFORNIA HMO ENROLLMENT FOR MARCH 31, 2014 AND MARCH 31, 2015 (see Notes, pg 8) ALL HMO PRODUCT LINES ENROLLMENT HMO Plans 2014 HMO Plans 2015 Difference Percent Chg Commercial
COMPARING FULL SERVICE CALIFORNIA HMO ENROLLMENT FOR MARCH 31, 2014 AND MARCH 31, 2015 (see Notes, pg 8) ALL HMO PRODUCT LINES ENROLLMENT HMO Plans 2014 HMO Plans 2015 Difference Percent Chg Commercial
Improving Pain Center Processes utilizing a Lean Team Approach
 Improving Pain Center Processes utilizing a Lean Team Approach Organization Name: St. Joseph Medical Center Type: Acute Care Hospital Contact Person: Sue Mitchell Title: Nurse Mgr Pain Mgmt Center E-Mail:
California Directors of Public Health Nursing Strategic Plan FY
 California Directors of Public Health Nursing Strategic Plan FY 2014-2016 Last updated: September 28, 2016 Last Updated: 3/4/2015 Page 2 of 24 Table of Contents Letter from the 2014-2015 DPHN Executive
APPLICATION MUST BE COMPLETED TO BE CONSIDERED FOR MEMBERSHIP. Agency Name: Mailing Address: City, State, Zip: Phone Number: Fax: Website:
 I. COMPANY INFORMATION New Member Provider Membership Application California Association for Health Services at Home 3780 Rosin Court, Ste. 190, Sacramento, CA 95834 Phone: (916) 641-5795 Fax: (916) 641-5881
Medi-Cal Funded Induced Abortions 1997
 Golden Gate University School of Law GGU Law Digital Commons California Agencies California Documents 3-1999 Medi-Cal Funded Induced Abortions 1997 Department of Health Services Follow this and additional
Executive Summary November 2008
 November 2008 Purpose of the Study This study analyzes short-term risks and provides recommendations on longer-term policy opportunities for the Marin County healthcare delivery system in general as well
Silver Plan 100%-150% FPL. Member Cost Share. Member Cost Share. Member Cost Share. Deductible Applies. Deductible Applies. Deductible Applies
 A California Health Benefit Exchange QHP Certification Application for Plan ear 2018 Attachment B Standard Benefit Plan Design Deviation Indicate requests for deviations from the 2018 Standard Benefit
Medi-Cal Eligibility: History, ACA Changes and Challenges
 Medi-Cal Eligibility: History, ACA Changes and Challenges PRESENTATION TO CAHP SEMINAR CATHY SENDERLING-MCDONALD, CWDA FEBRUARY 26, 2015 1 Presentation Overview What is CWDA? Medi-Cal Eligibility Overview
Identifying Errors: A Case for Medication Reconciliation Technicians
 Organization: Solution Title: Calvert Memorial Hospital Identifying Errors: A Case for Medication Reconciliation Technicians Program/Project Description and Goals: What was the problem to be solved? To
SAN JOSE ; Memorandum CAPITAL OF SILICON VALLEY
 PSFSS COMMITTEE: 03/17/J6 ITEM: (d) 1 CITY OF & 2 SAN JOSE ; Memorandum CAPITAL OF SILICON VALLEY TO: PUBLIC SAFETY, FINANCE, AND STRATEGIC SUPPORT COMMITTEE FROM: Curtis P. Jacobson SUBJECT: FIRE DEPARTMENT
Whole Person Care Pilots & the Health Home Program
 Whole Person Care Pilots & the Health Home Program Molly Brassil, MSW Director of Behavioral Health Integration, Harbage Consulting December 13, 2016 Presentation Overview Delivery System Reform in California
Survey of Nurse Employers in California
 Survey of Nurse Employers in California Fall 2012 April 10, 2013 Prepared by: Tim Bates, MPP Lela Chu, BS Dennis Keane, MPH Joanne Spetz, PhD University of California, San Francisco 3333 California Street,
Cindy Cameron Senior Director of Finance & Reimbursement LightBridge Hospice, LLC
 Cindy Cameron Senior Director of Finance & Reimbursement LightBridge Hospice, LLC Kristina Runnels Director Patient Financial Services VITAS Healthcare Corp Medi-Cal Managed Care Program The 3 models of
Table of Contents. Table of Contents
 Table of Contents Table of Contents Table of Contents... 1 Acknowledgements... 4 Definitions and Abbreviations... 5 Executive Summary... 6 1.0 Background Information... 8 Introduction... 8 Overview of
PATIENT CARE SERVICES REPORT Submitted to the Joint Conference Committee, November 2017
 Report Contents: PATIENT CARE SERVICES REPORT Submitted to the Joint Conference Committee, November By: Terry Dentoni, MSN, RN, CNL - ZSFG Chief Nursing Officer 1. Professional Nursing.....1 2. Emergency
2017 CALWORKS TRAINING ACADEMY
 2017 CALWORKS TRAINING ACADEMY What is CalFresh E&T? Program Funding Program Partnerships CalFresh E&T Components CalFresh E&T Reporting Q&A The Supplemental Nutritional Assistance Program (SNAP) E&T has
Results from Contra Costa Regional Medical Center
 Results from Contra Costa Regional Medical Center Karin Stryker, MBA DSRIP Manager, Health Services Administrator Chris Farnitano, MD Medical Director, Ambulatory Care High Impact Interventions Sepsis
Project Update. February 2018
 Project Update February 2018 CWDS / Child Welfare Digital Services Digital Services & Support CWDS Web (Development) CWDS Technology Platform (Development) CWDS Infrastructure (Development) Digital Services
Medi-Cal Matters. July 2017 Updated September 2017
 Medi-Cal Matters July 2017 Updated September 2017 Medi-Cal Matters to California This publication is a snapshot of many of the benefits Medi-Cal (California s Medicaid program) provides to Californians.
NHS performance statistics
 NHS performance statistics Published: 14 th December 217 Geography: England Official Statistics This monthly release aims to provide users with an overview of NHS performance statistics in key areas. Official
California s Current Section 1115 Waiver & Its Impact on the Public Hospital Safety Net
 February 2010 California s Current Section 1115 Waiver & Its Impact on the Public Hospital Safety Net Executive Summary The current Section 1115 Medicaid waiver, which was intended to stabilize California
Introduction. Summary of Approved WPC Pilots
 The California Whole Person Care Pilot Program: County Partnerships to Improve the Health of Medi-Cal Beneficiaries Prepared by Lucy Pagel, Tanya Schwartz and Jennifer Ryan with support from The California
SEEK NZ Employment Indicators, May Commentary
 SEEK NZ Employment Indicators, May 12 Commentary In May 12 the number of new job ads registered with SEEK (seasonally adjusted) rose by 3.8%, to be 3.9% higher than three months earlier and 6.4% higher
% Pass. % Pass. # Taken. Allan Hancock College 40 80% 35 80% % % %
 NCLEX Rates The table below is categorized by academic year (e.g., July 1st - June 30th) and reflects the results of all graduates who have taken the NCLEX examination for the first time within the last
Evaluation of NHS111 pilot sites. Second Interim Report
 Evaluation of NHS111 pilot sites Second Interim Report Janette Turner Claire Ginn Emma Knowles Alicia O Cathain Craig Irwin Lindsey Blank Joanne Coster October 2011 This is an independent report commissioned
Advancing Accountability for Improving HCAHPS at Ingalls
 iround for Patient Experience Advancing Accountability for Improving HCAHPS at Ingalls A Case Study Webconference 2 Managing your audio Use Telephone If you select the use telephone option please dial
NHS performance statistics
 NHS performance statistics Published: 8 th February 218 Geography: England Official Statistics This monthly release aims to provide users with an overview of NHS performance statistics in key areas. Official
Community paramedicine (CP) seeks to improve
 seeks to improve") Overview Community paramedicine (CP) seeks to improve the effectiveness and efficiency of health care delivery by partnering specially trained paramedics with other health care providers to meet local
Overview Community paramedicine (CP) seeks to improve the effectiveness and efficiency of health care delivery by partnering specially trained paramedics with other health care providers to meet local
Project Update. March 2018
 Project Update March 2018 CWDS / Child Welfare Digital Services Digital Services & Support CWDS Web (Development) CWDS Technology Platform (Development) CWDS Infrastructure (Development) Digital Services
CAUTI Reduction A Clinton Memorial Presentation
 CAUTI Reduction 2016 A Clinton Memorial Presentation Clinton Memorial Statistics Rurally situated in a primarily agricultural community with a population of 42,000 The hospital is licensed for 165 beds
California's Primary Care Workforce: Forecasted Supply, Demand, and Pipeline of Trainees,
 Research Report California's Primary Care Workforce: Forecasted Supply, Demand, and Pipeline of Trainees, 2016-2030 by Joanne Spetz, Janet Coffman, and Igor Geyn, Healthforce Center at UCSF August 15,
California Community Clinics
 California Community Clinics A Financial and Operational Profile, 2008 2011 Prepared by Sponsored by Blue Shield of California Foundation and The California HealthCare Foundation TABLE OF CONTENTS Introduction
Forecasts of the Registered Nurse Workforce in California. June 7, 2005
 Forecasts of the Registered Nurse Workforce in California June 7, 2005 Conducted for the California Board of Registered Nursing Joanne Spetz, PhD Wendy Dyer, MS Center for California Health Workforce Studies
community clinic case studies professional development
 community clinic case studies professional development LFA Group 2011 Prepared by: Established in 2000, LFA Group: Learning for Action provides highly customized research, strategy, and evaluation services
CAMDEN CLARK MEDICAL CENTER:
 INSIGHT DRIVEN HEALTH CAMDEN CLARK MEDICAL CENTER: CARE MANAGEMENT TRANSFORMATION GENERATES SAVINGS AND ENHANCES CARE OVERVIEW Accenture helped Camden Clark Medical Center, (CCMC), a West Virginia-based
National Trends Winter 2016
 National Trends Winter 216 About the National Trends data This report presents a unique and real-time view of trends within temporary nursing including bank and agency usage. The data used has been drawn
1. November RN VACANCY RATE: Overall 2320 RN vacancy rate for areas reported is 12.5%
 PATIENT CARE SERVICES REPORT Submitted to the Joint Conference Committee, December 2013 Terry Dentoni, RN, MSN, CNL, Interim Chief Nursing Officer 1. November 2013-2320 RN VACANCY RATE: Overall 2320 RN
CDPH HAI Program Overview
 CDPH HAI Program Overview San Diego APIC Chapter San Diego January 11, 2017 Lynn Janssen, Chief Healthcare-Associated Infections Program Center for Health Care Quality California Department of Public Health
FY 2017 Year In Review
 WEINGART FOUNDATION FY 2017 Year In Review ANGELA CARR, BELEN VARGAS, JOYCE YBARRA With the announcement of our equity commitment in August 2016, FY 2017 marked a year of transition for the Weingart Foundation.
California County Customer Service Centers Survey of Current Human Service Operations July 2012
 California County Customer Service Centers Survey of Current Human Service Operations July 2012 I. Introduction Early this spring, the County Welfare Directors Association of California (CWDA) worked with
Project Update. June 2018
 Project Update June 2018 CWDS / Child Welfare Digital Services Agenda 1. CWS-CARES Development Priorities 2. Cognito: CWS-CARES Identity Management System 3. Snapshot 1.1 & 1.2 Improvements 4. CANS System
Board Briefing. Board Briefing of Nursing and Midwifery Staffing Levels. Date of Briefing January 2018 (December 2017 data)
") Board Briefing Board Briefing of Nursing and Midwifery Staffing Levels Date of Briefing January 2018 (December 2017 data) This paper is for: Sponsor: Chief Nurse- Dame Eileen Sills (DBE) Decision Author:
Board Briefing Board Briefing of Nursing and Midwifery Staffing Levels Date of Briefing January 2018 (December 2017 data) This paper is for: Sponsor: Chief Nurse- Dame Eileen Sills (DBE) Decision Author:
Improving ED Flow through the UMLN II
 Improving ED Flow through the UMLN II Good Samaritan Hospital Medical Center West Islip, NY 437 beds, 50 ED beds http://www.goodsamaritan.chsli.org Good Samaritan Hospital Medical Center, a member of Catholic
From Big Data to Big Knowledge Optimizing Medication Management
 From Big Data to Big Knowledge Optimizing Medication Management Session 157, March 7, 2018 Dave Webster, RPh MSBA, Associate Director of Pharmacy Operations, URMC Strong Maria Schutt, EdD, Director Education
Julie Kelley, MSW, MPH Program Chief, Mental Heath/Psychiatry Contra Costa Regional Medical Center Martinez, CA
 Julie Kelley, MSW, MPH Program Chief, Mental Heath/Psychiatry Contra Costa Regional Medical Center Martinez, CA Patients and Families as Care Partners April 20, 2011 Little about us Contra Costa Regional
Competitive Cal Grants by California Community College,
 by California Community College, 2006-07 Source: California Student Aid Commission, 2006-07 Preliminary Grant Statistics Report California community college students receiving Cal typically receive a Cal
Emergency Department Waiting Times
 Publication Report Emergency Department Waiting Times (formerly Accident & Emergency Waiting Times) Quarter ending 30 June 2011 Publication date 30 August 2011 A National Statistics Publication for Scotland
Urgent Care Short Term Actions to Improve Performance
 To: Trust Board From: Chief Operating Officer Date: March 2017 Healthcare standard Title: Urgent Care Short Term Actions to Improve Performance Author/Responsible Director: Michael Woods / Andrew Prydderch
Healthcare Hot Spotting: Variation in Quality and Resource Use in California
 Issue Brief No. 19 July 2015 Healthcare Hot Spotting: Variation in Quality and Resource Use in California Kelly Miller, Project Manager Jill Yegian, Ph.D., Senior Vice President, Programs and Policy Dolores
EL PASO COUNTY JUDICIAL MANAGEMENT REPORT. 1 st QUARTER FY 2018 (OCTOBER 1 DECEMBER 31, 2017)
") EL PASO COUNTY JUDICIAL MANAGEMENT REPORT 1 st QUARTER FY 2018 (OCTOBER 1 DECEMBER 31, 2017) Table of Contents Court Table... 3 General Assumptions for All Measures... 4 Measure 1: Access and Fairness...
EL PASO COUNTY JUDICIAL MANAGEMENT REPORT 1 st QUARTER FY 2018 (OCTOBER 1 DECEMBER 31, 2017) Table of Contents Court Table... 3 General Assumptions for All Measures... 4 Measure 1: Access and Fairness...
Inpatient Bed Need Planning-- Back to the Future?
 The Academy Journal, v5, Oct. 2002: Inpatient Bed Need Planning--Back to the Future? Inpatient Bed Need Planning-- Back to the Future? Margaret Woodruff Principal The Bristol Group National inpatient bed
Project Update. March 2018
 Project Update March 2018 CWDS / Child Welfare Digital Services Digital Services & Support CWDS Web (Development) CWDS Technology Platform (Development) CWDS Infrastructure (Development) Digital Services
NHS Performance Statistics
 NHS Performance Statistics Published: 8 th March 218 Geography: England Official Statistics This monthly release aims to provide users with an overview of NHS performance statistics in key areas. Official
Low Acuity Emergency Department Visits. Joanna Cohen, MD June 2018
 Low Acuity Emergency Department Visits Joanna Cohen, MD June 2018 Goals and Objectives Identify and quantify low acuity ED visits Analyze challenges associated with low acuity ED visits Assess the impact
My Discharge a proactive case management for discharging patients with dementia
 Shine 2013 final report Project title My Discharge a proactive case management for discharging patients with dementia Organisation name Royal Free London NHS foundation rust Project completion: March 2014
Collaboration Between Radiology and Utilization Management to Reduce Inappropriate MRI Orders and Patient Wait Times. Problem/Goal
 Collaboration Between Radiology and Utilization Management to Reduce Inappropriate MRI Orders and Patient Wait Times A. Chang, C. Hyun, N. Mehta, S. Kim, M. Grube, M. Blair, A. Yi VA Loma Linda Healthcare
Publication Year: 2013
 THE INITIAL ASSESSMENT PROCESS ST. JOSEPH'S HEALTHCARE HAMILTON Publication Year: 2013 Summary: The Initial Assessment Process (IAP) was developed collaboratively by the emergency physicians, nursing,
Defining the Terms: POLST, Advance Directives, and California s Infrastructure
 Defining the Terms: POLST, Advance Directives, and California s Infrastructure Judy Thomas, JD Executive Director Coalition for Compassionate Care of California CHCF Sacramento Briefing December 3, 2014
BEDSIDE REGISTRATION CAPE CANAVERAL HOSPITAL
 Publication Year: 2004 BEDSIDE REGISTRATION CAPE CANAVERAL HOSPITAL Summary: Cape Canaveral hospital implemented a streamlined bedside registration process in order to reduce the time patients spent waiting
Case Study BACKGROUND. Recovering Ambulance Linen. Larry J Haddad, CLLM Textile Management Consultant. Midwest Region
 Title: Facility: Author: Recovering Ambulance Linen Midwest Region Larry J Haddad, CLLM Textile Management Consultant Midwest Region BACKGROUND A 294-bed, not-for-profit community hospital in the Midwest
The Trauma System. Prevention Pre-hospital care and transport Acute hospital care Rehab Research
 An Overview The Trauma System The Office of Emergency Medical Services & Trauma System (OEMSTS) is responsible for oversight of the trauma system. The ideal trauma system includes; Prevention Pre-hospital
LASD/Metro Transit Security Program
 Los Angeles County Metropolitan Transportation Authority LASD/Metro Transit Security Program Board of Directors Meeting December 4, 2008 1 Metro s Proposed Security Model Contract Framework: FTE - based
Same Disease, Different Care: How Patient Health Coverage Drives Treatment Patterns in California. The analysis includes:
 Same Disease, Different Care: How Patient Health Coverage Drives Treatment Patterns in California C A L I FOR N I A HEALTHCARE FOUNDATION Introduction As shown in The 2005 Dartmouth Atlas of Health Care,
Stakeholder input is gathered in several ways. Patients are given the opportunity to provide feedback, the SWOT analysis is based on information from
 Strategic Plan 27 Executive Summary The following is a summary of the information shared in this Operations Review and Plan. This plan highlights operational achievements and challenges, clinical outcomes
HEALTH PLANS FOR PARTICIPANTS
 Kern County 2018 Retiree HEALTH PLANS FOR PARTICIPANTS OVER AGE 65 (Must have BOTH Medicare Parts A & B) For current participating physician information, please contact each plan directly. This summary
Mark Stagen Founder/CEO Emerald Health Services
 The Value Proposition of Nurse Staffing September 2011 Mark Stagen Founder/CEO Emerald Health Services Agenda Nurse Staffing Industry Update Improving revenue trends in healthcare staffing 100% Percentage
The San Joaquin Valley Registered Nurse Workforce: Forecasted Supply and Demand,
 Research Report The San Joaquin Valley Registered Nurse Workforce: Forecasted Supply and Demand, 2016-2030 by Joanne Spetz, Janet Coffman, Timothy Bates Healthforce Center at UCSF March 26, 2018 Abstract
Nottingham University Hospitals Emergency Department Quality Issues Related to Performance
 RCCG/GB/14/123 Nottingham University Hospitals Emergency Department Quality Issues Related to Performance Introduction NUH have failed to meet the 95% 4 hour wait standard for a number of consecutive months.
The Realignment of HUD Continuum of Care Program Funding Continues: Some California Continuums of Care Are Winners and Some Are Losers
 The Realignment of HUD Continuum of Care Program Funding Continues: Some California Continuums of Care Are Winners and Some Are Losers A brief prepared by Joe Colletti, PhD and Sofia Herrera, PhD -Institute
1. March RN VACANCY RATE: Overall 2320 RN vacancy rate for areas reported is 13.8%
 PATIENT CARE SERVICES REPORT Submitted to the Joint Conference Committee, April 2014 Terry Dentoni, RN, MSN, CNL, Interim Chief Nursing Officer 1. March 2014-2320 RN VACANCY RATE: Overall 2320 RN vacancy
Any travel outside the Pacific Area requires pre-approval by the Area Manager, Operations Support.
 August 7, 2009 ALL EAS EMPLOYEES SAN FRANCISCO DISTRICT SUBJECT: Official Travel Approvals: Effective immediately, any travel involving lodging within the District must be approved in advance using the
Report Summary. Identifying the Problem
 Hospital Costs in California: Wide Variations in Charges Raise Questions on Pricing Policies January 14, 2008 (An Executive Summary of Cost Efficiency at Hospital Facilities in California: A Report Based