A Report of The Heritage Center for Data Analysis
|
|
|
- Kerrie Cobb
- 5 years ago
- Views:
Transcription
1
2 A Report of The Heritage Center for Data Analysis WHO BEARS THE BURDEN? DEMOGRAPHIC CHARACTERISTICS OF U.S. MILITARY RECRUITS BEFORE AND AFTER 9/11 TIM KANE, PH.D. CDA05-08 November 7, Massachusetts Avenue, NE Washington, D.C (202) heritage.org NOTE: Nothing written here is to be construed as necessarily reflecting the views of The Heritage Foundation or as an attempt to aid or hinder the passage of any bill before Congress.
3
4 CDA05 08 CDA04 01 November November 9, 20047, 2005 WHO BEARS THE BURDEN? DEMOGRAPHIC CHARACTERISTICS OF U.S. MILITARY RECRUITS BEFORE AND AFTER 9/11 TIM KANE, PH.D. A few Members of Congress, motivated by American combat in the Middle East, have called for the reinstatement of a compulsory military draft. The case for coercing young citizens to join the military is supposedly based on social justice that all should serve and seems to be buttressed by reports of shortfalls in voluntary enlistment. In a New York Times op-ed on December 31, 2002, Representative Charles Rangel (D NY) claimed, A disproportionate number of the poor and members of minority groups make up the enlisted ranks of the military, while most privileged Americans are underrepresented or absent. 1 This claim is frequently repeated by critics of the war in Iraq. 2 Aside from the logical fallacy that a draft is less offensive to justice than a voluntary policy, Rangel s assertions about the demographic makeup of the enlisted military are not grounded in fact. Although all branches of the armed services have been able to meet recruiting goals in recent years, the Army s difficulty in meeting its goal of 80,000 new soldiers in 2005 has been widely reported, and some view it as a symbol of the need to reinstate the draft. However, this shortfall should be placed in the proper context. The Army is projected to fall just 7,000 (about 9 percent) short of its 2005 recruitment goal, which is less than 1 percent of the overall military of over 1 million personnel. Furthermore, there is the unexpected rise in reenlistment rates. In other words, the total force strength is about what it should be. Since the draft was discontinued in 1973, all branches of the U.S. military have relied entirely on volunteers to fill their ranks. There are constant challenges in maintaining a balanced supply of recruits for force strength and composition, but three decades of experience confirms that the voluntary policy works well, despite widespread skepticism in the early 1970s. The same cannot be said of a conscripted force, as evidenced by the backlash among troops and the public during the Vietnam conflict. Despite the Pentagon s strong preference for an all-volunteer force, some politicians and many voters favor a draft. A June 2005 Associate Press/Ipsos poll found that 27 percent of respondents supported the reinstatement of the military draft in the United States. Reinstatement of the draft was far more popular immediately following the September 11, 2001, terrorist attacks, when 76 percent of Americans supported a renewed draft if it becomes clear that more soldiers are needed in the war against terrorism. 3 Although Representative Rangel s bill to reinstate the draft failed by a decisive vote of in the 1. Charles B. Rangel, op-ed, Bring Back the Draft, The New York Times, December 31, 2002, p. A See, for example, Bob Herbert, Blood Runs Red, Not Blue, The New York Times, August 18, 2005, p. A PollingReport.com, Foreign Affairs and Defense Issues, at (September 7, 2005).
5 House of Representatives in 2004, the issue will likely be considered again, especially if there are more terrorist attacks on the U.S. Some motivations for the draft are entirely patriotic in the sense that they aim to protect America from aggressors. Others see the draft as an instrument of equality, as well as an instrument of pacifism. Representative Rangel s theory is that if all citizens faced equal prospects of dying in a conflict, support for that conflict would have to pass a higher standard. This theory assumes that the privileged classes would be less willing to commit the nation to war if that conflict involved personal, familial, or class bloodshed. It also assumes that the existing volunteers are either ignorant or lack other options that is, they are involuntary participants. One way to test this thesis is to explore the demographic patterns of enlisted recruits before and after the initiation of the global war on terrorism on September 11, This paper reports the results of summary research into the demographic composition of two groups of recruits: those who enlisted between October 1998 and September 1999 and those who enlisted between January 2003 and September These groups are referred to as the 1999 and 2003 recruit cohorts, respectively. Nationwide Census data for citizens ages were used as a baseline for comparison. Comparisons of these three different groups highlight the differences not only between the general population and military volunteers, but also between recruits who volunteered for the military before 9/11 and those who volunteered after 9/11. Our analysis of the demographic composition of enlisted recruits vis-à-vis the general population considers the following characteristics: Household income, Level of education, Race/ethnicity, and Region/rural origin. This paper also reviews other evidence that is at odds with the image, painted by some supporters of the draft, that the military exploits poor, ignorant, young Americans by using slick advertising that promises technical careers in the military to dupe them into trading their feeble opportunities in the private sector for a meager role as cannon fodder. The caricature of conscription a harsh reality of European militaries in the 18th and 19th centuries lives on in the popular imagination, but it does not accurately represent the all-volunteer U.S. military. Indeed, the U.S. military s qualitative superiority is what makes it the most efficient and lethal combat force in history. In economic terms, high-skill human capital among troops makes the military more productive overall. There may be legitimate equity concerns that outweigh national security, but they will undoubtedly come at a cost or trade-off in productivity. However, our research shows that the volunteer force is already equitable. That is, it is highly likely that reinstating the draft would erode military effectiveness, increase American fatalities, destroy personal freedom, and even produce a less socioeconomically privileged military in the process. In summary, we found that, on average, 1999 recruits were more highly educated than the equivalent general population, more rural and less urban in origin, and of similar income status. We did not find evidence of minority racial exploitation (by race or by race-weighted ZIP code areas). We did find evidence of a Southern military tradition in that some states, notably in the South and West, provide a much higher proportion of enlisted troops by population. The household income of recruits generally matches the income distribution of the American population. There are slightly higher proportions of recruits from the middle class and slightly lower proportions from low-income brackets. However, the proportion of high-income recruits rose to a disproportionately high level after the war on terrorism began, as did the proportion of highly educated enlistees. All of the demographic evidence that we analyzed contradicts the pro-draft case. HOUSEHOLD INCOME OF RECRUITS We found that recruits tend to come from middle-class areas, with disproportionately fewer from low-income areas. Overall, the income distribution of military enlistees is more similar to than different from the income distribution of the general population. Income was compared on a household basis, not an individual basis, meaning that recruits income was defined by their household of origin. This approach was used because youth are rarely pri- 2
6 Table 1 CDA Summary of Findings: Demographics of U.S. Military Enlistment By Total Population By ZCTA* Change After 9/11 Comparison Group Income Recruits are not disproportionately poor. Mean household income for recruits in 1999 was $41,141 (in 2000 dollars), compared to the general population median of $41,994. Recruits in 2003 came from households with an average 1999 income of $42,822. Middle-income quintile ZIP code areas provided consistently higher proportions of recruits. Areas in the lowest-income quintile provided disproportionately low numbers of recruits in 1999 and 2003 (18.0 and 14.6 percent, respectively). Areas in the highest-income quintile provided the greatest positive proportional increase of recruits after 9/11, from 18.6 to 22.0 percent. Household incomes (in 1999 dollars) for the general population from Census Education 98 percent of recruits have a high school education or higher, compared to 75 percent of non-recruits. High school graduation rates were higher for recruits than the local population in every three-digit ZCTA in Of five quintiles based on graduation rates, the only one with disproportionately low enlistment was the highest quintile (15 percent compared to a proportional 20 percent). The average education level of recruits increased after 9/11, with 2.8 percent more enlistees joining who already had some college experience or a college degree. General population, ages 18-24, from Census Race Based on 2003 data, whites are proportionally represented in the military (and Army specifically). Blacks and native Americans are overrepresented, offsetting underrepresentation by Asians and individuals who decline to identify a race. Recruiting is not disproportionately reliant on minority neighborhoods. The 100 three-digit ZIP codes with the highest concentrations of blacks represent 14.7 percent of the population, 16.6 percent of 1999 recruits, and 14.1 percent of recruits in Not applicable: 1999 military data are not comparable to 2000 Census data. General population, ages 18 and older, from Census Region Completely urbanized areas have 39.1 percent of the population, but accounted for 30.1 percent of recruits in 1999 and 28.9 percent in As urban concentration declines, the recruit-to-population ratio rises. States have widely varying rates of military enlistment. Montana, Wyoming, Florida, Maine, and Texas provide disproportionately high numbers of recruits, whereas Massachusetts, Rhode Island, Utah, and especially the District of Columbia provide disproportionately low numbers. States with large increases in the recruit-to-population ratio of greater than 10 percentage points were Iowa, Wisconsin, Kansas, Washington, Arizona, Indiana, Oregon, Nebraska, Colorado, Minnesota, and North Carolina. General population, ages 18-24, from Census * ZIP code tabulation area. Source: Heritage Foundation calculations based on data from U.S. Department of Defense, Office of the Undersecretary of Defense, October 1998 September 1999 Non-Prior Service (NPS) Enlisted Accessions and January 2003 September 2003 NPS Enlisted Accessions, and U.S. Bureau of the Census, United States Census 2000, Summary File 1, at (July 6, 2005), and Summary File 3, at (July 6, 2005). 3

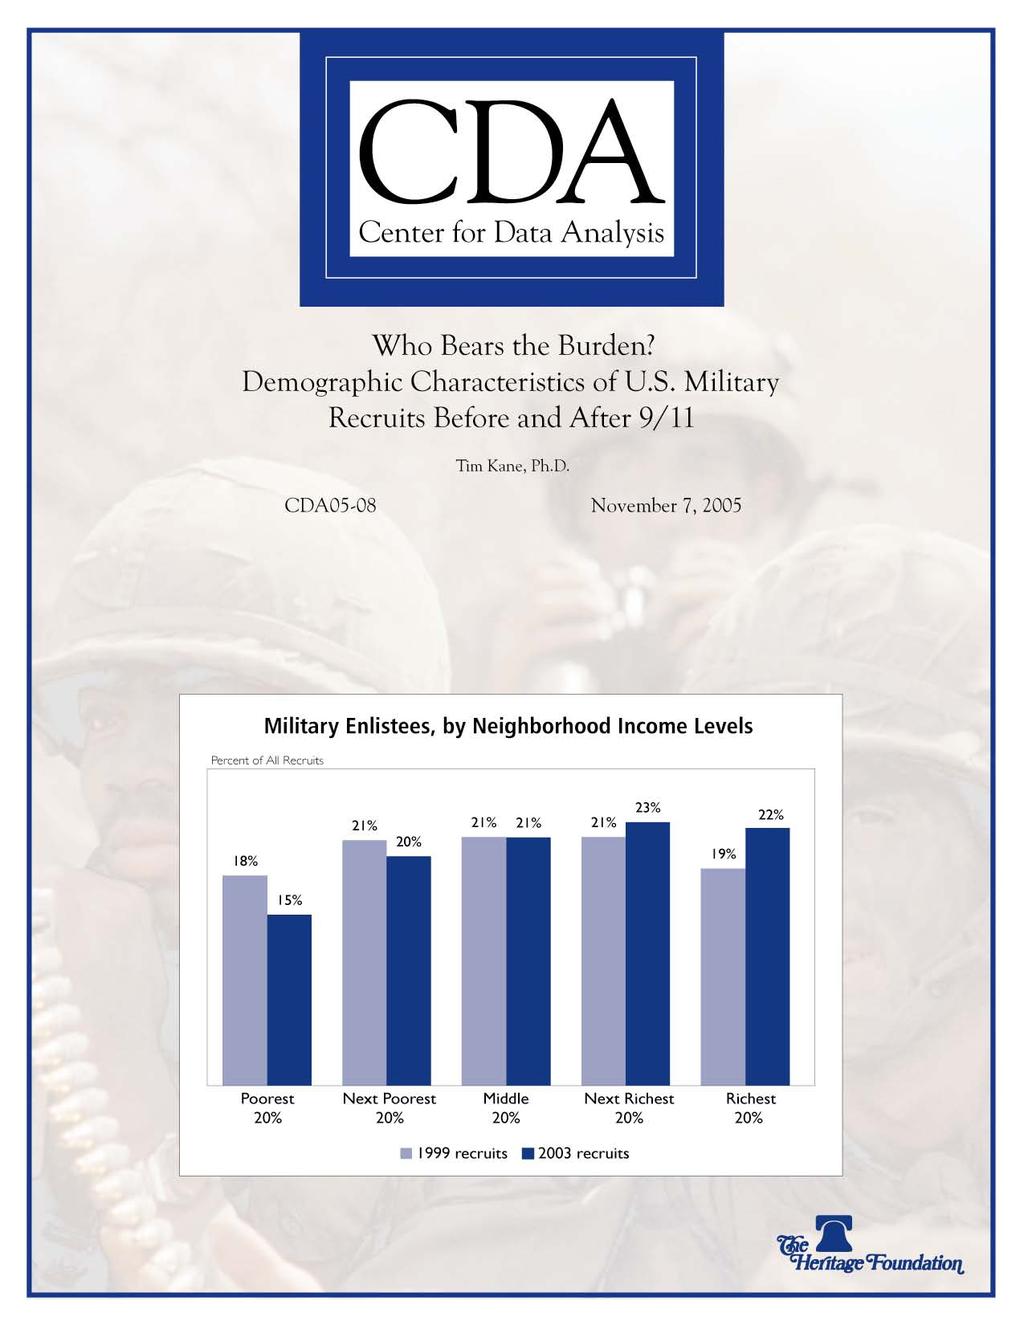
7 mary income earners, and many earn no income at all until after high school graduation. However, the household income of their area of origin does serve as a basis for assessing whether the military recruits come from disproportionately poor backgrounds. Much of the analysis in this paper (including this section) uses fivedigit Census ZIP code tabulation areas (ZCTAs) as the unit of analysis. The Census Bureau uses ZCTAs to approximate U.S. Postal Service ZIP codes. In most cases, ZCTAs correspond to postal ZIP codes. For example, Representative Rangel resides in the postal ZIP code The corresponding fivedigit ZCTA 10037, shown in Figure 1, has a median household income of $26,561. In 1999, four recruits originated from the area, in 2003, the total was six recruits. According to the 2000 Census, the national median income per household in 1999 was $41,994 in 1999 dollars. By assigning each recruit the median 1999 household income for his hometown ZIP code, we calculated that the mean 1999 income for 1999 recruits before entering the military was $41,141 (in 1999 dollars). The mean 1999 income for 2003 recruits was $42,822 (in 1999 dollars). In other words, on average, recruits in 2003 were from wealthier neighborhoods than were recruits in Table 2 is a summary of ZCTA data ranked in order of population quintiles. In 1999 and 2003, the recruits generally mirror the percent distribution among the population, but the pattern shows clearly that there were fewer recruits from the poorest quintile of neighborhoods 4 (18.0 percent) and fewer from the richest quintile (18.6 percent) in In 2003, however, only 14.6 percent of military recruits came from the poorest quintile, whereas the wealthiest quintile provided 22.0 percent. Enlistments from wealthier areas surged, resulting in a 3.4 percentage point upturn. The middle-class quintiles Figure 1 CDA Census ZIP Code Tabulation Area Source: U.S. Bureau of the Census, American FactFinder, at factfinder.census.gov/home/saff/main.html?_lang=en (October 18, 2005). (the third and fourth wealthiest areas) consistently provided disproportionately high numbers of soldiers in both year groups. (See Chart 1.) Some ZCTAs had higher median incomes than the national median, and some had lower. Chart 2 shows a percent distribution of 1999 recruits by ZCTA income, revealing that the bulk of recruits came from middle-class areas. For instance, the largest percentage cohort of 1999 recruits (17.8 percent) came from neighborhoods with average household incomes of $35,000 to $40,000. Very few recruits less than 5 percent came from neighborhoods with average incomes below $20,000 per household. The plain fact is that the income distribution of recruits is nearly identical to the income distribution of the general population ages Because we lack individualized household income data, our approach does not indicate whether or not the recruits came from the poorer households in their neighborhoods. Nevertheless, Chart 3 shows that the difference between the 1999 recruit distribution 4. In this report, the term neighborhoods is used interchangeably with ZCTA. 4
8 Table 2 CDA U.S. Military Recruits by Household Income Median Household Income Range Population Percent, Ages Recruit Percent 2003 Recruit Percent 1999 Difference 2003 Difference $0 $29,375 20% 18.0% 14.6% -2.1% -5.4% $29,382 $35,462 20% 21.0% 19.6% 1.0% -0.4% $35,463 $41,685 20% 21.3% 21.2% 1.3% 1.2% $41,688 $52,068 20% 21.3% 22.5% 1.2% 2.5% $52,071 $200,001 20% 18.6% 22.0% -1.4% 2.1% Source: Heritage Foundation calculations based on data from U.S. Department of Defense, Office of the Undersecretary of Defense, October 1998 September 1999 Non-Prior Service (NPS) Enlisted Accessions and January 2003 September 2003 NPS Enlisted Accessions, and U.S. Bureau of the Census, United States Census 2000, Summary File 3, at (July 6, 2005). Chart 1 CDA Military Enlistees, by Neighborhood Income Levels 18% 21% 21% 21% 21% 20% 23% 19% 22% 15% Poorest Quintile Quintile 2 Quintile 3 Quintile 4 Richest Quintile 1999 recruits 2003 recruits Note: Each quintile represents 20 percent of the U.S. population. Source: Heritage Foundation calculations based on data from U.S. Department of Defense, Office of the Undersecretary of Defense, October 1998 September 1999 Non-Prior Service (NPS) Enlisted Accessions and January 2003 September 2003 NPS Enlisted Accessions, and U.S. Bureau of the Census, United States Census 2000, Summary File 3, at (July 6, 2005). 5
9 Chart 2 CDA Distribution of 1999 U.S. Military Recruits, by Household Income Percentage of Recruits 18% Poverty Threshold = $17,030 National Median = $41,994 $0 $10 $20 $30 $40 $50 $60 $70 $80 $90 $100 + Median Household Income* ($thousands) * Median household income was calculated by ZIP code tabulation area, based on Census Source: Heritage Foundation calculations based on data from U.S. Department of Defense, Office of the Undersecretary of Defense, October 1998 September 1999 Non-Prior Service Enlisted Accessions, and U.S. Bureau of the Census, United States Census 2000, Summary File 3, at Release/www/2002/sumfile3.html (July 6, 2005). Chart 3 CDA Differences Between Recruit and Civilian Income Distribution Percentage point difference* 2% 1% 0% -1% More recruits come from the middle class -2% $0 $10 $20 $30 $40 $50 $60 $70 $80 $90 $100 + Median Household Income** ($thousands) *Percentage point difference represents the distribution of 1999 recruits minus the distribution of the general population ages Positive bars indicate higher levels of recruits from that income cohort. ** Median household income was calculated by ZIP code tabulation area, based on Census Source: Heritage Foundation calculations based on data from U.S. Department of Defense, Office of the Undersecretary of Defense, October 1998 September 1999 Non-Prior Service Enlisted Accessions, and U.S. Bureau of the Census, United States Census 2000, Summary File 3, at Release/www/2002/sumfile3.html (July 6, 2005). 6
10 of ZCTA income and the population distribution is below a single percentage point for 19 of the 20 income brackets. Yet even these slight differences show a subtle pattern: Proportionally, both poorer and richer areas provide slightly fewer recruits, and middle-income areas provide slightly more. This evidence directly contradicts Representative Rangel s claim that underprivileged Americans are the source of military manpower and that the privileged are underrepresented. In fact, Chart 4 shows that every ZCTA income bracket below $40,000 provided the same number or fewer recruits after 9/11, while all brackets above $40,000 provided the same number or more. Chart 4 CDA Percentage point difference* 2% 1% 0% -1% EDUCATION LEVELS OF RECRUITS We find that, on average, recruits tend to be much more highly educated than the general public and that this education disparity increased after the war on terrorism began. Comparable detailed education data from the Census classify the education level of individuals into one of seven categories (from less than high school up to graduate/professional degree). We generated a binary variable that assigns a 1 for individuals with a high school diploma or higher and a 0 for less than a high school diploma. If one single statistic could settle this issue, it is this: 98 percent of all enlisted recruits who enter the military have an education level of high school graduate or higher, compared to the national average of 75 percent. 5 In an education context, rather than attracting underprivileged young Americans, the military seems to be attracting above-average Americans. What remains to explore is whether this pattern of military enlistment is (1) consistent Change in Enlistments After 9/11, by Household Income -2% $0 $10 $20 $30 $40 $50 $60 $70 $80 $90 $100 + Median Household Income** ($thousands) *Percentage point difference represents the distribution of 2003 recruits minus the distribution of 1999 recruits. Positive bars indicate higher levels of recruits from that income cohort. ** Median household income was calculated by ZIP code tabulation area, based on Census Source: Heritage Foundation calculations based on data from U.S. Department of Defense, Office of the Undersecretary of Defense, January 2003 September 2003 Non-Prior Service Enlisted Accessions, and U.S. Bureau of the Census, United States Census 2000, Summary File 3, at Release/www/2002/sumfile3.html across ZIP codes, (2) consistent across all branches of service, and/or (3) consistent proportionally across all levels of education. The claim could still be made that highly educated recruits are being pulled from underprivileged areas, marked by below-average high school graduation rates. Further analysis shows that any such claim would also be incorrect. We used the binary measure to make a ZIP code level comparison. By comparing the records of 183,288 individual recruits from the 1999 cohort, using ZIP code of origin, against other Census populations by ZIP code, our analysis shows that roughly half (48.5 percent) of enlistees came from three-digit ZCTAs with above-average national graduation rates. The other half of enlistees came from areas with belowaverage high school graduation rates. Regardless of ZIP code area, we also find that enlistees are almost universally better educated than the general population. In all but one of the 885 three-digit ZCTAs, the graduation rate for 5. U.S. Bureau of the Census, United States Census 2000, Summary File 3, at sumfile3.html (July 6, 2005). Alternative data from the Current Population Survey indicate that 79 percent of citizens ages have achieved a level of education of a high school equivalent diploma or higher. 7
11 Chart 5 CDA Military Enlistees, by Neighborhood Education Levels 22% 22% 22% 21% 21% 21% 20% 21% 15% 15% Quintile 1 (ZIPs with 33-69% HS grads) Quintile 2 (ZIPs with 69-73% HS grads) Quintile 3 ZIPs with 73-77% HS grads) Quintile 4 (ZIPs with 77-80% HS grads) Quintile 5 (ZIPs with 80-99% HS grads) 1999 recruits 2003 recruits Source: Heritage Foundation calculations based on data from U.S. Department of Defense, Office of the Undersecretary of Defense, October 1998 September 1999 Non-Prior Service (NPS) Enlisted Accessions and January 2003 September 2003 NPS Enlisted Accessions, and U.S. Bureau of the Census, United States Census 2000, Summary File 3, at (July 6, 2005). Chart 6 CDA Military Recruits in 1999, by Education Level Percent of Total Recruits 100% Less than 9th grade 9th-12th grade, no diploma HS graduate (including equivalency) Some college, no degree Associate's degree Bachelor's degree Graduate or Professional degree Educational Level General Population (age 18-24) Army 1999 Air Force 1999 Marine Corps 1999 Navy 1999 Source: Heritage Foundation calculations based on data from U.S. Department of Defense, Office of the Undersecretary of Defense, October 1998 September 1999 Non-Prior Service Enlisted Accessions, and U.S. Bureau of the Census, United States Census 2000, Summary File 3, at (July 6, 2005). 8
12 Chart 7 CDA Change in Education Level of Recruits After 9/11 3.0% 2.0% 1.0% 0.0% -1.0% 0.0% -0.1% 1.0% 1.0% 1.2% 0.0% -2.0% -3.0% -4.0% Less than 9th grade 9th-12th grade, no diploma -3.0% HS graduate (including equivalency) Some college, no degree Associate's degree Bachelor's degree Graduate or professional degree Educational Attainment Source: Heritage Foundation calculations based on data from U.S. Department of Defense, Office of the Undersecretary of Defense, October 1998 September 1999 Non-Prior Service (NPS) Enlisted Accessions and January 2003 September 2003 NPS Enlisted Accessions, and U.S. Bureau of the Census, United States Census 2000, Summary File 3, at Release/www/2002/sumfile3.html (July 6, 2005) recruits was higher than the graduation rate for non-recruits ages In 2003, recruits had a higher graduation rate in every ZCTA. Figure 2, by using a gray scale to show the intensity of the educational gap, clearly shows that recruits are often better educated than the general population. Given the nature of the military rank structure, most enlisted recruits do not have a college education or degree. Members of the armed forces with higher education are more often commissioned officers (i.e., lieutenant and above). Compared to the general population, a lower percentage of enlisted recruits have an educational level of 4 (some college/no degree) through 7 (graduate or professional degree), and a lower percentage of recruits are in the two lowest educational levels. Chart 6 shows the distributions for each branch of the military and the general population. The similarity among branches stands out, with the minor distinction that the Army has a slightly higher percentage (2.7 percent) of enlisted recruits with a bachelor s degree than the other branches. After September 11, 2001, the educational quality of recruits rose slightly. Comparing 1999 enlisted recruits to 2003 recruits showed an increase in collegiate experience. In 2003, a higher proportion of recruits had college experience and diplomas, and a lower percentage had only a high school diploma a shift of about 3 percentage points. Furthermore, this figure is not subject to statistical significance tests because it measures the entire recruit population, not just a sample of it. Therefore, we can say definitively that enlistee quality actually increased between 1999 and (See Chart 7.) RACIAL REPRESENTATION AMONG RECRUITS We found that whites are one of the most proportionally represented groups making up 77.4 percent of the population and 75.8 percent of all recruits whereas other racial categories are often represented in noticeably higher and lower proportions than the general population. This kind of racial analysis is complicated by the fact that race is a self-identified attribute that is not well defined genetically, and many citizens object to racial classification, which complicates government efforts to categorize racial and ethnic identity consistently. Specifically, race data for the population in 2000 are not compatible with the 1999 recruit cohort but are compatible with the 2003 cohort. The 1999 recruit data allow for only 9

.")
13 Figure 2 CDA High School Graduation Rates: 1999 Recruits vs. General Population, Ages CDA Percentage point difference Note: Positive values indicate higher recruit graduation rates. Rates were calculated by three-digit ZIP code tabulation areas. Source: Heritage Foundation calculations based on data from U.S. Department of Defense, Office of the Undersecretary of Defense, October 1998 September 1999 Non-Prior Service Enlisted Accessions, and U.S. Bureau of the Census, United States Census 2000, Summary File 3, at (July 6, 2005). Figure 3 CDA High School Graduation Rates: 2003 Recruits vs. General Population, Ages Percentage point difference Note: Positive values indicate higher recruit graduation rates. Rates were calculated by three-digit ZIP code tabulation areas. Source: Heritage Foundation calculations based on data from U.S. Department of Defense, Office of the Undersecretary of Defense, January 2003 September 2003 Non-Prior Service Enlisted Accessions, and U.S. Bureau of the Census, United States Census 2000, Summary File 3, at (July 6, 2005). 10
14 Table 3 CDA Race U.S. Military Recruits by Race Population Percent 2003 Recruit Percent 2003 Army Percent Recruit/ Population Ratio Army/ Population Ratio American Indian/Alaska Native 0.78% 1.82% 1.19% Asian 3.67% 1.23% 1.14% Black 11.33% 14.99% 16.25% Native Hawaiian/Pacific Islander 0.13% 0.42% 0.45% White 77.44% 75.79% 78.50% Combination of two or more races 1.93% 2.67% 2.46% Other 4.73% Declined to respond 3.08% 2.18% Hispanic 12.11% 11.50% 10.74% Not Hispanic 87.89% 84.64% 82.65% Declined to respond 3.87% 6.61% Source: Heritage Foundation calculations based on data from U.S. Department of Defense, Office of the Undersecretary of Defense, October 1998 September 1999 Non-Prior Service (NPS) Enlisted Accessions and January 2003 September 2003 NPS Enlisted Accessions, and U.S. Bureau of the Census, United States Census 2000, Summary File 1, at Release/www/2001/sumfile1.html (July 6, 2005). one race category per person, whereas 2003 recruit and Census data follow a system that both allows each individual to self-identify any combination of six racial categories and includes an independent Hispanic indicator. The following analysis of race is based on a comparison of the 2003 recruit data and Census population data for ages 18 and above (not just 18 24). Table 3 provides a summary of racial data, revealing that enlisted recruits are similar to the population with a few sharp differences. Table 3 also includes a breakout comparison of the 2003 Army recruits, since that branch bears a larger share of danger on the ground in Iraq and Afghanistan. For example, the data show that, proportionally, blacks make up 43 percent more of the Army recruits than does the general population, but this is not in place of whites, who make up 1 percent more (not less). Other racial categories notably American Indians/Alaskan Natives (53 percent) and Native Hawaiian/Pacific Islanders (249 percent) are even more overrepresented. A military draft along the lines proposed by Representative Rangel would press thousands more Asian Americans into service, as well as thousands of Americans who decline to be racially categorized. In contrast, a draft could deny blacks, whites, and others the freedom to enlist in the Army once their racial quotas were filled. We next considered the underprivileged source hypothesis. We know from earlier analysis that recruiting is not concentrated in poor neighborhoods (ZCTAs), but perhaps it is disproportionately concentrated in black neighborhoods. The 100 three-digit ZCTAs with the highest concentration of blacks (in any combination of other races) range from percent up to percent self-identified as black. These areas have percent of the adult population but are the origin of only percent of 1999 recruits and percent of 2003 recruits. Moreover, 2003 recruits from these black areas included an almost equal number of white and black recruits (45.7 percent and 46 percent of the total, respectively). The group of ZCTAs with the highest concentration of whites had almost 46 times as many white recruits as black recruits. Among the ZCTAs that had the highest number of recruits, the ratio was almost 4:1. If the military were to draw disproportionately from minority groups by design, one would expect fewer white recruits from minority-concentrated areas and more minority recruits from the whiteconcentrated areas. The demographic data on race reveal that military enlistees are not, in fact, more heavily recruited from black neighborhoods. The data also reveal that minorities serve in different proportions, but not because fewer whites are serving. In other 11
15 Table 4 CDA Rural Concentration Recruitment by Rural Concentration Population, Ages words, there is no disproportionate share of minorities serving in the military, as claimed by editorials around the nation in Some minorities participate more heavily than other minorities. Race is often used as a proxy for class, but it is rarely, if ever, an appropriate substitute. Even if the military had a higher share of African Americans, it does not follow that those recruits are poorer, from poorer areas, from more urbanized areas, less educated, or from less educated areas. Indeed, none of these other claims can be substantiated Recruits 2003 Recruits 1999 Recruits/ 2003 Recruits/ Population Ratio Population Ratio (all urban) 39.1% 30.1% 28.9% % 33.7% 33.6% % 16.8% 17.3% % 7.5% 8.0% (all rural) 7.7% 11.9% 12.2% Source: Heritage Foundation calculations based on data from U.S. Department of Defense, Office of the Undersecretary of Defense, October 1998 September 1999 Non-Prior Service (NPS) Enlisted Accessions and January 2003 September 2003 NPS Enlisted Accessions, and U.S. Bureau of the Census, United States Census 2000, Summary File 1, at (July 6, 2005), and Summary File 3, at (July 6, 2005). REGIONAL ANALYSIS This section focuses on two questions of regional concentration of enlisted recruits. First, we asked whether recruits come predominately from urban areas. Second, we asked whether troops enlist predominately from Southern areas. In April 2005, the Chicago Tribune cited a statistic that 35 percent of those who died in Iraq and Afghanistan were from small, rural towns, in contrast to 25 percent of the population. 7 This point runs counter to the picture, painted by Rangel and others, of heavy enlistment reliance on poor, black urban neighborhoods. Indeed, recruits are disproportionately rural, not urban, and as rural concentration 8 rises, so does military enlistment. Specifically, 80 percent of recruits come from areas that have a rural concentration of less than 0.5, meaning that they come from areas where more than half of the population is urbanized. The overall population is slightly more urbanized, with 84 percent of Americans ages in similar areas. Table 4 shows the distribution of 32,243 five-digit ZCTAs. (Recruits who listed five-digit ZIP codes that are not listed as Census ZCTAs were excluded.) The constant increase in the recruit/population ratio contradicts the assertion that military recruiting targets youth in inner cities. In fact, entirely urban areas are the area most underrepresented among recruits. Both suburban and rural areas are overrepresented. Although this may not reflect Representative Rangel s desire that military demographics precisely mirror the population, the overrepresentation of rural areas should be viewed as beneficial from an economic perspective. Rural areas generally offer a less flexible, thinner job market. The military extends job opportunities into these areas, with technical training that is usually unavailable otherwise. THE SOUTHERN MILITARY TRADITION The South is overrepresented among military recruits. It provided 42.2 percent of 1999 recruits and 41.0 percent of 2003 recruits but contained just 35.6 percent of the population ages However, other regions also provide a higher proportion 6. See Lewis W. Diuguid, Pushy Recruiters Descend on High Schools, The Kansas City Star, January 29, 2003, p. B7. 7. Sean D. Hammil, Small Towns Pay Big Price in Fighting Nation s Wars, Chicago Tribune, April 27, 2005, p The Census Bureau classifies each ZCTA into population residing in urban areas, urban clusters, and rural areas. The formula we used defines rural concentration as the population residing in rural areas divided by the total population for that ZCTA. Areas that are entirely urban, such as Representative Rangel s ZCTA 10037, have a rural concentration of Completely rural areas have a concentration of ZCTAs with zero population were excluded from this analysis. 12
16 of enlistees. The states with the highest enlistment proportional ratings by far are Montana (1.67), Alaska (1.42), Wyoming (1.40), and Maine (1.39). (A proportional rating of 1.00 means that a state s enlistee and general populations ages are exactly proportional to their respective national populations.) This section utilizes the home-of-record ZIP code of recruits to assess the regional origin of military members. The home-of-record ZIP code represents the area where individual recruits resided upon enlistment, not their location after enlistment. We calculated and analyzed a regional distribution of recruits by state and region for comparison to similar distributions of the general population. Table 5 CDA Census Divisions In addition to confirming the strong Southern military tradition, we also found an exceptional tendency for lower than average military participation in New England. The West was underrepresented among 1999 recruits, but its 2003 proportion was equal to the population. For example, the East North Central Census region, conventionally known as the Great Lakes states, had a proportional rating of 0.86, which rose to 0.93 after September 11, This implies a lower than average interest in joining the military in the region compared to the nation, but it may reflect other variables as well (e.g., relative health and fitness of potential recruits). Table 5 shows the proportions for each region. On the state level, 20 states and the District of Columbia and Puerto Rico were underrepresented with proportional ratios below 1.0. Table 6 provides complete state-level data. Of note, this table shows that certain states had a higher enlistment proportion after the terrorist attacks. One might expect the states where the attacks took place to respond with higher enlistment proportions. On the contrary, New York s enlistment proportion ratio was 0.86 in 1999 and 0.79 in In Virginia, the ratio dropped from 1.27 to Recruitment Distribution by Census Division Population, Ages Enlisted Recruits 2003 Enlisted Recruits 1999 Recruit/ Population Ratio 2003 Recruit/ Population Ratio Northeast Middle Atlantic 12.8% 11.7% 10.7% New England 4.4% 3.4% 3.4% North Central East North Central 15.8% 13.5% 14.6% West North Central 6.9% 6.0% 6.8% South East South Central 6.2% 6.4% 6.2% South Atlantic 17.5% 20.7% 20.4% West South Central 11.9% 15.1% 14.5% West Mountain 6.9% 7.2% 7.5% Pacific 16.0% 15.2% 15.4% Puerto Rico 1.6% 0.8% 0.6% Source: Heritage Foundation calculations based on data from U.S. Department of Defense, Office of the Undersecretary of Defense, October 1998 September 1999 Non-Prior Service (NPS) Enlisted Accessions and January September 2003 NPS Enlisted Accessions, and U.S. Bureau of the Census, United States Census 2000, Summary File 1, at (July 6, 2005), and Summary File 3, at Release/www/2002/sumfile3.html (July 6, 2005). Due to the lack of comparable data for other years, it is unclear whether this movement is significant or even suggestive of a pattern. However, states with the most positive upward movement in their enlistment ratios after the war on terrorism began were Iowa (+0.21), Wisconsin (+0.17), Kansas (+0.16), Washington (+0.15), and Arizona (+0.14). The variation by state shows that the military is somewhat distinct from the young adult population in terms of geographic composition. However, there is very little variation in geographic origin between 1999 recruits and 2003 recruits, which suggests that the war on terrorism had little effect on the regional demographics of recruits. CONCLUSION A large shift in public opinion about the desirability of a military draft occurred in the aftermath of the September 11 terrorist attacks. Most Americans instinctively rallied to the flag and wanted to do everything to protect the nation. As a result, the draft became one of the issues that received renewed emotional support. Support eroded in succeeding polls, as evidenced by the fact that 70 percent of Americans currently oppose reinstate- 13
17 Table 6 CDA U.S. Military Recruits by State State Population, Ages (% of total) 1999 Recruits (% of total) 2003 Recruits (% of total) 1999 Recruit/ Population Ratio 2003 Recruit/ Population Ratio Alabama Alaska Arizona Arkansas California Colorado Connecticut Delaware Florida Georgia Hawaii Idaho Illinois Indiana Iowa Kansas Kentucky Louisiana Maine Maryland Massachusetts Michigan Minnesota Mississippi Missouri Montana Nebraska Nevada New Hampshire New Jersey New Mexico New York North Carolina North Dakota Ohio Oklahoma Oregon Pennsylvania Rhode Island South Carolina South Dakota Tennessee Texas Utah Vermont Virginia Washington West Virginia Wisconsin Wyoming District of Columbia Puerto Rico 1.6% 0.2% 1.9% 1.0% 12.2% 1.6% 1.0% 4.8% 3.0% 0.4% 0.5% 4.4% 2.2% 1.1% 1.0% 1.5% 1.7% 0.4% 1.6% 2.1% 3.4% 1.7% 1.1% 1.9% 0.6% 0.6% 0.4% 2.5% 0.6% 6.4% 2.9% 3.8% 1.3% 1.2% 4.0% 0.4% 1.5% 2.0% 8.0% 1.2% 0.2% 2.5% 2.0% 0.6% 1.9% 0.2% 1.6% 2.1% 1.9% 1.2% 10.9% 1.5% 0.7% 6.2% 3.3% 0.5% 0.6% 3.8% 1.8% 0.8% 0.9% 1.3% 2.2% 0.6% 2.0% 1.2% 2.8% 1.1% 1.2% 2.1% 0.6% 0.6% 0.8% 0.4% 2.2% 0.9% 5.5% 2.8% 0.2% 3.8% 1.8% 1.3% 4.0% 2.0% 1.8% 9.9% 0.6% 0.2% 3.1% 2.1% 0.9% 1.3% 0.1% 0.8% 1.9% 2.2% 1.0% 10.9% 1.6% 0.7% 0.2% 6.6% 3.2% 0.4% 0.7% 3.7% 2.1% 1.0% 1.1% 1.4% 1.8% 0.5% 1.9% 1.3% 3.0% 1.2% 1.0% 2.3% 0.5% 0.7% 0.7% 0.4% 1.9% 0.8% 5.1% 3.1% 0.2% 4.1% 1.7% 1.5% 3.7% 0.2% 1.7% 1.9% 9.9% 0.7% 0.2% 3.0% 2.4% 0.7% 1.7% 0.1% 0.6% Source: Heritage Foundation calculations based on data from U.S. Department of Defense, Office of the Undersecretary of Defense, October 1998 September 1999 Non-Prior Service (NPS) Enlisted Accessions and January 2003 September 2003 NPS Enlisted Accessions, and U.S. Bureau of the Census, United States Census 2000, Summary File 1, at (July 6, 2005), and Summary File 3, at (July 6, 2005). 14
18 ment of the draft. This sentiment is especially strong among the young. We know that the Pentagon strongly prefers a voluntary force. However, support for a draft will likely surge again if, or when, America suffers additional terrorist attacks. Emotion and reason agree on the necessity of defeating terrorism, but reason demands that the conflict be fought as effectively as possible, and that may require policymakers to resist popular calls for a draft. This paper reviews the demographic status of the all-volunteer military and refutes the claim that enlisted troops are underprivileged and come from underprivileged areas. In terms of education, household income, race, and home origin, the troops are more similar than dissimilar to the general population. Put simply, the current makeup of the all-voluntary military looks like America. Where they are different, the data show that the average soldier is slightly better educated and comes from a slightly wealthier, more rural area. We found that the military (and Army specifically) included a higher proportion of blacks and lower proportions of other minorities but a proportionate number of whites. More important, we found that recruiting was not drawing disproportionately from racially concentrated areas. Perhaps more could be done to dismantle the claim that an all-volunteer military relies disproportionately on ignorant, black, poor, urban young citizens in America, but the evidence already clearly shows this claim to be hollow. Nevertheless, the Army is facing a shortage of new recruits for the recruiting year that ended in September. The shortage is minor about 7,000 less than the goal of 80,000 new recruits in a military with over 1 million members, but it will fuel ongoing calls for a military draft. Policymakers should remember that recruiting was also difficult in 1999 (when the economy was strong), but not so difficult in , in the immediate wake of the 2001 terrorist attacks on the United States. The Department of Defense reported 352,839 applicants for active component enlistment in fiscal year 2003, and it accepted 176, Logically, this suggests that if terrorists strike America again, young Americans will be more not less willing to volunteer for military service. We can also anticipate that successful terrorist attacks will result in a resurgence of popular support for a draft. All Americans hope that day will never come, but if it does, Congress needs to remain steadfast in opposing coerced conscription and expose the myths of racial and class exploitation in military recruiting. Tim Kane, Ph.D., is Bradley Fellow in Labor Policy in the Center for Data Analysis at The Heritage Foundation. The quantitative research effort for this piece was largely the work of Alana Finley, who has the author s heartfelt thanks. Any mistakes in the analysis are entirely the author s. 9. U.S. Department of Defense, Office of the Under Secretary of Defense, Personnel and Readiness, Executive Summary of the 2003 Population Representation in the Military Services Population Representation, at poprep2003 (September 7, 2005). The fiscal year for U.S. military services runs from October through September. The dataset for 2003 used in this analysis includes the 138,914 applicants accepted between January 2003 and September

, by St")
19 Figure 4 CDA Ratio of 1999 Enlisted Recruits to Population (Ages 18-24), by State of Origin Source: Heritage Foundation calculations based on data from U.S. Department of Defense, Office of the Undersecretary of Defense, October 1998 September 1999 Non-Prior Service Enlisted Accessions, and U.S. Bureau of the Census, United States Census 2000, Summary File 3, at (July 6, 2005). Figure 5 CDA Ratio of 2003 Enlisted Recruits to Population (Ages 18-24), by State of Origin Source: Heritage Foundation calculations based on data from U.S. Department of Defense, Office of the Undersecretary of Defense, January 2003 September 2003 Non-Prior Service Enlisted Accessions, and U.S. Bureau of the Census, United States Census 2000, Summary File 3, at (July 6, 2005). 16
20 Technical Appendix THE HERITAGE CENTER FOR DATA ANALYSIS This report was prepared by integrating two different sets of data. The recruitment data were provided by the Office of Accessions in the U.S. Department of Defense (DOD) at the request of The Heritage Foundation. Each recruit studied has a ZIP code for home-of-record, which we matched with U.S. Census 2000 data on that ZIP code. The two sets, and our integration methodology, are further described in this appendix. However, we do not provide analysis on troops serving in Iraq or Afghanistan, or on troop casualties, because those distinctions are not available in the data at our disposal. This study focuses exclusively on the demographics of the volunteers in the enlisted ranks of the military specifically, those accessions who were never previously in the military. DOD RECRUIT DATA The DOD recruit data are divided into two sets: October 1998 September 1999 Non-Prior Service (NPS) Enlisted Accessions and January 2003 September 2003 NPS Enlisted Accessions. The 1999 data have 183,768 recruits, and 2003 data have 138,914 recruits. Each individual recruit record in the data includes hometown ZIP code, race/ethnicity code, and educational code. The data include accessions for the Army, Navy, Marine Corps, and Air Force. Race Data. The 1999 data classify race as one of seven mutually exclusive categories (American Indian or Alaska Native, Asian or Pacific Islander, Black, Hispanic, White, Other, or Unknown). The 2003 data more closely match the 2000 U.S. Census categorization, which allows for any combination of six races (American Indian or Alaska Native, Asian, Native Hawaiian or Other Pacific Islander, Black or African American, White, or Some Other Race). The 2003 data do not include an other classification. The 2003 data also include recruits who declined to respond. In both the 2003 data and the 2000 Census data, a Hispanic indicator is identified separate from race. Invalid Recruit ZIP Codes. For some recruits, the home-of-record ZIP code either is invalid (according to the U.S. Postal Service) or corresponds to an area that is not included in the Census. For example, recognition by the Postal Service but exclusion from the Census could indicate a military ZIP code or a U.S. territory. Puerto Rico is included in both the Census and the recruit data and was included in all analysis done for this paper. Individual records that could not be sorted by ZIP code were not included in our analysis using ZIP codes. To reduce the number of invalid recruit ZIP codes when analyzing educational attainment, only the first three ZIP digits were used. These were matched with three-digit Census ZIP Code Tabulation Areas (ZCTAs). The five-digit ZIP codes/zctas were used for income and regional analysis. After excluding invalid five-digit ZIP codes, the 1999 dataset contains 180,883 recruits, and the 2003 dataset contains 136,462 recruits. When using three-digit ZCTAs, the 1999 dataset contains 183,288 recruits with valid entries, and the 2003 dataset contains 138,627 valid entries. There are 887 three-digit ZCTAs and 33,178 five-digit ZCTAs. 10 CENSUS DATA Data were taken from United States Census 2000, Summary File 1 and Summary File Income analysis used data from Summary File 3, Table P53 (Median Household Income). Educational analysis used data from Summary File 3, Table PCT25 (Sex by Age by Educational Attainment for the Population 18 Years and Over). These tables contain sample data. The Census Bureau does not compile these statistics for the entire population. Race analysis used data from Summary File 1, Table P5 (Race for the Population 18 Years and Over) and Table P6 (Hispanic or Latino, and Not Hispanic or Latino by Race for the Population 18 Years and Over). Regional analysis used data from Summary File 1, Table P2 (Urban and Rural). These tables include information gathered from the entire population. 10. For more information on ZCTAs, see U.S. Bureau of the Census, ZIP Code Tabulation Areas (ZCTAs), July 8, 2005, at (October 18, 2005). 11. U.S. Bureau of the Census, United States Census 2000, Summary File 1, at sumfile1.html (July 6, 2005), and Summary File 3, at (July 6, 2005). 17
Unemployment Rate (%) Rank State. Unemployment
 Rank State. Unemployment") States Ranked by February 2018 Unemployment Rate Seasonally Adjusted Unemployment Unemployment Unemployment 1 Hawaii 2.1 19 Alabama 3.7 33 Ohio 4.5 2 New Hampshire 2.6 19 Missouri 3.7 33 Rhode Island 4.5
States Ranked by February 2018 Unemployment Rate Seasonally Adjusted Unemployment Unemployment Unemployment 1 Hawaii 2.1 19 Alabama 3.7 33 Ohio 4.5 2 New Hampshire 2.6 19 Missouri 3.7 33 Rhode Island 4.5
Unemployment Rate (%) Rank State. Unemployment
 Rank State. Unemployment") States Ranked by November 2015 Unemployment Rate Seasonally Adjusted Unemployment Unemployment Unemployment 1 North Dakota 2.7 19 Indiana 4.4 37 Georgia 5.6 2 Nebraska 2.9 20 Ohio 4.5 37 Tennessee 5.6
States Ranked by November 2015 Unemployment Rate Seasonally Adjusted Unemployment Unemployment Unemployment 1 North Dakota 2.7 19 Indiana 4.4 37 Georgia 5.6 2 Nebraska 2.9 20 Ohio 4.5 37 Tennessee 5.6
Unemployment Rate (%) Rank State. Unemployment
 Rank State. Unemployment") States Ranked by April 2017 Unemployment Rate Seasonally Adjusted Unemployment Unemployment Unemployment 1 Colorado 2.3 17 Virginia 3.8 37 California 4.8 2 Hawaii 2.7 20 Massachusetts 3.9 37 West Virginia
States Ranked by April 2017 Unemployment Rate Seasonally Adjusted Unemployment Unemployment Unemployment 1 Colorado 2.3 17 Virginia 3.8 37 California 4.8 2 Hawaii 2.7 20 Massachusetts 3.9 37 West Virginia
Unemployment Rate (%) Rank State. Unemployment
 Rank State. Unemployment") States Ranked by August 2017 Unemployment Rate Seasonally Adjusted Unemployment Unemployment Unemployment 1 North Dakota 2.3 18 Maryland 3.9 36 New York 4.8 2 Colorado 2.4 18 Michigan 3.9 38 Delaware 4.9
States Ranked by August 2017 Unemployment Rate Seasonally Adjusted Unemployment Unemployment Unemployment 1 North Dakota 2.3 18 Maryland 3.9 36 New York 4.8 2 Colorado 2.4 18 Michigan 3.9 38 Delaware 4.9
Unemployment Rate (%) Rank State. Unemployment
 Rank State. Unemployment") States Ranked by March 2016 Unemployment Rate Seasonally Adjusted Unemployment Unemployment Unemployment 1 South Dakota 2.5 19 Delaware 4.4 37 Georgia 5.5 2 New Hampshire 2.6 19 Massachusetts 4.4 37 North
States Ranked by March 2016 Unemployment Rate Seasonally Adjusted Unemployment Unemployment Unemployment 1 South Dakota 2.5 19 Delaware 4.4 37 Georgia 5.5 2 New Hampshire 2.6 19 Massachusetts 4.4 37 North
Unemployment Rate (%) Rank State. Unemployment
 Rank State. Unemployment") States Ranked by September 2017 Unemployment Rate Seasonally Adjusted Unemployment Unemployment Unemployment 1 North Dakota 2.4 17 Indiana 3.8 36 New Jersey 4.7 2 Colorado 2.5 17 Kansas 3.8 38 Pennsylvania
States Ranked by September 2017 Unemployment Rate Seasonally Adjusted Unemployment Unemployment Unemployment 1 North Dakota 2.4 17 Indiana 3.8 36 New Jersey 4.7 2 Colorado 2.5 17 Kansas 3.8 38 Pennsylvania
Unemployment Rate (%) Rank State. Unemployment
 Rank State. Unemployment") States Ranked by December 2017 Unemployment Rate Seasonally Adjusted Unemployment Unemployment Unemployment 1 Hawaii 2.0 16 South Dakota 3.5 37 Connecticut 4.6 2 New Hampshire 2.6 20 Arkansas 3.7 37 Delaware
States Ranked by December 2017 Unemployment Rate Seasonally Adjusted Unemployment Unemployment Unemployment 1 Hawaii 2.0 16 South Dakota 3.5 37 Connecticut 4.6 2 New Hampshire 2.6 20 Arkansas 3.7 37 Delaware
Unemployment Rate (%) Rank State. Unemployment
 Rank State. Unemployment") States Ranked by September 2015 Unemployment Rate Seasonally Adjusted Unemployment Unemployment Unemployment 1 North Dakota 2.8 17 Oklahoma 4.4 37 South Carolina 5.7 2 Nebraska 2.9 20 Indiana 4.5 37 Tennessee
States Ranked by September 2015 Unemployment Rate Seasonally Adjusted Unemployment Unemployment Unemployment 1 North Dakota 2.8 17 Oklahoma 4.4 37 South Carolina 5.7 2 Nebraska 2.9 20 Indiana 4.5 37 Tennessee
Unemployment Rate (%) Rank State. Unemployment
 Rank State. Unemployment") States Ranked by November 2014 Unemployment Rate Seasonally Adjusted Unemployment Unemployment Unemployment 1 North Dakota 2.7 19 Pennsylvania 5.1 35 New Mexico 6.4 2 Nebraska 3.1 20 Wisconsin 5.2 38 Connecticut
States Ranked by November 2014 Unemployment Rate Seasonally Adjusted Unemployment Unemployment Unemployment 1 North Dakota 2.7 19 Pennsylvania 5.1 35 New Mexico 6.4 2 Nebraska 3.1 20 Wisconsin 5.2 38 Connecticut
Unemployment Rate (%) Rank State. Unemployment
 Rank State. Unemployment") States Ranked by July 2018 Unemployment Rate Seasonally Adjusted Unemployment Unemployment Unemployment 1 Hawaii 2.1 19 Massachusetts 3.6 37 Kentucky 4.3 2 Iowa 2.6 19 South Carolina 3.6 37 Maryland 4.3
States Ranked by July 2018 Unemployment Rate Seasonally Adjusted Unemployment Unemployment Unemployment 1 Hawaii 2.1 19 Massachusetts 3.6 37 Kentucky 4.3 2 Iowa 2.6 19 South Carolina 3.6 37 Maryland 4.3
TABLE 3c: Congressional Districts with Number and Percent of Hispanics* Living in Hard-to-Count (HTC) Census Tracts**
 Census Tracts**") living Alaska 00 47,808 21,213 44.4 Alabama 01 20,661 3,288 15.9 Alabama 02 23,949 6,614 27.6 Alabama 03 20,225 3,247 16.1 Alabama 04 41,412 7,933 19.2 Alabama 05 34,388 11,863 34.5 Alabama 06 34,849 4,074
living Alaska 00 47,808 21,213 44.4 Alabama 01 20,661 3,288 15.9 Alabama 02 23,949 6,614 27.6 Alabama 03 20,225 3,247 16.1 Alabama 04 41,412 7,933 19.2 Alabama 05 34,388 11,863 34.5 Alabama 06 34,849 4,074
 3+ 3+ N = 155, 442 3+ R 2 =.32 < < < 3+ N = 149, 685 3+ R 2 =.27 < < < 3+ N = 99, 752 3+ R 2 =.4 < < < 3+ N = 98, 887 3+ R 2 =.6 < < < 3+ N = 52, 624 3+ R 2 =.28 < < < 3+ N = 36, 281 3+ R 2 =.5 < < < 7+
How North Carolina Compares
 How North Carolina Compares A Compendium of State Statistics March 2017 Prepared by the N.C. General Assembly Program Evaluation Division Preface The Program Evaluation Division of the North Carolina General
TABLE 3b: Congressional Districts Ranked by Percent of Hispanics* Living in Hard-to- Count (HTC) Census Tracts**
 Census Tracts**") Rank State District Count (HTC) 1 New York 05 150,499 141,567 94.1 2 New York 08 133,453 109,629 82.1 3 Massachusetts 07 158,518 120,827 76.2 4 Michigan 13 47,921 36,145 75.4 5 Illinois 04 508,677 379,527
Rank State District Count (HTC) 1 New York 05 150,499 141,567 94.1 2 New York 08 133,453 109,629 82.1 3 Massachusetts 07 158,518 120,827 76.2 4 Michigan 13 47,921 36,145 75.4 5 Illinois 04 508,677 379,527
How North Carolina Compares
 How North Carolina Compares A Compendium of State Statistics January 2013 Prepared by the N.C. General Assembly Program Evaluation Division Program Evaluation Division North Carolina General Assembly Legislative
Annex A: State Level Analysis: Selection of Indicators, Frontier Estimation, Setting of Xmin, Xp, and Yp Values, and Data Sources
 Annex A: State Level Analysis: Selection of Indicators, Frontier Estimation, Setting of Xmin, Xp, and Yp Values, and Data Sources Right to Food: Whereas in the international assessment the percentage of
2015 State Hospice Report 2013 Medicare Information 1/1/15
 2015 State Hospice Report 2013 Medicare Information 1/1/15 www.hospiceanalytics.com 2 2013 Demographics & Hospice Utilization National Population 316,022,508 Total Deaths 2,529,792 Medicare Beneficiaries
Introduction. Current Law Distribution of Funds. MEMORANDUM May 8, Subject:
 MEMORANDUM May 8, 2018 Subject: TANF Family Assistance Grant Allocations Under the Ways and Means Committee (Majority) Proposal From: Gene Falk, Specialist in Social Policy, gfalk@crs.loc.gov, 7-7344 Jameson
STATE ENTREPRENEURSHIP INDEX
 University of Nebraska - Lincoln DigitalCommons@University of Nebraska - Lincoln Business in Nebraska Bureau of Business Research 12-2013 STATE ENTREPRENEURSHIP INDEX Eric Thompson University of Nebraska-Lincoln,
Current Medicare Advantage Enrollment Penetration: State and County-Level Tabulations
 Current Advantage Enrollment : State and County-Level Tabulations 5 Slide Series, Volume 40 September 2016 Summary of Tabulations and Findings As of September 2016, 17.9 million of the nation s 56.1 million
Salary and Demographic Survey Results
 Salary and Demographic Survey Results Executive Summary In July of 2010, Grant Professionals Association (GPA formerly AAGP) conducted a salary and demographic survey of grant professionals. The survey
FY 2014 Per Capita Federal Spending on Major Grant Programs Curtis Smith, Nick Jacobs, and Trinity Tomsic
 Special Analysis 15-03, June 18, 2015 FY 2014 Per Capita Federal Spending on Major Grant Programs Curtis Smith, Nick Jacobs, and Trinity Tomsic 202-624-8577 ttomsic@ffis.org Summary Per capita federal
The American Legion NATIONAL MEMBERSHIP RECORD
 The American Legion NATIONAL MEMBERSHIP RECORD www.legion.org 2016 The American Legion NATIONAL MEMBERSHIP RECORD 1920-1929 Department 1920 1921 1922 1923 1924 1925 1926 1927 1928 1929 Alabama 4,474 3,246
THE STATE OF GRANTSEEKING FACT SHEET
 1 THE STATE OF GRANTSEEKING FACT SHEET ORG ANIZATIONAL COMPARISO N BY C ENSUS DIV ISION S PRING 2013 The State of Grantseeking Spring 2013 is the sixth semi-annual informal survey of nonprofits conducted
Interstate Pay Differential
 Interstate Pay Differential APPENDIX IV Adjustments for differences in interstate pay in various locations are computed using the state average weekly pay. This appendix provides a table for the second
Weights and Measures Training Registration
 Weights and Measures Training Registration Please fill out the form below to register for Weights and Measures training and testing dates. NIST Handbook 44, Specifications, Tolerances and other Technical
Percentage of Enrolled Students by Program Type, 2016
 Percentage of Enrolled Students by Program Type, 2016 Doctorate 4% PN/VN 3% MSN 15% ADN 28% BSRN 22% Diploma 2% BSN 26% n = 279,770 Percentage of Graduations by Program Type, 2016 MSN 12% Doctorate 1%
Salary and Demographic Survey Results
 Salary and Demographic Survey Results Executive Summary In April of 2013, GPA conducted a salary and demographic survey of grant professionals. The survey was distributed to all active GPA members and
Rankings of the States 2017 and Estimates of School Statistics 2018
 Rankings of the States 2017 and Estimates of School Statistics 2018 NEA RESEARCH April 2018 Reproduction: No part of this report may be reproduced in any form without permission from NEA Research, except
 Page 1 of 11 NOAA Technical Memorandum NWS SR-193, Section 4 Section 4 Table of Contents: 4. Variations by State Weighted by Population A. Death and Injury (Casualty) Rate per Population B. Death Rate
Sentinel Event Data. General Information Copyright, The Joint Commission
 Sentinel Event Data General Information 1995 2015 Data Limitations The reporting of most sentinel events to The Joint Commission is voluntary and represents only a small proportion of actual events. Therefore,
YOUTH MENTAL HEALTH IS WORSENING AND ACCESS TO CARE IS LIMITED THERE IS A SHORTAGE OF PROVIDERS HEALTHCARE REFORM IS HELPING
 2 3 4 MENTAL HEALTH AND SUBSTANCE USE CONDITIONS ARE COMMON MOST AMERICANS LACK ACCESS TO CARE OF AMERICAN ADULTS WITH A MENTAL ILLNESS DID NOT RECEIVE TREATMENT ONE IN FIVE REPORT AN UNMET NEED NEARLY
Sentinel Event Data. General Information Q Copyright, The Joint Commission
 Sentinel Event Data General Information 1995 2Q 2014 Data Limitations The reporting of most sentinel events to The Joint Commission is voluntary and represents only a small proportion of actual events.
REGIONAL AND STATE EMPLOYMENT AND UNEMPLOYMENT JUNE 2010
 For release 10:00 a.m. (EDT) Tuesday, July 20, USDL-10-0992 Technical information: Employment: Unemployment: Media contact: (202) 691-6559 sminfo@bls.gov www.bls.gov/sae (202) 691-6392 lausinfo@bls.gov
Index of religiosity, by state
 Index of religiosity, by state Low Medium High Total United States 19 26 55=100 Alabama 7 16 77 Alaska 28 27 45 Arizona 21 26 53 Arkansas 12 19 70 California 24 27 49 Colorado 24 29 47 Connecticut 25 32
2016 INCOME EARNED BY STATE INFORMATION
 BY STATE INFORMATION This information is being provided to assist in your 2016 tax preparations. The information is also mailed to applicable Columbia fund non-corporate shareholders with their year-end
Child & Adult Care Food Program: Participation Trends 2017
 Child & Adult Care Food Program: Participation Trends 2017 February 2018 About FRAC The Food Research and Action Center (FRAC) is the leading national organization working for more effective public and
2014 ACEP URGENT CARE POLL RESULTS
 2014 ACEP URGENT CARE POLL RESULTS PREPARED FOR: PREPARED BY: 2014 Marketing General Incorporated 625 North Washington Street, Suite 450 Alexandria, VA 22314 800.644.6646 toll free 703.739.1000 telephone
REGIONAL AND STATE EMPLOYMENT AND UNEMPLOYMENT MAY 2013
 For release 10:00 a.m. (EDT) Friday, June 21, USDL-13-1180 Technical information: Employment: Unemployment: Media contact: (202) 691-6559 sminfo@bls.gov www.bls.gov/sae (202) 691-6392 lausinfo@bls.gov
TENNESSEE TEXAS UTAH VERMONT VIRGINIA WASHINGTON WEST VIRGINIA WISCONSIN WYOMING ALABAMA ALASKA ARIZONA ARKANSAS
 ALABAMA ALASKA ARIZONA ARKANSAS CALIFORNIA COLORADO CONNECTICUT DELAWARE DISTRICT OF COLUMBIA FLORIDA GEORGIA GUAM MISSOURI MONTANA NEBRASKA NEVADA NEW HAMPSHIRE NEW JERSEY NEW MEXICO NEW YORK NORTH CAROLINA
Center for Data Analysis
 CDA Center for Data Analysis Who Serves in the U.S. Military? Demographic Characteristics of Enlisted Troops and Officers Shanea J. Watkins, Ph.D., and James Sherk CDA08-05 August 21, 2008 Enlisted Are
Fiscal Research Center
 January 2018 Georgia s Rankings Among the States: Budget, Taxes and Other Indicators ABOUT THE FISCAL RESEARCH CENTER Established in 1995, the (FRC) provides nonpartisan research, technical assistance
PRESS RELEASE Media Contact: Joseph Stefko, Director of Public Finance, ;
 PRESS RELEASE Media Contact: Joseph Stefko, Director of Public Finance, 585.327.7075; jstefko@cgr.org Highest Paid State Workers in New Jersey & New York in 2010; Lowest Paid in Dakotas and West Virginia
Students Experiencing Homelessness in Washington s K-12 Public Schools Trends, Characteristics and Academic Outcomes.
 Students Experiencing Homelessness in Washington s K-12 Public Schools 2016-17 Trends, Characteristics and Academic Outcomes October 2018 Building Changes thanks the Washington State Office of Superintendent
Washburn University. Faculty Salary Analysis
 Washburn University Faculty Salary Analysis 2012-13 Office of Institutional Research Washburn University May 15, 2013 Washburn University Faculty Salary Analysis 2012-13 This report provides an overview
Fiscal Research Center
 January 2016 Georgia s Rankings Among the States: Budget, Taxes and Other Indicators ABOUT THE FISCAL RESEARCH CENTER Established in 1995, the (FRC) provides nonpartisan research, technical assistance
Nielsen ICD-9. Healthcare Data
 Nielsen ICD-9 Healthcare Data Healthcare Utilization Model The Nielsen healthcare utilization model has three primary components: demographic cohort population counts, cohort-specific healthcare utilization
Child & Adult Care Food Program: Participation Trends 2016
 Child & Adult Care Food Program: Participation Trends 2016 March 2017 About FRAC The Food Research and Action Center (FRAC) is the leading national organization working for more effective public and private
Salary and Demographic Survey Results
 Salary and Demographic Survey Results Executive Summary In May of 2011, GPA conducted a salary and demographic survey of grant professionals. The survey was distributed to all 1,683 active GPA members
How. January. Prepared by
 How North Carolina Compares A Compendium of State Statisticss January 2011 Prepared by the N.C. General Assembly Program Evaluation Division Prefacee The Program Evaluation Division of the North Carolina
Child & Adult Care Food Program: Participation Trends 2014
 Child & Adult Care Food Program: Participation Trends 2014 1200 18th St NW Suite 400 Washington, DC 20036 (202) 986-2200 / www.frac.org February 2016 About FRAC The Food Research and Action Center (FRAC)
Estimated Economic Impacts of the Small Business Jobs and Tax Relief Act National Report
 Regional Economic Models, Inc. Estimated Economic Impacts of the Small Business Jobs and Tax Relief Act National Report Prepared by Frederick Treyz, CEO June 2012 The following is a summary of the Estimated
States Ranked by Annual Nonagricultural Employment Change October 2017, Seasonally Adjusted
 States Ranked by Annual Nonagricultural Employment Change Change (Jobs) Change (Jobs) Change (Jobs) 1 Texas 316,100 19 Nevada 36,600 37 Hawaii 7,100 2 California 256,800 20 Tennessee 34,800 38 Mississippi
Rutgers Revenue Sources
 Rutgers Revenue Sources 31.2% Tuition and Fees 27.3% State Appropriations with Fringes 1.0% Endowment and Investments.5% Federal Appropriations 17.8% Federal, State, and Municipal Grants and Contracts
Table 1 Elementary and Secondary Education. (in millions)
") Revised February 22, 2005 WHERE WOULD THE CUTS BE MADE UNDER THE PRESIDENT S BUDGET? Data Table 1 Elementary and Secondary Education Includes Education for the Disadvantaged, Impact Aid, School Improvement
Revised February 22, 2005 WHERE WOULD THE CUTS BE MADE UNDER THE PRESIDENT S BUDGET? Data Table 1 Elementary and Secondary Education Includes Education for the Disadvantaged, Impact Aid, School Improvement
NAFCC Accreditation Annual Update
 NAFCC Accreditation Annual Update 1st year 2nd year First MI Last Co-provider (if applicable) Address on License, Registration or Certificate Phone Fax Mailing Address Email City State Zip County Country
USDA Farm to School Program FY 2013 FY 2017 Summary of Grant Awards
 USDA Farm to School Program FY 2013 FY 2017 Summary of Grant Awards ABOUT THIS REPORT This report summarizes findings from an analysis of select data from the 365 farm to school projects funded by USDA
5 x 7 Notecards $1.50 with Envelopes - MOQ - 12
 5 x 7 Notecards $1.50 with Envelopes - MOQ - 12 Magnets 2½ 3½ Magnet $1.75 - MOQ - 5 - Add $0.25 for packaging Die Cut Acrylic Magnet $2.00 - MOQ - 24 - Add $0.25 for packaging 2535-22225 California AM-22225
Acm762 AG U.S. VITAL STATISTICS BY SECTION, 2017 Page 1
 Acm762 AG U.S. VITAL STATISTICS BY SECTION, 2017 Page 1 District Summary Major Worship Total Total -------------------- Adherents -------------------- Service District Churches Membership Boys Girls Men
Fiscal Research Center
 January 2017 Georgia s Rankings Among the States: Budget, Taxes and Other Indicators ABOUT THE FISCAL RESEARCH CENTER Established in 1995, the (FRC) provides nonpartisan research, technical assistance
November 24, First Street NE, Suite 510 Washington, DC 20002
 820 First Street NE, Suite 510 Washington, DC 20002 Tel: 202-408-1080 Fax: 202-408-1056 center@cbpp.org www.cbpp.org November 24, 2008 TANF BENEFITS ARE LOW AND HAVE NOT KEPT PACE WITH INFLATION But Most
MAP 1: Seriously Delinquent Rate by State for Q3, 2008
 MAP 1: Seriously Delinquent Rate by State for Q3, 2008 Seriously Delinquent Rate Greater than 6.93% 5.18% 6.93% 0 5.17% Source: MBA s National Deliquency Survey MAP 2: Foreclosure Inventory Rate by State
Voter Registration and Absentee Ballot Deadlines by State 2018 General Election: Tuesday, November 6. Saturday, Oct 27 (postal ballot)
") Voter Registration and Absentee Ballot Deadlines by State 2018 General Election: All dates in 2018 unless otherwise noted STATE REG DEADLINE ABSENTEE BALLOT REQUEST DEADLINE Alabama November 1 ABSENTEE
Voter Registration and Absentee Ballot Deadlines by State 2018 General Election: All dates in 2018 unless otherwise noted STATE REG DEADLINE ABSENTEE BALLOT REQUEST DEADLINE Alabama November 1 ABSENTEE
Nicole Galloway, CPA
 Office of State Auditor Nicole Galloway, CPA Statewide Performance Indicators: A National Comparison Report No. 2017-050 June 2017 auditor.mo.gov Statewide Performance Indicators: A National Comparison
National Study of Nonprofit-Government Contracts and Grants 2013: State Profiles
 www.urban.org Study of Nonprofit-Government Contracts and Grants 2013: State Profiles Sarah L. Pettijohn, Elizabeth T. Boris, and Maura R. Farrell Data presented for each state: Problems with Government
Date: 5/25/2012. To: Chuck Wyatt, DCR, Virginia. From: Christos Siderelis
 1 Date: 5/25/2012 To: Chuck Wyatt, DCR, Virginia From: Christos Siderelis Chuck Wyatt with the DCR in Virginia inquired about the classification of state parks having resort type characteristics and, if
Dashboard. Campaign for Action. Welcome to the Future of Nursing:
 Welcome to the Future of Nursing: Campaign for Action Dashboard About This Dashboard: These graphs and charts show goals by which the Campaign evaluates its efforts to implement recommendations in the
Acm769 AG U.S. WATER BAPTISMS, 2017¹ Page 1
 Acm769 AG U.S. WATER BAPTISMS, 2017¹ Page 1 Baptisms Baptisms Pct Baptisms Pct Baptisms Pct Alabama 2,552 2,944-392 -13.3 3,146-594 -18.9 2,501 51 2.0 Alaska 511 392 119 30.4 443 68 15.3 505 6 1.2 Appalachian
Percent of Population Under Age 65 Uninsured, 2013, 2014, and 2015
 Exhiit 1 Percent of Population Under Age 65 Uninsured, 13, 14, and 15 13 14 15
N A S S G A P Academic Year. 43rd Annual Survey Report on State-Sponsored Student Financial Aid
 N A S 43rd Annual Survey Report on State-Sponsored Student Financial Aid 2011-2012 Academic Year National Association of State Student Grant and Aid Programs S G A P About NASSGAP and this Report The National
Is this consistent with other jurisdictions or do you allow some mechanism to reinstate?
 Topic: Question by: : Forfeiture for failure to appoint a resident agent Kathy M. Sachs Kansas Date: January 8, 2015 Manitoba Corporations Canada Alabama Alaska Arizona Arkansas California Colorado Connecticut
Arizona State Funding Project: Addressing the Teacher Labor Market Challenge Executive Summary. Research conducted by Education Resource Strategies
 Arizona State Funding Project: Addressing the Teacher Labor Market Challenge Executive Summary Research conducted by Education Resource Strategies Key findings 1. Student outcomes in Arizona lag behind
Table 8 Online and Telephone Medicaid Applications for Children, Pregnant Women, Parents, and Expansion Adults, January 2017
 Table 8 Online and Telephone Medicaid Applications for Children, Pregnant Women, Parents, and Expansion Adults, January 2017 State Applications Can be Submitted Online at the State Level 1 < 25% 25% -
Senior American Access to Care Grant
 Senior American Access to Care Grant Grant Guidelines SENIOR AMERICAN (age 62 plus) ACCESS TO CARE GRANT GUIDELINES: The (ADAF) is committed to supporting U.S. based organizations exempt from taxation
ACEP EMERGENCY DEPARTMENT VIOLENCE POLL RESEARCH RESULTS
 ACEP EMERGENCY DEPARTMENT VIOLENCE POLL RESEARCH RESULTS Prepared For: American College of Emergency Physicians September 2018 2018 Marketing General Incorporated 625 North Washington Street, Suite 450
EXHIBIT A. List of Public Entities Participating in FEDES Project
 EXHIBIT A List of Public Entities Participating in FEDES Project Alabama Alabama Department of Economic and Community Affairs Alabama Department of Industrial Relations Alaska Department of Labor and Workforce
2001 AAPA Physician Assistant Census Report 1. Respondents % Male % Female %
 1 Section I. Personal Characteristics of Respondents* Table 1. Distribution of Respondents by Sex Respondents... 19786 100.0% Male... 8603 43.5% Female... 11183 56.5% Table 2. Distribution of Respondents
Appendix A: Carnegie 2010 Classifications and SHEEO Groupings 2010 Carnegie Classification
 Appendix A: Carnegie 2010 Classifications and SHEEO Groupings 2010 Carnegie Classification SHEEO Code Description Sector Groupings 0 (Not classified Not Classified 1 Assoc/Pub-R-S: Associate's--Public
Department of Defense INSTRUCTION
 Department of Defense INSTRUCTION NUMBER 4715.02 August 28, 2009 Incorporating Change 2, August 31, 2018 USD(A&S) SUBJECT: Regional Environmental Coordination References: (a) DoD Instruction 4715.2, DoD
NMLS Mortgage Industry Report 2017Q4 Update
 NMLS Mortgage Industry Report 2017Q4 Update Released March 9, 2018 Conference of State Bank Supervisors 1129 20 th Street, NW, 9 th Floor Washington, D.C. 20036-4307 NMLS Mortgage Industry Report: 2017Q4
The Job Market Experiences of Gulf War II Era Veterans
 The Job Market Experiences of Gulf War II Era Veterans Paul E. Harrington Center for Labor Markets and Policy Drexel University Jan 2001 May 2001 Sep 2001 Jan 2002 May 2002 Sep 2002 Jan 2003 May 2003 Sep
CRMRI White Paper #3 August 2017 State Refugee Services Indicators of Integration: How are the states doing?
 CRMRI White Paper #3 August 7 State Refugee Services Indicators of Integration: How are the states doing? Marci Harris, Julia Greene, Kilee Jorgensen, Caren J. Frost, & Lisa H. Gren State Refugee Services
national assembly of state arts agencies
 STATE ARTS AGENCY GRANT MAKING AND FUNDING Each of America's 50 states and six jurisdictions has a government that works to make the cultural, civic, economic and educational benefits of the available
Weatherization Assistance Program PY 2013 Funding Survey
 Weatherization Assistance Program PY 2013 Summary Summary............................................................................................... 1 Background............................................................................................
1998 AAPA Census Report
 Section I. General Information about Respondents Table 1. Distribution of Respondents by Sex Respondents... 15716 100.0% Male... 7413 47.2% Female... 8303 52.8% Table 2. Distribution of Respondents by
Table of Contents Introduction... 2
 Snapshot Missouri: A National Comparison Report 9-212 Table of Contents Introduction... 2 Economy 3 Median Household Income 21... 4 Unemployment Rate 211... 5 Job Growth Rate 29.. 6 Cigarette Tax per Pack
Vision Problems in the U.S. Prevalence of Adult Vision Impairment and Age-Related Eye Disease in America Update to the Fourth Edition
 Vision Problems in the U.S. Prevalence of Adult Vision Impairment and Age-Related Eye Disease in America 2008 Update to the Fourth Edition Founded in 1908, Prevent Blindness America is the nation's leading
NMLS Mortgage Industry Report 2016 Q1 Update
 NMLS Mortgage Industry Report 2016 Q1 Update Released June 10, 2016 Conference of State Bank Supervisors 1129 20 th Street, NW, 9 th Floor Washington, D.C. 20036-4307 NMLS Mortgage Industry Report: 2016Q1
Statutory change to name availability standard. Jurisdiction. Date: April 8, [Statutory change to name availability standard] [April 8, 2015]
![Statutory change to name availability standard. Jurisdiction. Date: April 8, [Statutory change to name availability standard] [April 8, 2015]](/thumbs/83/87461560.jpg "Statutory change to name availability standard. Jurisdiction. Date: April 8, [Statutory change to name availability standard] [April 8, 2015]") Topic: Question by: : Statutory change to name availability standard Michael Powell Texas Date: April 8, 2015 Manitoba Corporations Canada Alabama Alaska Arizona Arkansas California Colorado Connecticut
Topic: Question by: : Statutory change to name availability standard Michael Powell Texas Date: April 8, 2015 Manitoba Corporations Canada Alabama Alaska Arizona Arkansas California Colorado Connecticut
Fiscal Year 1999 Comparisons. State by State Rankings of Revenues and Spending. Includes Fiscal Year 2000 Rankings for State Taxes Only
 Fiscal Year 1999 Comparisons State by State Rankings of Revenues and Spending Includes Fiscal Year 2000 Rankings for State Taxes Only January 2002 1 2 published annually by: The Minnesota Taxpayers Association
Grants 101: An Introduction to Federal Grants for State and Local Governments
 Grants 101: An Introduction to Federal Grants for State and Local Governments Introduction FFIS has been in the federal grant reporting business for a long time about 30 years. The main thing we ve learned
STATE INDUSTRY ASSOCIATIONS $ - LISTED NEXT PAGE. TOTAL $ 88,000 * for each contribution of $500 for Board Meeting sponsorship
 Exhibit D -- TRIP 2017 FUNDING SOURCES -- February 3, 2017 CORPORATE $ 12,000 Construction Companies $ 5,500 Consulting Engineers Equipment Distributors Manufacturer/Supplier/Producer 6,500 Surety Bond
Food Stamp Program State Options Report
 United States Department of Agriculture Food and Nutrition Service Fourth Edition Food Stamp Program State s Report September 2004 vember 2002 Program Development Division Program Design Branch Food Stamp
NMLS Mortgage Industry Report 2017Q2 Update
 NMLS Mortgage Industry Report 2017Q2 Update Released September 18, 2017 Conference of State Bank Supervisors 1129 20 th Street, NW, 9 th Floor Washington, D.C. 20036-4307 NMLS Mortgage Industry Report:
GROWING THE MIDDLE: SECURING THE FUTURE LOS ANGELES
 GROWING THE MIDDLE: SECURING THE FUTURE LOS ANGELES 02.21.18 MANUEL PASTOR @Prof_MPastor THE WIDENING GAP 1 THE WIDENING GAP INEQUALITY: HOW CALIFORNIA RANKS Household* Gini Coefficient, 1969 Mississippi
NMLS Mortgage Industry Report 2018Q1 Update
 NMLS Mortgage Industry Report 2018Q1 Update Released July 5, 2018 Conference of State Bank Supervisors 1129 20 th Street, NW, 9 th Floor Washington, D.C. 20036-4307 NMLS Mortgage Industry Report: 2018Q1
Colorado River Basin. Source: U.S. Department of the Interior, Bureau of Reclamation
 The Colorado River supports a quarter million jobs and produces $26 billion in economic output from recreational activities alone, drawing revenue from the 5.36 million adults who use the Colorado River
National Collegiate Soils Contest Rules
 National Collegiate Soils Contest Rules Students of Agronomy, Soils, and Environmental Sciences (SASES) Revised September 30, 2008 I. NAME The contest shall be known as the National Collegiate Soils Contest
HOME HEALTH AIDE TRAINING REQUIREMENTS, DECEMBER 2016
 BACKGROUND HOME HEALTH AIDE TRAINING REQUIREMENTS, DECEMBER 2016 Federal legislation (42 CFR 484.36) requires that Medicare-certified home health agencies employ home health aides who are trained and evaluated
VOLUME 35 ISSUE 6 MARCH 2017
 VOLUME 35 ISSUE 6 MARCH 2017 IN THIS ISSUE Index of State Economic Momentum The Index of State Economic Momentum, developed by Reports founding editor Hal Hovey, ranks states based on their most recent