YOUTH MENTAL HEALTH IS WORSENING AND ACCESS TO CARE IS LIMITED THERE IS A SHORTAGE OF PROVIDERS HEALTHCARE REFORM IS HELPING
|
|
|
- Grace Haynes
- 6 years ago
- Views:
Transcription


1


2 2
3 3
4 4
5 MENTAL HEALTH AND SUBSTANCE USE CONDITIONS ARE COMMON MOST AMERICANS LACK ACCESS TO CARE OF AMERICAN ADULTS WITH A MENTAL ILLNESS DID NOT RECEIVE TREATMENT ONE IN FIVE REPORT AN UNMET NEED NEARLY HALF HAVE A CO-OCCURRING SUBSTANCE ABUSE DISORDER YOUTH MENTAL HEALTH IS WORSENING AND ACCESS TO CARE IS LIMITED THERE IS A SHORTAGE OF PROVIDERS IN ALABAMA, THERE S ONLY ONE MENTAL HEALTH PROFESSIONAL PER 1,260 PEOPLE HEALTHCARE REFORM IS HELPING 5 T H E S T A T E O F M E N T A L H E A L T H I N A M E R I C A 20 18
6 6
7 7
8 8
9 Massachusetts South Dakota Minnesota Vermont Connecticut Iowa North Dakota Maine Hawaii New Jersey Illinois Maryland New York Delaware District of Columbia Pennsylvania Michigan Nebraska Kansas Ohio New Mexico Kentucky Rhode Island California Wisconsin Georgia Montana Alaska New Hampshire Missouri Wyoming North Carolina Florida Washington Arkansas Oklahoma Utah Louisiana Texas Virginia Alabama West Virginia Colorado Oregon South Carolina Tennessee Idaho Indiana Arizona Mississippi Nevada


10 Rank State 1 Massachusetts 2 Iowa 3 Hawaii 4 North Dakota 5 South Dakota 6 Maine 7 Minnesota 8 Illinois 9 New Jersey 10 Connecticut 11 Wisconsin 12 Delaware 13 New York 14 Maryland 15 California 16 Pennsylvania 17 Vermont 18 Texas 19 Michigan 20 Rhode Island 21 Nebraska 22 Kansas 23 Virginia 24 Florida 25 New Mexico 26 Arkansas 27 Alabama 28 Ohio 29 Georgia 30 Wyoming 31 West Virginia 32 Kentucky 33 District of Columbia 34 Montana 35 Oklahoma 36 Missouri 37 North Carolina 38 Washington 39 South Carolina 40 Colorado 41 Louisiana 42 Arizona 43 Mississippi 44 Tennessee 45 Idaho 46 New Hampshire 47 Indiana 48 Oregon 49 Alaska 50 Nevada 51 Utah 10


11 Rank State 1 South Dakota 2 Vermont 3 Minnesota 4 Massachusetts 5 Connecticut 6 North Dakota 7 District of Columbia 8 Iowa 9 New Jersey 10 Pennsylvania 11 Ohio 12 Maine 13 Illinois 14 Maryland 15 Kentucky 16 Alaska 17 Michigan 18 New York 19 Kansas 20 Georgia 21 Nebraska 22 New Hampshire 23 Delaware 24 Utah 25 New Mexico 26 Montana 27 Hawaii 28 Alabama 29 North Carolina 30 Missouri 31 Louisiana 32 Tennessee 33 Rhode Island 34 West Virginia 35 Washington 36 Wyoming 37 Florida 38 Indiana 39 California 40 Idaho 41 Oregon 42 South Carolina 43 Wisconsin 44 Texas 45 Oklahoma 46 Arkansas 47 Virginia 48 Colorado 49 Mississippi 50 Arizona 51 Nevada 11


12 Rank State 1 South Dakota 2 Hawaii 3 Georgia 4 North Dakota 5 Texas 6 New Jersey 7 South Carolina 8 Alabama 9 Illinois 10 Florida 11 Mississippi 12 Iowa 13 Kansas 14 Louisiana 15 Maryland 16 Tennessee 17 Missouri 18 Connecticut 19 District of Columbia 20 Nebraska 21 Pennsylvania 22 New York 23 Michigan 24 California 25 Oklahoma 26 Minnesota 27 Arkansas 28 Virginia 29 Delaware 30 North Carolina 31 New Mexico 32 Kentucky 33 Massachusetts 34 Montana 35 Wyoming 36 Ohio 37 Utah 38 West Virginia 39 Idaho 40 Maine 41 Washington 42 Wisconsin 43 Nevada 44 Alaska 45 Arizona 46 Vermont 47 Indiana 48 Rhode Island 49 Colorado 50 New Hampshire 51 Oregon 12


13 Rank State 1 Vermont 2 Massachusetts 3 Minnesota 4 Maine 5 Connecticut 6 Rhode Island 7 New Hampshire 8 South Dakota 9 Iowa 10 Delaware 11 New York 12 Oregon 13 Wisconsin 14 Ohio 15 North Dakota 16 Michigan 17 Colorado 18 Pennsylvania 19 Maryland 20 Alaska 21 District of Columbia 22 Illinois 23 New Mexico 24 Hawaii 25 Kentucky 26 New Jersey 27 Nebraska 28 Washington 29 Montana 30 California 31 Wyoming 32 Kansas 33 Indiana 34 Utah 35 West Virginia 36 North Carolina 37 Idaho 38 Arkansas 39 Arizona 40 Missouri 41 Oklahoma 42 Virginia 43 Georgia 44 Florida 45 Louisiana 46 Tennessee 47 Nevada 48 Alabama 49 Texas 50 South Carolina 51 Mississippi 13


14 Rank State % # 1 Hawaii ,000 2 Texas ,127,000 3 Illinois ,570,000 4 New Jersey ,107,000 5 Maryland ,000 6 Florida ,630,000 7 North Dakota ,000 8 California ,997,000 9 Iowa , New York ,638, Connecticut , Georgia ,299, Kansas , South Carolina , South Dakota , Nevada , District of Columbia , Mississippi , Missouri , Arkansas , Michigan ,373, Alaska , Nebraska , Pennsylvania ,803, Arizona , Louisiana ,000 Rank State % # 27 Delaware , Wisconsin , Minnesota , Alabama , Massachusetts ,008, Maine , Oklahoma , Virginia ,203, North Carolina ,459, Wyoming , Colorado , Washington ,062, Tennessee , New Mexico , Montana , Ohio ,778, Vermont , Idaho , Utah , Rhode Island , Indiana ,014, West Virginia , Kentucky , Oregon , New Hampshire ,000 National ,486,000 14


15 Rank State Weighted Sum of Z scores Adult Alcohol Dependence and Marijuana, Heroin, Cocaine Use 1 Mississippi Utah Iowa Arkansas Alabama Kansas Texas North Dakota Tennessee Oklahoma Idaho Missouri Georgia West Virginia South Dakota Virginia Nebraska Florida North Carolina Hawaii Michigan Wyoming Wisconsin Minnesota South Carolina Indiana Rank State Weighted Sum of Z scores Adult Alcohol Dependence and Marijuana, Heroin, Cocaine Use 27 Illinois Nevada Ohio New Jersey Kentucky Louisiana Montana Pennsylvania Washington Maine California Maryland New Mexico Massachusetts Delaware Arizona New York Oregon Rhode Island Connecticut New Hampshire Colorado Vermont Alaska District of Columbia National


16 Rank State % 1 Maine Alabama Utah Arkansas Tennessee Mississippi New Jersey Kansas Florida Iowa Georgia Washington Michigan Missouri West Virginia Hawaii Texas Delaware Minnesota North Carolina Illinois Kentucky Oklahoma Wisconsin North Dakota South Carolina 3.09 Rank State % 27 Virginia Maryland Idaho Massachusetts Pennsylvania Nevada Ohio Connecticut Indiana Nebraska South Dakota New York Wyoming Montana California Rhode Island New Hampshire Oregon Louisiana Arizona Vermont Alaska Colorado District of Columbia New Mexico National


17 Rank State % 1 Mississippi Iowa Utah Alabama North Dakota Texas Wyoming South Dakota Nebraska West Virginia Tennessee Idaho Oklahoma Louisiana Arkansas Virginia New Jersey North Carolina Wisconsin Ohio Kentucky Kansas Pennsylvania Florida Illinois South Carolina Rank State % 27 Hawaii Georgia Minnesota Nevada Delaware Arizona Missouri Indiana New Mexico Maryland Michigan New York California Montana Connecticut New Hampshire Washington Massachusetts Rhode Island Oregon Maine Vermont Alaska Colorado District of Columbia National


18 .12% 1.36% Rank State % 1 Texas Iowa Kansas Mississippi Georgia Louisiana Arkansas Montana New Mexico California North Carolina North Dakota Nebraska Oklahoma Hawaii Florida Utah Massachusetts Missouri Tennessee South Dakota Alabama Idaho South Carolina Indiana Idaho 0.92 Rank State % 27 Nevada Illinois Oregon Minnesota West Virginia Virginia Wyoming Michigan Ohio Colorado Washington Rhode Island New York Kentucky Pennsylvania Arizona Maine District of Columbia New Hampshire New Jersey Vermont Connecticut Maryland Delaware Alaska 1.36 National.35 18


19 .94% 3.35% Rank State % 1 Utah Mississippi South Dakota Idaho Iowa Wyoming Arkansas Oklahoma North Dakota Kansas Alabama Virginia Indiana Michigan Missouri Nebraska Texas Nevada Ohio Montana Maryland Minnesota Tennessee West Virginia Wisconsin Kentucky 1.69 Rank State % 27 Pennsylvania South Carolina New Jersey Georgia Louisiana Maine North Carolina Illinois Washington Hawaii Florida New Mexico Alaska Oregon California Delaware Arizona Connecticut Massachusetts Rhode Island New York Vermont Colorado New Hampshire District of Columbia 3.35 National


20 Rank State % # 1 Texas ,000 2 Connecticut ,000 3 Florida ,000 4 Maryland ,000 5 South Dakota ,000 6 South Carolina ,000 7 New Jersey ,000 8 California ,115,000 9 New York , Hawaii , Massachusetts , Illinois , Missouri , Iowa , Virginia , North Dakota , Oklahoma , Alabama , Delaware , Georgia , Minnesota , New Mexico , Maine , Pennsylvania , Mississippi , Wyoming ,000 Rank State % # 27 Kansas , Michigan , Indiana , District of Columbia , Nebraska , Wisconsin , Louisiana , North Carolina , West Virginia , Tennessee , Arizona , Oregon , Idaho , Arkansas , Rhode Island , Nevada , Colorado , Washington , Vermont , Ohio , Kentucky , Alaska , New Hampshire , Montana , Utah ,000 National ,653,000 20


21 Rank State % # 1 Hawaii ,000 2 South Dakota ,000 3 District of Columbia ,000 4 Georgia ,000 5 New Jersey ,000 6 North Dakota ,000 7 Tennessee ,000 8 South Carolina ,000 9 Alabama , Louisiana , Maryland , Kentucky , Mississippi , Kansas , Illinois , Montana , Delaware , Connecticut , Missouri , New Mexico , Texas , Pennsylvania , Michigan , Ohio , Iowa , Florida ,000 Rank State % # 27 New York , Utah , Vermont , Nebraska , California , North Carolina , Massachusetts , Alaska , Virginia , Maine , Washington , Minnesota , Oklahoma , Arkansas , Idaho , Rhode Island , Arizona , West Virginia , Wyoming , New Hampshire , Wisconsin , Colorado , Nevada , Oregon , Indiana ,000 National ,969,000 21


22 Rank State Weighted Sum of Z scores 1 Mississippi Alabama Louisiana North Carolina Utah Georgia Iowa Tennessee South Carolina District of Columbia Oklahoma Virginia Missouri Nebraska South Dakota Arkansas Minnesota Florida North Dakota Ohio Kansas Illinois Maryland Pennsylvania Kentucky Idaho Rank State Weighted Sum of Z scores 27 Wyoming Michigan Montana West Virginia Indiana Hawaii Delaware New Jersey Massachusetts Texas Connecticut Alaska New York Wisconsin Washington Maine Nevada Rhode Island California New Mexico Oregon New Hampshire Vermont Arizona Colorado National Center for Substance Abuse Treatment. Substance Abuse Treatment and Family Therapy. Rockville (MD): Substance Abuse and Mental Health Services Administration (US); (Treatment Improvement Protocol (TIP) Series, No. 39.) Chapter 5 Specific Populations. Available from: 22


23 Rank State % 1 Maryland Tennessee Alabama South Carolina North Carolina Kentucky Virginia Missouri District of Columbia Hawaii Oklahoma Georgia Minnesota Mississippi Louisiana Maine Florida Alaska New Hampshire Pennsylvania Illinois New Jersey Massachusetts Delaware Nebraska Idaho 0.92 Rank State % 27 Connecticut Washington Montana Iowa Kansas Utah South Dakota Michigan Ohio Arkansas West Virginia Rhode Island Vermont North Dakota Wisconsin Indiana New York Nevada Oregon Wyoming California Arizona Colorado Texas New Mexico 1.23 National.95 23


24 % (Alaska) Rank State % 1 Utah Iowa Mississippi Alabama Louisiana Nebraska South Dakota Tennessee Ohio Virginia Minnesota North Carolina Illinois Kentucky Georgia Texas Oklahoma North Dakota Pennsylvania South Carolina Arkansas West Virginia New Jersey Kansas Missouri Delaware Rank State % 27 New York Wyoming Idaho Arizona Florida Nevada Hawaii Indiana Wisconsin Michigan California Maryland Montana New Mexico Washington Connecticut Massachusetts Rhode Island New Hampshire District of Columbia Vermont Maine Oregon Colorado Alaska National Medical marijuana laws and adolescent marijuana use in the USA from 1991 to 2014: results from annual, repeated cross-sectional surveys Hasin, Deborah S et al.the Lancet Psychiatry, Volume 2, Issue 7,
25 .04% (District of Columbia).22% Rank State % 1 District of Columbia Wyoming Louisiana Mississippi Texas Georgia North Carolina Iowa Florida Kansas Arkansas Montana North Dakota New Mexico Massachusetts Nebraska Oklahoma Alaska Alabama Missouri South Carolina Tennessee South Dakota Utah California Connecticut 0.10 Rank State % 27 Idaho Hawaii Illinois Indiana Minnesota Virginia New York Ohio Michigan West Virginia Wisconsin Oregon Colorado Rhode Island Nevada Pennsylvania Delaware Washington Maryland New Jersey Maine Kentucky Vermont Arizona New Hampshire 0.22 National


26 .34% (District of Columbia).98% (Colorado) Rank State % 1 District of Columbia Mississippi Utah Alabama Louisiana Michigan Maryland Virginia Iowa Arkansas South Dakota Missouri South Carolina Oklahoma Ohio Indiana Georgia North Carolina Pennsylvania Tennessee Nebraska Wyoming Delaware Kentucky North Dakota Minnesota Rank State % 27 Idaho West Virginia Illinois New Jersey Kansas Montana Florida Alaska Maine Connecticut Washington Texas Massachusetts Nevada Wisconsin New York Rhode Island Hawaii Oregon Vermont New Mexico New Hampshire Arizona California Colorado 0.98 National


27 Rank State % # 1 South Dakota 5.4 4,000 2 Kentucky ,000 3 Georgia ,000 4 New Mexico 5.8 9,000 5 Montana 5.9 4,000 6 North Dakota 6.0 3,000 7 Hawaii 6.2 6,000 8 Tennessee ,000 9 New Jersey , District of Columbia 6.7 2, Alabama , Louisiana , South Carolina , New York , Pennsylvania , Texas , Nebraska , Utah , Kansas , California , Illinois , Ohio , Connecticut , Florida , Minnesota , Massachusetts ,000 Rank State % # 27 West Virginia , Vermont 8.5 4, Alaska 8.7 5, Michigan , New Hampshire 8.7 8, Wyoming 8.8 4, Mississippi , Iowa , Delaware 8.9 6, Arkansas , Oklahoma , Washington , Idaho , Maryland , Missouri , North Carolina , Virginia , Maine , Nevada , Arizona , Colorado , Wisconsin , Rhode Island , Indiana , Oregon ,000 National 8.2 1,996,000 27


28 Rank State % # 1 Maine ,000 2 Vermont ,000 3 Minnesota ,000 4 Iowa ,000 5 Massachusetts ,104,000 6 Montana ,000 7 New Hampshire ,000 8 Rhode Island ,000 9 North Carolina , Delaware ,557, Kentucky , Oregon , Wyoming , Idaho , Missouri , Wisconsin , Connecticut , Ohio , Virginia , Pennsylvania , Illinois , Kansas , Michigan , West Virginia , Alabama , South Dakota ,000 Rank State % # 27 Arkansas , Indiana , North Dakota , Washington , Utah , Oklahoma , New York ,468, New Mexico , Colorado , Georgia , Nebraska , Tennessee , Mississippi , Louisiana , New Jersey , South Carolina , Arizona , District of Columbia ,890, Maryland , Texas , California , Florida , Hawaii , Alaska , Nevada ,000 National ,280,000 28


29 Rank State % # 1 Hawaii ,000 2 Massachusetts ,000 3 Texas ,000 4 Delaware ,000 5 New Jersey ,000 6 Rhode Island ,000 7 New Mexico ,000 8 California ,000 9 Florida , Montana , New York , Wisconsin , Maine , Nebraska , Alaska , Georgia , Arkansas , South Dakota , Louisiana , Alabama , Tennessee , Maryland , Ohio , Michigan , Vermont , Iowa ,000 Rank State % # 27 Wyoming , Pennsylvania , Arizona , North Dakota , Illinois , South Carolina , Connecticut , Oklahoma , Colorado , Virginia , West Virginia , Nevada , Kansas , Utah , Mississippi , Kentucky , Washington , New Hampshire , Minnesota , North Carolina , Oregon , Indiana , Idaho , Missouri , District of Columbia ,000 National ,752,000 29


30 Rank State % # 1 Massachusetts ,000 2 District of Columbia 4.9 5,000 3 Hawaii ,000 4 Vermont 5.6 6,000 5 Minnesota ,000 6 Kentucky ,000 7 Rhode Island ,000 8 Colorado ,000 9 Wisconsin , Connecticut , Iowa , Pennsylvania , New York , North Dakota , New Mexico , New Hampshire , Delaware , New Jersey , Maryland , South Dakota , Ohio , Washington , West Virginia , Michigan , California , Maine ,000 Rank State % # 27 Illinois , Oregon , Virginia , Alaska , North Carolina , Nebraska , Arizona , Indiana , Louisiana , Utah , Oklahoma , Arkansas , Kansas , Montana , Nevada* , Georgia , Alabama , Idaho , Mississippi , Wyoming , Florida , Missouri , Texas , Tennessee , South Carolina ,000 National ,389,000 30


31 Rank State % # 1 Hawaii ,097 2 Iowa ,455 3 Vermont ,144 4 North Dakota ,981 5 New Hampshire ,019 6 Massachusetts ,320 7 District of Columbia ,597 8 Minnesota ,523 9 Illinois , Kentucky , Maine , South Dakota , Rhode Island , Colorado , Connecticut , Washington , Wisconsin , Ohio , Montana , Maryland , California ,006, New York , Kansas , Oregon , Nebraska , Delaware ,943 Rank State % # 27 West Virginia , Pennsylvania , Idaho , Alaska , New Mexico , Wyoming , Michigan , Virginia , Utah , New Jersey , Indiana , Missouri , Arkansas , Arizona , Nevada , Tennessee , North Carolina , Oklahoma , Alabama , Georgia , Florida , South Carolina , Louisiana , Texas , Mississippi ,133 National ,663,174 Bradford, Kim, Braxton, and others, "Access to medical care among persons with psychotic and major affective disorders," Psychiatric Services 59(8), pp , 2008 (AHRQ grant HS13353). 31


32 Rank State % # 1* Connecticut ,000 2 Maine ,000 3 Vermont ,000 4 Minnesota ,000 5 Alaska ,000 6 Oregon ,000 7 Massachusetts ,000 8 Maryland ,000 9 Wyoming , Iowa , Ohio , New Hampshire , South Dakota , Delaware , West Virginia , Idaho , New York , Rhode Island , Illinois , Michigan , Colorado , Nebraska , Arizona , North Carolina , Washington , North Dakota ,000 Rank State % # 27 Indiana , Oklahoma , Kansas , New Jersey , Nevada , District of Columbia , Montana , Utah , Kentucky , California , Louisiana , Georgia , Missouri , Pennsylvania , Arkansas , Hawaii , Florida , Alabama , New Mexico , Texas , Mississippi , South Carolina , Virginia , Wisconsin , Tennessee ,000 National ,548,000 Due to data limitations, figures were taken from two sets of data: annual averages from and Data set denoted for each state in the Appendix- Table


33 High percentages are associated with positive outcomes and low percentages are associated with poorer outcomes. Rank State % # 1 Minnesota ,000 2 South Dakota ,000 3 Vermont ,000 4 Alaska ,000 5 Massachusetts ,000 6 Maine ,000 7 New Hampshire ,000 8 North Dakota ,000 9 Colorado , Ohio , Oregon , Michigan , Utah , New York , Kansas , West Virginia , Nebraska , Iowa , Wyoming , Delaware , Rhode Island , New Jersey , Illinois , Connecticut , North Carolina , Pennsylvania ,000 Rank State % # 27 Arkansas , Maryland , Washington , Louisiana , Indiana , New Mexico , California , Arizona , Wisconsin , Alabama , Idaho , Kentucky , Texas , Hawaii , Missouri , Florida , Oklahoma , District of Columbia < 1, Virginia , South Carolina , Nevada , Montana < 1, Tennessee , Georgia , Mississippi ,000 National ,000 Due to data limitations, figures were taken from three sets of data: annual averages from , , and Data set denoted for each state in the Appendix-Table 2 33


34 Massachusetts 2.4 7,000 Connecticut 2.7 4,000 South Dakota 4.2 1,000 Wisconsin ,000 Indiana ,000 New Hampshire 4.5 3,000 Michigan ,000 New Mexico 4.7 3,000 Vermont 4.7 1,000 Oregon 5.0 7,000 New Jersey ,000 Minnesota ,000 Rhode Island 5.4 2,000 Pennsylvania ,000 Kentucky ,000 Maryland ,000 Kansas 6.1 7,000 Washington ,000 Montana 6.6 2,000 New York ,000 District of Columbia 6.7 1,000 Colorado ,000 Delaware 6.9 3,000 Tennessee ,000 Illinois ,000 Missouri ,000 Utah ,000 Alaska 7.6 2,000 North Carolina ,000 Iowa ,000 California ,000 Maine 8.1 4,000 North Dakota 8.1 3,000 Ohio ,000 Nebraska 8.3 6,000 Georgia ,000 Virginia ,000 Arizona ,000 Idaho 9.7 6,000 Florida ,000 Arkansas ,000 West Virginia ,000 Nevada ,000 Alabama ,000 Hawaii ,000 Texas ,000 South Carolina ,000 Oklahoma ,000 Wyoming ,000 Louisiana ,000 Mississippi ,000 National ,000


35 High percentages are associated with positive outcomes and low percentages are associated with poorer outcomes. 35 Vermont ,968 Minnesota ,736 Massachusetts ,137 Wisconsin ,217 Pennsylvania ,322 District of Columbia Maine ,234 Indiana ,642 Iowa ,610 Rhode Island ,629 New Hampshire ,107 Connecticut ,395 Illinois ,198 New York ,377 Ohio ,979 South Dakota ,099 North Dakota Oregon ,704 Nebraska ,313 Michigan ,325 Virginia ,398 Maryland ,203 Mississippi ,544 Missouri ,439 Georgia ,546 Arizona ,456 Kentucky ,422 Colorado ,624 Oklahoma ,078 Delaware Wyoming Florida ,333 New Mexico ,959 New Jersey ,955 Montana Texas ,558 Hawaii Alaska Idaho ,422 West Virginia ,284 Kansas ,290 Washington ,601 Nevada ,826 California ,199 North Carolina ,462 Tennessee ,237 South Carolina ,418 Utah ,871 Louisiana ,763 Alabama ,348 Arkansas National ,609
.")


36 6 200:1 (Massachusetts) :1 (Alabama) 5 Health Resources & Services Administration, Shortage Designation: Health 6 United States. (2013). Report to Congress on the nation's substance abuse and mental health workforce issues. Massachusetts 200:1 District of Columbia 230:1 Maine 240:1 Oregon 250:1 Vermont 260:1 Oklahoma 270:1 New Mexico 280:1 Rhode Island 290:1 Alaska 300:1 Connecticut 310:1 California 350:1 Colorado 350:1 Wyoming 350:1 Missouri 360:1 Washington 360:1 Utah 380:1 New Hampshire 390:1 Montana 410:1 New York 420:1 Nebraska 440:1 Delaware 460:1 Michigan 460:1 Hawaii 470:1 Maryland 490:1 North Carolina 490:1 Arkansas 510:1 Minnesota 510:1 Idaho 550:1 Kentucky 560:1 Illinois 580:1 Kansas 580:1 Nevada 580:1 New Jersey 580:1 Louisiana 600:1 Pennsylvania 600:1 Wisconsin 600:1 Ohio 630:1 North Dakota 640:1 South Dakota 660:1 South Carolina 680:1 Indiana 730:1 Virginia 730:1 Florida 750:1 Tennessee 780:1 Iowa 820:1 Mississippi 820:1 Arizona 850:1 Georgia 900:1 West Virginia 950:1 Texas 1070:1 Alabama 1260:1 National 536:1
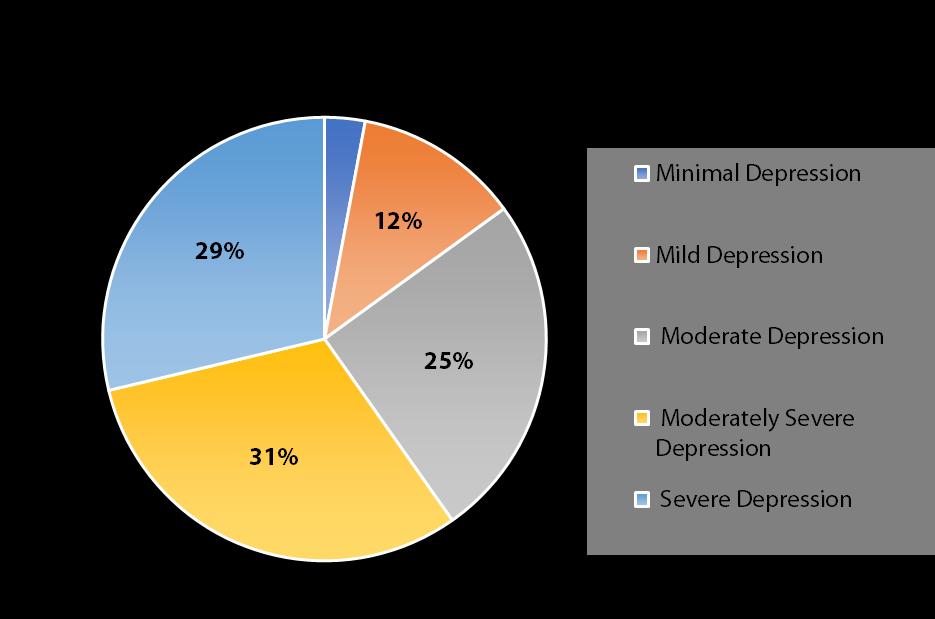
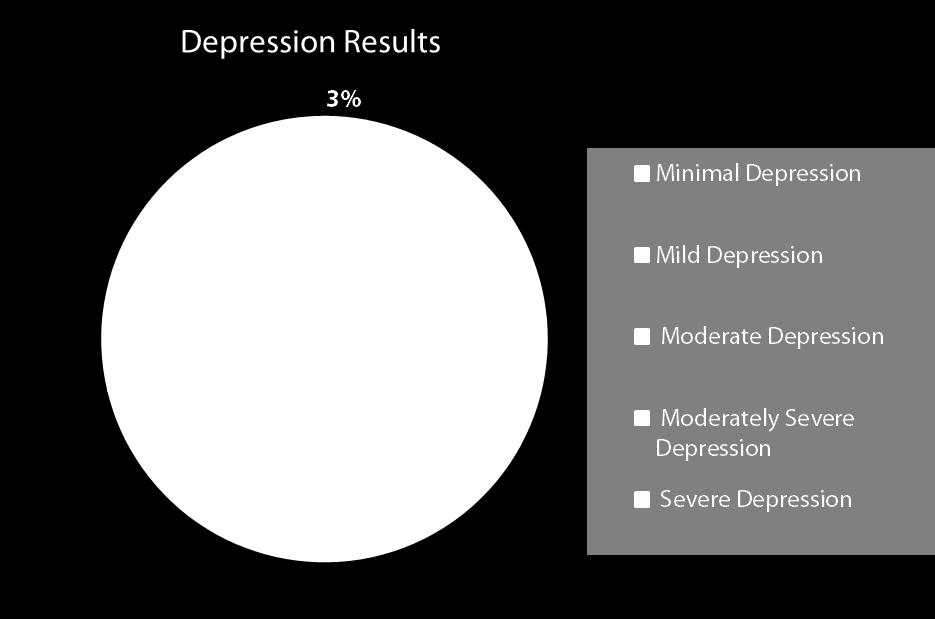
37 Spotlight: Online Depression Screening 7 Christensen, K. S., Toft, T., Frostholm, L., Ørnbøl, E., Fink, P., & Olesen, F. (2005). Screening for common mental disorders: who will benefit? Results from a randomised clinical trial. Family practice, 22(4), Pignone, M. P., Gaynes, B. N., Rushton, J. L., Burchell, C. M., Orleans, C. T., Mulrow, C. D., & Lohr, K. N. (2002). Screening for depression in adults: a summary of the evidence for the US Preventive Services Task Force. Annals of internal medicine, 136(10), O Connor, E. A., Whitlock, E. P., Beil, T. L., & Gaynes, B. N. (2009). Screening for depression in adult patients in primary care settings: a systematic evidence review. Annals of Internal Medicine, 151(11),


38 38
39 39
40 1 District of Columbia 7.54% 19.83% 28.59% 24.57% 19.46% % 2 Minnesota 4.96% 14.58% 26.77% 29.18% 24.51% % 3 North Dakota 5.23% 15.61% 24.65% 29.87% 24.65% % 4 Utah 12.18% 16.64% 21.99% 24.53% 24.68% % 5 Massachusetts 3.20% 14.46% 27.78% 29.57% 24.99% % 6 Maryland 4.02% 13.79% 25.78% 30.55% 25.86% % 7 Nebraska 7.84% 13.90% 24.17% 27.65% 26.43% % 8 Iowa 3.68% 12.97% 26.06% 30.17% 27.12% % 9 Delaware 3.53% 12.78% 24.94% 31.23% 27.52% % 10 New York 3.50% 12.75% 25.79% 30.42% 27.54% % 11 Connecticut 3.15% 13.21% 25.65% 30.31% 27.67% % 12 Rhode Island 2.46% 13.51% 25.68% 30.65% 27.70% % 13 New Jersey 3.58% 12.63% 25.09% 30.97% 27.73% % 14 Wisconsin 3.70% 13.03% 24.76% 30.78% 27.73% % 15 Vermont 3.32% 15.21% 25.53% 28.20% 27.74% % 16 Illinois 3.41% 12.91% 24.74% 31.01% 27.94% % 17 Colorado 3.84% 13.51% 23.97% 30.69% 27.99% % 18 Pennsylvania 3.23% 12.41% 25.33% 31.02% 28.00% % 19 New Hampshire 2.82% 13.11% 25.21% 30.56% 28.30% % 20 South Dakota 4.90% 13.04% 26.00% 27.66% 28.41% % 21 Wyoming 4.18% 12.64% 25.76% 28.99% 28.42% % 22 California 3.70% 12.58% 24.71% 30.54% 28.46% % 23 Hawaii 4.47% 11.59% 24.22% 31.02% 28.70% % 24 Montana 3.38% 13.03% 23.82% 30.81% 28.97% % 25 Virginia 3.15% 12.36% 24.46% 31.03% 29.00% % 26 Michigan 3.13% 12.00% 25.17% 30.62% 29.08% % 27 Alaska 3.96% 13.44% 24.15% 29.17% 29.27% % 28 Oregon 3.36% 12.28% 24.73% 30.34% 29.29% % 29 North Carolina 3.45% 12.32% 24.62% 30.27% 29.34% % 30 Missouri 3.08% 12.06% 24.27% 30.68% 29.91% % 31 Georgia 6.86% 11.15% 22.91% 29.08% 30.00% % 32 Kansas 3.07% 12.26% 24.02% 30.63% 30.02% % 33 Ohio 2.94% 11.15% 24.52% 31.35% 30.04% % 34 Washington 2.90% 12.19% 24.43% 30.17% 30.31% % 35 Maine 2.76% 11.00% 24.22% 31.48% 30.54% % 36 Indiana 3.94% 11.53% 23.74% 30.09% 30.70% % 37 Arkansas 4.34% 11.33% 22.75% 30.76% 30.82% % 38 Louisiana 2.76% 10.24% 23.96% 32.20% 30.83% % 39 Florida 3.63% 11.49% 23.25% 30.53% 31.10% % 40 Alabama 2.93% 10.84% 23.90% 31.22% 31.10% % 41 New Mexico 2.94% 11.13% 23.98% 30.55% 31.40% % 42 Arizona 4.17% 11.48% 22.67% 30.26% 31.42% % 43 Texas 2.88% 10.81% 23.44% 31.30% 31.57% % 44 Tennessee 3.10% 10.32% 23.90% 31.02% 31.67% % 45 Kentucky 2.57% 10.37% 22.81% 31.90% 32.36% % 46 Idaho 2.87% 10.69% 23.48% 30.59% 32.38% % 47 South Carolina 2.38% 10.51% 22.93% 31.32% 32.86% % 48 Mississippi 3.55% 9.88% 23.38% 30.28% 32.91% % 49 West Virginia 2.94% 10.07% 23.46% 29.93% 33.61% % 50 Oklahoma 2.21% 10.39% 23.24% 30.49% 33.66% % 51 Nevada 3.38% 9.89% 22.13% 30.87% 33.72% % National 3.67% 12.19% 24.44% 30.49% 29.22% % 40


41 100.00% 90.00% 80.00% 70.00% 60.00% 50.00% 40.00% 30.00% 20.00% 10.00% 0.00% '11-17' '18-24' '25-34' '35-44' '45-54' '55-64' '65+' Total Not at all to Several Days More than half to Nearly everyday 41
42 42
43 43


44 44
45 40% 35% 30% 25% 20% 15% 10% 5% 0% 40% 35% 30% 25% 20% 15% 10% 5% 0% 45
46 45% 40% 35% 30% 25% 20% 15% 10% 5% 0%
47 47
48 48
49 Moderate Depression among Race/Ethinicity by Income 250% 200% 150% 31% 29% 29% 32% 31% 30% 32% 29% 28% 35% 36% 31% 29% 29% 29% 27% 28% 33% 27% 26% 30% 100% 31% 32% 33% 37% 29% 32% 30% 32% 32% 31% 31% 32% 30% 31% 50% 0% 30% 31% 28% 30% 28% 29% 27% 31% 31% 31% 28% 28% 29% 28% Severe Depression among Race/Ethnicity by Income 250% 34% 200% 150% 100% 36% 38% 39% 35% 29% 31% 35% 35% 25% 29% 29% 31% 24% 21% 19% 20% 27% 25% 28% 28% 29% 32% 24% 32% 28% 30% 26% 31% 50% 34% 28% 26% 25% 23% 25% 22% 27% 25% 22% 20% 21% 22% 0% 31% 26% 24% 23% 23% 21% 21% 49
50 50
51 What next steps do you plan to take after screening? 51
52 50.00% 45.00% 46.24% 40.00% 35.00% 34.00% 30.00% 25.00% 20.00% 15.00% 18.71% 24.84% 10.00% 7.41% 5.00% 0.00% 52
53 40.00% 37.07% 35.00% 30.00% 25.00% 27.37% 26.84% 31.57% 20.00% 15.00% 17.84% 17.78% 16.20% 15.26% 10.00% 5.00% 5.44% 4.63% 0.00% 53
54 45.00% 40.00% 35.00% 30.00% 25.00% 20.00% 15.00% 10.00% 5.00% 0.00% 28.74% 19.11% 23.51% 6.52% 40.61% Asian or Pacific Islander Black or African American (non- Hispanic) Hispanic Latino More than one of the above Native American or American Indian Other White (non- Hispanic) Total 54
55 35.00% 30.00% 30.79% 32.82% 25.00% 20.00% 20.80% 20.74% 15.00% 10.00% 5.00% 0.00% 55
56 56
57 Rank State % # 1 Connecticut* ,000 2 Maine* ,000 3 Vermont* ,000 4 Minnesota* ,000 5 Alaska* ,000 6 Oregon ,000 7 Massachusetts* ,000 8 Maryland* ,000 9 Wyoming* , Iowa* , Ohio , New Hampshire , South Dakota* , Delaware* , West Virginia* , Idaho* , New York , Rhode Island , Illinois , Michigan , Colorado , Nebraska* , Arizona , North Carolina , Washington* , North Dakota* ,000 Rank State % # 27 Indiana , Oklahoma* , Kansas* , New Jersey* , Nevada , District of ,000 Columbia* 33 Montana* , Utah* , Kentucky* , California , Louisiana* , Georgia* , Missouri* , Pennsylvania , Arkansas* , Hawaii* , Florida , Alabama* , New Mexico* , Texas , Mississippi* , South Carolina* , Virginia , Wisconsin , Tennessee* ,000 National ,548,000 * Measures collected from Annual Averages based on , other measures are based on Annual Averages for
58 Rank State % # 1 Minnesota* ,000 2 South Dakota** ,000 3 Vermont** ,000 4 Alaska** ,000 5 Massachusetts* ,000 6 Maine* ,000 7 New Hampshire* ,000 8 North Dakota** ,000 9 Colorado* , Ohio , Oregon* , Michigan , Utah** , New York , Kansas* , West Virginia* , Nebraska** , Iowa* , Wyoming* , Delaware* , Rhode Island* , New Jersey* , Illinois , Connecticut* , North Carolina* , Pennsylvania ,000 Rank State % # 27 Arkansas* , Maryland* , Washington* , Louisiana** , Indiana* , New Mexico* , California , Arizona* , Wisconsin* , Alabama* , Idaho** , Kentucky* , Texas , Hawaii* , Missouri* , Florida , Oklahoma** , District of Columbia** 15.9 < 1, Virginia* , South Carolina** , Nevada* , Montana** 12.8 < 1, Tennessee** , Georgia* , Mississippi* ,000 National* ,000 *Measures collected from annual averages based on ** Measures collected from annual averages based on Unmarked states: measures collected from annual averages based on
59 /data/population-datansduh/reports?tab=
60 data/population-datansduh/reports?tab=38 s/annual_data/annual_2 014.html data/population-datansduh/reports?tab=38 60
61 61
62 62
63 63
 3+ 3+ N = 155, 442 3+ R 2 =.32 < < < 3+ N = 149, 685 3+ R 2 =.27 < < < 3+ N = 99, 752 3+ R 2 =.4 < < < 3+ N = 98, 887 3+ R 2 =.6 < < < 3+ N = 52, 624 3+ R 2 =.28 < < < 3+ N = 36, 281 3+ R 2 =.5 < < < 7+
TABLE 3c: Congressional Districts with Number and Percent of Hispanics* Living in Hard-to-Count (HTC) Census Tracts**
 Census Tracts**") living Alaska 00 47,808 21,213 44.4 Alabama 01 20,661 3,288 15.9 Alabama 02 23,949 6,614 27.6 Alabama 03 20,225 3,247 16.1 Alabama 04 41,412 7,933 19.2 Alabama 05 34,388 11,863 34.5 Alabama 06 34,849 4,074
living Alaska 00 47,808 21,213 44.4 Alabama 01 20,661 3,288 15.9 Alabama 02 23,949 6,614 27.6 Alabama 03 20,225 3,247 16.1 Alabama 04 41,412 7,933 19.2 Alabama 05 34,388 11,863 34.5 Alabama 06 34,849 4,074
TABLE 3b: Congressional Districts Ranked by Percent of Hispanics* Living in Hard-to- Count (HTC) Census Tracts**
 Census Tracts**") Rank State District Count (HTC) 1 New York 05 150,499 141,567 94.1 2 New York 08 133,453 109,629 82.1 3 Massachusetts 07 158,518 120,827 76.2 4 Michigan 13 47,921 36,145 75.4 5 Illinois 04 508,677 379,527
Rank State District Count (HTC) 1 New York 05 150,499 141,567 94.1 2 New York 08 133,453 109,629 82.1 3 Massachusetts 07 158,518 120,827 76.2 4 Michigan 13 47,921 36,145 75.4 5 Illinois 04 508,677 379,527
The American Legion NATIONAL MEMBERSHIP RECORD
 The American Legion NATIONAL MEMBERSHIP RECORD www.legion.org 2016 The American Legion NATIONAL MEMBERSHIP RECORD 1920-1929 Department 1920 1921 1922 1923 1924 1925 1926 1927 1928 1929 Alabama 4,474 3,246
2015 State Hospice Report 2013 Medicare Information 1/1/15
 2015 State Hospice Report 2013 Medicare Information 1/1/15 www.hospiceanalytics.com 2 2013 Demographics & Hospice Utilization National Population 316,022,508 Total Deaths 2,529,792 Medicare Beneficiaries
Unemployment Rate (%) Rank State. Unemployment
 Rank State. Unemployment") States Ranked by February 2018 Unemployment Rate Seasonally Adjusted Unemployment Unemployment Unemployment 1 Hawaii 2.1 19 Alabama 3.7 33 Ohio 4.5 2 New Hampshire 2.6 19 Missouri 3.7 33 Rhode Island 4.5
States Ranked by February 2018 Unemployment Rate Seasonally Adjusted Unemployment Unemployment Unemployment 1 Hawaii 2.1 19 Alabama 3.7 33 Ohio 4.5 2 New Hampshire 2.6 19 Missouri 3.7 33 Rhode Island 4.5
Unemployment Rate (%) Rank State. Unemployment
 Rank State. Unemployment") States Ranked by November 2015 Unemployment Rate Seasonally Adjusted Unemployment Unemployment Unemployment 1 North Dakota 2.7 19 Indiana 4.4 37 Georgia 5.6 2 Nebraska 2.9 20 Ohio 4.5 37 Tennessee 5.6
States Ranked by November 2015 Unemployment Rate Seasonally Adjusted Unemployment Unemployment Unemployment 1 North Dakota 2.7 19 Indiana 4.4 37 Georgia 5.6 2 Nebraska 2.9 20 Ohio 4.5 37 Tennessee 5.6
Unemployment Rate (%) Rank State. Unemployment
 Rank State. Unemployment") States Ranked by April 2017 Unemployment Rate Seasonally Adjusted Unemployment Unemployment Unemployment 1 Colorado 2.3 17 Virginia 3.8 37 California 4.8 2 Hawaii 2.7 20 Massachusetts 3.9 37 West Virginia
States Ranked by April 2017 Unemployment Rate Seasonally Adjusted Unemployment Unemployment Unemployment 1 Colorado 2.3 17 Virginia 3.8 37 California 4.8 2 Hawaii 2.7 20 Massachusetts 3.9 37 West Virginia
Unemployment Rate (%) Rank State. Unemployment
 Rank State. Unemployment") States Ranked by August 2017 Unemployment Rate Seasonally Adjusted Unemployment Unemployment Unemployment 1 North Dakota 2.3 18 Maryland 3.9 36 New York 4.8 2 Colorado 2.4 18 Michigan 3.9 38 Delaware 4.9
States Ranked by August 2017 Unemployment Rate Seasonally Adjusted Unemployment Unemployment Unemployment 1 North Dakota 2.3 18 Maryland 3.9 36 New York 4.8 2 Colorado 2.4 18 Michigan 3.9 38 Delaware 4.9
Unemployment Rate (%) Rank State. Unemployment
 Rank State. Unemployment") States Ranked by March 2016 Unemployment Rate Seasonally Adjusted Unemployment Unemployment Unemployment 1 South Dakota 2.5 19 Delaware 4.4 37 Georgia 5.5 2 New Hampshire 2.6 19 Massachusetts 4.4 37 North
States Ranked by March 2016 Unemployment Rate Seasonally Adjusted Unemployment Unemployment Unemployment 1 South Dakota 2.5 19 Delaware 4.4 37 Georgia 5.5 2 New Hampshire 2.6 19 Massachusetts 4.4 37 North
Unemployment Rate (%) Rank State. Unemployment
 Rank State. Unemployment") States Ranked by September 2017 Unemployment Rate Seasonally Adjusted Unemployment Unemployment Unemployment 1 North Dakota 2.4 17 Indiana 3.8 36 New Jersey 4.7 2 Colorado 2.5 17 Kansas 3.8 38 Pennsylvania
States Ranked by September 2017 Unemployment Rate Seasonally Adjusted Unemployment Unemployment Unemployment 1 North Dakota 2.4 17 Indiana 3.8 36 New Jersey 4.7 2 Colorado 2.5 17 Kansas 3.8 38 Pennsylvania
Unemployment Rate (%) Rank State. Unemployment
 Rank State. Unemployment") States Ranked by December 2017 Unemployment Rate Seasonally Adjusted Unemployment Unemployment Unemployment 1 Hawaii 2.0 16 South Dakota 3.5 37 Connecticut 4.6 2 New Hampshire 2.6 20 Arkansas 3.7 37 Delaware
States Ranked by December 2017 Unemployment Rate Seasonally Adjusted Unemployment Unemployment Unemployment 1 Hawaii 2.0 16 South Dakota 3.5 37 Connecticut 4.6 2 New Hampshire 2.6 20 Arkansas 3.7 37 Delaware
Unemployment Rate (%) Rank State. Unemployment
 Rank State. Unemployment") States Ranked by September 2015 Unemployment Rate Seasonally Adjusted Unemployment Unemployment Unemployment 1 North Dakota 2.8 17 Oklahoma 4.4 37 South Carolina 5.7 2 Nebraska 2.9 20 Indiana 4.5 37 Tennessee
States Ranked by September 2015 Unemployment Rate Seasonally Adjusted Unemployment Unemployment Unemployment 1 North Dakota 2.8 17 Oklahoma 4.4 37 South Carolina 5.7 2 Nebraska 2.9 20 Indiana 4.5 37 Tennessee
Unemployment Rate (%) Rank State. Unemployment
 Rank State. Unemployment") States Ranked by November 2014 Unemployment Rate Seasonally Adjusted Unemployment Unemployment Unemployment 1 North Dakota 2.7 19 Pennsylvania 5.1 35 New Mexico 6.4 2 Nebraska 3.1 20 Wisconsin 5.2 38 Connecticut
States Ranked by November 2014 Unemployment Rate Seasonally Adjusted Unemployment Unemployment Unemployment 1 North Dakota 2.7 19 Pennsylvania 5.1 35 New Mexico 6.4 2 Nebraska 3.1 20 Wisconsin 5.2 38 Connecticut
Unemployment Rate (%) Rank State. Unemployment
 Rank State. Unemployment") States Ranked by July 2018 Unemployment Rate Seasonally Adjusted Unemployment Unemployment Unemployment 1 Hawaii 2.1 19 Massachusetts 3.6 37 Kentucky 4.3 2 Iowa 2.6 19 South Carolina 3.6 37 Maryland 4.3
States Ranked by July 2018 Unemployment Rate Seasonally Adjusted Unemployment Unemployment Unemployment 1 Hawaii 2.1 19 Massachusetts 3.6 37 Kentucky 4.3 2 Iowa 2.6 19 South Carolina 3.6 37 Maryland 4.3
Index of religiosity, by state
 Index of religiosity, by state Low Medium High Total United States 19 26 55=100 Alabama 7 16 77 Alaska 28 27 45 Arizona 21 26 53 Arkansas 12 19 70 California 24 27 49 Colorado 24 29 47 Connecticut 25 32
5 x 7 Notecards $1.50 with Envelopes - MOQ - 12
 5 x 7 Notecards $1.50 with Envelopes - MOQ - 12 Magnets 2½ 3½ Magnet $1.75 - MOQ - 5 - Add $0.25 for packaging Die Cut Acrylic Magnet $2.00 - MOQ - 24 - Add $0.25 for packaging 2535-22225 California AM-22225
Weights and Measures Training Registration
 Weights and Measures Training Registration Please fill out the form below to register for Weights and Measures training and testing dates. NIST Handbook 44, Specifications, Tolerances and other Technical
MAP 1: Seriously Delinquent Rate by State for Q3, 2008
 MAP 1: Seriously Delinquent Rate by State for Q3, 2008 Seriously Delinquent Rate Greater than 6.93% 5.18% 6.93% 0 5.17% Source: MBA s National Deliquency Survey MAP 2: Foreclosure Inventory Rate by State
Interstate Pay Differential
 Interstate Pay Differential APPENDIX IV Adjustments for differences in interstate pay in various locations are computed using the state average weekly pay. This appendix provides a table for the second
Percentage of Enrolled Students by Program Type, 2016
 Percentage of Enrolled Students by Program Type, 2016 Doctorate 4% PN/VN 3% MSN 15% ADN 28% BSRN 22% Diploma 2% BSN 26% n = 279,770 Percentage of Graduations by Program Type, 2016 MSN 12% Doctorate 1%
Voter Registration and Absentee Ballot Deadlines by State 2018 General Election: Tuesday, November 6. Saturday, Oct 27 (postal ballot)
") Voter Registration and Absentee Ballot Deadlines by State 2018 General Election: All dates in 2018 unless otherwise noted STATE REG DEADLINE ABSENTEE BALLOT REQUEST DEADLINE Alabama November 1 ABSENTEE
Voter Registration and Absentee Ballot Deadlines by State 2018 General Election: All dates in 2018 unless otherwise noted STATE REG DEADLINE ABSENTEE BALLOT REQUEST DEADLINE Alabama November 1 ABSENTEE
HOME HEALTH AIDE TRAINING REQUIREMENTS, DECEMBER 2016
 BACKGROUND HOME HEALTH AIDE TRAINING REQUIREMENTS, DECEMBER 2016 Federal legislation (42 CFR 484.36) requires that Medicare-certified home health agencies employ home health aides who are trained and evaluated
STATE INDUSTRY ASSOCIATIONS $ - LISTED NEXT PAGE. TOTAL $ 88,000 * for each contribution of $500 for Board Meeting sponsorship
 Exhibit D -- TRIP 2017 FUNDING SOURCES -- February 3, 2017 CORPORATE $ 12,000 Construction Companies $ 5,500 Consulting Engineers Equipment Distributors Manufacturer/Supplier/Producer 6,500 Surety Bond
Estimated Economic Impacts of the Small Business Jobs and Tax Relief Act National Report
 Regional Economic Models, Inc. Estimated Economic Impacts of the Small Business Jobs and Tax Relief Act National Report Prepared by Frederick Treyz, CEO June 2012 The following is a summary of the Estimated
PRESS RELEASE Media Contact: Joseph Stefko, Director of Public Finance, ;
 PRESS RELEASE Media Contact: Joseph Stefko, Director of Public Finance, 585.327.7075; jstefko@cgr.org Highest Paid State Workers in New Jersey & New York in 2010; Lowest Paid in Dakotas and West Virginia
Sentinel Event Data. General Information Copyright, The Joint Commission
 Sentinel Event Data General Information 1995 2015 Data Limitations The reporting of most sentinel events to The Joint Commission is voluntary and represents only a small proportion of actual events. Therefore,
Current Medicare Advantage Enrollment Penetration: State and County-Level Tabulations
 Current Advantage Enrollment : State and County-Level Tabulations 5 Slide Series, Volume 40 September 2016 Summary of Tabulations and Findings As of September 2016, 17.9 million of the nation s 56.1 million
Sentinel Event Data. General Information Q Copyright, The Joint Commission
 Sentinel Event Data General Information 1995 2Q 2014 Data Limitations The reporting of most sentinel events to The Joint Commission is voluntary and represents only a small proportion of actual events.
Is this consistent with other jurisdictions or do you allow some mechanism to reinstate?
 Topic: Question by: : Forfeiture for failure to appoint a resident agent Kathy M. Sachs Kansas Date: January 8, 2015 Manitoba Corporations Canada Alabama Alaska Arizona Arkansas California Colorado Connecticut
2016 INCOME EARNED BY STATE INFORMATION
 BY STATE INFORMATION This information is being provided to assist in your 2016 tax preparations. The information is also mailed to applicable Columbia fund non-corporate shareholders with their year-end
Table 6 Medicaid Eligibility Systems for Children, Pregnant Women, Parents, and Expansion Adults, January Share of Determinations
 Table 6 Medicaid Eligibility Systems for Children, Pregnant Women, Parents, and Expansion Adults, January 2017 Able to Make Share of Determinations System determines eligibility for: 2 State Real-Time
Rutgers Revenue Sources
 Rutgers Revenue Sources 31.2% Tuition and Fees 27.3% State Appropriations with Fringes 1.0% Endowment and Investments.5% Federal Appropriations 17.8% Federal, State, and Municipal Grants and Contracts
Child & Adult Care Food Program: Participation Trends 2017
 Child & Adult Care Food Program: Participation Trends 2017 February 2018 About FRAC The Food Research and Action Center (FRAC) is the leading national organization working for more effective public and
Child & Adult Care Food Program: Participation Trends 2016
 Child & Adult Care Food Program: Participation Trends 2016 March 2017 About FRAC The Food Research and Action Center (FRAC) is the leading national organization working for more effective public and private
FORTIETH TRIENNIAL ASSEMBLY
 FORTIETH TRIENNIAL ASSEMBLY MOST PUISSANT GENERAL GRAND MASTER GENERAL GRAND COUNCIL OF CRYPTIC MASONS INTERNATIONAL 1996-1999 -
Table 8 Online and Telephone Medicaid Applications for Children, Pregnant Women, Parents, and Expansion Adults, January 2017
 Table 8 Online and Telephone Medicaid Applications for Children, Pregnant Women, Parents, and Expansion Adults, January 2017 State Applications Can be Submitted Online at the State Level 1 < 25% 25% -
States Ranked by Annual Nonagricultural Employment Change October 2017, Seasonally Adjusted
 States Ranked by Annual Nonagricultural Employment Change Change (Jobs) Change (Jobs) Change (Jobs) 1 Texas 316,100 19 Nevada 36,600 37 Hawaii 7,100 2 California 256,800 20 Tennessee 34,800 38 Mississippi
Child & Adult Care Food Program: Participation Trends 2014
 Child & Adult Care Food Program: Participation Trends 2014 1200 18th St NW Suite 400 Washington, DC 20036 (202) 986-2200 / www.frac.org February 2016 About FRAC The Food Research and Action Center (FRAC)
Statutory change to name availability standard. Jurisdiction. Date: April 8, [Statutory change to name availability standard] [April 8, 2015]
![Statutory change to name availability standard. Jurisdiction. Date: April 8, [Statutory change to name availability standard] [April 8, 2015]](/thumbs/83/87461560.jpg "Statutory change to name availability standard. Jurisdiction. Date: April 8, [Statutory change to name availability standard] [April 8, 2015]") Topic: Question by: : Statutory change to name availability standard Michael Powell Texas Date: April 8, 2015 Manitoba Corporations Canada Alabama Alaska Arizona Arkansas California Colorado Connecticut
Topic: Question by: : Statutory change to name availability standard Michael Powell Texas Date: April 8, 2015 Manitoba Corporations Canada Alabama Alaska Arizona Arkansas California Colorado Connecticut
*ALWAYS KEEP A COPY OF THE CERTIFICATE OF ATTENDANCE FOR YOUR RECORDS IN CASE OF AUDIT
 State Alabama Alaska Arizona Arkansas California INSTRUCTIONS FOR CLE ATTENDANCE REPORTING AT IADC 2012 TRIAL ACADEMY Attorney Reporting Method After the CLE activity, fill out the Certificate of Attendance
Percent of Population Under Age 65 Uninsured, 2013, 2014, and 2015
 Exhiit 1 Percent of Population Under Age 65 Uninsured, 13, 14, and 15 13 14 15
HIGH SCHOOL ATHLETICS PARTICIPATION SURVEY
 2011-12 HIGH SCHOOL ATHLETICS PARTICIPATION SURVEY Conducted By THE NATIONAL FEDERATION OF STATE HIGH SCHOOL ASSOCIATIONS Based on Competition at the High School Level in the 2011-12 School Year BOYS GIRLS
Rankings of the States 2017 and Estimates of School Statistics 2018
 Rankings of the States 2017 and Estimates of School Statistics 2018 NEA RESEARCH April 2018 Reproduction: No part of this report may be reproduced in any form without permission from NEA Research, except
CRMRI White Paper #3 August 2017 State Refugee Services Indicators of Integration: How are the states doing?
 CRMRI White Paper #3 August 7 State Refugee Services Indicators of Integration: How are the states doing? Marci Harris, Julia Greene, Kilee Jorgensen, Caren J. Frost, & Lisa H. Gren State Refugee Services
FY 2014 Per Capita Federal Spending on Major Grant Programs Curtis Smith, Nick Jacobs, and Trinity Tomsic
 Special Analysis 15-03, June 18, 2015 FY 2014 Per Capita Federal Spending on Major Grant Programs Curtis Smith, Nick Jacobs, and Trinity Tomsic 202-624-8577 ttomsic@ffis.org Summary Per capita federal
Interstate Turbine Advisory Council (CESA-ITAC)
") Interstate Turbine Advisory Council (CESA-ITAC) Mark Mayhew NYSERDA for Val Stori Clean Energy States Alliance SWAT 4/25/12 Today CESA ITAC, LLC - What, who and why The Unified List - What, why, how and
Interstate Turbine Advisory Council (CESA-ITAC) Mark Mayhew NYSERDA for Val Stori Clean Energy States Alliance SWAT 4/25/12 Today CESA ITAC, LLC - What, who and why The Unified List - What, why, how and
Dashboard. Campaign for Action. Welcome to the Future of Nursing:
 Welcome to the Future of Nursing: Campaign for Action Dashboard About This Dashboard: These graphs and charts show goals by which the Campaign evaluates its efforts to implement recommendations in the
Critical Access Hospitals and HCAHPS
 Critical Access Hospitals and HCAHPS Michelle Casey, MS Senior Research Fellow and Deputy Director University of Minnesota Rural Health Research Center June 12, 2012 Overview of Presentation Why is HCAHPS
EXHIBIT A. List of Public Entities Participating in FEDES Project
 EXHIBIT A List of Public Entities Participating in FEDES Project Alabama Alabama Department of Economic and Community Affairs Alabama Department of Industrial Relations Alaska Department of Labor and Workforce
Benefits by Service: Outpatient Hospital Services (October 2006)
") Page 1 of 8 Benefits by Service: Outpatient Hospital Services (October 2006) Definition/Notes Note: Totals include 50 states and D.C. "Benefits Covered" Totals "Benefits Not Covered" Totals Is the benefit
Page 1 of 8 Benefits by Service: Outpatient Hospital Services (October 2006) Definition/Notes Note: Totals include 50 states and D.C. "Benefits Covered" Totals "Benefits Not Covered" Totals Is the benefit
State Authority for Hazardous Materials Transportation
 Appendixes Appendix A State Authority for Hazardous Materials Transportation Hazardous Materials Transportation: Regulatory, Enforcement, and Emergency Response* Alabama E Public Service Commission ER
THE METHODIST CHURCH (U.S.)
") THE METHODIST LIBRARY CONFERENCE JOURNALS COLLECTION PAGE: 1 ALABAMA 1939-58 ALABAMA WEST FLORIDA 1959-1967 ALASKA MISSION 1941, 1949-1967 ATLANTA 1939-1951 BALTIMORE CALIFORNIA ORIENTAL MISSION 1939-1952
THE METHODIST LIBRARY CONFERENCE JOURNALS COLLECTION PAGE: 1 ALABAMA 1939-58 ALABAMA WEST FLORIDA 1959-1967 ALASKA MISSION 1941, 1949-1967 ATLANTA 1939-1951 BALTIMORE CALIFORNIA ORIENTAL MISSION 1939-1952
Senior American Access to Care Grant
 Senior American Access to Care Grant Grant Guidelines SENIOR AMERICAN (age 62 plus) ACCESS TO CARE GRANT GUIDELINES: The (ADAF) is committed to supporting U.S. based organizations exempt from taxation
Introduction. Current Law Distribution of Funds. MEMORANDUM May 8, Subject:
 MEMORANDUM May 8, 2018 Subject: TANF Family Assistance Grant Allocations Under the Ways and Means Committee (Majority) Proposal From: Gene Falk, Specialist in Social Policy, gfalk@crs.loc.gov, 7-7344 Jameson
Weekly Market Demand Index (MDI)
") VOL. 8 NO. 28 JULY 13, 2015 LOAD AVAILABILITY Up 7% compared to the Weekly Market Demand Index (MDI) Note: MDI Measures Relative Truck Demand LOAD SEARCHING Up 18.3% compared to the TRUCK AVAILABILITY
VOL. 8 NO. 28 JULY 13, 2015 LOAD AVAILABILITY Up 7% compared to the Weekly Market Demand Index (MDI) Note: MDI Measures Relative Truck Demand LOAD SEARCHING Up 18.3% compared to the TRUCK AVAILABILITY
Cooperative Program Allocation Budget Receipts Southern Baptist Convention Executive Committee August 2015
 Cooperative Program Allocation Budget Receipts August 2015 Cooperative Program Allocation Budget Current Current $ Change % Change Month Month from from Contribution Sources 2014-2015 2013-2014 Prior Year
Cooperative Program Allocation Budget Receipts Southern Baptist Convention Executive Committee March 2018
 Cooperative Program Allocation Budget Receipts March 2018 Cooperative Program Allocation Budget Current Current $ Change % Change Month Month from from Contribution Sources 2017-2018 2016-2017 Prior Year
Acm762 AG U.S. VITAL STATISTICS BY SECTION, 2017 Page 1
 Acm762 AG U.S. VITAL STATISTICS BY SECTION, 2017 Page 1 District Summary Major Worship Total Total -------------------- Adherents -------------------- Service District Churches Membership Boys Girls Men
HOPE NOW State Loss Mitigation Data December 2016
 HOPE NOW State Loss Mitigation Data December 2016 Table of Contents Page Definitions 2 Data Overview 3 Table 1 - Delinquencies 4 Table 2 - Foreclosure Starts 7 Table 3 - Foreclosure Sales 8 Table 4 - Repayment
HOPE NOW State Loss Mitigation Data September 2014
 HOPE NOW State Loss Mitigation Data September 2014 Table of Contents Page Definitions 2 Data Overview 3 Table 1 - Delinquencies 4 Table 2 - Foreclosure Starts 7 Table 3 - Foreclosure Sales 8 Table 4 -
Cooperative Program Allocation Budget Receipts Southern Baptist Convention Executive Committee January 2014
 Cooperative Program Allocation Budget Receipts January 2014 Cooperative Program Allocation Budget Current Current $ Change % Change Month Month from from Contribution Sources 2013-2014 2012-2013 Prior
Cooperative Program Allocation Budget Receipts Southern Baptist Convention Executive Committee April 2015
 Cooperative Program Allocation Budget Receipts April 2015 Cooperative Program Allocation Budget Current Current $ Change % Change Month Month from from Contribution Sources 2014-2015 2013-2014 Prior Year
Cooperative Program Allocation Budget Receipts Southern Baptist Convention Executive Committee March 2015
 Cooperative Program Allocation Budget Receipts March 2015 Cooperative Program Allocation Budget Current Current $ Change % Change Month Month from from Contribution Sources 2014-2015 2013-2014 Prior Year
Cooperative Program Allocation Budget Receipts Southern Baptist Convention Executive Committee May 2016
 Cooperative Program Allocation Budget Receipts May 2016 Cooperative Program Allocation Budget Current Current $ Change % Change Month Month from from Contribution Sources 2015-2016 2014-2015 Prior Year
Cooperative Program Allocation Budget Receipts Southern Baptist Convention Executive Committee December 2015
 Cooperative Program Allocation Budget Receipts December 2015 Cooperative Program Allocation Budget Current Current $ Change % Change Month Month from from Contribution Sources 2015-2016 2014-2015 Prior
Department of Defense INSTRUCTION
 Department of Defense INSTRUCTION NUMBER 4715.02 August 28, 2009 Incorporating Change 2, August 31, 2018 USD(A&S) SUBJECT: Regional Environmental Coordination References: (a) DoD Instruction 4715.2, DoD
 Page 1 of 11 NOAA Technical Memorandum NWS SR-193, Section 4 Section 4 Table of Contents: 4. Variations by State Weighted by Population A. Death and Injury (Casualty) Rate per Population B. Death Rate
STATE AGRICULTURAL ORGANIZATIONS SUPPORTING S. 744 AS APPROVED BY THE SENATE AGRICULTURE COMMITTEE
 STATE AGRICULTURAL ORGANIZATIONS SUPPORTING S. 744 AS APPROVED BY THE SENATE AGRICULTURE COMMITTEE ALABAMA ALASKA ARIZONA Alabama Department of Agriculture & Industries* Alabama Poultry & Egg Association
All Approved Insurance Providers All Risk Management Agency Field Offices All Other Interested Parties
 United States Department of Agriculture Farm Production and Conservation Risk Management Agency Beacon Facility Mail Stop 080 P.O. Box 49205 Kansas City, MO 644-6205, 207 INFORMATIONAL MEMORANDUM: PM-7-06
In the District of Columbia we have also adopted the latest Model business Corporation Act.
 Topic: Question by: : Reinstatement after Admin. Dissolution question Dave Nichols West Virginia Date: March 14, 2014 Manitoba Corporations Canada Alabama Alaska Arizona Arkansas California Colorado Connecticut
Colorado River Basin. Source: U.S. Department of the Interior, Bureau of Reclamation
 The Colorado River supports a quarter million jobs and produces $26 billion in economic output from recreational activities alone, drawing revenue from the 5.36 million adults who use the Colorado River
CONNECTICUT: ECONOMIC FUTURE WITH EDUCATIONAL REFORM
 CONNECTICUT: ECONOMIC FUTURE WITH EDUCATIONAL REFORM This file contains detailed projections and information from the article: Eric A. Hanushek, Jens Ruhose, and Ludger Woessmann, It pays to improve school
Table 1 Elementary and Secondary Education. (in millions)
") Revised February 22, 2005 WHERE WOULD THE CUTS BE MADE UNDER THE PRESIDENT S BUDGET? Data Table 1 Elementary and Secondary Education Includes Education for the Disadvantaged, Impact Aid, School Improvement
Revised February 22, 2005 WHERE WOULD THE CUTS BE MADE UNDER THE PRESIDENT S BUDGET? Data Table 1 Elementary and Secondary Education Includes Education for the Disadvantaged, Impact Aid, School Improvement
How North Carolina Compares
 How North Carolina Compares A Compendium of State Statistics March 2017 Prepared by the N.C. General Assembly Program Evaluation Division Preface The Program Evaluation Division of the North Carolina General
FINANCING BRIEF. Implementation of Health Reform for Children s Mental Health HEALTH REFORM PROVISIONS EXPLORED
 FINANCING BRIEF Implementation of Health Reform for Children s Mental Health Beth A. Stroul, M.Ed. Jonathan Safer-Lichtenstein, B.S. Linda Henderson-Smith, Ph.D., LPC Lan Le, M.P.A. MAY 2015 The National
F O R E S T R I V E R M A R I N E
 F O R E S T R I V E R M A R I N E Regional Sales Manager - Eric Rose Cell: (574) 361-8673 E-mail: erose@forestriverinc.com Sales Coordinator - Neil Massing (574) 825-8168 Cell: (574) 825-6180 E-mail: nmassing@forestriverinc.com
Acm769 AG U.S. WATER BAPTISMS, 2017¹ Page 1
 Acm769 AG U.S. WATER BAPTISMS, 2017¹ Page 1 Baptisms Baptisms Pct Baptisms Pct Baptisms Pct Alabama 2,552 2,944-392 -13.3 3,146-594 -18.9 2,501 51 2.0 Alaska 511 392 119 30.4 443 68 15.3 505 6 1.2 Appalachian
U.S. Army Civilian Personnel Evaluation Agency
 Army Regulation 10 89 Organizations and Functions U.S. Army Civilian Personnel Evaluation Agency Headquarters Department of the Army Washington, DC 15 December 1989 Unclassified SUMMARY of CHANGE AR 10
Name: Date: Albany: Jefferson City: Annapolis: Juneau: Atlanta: Lansing: Augusta: Lincoln: Austin: Little Rock: Baton Rouge: Madison: Bismarck:
 Albany: Annapolis: Atlanta: Augusta: Austin: Baton Rouge: Bismarck: Boise: Boston: Carson City: Charleston: Cheyenne: Columbia: Columbus: Concord: Denver: Des Moines: Dover: Frankfort: Harrisburg: Hartford:
National Collegiate Soils Contest Rules
 National Collegiate Soils Contest Rules Students of Agronomy, Soils, and Environmental Sciences (SASES) Revised September 30, 2008 I. NAME The contest shall be known as the National Collegiate Soils Contest
Date: 5/25/2012. To: Chuck Wyatt, DCR, Virginia. From: Christos Siderelis
 1 Date: 5/25/2012 To: Chuck Wyatt, DCR, Virginia From: Christos Siderelis Chuck Wyatt with the DCR in Virginia inquired about the classification of state parks having resort type characteristics and, if
UNCLASSIFIED UNCLASSIFIED
 The National Guard Bureau Critical Infrastructure Program in Conjunction with the Joint Interagency Training and Education Center Brigadier General James A. Hoyer Director Joint Staff West Virginia National
NMLS Mortgage Industry Report 2016 Q1 Update
 NMLS Mortgage Industry Report 2016 Q1 Update Released June 10, 2016 Conference of State Bank Supervisors 1129 20 th Street, NW, 9 th Floor Washington, D.C. 20036-4307 NMLS Mortgage Industry Report: 2016Q1
2014 ACEP URGENT CARE POLL RESULTS
 2014 ACEP URGENT CARE POLL RESULTS PREPARED FOR: PREPARED BY: 2014 Marketing General Incorporated 625 North Washington Street, Suite 450 Alexandria, VA 22314 800.644.6646 toll free 703.739.1000 telephone
How North Carolina Compares
 How North Carolina Compares A Compendium of State Statistics January 2013 Prepared by the N.C. General Assembly Program Evaluation Division Program Evaluation Division North Carolina General Assembly Legislative
The Regional Economic Outlook
 The Regional Economic Outlook Presented by: Mark McMullen, Director of Government Svcs Prepared for: FTA Revenue Estimating Conference September 15, 2008 Recent Economic Performance 2 1 The Job Market
NMLS Mortgage Industry Report 2017Q2 Update
 NMLS Mortgage Industry Report 2017Q2 Update Released September 18, 2017 Conference of State Bank Supervisors 1129 20 th Street, NW, 9 th Floor Washington, D.C. 20036-4307 NMLS Mortgage Industry Report:
Economic Freedom of North America
 Economic Freedom of North America 08 Annual Report (Canadian Edition) Amela Karabegović & Fred McMahon with Nathan J. Ashby & Russell S. Sobel The Fraser Institute 08 FRA S ER INSTITUTE Chapter 1 Economic
The Job Market Experiences of Gulf War II Era Veterans
 The Job Market Experiences of Gulf War II Era Veterans Paul E. Harrington Center for Labor Markets and Policy Drexel University Jan 2001 May 2001 Sep 2001 Jan 2002 May 2002 Sep 2002 Jan 2003 May 2003 Sep
NMLS Mortgage Industry Report 2017Q4 Update
 NMLS Mortgage Industry Report 2017Q4 Update Released March 9, 2018 Conference of State Bank Supervisors 1129 20 th Street, NW, 9 th Floor Washington, D.C. 20036-4307 NMLS Mortgage Industry Report: 2017Q4
NMLS Mortgage Industry Report 2018Q1 Update
 NMLS Mortgage Industry Report 2018Q1 Update Released July 5, 2018 Conference of State Bank Supervisors 1129 20 th Street, NW, 9 th Floor Washington, D.C. 20036-4307 NMLS Mortgage Industry Report: 2018Q1
Fiscal Year 1999 Comparisons. State by State Rankings of Revenues and Spending. Includes Fiscal Year 2000 Rankings for State Taxes Only
 Fiscal Year 1999 Comparisons State by State Rankings of Revenues and Spending Includes Fiscal Year 2000 Rankings for State Taxes Only January 2002 1 2 published annually by: The Minnesota Taxpayers Association
Supplemental Nutrition Assistance Program. STATE ACTIVITY REPORT Fiscal Year 2016
 Supplemental Nutrition Assistance Program ACTIVITY REPORT Fiscal Year 2016 Food and Nutrition Service Supplemental Nutrition Assistance Program Program Accountability and Administration Division September
State Seals with Bronze or Silver Ox finish Unmounted
 State Seals with Bronze or Silver Ox finish Unmounted Bronze Ox Silver Ox without color Size Quantity 6 8 weeks shipping schedule 12 14 weeks shipping schedule 1 $218.90 each $208.60 each 15 Butyrate State
Larry DeBoer Purdue University September Real GDP Growth. Real Consumption Spending Growth
 Larry DeBoer Purdue University September 2011 Real GDP Growth Real Consumption Spending Growth 1 Index of Consumer Sentiment 57.8 Sept 11 Savings Rate (percent of disposable income) Real Investment Spending
NURSING HOME STATISTICAL YEARBOOK, 2015
 NURSING HOME STATISTICAL YEARBOOK, 2015 C. MCKEEN COWLES COWLES RESEARCH GROUP Acknowledgments We extend our appreciation to Craig Dickstein of Tamarack Professional Services, LLC for optimizing the SAS
HIGH SCHOOL ATHLETICS PARTICIPATION SURVEY
 2015-16 HIGH SCHOOL ATHLETICS PARTICIPATION SURVEY Conducted By THE NATIONAL FEDERATION OF STATE HIGH SCHOOL ASSOCIATIONS Based on Competition at the High School Level in the 2015-16 School Year BOYS GIRLS
VOCA Assistance for Crime Victims
 VOCA Assistance for Crime Victims What is VOCA? Enacted in 1984, the Victims of Crime Act (VOCA) is the central source of federal financial support for direct services to victims of crime. VOCA is administered
Revenues, Expenses, and Operating Profits of U. S. Lotteries, FY 2002
 Revenues, Expenses, and Operating Profits of U. S. Lotteries, APPENDIX A Table A.1: Lottery Sales Excluding Sales From Video Lottery Terminals, Table A.2: Sales from Video Lottery Terminals Table A.3: