University of Nevada, Reno. A Market Opportunities Analysis for a One-Stop Clinic. A thesis submitted in partial fulfillment of the
|
|
|
- Lora Martin
- 5 years ago
- Views:
Transcription
1 University of Nevada, Reno A Market Opportunities Analysis for a One-Stop Clinic A thesis submitted in partial fulfillment of the requirements for the degree of Master of Science in Finance By Inara W. Santora Dr. Chunlin Liu/Thesis Advisor May, 2014
2 Copy right by Inara W. Santora 2014 All Rights Reserve

3 THE GRADUATE SCHOOL We recommend that the thesis prepared under our supervision by INARA W SANTORA Entitled A Market Opportunities Analysis For A One-Stop Clinic be accepted in partial fulfillment of the requirements for the degree of MASTER OF SCIENCE Chunlin Liu, Ph.D., Advisor Arun Upadhyay, Ph.D., Committee Member Leanne Bauer, M.B.A., Committee Member Jeanne Wendel, Ph.D., Graduate School Representative David W. Zeh, Ph. D., Dean, Graduate School May, 2014
4 i Abstract One-stop clinics are an innovative approach to an integrated ambulatory care system using a value-based reimbursement system. This study assessed the local market opportunities of a one-stop clinic by investigating patient shopping behavior. Results indicate that the elderly and women are more likely to have one-stop visits. Primary care, imaging, and lab services were most frequently visited combination in one-stop visits. Age and gender were significantly associated with one-stop shopping behavior; self-pay patients were less likely to have one-stop visits, compared to Medicare patients. There are no significant differences between patients with commercial insurance, Medicaid, and Medicare. Missing appointments behavior is investigated as well. The results reveal that the elderly and women were more likely to miss an appointment; self-pay patients were nearly 28 times more likely to miss an appointment compared to Medicare patients. We conclude that there is a local market for a one-stop clinic.
5 ii Acknowledgement I would like to thank my thesis committee for all the guidance through the entire project; the discussions, the ideas and the feedback have been extremely helpful throughout the whole process. Dr. Chunlin Liu, my thesis advisor, you have guided and supported me over the past two years. You have set an example of excellence as a researcher, mentor, and instructor. Dr. Arun Upadhyay, my committee member, thank you for the constant enthusiasm and encouragement. Ms. Leanne Bauer, thank you for the efforts on data requesting, real world expertise and your help on the initial ideas for this study. Special thanks to Dr. Jeanne Wendel, from the Economics Department, Graduate School representative on my thesis committee. Your encouragement, guidance, and support from the beginning helped me to develop an understanding of the subject and finish this study successfully. It has been an honor to work with you. Your contributions, detailed comments, and expertise have been a great value to me. Also, I would like to extend my sincerest thanks and appreciation to the director of the University Writing Center, Dr. William J Macauley, Jr. You have helped me with my writing from the very first paper of my graduate study to my thesis now. The technique of writing you have taught me will keep benefiting my professional career and future studies. Finally, I would like to thank my families. To my husband, Francesco, special thanks for his patience, understanding and support during my two-year graduate study. To my children, Francesco Jr. and Francesca, the love and happiness you have brought to me have kept me smiling and going.
6 iii Table of Contents Abstract... i Acknowledgement... ii Table of Contents... iii List of Tables... iv List of Figures... v Introduction... 1 Study Purpose and Research Questions... 5 Literature review... 6 Data and Methods... 7 Data sources... 7 Study Design... 9 Multivariate logistic regression Results Number of patients Characteristics of one-stop shopping patients Patterns of one-stop visits Likelihood of one-stop shopping Likelihood of missing appointment Discussion and Conclusions Limitations Conclusions Appendices Appendix A Variables List Appendix B Glossary of Terms Appendix C Institutional Review Board Certificate of Approval Bibliography... 40
7 iv List of Tables Table 1 Number of Visits and Patients...15 Table 2 Characteristics of Patients with One-stop Shopping Behavior...17 Table 3 Numbers of Visits and Patients in All One-Stop Shopping Visits...18 Table 4 Summary of Number of Services...20 Table 5 Patterns of primary care + 1 service combinations in one-stop visits...21 Table 6 Patterns of primary + 2 or 3 services combinations in one-stop visits...21 Table 7 Multiple Logistic Regression Results - the likelihoods of one-stop shopping behavior (Patient from ALL Area)...24 Table 8 Multiple Logistic Regression Results - the likelihoods of one-stop behavior (Patients from TARGET Area)...26 Table 9 Multiple Logistic Regression Results - the likelihoods of missing scheduled appointment (All area vs. Target area)...27
8 v List of Figures Figure 1 An Example of One-stop Clinic Model...3 Figure 2 Studied Medical Services and Modalities...10 Figure 3 Study Design...11 Figure 4 Number of Services used by Patients with One-stop Visits...20
9 1 Introduction The United States healthcare industry is rapidly changing in both financing and care delivery (American Hospital Association, 2012). With the passage of the Patient Protection and Affordable Care Act (ACA) of 2010, the reimbursement model is moving from a volume-based system (fee-for-service) to a value-based system (Physicians Foundation, 2010). The value-based system makes health providers accountable for the care they provide by sharing savings and loses (Centers for Medicare and Medicaid Services, 2014). Health providers will receive lower reimbursements for poorer health outcomes and higher reimbursement for better health outcomes for their managed population. Under the ACA, healthcare providers should focus on quality and efficiency to better manage the population health while reducing the cost, in order to share savings. The ACA encourages doctors, hospitals and other health care providers to voluntarily come together to form a network, to provide better coordinated high quality care to their patients, which also could keep costs down (Centers for Medicare & Medicaid Services, 2014). The goal of coordinated care is to ensure that patients, especially the chronically ill, get the right care at the right time while avoiding unnecessary duplication of services and preventing medical errors (Centers for Medicare & Medicaid Services, 2014). To manage population health, especially chronic disease control and preventive care, ambulatory care systems play an important role. From a finance standpoint, ambulatory services have been providing the majority of services within operating margin for most health systems under traditional fee-for-service reimbursement model
10 2 (The Chartis Group, 2011). A coordinated care system encouraged by the ACA may transition more procedures and treatments to an ambulatory setting, which will generate more revenues. For these reasons, improving ambulatory performance is a top strategic priority for health systems nationwide (The Chartis Group, 2011). A competitive ambulatory care system should be able to finance and deliver comprehensive coordinated patient care (Patient-Centered Primary Care Collaborative, 2012). Under these criteria, the one-stop clinic model stands out. A one-stop clinic is an innovative approach to build an integrated ambulatory care system (Ng, Cheung, Ngan, & Chu, 2013). One-stop clinic provides many outpatient services under one roof. As a result, ability to manage the continuum of care will improve quality of care and patient satisfaction, and promote care coordination and increase access to care, while still being able to reduce cost of care. Kaiser Permanents is a successful example of the one-stop clinic model. Kaiser, an integrated health organization, has long relied on a simple strategy of building complete, self-sustaining medical centers in each region it serves (Mohrman & Kanter, 2012). These medical centers generally employ 50 doctors or more, and "offer one-stop shopping: pharmacy and radiology and everything patient want from health care in one building (Flanagin, 2009). Figure 1 presents an example of a one-stop clinic model. It is a map of the Kaiser Permanents Santa Rosa medical center. The outpatient site is connected to hospital resulting in transferring patients quickly and easily if needed. The three-story building in the east wing of the campus has easy access. It provides primary care, lab and imaging services, and more than 20 other specialties, including orthopedics,

11 3 oncology, OB/Gyn, endoscopy, gastroenterology, head& neck, audiology, neurotology, cardiology, pulmonology, breast care, wound care, infectious diseases, HIV and others.
12 4 A local integrated health network (the Health Network) is a not-for-profit health network in Reno. The primary goal of the health network is to provide high quality health care services to the local community. However, a big challenge for a not-for-profit organization is that they cannot raise money from private investors. How to improve the quality of care, increase access to care, and reduce the costs at the same time, are important questions for management. One-stop clinic is a feasible model that can achieve all these goals, and fit into the ACA requirements. Similar to most non-profit hospitals, the health network has very limited access to capital. Whether a one-stop clinic in local market can be self-sustained is the first question asked. A one-stop clinic will be the first of its kind in Reno. The key for a one-stop clinic is to shorten the interval between initial primary physician consultation and the follow up assessments and treatments by offering multiple medical services in one location. After consulting the health network, a patient's one-stop shopping behavior in this study refers to a patient that has used at least two health services with more than one visit in 30 days. To assess the market demands of a one-stop clinic, our approach is to analyze the historical visit data and look for patterns of one-stop shopping that may reflect the needs of a one-stop clinic. The health network currently has more than 50 outpatient sites providing different health services. If high percentage of visits were involved in one-stop shopping, there is a market opportunity for a clinic offering multiple services in one location, which is expected to reduce the waiting time and improve patients' satisfaction, reduce costs by sharing recourses, and improve the care coordination between physicians, which leads to better quality of care. From an operational view, one-stop clinic can
13 5 increase the physician's utilization and maximize capacity, which will generate extra revenue for the clinic; also it may save administrative expenses, for example, different services can share pars for check-in. Furthermore, since one-stop clinic can provide full episode of care in an ambulatory setting with timely manners, it can better manage the population health, prevent the conditions/illness to become worse and reduce the risk of emergency room (ER) visits. This study is designed to assess the market opportunities of a one-stop clinic in Reno. We analyze available data to examine patients one-stop shopping behavior, look for patterns and significant factors of the behavior, to determine the market opportunity for a one-stop clinic. Study Purpose and Research Questions The purpose of this study is to investigate and analyze the patterns of current patients' one-stop shopping behavior, assess the factors associated with the behavior, and find the potential customers (patients) for a local one-stop clinic. To achieve this, we address the following questions: 1. How many patients have one-stop shopping behavior in 2013? 2. What types of patients have one-stop shopping behavior in 2013? 3. What are the patterns of one-stop visits (service combinations)? 4. What are the variables associated with the one-stop shopper? 5. What are the variables associated with missing appointment behavior?
14 6 Literature review When literature refers to one-stop shopping behavior for health care, most of it focuses on integration of care. Medical mall is a good example. Medical mall was developed in the late 80's, integrating primary care, some specialties, pharmacy, dental care, physical therapy, diagnostics, government services, and other patients' services (Anonymous, 1996). Integration of care improves coordination of care and may reduce patients' waiting time. After the physician consultation, patients could quickly receive necessary assessments and follow-ups (Nguyen, 2005; Birns, Vilasuso, & Cohen, 2006; Jackson, 2009; Reid, David, & Nicholl, 2009). In terms of a one-stop clinic model, most of the literature presents specialty clinics with multiple related services, such as fertility clinics (Magos, et al., 2005), carpal tunnel clinics (Reid, David, & Nicholl, 2009), neck lump clinics (McCombe & George, 2002; Hamarneh & Shortridge, 2013), breast clinics (Dixon, 2002), and sexual health clinics (Cherry, 2009). Those studies conclude that patients receive quicker assessments, resulting early diagnoses and treatments, providing better health outcomes. There are not many studies about one-stop primary care clinics like Kaiser Permanent medical center. This study explores local market opportunities for a one-stop clinic integrating primary care, lab and imaging services, and some other specialties by investigating patients' one-stop shopping behaviors.
15 7 Data and Methods This section explains the data process and study design. Institutional Reviews Board approvals were received from the Renown Regional Medical Center and the University of Nevada, Reno (Appendix C). Figure 1 shows groups of different services and modalities among the imagining services identified in the current study. Figure 2 illustrates the study design. Data sources The health network had nearly 30% market share of outpatient services in Reno as of The visit datasets reflect the current patients' cohort of the health network. To identify one-stop visits in current patient s cohort, three routine datasets are used: 3 year office visits (n=657,715), 2013 lab visits (n=154,851), and 2013 imaging appointments (n=165,324). The patient Medicare Records Number (MRN) has been replaced by unique identification numbers, and patient age has been replaced by 5 year age group to protect patient privacy. 1. The three-year office visit dataset includes all outpatient site visits from January 1, 2011 to December 31, It covers primary care, urgent care, women s health, pediatric care, cardiology, inpatient services, lab services, and other specialties. The 2013 lab visit dataset includes all outpatient lab services from January 1, 2013 to December 31, The 2013 imaging appointment dataset comprises all appointments for both completed as well as missed appointments and 2012 office visits data was excluded, in addition, since the health network are only interested in primary care, urgent care, women s health, pediatric care, and cardiology visits, inpatient services and other specialties are excluded as well. Since completed outpatient lab visit data was available from
16 8 another dataset, we exclude lab services from the office visits. This dataset has detailed patient information, including patient identification number, patient age, patient gender, insurance type, zip code, visit type, visit date, visit status, and visit department. Therefore, two other datasets were merged into this dataset to identify patients' geographic information. 2. The 2013 lab visit dataset is comprised of one record for each outpatient lab visit between January 1, 2013 and December 31, If a patient had multiple lab visits, multiple records would be shown in this dataset. 3. The 2013 imaging appointment dataset includes both completed appointments and missed appointments. Missed appointments were filtered out and only completed appointments were used for visits. This dataset does not provide zip code. We matched these three datasets and identified unique patients records between January 1, 2013 and December 31, 2013 for later analysis. The merged datasets include one-stop visits indicator, patient identification numbers, patient age, patient gender, insurance type, and zip code. Additionally, missed appointments were identified. We requested appointment detail datasets for office visits and lab visits, since we only had missed imaging appointments from the third dataset (2013 imaging appointments). However, at the time of the study, only office appointment details were available. Since the 2013 imaging appointment dataset does not provide zip code information, we matched zip codes by patient identification number to the office visit dataset. Then we merged the 2013 office appointment detail dataset (n=363,751) and the 2013 imaging appointments with zip code (n=141,824) and identified 505,566 unique appointment records for 118,021 patients
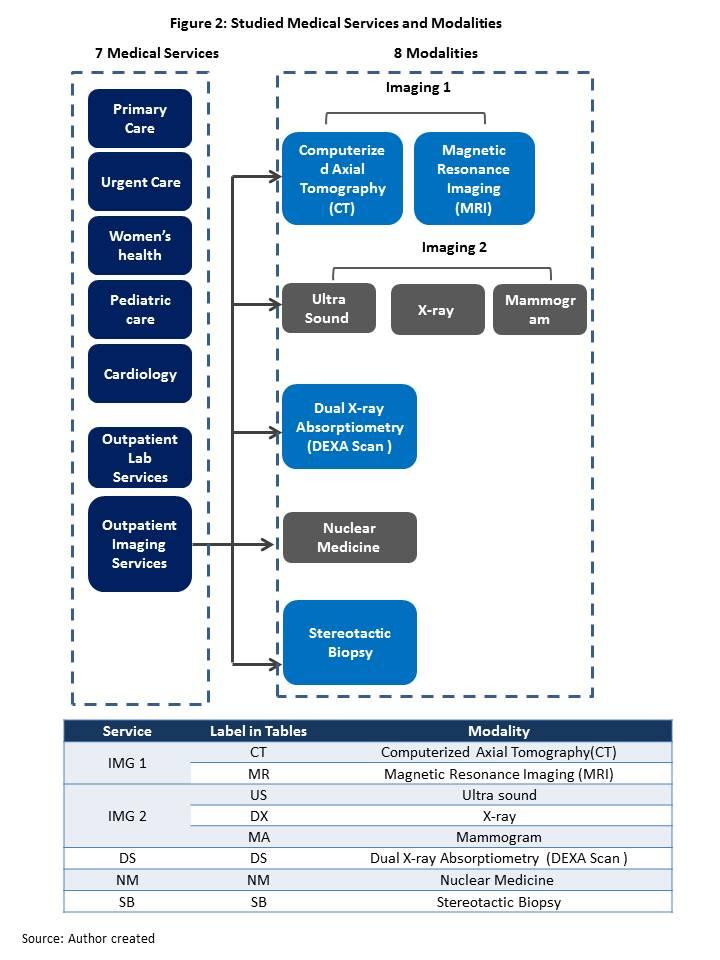
17 9 from January 1, 2013 to December 31, 2013 for later analysis. Data were computed and analyzed in Microsoft Excel 2007, Access 2007 and SAS version 9.3 Enterprise Guide (SAS Institute, Inc., Cary, North Carolina). Study Design In 2013, a total of 149,223 patients with 517,995 ambulatory visits were recorded. These visits include 216,566 office visits, 154,851 lab visits and 146,578 imagining visits. The health network suggested using a 30 day time limit to investigate one-stop shopping behavior. If a patient used more than one health service in 30 day period, we considered this patient for one-stop shopping behavior. We also used a term of "one-stop visit", since we do not have real one-stop visits (use multiple service in one visit at a same location), one-stop visit is refer to a series of visits ( at least two) to multiple services (at least two) in 30 days, regardless of visit location. A patient-centered care model is encouraged by CMS under the ACA. It requires primary physicians play a "navigator" role. We only analyzed the patients with primary care office visits. We excluded patients who only visited urgent care, women s health, cardiology, and pediatric care, without any primary care visits. Completed visits and missed visits were separately analyzed. We extracted the patients who had one-stop shopping behavior and calculated the distribution by age, gender and insurance type. The health network divided medical services into seven types and eight modalities in imagining services. Figure 2 shows the medical services and modalities that were studied. The modalities, which are the different tests performed by different medical equipment, were considered as different services in addition to six services: primary
18 10 care, urgent care, women's health, pediatric care, cardiology and outpatient lab services. Furthermore, we grouped Computerized Axial Tomography (CT) and Magnetic Resonance Imaging (MRI) as imaging 1, and ultra sound, X-ray and mammogram as imaging 2. From an operation and finance view, in an ambulatory setting, generally we provide CT and MRI as a group of services in the same location. Similarly, if women's health services were offered, ultra sound, X-ray and mammogram machines are normally on site, because they are used for common test/screening of OB/GYN visits. We examined the patterns of one-stop shopping behavior by analyzing the combination of services in one-stop visits (a series of visits to multiple services in 30 days, regardless visit location). We focused on the patterns of two and three services. The possible location of a one-stop clinic was given by the health network. We used zip codes to identify target population. Multiple logistic regressions were used to investigate the likelihood of one-stop shopping behavior with different age, gender and insurance type for all patients. We also did the same analysis for target area patients. Then we compared all patients and target area patients. Missed office and imaging visits from the original dataset was used to identify the potential customers who may use one-stop medical services. Logistic regression was utilized to assess the characteristics of the patients who were more likely to miss/cancel an appointment. Figure 3 illustrates the study design.
19 11

20 * 3 year office visits covers 01/01/ /31/2013 all office visits, includes Primary care, Urgent care, Women s health, Pediatric care, Cardiology, Inpatient services, Lab services, and Other specialties. * * 2013 office visits covers 01/01/ /2013 all office visits, includes Primary care, Urgent care, Women s health, Pediatric care, and Cardiology, excludes Inpatient services, Lab services, and Other specialties. ᶧ2013 imaging appointments covers 01/01/ /31/2013 all imaging appointments, includes completed appointments and missed appointments in 8 modalities: Computerized Axial Tomography (CT), Magnetic Resonance Imaging (MRI), Ultra Sound, X- ray, Mammogram, Dual X-ray Absorptiometry (DEXA Scan ), Nuclear Medicine, and Stereotactic Biopsy. ᶧᶧ 2013 imaging visits covers 01/01/ /31/2013 only completed appointments in 8 modalities, excluded missed appointments office appointment detail covers 01/01/ /31/2013 all office appointments, includes completed and missed appointments in Primary care, Urgent care, Women s health, Pediatric care, and Cardiology, excludes Inpatient services, Lab services, and Other specialties 12
21 13 Multivariate logistic regression We used multivariate logistic regressions to determine the associations between age, gender and insurance types and different indicators. A basic equation of the logistic regression is: Pr(Indicator i = 1) = β 0 + β 1 Age + β 2 Gender + β 3 Insurance Type + ε i Where: Indicator : Binary dependent variable. We use this multivariable logistic regression model for assessing the likelihood of having one-stop shopping and missed appointment behaviors. Two indicators were generated in the study: indicators of one-stop visit and missed appointment. We coded patients who had one-stop shopping or missing appointment behavior as "1", otherwise as "0". Age: Categorical independent variable. Age is provided in five year age grouping, 0 to 4 years, 5 to 9 years and so on. We code "0 to 4 years" as 1, "5 to 9 years" as 2 and so on. The maximum is 18 for "85 years and older". Gender: Binary independent variable. Patients who are female are coded as 1, otherwise coded as 0. Insurance Type: Binary independent variables. Four insurance types are provided: commercial, Medicare, Medicaid, and self-pay. Generally, employed patients have commercial insurance offered by their employers. Medicare is "the federal health
22 14 insurance program for people who are 65 or older, certain younger people with disabilities, and people with End-Stage Renal Disease (permanent kidney failure requiring dialysis or a transplant, sometimes called ESRD) (Medicare, 2014). Medicaid is a federal and state joined health and medical services program for individuals and families with low income and few resources (Medical News Today, 2014). The current minimum eligibility for national Medicaid is 133% of the federal poverty level (Medicaid, 2014). Self-pay patients are considered those make more than 133% of the federal poverty level but not enough to have commercial insurance. Patients who were included in a specific type are coded as 1, these are excluded from a specific type are coded as 0. The variables used in the study are described in Appendix A.
23 15 Results Number of patients There were 517,995 outpatient visits, which include primary care, urgent care, women's health, pediatric care, cardiology, outpatient lab and imaging visits. 149,223 unique patients have been seen by the health network outpatient sites in The unique patient count is not the sum of patient count of office visits, lab visits and imaging visits, since some patients might use more than one health services. For example, a patient could have office visits and lab visits; we would count this patient as office patient, as well as lab patient. One-stop visits (a series of visits to multiple services in 30 days, regardless visit location) involved 209,344 visits (40.4% of 517,955 total visits) by 46,816 (31.4% of 332,386 total patients) patients (Table 1). Table 1. Number of Visits and Patients Total Visits 517,995 Office ª 216,566 Lab 154,851 Imaging ᵇ 146,578 Total Patients 149,223 Officeª 103,252 Lab 71,269 Imaging 55,497 One-stop visits 209,344 (40.4%) Patients with one-stop visits 46,816 (31.4%) ª Office services include primary care, urgent care, women's health, pediatric care and cardiology ᵇ Imaging services include CT, MRI, ultra-sound, X-ray, Mammogram, DEXA Scan, Nuclear Medicine and Stereotactic Biopsy (more details refer to Figure 1) Number of total patients is not the sum of patients who had office, lab and imaging visits, for example, a patient could have both office and imaging visits.
24 16 Characteristics of one-stop shopping patients Due to data limitations, we were only able to identify 40,827 one-stop shopping patients' demographic information. Among these 40,827 patients, the percentage of a patient who had one-stop visit increased with age after five and reached the highest point in the age group of years as 1.8% (2,628 out of all 149,223 patients). After age of 69, one-stop shopping behavior decreased. In terms of insurance type, patients with commercial insurance had highest percentage for one-stop visits, followed by Medicare, Medicaid, and self-pay. In general, women were more likely to have one-stop shopping behavior than men (16.5% vs. 10.9%). Among the 40,827 identified patients with onestop shopping behavior, there were 4,661 patients living in the target area. These patients showed similar trends as the general population in that women were more likely to have one-stop visits than men (1.9% vs. 1.3%), and elderly were more likely to have one-stop visits as well. Similar to the general patients, after the age of 69, the percentage of target area patients with one-stop visits decreased. Unlike general patients, Medicaid patients from the target area were more likely to have one-stop visits than Medicare and self-pay patients (Table 2)
25 17 Table 2 Characteristics of Patients with One-stop Shopping Behavior (01/01/ /31/2013) # of patients with One-stop visits of all area (n=40,827) # of patients with One-stop visits of Target area (n=4,661) Female % Male % All gender Female % Male % All gender Age Group 24, ª 16, ª 40,827 2, ᵇ 1, ᵇ 4, , , , , , , , , , , , , , , , , , , , , , , , , , , , , , , , , , , , , Insurance type 24, ª 16, ª 40,827 2, ᵇ 1, ᵇ 4,661 Commercial 13, , ,588 1, , ,735 Medicare 8, , , Medicaid 1, , ,543 Self-pay , ª The denominator is the number of patients with one-stop visits of all area (n=40,827), the numerator is the number of visits of the specific group. ᵇ The denominator is the number of patients with one-stop visits of target area (n=4,661), the numerator is the number of visits of the specific group.
26 18 Patterns of one-stop shopping behavior There were 209,344 visits involved in one-stop shopping. Table 3 summaries the number of visits and number of patients for each service analyzed in the study. Among one-stop visits, imaging services were most frequently visited (39.02% of 209,344), followed by outpatient lab services, primary care, urgent care. These four services together accounted for 96.75% (202,534 visits) of all the one-stop visits. Among the imaging services, imaging 2 (ultra sound, x-ray and mammogram) were visited the most (28.93% of 209,344 visits), x-ray itself contributed 15.58% visits. Nuclear medicine had lowest volume. Table 3. Numbers of Visits and Patients in All One-Stop Shopping Visits Specialty No. of Visits % ᶠ No. of Patients Primary Care 42, ,754 Urgent Care 22, ,554 Women's health Pediatric 1, Cardiology 5, ,351 Outpatient Lab 55, ,168 Imaging 81, ,518 Imaging 1 15, ,009 CT 8, ,405 MR 7, ,604 Imaging 2 60, ,187 US 15, ,348 DX 32, ,271 MA 12, ,568 DS 4, ,143 NM SB Labels have been explained in Figure 1 ᶠ The denominator is the total number of one-stop visits (n=209,344), the numerator is the number of visits of the specific service.
27 19 Total of 209,344 visits involved in one-stop shopping were counted 71,964 times. One-stop shopping visited two to six services. Most of the one-stop shoppers (91.1%) visited two or three services (Figure 4 & Table 4). Table 5 and Table 6 present the combinations of two and three services. The combination of primary care and outpatient lab services was most frequently used with 46,381 times (64.45% of 71,964 times of onestop shopping). If we counted imaging services (imaging 1, imaging 2,dual X-ray Absorptiometry, nuclear medicine and stereotactic biopsy) as a whole, primary care and imaging services combination was the second frequently used among all two service combinations studied (15,712 times visited, and 21.83% of 71,964 times of one-stop shopping). Within the imaging services, primary care plus imaging 2 (ultra sound, X-ray and Mammogram) were the most often visited with 12,370 times (17.19% of time of one-stop shopping) (Table 5). For the three services combination, the most frequently visited was primary care, outpatient lab service and imaging services with 13,931 times of one-stop shopping (19.31% of 71,946 times of one-stop shopping) (Table 6).
28 20 Table 4 Summary of Number of Services # of Services used # of patients % 2 Services 42, Services 4, Services Services Services 1 0.0
29 21 Table 5 Patterns of primary care + 1 Service Combinations in One-stop Visits (01/01/ /31/2013) Combination of Services Count of One-stop Shopping % ᶢ # of Patients Primary Care + Urgent Care 4, ,447 Primary Care + Women's Health Primary Care + Pediatric Primary Care +Cardiology 1, Primary Care + Lab 46, ,787 Primary Care + Imaging 15, ,169 Primary Care + Imaging 1 2, Primary Care + CT 1, Primary Care + MR 1, Primary Care + Imaging 2 12, ,299 Primary Care + US 2, Primary Care + DX 8, ,090 Primary Care + MA 1, Primary Care + DS Primary Care + NM Primary Care + SB ᶢ The denominator is the count of time of one-stop shopping (n=71,964), the numerator is visit frequency of a specific combination. Table 6 Patterns of primary Care + 2 or 3 Services Combinations in One-stop Visits (01/01/ /31/2013) Combination of Services Count of One-stop Shopping % ᶢ # of Patients Primary Care +Urgent Care + Women's Health Primary Care +Urgent Care + Pediatric Primary Care +Urgent Care + Lab 4, Primary Care +Urgent Care + Imaging 2, Primary Care +Urgent Care + Cardiology Primary Care +Lab + Imaging 13, ,311 Primary Care + Imaging 1 3, Primary Care + CT + Lab 2, Primary Care + MR + Lab 1, Primary Care + Imaging 2 10, ,004 Primary Care + US + Lab 3, Primary Care + DX + Lab 5, Primary Care + MA + Lab 1, Primary Care + DS + Lab Primary Care + NM + Lab Primary Care + SB + Lab Primary Care +Urgent Care + Lab + Imaging % 146 ᶢ The denominator is the count of time of one-stop shopping (n=71,964), the numerator is visit frequency of a specific combination. This is a four services combination
30 22 Likelihood of one-stop shopping Table 7 presents the multivariable logistic regression of the likelihood of one - stop shopping behavior among all patients in 201. Initially a regression was run to investigate the likelihood of overall one-stop shopping behavior regardless of number of services used in the one-stop shopping. We also were interested in finding out if there are any differences between number of services used in a one-stop visit and how good our model was. By grouping different number of services of one-stop visits, we found more than 90% of the patients with one-stop shopping behavior have visited two services, details can be found in Table 4. Three logistic regressions were run for two services used, three services used and four services used one-stop visits. The dependent variable for each regression was if the patient had one-stop shopping behavior (YES= "1", NO= "0"), and if the patient had a one-stop shopping of two, three, and four services used (Yes = "1", No = "0"). All regressions investigated same set of independent variables: age gender, insurance type; and within the insurance type, all regressions used same reference group - Medicare. In this study, a p-value less than.01 is defined as highly significant, less than.05 is defined as significant. Four regressions showed consistent results: age and gender were highly significant across all; self-pay is highly significant except in Regression 4 - four services used. Commercial and Medicaid insurance type were highly significant in Regression 2-2 services used, and Regression 3 - three services used. Regression 1 showed age and gender highly significant associated with overall one-stop shopping behavior (no matter how many services were used). In general, every
31 23 5 years age increase, the odds of one-stop shopping behavior increased 9%. The odds ratio for gender was 1.35 with coefficient 0.3 and a 99% (1.085, 1.094) confidence interval. This suggested that women were 1.35 times more likely to have one-stop shopping behavior than men. Patients who had commercial or Medicaid insurance were not significantly different from Medicare patients in terms of one-stop shopping behavior. No surprise, self-pay patients were least likely to be a one-stop shopper (OR: 0.32). Regression 2 had the best estimation. The result indicates age, gender and insurance type are all highly significant associated with two services used in one-stop shopping. With 5 years increasing in age, patients were 1.14 times more likely to perform one-stop shopping behavior. Women were 1.13 times more likely to use two services in a one-stop visit than men. For insurance types, Medicaid patients were 1.78 times more likely to use two services in a one-stop visit, compared to Medicare, followed by patients with commercial insurance, they were 1.10 more likely to have one-stop visits. Again, self-pay patients were least likely to become one-stop shoppers (OR: 0.46). Regression 3 investigation of likelihood of 3 services used in a one stop visit showed similar results as two services used. However Regression 4 - four services used started to loss significance due to the small sample size. Therefore, we did not go on for more services used in onestop visits. Among the patients from the target area, results were consistence with all patients: Gender and age were still highly significant across the board. For overall onestop visits, patients with commercial and Medicaid insurance did not show significant difference from Medicare patients in terms of one-stop shopping behavior. Self-pay
32 24 patients still were least likely to have one-stop visits. We stopped at three services used in one-stop shopping, since the model was starting to lose significance (Table 8). Table 7 Multivariable Logistic Regression Results- the likelihoods of one-stop shopping behavior (Patient from ALL Area) Coefficient Regression 1: All Area One-stop Visit Regression 2: All Area 2 Services Used (n=103,251 Yes = 40,827 No = 62,424) (n=103,251 Yes= 18,921 No = 84,330) P Odds Ratio 95% CI Coefficient P Odds Ratio 95% CI age **0.09 < **0.13 < Gender **0.30 < **0.12 < Insurance Typeᶧ Commercial ** Medicaid **0.58 < Self_pay **-1.13 < **-0.78 < Coefficient Regression 3: All Area 3 Services Used Regression 4: All Area 4 Services Used (n=103,251 Yes= 1,481 No =100,770) (n=103,251 Yes = 320 No =102,931) P Odds Ratio 95% CI Coefficient P Odds Ratio 95% CI age **0.12 < **0.13 < Gender **0.34 < ** Insurance Typeᶧ Commercial **0.38 < Medicaid ** Self_pay **-0.69 < Note: The Wald statistics are distributed chi-square with 1 degree of freedom. *Significant at the 5%; ** Significant at the 1% ᶧ reference group was Medicare patients
33 25 Table 8 Multivariable Logistic Regression Results- the likelihoods of one-stop behavior (Patients from TARGET Area) Regression 5: Target Area One-stop Visit Regression 6: Target Area 2 Services Used Regression 7: Target Area 3 Services Used (n=10,7691 Yes=4,659 No=6,110) (n=10,7691 Yes=2,134 No=8,635) (n=10,7691 Yes=293 No=10,476) Odds Odds Odds Coefficient P Ratio 95% CI Coefficient P Ratio 95% CI Coefficient P Ratio 95% CI age **0.09 < **0.14 < **0.10 < Gender **0.24 < * ** Insurance Typeᶧ Commercial * Medicaid **0.73 < Self_pay **-1.16 < **-0.67 < Note: The Wald statistics are distributed chi-square with 1 degree of freedom. *Significant at the 5%; ** Significant at the 1% ᶧ Reference group was Medicare patients
34 26 Likelihood of missing appointment Two logistic regressions were conducted to investigate the likelihood of missing scheduled appointment behavior. Table 7 presents the results of the logistic regressions. Two regressions showed similar results for both all area and target area: age and gender highly significantly associated with missing appointment behavior. Medicaid patients were not significant different from Medicare patients in regards to missing appointment behavior. Patients with commercial insurance were less likely to miss a scheduled appointment compare to Medicare patients. However, self-pay patients were most likely to miss an appointment. The odd ratio was and 23.7 for all area and target area patients, respectively. This means, compared to Medicare patients, self-pay patients are nearly 28 and 24 times more likely to miss an appointment across all area and target area, respectively. Table 9 Multivariable Logistic Regression Results- the likelihoods of missing scheduled appointment (All area vs. Target area) All Missed Appointments Patients from Target Area Missed Appointments (n=114,886 Yes= 43,217 No=71,669) (n=12,099 Yes=4,438 No= 7,661) Coefficient P Odds Ratio 95% CI Coefficient P Odds Ratio 95% CI Age **0.09 < **0.11 < Gender **0.51 < **0.47 < Insurance Typeᶧ Commercial **-0.32 < ** Medicaid Self_pay **3.33 < **3.17 < Note: The Wald statistics are distributed chi-square with 1 degree of freedom. *Significant at the 5%; ** Significant at the 1% ᶧ Reference group was Medicare patients
35 27 Discussion and Conclusions This study is a market opportunity analysis for a one-stop clinic in Reno. To understand the community needs of a one-stop clinic is critical for making the business decision, especially during this rapid changing period of the U.S. health industry. On one hand, we want to improve the quality of care while reducing cost; on the other hand, we expect the clinic will be able to financially be self-supported. Our study showed the likelihood of one-stop shopping behavior increased when age increased, and reached the highest percentage in the 65 to 69 years group. After the age of 69, one-stop shopping behavior decreased. The decrease might be due to the independence of the patient. Generally, older people need assistance in transportation, and they may have multiple health conditions. This group of patients has more of a need for a convenient location with multiple services to reduce the frequency of the visits while getting all necessary services. One-stop clinic matches all those purposes, making multiple services in one visit possible. Across all age groups, women had higher percentage of one-stop shopping behavior than men. This may because men tended to delay seeking help for health (Galdas, Cheater, & Marshall, 2005). The number of services used in a one-stop visit may be affected by the condition of the patient, appointment availability in a specific location in 30 days, and the wiliness of the patient. In our study, majority of the one-stop visits used two services and three services. The maximum number of services used were six, but only occurred once (Table 4). This result does not suggest that our patients only have the need for two or three services at one location. Instead, our 50+ service locations are spread throughout the
36 28 whole city, as well as rural areas, our patient might have limited access to necessary services. One-stop clinic may increase the access to care and fix the differences between market demands and available health services. In our study, imaging services were the most frequently visited among one-stop visits, followed by outpatient lab service, primary care and urgent care. This result indicates that those services are in high demand. We recommend a one-stop clinic should consider primary care, urgent care, lab and imaging services as the must-have services. As for imaging services, ultra sound, x-ray and mammogram are must-have modalities, since they were counted more than 74% of all imaging visits (60,568 out of 81,682). When we investigate the combination patterns of one-stop visits, primary care was included for all the combinations. This is because primary care physicians (PCPs) are supposed to serve as navigator for patients' first stop. Any follow-up assessment or specialty referrals should be directed by their PCPs. The high volume of primary care, lab and imaging services combination also indicates this is a general practice model in the field. Primary care and urgent care combinations frequently occurred as well. This might be due to the availability of a patient's PCP. If a patient could not make an appointment with his/her PCP, and the condition was urgent but not emergency, they might visit urgent care since it does not require an appointment. If a one-stop clinic provided both primary care and urgent care services, physicians would have more flexibility to see their patients. Also, missed/canceled appointments and same day appointments would have more opportunities to be filled. As a result, the utilization will
37 29 increase, and urgent care would have more capacity for patients in need, which may lead to fewer visits to ER, since Urgent care is available and cheaper. Less ER visits will reduce the operation cost and also would improve the overall performance score of health care providers, which increases the chance to have share savings. In terms of insurance type, only self-pay patients were significantly different from Medicare patients. Self-pay patients were least likely to have one-stop visits. This may be due to their ability to pay. In practice, we normally consider these patients make less than livable wage, which means one more visit, one more expense, which includes the bill of visit, lost income, lost household production, etc. One-stop clinic will reduce the frequency of visits for same amount of health services. As of likelihood of one-stop shopping behavior, age and gender were highly significant. Elderly are more likely to have one-stop visits, which may be due to their complication of conditions. Women are more likely to have one-stop shopping behavior, this may due to their concern for their health, compared to men. These trends are similar between all patients and target area patients. If target area has large number of elderly and females, we may expect high demand for a one-stop clinic. Patients who missed an appointment may have different reasons. But one of the reasons can be logistic issues, such as lack of transportation, long waiting time, no time off from work, etc. The missing appointment behavior is highly significant associated with age and gender: women are more likely to miss an appointment. Some women maybe need to work and take care of the family. If a one-stop clinic provided adult care and children's care in the same location, it might fit those women's needs. The likelihood
38 30 of missing appointments slightly increased when age increased. This may be due to elderly having more needs of multiple services and multiple visits, but they might have difficulties in keeping those appointments, because of logistic reasons. One-stop clinic would be more convenience for patients. Patients who are likely to one-stop shop and who are likely to miss an appointment are demographically similar - elderly and women. This might indicate that patients who missed an appointment because of time consuming and inconvenient locations, even further supports the needs of one-stop clinic. Limitations This study has some limitations. First, the actual incomes of patients were not accurate in the Electronic Medical Records (EMR) system, since they were self-reported. Insurance types were used to substitute income and estimated actual income for future analysis. Second, we did not have any information of primary care physician referrals. Therefore, we could not investigate whether one-stop shopping behavior was due to referral or to patients' free choices. Third, our datasets did not come from the same source; different variables were generated in different datasets. We only had residence information of patients in the office visit data, therefore, when we were forced to match patient demographic information with the office visit data, results lost a few one-stop visits data in our analysis. Fourth, our datasets did not reflect the real visit information for women's health and pediatric care. This might due to report writer's coding errors which excluded tow outpatient sites located in hospitals. This issue can be easily fixed by rewriting the code. Finally, our data were limited to the health network ambulatory care
39 31 locations, which were nearly 30% of the market. The other 70% of the market could not be analyzed using current data. Conclusions Regardless of the limitation of the data, we had successfully analyzed the patterns of one-stop shopping behavior of the health network patients. This could represent 30% of market needs of a one-stop clinic. From the results, we could conclude that there is a local market for a one-stop clinic. The results could help the health network leaders to understanding the market opportunities of a one-stop clinic in Reno, and provide empirical evidence to define the target population. Also, policymakers can use this information to develop better health care delivery models. This is the first step to analyze market opportunities for a one-stop clinic in Reno. The next step is to estimate the volumes of different services in the target area. Then more financial data will be needed to analyze the cost and benefit of opening a one-stop clinic in a defined location.
40 32 Appendices Appendix A. Variables List Variable Variable Description Indicator of one-stop visit A patient had one-stop visit in 2013 was coded as "1", otherwise "0" Indicator of missed appointment Age Gender Insurance Type A patient had missing appointment (either office appointment or imaging appointment) in 2013 was coded as "1", otherwise "0" 0-4 = = = = = = = = = = = = = = = = = = 18 Female = 1, Male=0 Commercial: Yes = 1, No = 0 Medicare: Yes=1, No=0 (Reference Group) Medicaid: Yes=1, No=0 Self-pay: Yes=1, No=0
41 33 Appendix B Glossary of Terms Ambulatory care: A generic term for any health service for which an overnight in hospital is not required (e.g., outpatient services, X-ray, day surgery and medical diagnostics). Examples: Well-baby visits, abscess drainage, chemotherapy (Segen's Medical Dictionary, 2012). Primary care: Primary care is that care provided by physicians specifically trained for and skilled in comprehensive first contact and continuing care for persons with any undiagnosed sign, symptom, or health concern (the "undifferentiated" patient) not limited by problem origin (biological, behavioral, or social), organ system, or diagnosis. Primary care includes health promotion, disease prevention, health maintenance, counseling, patient education, diagnosis and treatment of acute and chronic illnesses in a variety of health care settings (e.g., office, inpatient, critical care, long-term care, home care, day care, etc.). Primary care is performed and managed by a personal physician often collaborating with other health professionals, and utilizing consultation or referral as appropriate. Primary care provides patient advocacy in the health care system to accomplish cost-effective care by coordination of health care services. Primary care promotes effective communication with patients and encourages the role of the patient as a partner in health care (American Hospital Association, 2012) Urgent care: Urgent care is defined as the delivery of ambulatory medical care outside of a hospital emergency department on a walk-in basis without a scheduled appointment (Urgent Care Association of America, 2008) One-stop clinic: An outpatient clinic provides integrated healthcare services at a single location.
MEDICARE ENROLLMENT, HEALTH STATUS, SERVICE USE AND PAYMENT DATA FOR AMERICAN INDIANS & ALASKA NATIVES
 American Indian & Alaska Native Data Project of the Centers for Medicare and Medicaid Services Tribal Technical Advisory Group MEDICARE ENROLLMENT, HEALTH STATUS, SERVICE USE AND PAYMENT DATA FOR AMERICAN
Choice PPO Retired Employees Health Program Non-Medicare Eligible Retired Members
 Choice PPO Retired Employees Health Program Non-Medicare Eligible Retired Members DEDUCTIBLE (per calendar year) Annual in-network deductible must be paid first for the following services: Imaging, hospital
A BETTER WAY. to invest in employee health
 A BETTER WAY to invest in employee health A BETTER WAY to take care of business Rely on A BETTER WAY Manage costs Invest in employee health Build the future 2 May 9, 2013 Kaiser Permanente 2012. All Rights
Quality of Care of Medicare- Medicaid Dual Eligibles with Diabetes. James X. Zhang, PhD, MS The University of Chicago
 Quality of Care of Medicare- Medicaid Dual Eligibles with Diabetes James X. Zhang, PhD, MS The University of Chicago April 23, 2013 Outline Background Medicare Dual eligibles Diabetes mellitus Quality
Impact of Financial and Operational Interventions Funded by the Flex Program
 Impact of Financial and Operational Interventions Funded by the Flex Program KEY FINDINGS Flex Monitoring Team Policy Brief #41 Rebecca Garr Whitaker, MSPH; George H. Pink, PhD; G. Mark Holmes, PhD University
Scottish Hospital Standardised Mortality Ratio (HSMR)
") ` 2016 Scottish Hospital Standardised Mortality Ratio (HSMR) Methodology & Specification Document Page 1 of 14 Document Control Version 0.1 Date Issued July 2016 Author(s) Quality Indicators Team Comments
` 2016 Scottish Hospital Standardised Mortality Ratio (HSMR) Methodology & Specification Document Page 1 of 14 Document Control Version 0.1 Date Issued July 2016 Author(s) Quality Indicators Team Comments
Performance Measurement of a Pharmacist-Directed Anticoagulation Management Service
 Hospital Pharmacy Volume 36, Number 11, pp 1164 1169 2001 Facts and Comparisons PEER-REVIEWED ARTICLE Performance Measurement of a Pharmacist-Directed Anticoagulation Management Service Jon C. Schommer,
Orange County s Health Care Coverage Initiative Network Structure: Interim Findings
 Orange County s Health Care Coverage Initiative Network Structure: Interim Findings Introduction The HCCI Demonstration Program in Orange County provides health care to low-income uninsured adults and
UTILIZATION MANAGEMENT AND CARE COORDINATION Section 8
 Overview The focus of WellCare s Utilization Management (UM) Program is to provide members access to quality care and to monitor the appropriate utilization of services. WellCare s UM Program has five
Fast Facts 2018 Clinical Integration Performance Measures
 IMPORTANT: LHP providers who do not achieve a minimum CI Score in 2018 will not be eligible for incentive distribution and will be placed on a monitoring plan for the 2019 performance year. For additional
Frequently Asked Questions (FAQ) The Harvard Pilgrim Independence Plan SM
 The Harvard Pilgrim Independence Plan SM") Frequently Asked Questions (FAQ) The Harvard Pilgrim Independence Plan SM Plan Year: July 2010 June 2011 Background The Harvard Pilgrim Independence Plan was developed in 2006 for the Commonwealth of Massachusetts
Frequently Asked Questions (FAQ) The Harvard Pilgrim Independence Plan SM Plan Year: July 2010 June 2011 Background The Harvard Pilgrim Independence Plan was developed in 2006 for the Commonwealth of Massachusetts
Repricing Specialty Hospital Outpatient Services Using Ambulatory Surgery Center Prices
 Repricing Specialty Hospital Outpatient Services Using Ambulatory Surgery Center Prices Deborah Healy, Ph.D., Jerry Cromwell, Ph.D., and Frederick G. Thomas, Ph.D., C.P.A. This article explores whether
HMO West Pennsylvania Employees Benefit Trust Fund Benefit Highlights Active Eligible Members. Providers None $6,850 single / $13,700 family
 Benefit Provision HMO Network Providers None $6,850 single / $13,700 family DEDUCTIBLE (Per Calendar Year) OUT-OF-POCKET MAXIMUM (includes costs for medical, mental health and substance abuse benefits
Outpatient Hospital Facilities
 Outpatient Hospital Facilities Chapter 6 Chapter Outline Introduce students to 1. Different outpatient facilities 2. Different departments involved in the reimbursement process 3. The Chargemaster 4. Terminology
PBGH ANALYSIS. Highlights: Anthem Strengths and Weaknesses
 Methods Description: Health Plan Shopping Services Evaluation PBGH ANALYSIS Executive Summary: Anthem The brief provides purchasers with an evaluation of the consumer medical care and provider online shopping
Survey of Nurses 2015
 Survey of Nurses 2015 Prepared by Public Sector Consultants Inc. Lansing, Michigan www.pscinc.com There are an estimated... 104,351 &17,559 LPNs RNs onehundredfourteenthousdfourhundredtwentyregisterednursesactiveinmichigan
2018 Medicare Advantage Dual Eligible Special Needs Plan (DSNP) & Model of Care (MOC) Overview
 & Model of Care (MOC) Overview") 2018 Medicare Advantage Dual Eligible Special Needs Plan (DSNP) & Model of Care (MOC) Overview Medicare Advantage (MA) Program Part C Medicare Advantage Medicare Part A and B benefits are administered
2018 Medicare Advantage Dual Eligible Special Needs Plan (DSNP) & Model of Care (MOC) Overview Medicare Advantage (MA) Program Part C Medicare Advantage Medicare Part A and B benefits are administered
2018 Medicare Advantage Dual Eligible Special Needs Plan (DSNP), Chronic Special Needs Plan ESRD (CSNP ESRD) & Model of Care (MOC) Overview
, Chronic Special Needs Plan ESRD (CSNP ESRD) & Model of Care (MOC) Overview") 2018 Medicare Advantage Dual Eligible Special Needs Plan (DSNP), Chronic Special Needs Plan ESRD (CSNP ESRD) & Model of Care (MOC) Overview Medicare Advantage (MA) Program Part C Medicare Advantage Medicare
2018 Medicare Advantage Dual Eligible Special Needs Plan (DSNP), Chronic Special Needs Plan ESRD (CSNP ESRD) & Model of Care (MOC) Overview Medicare Advantage (MA) Program Part C Medicare Advantage Medicare
2016 Survey of Michigan Nurses
 2016 Survey of Michigan Nurses Survey Summary Report November 15, 2016 Office of Nursing Policy Michigan Department of Health and Human Services Prepared by the Michigan Public Health Institute Table of
Secondary Care. Chapter 14
 Secondary Care Chapter 14 Objectives Define secondary care Identifies secondary care providers, Discuss the a description of access to and utilization of secondary-care services Discuss policy issues related
MACRA Frequently Asked Questions
 Following the release of the Quality Payment Program Interim Final Rule, the American Medical Association (AMA) conducted numerous informational and training sessions for physicians and medical societies.
June 25, Shamis Mohamoud, David Idala, Parker James, Laura Humber. AcademyHealth Annual Research Meeting
 Evaluation of the Maryland Health Home Program for Medicaid Enrollees with Severe Mental Illnesses or Opioid Substance Use Disorder and Risk of Additional Chronic Conditions June 25, 2018 Shamis Mohamoud,
The MITRE Corporation Plan
 Benefit Type Plan Year Type Calendar Year Annual Medical Out of (for certain services) Employee Employee + 1 Family Annual Prescription Drug Out of Employee Employee + 1 Family Copayments: One copay per
PBGH ANALYSIS. Highlights: Aetna Strengths and Weaknesses
 Methods Description: Health Plan Shopping Services Evaluation PBGH ANALYSIS Executive Summary: Aetna This report evaluates Aetna s online medical care and provider shopping services that are intended to
NHS Diagnostic Waiting Times and Activity Data
 NHS Diagnostic Waiting Times and Activity Data 1 NHS Diagnostic Waiting Times and Activity Data July 2018 Monthly Report Version number: 1 First published: 13 th September 2018 Prepared by: Operational
NHS Diagnostic Waiting Times and Activity Data
 NHS Diagnostic Waiting Times and Activity Data 1 NHS Diagnostic Waiting Times and Activity Data November 2017 Monthly Report Version number: 1 First published: 11 th January 2018 Prepared by: Operational
WHAT DOES MEDICALLY NECESSARY MEAN?
 WHAT DOES MEDICALLY NECESSARY MEAN? Your Primary Care Provider (PCP) will help you get the services you need that are medically necessary as defined below. Medically Necessary means appropriate and necessary
Services That Require Prior Authorization
 Services That Require Prior Authorization Some of the services listed in the Medical Benefits Chart are covered only if your doctor or other network provider gets approval in advance (sometimes called
Telemedicine Guidance
 Telemedicine Guidance GEORGIA DEPARTMENT OF COMMUNITY HEALTH DIVISION OF MEDICAID Revised: October 1, 2017 Policy Revisions Record Telemedicine Guidance 2017 REVISION DATE Oct. 1, 2017 SECTION REVISION
Appendix. We used matched-pair cluster-randomization to assign the. twenty-eight towns to intervention and control. Each cluster,
 Yip W, Powell-Jackson T, Chen W, Hu M, Fe E, Hu M, et al. Capitation combined with payfor-performance improves antibiotic prescribing practices in rural China. Health Aff (Millwood). 2014;33(3). Published
Predicting Transitions in the Nursing Workforce: Professional Transitions from LPN to RN
 Predicting Transitions in the Nursing Workforce: Professional Transitions from LPN to RN Cheryl B. Jones, PhD, RN, FAAN; Mark Toles, PhD, RN; George J. Knafl, PhD; Anna S. Beeber, PhD, RN Research Brief,
2016 Embedded and Rapid Response Care Management
 2016 Embedded and Rapid Response Care Management Program Evaluation Our mission is to improve the health and quality of life of our members 2016 Embedded and Rapid Response Care Management Program Evaluation
HOME DIALYSIS REIMBURSEMENT AND POLICY. Tonya L. Saffer, MPH Senior Health Policy Director National Kidney Foundation
 HOME DIALYSIS REIMBURSEMENT AND POLICY Tonya L. Saffer, MPH Senior Health Policy Director National Kidney Foundation Objectives Understand the changing dynamics of use of home dialysis Know the different
2016 Complex Case Management. Program Evaluation. Our mission is to improve the health and quality of life of our members
 2016 Complex Case Management Program Evaluation Our mission is to improve the health and quality of life of our members 2016 Complex Case Management Program Evaluation Table of Contents Program Purpose
NHS Diagnostic Waiting Times and Activity Data
 NHS Diagnostic Waiting Times and Activity Data 1 NHS Diagnostic Waiting Times and Activity Data February 2018 Monthly Report Version number: 1 First published: 12 th April 2018 Prepared by: Operational
Analysis of 340B Disproportionate Share Hospital Services to Low- Income Patients
 Analysis of 340B Disproportionate Share Hospital Services to Low- Income Patients March 12, 2018 Prepared for: 340B Health Prepared by: L&M Policy Research, LLC 1743 Connecticut Ave NW, Suite 200 Washington,
YOUR HEALTH INFORMATION EXCHANGE
 YOUR HEALTH INFORMATION EXCHANGE Introduction to Health Information Exchange Healthcare organizations are experiencing substantial pressures from initiatives and reforms such as new payment models, care
SECTION V. HMO Reimbursement Methodology
 SECTION V. HMO Reimbursement Methodology Overview V-2 SFHN s Financial Responsibility Provider Payment Methodology Chart Primary Care Physicians V-4 Overview Capitated Primary Care Services Services Reimbursed
Survey of Physicians Utilization of Home Health Services June 2009
 Survey of Physicians Utilization of Home Health Services June 2009 Introduction By the year 2030 the number of adults age 65 and older in the United States will effectively double. 1 There are several
Total Cost of Care Technical Appendix April 2015
 Total Cost of Care Technical Appendix April 2015 This technical appendix supplements the Spring 2015 adult and pediatric Clinic Comparison Reports released by the Oregon Health Care Quality Corporation
Improving Hospital Performance Through Clinical Integration
 white paper Improving Hospital Performance Through Clinical Integration Rohit Uppal, MD President of Acute Hospital Medicine, TeamHealth In the typical hospital, most clinical service lines operate as
Best Practices in Managing Patients with Rheumatoid Arthritis. Wilmington Health. Using RAPID 3 Assessments to Improve Patient Care
 Best Practices in Managing Patients with Rheumatoid Arthritis Wilmington Health Using RAPID 3 Assessments to Improve Patient Care Organizational Profile Wilmington Health is structured as a multispecialty
NHS Diagnostic Waiting Times and Activity Data
 NHS Diagnostic Waiting Times and Activity Data 1 NHS Diagnostic Waiting Times and Activity Data March 2017 Monthly Report Version number: 1 First published: 11 th May 2017 Prepared by: Operational Information
CO-PAYMENT BOOK Las Vegas Blvd. South Suite 107 Las Vegas, NV
 CO-PAYMENT BOOK 1901 Las Vegas Blvd. South Suite 107 Las Vegas, NV 89104 702-733-9938 www.culinaryhealthfund.org Revised January 2018 (Replaces Co-Payment Book dated June 2017) TABLE OF CONTENTS 4 5 6
NHS Diagnostic Waiting Times and Activity Data
 NHS Diagnostic Waiting Times and Activity Data 1 NHS Diagnostic Waiting Times and Activity Data May 2015 Monthly Report Version number: 1 First published: 8 th July 2015 Prepared by: NHS England Analytical
2017 SPECIALTY REPORT ANNUAL REPORT
 2017 SPECIALTY REPORT ANNUAL REPORT National Commission on Certification of Physician Assistants Table of Contents Message from the President... 3 About the Data Collection and Methodology...4 All Specialties....
OUTPATIENT LIVER INTRODUCTION:
 OUTPATIENT LIVER INTRODUCTION: The purpose of the Liver rotation is to expose residents in internal medicine to acute and chronic liver diseases. Emphasis is on diagnosis of liver diseases by taking a
NHS Diagnostic Waiting Times and Activity Data
 NHS Diagnostic Waiting Times and Activity Data 1 NHS Diagnostic Waiting Times and Activity Data January 2017 Monthly Report Version number: 1 First published: 9 th March 2017 Prepared by: Operational Information
Technical Notes on the Standardized Hospitalization Ratio (SHR) For the Dialysis Facility Reports
 For the Dialysis Facility Reports") Technical Notes on the Standardized Hospitalization Ratio (SHR) For the Dialysis Facility Reports July 2017 Contents 1 Introduction 2 2 Assignment of Patients to Facilities for the SHR Calculation 3 2.1
Technical Notes on the Standardized Hospitalization Ratio (SHR) For the Dialysis Facility Reports July 2017 Contents 1 Introduction 2 2 Assignment of Patients to Facilities for the SHR Calculation 3 2.1
NHS Diagnostic Waiting Times and Activity Data
 NHS Diagnostic Waiting Times and Activity Data 1 NHS Diagnostic Waiting Times and Activity Data March 2018 Monthly Report Version number: 1 First published: 10 th May 2018 Prepared by: Operational Information
LOUISIANA MEDICAID PROGRAM ISSUED: 08/15/12 REPLACED: 07/01/11 CHAPTER 25: HOSPITAL SERVICES SECTION 25.3: OUTPATIENT SERVICES PAGE(S) 11
 11") OUTPATIENT SERVICES Outpatient hospital services are defined as diagnostic and therapeutic services rendered under the direction of a physician or dentist to an outpatient in an enrolled, licensed and
OUTPATIENT SERVICES Outpatient hospital services are defined as diagnostic and therapeutic services rendered under the direction of a physician or dentist to an outpatient in an enrolled, licensed and
Population and Sampling Specifications
 Mat erial inside brac ket s ( [ and ] ) is new to t his Specific ati ons Manual versi on. Introduction Population Population and Sampling Specifications Defining the population is the first step to estimate
Adopting Accountable Care An Implementation Guide for Physician Practices
 Adopting Accountable Care An Implementation Guide for Physician Practices EXECUTIVE SUMMARY November 2014 A resource developed by the ACO Learning Network www.acolearningnetwork.org Executive Summary Our
MaRS 2017 Venture Client Annual Survey - Methodology
 MaRS 2017 Venture Client Annual Survey - Methodology JUNE 2018 TABLE OF CONTENTS Types of Data Collected... 2 Software and Logistics... 2 Extrapolation... 3 Response rates... 3 Item non-response... 4 Follow-up
What s Wrong with Healthcare?
 What s Wrong with Healthcare? Dan Murrey, MD, MPP Chief Executive Officer Agenda What s wrong with healthcare in the US? What would make it better? How can you help? What s wrong with US healthcare? What
Addressing the growth of ancillary services in physicians offices
 C h a p t e r8 Addressing the growth of ancillary services in physicians offices C H A P T E R 8 Addressing the growth of ancillary services in physicians offices Chapter summary In this chapter The Ethics
MERMAID SERIES: SECONDARY DATA ANALYSIS: TIPS AND TRICKS
 MERMAID SERIES: SECONDARY DATA ANALYSIS: TIPS AND TRICKS Sonya Borrero Natasha Parekh (Adapted from slides by Amber Barnato) Objectives Discuss benefits and downsides of using secondary data Describe publicly
2013 Physician Inpatient/ Outpatient Revenue Survey
 Physician Inpatient/ Outpatient Revenue Survey A survey showing net annual inpatient and outpatient revenue generated by physicians in various specialties on behalf of their affiliated hospitals Merritt
Suicide Among Veterans and Other Americans Office of Suicide Prevention
 Suicide Among Veterans and Other Americans 21 214 Office of Suicide Prevention 3 August 216 Contents I. Introduction... 3 II. Executive Summary... 4 III. Background... 5 IV. Methodology... 5 V. Results
NHS Diagnostic Waiting Times and Activity Data
 NHS Diagnostic Waiting Times and Activity Data 1 NHS Diagnostic Waiting Times and Activity Data February 2016 Monthly Report Version number: 1 First published: 14 th April 2016 Prepared by: Operational
Patient survey report Survey of people who use community mental health services gether NHS Foundation Trust
 Patient survey report 2014 Survey of people who use community mental health services 2014 National NHS patient survey programme Survey of people who use community mental health services 2014 The Care
Table 8.2 FORM CMS County Hospital - Fiscal Year One Worksheet A
 Table 8.2 Worksheet A A-6 Reclassified A-8 Net Expenses Salaries Other Total Reclassifications Trial Balance Adjustments For Allocation Cost Center Descriptions 1 2 3 4 5 6 7 General Service Cost Centers
2017 Catastrophic Care. Program Evaluation. Our mission is to improve the health and quality of life of our members
 2017 Catastrophic Care Program Evaluation Our mission is to improve the health and quality of life of our members 2017 Catastrophic Care Program Evaluation Table of Contents Program Purpose Page 1 Goals
Benefit Criteria for Outpatient Observation Services to Change for Texas Medicaid
 Benefit Criteria for Outpatient Observation Services to Change for Texas Medicaid Information posted on October 8, 2010 Effective for dates of service on or after December 1, 2010, the benefit criteria
Prepared for North Gunther Hospital Medicare ID August 06, 2012
 Prepared for North Gunther Hospital Medicare ID 000001 August 06, 2012 TABLE OF CONTENTS Introduction: Benchmarking Your Hospital 3 Section 1: Hospital Operating Costs 5 Section 2: Margins 10 Section 3:
For Large Groups Health Benefit Single Plan (HSA-Compatible)
") Financial Features (DED 1 ) (PBP 2 ) (DED is the amount the member is responsible for before Florida Blue pays) Out-of-Network Inpatient Hospital Facility Services Per Admission (PAD) Coinsurance (Coinsurance
Financial Features (DED 1 ) (PBP 2 ) (DED is the amount the member is responsible for before Florida Blue pays) Out-of-Network Inpatient Hospital Facility Services Per Admission (PAD) Coinsurance (Coinsurance
State of NM Group Benefits Plan Plan Year: January-December 2017
 State of NM Group Benefits Plan Plan Year: January-December 2017 Who We Are THE CONSUMER S CHOICE Considered Best Healthcare Organization in New Mexico, Best Health Plan and Best Doctors for more than
Findings Brief. NC Rural Health Research Program
 Safety Net Clinics Serving the Elderly in Rural Areas: Rural Health Clinic Patients Compared to Federally Qualified Health Center Patients BACKGROUND Andrea D. Radford, DrPH; Victoria A. Freeman, RN, DrPH;
U.S. Healthcare Problem
 U.S. Healthcare Problem U.S. Federal Spending GDP (%) Source: Congressional Budget Office This graph shows that government has to spend a lot of more money in healthcare in the future and it is growing
Healthcare- Associated Infections in North Carolina
 2018 Healthcare- Associated Infections in North Carolina Reference Document Revised June 2018 NC Surveillance for Healthcare-Associated and Resistant Pathogens Patient Safety Program NC Department of Health
An Analysis of Medicaid Costs for Persons with Traumatic Brain Injury While Residing in Maryland Nursing Facilities
 An Analysis of Medicaid for Persons with Traumatic Brain Injury While Residing in Maryland Nursing Facilities December 19, 2008 Table of Contents An Analysis of Medicaid for Persons with Traumatic Brain
Creating a Patient-Centered Payment System to Support Higher-Quality, More Affordable Health Care. Harold D. Miller
 Creating a Patient-Centered Payment System to Support Higher-Quality, More Affordable Health Care Harold D. Miller First Edition October 2017 CONTENTS EXECUTIVE SUMMARY... i I. THE QUEST TO PAY FOR VALUE
Risk Adjusted Diagnosis Coding:
 Risk Adjusted Diagnosis Coding: Reporting ChronicDisease for Population Health Management Jeri Leong, R.N., CPC, CPC-H, CPMA, CPC-I Executive Director 1 Learning Objectives Explain the concept Medicare
time to replace adjusted discharges
 REPRINT May 2014 William O. Cleverley healthcare financial management association hfma.org time to replace adjusted discharges A new metric for measuring total hospital volume correlates significantly
CRS Report for Congress Received through the CRS Web
 CRS Report for Congress Received through the CRS Web Order Code RS20386 Updated April 16, 2001 Medicare's Skilled Nursing Facility Benefit Summary Heidi G. Yacker Information Research Specialist Information
Patient survey report National children's inpatient and day case survey 2014 The Mid Yorkshire Hospitals NHS Trust
 Patient survey report 2014 National children's inpatient and day case survey 2014 National NHS patient survey programme National children's inpatient and day case survey 2014 The Care Quality Commission
The TeleHealth Model THE TELEHEALTH SOLUTION
 The Model 1 CareCycle Solutions The Solution Calendar Year 2011 Data Company Overview CareCycle Solutions (CCS) specializes in managing the needs of chronically ill patients through the use of Interventional
Medical Management Program
 Medical Management Program Introduction Molina Healthcare maintains a medical management program to ensure patient safety as well as detect and prevent Fraud, Waste and Abuse in its programs. The Molina
Issue Brief. Maine s Health Care Workforce. January Maine s Unique Challenge. Current State of Maine s Health Care Workforce
 January 2009 Issue Brief Maine s Health Care Workforce Affordable, quality health care is critical to Maine s continued economic development and quality of life. Yet substantial shortages exist at almost
Hospital Discharge Data, 2005 From The University of Memphis Methodist Le Bonheur Center for Healthcare Economics
 Hospital Discharge Data, 2005 From The University of Memphis Methodist Le Bonheur Center for Healthcare Economics August 22, 2008 Potentially Avoidable Pediatric Hospitalizations in Tennessee, 2005 Cyril
2. What is the main similarity between quality assurance and quality improvement?
 Chapter 6 Review Questions 1. Quality improvement focuses on: a. Individual clinicians or system users b. Routine measurement of performance c. Information technology issues d. Constant training 2. What
Urgent Care Centers and Free-Standing Emergency Rooms: A Necessary Alternative under the ACA
 Urgent Care Centers and Free-Standing Emergency Rooms: A Necessary Alternative under the ACA Kim Harvey Looney, Waller Lansden Dortch and Davis Mollie K. O Brien, Epstein Becker Green Jon Sundock, CareSpot
Implications of Hospital Employment of Physicians on Medicare & Beneficiaries
 Implications of Hospital Employment of Physicians on Medicare & Beneficiaries November 2017 Analysis by Avalere Health, LLC About the Physicians Advocacy Institute The Physicians Advocacy Institute (PAI)
Satisfaction and Experience with Health Care Services: A Survey of Albertans December 2010
 Satisfaction and Experience with Health Care Services: A Survey of Albertans 2010 December 2010 Table of Contents 1.0 Executive Summary...1 1.1 Quality of Health Care Services... 2 1.2 Access to Health
Annual Notice of Changes for 2017
 Network PlatinumPlus (PPO) offered by Network Health Insurance Corporation Annual Notice of Changes for 2017 You are currently enrolled as a member of Network PlatinumPlus. Next year, there will be some
Facility Survey of Providers of ESRD Therapy. Number of Dialysis and Transplant Units 1989 and Number of Units ,660 2,421 1,669
 Annual Data Report Facility Survey of Providers of ESRD Therapy Chapter X Annual Facility Survey of Providers of ESRD Therapy T he Annual Facility Survey conducted, by HCFA, is the source of all the results
2017 Quality Reporting: Claims and Administrative Data-Based Quality Measures For Medicare Shared Savings Program and Next Generation ACO Model ACOs
 2017 Quality Reporting: Claims and Administrative Data-Based Quality Measures For Medicare Shared Savings Program and Next Generation ACO Model ACOs June 15, 2017 Rabia Khan, MPH, CMS Chris Beadles, MD,
Patient survey report Survey of people who use community mental health services Boroughs Partnership NHS Foundation Trust
 Patient survey report 2013 Survey of people who use community mental health services 2013 The survey of people who use community mental health services 2013 was designed, developed and co-ordinated by
Factors that Impact Readmission for Medicare and Medicaid HMO Inpatients
 The College at Brockport: State University of New York Digital Commons @Brockport Senior Honors Theses Master's Theses and Honors Projects 5-2014 Factors that Impact Readmission for Medicare and Medicaid
Blue Cross Premier Bronze
 An individual PPO health plan from Blue Cross Blue Shield of Michigan. You will have a broad choice of doctors and hospitals within BCBSM s unsurpassed statewide PPO network including nationwide coverage.
Navy and Marine Corps Public Health Center. Fleet and Marine Corps Health Risk Assessment 2013 Prepared 2014
 Navy and Marine Corps Public Health Center Fleet and Marine Corps Health Risk Assessment 2013 Prepared 2014 The enclosed report discusses and analyzes the data from almost 200,000 health risk assessments
KY Medicaid Co-pays Except for the Pharmacy Non-Preferred co-pay, co-pays do not apply to the following:
 This is a list of current covered services and co-pays. Except for the Pharmacy Non-Preferred co-pay, co-pays do not apply to the following: Non-KCHIP children Children under 19 in foster care Pregnant
SUMMARY OF BENEFITS. Hamilton County Department of Education Network Copay Plan. Connecticut General Life Insurance Co.
 SUMMARY OF BENEFITS Connecticut General Life Insurance Co. Hamilton County Department of Education Annual deductibles and maximums Lifetime maximum Pre-Existing Condition Limitation (PCL) Coinsurance All
A Comparison of Closed Rural Hospitals and Perceived Impact
 A Comparison of Closed Rural Hospitals and Perceived Impact Sharita R. Thomas, MPP; Brystana G. Kaufman, BA; Randy K. Randolph, MRP; Kristie Thompson, MA; Julie R. Perry; George H. Pink, PhD BACKGROUND
Emerging Outpatient CDI Drivers and Technologies
 7th Annual Association for Clinical Documentation Improvement Specialists Conference Emerging Outpatient CDI Drivers and Technologies Elaine King, MHS, RHIA, CHP, CHDA, CDIP, FAHIMA Outpatient Payment
An Overview of NCQA Relative Resource Use Measures. Today s Agenda
 An Overview of NCQA Relative Resource Use Measures Today s Agenda The need for measures of Resource Use Development and testing RRU measures Key features of NCQA RRU measures How NCQA calculates benchmarks
Low-Income Health Program (LIHP) Evaluation Proposal
 Evaluation Proposal") Low-Income Health Program (LIHP) Evaluation Proposal UCLA Center for Health Policy Research & The California Medicaid Research Institute Background In November of 2010, California s Bridge to Reform 1115
Low-Income Health Program (LIHP) Evaluation Proposal UCLA Center for Health Policy Research & The California Medicaid Research Institute Background In November of 2010, California s Bridge to Reform 1115
UNIVERSITY OF THE CUMBERLANDS MEDICAL BENEFITS SCHEDULE
 November 1, 2016 UNIVERSITY OF THE CUMBERLANDS MEDICAL BENEFITS SCHEDULE NETWORK NON-NETWORK Lifetime Maximum Benefit Unlimited Unlimited Annual Deductible (Single/Family) $500/$1,000 $1,000/$2,000 Maximum
KY Medicaid Co-pays. Acute admissions medical Per admission diagnoses $0 Acute health care related to. Per admission substance abuse and/or for
 This is a list of current covered services and co-pays. Except for the Pharmacy Non-Preferred co-pay, co-pays do not apply to the following: Non-KCHIP children Children under 19 in foster care Pregnant
Predicting use of Nurse Care Coordination by Patients in a Health Care Home
 Predicting use of Nurse Care Coordination by Patients in a Health Care Home Catherine E. Vanderboom PhD, RN Clinical Nurse Researcher Mayo Clinic Rochester, MN USA 3 rd Annual ICHNO Conference Chicago,