Satisfaction and Experience with Health Care Services: A Survey of Albertans December 2010
|
|
|
- Ella Richard
- 5 years ago
- Views:
Transcription

1 Satisfaction and Experience with Health Care Services: A Survey of Albertans 2010 December 2010
2
3 Table of Contents 1.0 Executive Summary Quality of Health Care Services Access to Health Care Services Satisfaction with Health Care Services Received Personal Family Doctors Preventative Care Community Walk-in Clinics Emergency Department Services MRI Public Health Mental Health Services Specialist Services Coordination of Care Patient Safety Serious Complaints Health Link Introduction How to Interpret Provincial and Health Zone Level Results How to Interpret the Weighted Result Graphs How to Interpret the Multivariate Analysis Graphs Characteristics of the 2010 Survey Sample Age and Sex Distributions and Sample Weighting Individual and Household Characteristics of the Sample Contact with Health Care Services Most Recent Contact with Alberta s Health Care System By Health Zone and Year of Survey By Demographic Factors By Health Service Area Access to Health Care Services Perception of Access to Health Care Services By Health Zone and Year Actual Experiences Accessing Health Care Services By Health Zone and Year Perceived Access versus Rating of Overall Access for Service Specific Health Service Area Experience of Accessing Health Care Services in the Past Year, by Demographic Factors and Selected Variables (Multivariate Analysis) Quality of Health Care Services Perceived Quality of Alberta s Health Care System i
4 By Health Zone Overall Quality of Health Care Services Actually Received Overall Quality of Healthcare Services Personally Received by Health Zone Perceived Quality of Health Care Services Received in the Past Year, by Demographic Factors and Selected Variables (Multivariate Analysis) Satisfaction with Health Care Services Overall Satisfaction By Health Zone Summary of Satisfaction with Various Health Care Services Received, by Year of Survey Overall Satisfaction with Health Care Services Received in the Past Year, by Demographic Factors and Selected Variables (Multivariate Analysis) Coordination of Health Care Services Overall Coordination By Health Zone Coordination of Specific Health Care Services Personal Family Doctor Services Respondents Who Currently Have a Personal Family Doctor By Health Zone and Survey Year By Demographic Factors Length of Time Respondent Has Been with Personal Family Doctor By Health Zone and Year Practice Setting of Personal Family Doctor By Health Zone By Health Zone Care for Urgent but Minor Condition When Personal Family Doctor s Office was Open Care for Urgent but Minor Condition When Personal Family Doctor s Office was Closed Do Not Have a Personal Family Doctor Health Care Options When Respondent Does Not Have a Personal Family Doctor Access to Personal Family Doctor by Year Access to Personal Family Doctor by Health Zone and Year Quality of Family Doctor Care By Health Zone Satisfaction with Personal Family Doctor Services By Health Zone and Year of Survey Personal Family Doctor Satisfaction with Specific Attributes Preventative Care Healthy Diet and Healthy Eating Habits Exercise and Physical Activity Feeling Sad, Empty or Depressed Encouraged To Talk About All Your Health Concerns ii
5 Satisfaction with Health Care Services Personally Received in Alberta from a Personal Family Doctor in the Past Year, by Demographic Factors and Selected Variables (Multivariate Analysis) Community Walk-in Clinics Use of Walk-in Clinics Access to Walk-in Clinics By Health Zone Quality of Walk-in Clinic Doctor By Health Zone Satisfaction with Walk-in Clinics By Health Zone Satisfaction with Specific Community Walk-in Clinic Attributes Satisfaction with Community Walk-in Clinic Services in the Past Year, by Demographic Factors and Selected Variables (Multivariate Analysis) Emergency Department Services Use of Emergency Department Services Reason for Choosing Emergency Department Services Instead of Somewhere Else Self rated Urgency of Health Problem Emergency Department Wait Times Access to Emergency Department Services By Health Zone and Year of Survey Quality of Care in the Emergency Department By Health Zone Satisfaction with Emergency Department Services By Health Zone Re-Assessment Frequency of Re-Assessment While Waiting For Physician Ability to Get Staff Member Help Considered Leaving without Being Seen Left Without Being Seen Factors Associated with Actually Leaving the Emergency Department Prior to Treatment, by Demographic Factors and Selected Variables (Multivariate Analysis) Specialist Services Use of Specialist Services Access to Specialist Services By Health Zone and Year By Wait Time By Wait Time at Office Quality of Care Received from Specialist By Health Zone Satisfaction with Specialist Services By Health Zone iii
6 Satisfaction with Specific Attributes Satisfaction with Health Care Services Personally Received in Alberta from a Specialist in the Past Year, by Demographic Factors and Selected Variables (Multivariate Analysis) Hospital Care Quality of Hospital Care Inpatient (Overnight) Outpatient (Day) Access to Hospital Care Inpatient (Overnight) Outpatient (Day) Mental Health Services Use of Mental Health Services by Location Access to Mental Health Services Satisfaction with Mental Health Services Satisfaction with the Way Health Care Providers Worked Together Discrimination Diagnostic imaging Use of Magnetic Resonance Imaging (MRI) Services By Public or Private Provider Access to MRI Services By Health Zone MRI Wait Time Satisfaction with MRI Services By Health Zone Diagnostic Imaging Other than MRIs Access to Other Diagnostic Imaging Services By Health Zone Satisfaction with Other Diagnostic Imaging Services By Health Zone Pharmacist Services Use of Pharmacist Services Satisfaction with Pharmacist Services Public Health Hand Washing Self Hand Washing & Putting on New Gloves Health care workers Patient Safety Experience of Harm Experience with Unexpected Harm By Health Zone Recipient of Unexpected Harm Notification of Unexpected Harm iv
7 Description of Unexpected Harm Health Care Setting Patient Complaints about Health Care Services Experiences of Serious Complaint By Health Zone Action Taken to Address Serious Complaint Satisfaction with How Complaint was Handled Process and Experience with Lodging Complaint Health Care Setting Serious Complaint Referred To Focus of Serious Complaint Health Link Awareness of Health Link By Health Zone Use of Health Link Demographics Satisfaction with Health Link Followed Recommendations by the Health Link Nurse In summary v
8
9 1.0 Executive Summary Listening and responding to Albertans to continuously improve the quality and safety of Alberta s health system is the mission of the Health Quality Council of Alberta (HQCA). This mission is realized through the HQCA s legislated mandate to survey Albertans on their experience with the health system and the services it provides. The HQCA conducted our first population-based survey in Additional surveys followed in 2004, 2006 and Each survey looked at overall quality, access and satisfaction with specific health services at both the provincial level and within each of the nine former health regions. The 2010 survey again measures satisfaction, access and other experiences with health care services through the eyes of Albertans who actually experienced the system in 2009 and identifies areas that are working well and those that need improvement. Where possible, it compares the 2010 results with those from previous years. Specific services assessed in the 2010 survey included family doctors, specialist physicians, community walk-in clinics, emergency departments, hospitals, pharmacists, diagnostic imaging, mental health services, and Health Link. In addition, patient safety and patient complaints are examined. This report also looks at the relationships between respondent characteristics and respondents evaluations of the health care system. Together, the five surveys provide an assessment of the public s opinion about Alberta s health care system over time. Caution must be used, however, in interpreting differences from one survey year to the next as evidence of trends over time. Differences may reflect actual trends over time or may also reflect sampling error and differences in survey methodology from year to year. Population Research Laboratory at the University of Alberta conducted the 2010 survey. They did 5,010 telephone interviews with Albertans aged 18 years and older between February 24 and May 11, With previous surveys, analysis was done according to the nine former health regions. For comparison purposes in 2010, we re-categorized the health regions into the five new zones: South, Calgary, Central, Edmonton and North. The 2010 response rate was 38% and the margin of error was comparable to previous years at approximately ±1.5% 19 times out of 20. The information in this report is vital in identifying what Albertans views and perceptions are with the quality, safety and performance of the publicly funded health care system. It will also inform the stakeholders (Alberta Health Services, Alberta Health and Wellness and health care professionals) responsible for health care service delivery about Albertans experience with the health services they receive and the impact those experiences have on their overall ratings of the health system. The 2010 survey was conducted after the creation of Alberta Health Services and the amalgamation of 12 formerly separate health entities in Alberta, including the nine geographically based health authorities, Alberta Alcohol and Drug Abuse Commission (AADAC), Alberta Mental Health Board, and Alberta Cancer Board. The results provide a baseline for measuring future quality improvement initiatives under the new organizational structure. 1
10 Table 1.1 Historical survey timelines Year HQCA Survey Overview Inaugural survey 2003; 2004; health regions March 10-May 27: survey interviews conducted last measure of previous health region structure May 15: Alberta Health Services created February 24-May 11: survey interviews conducted first measure of patient satisfaction and experience with new Alberta Health Services structure 1.1 Quality of Health Care Services Based on perceptions of the quality of services, 65% of Albertans believe the quality of health care services in the province is excellent or good. Seventy-five percent () of those who actually received services 1 rate the quality as excellent or good. From the public s perspective, coordination of health care efforts and whether or not a respondent had a serious complaint were the two most strongly associated drivers of the overall quality rating, based on actual experience. Other factors associated with overall quality of health care services include: Not having a serious complaint Excellent or good quality of emergency department visit Excellent or good quality of walk-in clinic services Factors associated with poor overall quality of health care services are: Having a serious complaint Very poor or fair quality of emergency department visit Very poor of rail quality of walk-in clinic services 1 The other health care services asked about in the 2010 survey include: personal family doctor, other health care professionals at family doctor s office (e.g. nurse or dietician), community walk-in clinics, specialists (e.g. surgeon, heart doctor, skin doctor), MRI, other diagnostic imaging (e.g. CAT-scan, X-ray, ultrasound, mammogram), pharmacists, emergency departments, inpatient hospital services, outpatient hospital services, and mental health services. 2
11 1.2 Access to Health Care Services Forty-eight percent (48%) of Albertans rated access to health care services as easy (4 or 5 out of 5) in This is relatively unchanged from 46% in 2008 and significantly higher than 42% in Table 1.2 Overall Access to Health Care Services: Percent Easy (4 or 5 out of 5) Overall access * * Denotes statistically significant difference compared to the 2010 survey year From the public s perspective, ease of obtaining emergency department services is the factor most strongly associated with overall ease of access to health care services. Other factors associated with ease of access to health care services include: Ease of access to a personal family doctor Excellent or very good coordination of efforts to provide health care services Ease of access to specialist services Factors associated with difficulty in overall access to health care services are: Difficulty accessing emergency department services Difficulty accessing services from personal family doctors Good, fair or poor coordination of efforts to provide health care services The access ratings for specific health care services are as follows: 3
12 Table 1.3 Access to Health Care Services: Health Care Service Area Percent Easy (4 or 5 out of 5) Family doctor N/A N/A Community walk-in clinics Emergency department services * 50 46* Specialist care * 42* Mental health * N/A MRIs (publicly funded) N/A Diagnostic imaging * 89* N/A * Denotes statistically significant difference compared to the 2010 survey year 1.3 Satisfaction with Health Care Services Received Sixty-two percent (62%) of respondents were satisfied (4 or 5 out of 5) with the health care services they received in This is relatively unchanged from 6 in 2008, but significantly higher than 58% in 2006 and 52% in Table 1.4 Overall Satisfaction with Health Care Services: Percent Satisfied (4 or 5 out of 5) Overall satisfaction * 52* N/A 4
13 * Denotes statistically significant difference compared to the 2010 survey year From the public s perspective, access the ease of obtaining health care services continues to be the most important factor associated with their overall satisfaction with health care services received. In addition to access, other priority themes emerge as associated with overall satisfaction with health care services received: Excellent or very good overall quality of health services received Satisfaction with personal family doctors Excellent or very good coordination of overall efforts of health care professionals to provide health care services Factors associated with dissatisfaction include: Difficult overall access to health care services Fair or poor overall quality of health care services Dissatisfied with services received from a family doctor The satisfaction rating with specific health care services received is as follows: Table 1.5 Satisfaction with Health Care Services Received: Health Care Service Area Percent Satisfied (4 or 5 out of 5) Family doctor Community walk-in clinic Emergency department services * 50* 50* Specialist care * 70* Mental health N/A MRI N/A Diagnostic imaging N/A Serious complaint handling * Denotes statistically significant difference compared to the 2010 survey year 5
14 1.4 Personal Family Doctors Major changes have occurred in the past two years when it comes to Albertans family doctor practice setting. Fifty-nine percent (59%) reported their family doctor was located in an office where they might see other doctors or health care professionals and medical files are shared among practitioners. This is up from 48% in The same reasons for not having a family doctor exist in 2010 as in They include personal family doctor not taking new patients, family doctor left/retired, and people feeling they don t need one. For the most part, those without a personal family doctor use community walk-in clinics (56%) for the kind of care most people get from a family doctor. Seven percent (7%) said they used the emergency department. 1.5 Preventative Care Forty-five percent (45%) of Albertans who had visited their personal family doctor in the past year said they and their doctor had talked about a healthy diet and healthy eating habits. This is similar to 46% in Fifty-four percent (54%) said they had spoken with their doctor about their exercise or physical activity compared to 58% in Community Walk-in Clinics Fifty-six percent (56%) of respondents reported it was easy (4 or 5 out of 5) to obtain health care services from a community walk-in clinic. This is unchanged compared to 2008 and similar to 2006, 2004 and Forty percent (4) said the quality of care received from a walk-in doctor seen most recently was very good or excellent. Satisfaction with health care services received from a walk-in clinic has not changed between 2010 (58%) and 2003 (55%). Fifty-nine percent (59%) of respondents who visited a walk-in clinic were satisfied (4 or 5 out of 5) with the ultimate impact the care received had on their health and lives. This has improved significantly from 49% in Emergency Department Services Fifty-four percent (54%) of respondents who visited an emergency department rated access as easy (4 or 5 out of 5) in This is relatively unchanged from 51% in 2008 and significantly higher than 48% in 2006 and 46% in In 2010, like 2008, 55% of respondents said they had gone to the emergency department for themselves because it was the only choice available. Significantly more respondents said they chose to go to the emergency department because it was the most convenient place to go in 2010 (27%) versus 2008 (2). 6
15 Thirty percent (3) of respondents considered leaving the emergency department before being seen and treated compared to 31% in Eight percent (8%) said they left before seeing the doctor or before care and treatment was finished. Some of the best predictors of why a person leaves or stays in the emergency department are staff checking on patients every 15 minutes and staff being available to help. 1.8 MRI The number of respondents receiving an MRI has increased since In 2010, 1 said they received an MRI compared to 1 in 2008, 8% in 2006 and 6% in This is significantly higher than 2006 and 2004 and unchanged from Fifty-eight percent (58%) of respondents rated access as easy (4 or 5 out of 5) in The results have not changed significantly since Public Health Fifty-six percent (56%) of Albertans said they definitely washed their hands more often in the past year because of concerns about the flu or H1N1. Eighty-nine percent (89%) said they saw health care workers either put on new gloves or wash their hands before they touched or treated them; 11% said they did not see this occur Mental Health Services Seventy-eight percent (78%) of those respondents who obtained mental health services in the past year said they were satisfied (4 or 5 out of 5) with the services they received. While this number has fluctuated over the years, the differences are not statistically significant. Seventy-eight percent (78%) reported obtaining mental health services was easy (4 or 5 out of 5). This number has remained stable over the years Specialist Services Sixty-two percent (62%) of Albertans surveyed said it was easy (4 or 5 out of 5) to obtain specialist services, similar to 2008 (59%) and 2006 (56%), but significantly higher than 2004 (47%) and 2003 (42%). There has been little change in satisfaction across the survey years regarding the amount of time respondents had to wait after booking an appointment to see the specialist (55.3% in 2010; 54.2% in 2008; and 52.1% in 2006). All attributes of specialist services (e.g., treating patients with courtesy and respect, spending enough time with patients, specialist s knowledge and competence) remained stable compared to
16 1.12 Coordination of Care Regardless of survey year, less than fifty percent () of respondents felt the coordination of health care professionals to serve their needs was very good or excellent. The results have not significantly changed since Coordination of care is associated with ease and difficulty of access as well as satisfaction and dissatisfaction with health care services. Table (%) (%) (%) (%) (%) Excellent or very good Good, fair or poor * Denotes statistically significant difference compared to the 2010 survey year 1.13 Patient Safety In 2010, 9% of Albertans reported they or an immediate family member experienced unexpected harm. This is down from 1 in 2008 and significantly lower than in 2006 (13%), 2004 (13%) or 2003 (14%). There appears to be a downward trend in terms of those experiencing unexpected harm. Thirty-four percent (34%) reported they were told by their health care provider about the harm. This is the same as 2008 and down from 4 in Serious Complaints Thirteen percent (13%) of Albertans had a serious complaint about health care services received. This is unchanged from 2008 and similar to 2006, 2004 and Sixty-one percent (61%) of those that had a complaint were dissatisfied (1 or 2 out of 4) with how the complaint was handled compared to 61% in 2008 and 57% in Overall, the results have remained stable since 2003 and there is no statistically significant variation Health Link There is an increasing trend in the number of respondents who said they were aware of Health Link. Year-over-year increases are statistically significant from 2006 to 2010 (66% versus ). Satisfaction with Health Link appears to be declining. In 2004, 77% were satisfied with the service compared to 72% in
17 2.0 Introduction The mission of the Health Quality Council of Alberta (HQCA) is to assess and improve the quality, safety, and performance of Alberta s health care system. In 2003, 2004, 2006, and 2008 the HQCA conducted a survey of a representative sample of Albertans, 18 years and older, to examine satisfaction with health care services in Alberta. This survey was conducted again in The results of the 2010 survey are presented in this report along with comparative data, where possible, from the previous surveys from 2008, 2006, 2004, and The 2010, 2008, 2006, 2004, and 2003 surveys examine the public s use of the various components of Alberta s health care system, satisfaction with services received, perceived quality of health care, ease of access to health care services, and coordination of care. Specific services assessed included family doctors, specialist physicians, community walk-in clinics, emergency departments, hospitals, pharmacists, diagnostic imaging, mental health services, and Health Link. In addition, patient safety and patient complaints are examined. Together the five surveys provide an assessment of the public s perceptions of Alberta s health care system over time. Caution must be used, however, in interpreting differences from one survey to the next as evidence of trends over time. Differences may reflect actual trends over time but may also reflect sampling error and differences in the way respondents were recruited depending on the survey year. The public s utilization and evaluation of the health care system may vary with health status, age, gender, income, family composition, and location of residence (for example, by Alberta Health Service zone or rural or urban location). Furthermore, assessments of quality and satisfaction with health care services may be influenced by reported ease of access to health care services, for example, and satisfaction with the health care system overall may be influenced by satisfaction with various component parts. This report examines the relationships between respondent characteristics, reported use of health care services, and respondent s evaluations of the health care system. In 2010, the HQCA contracted the Population Research Laboratory (PRL) at the University of Alberta to administer the survey by telephone to a representative sample of Albertans 18 years and older living in the former nine regional health authorities. The survey questionnaire is available in a supplemental report as is the detailed survey methodology. A total of 5,010 Albertans were interviewed for the 2010 survey; the response rate was 33.1% and the margin of error was comparable to previous years at approximately +1.5% 19 times out of 20. The EuroQol Group s five functional health dimension questions (EQ-5D) were new in the 2010 survey and focused on the following specific areas: mobility, self-care, usual activities, pain and/or discomfort, and anxiety and/or depression. In addition, some questions asked in 2008 were not asked in 2010 because: 1) the questions asked respondents about their perceptions to services and procedures to which they could not appropriately make comments (i.e. could not say if a diagnostic test was appropriate); 2) the questions were perpetually getting high ratings with no variation (i.e. Pharmacist services); and 3) they were poor questions and the response was difficult to interpret (i.e. how many DIFFERENT specialists have you personally seen within the past year? Is the question asking how many different specialist/persons or how many different specialist types?) 9
18 Public Health section questions in the 2008 survey were focused on asking participants whether or not they were aware of signs or posters telling them to wash their hands. In the 2010, we asked participants if they had changed their hand washing habits because of concerns over the flu or H1N1. The sections in this report cover the following topics: characteristics of the sample, utilization of health care services, access to health care services, perceived quality of health care services, satisfaction with health care services, coordination of health care services, and experiences with the following: family doctors, community walk-in clinics, emergency departments, specialist physicians, mental health care, diagnostic imaging, physiotherapy, pharmacy, public health, patient safety, patient complaints, and Health Link. 10
19 3.0 How to Interpret Provincial and Health Zone Level Results 3.1 How to Interpret the Weighted Result Graphs Provincial and health zone level results are presented in graphical format. All graph results include confidence intervals. Where these confidence intervals do not overlap; the difference between the measured proportions of two years or health zones is statistically significantly (within 5% error). If the confidence intervals overlap, the proportions denote non-statistical differences. Year over year health zone results should be interpreted with some caution. Readers can decide which year over year health comparisons provides the most appropriate comparisons. For example: 2010 results are based on AHS health zones and a new single health system structure, whereas 2003 to 2008 results are based on the nine health regions and the nine health systems. Readers should recognize that there may be differences between the year over year results, their populations, and how the health systems functioned in the broader region/zone. However, when interpreting the graphs and figures, keep in mind 11
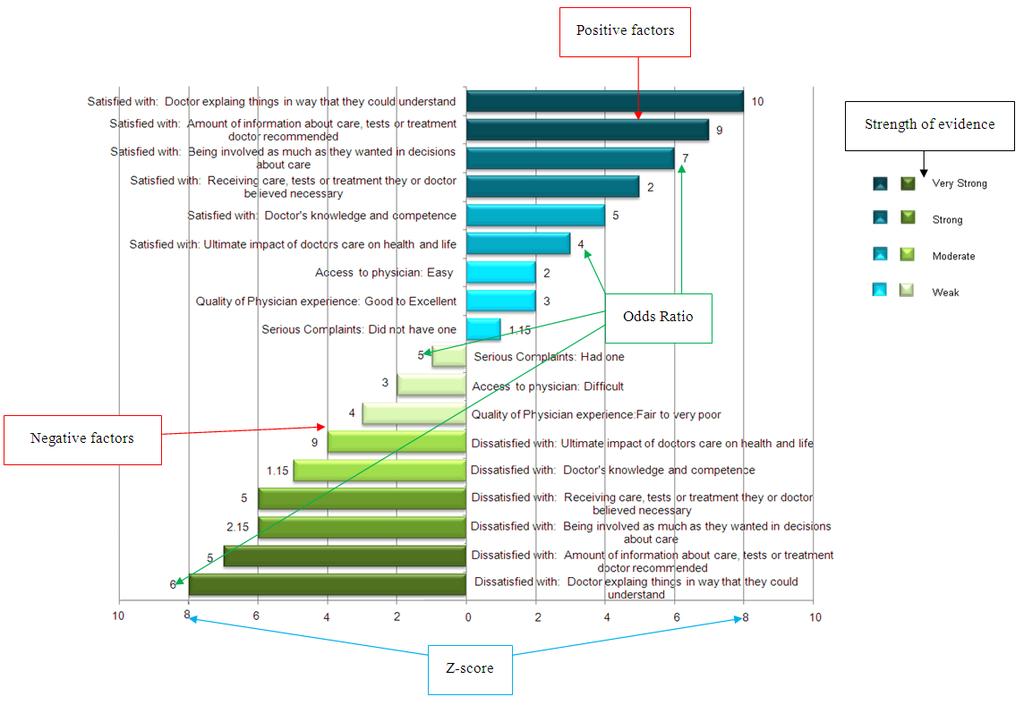
20 the trends within each graph/figure. If results are similar or follow a consistent trend, then confidence can be had when comparing the 2010 results to the other years. 3.2 How to Interpret the Multivariate Analysis Graphs The multivariate analysis results are be presented in a simplified visual graph; only significant odds ratios are presented. The top and bottom of each graph represents two separate logistic regressions where the dependent variable is either satisfaction or dissatisfaction; easy access or difficult access; good quality or poor quality. For interpretation purposes, control variables are not be discussed or presented, but information on these is available in a supplemental report. Statistically significant indicators are rank ordered based on their strength of evidence with the strongest indicators on the ends of the graph and the weaker indicators closer to the middle. A colour coded legend is provided for each multivariate graph in order to differentiate indicators strengths of evidence. As well, the bottom horizontal axis represents the z-value. HQCA uses the strength of evidence of each indicator in the positive or negative logistic regression to determine its overall strength as a driver of access, quality or satisfaction. 2 For example, an indicator that is very strong at predicting satisfaction and very strong at predicting dissatisfaction is classified as a very strong driver of overall satisfaction. This is because the indicator s effect and its inverse s/opposite s effects are consistent; both are very strong. However, if there are strength differences in an indicator s and its inverse s effects the HQCA adopts a conservative view and categorizes the overall strength of the driver based on the weakest evidence. For instance, if an indicator is very strong at predicting ease of access and weak at predicting difficult access, it will be classified as a weak driver of overall access. At the end of each bar is an odds ratio. This value represents the effect of the indicator on the outcome measure. The odds ratio is a good way to compare the effects across logistic regression models. 2 The HQCA chose to categorize strength of evidence based on differences in Bayesian Information Criterion (BIC) rather than on fully standardized coefficients due to the ambiguity of standard scores or standard units for dummy variables. With only two values, a standardized dummy variable does not represent a matter of degree and reference to a standard deviation changed lacks concrete reference (Pampel, F.C. (2000). Logistic Regression: A primer Sage Publications, California). 12
21 13
22 4.0 Characteristics of the 2010 Survey Sample 4.1 Age and Sex Distributions and Sample Weighting The data collection strategy in the 2010 HQCA survey set quotas for four broad age groups and gender within each former health region based on registration data from Alberta Health and Wellness (AHW). Under this strategy, implicit quotas at the provincial level can be derived from the regional quotas, reflecting the representativeness of the sample collected before weighting, compared to the registration data. Table 4.1 shows the provincial distribution by the four age groups and gender for the 2010 survey sample and registration data from AHW. With respect to gender, the unweighted HQCA 2010 sample was 50.4% male and 49.6% female compared to the registration population where the distribution for males was 50.1% and females 49.9%. As for age, the unweighted sample obtained across the province for males and females is similar (median age 44) to the age 18 and over population data from provincial health care registration data (median age 44). Minor deviations will be adjusted at the provincial level by weighting the data based on the provincial health care registration distributions. Table HQCA unweighted survey data and 2009 Alberta Health and Wellness health care registration data population age 18 and over, by gender 2010 Survey 2009 AHW Registry Age MEN WOMEN MEN WOMEN % 9.2% % % 38.9% % 38.9% 34.5% 33.3% % 14.8% 13.6% 16. Table 4.2 shows the unweighted distribution of the four categories of age and gender by each of the five AHS health zones for the 2010 survey sample and for the provincial health care registration data. The five AHS health zones are a re-categorization of the former health regions: South Zone: Chinook and Palliser Calgary Zone: Calgary Health Region Central Zone: David Thompson and East Central Edmonton Zone: Capital Health North Zone: Aspen, Peace Country and Northern Lights 14
23 Table HQCA unweighted survey data aged 18 and over, by gender and AHS health zone 2010 HQCA Survey 2009 Provincial Health Care Registration AHS Zones Age MEN WOMEN MEN WOMEN % 8.5% % South % 32.9% 35.4% 33.5% % 39.7% 33.4% 33.3% % 18.9% 17.2% 20.4% % 6.5% 12.2% 11.9% Calgary % 42.5% 41.1% 40.4% % 38.4% 34.7% 33.4% % 12.6% 12.1% 14.3% % 7.1% 13.8% 13.1% Central % 34.3% 34.5% 33.6% % % % 18.7% 16.9% 19.2% % 13.2% 12.9% 12.6% Edmonton % 38.8% 37.4% % 37.5% 34.5% 33.4% % 14.3% 13.8% 16.6% % 10.1% 14.7% 14.8% North % 39.4% 39.1% 39.8% % % 32.5% % 11.5% 12.1% 12.9% 15
24 Table 4.3 Comparison of age and gender between 2010 HQCA survey data and 2009 provincial health care registration data for AHS health zone 2010 HQCA Survey 2009 Provincial Health Care Registration Gender Strata Zones % of sample age 18 and over Median Age % of Population Median age South 46.3% % 46 Calgary Female Central 47.4% % 46 Edmonton 48.1% % 45 North 48.6% % 42 South 53.7% % 45 Calgary Male Central 52.6% Edmonton 51.9% % 44 North 51.4% % 42 South 17.8% % 46 Calgary 19.2% Total Central 17.8% % 46 Edmonton 19.5% % 57 North 25.7% % 42 The unweighted sample distributions closely mirror the distributions for broad age groups and gender within each of the five AHS health zones observed from health care registration data as shown in Table 4.3. Minor deviations in the proportion of males and females and age in a health zone compared to the registration populations will be adjusted through weighting by age and gender within a health zone. Furthermore, any distortions in ratio of sample to population due to over sampling will be adjusted with the provincial weights. 16
25 4.2 Individual and Household Characteristics of the Sample 3 Tables 4.4 to 4.6 show the distributions of other individual and household characteristics from the weighted sample for the 2010 survey. The median number of years respondents lived in Alberta is 30 years. In the Calgary and North zones, that had experienced relatively high growth in recent years attributable to migration, respondents reported a lower median number of years lived in Alberta. Over half of those surveyed (56.8%) reported at least some university or college education. AHS health zones with large metropolitan areas were more likely to have residents with a completed university degree. Sixty-four percent of the 4,331 respondents that answered the question on household income reported having total household incomes greater than $60,000 per year. Household income varied by health zone. Those health zones that experienced recent high growth and or had larger metropolitan areas had more respondents reporting a total household income of $100,000 or more. Approximately, thirty-five percent of respondents had children under 16 living in the household. Similar distributions occur in four of the five health zones, except the North zone where there was a higher proportion of children under the age of 16 living in the household. Most Albertans, age 18 years or older, (88.2%) reported their health to be good to excellent. 3 Please be advised some slight variation may occur between the individual and household characteristics presented in this report and the result the HQCA reviewed and approved in Alberta Health and Wellness (AHW) Key Performance Indicator report. AHW results were based on a sample of 4,341 Albertans (margin of error is 1.5%) received on April 26-27, 2010, whereas the HQCA report values were based on an increased sample quota (5,500 vs. 4,500) and an extended data collection period (May 31, 2010 vs. April 30, 2010). Where results were rounded, values may differ due to rounding rules. 17
26 Characteristics Alberta South Calgary Central Edmonton North Median Number of years Grade school or some high school 10.4% 12.2% 6.1% 14.5% 9.7% 19.7% 2. Completed high school 20.9% 23.6% 17.5% 29.3% 19.2% 26.5% 3. Post secondary technical school/trade school 11.9% 11.3% 9.8% 14.3% 13.9% 10.9% 4. Some university or college 14.4% 15.6% 15.1% % 11.3% 5. Completed college diploma 14.6% 16.2% 14.4% 15.4% 13.5% 16.3% 6. Completed university degree 20.1% 15.1% % 20.5% 11.8% 7. Post-grad degree 7.7% 6.2% 10.5% 2.7% % 18 Table 4.4 Selected individual and household characteristics using weighted data, by health zone How long have you lived in Alberta? n=5,006 What is the highest level of schooling that you have completed? n=4,986
27 Characteristics Alberta South Calgary Central Edmonton North 1. less than $30, % 17.2% 10.8% 15.4% 12.1% 13.1% 2. $30,000 to just under $60, % 26.1% 20.9% 27.3% 22.2% 23.2% 3. $60,000 to just under $100, % % 30.2% % 4. $100,000 or more 35.2% 24.8% 38.2% 27.1% 36.7% 36.5% 1. Yes 35.5% 34.3% 36.1% 36.3% 32.9% 40.5% 2. No 64.5% 65.7% 63.9% 63.7% 67.1% 59.5% Table 4.5 Selected individual and household characteristics using weighted 2010 data, by health zone What is your total household income before taxes? n=4,331 Do you currently have any children under 16 living in your household? n= 5,003 19
28 Characteristics Alberta South Calgary Central Edmonton North 1. Excellent 23.8% 24.1% 24.9% 24.1% 23.5% 20.1% 2. Very good 33.9% 35.7% 33.3% 34.1% 35.5% 29.7% 3. Good 30.5% 28.4% 30.3% 29.2% 29.7% 36.4% 4. Fair 9.1% 8.8% 8.7% 10.3% 8.3% 11.4% 5. Poor 2.8% % 2.6% 3.1% 2.4% Table 4.6 shows self rated health. In 2010, 58% of Albertans aged 18 to 64 and 57% of Albertans aged 65 or older, rate their health as excellent or very good. There was no statistically significant difference between 2006 (57% and 53%) and 2008 (59% and 54%). Better self rated health is frequently associated with better ratings of satisfaction or experience with health services and as such was included in multivariate analyses as a control (confounding) variable. 20 Table 4.6 Selected individual and household characteristics using weighted data, by health zone Compared to other people your age, how would you rate you health? N = 4,994
29 5.0 Contact with Health Care Services 5.1 Most Recent Contact with Alberta s Health Care System Q16. When was your most recent contact with Alberta s health care system? The information collected for the 2010 survey provides timely and robust data regarding Albertans (18 years and older) perceptions of and actual experiences with health care services in Alberta over the past year. The majority of respondents, almost 9, indicated they had contact with the health care system within the past 12 months; similar results are found across the other survey years. In 2010, slightly more than half of the respondents (50.3%) indicated their most recent contact with Alberta s health care system was within the past 2 months, with an additional 17.3% indicating their most recent contact with the health care system was in the past 3 to 6 months of the survey date. Figure 5.1 Respondents most recent contact with Alberta s health care system, by year of survey months 3 to 4 months 5 to 6 months 7 to 8 months 9 to 10 months 11 to 12 months More than a year ago % 16.6% 9.4% 2.8% 1.9% 2.3% 14.9% % 11.2% 3.4% 2.3% 3.3% 11.6% % 17.2% 11.7% 5.2% 2.6% 2.1% 11.4% % 10.4% 4.8% 2.9% 2.5% 10.8% % 17.3% 11.1% % 3.6% 10.4% 21
30 By Health Zone and Year of Survey Throughout the province, more Albertans in 2010 had contact with Alberta s health care system than in 2003 (p < 0.05). The same relationship is found in two of the five health zones as well (South and North). However, compared to the 2008 survey, there were no statistically significant differences between the health zones or the province as a whole. Figure 5.2 Percent of respondents who have had contact with the Alberta health care system within the past 12 months, by health zones 10 Alberta South Calgary Central Edmonton North % 82.6% 86.5% 84.4% 86.1% 80.9% % 88.4% 88.8% 89.1% 87.9% 87.4% % 87.5% 90.7% 87.1% 87.8% 86.7% % 91.2% 90.1% 87.3% 89.2% 87.3% % 90.6% 89.9% 86.6% 90.1% 89.9% 22
31 By Demographic Factors Respondents were asked when their most recent contact with Ablerta s health care system occurred. Figure 5.3a and 5.3b refers to those whose last contact with the health care ystem was in the past 12 months. Overall, there was significatly (p < 0.05) more contact with the health care system for: women versus men; and respondents 65+ as compared to year olds and year olds. Figure 5.3a Percent of respondents who had in contact with Alberta s health care system in the past 12 months, by demographic factors. 23
32 Figure 5.3b Percent of respondents who had contact with Alberta s health care system in the past 12 months, by demographic factors. 24
 surveyed who used each service. Figure 5.")
 46.4% Specialist 41. Community walk-in clinic 32.6% Different doctor at personal family doctor's 26.6% Hospital services as day patient 21.")
33 By Health Service Area Respondents were asked a series of individual yes/no questions to determine which health care services they had received in the past 12 months. Figure 5.4 provides a description of the proportion of Albertans, (18+) surveyed who used each service. Figure 5.4 Proportion of Albertans (18+) receiving various health service within the past 12 months Personal family doctor 84.6% Pharmacist (prescription or advice) 64.2% Diagnostic testing 47. Emergency department (self or family) 46.4% Specialist 41. Community walk-in clinic 32.6% Different doctor at personal family doctor's 26.6% Hospital services as day patient 21.3% Magnetic resonance imaging (MRI) 20.8% Hospital services as inpatient 11.5% Other health care professional 11.2% Mental health services 10.3% 10 25
34 6.0 Access to Health Care Services 6.1 Perception of Access to Health Care Services Q2. Thinking of access and wait times in Alberta s health care system overall, how difficult or easy do you think it is for Albertans to access the health care services they need? As we can see in Figure 6.1 the majority of respondents, regardless of survey year, did not perceive access to be easy or difficult, but somewhere in the middle. Looking at 2010, we find respondents more likely to say access was very difficult than they were to say it was very easy (p < 0.05). Figure 6.1 Respondents perception of the difficulty or ease Albertans have accessing health care services, by year of survey 10 Very easy Very difficult % % 26.6% 11.6% % 17.1% 38.5% 26.5% 13.1% % 37.5% 24.3% 10.9% % 16.6% 34.5% 26.7% 17.1% % 21.7% 35.4% 23.2% 12.3% Demographically, significantly more men (32.4%) found access was easy as compared to women (25.8%) (p < 0.05). However, women were more likely to rate access as difficult (39.1% versus 31.7% of men). Respondents aged (39.7%) and 65+ (31.7%) found access easier than those (26.9%) and (26.4%), while significantly more year olds (40.3%) found it difficult compared to the year olds (23.4%). Albertans (18+) with excellent or very good self-rated health (32.5%) claimed access was easy, while 24.7% of those who rated self-help as good, fair or poor said access was easy. 26
35 By Health Zone and Year Figure 6.2 presents the percent of Albertans, 18 and older, who reported perceived access to health care services was easy (4 or 5 out of 5) by health zone and year of survey. Provincially, in 2010, significantly more respondents found access to be easy compared to 2008, 2004 and In comparing the 2010 results by health zones, it was noted that respondents in the South zone was more likely to have said that access was easy compared to respondents in the Calgary or North zones (p < 0.05). Figure 6.2 Respondents who perceived that accessing health care services was easy (4 or 5 out of 5), by health zone and year of survey 10 Alberta South Calgary Central Edmonton North % 23.8% % % % 21.3% % 19.4% % % 29.7% 23.1% % 25.8% 18.6% 26.7% 21.9% 23.2% % 34.4% 26.2% 32.3% 31.4% 25.4% 27
36 6.2 Actual Experiences Accessing Health Care Services Q19. Thinking of access and waiting times overall, how difficult or easy was it to actually obtain the health care services you needed in Alberta within the past year? The relationship between ease of access to health care services across the different survey years differs statistically (p < 0.05). The percent of Albertans, 18 years of age and older, who claimed that it was very easy to actually obtain health care services in 2010, was significantly higher than in In addition, significantly fewer respondents in 2010 said it was very difficult to obtain services, compared to 2008; but significantly more than in 2006 and 2004 (p < 0.05). Figure 6.3 Respondents opinions on the difficulty or ease they had in accessing health care services, by year of survey 10 Very easy Very difficult % % 17.1% 9.3% % 29.8% 29.6% 15.8% 8.2% % 28.7% 27.8% 16.4% 8.7% % 24.1% 16.5% 13.2% % 28.9% 26.1% 14.6% 11.1% Demographically, a significantly higher proportion of men (32.5%) said access was easy (4 or 5 out of 5) as compared to women (25.8%) (p < 0.05). Across the different age groups, more respondents years old (51.6%) said access was easy versus those (46.19%), and (44.1%). As well, the majority of Albertans (18+) (32.5%) who self-reported their health as excellent or very good said access was easy compared to 24.7% of those with good, fair or poor health. 28
37 By Health Zone and Year Figure 6.4 presents the percent of respondents who reported that access to health care services was easy (4 or 5 out of 5) by health region and year of survey. Across the province, significantly more Albertans (18+) found access to be easy (48.2%) than in 2003 (p < 0.05). Between the zones, the South (53.6%), zone had significantly more respondents rating access as easy (4 or 5 out of 5) than the Calgary (46.2%) and North (40.8%) zones. Additionally, the Central (53.2%) and Edmonton (50.1%) zones had significantly more respondents rating access as easy than the North zone. Figure 6.4 Percent of respondents who found it easy (4 or 5 out of 5) to access health care services, by health zone and year of survey 10 Alberta South Calgary Central Edmonton North % 46.5% 41.2% % 40.3% % 48.6% 45.1% 50.5% % % 52.3% 45.8% 48.3% 49.6% 40.1% % 52.2% 44.9% 48.3% 46.5% 43.1% % 53.6% 46.2% 53.2% 50.1% 40.8% 29
38 6.3 Perceived Access versus Rating of Overall Access for Service Q2. Thinking of access and wait times in Alberta s health care system overall, how difficult or easy do you think it is for Albertans to access the health care services they need? Q19. Thinking of access and waiting times overall, how difficult or easy was it to actually obtain the health care services you needed in Alberta within the past year? Generally speaking, respondents were significantly more likely to perceive the accessibility of health care services (Q2) as 3 out of 5 (p < 0.05). However, when asked how difficult or easy it was to actually obtain health care services (Q19), Albertans, 18 years and older, were significantly more likely to rank access as 4 out of 5 than any other value. Figure 6.5 Respondents perception of the difficulty or ease of accessing needed health care services versus their experience of obtaining health care services 10 Very easy Very difficult Perceived Ease 7.4% 21.7% 35.4% 23.2% 12.3% Actual Ease 19.4% 28.9% 26.1% 14.6% 11.1% 30

39 Figure 6.6 presents the percent of respondents who reported that access to health care services was easy (4 or 5 out of 5) by year of survey. The results remained stable between 2008 and Specific Health Service Area Figure 6.6 Percent of respondents who found it easy (4 or 5 out of 5) to access specific health services 10 Personal family doctor Community Walkin Clinic Emergency Department % % Specialist Public MRI Diagnostic Imaging Mental Health % 49.5% 46.8% 50.5% 89.2% 65.9% Hospital - Inpatient Hospital - Outpatient % 59.6% 47.5% 48.6% 56.2% 91.8% 73.5% 75.6% 68.4% % 52.6% 51.2% 50.2% 59.3% 79.3% 79.2% 79.7% 71.5% % 55.7% 54.4% 54.3% 57.6% 79.5% 78.3% 78.3% 75.2% 31
40 Experience of Accessing Health Care Services in the Past Year, by Demographic Factors and Selected Variables (Multivariate Analysis) In this multivariate analysis, the outcome being estimated is ease of actually obtaining the health care services that respondents needed in the past year. Q19. Thinking of access and waiting times overall, how difficult or easy was it to actually obtain the health care services you needed in Alberta within the past year? 4 Figure 6.7 is a simplified visual representation of significant odds ratios for a logistic regression where the dependent variable is overall ease of access for services received. The top of the figure displays factors associated with easy access, while the bottom displays predictors of difficult access. For interpretation purposes, control variables will not be discussed or examined. Information on these variables and parameters is provided in a supplemental report. Very Strong Predictors For Albertans (18+), in general, the strongest predictors for ease or difficulty of access to needed health care services in Alberta within the past year included access to: emergency departments (ED), family doctors, specialists and walk-in clinics. As well, perceptions of how well all of the health care professionals coordinated their efforts to serve respondents needs, and whether or not respondents had a serious complaint were also very strong predictors of difficult or easy access. Difficult access to diagnostic imaging was additionally very strongly associated with difficult access to health services in Alberta. However, its inverse (or opposite) was not a very strong predictor, but rather easy access to diagnostic imaging was weakly related to easy overall access. Access to EDs, family doctors, specialists and walk-in clinics, as well as coordination efforts of health care professionals were the strongest drivers of overall access because these indicators (and their inverse) were very strong predictors of overall perceptions of access. The indicators associations and strength of evidence with access were consistent; for example, easy access to EDs resulted in very strong evidence for overall easy access, and difficult access to EDs resulted in very strong evidence for overall difficult access. However because access to diagnostic imaging was a very strong predictor of negative access but a moderate predictor of easy access, we concluded that it was not a very strong driver of overall access; if anything it was a moderate driver at best. Strong Predictors The perceived ease of obtaining inpatient hospital services and/or outpatient hospital services was strongly related with how easy it was to actually obtain health care services in Alberta within the past year. Inversely, only difficult access to outpatient hospital services was strongly related to difficult access to health services, and based on this result, outpatient hospital access was a strong driver of overall access 4 For analytical purposes, the access question was coded as follows: 1= easy (4 or 5 out of 5); 0=difficult (1 or 2 out of 5); and 3 out of 5 was dropped from the analysis. 32
41 in Alberta within the past year. However, as inpatient hospital services was strongly associated with easy access and moderately associated with difficult access, it is at most a moderate driver of overall access to health care services in Alberta. Moderate predictors Easy access to diagnostic imaging was moderately associated with overall ease of access to health care services, and difficult access was very strongly associated with overall difficult access to health care services. Due to the disparity in strength of evidence between easy and difficult overall access to health care services, it is conservative to conclude that access to diagnostic imaging is a moderate driver of overall access. Access to inpatient hospital care was also concluded to be a moderate driver of overall access to health care services. The reason being, like access to diagnostic imaging, access to inpatient hospital care effects was mixed. Easy access to inpatient hospital care was strongly associated with easy overall access, while difficult access to inpatient hospital care was moderately related with difficult overall access. In order to be conservative with our rating of inpatient hospital care, the HQCA choose to define the driver based on its moderate effect instead of its strong association. 33
42 Figure 6.7 Overall ease of access, multivariate analysis 34
43 7.0 Quality of Health Care Services 7.1 Perceived Quality of Alberta s Health Care System Q1. To begin, thinking broadly about Alberta's health care system and the quality of medical services it provides, how would you describe it overall? In 2010, 64.9% of Albertans, 18 years and older, indicated that they felt the quality of services provided by Alberta s health care system was either good (53%) or excellent (11.9%). The results remained stable from 2006 to Significantly fewer year olds (59.9%) felt the quality of services provided by Alberta s health care system was either good or excellent as compared to (71.8%) and (66.5%) year old respondents (p < 0.05). Respondents with better self-rated health were significantly more likely to perceive better health care services as good or excellent than those with good, fair or poor self rated health (70.5% versus 57.4%) (p < 0.05). Albertans (18+) with more than a high school education were more likely to rate health care services as good or excellent compared to those with a high school education or less (66.7% versus 61.5%). For those interviewed, the ones who lived in Alberta for less than five years perceived quality of health care as being better than those who lived in Alberta for more than five years (71.9% compared to 64%) (p < 0.05). Figure 7.1 Perceived quality of health care services overall, in Alberta, by year of survey 10 Excellent Good Fair Poor % 53.6% 27.3% 7.3% % 49.9% 30.9% 9.5% % % 8.4% 35
44 By Health Zone In Figure 7.2 the results of Question 1 are broken down by health zones, and year of survey. The figure presents those respondents who reported that the quality of health care services was either excellent or good. Statistically more Albertans (18+) (64.9%) 5 reported excellent or good quality of medical services in 2010 than in 2008 (59.7%). Across the zones, more respondents in the Central and Edmonton zones reported higher quality of medical services in 2010 than respondents in the North zone (p < 0.05). Figure 7.2 Percent of respondents who reported that quality of medical services was good or excellent, by health zone and year of survey 10 Alberta South Calgary Central Edmonton North % 62.8% 64.9% 69.8% 68.7% 54.6% % 64.7% 55.1% 65.2% % % 63.8% 62.9% 69.8% 67.5% 59.8% 5 Please be advised some slight variation may occur between the result presented in this report (64.9%) and the result the HQCA reviewed and approved as a Key Performance Indicator for Alberta Health and Wellness (AHW) (64.8%). The AHW result was based on a sample of 4,341 Albertans (margin of error is 1.5%) received on April 26-27, 2010, whereas the HQCA report value was based on an increased sample quota (5,500 vs. 4,500) and an extended data collection period (May 31, 2010 vs. April 30, 2010). Where results were rounded, values may differ due to rounding rules. 36
45 7.2 Overall Quality of Health Care Services Actually Received Q18. And again, thinking about all of your personal experiences within the past year with the health care services in Alberta that we just reviewed, 6 how would you describe the overall quality of those services? In 2010, 74.7% of respondents indicated that the quality of health care services they personally experienced in the last year was excellent (25.3%) and good (49.4%). This rating is virtually the same as reported in 2008 (73.2%). However Albertans (18+) rating of the quality of service as good is significantly higher in 2010 (49.4%) than it was in 2004 (33.5%) (p < 0.05). Figure 7.3 Overall quality of health care services personally received in Alberta, by year of survey 10 Excellent Good Fair Poor % 30.5% 40.1% 20.1% % 37.6% % 49.9% 21.5% 4.9% % 47.4% % % 49.4% % Albertans 65+ year olds (82.6%) report significantly higher overall quality of services (excellent or good) than (74.7%), (72.7%) and/or year olds (71.7%) (p < 0.05). Respondents with higher self-rated health (excellent or very good) were more likely to indicate higher quality of service than those with good, fair or poor self-rated health (79.9% versus 67.7%). Seventy percent (70.2%) of Albertans with less than $30,000 household income reported overall quality of services as excellent or good versus 76.2% of $30k-<$60k, 74% of $60k - <$100k, and 78.4% of the $100k + households; the highest income earners reported significantly higher quality of service than the lowest group (p < 0.05). 6 The other health care services asked about in the 2010 survey include: personal family doctor, other health care professionals at family doctor s office (e.g. nurse or dietician), community walk-in clinics, specialists (e.g. surgeon, heart doctor, skin doctor), MRI, other diagnostic imaging (e.g. CAT-scan, X-ray, ultrasound, mammogram), pharmacists, emergency departments, inpatient hospital services, outpatient hospital services, and mental health services. 37
46 Overall Quality of Healthcare Services Personally Received by Health Zone In Figure 7.4 the results of Question 18 are broken down by health zone and year of survey. The responses to this question were collapsed into a dichotomous variable, (0=Fair or poor and 1 = Good or excellent). The figure presents those respondents who reported that the quality of health care services they received was either excellent or good. 7 In 2010, all the zones reported statistically similar proportions of respondents who felt that the quality of health care services personally received was good or excellent. Provincially, the results have not significantly changed since Figure 7.4 Percent of respondents who felt that the quality of health care services personally received in Alberta was good or excellent, by health zone and year of survey 10 Alberta South Calgary Central Edmonton North % 75.3% 72.9% 78.7% 74.5% 67.3% % 77.9% 70.6% 77.3% % % 75.1% 72.9% 77.7% 77.3% 70.4% 7 This question differs from what AHW reports as their overall quality rating, which asks Albertans to consider health services from hospitals, physician's clinics, long term care facilities, public health services, home and community health services and regional health authorities. HQCA s overall rating asks respondents to rate overall quality based on their actual experiences with personal family doctor, other health care professionals at family doctor s office (e.g. nurse or dietician), community walk-in clinics, specialists (e.g. surgeon, heart doctor, skin doctor), MRI, other diagnostic imaging (e.g. CAT-scan, X-ray, ultrasound, mammogram), pharmacists, emergency departments, inpatient hospital services, outpatient hospital services, and mental health services. 38
47 Perceived Quality of Health Care Services Received in the Past Year, by Demographic Factors and Selected Variables (Multivariate Analysis) In this multivariate analysis, the outcome being estimated is perceived quality of health care services within the past year. Q18. Thinking about all of your personal experiences within the past year with the health care services in Alberta that we just reviewed, how would you describe the overall quality of those services? 8,9 Figure 7.5 is a simplified visual representation of significant odds ratios for a logistic regression where the dependent variable is perceived quality of health care services received. The top of the figure displays factors associated with excellent/good quality, while the bottom displays predictors of fair/poor quality. For interpretation purposes, control variable will not be discussed or examined. Information on these variables and parameters is provided in a supplemental report. Very Strong Predictors In regards to overall quality, very strong predictors included Albertans (18+) perceptions of how well all of the health care professionals coordinated their efforts to serve respondents needs; whether or not respondents had a serious complaint; and the quality of emergency department visits, and walk-in clinics. In addition, fair to very poor perceived quality of care received from their family physician and/or outpatient hospital services were also very strongly associated with poor overall ratings of quality. Respondents perceptions of how well all of the health care professionals coordinated their efforts to serve their needs; whether or not respondents had a serious complaint; and the quality of emergency department visits, and walk-in clinics are all very strong drivers of overall quality because the indicators are consistently related to both ends of the quality scale in a very strong manner. In contrast, quality of walkin clinics and outpatient hospital services, although, were very strongly associated with poorer overall ratings of quality, the indicators were not very strongly associated with ratings of good quality. Therefore, the quality of walk-in clinics and outpatient hospital services were respectively moderate and weak drivers of overall quality. Moderate predictors The quality of specialist care was a moderate driver of overall quality. Weak Predictors Positive ratings of outpatient hospital services and family physician quality of care were weakly associated with overall good/excellent ratings of health care quality. However, these indicators had 8 For analytical purposes, this question was coded as follows: 1= good (excellent and good); 0=fair (fair and poor). 9 The overall quality of health care services has a long history in the surveys, and any modifications would make year over year comparisons problematic. For this reason the question has remained unchanged. However, the new quality of health care service questions used was an expanded scale (excellent to very poor). For analytical purposes, the dichotomization of the two quality scales was nearly exact, with the exception of the negative end of the scale. In the extended scale, the negative grouping included fair, poor and very poor responses versus fair and poor response as in the overall health care quality scale. 39
48 stronger associations with negative ratings of overall health care quality. Due to the inconsistent association between the inverses, the strength of the outpatient hospital service indicator and family physician indicator represent weak drivers of overall quality of health care services. Figure 7.5 Overall perceived quality, multivariate analysis 40
49 8.0 Satisfaction with Health Care Services 8.1 Overall Satisfaction Q17. Thinking about all of your personal experiences within the past year with the health care services in Alberta that we just reviewed, to what degree are you satisfied or dissatisfied with the services you have received? In 2010, the majority of Albertans 18 years and older (61.9%) 10 were satisfied with Alberta s health care system; 35.8% rated satisfaction as 4 and 26.1% rated it 5 out of 5. The results remained stable in 2010 compared to 2008; however there appears to be an increasing trend within the very satisfied category. Figure 8.1 Overall rates of satisfaction for health care services received in Alberta 10 Very Satisfied Very dissatisfied % 34.6% 33.2% 10.6% 4.5% % 36.4% 27.5% 10.3% 4.4% % 35.4% 25.5% 9.3% 5.5% % 35.8% 24.7% 8.7% 4.6% 10 Please be advised some slight variation may occur between the result presented in this report (61.9%) and the result the HQCA reviewed and approved as a Key Performance Indicator for Alberta Health and Wellness (AHW) (61.3%). The AHW result was based on a sample of 4,341 Albertans (margin of error is 1.5%) received on April 26-27, 2010, whereas the HQCA report value was based on an increased sample quota (5,500 vs. 4,500) and an extended data collection period (May 31, 2010 vs. April 30, 2010). Where results were rounded, values may differ due to rounding rules. 41
50 The majority of 65+ year olds (73.7%) are satisified (4 or 5 out of 5) with the health services they have received in the past year, significantly more than the year olds (58.1%) and the year olds (60.7%) (p < 0.05). Albertans (18 years and older) with excellent and very good self-reported health were more likely to rate their satifaction as 5 or 4 as compared to those with good, fair or poor self-rated health (67.3% versus 55%). More respondent s without children under 16 years of age living within the household (64.4%) had were satisfied with health care services versus those with children under 16 years of age (57.5%) (p < 0.05). 42
51 By Health Zone Figure 8.2 presents analysis of Question 17, where satisfaction ratings of 4 and 5 were collapsed into a single category, satisfied, by health zone and year of survey. Sixty-two percent (62%) of those who received health care services in Alberta in the past year rated it as satisfactory. Statistically significant changes over time are evident in the province (p < 0.05). The 2010 provincial result reflect a continued improvement from the 2003 result, however it is not statistically significant compared to the 2008 result. Between the zones, respondents in the North zone (53.4%) were significantly less likely to be satisfied with health care services as compared to the Edmonton (65.1%), Central (65.8%), and South (65.7%) zones. Figure 8.2 Percent of respondents with satisfied (4 or 5 out of 5) with health care services, by health zone and year of survey 10 Alberta South Calgary Central Edmonton North % 54.4% 50.4% 54.6% 52.5% 48.9% % 59.5% 57.4% 61.7% 58.7% 51.5% % 65.3% 56.7% % 57.2% % 59.9% 65.8% 65.1% 53.4% 43

52 Figure 8.3 summarizes Albertans satisfaction for various health care services received by year of survey. The 2010 results have remained stable and are statistically similar to the 2008 results. 44 Summary of Satisfaction with Various Health Care Services Received, by Year of Survey Figure 8.3 Percent of respondents satisfied (4 or 5 out of 5) with the health care services they received, by year of survey 10 Family doctor Community walk-in clinic Emergency department % 54.6% 50.4% 70.2% Specialist Public MRI Diagnostic imaging Mental health % 59.5% 50.4% 73.8% 76.5% 84.5% 70.1% % % 81.1% % 72.3% % 57.5% 81.2% 89.4% % % 57.6% 58.7% % 87.1% 77.7%
53 Overall Satisfaction with Health Care Services Received in the Past Year, by Demographic Factors and Selected Variables (Multivariate Analysis) A multivariate analysis using logistic regression was conducted on respondents overall satisfaction with health care services personally received in the past year. In addition to the standard socio-demographic variables, satisfaction with a variety of specific health care services that the respondent received in the past year were examined as possible predictors of overall satisfaction with health care services. Q17. Thinking about all of your personal experiences within the past year with the health care services in Alberta that we just reviewed, to what degree are you satisfied or dissatisfied with the services you have received? 11 Figure 8.4 is a simplified visual representation of significant odds ratios for a logistic regression where the dependent variable is overall satisfaction with health care services received in the past year. The top of the figure displays factors associated with satisfaction, while the bottom displays predictors of dissatisfaction. For interpretation purposes, control variable will not be discussed or examined. Information on these variables and parameters is provided in a supplemental report. Very Strong Predictors Very strong predictors of overall satisfaction included: overall access, overall quality, and satisfaction with family doctor. As both the indicator and its inverse were very strongly associated with satisfaction and dissatisfaction with the overall health care system, the indicators therefore were the strongest drivers of overall satisfaction. Moderate predictors Overall, Albertans perception of how well health care professionals coordinated their efforts to serve respondents needs was moderately related with overall satisfaction, and therefore was a moderate driver of satisfaction. Weak Predictors Albertan s satisfaction with emergency department services is a weak driver of overall satisfaction rating. Of note, dissatisfaction with diagnostic imaging was a weak predictor of dissatisfaction with overall health care services received in the past year. All-in-all, it was not a good driver of overall satisfaction because of its non-significant association with being overall satisfied with health care services. In addition, being satisfied with services received from both specialists and walk-in clinics offered moderate evidence towards predicting being satisfied with the health care system within the past year. However, the indicators inverses (dissatisfaction with specialists and walk-in clinics services) were not 11 For analytical purposes, this question was coded as follows: 1= satisfied (4 or 5 out of 5); 0=dissatisfied (1 or 2 out of 5); response category 3 was dropped for analytical purposes. 45
 of overall satisfaction. Figure 8.")
54 significant predictors of dissatisfaction with health care services. The two indicators were not good drivers (or even weak drivers) of overall satisfaction. Figure 8.4 Satisfaction with health care services, multivariate analysis 46
55 9.0 Coordination of Health Care Services 9.1 Overall Coordination Q126. Thinking about the health care services you have received in Alberta within the past year, how would you describe how well all of the health care professionals coordinated their efforts to serve your needs? This question was asked of Albertans who had contact with Alberta s health care system within the past 12 months. The breakdown of the ratings in 2010 is statistically similar to the 2008 results; they have remained stable over the two survey periods. Figure 9.1 Assessment of the coordination efforts of health care professionals in Alberta, by year or survey 10 Excellent Very Good Good Fair Poor % 32.6% 35.1% 12.8% 3.7% % 31.1% 36.1% 12.3% 3.9% % 28.1% % 3.5% % 31.7% 33.9% 12.9% 4.1% % % 5.3% Of Albertans aged 65+, 62.3% felt coordination efforts were excellent or very good, significantly more than year olds (50.1%), (42.9%) and year olds (43.4%). Respondents with excellent and very good self-rated health were more likely to assess coordination as excellent or very good than those with good, fair or poor health (54.9% versus 39.8%). Of those with children under 16 living in the household 44.8% felt coordination efforts were excellent or very good compared to 50.2% of those without children under 16 living in the household (p < 0.05). 47
56 By Health Zone In Figure 9.2 the results of Question 126 are broken down by health zone and year of survey. The figure presents those respondents who reported that the coordination of efforts by health care professionals to serve their needs was either excellent or very good. For the province as whole, no significant changes occurred in 2010 as compared to Likewise for the zones, there were not significant changes between 2008 and Between the zones, the South (52.5%), Central (53.5%) and Edmonton (50.9%) had significantly more respondents who reported coordination of health care professionals was excellent or very good versus the North zone (43.4%) (p < 0.05). Figure 9.2 Percent of respondents who reported that the coordination of health care professionals was excellent or very good, by health zone and year of survey 10 Alberta South Calgary Central Edmonton North % 53.6% 47.4% 56.2% 45.8% 47.3% % 52.4% 47.7% 52.2% % % 46.8% 46.7% 48.3% 48.1% 38.6% % 51.5% 48.9% 52.5% 48.4% 46.8% % 52.5% 45.1% 53.5% 50.9% 43.4% 48
57 9.2 Coordination of Specific Health Care Services Figure 9.3 summarizes Albertans experiences with their personal family doctor being informed about health care services or tests they have received elsewhere in the system. Results are stable between 2008 and 2010 with no significant differences between the years. The most common results reported back to family doctors were results for diagnostic imaging (84.9%) and MRI (86.7%). Visits to specialists and to hospital were less often reported to the personal family doctor (62.8% and 68.2% respectively). Personal family doctors are only informed about emergency department visits half the time (51.4%). Figure 9.3 Overall summary of personal family doctor being informed about specific health care services, by year 10 Emergency department Specialist MRI Diagnostic imaging Hospital care % 63.8% 84.5% 87.7% 67.7% % 64.6% 87.1% 85.6% 66.2% % 62.8% 86.7% 84.9% 68.2% 49
58 10.0 Personal Family Doctor Services 10.1 Respondents Who Currently Have a Personal Family Doctor Q3. Do you currently have a personal family doctor who you see for most of your health care needs? I m speaking of a family doctor and not a specialist. 12 Results have been relatively stable over time, though a significant increase was noted in 2004 which has not been seen since. The percent of Albertans who currently have a personal family doctor in 2010 is unchanged from 2008, 2006 and Figure 10.1 Percent of respondents who currently have a personal family doctor in Alberta, by year of survey % 84.7% 81.1% 81.1% 81.6% Please be advised some slight variation may occur between the result presented in this report (81.6%) and the result the HQCA reviewed and approved as a Key Performance Indicator for Alberta Health and Wellness (AHW) (81.8%). The AHW result was based on a sample of 4,341 Albertans (margin of error is 1.5%) received on April 26-27, 2010, whereas the HQCA report value was based on an increased sample quota (5,500 vs. 4,500) and an extended data collection period (May 31, 2010 vs. April 30, 2010). Where results were rounded, values may differ due to rounding rules. 50
59 By Health Zone and Survey Year Between the health zones, the South zone has the most Albertans (18+) with a family doctor (89.1%) in This is significantly more than the Calgary (80.3%), Central (84%), Edmonton (83.1%) and the North (74.6%) zones (p < 0.05). The proportion of residents in the Calgary zone with a family doctor is significantly less than all the other zones, with the exception of the North Zone. Figure 10.2 Percent of respondents who currently have a personal family doctor, by health zone and year of survey 10 Alberta South Calgary Central Edmonton North % 85.1% 80.8% 85.7% 79.9% 79.2% % 86.9% 83.7% 87.6% 84.9% 82.8% % 86.7% % 76.8% % 87.8% 81.6% % 73.6% % 89.1% 80.3% % 74.6% 51
60 By Demographic Factors Eighty-six (86.3%) of Albertan women currently have a family doctor; significantly more than Albertan men (76.9%) (p < 0.05). There are significant differences between the age groups in regards to the proportion who have a family doctor: 70.9% of year olds; 76% of year olds, 87.3% of year olds, and 93.9% of Albertans over the age of 65 have a family doctor. Fewer people new to Alberta (length of residence is less than 5 years) said they had a family doctor (65.1%) than longer-term residents (5 years plus) (83.9%) (p < 0.05). Figure 10.3a Percent of respondents who have a personal family doctor, by demographic factors 52

61 Figure 10.3b Percent of respondents who have a personal family doctor, by demographic factors 53
62 10.2 Length of Time Respondent Has Been with Personal Family Doctor Q8. How long have you been going to your present personal family doctor's office? This question was asked of Albertans (18+) who indicated they had a personal family doctor. Figure 10.4 presents the mean number of years respondents have been going to their personal family doctor s office for 2008 and On average, Albertans (18+) have been going to their doctor for 10.9 years Figure 10.4 Average number of years respondents have been seeing their personal family doctor, by year of survey
63 By Health Zone and Year Respondents in the North and Calgary zones have been going to their family doctor for significantly less time than Albertans (18+) in the South, Central and Edmonton zones. This question was asked only of those who reported they had a personal family doctor. Figure 10.5 Average number of years respondents have been going to their present personal family doctor s office, by health zone and year of survey Alberta South Calgary Central Edmonton North
![10.3 Practice Setting of Personal Family Doctor Q6. Which of these [office settings where you usually see your family doctor] best describes your family doctor s office?](/docs-images/82/86164818/images/64-3.jpg "Significant changes have occurred in the past two years concerning the setting in which Albertan family doctor s practice.")
64 10.3 Practice Setting of Personal Family Doctor Q6. Which of these [office settings where you usually see your family doctor] best describes your family doctor s office? Significant changes have occurred in the past two years concerning the setting in which Albertan family doctor s practice. In 2008, over of respondents said they attended a traditional family doctor s office. This has significantly dropped to 4 in 2010 (p < 0.05). A significant increase occurred in 2010 over 2008 (42.5% versus 36.5%) for Albertans (18+) attending a shared office or clinic where patients see other doctors and medical file available is shared. Additionally, significantly more respondents in 2010 (9.5%) claimed their doctor s office was a shared office or clinic where respondents might see a nurse or other health care professional (p < 0.05). The number of Albertans going to community walk-in clinics or other specified settings has stayed stable over the two time periods. Figure 10.6 Practice setting Traditional family doctor's office % Shared office/clinic with medical file 36.5% 42.5% Shared office (nurse and other professional) Community walk-in clinic 4.6% 9.5% % Other specified 0.4% 0.6% 10 56
65 By Health Zone Figure 10.7 provides a breakdown of the family doctor s practice setting, by health zone for 2010 and In 2010, the proportion of Albertans within each type of practice setting between the zones was not statistically significant. A comparison of the 2010 zones to their 2008 selves noted some significant changes. For instance, in 2010 there was an increase in Albertans (18+) in the South zone who attended a shared office or clinic where they could see a nurse or other health care professionals compared to 2008 (11.7% versus 6.7%). In the Calgary zone, a significant (p < 0.05) reduction occurred in the number of respondents who said their doctor practiced in a traditional setting; 58.1% in 2008 and 43.6% in There was an increase in Albertans (18+) who attended a shared office or clinic where patients might see a nurse or other health care professional compared to 2008 (9% versus 3%). Respondents in the Edmonton zone less often chose to describe their family doctors office as traditional in 2010 versus 2008 (p < 0.05). However, a significant increase occurred, from 2008 to 2010, in the number of Albertans (18+) attending a shared office or clinic where they saw other doctors, and the clinic had their medical file available for which ever doctor saw them results (32.9% and 42% respectively). As well, in 2010, the proportion of respondents describing their family doctor s practice as a shared office or clinic where you might see a nurse or other health care professional if you do not need to see the doctor significantly increased compared to 2008 (10.2% versus 5.4%). For the other zones, the results remained stable from 2008 to

66 58 By Health Zone Figure 10.7 Practice setting, by health zone, 2010 & 2008
67 Care for Urgent but Minor Condition When Personal Family Doctor s Office was Open Q12. [For respondents who had an urgent but minor health problem when their family doctor s office was open] Where did you end up going the last time you needed care for an urgent but minor health problem and your personal family doctor s office was OPEN? In 2010, Albertans (18+) who did have a family doctor (Q3) or those who indicated that they went to the same family doctor s office where doctors share patients were asked if they had an urgent but minor health problem when their family doctors office was open. Four in ten (40.1%) respondents indicated that they required care for an urgent but minor health problem when their doctor s office was open in the past twelve months; this is unchanged from Among these respondents, 67.4% were able to get an appointment at their family doctor s office as soon as it was needed (similar to 66% in 2008). Figure 10.8 displays the results for Question 12. The number of respondents who went to their personal family doctor s office remained stable in 2010, as compared to There was a significant increase in those who went to the emergency department in 2010 (24.9%) versus 2008 (19.9) (p < 0.05). All the other results have remained stable over the two years. Figure 10.8 Health care services used when respondents had an urgent but minor health problem and their family doctor s office was open personal family doctor's office? 59.1% 60.5% emergency? walk-in clinic? 19.9% 24.9% 21.1% 17. Health Link? find help somewhere else? didn't go anywhere? other (specified)? 2.7% % 1.8% 1.2% 2.2% 3.3% 4.4%
68 Care for Urgent but Minor Condition When Personal Family Doctor s Office was Closed Q14. [For respondents who had an urgent but minor health problem when their family doctor s office was open] Where did you end up going the last time you needed care for an urgent but minor health problem and your personal family doctor s office was CLOSED? In 2010, Albertans (18+) who did have a family doctor (Q3) or those who indicated they went to the same family doctor s office where doctors share patients were asked if they had an urgent but minor health problem when their family doctors office was closed. Slightly more than twenty-nine percent (29.7%) of respondents indicated they did require care for an urgent but minor health problem at a time when their personal family doctor s office was closed. In a following question, respondents who indicated that they required care for an urgent but minor health problem when their doctor s office was closed were asked where they went for help. Figure 10.9 summarizes the results, which remained stable over the two years. Figure 10.9 Health care services used when respondents had an urgent but minor health problem and their family doctor s office was closed emergency? 59.3% 62.1% walk-in clinic? 33.9% 32.7% made an app't to see family doc? Health Link? find help somewhere else? didn't go anywhere? other (specified)? 5.4% 6.7% % 1.5% 1.4% 1.5% 2.2% 3.4% 2.4%
69 Do Not Have a Personal Family Doctor Q7. [For respondents who indicated in Q3 that they do not have a personal family doctor] You mentioned you do not have a personal family doctor. What is the main reason you do not have or choose not to have a personal family doctor? This question was asked in 2010 of those Albertans who answered that they did not have a personal family doctor (Q3). Respondents indicated that the primary reason they did not have a personal family doctor was because family doctors were not taking new patients (21.2%) or they did not feel they needed a family doctor (17.1%). The 2010 results are not statistically different from Figure Respondents main reason for not having a personal family doctor Family doctors not taking new patients 19.1% 21.2% Personal family doctor left/retired 18.9% 15.9% Don't feel I need one 15.1% 17.1% Have not tried to find one Haven't found one I'm happy with 14.2% 12.8% 10.2% 10.4% Other specified 9.4% 9.3% See different doctors at same clinic 6.9% 6.6% No family doctors in the area 6.2% 6.7% 10 61
70 Health Care Options When Respondent Does Not Have a Personal Family Doctor Q4. [For respondents who indicated in Q3 that they do not have a personal family doctor] Which one of the following best describes your own personal situation when you need the kind of care most people get from a personal family doctor? While there are minor differences from 2008 to 2010 for most of the care strategies, in general all other 2010 results are statistically unchanged from Figure For respondents who do not have a personal family doctor, health care service used when they needed the kind of care most people get from a personal family doctor, by year of survey Community Walk-in clinic 54.7% 58.2% 56.2% Family doctor office shared with others % 10. Visit Urgent Care/Community Health Centre Visit ED % % 6.9% Use alternative practitioners 3.4% 1.1% 3.3% Rarely use healthcare services 22.3% 17.9% 18.8% 10 62
71 Access to Personal Family Doctor by Year Q20. Thinking of the past year, how difficult or easy was it to actually obtain medical health care services from your personal family doctor or some other doctor at your personal family doctor s office? This question 13 was asked of Albertans who had a personal family doctor. The majority of respondents indicated it was easy to obtain health care services from their doctor; with no significant differences between survey years (p > 0.05). Figure Percent of respondents who found it easy (4 or 5 out of 5) to obtain health care services from their personal family doctor or some other doctor in their personal family doctor s office, by year of survey % 72.5% 72.4% The question HQCA uses to assess ease of access to personal family doctor differs from AHW s question which asks respondents how easy of difficult was it for you to obtain this service from your physician? Would you say it was very easy, easy, a bit difficult or very difficult. 63
72 Access to Personal Family Doctor by Health Zone and Year In 2010, the South and Calgary zones had significantly more respondents who found it easy to obtain health care services from their personal family doctor or some other doctor in their personal family doctor s office as compared to the North zone (p < 0.05). Year over year results were stable for the health zones, as well as for the province. Figure Percent of respondents who found it easy (4 or 5 out of 5) to obtain health care services from their personal family doctor or some other doctor in their personal family doctor s office, by health zone and year of survey 10 Alberta South Calgary Central Edmonton North % 76.9% 75.5% 72.9% 75.3% 64.2% % 74.1% 77.1% 67.7% 70.9% 64.6% % 77.8% 74.8% 71.9% 70.8% 64.3% 64
73 10.4 Quality of Family Doctor Care Q22q. Overall, how would you rate the quality of care you received from your personal family doctor over the past 12 months? In 2010, the majority of respondents (75.3%) rated the quality of care they received from their personal family doctor over the past 12 months as very good (28.5) or excellent (46.8%). Figure Quality of care respondents received from their family doctor over the past 12 months % 28.5% 17.2% 5.5% 1.3% 0.8% Excellent Very good Good Fair Poor Very poor 65
74 By Health Zone Figure summarizes results for very good or excellent care received from personal family doctor over the past 12 months by health zone. In 2010, the South and Edmonton zones had significantly more respondents who rated the quality of care they received from their personal family doctor as very good or excellent, compared to the North zone (p < 0.05). Figure Very good or excellent qualities of care ratings for personal family doctor over the past 12 months, by health zone % 78.1% 73.1% 75.3% 78.5% 70.6% Alberta South Calgary Central Edmonton North 66
75 10.5 Satisfaction with Personal Family Doctor Services Q21. Thinking of the past year, in general how satisfied are you with the health care services you have received from your personal family doctor or some other doctor at your personal family doctor s office. Question 21 was asked of Albertans who had a personal family doctor. The majority of 2010 respondents, as in previous years, were very satisfied with the health care services they received from their personal family doctor or some other doctor at their personal family doctor s office. Figure Satisfaction with personal family doctor services or some other doctor at their personal family doctor s office, by year of survey 10 Very Satisfied Very Dissatisfied % 30.6% 14.2% 4.1% 0.9% % 32.5% 10.8% 3.8% 1.5% % 33.2% 12.1% 2.7% 0.8% % % % 30.3% 12.2% 3.5% 1.2% 67
76 By Health Zone and Year of Survey The proportion of Albertans who were satisfied (4 or 5 out of 5) with the health care services they received from their personal family doctor has remained stable over the past two years, and since Figure Percent of respondents who were satisfied (4 or 5 out of 5) with health care services they received from their personal family doctor, by health zone and year of survey 10 Alberta South Calgary Central Edmonton North % 82.2% % 79.8% 81.7% % 86.6% 81.2% 87.7% 85.5% 81.8% % 86.5% 83.7% 86.4% 85.4% 79.4% % 83.6% 86.3% 81.3% % 86.5% 81.4% 84.7% 84.5% 79.7% 68
77 Personal Family Doctor Satisfaction with Specific Attributes The following bar charts depict the proportion of Albertans who were satisfied (4 or 5 out of 5) with specific attributes of care from their personal family doctor. The results have remained stable from 2008 to However, there were some significant changes between 2010 and 2003 and/or 2004 (p < 0.05). Figure Percent of respondents who were satisfied (4 or 5 out of 5) with specific attributes of care from their personal family doctor, by year of survey Ultimate impact of doctor's care on health and life % 77.8% 83.3% 83.9% 84.6% Doctor's knowledge and competence 92.6% 92.2% 89.6% 90.3% 90.4%
78 Receiving care, tests or treatment they or doctor believed necessary % 85.9% 85.3% 84.5% Being involved as much as they wanted in decisions about care % 82.5% 86.9% % Amount of information about care, tests or treatment doctor recommended % 84.7%

79 Doctor explaing things in way that they could understand % 91.3% 92.8% 91.7% 90.9% Thoroughness of the examination by the doctor % % 84.6% 84.6% Doctor listening carefully to them when describing health concerns % 86.4% 88.5% %
80 10 Doctor treating them with courtesy and respect 94.9% 94.5% 95.5% 95.6% 95.3% Amount of time doctor spent with them during appointment % 78.5% 80.7% % Help from other staff at office % 78.6% 87.6% 88.2% 86.4%
81 Courtesy and respect from other staff at office % 88.4% 86.6% Amount of time waiting in doctor's office % 58.9% 61.6% 63.4% 66.1% Amount of time from booking appointment to seeing doctor % 66.3% 63.8% 65.8%
82 10.6 Preventative Care The next few items are about the respondents personal family doctor working with them to stay healthy and prevent illness. These questions were only asked of respondents who had a personal family doctor. These questions are come from the Consumer Assessment of Health Plans and Systems, Physician and Group Survey supplement items. Q27. In the last 12 months, did you need your doctor s help making changes to prevent illness? Q28. [If yes to Q27], in the last 12 months, did this doctor give you the help needed to make changes to prevent illness In 2010, 36% of Albertans (18+) who had visited a personal family doctor in the past twelve months said that they needed their doctor s help in making changes to prevent illness; unchanged from Among those who said they needed help, 93.3% indicated their doctor gave them the help they needed to make changes to prevent illness. The 0.5% increase from 2008 is not statistically significant. Figure Percent of respondents who needed their doctors help in making changes to prevent illness and percent of respondents who received the help they needed from their doctor to make changes to prevent illness, by year of survey 10 Needed help Received help % % 74
83 Healthy Diet and Healthy Eating Habits Q29. In the last 12 months, did you and this doctor talk about healthy diet and healthy eating habits? In 45% of Albertans (18+) said they had talked to their doctor about diet and eating habits, while 55% had not. The results remained stable from 2008 to Figure Percent of respondents who had talked with their doctor about a healthy diet and healthy eating habits, by year of survey 10 Yes No % 53.8%
84 Exercise and Physical Activity Q29. In the last 12 months, did you and this doctor talk about the exercise or physical activity you get? In 2010, 54.2% of Albertans (18+) had spoken with their family doctor about the exercise and physical activity they got. This is statistically unchanged from Figure Percent of respondents who had talked with their doctor about the exercise and physical activity they got, by year of survey 10 Yes No % 42.2% % 45.8% 76
85 Feeling Sad, Empty or Depressed Q29. In the last 12 months, did this doctor ever ask you whether there was a period of time when you felt sad, empty or depressed? Approximately thirty percent (29.6%) indicated that their doctor asked them whether there was a period of time when they felt sad, empty or depressed; unchanged from Figure Percent of respondents who had talked to them about whether there was a period of time when they felt sad, empty, or depressed, by year of survey 10 Yes No % 69.5% % 70.4% 77
86 Encouraged To Talk About All Your Health Concerns Q29. In the last 12 months, did this doctor encourage you to talk about all your health concerns? In 2010, 66.9% of Albertans said they were encouraged by their doctor to talk about all their health concerns; same as in Figure Percent of respondents whose doctor encouraged them to talk about all of their health concerns, by year of survey 10 Yes No % 35.4% % 33.1% 78
87 Satisfaction with Health Care Services Personally Received in Alberta from a Personal Family Doctor in the Past Year, by Demographic Factors and Selected Variables (Multivariate Analysis) A multivariate analysis using logistic regression was conducted on respondents overall satisfaction with health care services personally received from a personal family doctor in the past year. In addition to the standard socio-demographic variables, satisfaction with a variety of specific family doctor attributes and clinic attributes (family physician attribute index) that the respondent may have come in contact with were examined as possible predictors of overall satisfaction with family doctor services. Q21. How satisfied are you with the health care services you have received from your personal family doctor or some other doctor in the past year? 14 Figure is a simplified visual representation of significant odds ratios for a logistic regression where the dependent variable is overall satisfaction with health care services received from a personal family doctor in the past year. The top of the figure displays factors associated with satisfaction, while the bottom displays predictors of dissatisfaction. For interpretation purposes, control variable will not be discussed or examined. Information on these variables and parameters is provided in a supplemental report. Very Strong Predictors The strongest predictors of being satisfied with the health care services received from a personal family doctor were: access to a personal family doctor, satisfaction with family doctor attributes, 15 and quality of family doctor experience. All these indicators had a very strong relationship with family doctor satisfaction and dissatisfaction, and as such were very strong drivers of overall physician satisfaction. As for the attribute index, the more service areas to which respondents were satisfied the more likely they were satisfied with the overall experience; the inverse held true as well. Weak Predictors The weakest predictor and driver of family doctor satisfaction was whether or not a respondent had a serious complaint about any health care service received in Alberta within the past year. 14 For analytical purposes, this question was coded as follows: 1= satisfied (4 or 5 out of 5); 0=dissatisfied (1 or 2 out of 5); response category 3 was dropped. 15 The specific attributes are: ultimate impact of doctors care on health and life; doctor's knowledge and competence; receiving care, tests or treatment they or doctor believed necessary; being involved as much as they wanted in decisions about care; amount of information about care, tests or treatment doctor recommended; doctor explaining things in way that they could understand; thoroughness of the examination by the doctor; doctor listening carefully to them when describing health concerns; doctor treating them with courtesy and respect; amount of time doctor spent with them during appointment; help from other staff at office; courtesy and respect from other staff at office; amount of time waiting in doctor's office; amount of time from booking appointment to seeing doctor. 79
88 Figure Satisfaction with personal family doctor services, multivariate analysis 80
89 11.0 Community Walk-in Clinics 11.1 Use of Walk-in Clinics Respondents were given an initial screening question to determine how many had gone to a community walk-in clinic during the past year (Question 15d). Figure 11.1 illustrates that the use of walk-in clinics has declined over time, and declined significantly from 2004 to 2010 (p < 0.05). If respondents answered yes to this question, they were then asked the following subsequent questions about their experience with walk-in clinics. Figure 11.1 Percent of respondents who had gone to a community walk-in clinic, by year of survey % 47.2% 39.9% 34.9% 32.6%
90 11.2 Access to Walk-in Clinics Q42. How difficult or easy was it to actually obtain health care services from the community walk-in clinic that you went to most recently? As Figure 11.2 shows, the majority of Albertans in 2010 (55.7%) rated access to community walk-in clinics highly (4 or 5 out of 5).The 2010 results compared to 2008 results show no statistical improvement or decline. Figure 11.2 Difficulty or ease of obtaining health care services from the walk-in clinics, by year of survey 10 Very Easy Very Difficult % 31.3% % 7.6% % 30.7% 26.7% % % 27.4% 24.2% 9.9% 6.4% % 27.8% 21.6% 15.5% 10.4% % 31.6% 24.8% 12.4% 7.1% 82
91 By Health Zone In 2010, the Central zone had significantly more respondents rating access as easy (4 or 5 out of 5) than the South, Calgary, Edmonton and North zones (p < 0.05). Figure 11.3 Percent of Albertans who rated access to community walk-in clinics as easy (4 or 5 out of 5), by health zone and year of survey 10 Alberta South Calgary Central Edmonton North % 58.3% 52.2% 57.6% 54.4% 55.1% % 55.3% 61.8% 58.3% 59.1% 59.6% % 58.8% 64.9% 60.5% 54.2% 54.1% % 65.1% 48.8% 66.5% 50.6% 54.7% % 57.3% 53.2% 77.2% 52.8% 55.3% 83
 of respondents rated their quality of from the walk-in clinic doctor care as good, very good or excellent; the majority of Albertans (18+) rated the care as good (33.7%). Figure 11.")
92 11.3 Quality of Walk-in Clinic Doctor Q45a. Overall, how would you rate the quality of care you received from the walk-in clinic doctor you saw most recently? Over seventy percent (73.4%) of respondents rated their quality of from the walk-in clinic doctor care as good, very good or excellent; the majority of Albertans (18+) rated the care as good (33.7%). Figure 11.4 Quality of care received from the walk-in clinic doctor, by year of survey (2010) % 15.5% 24.2% 15.2% % Excellent Very Good Good Fair Poor Very Poor 84
93 By Health Zone The results in Figure 11.5 are based on a dichotomization of Question 45a (1=excellent and very good; 2 = good, fair, poor and very good). In 2010, there were no significant differences between the zones in the proportion of Albertans (18+) who rated the care they received from the walk-in clinic doctor as excellent or very good. Figure 11.5 Excellent or very good quality of care received from the walk-in clinic doctor, by health zone and year of survey % 47.9% 37.6% 49.2% 37.5% 43.8% Alberta South Calgary Central Edmonton North 85
94 11.4 Satisfaction with Walk-in Clinics Q43. How satisfied are you with the services you have received from the community walk-in clinic you went to most recently? The majority of Albertans (57.7%) rate their satisfaction with the services they have received most recently from the community walk-in clinic as 4 or 5 out of 5 (where 5 represents very satisfied). Figure 11.6 Satisfaction with the services received from the community walk-in clinic most recently visited, by year of survey 10 Very Satisified Very Dissatisfied % 31.5% 24.7% 13.7% % % 9.3% % 31.7% 25.3% 10.7% % 30.3% 23.5% 12.4% 8.3% % 34.2% 24.1% 10.6% 7.7% 86
95 By Health Zone The proportion of Albertans (18+) who were satisfied (4 or 5 out of 5) with services received from the community walk-in clinics has remained stable since In comparing the health zones, the Central zone had significantly more respondents who were satisfied with community walk-in clinics (76.3%) compared to the Calgary (55.1%), Edmonton (54.6%) and North (59%) zones (p < 0.05). Figure 11.7 Satisfaction with the services received from the community walk-in clinic most recently visited, by health zone and year of survey 10 Alberta South Calgary Central Edmonton North % 60.4% 54.1% 63.6% 51.1% 58.6% % 57.7% 63.5% 67.1% 52.7% 60.2% % 60.2% 66.8% 48.4% 60.6% % 65.9% % 61.4% % 61.7% 55.1% 76.3% 54.6%
96 Satisfaction with Specific Community Walk-in Clinic Attributes Questions regarding satisfaction (4 or 5 out of 5) with specific attributes of community walk-in clinics were asked of Albertans who visited a walk-in clinic in Overall, the results remained stable from 2008 to Figure 11.8 Satisfaction (4 or 5 out of 5) with specific community walk-in clinic attributes, by health zone and year of survey 10 Amount of time it took to be assessed by a nurse 40.2% 43.5% 45.3% 42.2% 43.3% Amount of time it took to see the doctor after being assessed by nurse % 37.9% 39.6% 39.4% 40.3%
97 Amount of time doctor spent with them during appointment % 57.4% 56.9% 55.8% 54.7% Thoroughness of the examination by the doctor % 60.4% 59.2% 60.3% 57.9% Doctor's knowledge and competence % % 73.7% 69.1%
98 Courtesy and respect of other staff at office % 77.4% 77.9% 75.7% 74.4% Help from other staff at office % 59.8% 70.7% 69.1% 68.7% Ultimate impact of doctor's care on health and life % 57.1% 58.6% 64.6% 58.8%
99 Doctor treating them with courtesy and respect % 80.6% Doctor explaining things in way that they could understand % Doctor listening carefully to them when describing health concerns % 66.8%
100 Satisfaction with Community Walk-in Clinic Services in the Past Year, by Demographic Factors and Selected Variables (Multivariate Analysis) A multivariate analysis using logistic regression was conducted on respondents overall satisfaction with health care services personally received from a walk-in clinic in the past year. In addition to the standard socio-demographic variables, satisfaction with a variety of specific walk-in clinic attributes and doctor attributes (attribute index) were examined as possible predictors of overall satisfaction with the community walk-in clinic. Q21. How satisfied are you with the health care services you have received from the community walk-in clinic that you went to most recently? 16 Figure 11.9 is a simplified visual representation of significant odds ratios for a logistic regression where the dependent variable is overall satisfaction with the walk-in clinic most recently visited. The top of the figure displays factors associated with satisfaction, while the bottom displays predictors of dissatisfaction. For interpretation purposes, control variables will not be discussed or examined. Information on these variables and parameters is provided in a supplemental report. Very Strong Predictors The strongest drivers of satisfaction with walk-in clinic services included: perceived quality of care of the walk-in clinic doctor service; access to walk-in clinic; and satisfaction with walk-in clinic and walk-in clinic doctor attributes. 17 In regards to the attribute index, the more service areas to which respondents were satisfied the more likely they were satisfied with the overall experience; the inverse holds true as well. 16 For analytical purposes, this question was coded as follows: 1= satisfied (4 or 5 out of 5); 0=dissatisfied (1 or 2 out of 5); and response category 3 was dropped from the analysis. 17 The specific attributes are: amount of time it took to be assessed by a nurse; amount of time it took to see a doctor; amount of time doctor spent with them; doctor treating them with courtesy and respect; doctor explaining things in way that they could understand; doctor listening carefully to them when describing health concerns; thoroughness of the examination; doctor's knowledge and competence; courtesy and respect from other staff at office; help from other staff at office; ultimate impact of doctors care on health and life. 92

101 Figure 11.9 Satisfaction with community walk-in clinic services, multivariate analysis 93
102 12.0 Emergency Department Services 12.1 Use of Emergency Department Services Q15j. [Have you] gone to an emergency department in Alberta to receive care for an illness or injury for yourself or a close family member [during the past year]? Those who answered yes to this question were asked the following questions. Respondent (self) and/or Family Member The proportion of Albertans (18+) who went to the emergency department for and/or on behalf of a family member remained stable from 2008 to Figure 12.1 Percent of Albertans who went to the emergency department for either themselves or a close family member, by year of survey 10 for family member for self % 25.3% % 24.4% % 26.4% 94
103 Reason for Choosing Emergency Department Services Instead of Somewhere Else The following questions deal only with individuals who had personally gone to the emergency department to receive services in the past year. Q50.Why did you choose to go to the emergency department, instead of somewhere else such as a doctor s office? In 2010, like 2008, over half of Albertans (18+) interviewed (55.3%) indicated they had gone to the emergency department for themselves because it was the only choice available at the time. Significantly more Albertans (18+) in 2010 said they choose to go to the emergency department because it was the most convenient place to go in 2010 versus 2008 (p < 0.05). In 2010, as in 2008, the two most popular choices for why a respondent went to go to the ED, instead of somewhere else, were because it was: 1) the only choice available at the time; and 2) the best place for his or her medical problem. These 2010 results have remained stable since Figure 12.2 Percent of respondents who went to the emergency department instead of somewhere else, by specific reason and year of survey 10 the only choice available at the time the most convenient place to go the best place for my medical problem I was told to go to the emergency department Other specified % 20.1% 34.5% 19.7% 5.4% % 26.8% 36.7% 20.4% 0.8% 95
104 Self rated Urgency of Health Problem 18 Q51.Would you have described your health problem as: life-threatening; possibly life-threatening; urgent, risk of permanent damage; somewhat urgent, needed to be seen on the same day; not urgent, but I wanted to be seen on the same day? The number of Albertans (18+) describing their condition across the various categories has remained stable over the past two years. Similar to 2008, the highest proportion of respondents who had visited the emergency department in the past year for themselves described their problem as urgent with a risk of permanent damage. Figure 12.3 Percent of respondents who visited the emergency department, by description of their health problem 10 Life-threatening Possibly lifethreatening Urgent, risk of permanent damage Somewhat urgent, need to be seen same day Not urgent, but wanted to be seen same day % 14.8% 38.2% 30.3% 7.2% % 13.6% 39.2% 29.1% 8.7% 18 While self rated urgency is not the same as the Canadian Triage Assessment Score (CTAS) recorded by triage nurses upon arrival at an emergency department, it is intended as a proxy and represents similar categories of urgency described from the patient perspective. The HQCA s 2007 Emergency Department Patient Experience Survey compared actual CTAS scores with self rated urgency. Overall findings suggested that a higher proportion of respondents under-estimate urgency rather than over estimate it. Self rated urgency is therefore an acceptable proxy for contrasting patient experience information and will be used in subsequent analysis in section
105 12.2 Emergency Department Wait Times Q57. From the time you arrived at the emergency department, how long did you wait before being examined by a doctor? In 2010, 17.1% of Albertans (18+) indicated they had waited for more than an hour, but less than two hours, before being examined by a doctor. The percent of respondents within each choice category remained relatively stable, with one exception. Significantly more Albertans (18+) said they waited more than one hour but less than 2 in 2010 as compared to 2008 (p < 0.05). Figure 12.4 Length of time respondents waited at the emergency department before being examined by a doctor, by year of survey 10 Less than 15 min. More than 15 min, no more than 30 min. More than 30 min, no more than 60 min. More than 1 hour but less than 2 More than 2 hours but less than 4 More than 4 hours Didn't see a doctor % 17.6% 12.2% 17.8% 17.6% 0.8% % 16.8% 15.8% 17.1% 18.8% 14.8% 0.5% As shown in Table 12.1 the green cells represent respondents for whom CAEP CTAS guidelines to physician are likely not achieved. Based on this self reported data, CTAS guidelines are met for less than of patients who visit emergency departments in Alberta (a mix of urban and rural) for CTAS 1-4 categories. The results are similar to what those reported in
106 Table 12.1 Length of time respondents waited at the emergency department before being examined by a doctor, by self-rated urgency and CTAS guidelines Self reported time to physician Lifethreatening Possibly lifethreatening Urgent, risk of permanent damage Somewhat urgent, need to be seen same day Not urgent, but wanted to be seen same day <15 Min. 35.2% 20.5% 14.6% 11.1% 13.2% > 15, < 30 min. > 30, < 60 min. > 1 hour, < 2 hours > 2 hour, < 4 hours 9.8% 15.3% 17.9% 15.4% 26.1% 10.4% 12.4% 16.2% 17.7% 19.2% 9.5% 20.6% 15.8% 20.3% 15.1% 14.9% 14.7% 20.6% 20.2% 18.7% > 4 hours 19.2% 16.3% 14.7% 14.6% 6.6% 98
107 12.3 Access to Emergency Department Services Q48. How difficult or easy was it to actually obtain the emergency department services you or your close family member needed most recently? In 2010, nearly a third (31.7%) of Albertans (18+) said it was very easy to obtain emergency department services. For the majority of 2010 respondents (54.4%) 19 obtaining emergency department services were easy (4 or 5 out of 5). The 2008 results compared to the 2010 results have remained relatively stable for the top four choice categories. However, fewer Albertans chose to rate ease of access as very difficult in 2010 (13.6%) than compared to 2008 (17.8%) (p < 0.05). Figure 12.5 Difficulty or ease of obtaining emergency department services, by year of survey 10 Very Easy Very Difficult % 24.7% 21.9% 15.4% 16.7% % 22.8% 22.2% 12.2% 16.1% % % % % 20.6% % 17.8% % 22.7% 19.8% 12.2% 13.6% 19 Please be advised some slight variation may occur between the result presented in this report (54.4%) and the result the HQCA reviewed and approved as a Key Performance Indicator for Alberta Health and Wellness (AHW) (55.2%). The AHW result was based on a sample of 4,341 Albertans (margin of error is 1.5%) received on April 26-27, 2010, whereas the HQCA report value was based on an increased sample quota (5,500 vs. 4,500) and an extended data collection period (May 31, 2010 vs. April 30, 2010). Where results were rounded, values may differ due to rounding rules. 99
108 By Health Zone and Year of Survey Provincially, the percent of respondents who found it easy (4 or 5 out of 5) to obtain emergency department services is unchanged in 2010 compared to 2008, but significantly higher than 2006 and In the Central zone significantly more respondents rated access to emergency departments 4 or 5 out of 5 (easy) (62.9%) than the Edmonton zone (50.8%) (p < 0.05). Figure 12.6 Percent of respondents who found it easy (4 or 5 out of 5) to obtain emergency department services, by year of survey 10 Alberta South Calgary Central Edmonton North % 37.1% 61.9% 48.6% % 52.4% 43.3% 58.2% 48.6% % 53.6% 43.6% 60.5% 41.9% 51.5% % 55.1% 45.9% 64.1% 47.7% 56.4% % 56.5% 53.4% 62.9% 50.8% 56.1% 100
109 12.4 Quality of Care in the Emergency Department Q59. Overall, how would you rate the quality of care you received in the Emergency Department you visited most recently? The majority of Albertans said the quality of care they received in the emergency department was good, very good or excellent (77.2%). The most common answer was excellent (3). Figure 12.7 Quality of care received from emergency department, by year of survey (2010) % % 5.7% 5.5% Excellent Very Good Good Fair Poor Very Poor 101
, differences between the zones were not statistically significant. Figure 12.")
110 By Health Zone In 2010, approximately fifty percent (51.1%) of Albertans said the quality of care they received in emergency departments was very good or excellent. Though there is considerable variation in the proportion of respondents who said quality was high (very good or excellent), differences between the zones were not statistically significant. Figure 12.8 Excellent or very good quality of care received in the emergency department, by health zone and year of survey % 49.6% 56.5% 53.7% 45.5% 47.8% Alberta South Calgary Central Edmonton North 102
111 12.5 Satisfaction with Emergency Department Services Q49. How satisfied are you with the emergency department services you or your close family member most recently received? In 2010, more than half (58.7%) reported they were highly satisfied (4 or 5 out of 5) with the emergency department services they received. Compared to 2008, the 2010 results have remained stable. Figure 12.9 Satisfaction with emergency department services, by year of survey 10 Very Satisfied Very Dissatisfied % 26.1% 22.2% 13.6% 13.8% % 22.6% 22.3% 13.5% 13.8% % 26.5% 23.6% 12.1% 13.5% % 24.4% 18.8% % % 27.8% 19.8% 10.6%
112 By Health Zone Question 49 was dichotomized where 1 = ratings 5 and 4, or satisfied. Provincially, the relationship between emergency department satisfaction and year was significant; 2010 results were significantly higher than the 2006, 2004 and 2003 results (p = < 0.05). Between the zones, 2010 results were not significantly different from one another. Figure Satisfaction (4 or 5 out of 5) with emergency department services, by health zone and year of survey 10 Alberta South Calgary Central Edmonton North % 51.3% 45.9% 59.2% 52.9% 46.9% % 52.5% 40.1% 63.5% 51.1% 55.1% % 50.9% 50.6% 58.6% 45.1% 54.4% % 61.6% 57.5% 63.9% 53.2% 58.3% % 58.9% 60.5% 63.2% % 104
113 12.6 Re-Assessment Q54. Did a staff member check on you while you were waiting? Among those who visited an emergency department for their own care in 2010, 59.3% reported that staff checked on them while they waited for care. In contrast, 40.7% reported that they were not checked on at any time while they waited. These results are unchanged from what was reported in Figure Percent of Albertans who had a staff member check on them while waiting for emergency department services, by year of survey 10 Yes No % 41.2% % 40.7% 105
114 Frequency of Re-Assessment While Waiting For Physician Q55. While you were waiting to see the physician, how often did a staff member check on you to make sure you were okay? Among those who indicated that a staff member did check on them while they were waiting, 45.2% of respondents reported that they were checked on by a staff member every 15 minutes. The year over year results have remained stable. Figure Frequency of a staff member checking on patient while waiting for emergency department care, by year of survey 10 Didn't check at all Less often than once in 2 hours About once in every 2 hours About once every hour About once every half hour About once every 15 minutes % 4.8% 5.8% 13.7% 25.2% 48.5% % 6.1% 3.8% 14.5% 26.4% 45.2% % 4.8% 5.8% 13.7% 25.2% 48.5% % 6.1% 3.8% 14.5% 26.4% 45.2% 106
115 Ability to Get Staff Member Help Q56. If you needed attention, were you able to get a staff member to help you? In 2010, slightly more than half of the respondents answered yes, they were always able to get help if they needed it (54.9%). The results have remained stable over the course of the two years. Figure Percent of Albertans (18+) who were able to get a staff member to help them in the emergency department, by year of survey 10 Yes, always Yes, sometimes No, I could not find a staff member to help me A member of the staff was with me all the time I didn't need attention % 21.5% 10.1% 2.3% 14.9% % 21.7% 8.3% 1.9% 13.4% 107
116 12.7 Considered Leaving without Being Seen Q52. During your visit to the emergency department, did you consider leaving before you had been seen and treated? Question 52 was asked only of those who went to the emergency department for themselves. The majority of Albertans (18+) indicated they did not consider leaving before being treated (70.2%). The differences in the 2010 results compared to the 2008 results were not statistically significant. Figure Percent of Albertans (18+) who consider leaving before they were seen and treated in the emergency department, by year of survey 10 Yes, definitely Yes, to some extent No % 12.7% 69.2% % 13.2% 70.2% 108
117 12.8 Left Without Being Seen Q53. During your visit to the emergency department, did you stay the full time, leave before seeing the doctor, or leave just after seeing the doctor but before care and treatment was finished? Over ninety percent (91.8%) of Albertans (18+) indicated they stayed the full time in the emergency department, more than in 2008, but not statistically significant. Of the remaining respondents, 3.9% left before seeing the doctor, and 4.3% left before care and treatment was finished. These 2010 results were not significantly different from the 2008 results. Figure Percent of Albertans who left before treatment in the emergency department, by year of survey 10 Stayed the full time Left before seeing the doctor Left after seeing doctor but before being treated % 5.3% % 3.9% 4.3% 109
118 Factors Associated with Actually Leaving the Emergency Department Prior to Treatment, by Demographic Factors and Selected Variables (Multivariate Analysis) A multivariate analysis using logistic regression was conducted to determine factors associated with actually leaving the emergency department prior to treatment. In addition to the standard sociodemographic variables, satisfaction with a variety of specific emergency department services were examined as possible predictors of leaving the ED before treatment. Q53. During your visit to the emergency department, did you actually leave before you were seen and treated? 20 Figure is a simplified visual representation of significant odds ratios for a logistic regression with the patient actually leaving prior to treatment as the dependent variable. The top of the figure displays factors associated with staying, while the bottom displays predictors of leaving prior to treatment. For interpretation purposes, control variables will not be discussed or examined. Information on these variables and parameters is provided in a supplemental report. Weak Predictors In the analysis, three drivers were found to be significantly related to whether or not a person left the emergency department prior to treatment. Firstly, if respondents were checked on about every 15 minutes by staff, as compared to not being checked on at all, they were more likely to stay. In contrast, not being checked on at all, compared to being checked on every 15 minutes, meant people were more likely to leave prior to treatment. Interestingly, in the analysis frequency of being checked on was an all or nothing scenario. If respondents were less frequently checked on than every 15 minutes, this had no significant effect on staying for treatment; it was essentially the same as not being checked on at all. A second weak driver was being able to get staff to help if needed. As well, another weak driver was the number to times respondents had gone to the emergency department. Those who had gone more than twice were more likely to stay for treatment, while respondents who had been to the emergency department two or less times were more likely to leave. 20 For analytical purposes, this question was coded as follows: 1= left before being treated; 0=did not leave before treatment. 110
119 Figure Respondents who reported leaving the emergency department before receiving treatment, multivariate analysis 111
120 13.0 Specialist Services 13.1 Use of Specialist Services Albertans (18+) were asked if they Had an appointment with a specialist, that is, a doctor who specializes in one area of health care, for example, a surgeon, heart doctor, skin doctor [twelve months before the interview date]? (Q15e). In 2010, 38.2% said they had seen a specialist at least once (1 or more times), significantly higher than the 35.8% in Q60. How many times have you personally seen a specialist in Alberta within the past year? The relationship between the number of times one saw a specialist and year of survey is not statistically significant; the results have remained stable since Overall, 21.7% of respondents saw a specialist two or more times in the past year and 16.5% saw a specialist only once. Q61. In which city or town did you visit the specialist you most recently saw? Of those who reported they had seen a specialist in the past year, most saw their specialist in either Calgary (40.3%) or Edmonton (38.1%) Access to Specialist Services Q64. How difficult or easy was it to actually obtain the specialist services that you most recently needed? The differences across the years are statistically significant. In 2003, 20.8% of Albertans (18+) reported that it was very easy to obtain specialist services in contrast to 35.2% of Albertans in 2010 (p = < 0.05). However, 2010 results compared to 2008 results noted no significant difference. Figure 13.1 Difficulty or ease of access to specialist services, by year of survey 10 Very Easy Very Difficult % 21.2% 22.7% 20.6% 14.7% % 21.9% 27.2% 13.4% 12.8% % 24.7% 20.6% 13.8% 9.9% % 24.6% 20.1% % % 26.4% 18.5% 10.3% 9.6% 112
121 By Health Zone and Year Figure 13.2 presents the analysis of ease of actually obtaining specialist services by health zone and year of survey. Statistically significant differences over time are seen in Alberta; the 2010 results are significantly higher than the 2004 and 2003 results (p = < 0.05). Between the health zones, the Edmonton health zone had significantly more respondents who rated access as easy (4 or 5 out of 5) in 2010 (67.1%) than did the Calgary zone (57%) (p < 0.05). Figure 13.2 Percent of Albertans who rated access to specialist services as easy (4 or 5 out of 5), by health zone and year of survey 10 Alberta South Calgary Central Edmonton North % 38.6% 52.2% 43.4% 38.9% % 51.5% 41.8% 55.9% % % 57.8% 53.2% 56.4% 57.6% 55.2% % 63.4% 56.9% 58.7% 59.4% 60.2% % 57.5% % 67.1% 63.6% 113
122 By Wait Time Q66a. [And thinking of the specialist you visited most recently], how satisfied are you with the amount of time from booking the appointment to actually seeing the specialist? The question was dichotomized where 1 = 5 or 4 or satisfied. The relationship between the amount of time one had to wait to see the specialist and year has remained stable since Figure 13.3 Percent of Albertans who were satisfied (4 or 5 out of 5) with the amount of time they had to wait after booking an appointment to see a specialist, by year of survey % 54.2% 55.3%
123 By Wait Time at Office Q66b. [And thinking of the specialist you visited most recently], how satisfied are you with the amount of time you waited at the specialist s office before getting in to see him or her? The relationship between the amount of time one had to wait at the specialist s office across the years is statistically significant (p < 0.05). The proportion of Albertans (18+) satisfied with the amount of time they had to wait in 2010 was significantly greater than in 2004 and Figure 13.4 Percent of Albertans (18+) who were satisfied (4 or 5 out of 5) with the amount of time they had to wait at the office before seeing the specialist, by year of survey % 70.3% 70.9% 57.1% 59.8%
124 13.3 Quality of Care Received from Specialist Q68. Overall, how would you rate the quality of care you received from the specialist you visited most recently? The majority of Albertans (18+) (71%) rated the quality of care they received from the specialist visited most recently as very good or excellent. Less than six percent (5.4%) rated the quality as poor or very poor. Figure 13.5 Quality of care received from the specialist, by year of survey % 26.2% 16.9% 6.6% 3.1% 2.3% Excellent Very Good Good Fair Poor Very Poor 116
 rate the quality of care from specialists as very good or excellent compared to Calgary (67.")

125 By Health Zone In 2010, the Edmonton health zone had significantly more respondents (77.3%) rate the quality of care from specialists as very good or excellent compared to Calgary (67.4%) and North (64.1%) zones (p < 0.05). Figure 13.6 Excellent or very good quality of care received from the specialist, by health zone and year of survey % 72.2% 67.4% 71.1% 77.3% 64.1% Alberta South Calgary Central Edmonton North 117
126 13.4 Satisfaction with Specialist Services Q65. How satisfied are you with the health care services you have received from the specialist you visited most recently? The majority of Albertans (79%) rated their satisfaction with the health care services they received from the specialist as 4 or 5 out of 5 or satisfied. Across time, there has been a significant improvement in the number of Albertans who indicated being very satisfied with specialist services; the 2010 result was significantly higher than the 2004 and 2003 results (p < 0.05). However, as compared to 2008, the 2010 results have remained stable. Figure 13.7 Satisfaction with specialist services, by year of survey 10 Very Satisfied Very Dissatisfied % 28.5% 16.7% 8.5% 4.6% % 28.7% % 4.4% % 25.9% 11.5% % % 28.9% 10.8% % 29.3% 12.1% 4.9%
127 By Health Zone Figure 13.8 reports the dichotomized results by health zone and year of survey. Comparing the health zones to one another, the 2010 results were not statistically significant. Figure 13.8 Satisfaction with specialist services, by health zone and year of survey 10 Alberta South Calgary Central Edmonton North % % 74.7% 68.9% 64.6% % 79.8% 76.7% 75.7% 68.7% 72.2% % 78.3% 80.9% 76.3% 84.2% % 81.2% 80.4% 79.6% 82.3% 82.4% % 76.5% 79.6% 82.5% 78.6% 119
128 Satisfaction with Specific Attributes Figure 13.9 reports the dichotomized results for satisfaction with specific specialist attributes by year of survey. There were no significant differences to note in 2010 versus 2008, however, the 2010 results were significantly higher than the 2006, 2004 and 2003 results for satisfaction with specialist s knowledge of latest treatments (p < 0.05). Additionally, the 2010 results were significantly higher than the 2004 and 2003 results for the amount of time a person waited at the office before getting to see the specialist; the amount of time spent with the respondent during the appointment; help from other staff that assists the specialist; being treated with courtesy and respect; listening carefully to the respondent s health concerns; thoroughness of examinations; explaining things in an understandable way; specialist s knowledge and competence; ultimate impact the care had upon one s life; the amount of time needed to wait for the specialist to review any required tests; and being involved in decisions about one s health care (p < 0.05). Figure 13.9 Satisfaction (4 or 5 out of 5) with specific attributes of specialist care, by year of survey Doctor's awareness of leading edge treatments % 78.9% 83.7% 89.3% 86.2% Amount of time waiting in doctor's office % 59.8% 69.2% 70.3% 70.9%
129 Doctor treating them with courtesy and respect % 85.8% 91.1% 92.7% 91.5% Doctor listening carefully to them when describing health concerns % 75.8% 82.7% 85.2% 82.8% Doctor explaining things in way they could understand % 81.8% 85.5% 87.8%
130 Amount of time doctor spent with them during appointment % 70.4% 77.8% 80.6% 80.9% Help from other staff at office % % Ultimate impact of doctors care on health and life % 70.8% 77.2% 80.9% 79.3%
131 Amount of time from booking appointment to seeing doctor % 54.2% 55.3% Amount of information received about recommendations for future treatment % 81.7% Thoroughness of the examination by the doctor % 76.1% 84.7% 85.6% 84.2%
132 Doctor's knowledge and competence % 87.1% 91.4% 93.3% 91.3% Amount of time they waited for specialist to get test results % 61.3% % 76.3% Being involved as much as they wanted in decisions about care % 72.2% % 82.7%
133 Satisfaction with Health Care Services Personally Received in Alberta from a Specialist in the Past Year, by Demographic Factors and Selected Variables (Multivariate Analysis) A multivariate analysis using logistic regression was conducted on respondents overall satisfaction with health care services personally received from a specialist in the past year. In addition to the standard socio-demographic variables, satisfaction with a variety of specific specialist services and attributes (attribute index) were examined as possible predictors of overall satisfaction with specialist services. Q65. How satisfied are you with the health care services you have received from the specialist you visited most recently? 21 Figure is a simplified visual representation of significant odds ratios for a logistic regression where the dependent variable is overall satisfaction with specialist services received in the past year. The top of the figure displays factors associated with satisfaction, while the bottom displays predictors of dissatisfaction. For interpretation purposes, control variables will not be discussed or examined. Information on these variables and parameters is provided in a supplemental report. Very Strong Predictors Very strong predictors and drivers of satisfaction with specialist services include: satisfaction with specialist attributes: 22 and perceived quality of care of the specialist. As for the attribute index, the more areas in which Albertans (18+) were satisfied or dissatisfied the more likely they were to be satisfied or dissatisfied with the specialist service (a 96% increase in satisfaction or dissatisfaction for each additional area/attribute). Moderate Predictors Access to specialists was found to be a moderate driver of overall satisfaction with the specialist. Weak Predictors How well health care professionals coordinated their efforts to serve respondents was a weak predictor and weak driver of satisfaction and dissatisfaction with specialist services. 21 For analytical purposes, this question was coded as follows: 1= satisfied (4 or 5 out of 5); 0=dissatisfied (1 or 2 out of 5); response category 3 was dropped. 22 Attributes include: amount of time waiting in doctor's office; doctor treating them with courtesy and respect; doctor listening carefully to them when describing health concern; doctor explaining things in way they could understand; amount of time doctor spent with them during appointment; help from other staff at office; ultimate impact of doctors care on health and life; thoroughness of the examination by the doctor; doctor's knowledge and competence; amount of time they waited for specialist to get test results; being involved as much as they wanted in decisions about care; doctor's awareness of leading edge treatments; amount of time from booking appointment to seeing doctor; amount of information received about recommendations for future treatment. 125
134 Figure Satisfaction with specialist services, multivariate analysis 126
135 14.0 Hospital Care 14.1 Quality of Hospital Care Q 100. What type of hospital service did you receive most recently? Was it overnight, day or emergency? Q101. How would you rate the quality of care you most recently received at the hospital? As shown in Figure 14.1 there have been minor fluctuations in the 2010 percentages in each response category; however none are significantly different from the 2008 response rates. Figure 14.1 Quality of care for most recent hospital visit (combined emergency department, outpatient and inpatient), by year 10 Excellent Good Fair Poor % 41.6% 15.8% 7.4% % 39.5% 13.3% 8.8% % 41.4% 12.9% 8.5% 127

136 Inpatient (Overnight) As shown in Figure 14.2 the proportion of 2010 respondent s ratings of quality of inpatient care has remained stable since 2008; the differences are not statistically significant. The majority of Albertans, over the three survey periods, rated quality of inpatient care as good or excellent (78.6% in 2010; 79.5% in 2008; and 75.5% in 2006). Figure 14.2 Quality of care for most recent inpatient hospital visit, by year 10 Excellent Good Fair Poor % 39.3% 12.7% 11.8% % 41.9% 14.7% 5.7% % 39.3% 11.9% 9.5% 128
137 Outpatient (Day) The 2010 results compared to the 2008 results are not statistically significant different from one another. Figure 14.3 Quality of care for most recent outpatient hospital visit, by year 10 Excellent Good Fair Poor % 37.9% 14.6% 2.4% % % 3.8% % 42.3% 9.4% 4.2% 129
138 14.2 Access to Hospital Care Q102. How easy or difficult was it for you to get this hospital service when you needed it? 23 As shown in Figure 14.4 below, there was a significant increase in2010 in the proportion of Albertans (18+) reporting easy (43.9%) compared to 2008 (37%) (p < 0.05). Figure 14.4 Ease of access for most recent hospital visit (emergency department, inpatient, outpatient), by year 10 Very easy Easy Bit difficult Very difficult % 42.9% 24.9% 8.3% % % 12.2% % 43.9% 18.6% 9.4% 23 Please be advised some slight variation may occur between the result presented in this report (72%) and the result the HQCA reviewed and approved as a Key Performance Indicator for Alberta Health and Wellness (AHW) (71.5%). The AHW result was based on a sample of 4,341 Albertans (margin of error is 1.5%) received on April 26-27, 2010, whereas the HQCA report value was based on an increased sample quota (5,500 vs. 4,500) and an extended data collection period (May 31, 2010 vs. April 30, 2010). Where results were rounded, values may differ due to rounding rules. 130
139 Inpatient (Overnight) As shown in Figure 14.5 there have been changes in the proportion of Albertans (18+) rating access to inpatient hospital care as very easy, easy, bit difficult or very difficult; however, the 2010 results are not statistically significant from the 2008 or 2006 results (p > 0.05). Figure 14.5 Ease of access for most recent hospital visit, by year 10 Very easy Easy Bit difficult Very difficult % 36.3% 17.9% 6.5% % % 6.6% % 41.1% 11.8%
140 Outpatient (Day) The proportion of Albertans (18+) rating access to outpatient hospital care as very easy to very difficult was statistically similar in 2010 as compared to Figure 14.6 Ease of access for most recent hospital visit, by year 10 Very easy Easy Bit difficult Very difficult % 25.7% 5.9% % 42.6% 20.6% 7.9% % 49.1% 20.2% 4.6% 132

141 15.0 Mental Health Services 15.1 Use of Mental Health Services by Location The following discussion is based on the number of individuals who answered yes to Question 15n, Within the past year, that is since [twelve months prior to interview date], have you personally received mental health services from a therapist, counselor, family doctor, psychologist, or psychiatrist? The majority of Albertans (18+), who answered yes to Question 15n, received four or more mental health services in 2010 (47.2%), which was consistent with previous years (45.1% in 2008; 51.5% in 2006; and 54.4% in 2004). In 2010, 24.2% of respondents said they had gone once for mental health services, 16.9% had gone twice, and 11.8% had gone three times; based on the 2008 proportions, the 2010 results remain statistically unchanged. Q93. Thinking of the mental health services you received most recently, where did you obtain this service? Was it at a hospital, an ED, a mental health clinic, a family doctor s office, through telemental health, a private counselor s office or somewhere else? Figure 15.1 summarizes responses to Question 93. Compared to 2008, no significant increases or decreases occurred among the 2010 response categories. Figure 15.1 Percent of respondents who received mental health services in specific locations, by year of survey Hospital 10.1% 12. Emergency department 0.2% 0.9% Mental health clinic 13.9% 17.3% Family doctor's office Telemental health 0.1% 1.3% 30.5% 24.5% Private counsellor/therapist office 36.9% 32.5% Other specified 8.3% 11.5%
142 15.2 Access to Mental Health Services Q91. How difficult or easy was it to actually obtain the mental health services you most recently received? In 2010, 51.5% of Albertans rated access to mental health services as very easy compared to 57% in 2008; the difference is not statistically significant. For the majority, over seventy-eight percent (78.3%), obtaining mental health services was easy (4 or 5 out of 5), which is significantly higher than in 2004 (65.9%) (p < 0.05), but not statistically different from 2006 (73.5%) or 2008 (79.3%). Figure 15.2 Ease of access to mental health services, by year of survey 10 Very Easy Very Difficult % % % % 29.1% 16.9% 4.3% 5.3% % 11.3% 6.4% % 26.8% 12.3% 4.9% 4.6% 134
143 15.3 Satisfaction with Mental Health Services Q92. How satisfied are you with the mental health services you most recently received? In 2010, 47.4% of Albertans were very satisfied with the mental health services they most recently received. Statistically the 2010 value is unchanged from the 2008, 2006 and 2004 result. Overall, the majority of respondents (77.8%), 24 reported high levels of satisfaction (4 or 5 out of 5) in Figure 15.3 Satisfaction with mental health services, by year of survey 10 Very Satisfied Very Dissatisfied % 26.1% 17.9% 5.9% 6.2% % 29.8% 17.5% 5.8% 4.4% % 16.8% 5.6% 3.5% % 30.4% 13.4% 5.5% 3.4% 24 Please be advised some slight variation may occur between the result presented in this report (77.8%) and the result the HQCA reviewed and approved as a Key Performance Indicator for Alberta Health and Wellness (AHW) (76.8%). The AHW result was based on a sample of 4,341 Albertans (margin of error is 1.5%) received on April 26-27, 2010, whereas the HQCA report value was based on an increased sample quota (5,500 vs. 4,500) and an extended data collection period (May 31, 2010 vs. April 30, 2010). Where results were rounded, values may differ due to rounding rules 135
144 Satisfaction with the Way Health Care Providers Worked Together Q94. How satisfied are you with the way health care providers worked together, to provide the mental health care you needed? This variable was dichotomized. The majority of Albertans, 18 years or older, (65.5%), were satisfied (4 or 5 out of 5) with the way health care providers worked together to provide mental health services. Over the years the value has fluctuated, however the differences are not statistically significant. Figure 15.4 Percent of respondents were satisfied (4 or 5 out of 5) with the way health care providers worked together to provide mental health services, by year of survey % %
145 Discrimination Q95. Did you at any time feel that health care professionals discriminated against you because you had a mental health concern or problem? In general, most Albertans (18+), who have personally received mental health services from a therapist, counselor, family doctor, psychologist, or psychiatrist, did not feel that health care professionals discriminated against them because of their mental health concerns or problems. The difference across the years was not statistically significant. Figure 15.5 Percent of respondents who did not feel health care professionals discriminated against them because of their mental health problem, by year of survey % 91.1% 91.9%
146 16.0 Diagnostic imaging 16.1 Use of Magnetic Resonance Imaging (MRI) Services Q69. Within the past year, have you received an MRI in Alberta? In 2010, 9.8% of Albertans (18+) indicated that they had received an MRI; compared to 9.7% in 2008, 7.7% in 2006 and 5.7% in The 2010 result is statistically significantly different compared to the 2006 and 2004 results (p < 0.05), but is unchanged from the 2008 result. For 2010, the majority of respondents who had an MRI in the past year received their MRI in Edmonton (42%) followed by Calgary (35.9%). New in the 2010 survey, was Question 49d, which asked respondents about their MRI experience. Over ninety percent (91.6%) reported their MRI experience was like the description 25 read by the interviewer. Figure 16.1 Percent of Albertans (18+) who received an MRI, by year of survey % 7.7% 9.7% 9.8% 2004* 2006* The Magnetic Resonance Imaging (MRI) machine looks like a tunnel that has both ends open. You lie down on a movable table that slides into the opening of the tunnel. A technologist monitors you from another room. You can talk with him or her by microphone. The MRI machine creates a strong magnetic field around you, and radio waves are directed at your body. You don't feel the magnetic field or radio waves, and there are no moving parts around you. During the MRI scan, the internal part of the magnet produces repetitive tapping, thumping sounds and other noises. Earplugs or music may be provided to help block the noise. 138
147 By Public or Private Provider Q70. Was the MRI provided by the public health care system or did you pay for it privately? In 2010, of those Albertans (18+) who had an MRI, the vast majority (94%) said it was provided by the public health care system. The 2010 increase compared to the 2008 result was not statistically significant. Figure 16.2 Percent of respondents who had a publicly funded or privately funded MRI in the past year 10 Public Private % 9.2%
148 16.2 Access to MRI Services Q72. In the past year, how difficult or easy was it to actually obtain the MRI? In 2010, 31.5% of Albertans (18+), who had an MRI in the past year, indicated that they found it very easy to obtain a MRI; this was not a statistically significant difference compared to Overall, the majority of respondents (57.6%) rated access as easy (4 or 5 out of 5) in Figure 16.3 Ease of access to MRI, by year of survey 10 Very Easy Very Difficult % 19.7% 13.1% 13.1% 19.8% % 24.5% 18.9% 12.7% 12.3% % 19.7% 19.9% 8.8% % 26.1% %
149 By Health Zone The 2010 variation between the health zones regarding easy access (4 or 5 out of 5) to MRIs is not statistically significant. Figure 16.4 Easy (4 or 5 out of 5) access to MRI, by health zone and year of survey 10 Alberta South Calgary Central Edmonton North % 48.9% 59.2% 34.7% 48.7% % % 65.3% % 63.6% 56.1% 59.7% 61.5% 58.4% % 53.9% 55.2% 59.1% 57.6% 67.2% 141
150 MRI Wait Time Q73. Did you get a private MRI because you felt the wait time for a publicly funded MRI was too long? Among Albertans (18+) who received a private MRI, 86.7% agreed that they went to the private sector because the wait time for a publicly funded MRI was too long. The 2010 values are not statistically significant compared to the 2008 values. As well, the small numbers make it difficult to infer provincial level results with much confidence. Figure 16.5 Percent of respondents who got a private MRI because the wait time was too long 10 Yes No % % 13.3% 142
151 16.3 Satisfaction with MRI Services Q74. Generally speaking, how satisfied are you with the MRI you have received within the past year? Question 74, was asked of Albertans (18+) who had received an MRI in the past year. In 2010, 52.3% indicated they were very satisfied with their MRI compared to 64.4% in 2008, which represents a significant decline (p < 0.05) but is consistent with findings from 2004 and The vast majority of respondents, regardless of the year of survey, reported satisfaction ratings of 4 or 5 (out of a 5 point scale). In 2010, 84.5% rated satisfaction as 4 or 5 versus 89.5% in 2008, 79% in 2006 and 76.6% in 2004 (2010 is not statistically different compared to the other years). Figure 16.6 Satisfaction with MRI services, by year of survey 10 Very Satisfied Very Dissatisfied % 26.2% 11.7% 3.1% 8.7% % 25.6% 12.6% 3.2% 5.3% % 25.1% 4.9% 3.6% 2.1% % 32.2% % 143
152 By Health Zone The 2010 variation between the health zones and satisfaction (4 or 5 out of 5) with MRIs is not statistically significant. Figure 16.7 Satisfaction (4 or 5 out of 5) with MRI services, by health zone and year of survey 10 Alberta South Calgary Central Edmonton North % % 77.7% 78.7% 67.3% % 85.5% 84.8% 71.6% 74.6% % 84.7% % 91.4% 83.1% % 74.2% 87.5% 83.3% 82.8% 88.3% 144
153 16.4 Diagnostic Imaging Other than MRIs Q76. Within the past year, have you received other diagnostic imaging such as CAT-Scans, X-rays, [FEMALE: mammograms] or ultrasounds in Alberta? The proportion of Albertans who have received some form of diagnostic imaging other than an MRI in the past year increased between 2010 and 2008, but is not statistically significant. Of those who received some form of diagnostic imaging, most said they received their diagnostic imaging in Calgary (34.6%), followed by Edmonton (28.7%). Figure 16.8 Percent of respondents who received other diagnostic imaging, by year of survey % 41.1% 30.4%
154 16.5 Access to Other Diagnostic Imaging Services Q78. In the past year, how difficult or easy was it to actually obtain the diagnostic imaging? In general, the majority of Albertans (18+) who had received diagnostic imagining other than an MRI, indicated it was very easy to obtain these services. The proportion of Albertans who rated ease of access to diagnostic imaging as very easy has remained stable over the four survey periods; the results are not statistically significant. Figure 16.9 Ease of access to diagnostic imaging, by year of survey 10 Very Easy Very Difficult % 34.9% % 4.1% % 34.4% % 2.1% % 28.1% 13.9% 4.4% 2.3% % 28.3% 12.8% 4.9% 2.8% 146
155 By Health Zone The proportion of Albertans (18+) who rated access to other diagnostic imaging as 4 or 5 out of 5 or easy, has significantly decreased since 2006 and 2004 (p < 0.05). Between the health zones, the Edmonton zone had significantly more respondents rating access as 4 or 5 (83.3%) compared to the North zone (74.2%) (p < 0.05). Figure Percent of respondents who rated access to other diagnostic imaging as easy (4 or 5 out of 5), by year of survey 10 Alberta South Calgary Central Edmonton North % 90.9% 89.3% 86.5% 91.7% 83.5% % 94.5% % 91.1% 87.1% % 76.4% 78.6% 79.4% 82.9% 72.2% % 77.7% 79.6% 75.1% 83.3% 74.2% 147
156 16.6 Satisfaction with Other Diagnostic Imaging Services Q79. Generally speaking, how satisfied are you with the diagnostic imaging you have received within the past year? Albertans (18+) were asked Question 79 if they had received diagnostic imaging other than an MRI. The difference in the proportion of respondents, in 2010, who were very satisfied with the diagnostic imaging they received, is not statistically significant in comparison to the proportion of respondents in 2008, 2006 or In all the years, the vast majority of respondents (87.1% in 2010; 89% in 2008; 87.5% in 2006; and 84.5% in 2004) were satisfied (4 or 5 out of 5) with the services they received; the results remained stable from 2008 to Figure Satisfaction with diagnostic imaging services, by year of survey 10 Very Satisfied Very Dissatisfied % 32.6% 11.1% 2.4% % 32.9% 8.9% 2.7% 0.9% % 29.5% 8.5% 1.3% 1.2% % % 2.2% 1.2% 148
157 By Health Zone The Edmonton zone had significantly more respondents who were satisfied with diagnostic imaging services than the North zone (90.5% versus 83.7%) (p < 0.05). Figure Percent of Albertans satisfied (4 or 5 out of 5) with diagnostic imaging, by health zone and year of survey 10 Alberta South Calgary Central Edmonton North % 82.4% 83.3% 86.1% 87.7% 80.3% % 88.3% 86.9% 89.8% 88.2% 84.2% % 89.6% % 89.1% % 87.7% 85.3% % 83.7% 149
158 17.0 Pharmacist Services 17.1 Use of Pharmacist Services Respondents were asked an initial screening question (Q15i) on whether they had, Received advice from a pharmacist or received prescription medication from a pharmacist for your own use [during the past year]? In 2006, 71.6% of Albertans (18+) had either received advice or medications from a pharmacist compared to 65.1% in 2008 and 64.2% in The 2010 result is unchanged from the 2008, but is statistically lower than the 2006 result (p < 0.05). Respondents who answered yes to this question were then asked the subsequent questions. Figure 17.1 Percent of Albertans (18+) who received advice or prescription medication from a pharmacist, by year of survey % 65.1% 64.2%
159 17.2 Satisfaction with Pharmacist Services The following questions were asked of persons who had received at least one prescription from a pharmacist in the past year. Q86a. And thinking of the past year, how satisfied are you with your pharmacist making sure you understand how to take your prescription medication properly? The majority of Albertans (68.9% in 2010; 70.3% in 2008; and 66.5% in 2006) were very satisfied with pharmacists making sure they understood how to take their prescription medication properly. The slight differences across the three survey periods were not statistically significant. In general, over ninety percent of Albertans rated their satisfaction with pharmacist services as 4 or 5 out of 5 in 2010 (92.7%), 2008 (94.2%) and 2006 (91.5%); the results are stable and not statistically significant from one another. Figure 17.2 Satisfaction with pharmacist making sure you understand how to take medication, by year of survey 10 Very Satisfied Very Dissatisfied % % 0.8% 0.4% % 23.9% 4.4% 0.9% 0.4% % 23.8% 5.6% 1.1% 0.7% 151
160 Q86b. And thinking of the past year, how satisfied are you with your pharmacist making sure you understand what results you might expect from your medication including any side effects or drug/food interactions that may occur? In general, the majority of Albertans (18+) who received at least one prescription from a pharmacist in the past year were very satisfied (61.9%) with their pharmacist making sure they understood what results they might expect from their medication. There were no statistically significant differences between those who reported being very satisfied with their pharmacist s performance across the three time periods. In general, over eighty-five percent (87% in 2010; 88% in 2008; and 88.5% in 2006) of respondents were satisfied (4 or 5 out of 5) with the pharmacist making sure they understood what results they might expect from their medication. Figure 17.3 Satisfaction with pharmacist making sure you understand side effects or drug/food interactions, by year of survey 10 Very Satisfied Very Dissatisfied % % 2.5% 0.9% % 25.2% 8.8% % % 25.1% 9.6% 2.3% 1.1% 152
161 18.0 Public Health 18.1 Hand Washing Self 103a. Over the past 12 months, have you been washing your hands more often because of concerns about the flu or H1N1? The majority of Albertans (72.4%) said they were washing their hands more often because of concerns about the flu or H1N1. Figure 18.1 Percent of respondents who have washed their hands more often because of concerns about the flu or H1N % 16.7% 27.6% Yes, definitely Yes, somewhat No 153
162 18.2 Hand Washing & Putting on New Gloves Health care workers Q106. In the past 12 months, did you see health care workers wash their hands before they touched or treated you? Q107. In the past 12 months, did you see health care workers put on new gloves before they touched or treated you? Asked as separate questions, 55.6% of Albertans (18+) reported that they always saw health care workers wash their hands before they touched or treated the respondent; and 66.2% reported that they had always saw a health care worker put on new gloves before they were touched or treated. As Figure 18.2 shows, respondents observed health care workers wash hands or put on new gloves 89.4% of the time in 2010 and 89% in 2008; the results were not statistically significantly different. Figure 18.2 Percent of Albertans (18+) who saw a health care worker wash their hands OR put on new gloves before the respondent was touched or treated 10 Washed hands or put on new gloves Did not % 10.6% 154
163 19.0 Patient Safety 19.1 Experience of Harm The following questions were asked of respondents who had indicated that they had used Alberta s health care system within the past 12 months. Q108. As a result of your personal experience in Alberta s health system within the past year, to what degree are you personally concerned that unexpected harm 26 could occur in the course of your care and treatment as a patient? This variable was collapsed into two categories coded as 0 = Not at all concerned or Not very concerned, or 1 = Concerned or Very concerned. In 2010, 81.6% of Albertans (18+) indicated that they were not at all concerned or not very concerned that unexpected harm could occur in the course of care and treatment as a patient compared to 79% in The slight increase in 2010 compared to 2008 is not statistically significant. *NOTE: Question wording was changed in 2006 to reflect current definitions of unexpected harm versus medical error. This may have impacted results between 2004 and Figure 19.1 Percent of Albertans (18+) who were concerned that unexpected harm could occur in the course of care or treatment as a patient, by year of survey % 66.3% 79.3% % Definition: Sometimes when people receive health care, unexpected harm can occur as a result of that care. Such unexpected harm is different from complications which may occur as an expected risk of some treatments. Unexpected harm may affect the patient s health and/or quality of life and may result in additional or prolonged treatment, pain or suffering, disability or death. 155

164 19.2 Experience with Unexpected Harm Q109. To the best of your knowledge, have you, or has a member of your immediate family experienced unexpected harm while receiving health care in Alberta within the past year? In 2010, 9% 27 of Albertans (18+) indicated that they or an immediate family member experienced unexpected harm; significantly less than in 2006, 2004 or 2003 (p < 0.05). However, the 2008 and 2010 results were not statistically significant from each other. Figure 19.2 Percent of Albertans (18+) who indicated that they or an immediate family member experienced unexpected harm while receiving health care in Alberta, by year of survey % 12.7% 12.9% 10.1% Please be advised some slight variation may occur between the result presented in this report (9%) and the result the HQCA reviewed and approved as a Key Performance Indicator for Alberta Health and Wellness (AHW) (8.7%). The AHW result was based on a sample of 4,341 Albertans (margin of error is 1.5%) received on April 26-27, 2010, whereas the HQCA report value was based on an increased sample quota (5,500 vs. 4,500) and an extended data collection period (May 31, 2010 vs. April 30, 2010). Where results were rounded, values may differ due to rounding rules. 156
165 By Health Zone The reported incidence of unexpected harm has remained stable across the health zones in 2010 compared to However, it has significantly declined, compared to the 2003 results, for the South, Central, Edmonton, and North zones (p < 0.05). Figure 19.3 Percent of Albertans (18+) who indicated that they or an immediate family member experienced unexpected harm while receiving health care in Alberta, by health zone and year of survey 10 Alberta South Calgary Central Edmonton North % 14.2% 13.7% 13.6% % % 12.5% 13.1% 12.6% 11.9% 13.6% % 13.9% 13.6% 10.3% 12.3% 14.3% % % 9.6% 11.4% 8.6% % 9.9% 7.5% 8.9%
166 Recipient of Unexpected Harm Q110. Did this unexpected harm happen while receiving care for yourself, a family member or both? The following questions were asked of Albertans (18+) who answered yes to Q109. The majority of respondents, regardless of year, said that the unexpected harm happened while receiving care for a family member, followed by self and then both. The difference in proportions within each choice category remained stable from 2008 to 2010; the results were not statistically significant over the two years. Figure 19.4 Percent of Albertans (18+) or immediate family members who experienced unexpected harm while receiving health care in Alberta in the past year, by year of survey 10 Self Family member Both % 65.7% 9.1% % 78.6% 4.8% % 73.9%
167 Notification of Unexpected Harm Q111. Did the doctor or health professional involved tell you that unexpected harm had occurred during your (or your family member s) care or treatment? This question refers to the unexpected harm that occurred most recently, if more than one incident had occurred. The proportion of respondents who were informed by a doctor or health care professionals that unexpected harm occurred has remained stable since 2006; the proportions are not statistically significant or different from one another. Figure 19.5 Percent of Albertans (18+) who were told by their doctor or health care professional that unexpected harm had occurred during care or treatment, by year of survey % 34.5%
 were asked a series of specific yes/no questions regarding different impacts.")
168 Description of Unexpected Harm Q113. Which of the following best describes the unexpected harm that you or your family member experienced? To determine the impact of perceived harm, Albertans (18+) were asked a series of specific yes/no questions regarding different impacts. The three most common consequences of unexpected harm were: 1) causing pain and suffering (70.1%); 2) requiring additional treatment (57.1%); and 3) affecting quality of life (52.6). As shown below, the proportion of respondents reporting these and other impacts has remained, for the most part, stable in the 2010 survey compared to the 2008 and 2006 survey. Figure 19.6 Percent of Albertans (18+) who experienced unexpected harm and how it affected their health, by year of survey Affected health Affected quality of life Affected ability to work Required additional treatment Required prolonged treatment Caused pain or suffering Caused disability 50.3% 59.2% 51.9% 42.9% 52.9% 52.6% 33.7% 32.9% 34.2% % 57.1% 39.6% 46.6% 38.1% 58.6% 75.4% 70.1% 20.9% 27.3% 22.6% Caused death Other specified 9.8% 6.7% 7.3% 1.2% 10.3% 6.9%
169 Health Care Setting Q114. In what health care setting did this unexpected harm occur? The majority of Albertans, 18 years and older, who said that they or a family member had experienced unexpected harm in the past year, indicated that the harm occurred while in the hospital as an admitted inpatient (41.8% in 2010; 50.9% in 2008; and 38% in 2006). In general, the 2010 results were not statistically significant from the 2008 and 2006 results, with the exception of the family physician setting. The percent of respondents who had experienced unexpected harm in the past year, and the harm occurred while in the family physician office, in 2010 and 2008 were both significantly less than in 2006 (p < 0.05). Figure 19.7 Percent of Albertans (18+) who experienced unexpected harm, by location where harm occurred and year of survey 10 Inpatient Outpatient Emergency Public health clinic Walk-in clinic Family physician Other specified % 16.3% 2.6% 8.6% 14.8% % 9.5% 12.6% 2.2% 4.6% 6.9% 13.4% % 9.2% 18.5% % 6.4% 12.1% 161
170 20.0 Patient Complaints about Health Care Services 20.1 Experiences of Serious Complaint Q115. Have you had a serious complaint about any health care services you have received in Alberta in the past year? This question was asked of Albertans (18+) who said they had contact with the health care system in the past year (Q16). As we can see in Figure 20.1 the majority of respondents did not have a serious complaint about the health care services they received. The differences across the years for those who did not have a complaint are minor and are not statistically significant. Figure 20.1 Percent of Albertans (18+) who had or did not have a serious complaint about health care services, by year of survey 10 Yes No % 84.9% % % 86.2%
171 By Health Zone In 2010, the number of Albertans (18+) who had a serious complaint about health care services did not vary significantly; the results were similar across the health zones. Figure 20.2 Percent of Albertans (18+) who had a serious complaint about health care services, by Health Zone and year of survey 10 Alberta South Calgary Central Edmonton North % 12.7% 13.6% 12.8% % % % 13.8% 14.7% 16.6% % 15.5% 15.9% 10.6% % % 11.4% 12.7% 13.1% % 14.2% 11.4% 12.5% 12.8% 163
172 Action Taken to Address Serious Complaint Q116. Which of the following best describes what you had done to date about your (most recent) serious complaint? Of the 575 Albertans (18+) who had contact with the health system during the past year and had a serious complaint in 2010, most did not report their complaint (42.4%), followed by those that directed their complaint to a health care professional (40.4%). However, the 2% difference between the two results was not statistically significant. Figure 20.3 Percent of Albertans (18+) who had a complaint about health care services and what they did about the complaint 10 Voiced complaint Written or ed % 6.9% Phoned Contacted Patient Concerns Department Not reported Other specified % 12.1% 1.8% % 12.5% 19.1% 33.4% 2.1% % 11.5% 12.2% 36.6% 9.8% % 10.3% % 42.4% 9.9% 164
173 20.2 Satisfaction with How Complaint was Handled Q117. And to what extent were you satisfied or dissatisfied with how your complaint was handled and addressed? Of those Albertans (18+) who had contact with the health system during the past year and had a serious complaint, 1 were very satisfied with how their complaint was handled. Overall, the results have remained stable since 2003; no statistically significant variation exists by year and satisfaction rating. Figure 20.4 Albertans (18+) satisfaction with how their complaint was handled, by year of survey 10 Very Satisfied Very Dissatisfied % % 19.8% 40.7% % 8.5% 22.2% 15.9% % 16.1% 18.7% 22.8% 34.6% % 8.7% 19.9% 18.5% 42.7% % 18.6% 20.9% 40.1% 165
174 Process and Experience with Lodging Complaint Figure 20.5 summarizes yes responses to questions concerning the process and experience of lodging a complaint. Almost two-thirds of respondents in 2010 felt it was easy to lodge a serious complaint (64.8%), however less than half of the respondents reported it was handled in a timely manner (48.4%), and approximately one in three indicated they were kept informed about the status of their complaint (28.1%). Slightly more than forty percent (43.6%) felt their complaint was welcome, and less than forty percent felt it was handled fairly (37.9%) or acted upon in a meaningful way (36.9%). Overall, there was no statistically significant relationship between question and year of survey: the results have remained stable over time. Figure 20.5 Albertans (18+) experience of lodging a complaint about health services received (percent who answered yes) 10 Serious complaint was welcome Easy to lodge serious complaint Serious complaint responded to in timely manner Serious complaint handled in a fair and thorough way Serious complaint acted on in a meaningful way Kept informed about the status of serious complaint % 68.4% 54.1% 39.5% 39.1% 26.8% % 67.7% 48.1% 38.9% 33.5% 19.3% % 64.8% 48.4% 37.9% 36.9% 28.1% 166
175 Health Care Setting Serious Complaint Referred To Q124. What health care setting did your serious complaint refer to? The highest proportion of complaints referred to the emergency department (28.4%) or the hospital as an admitted patient (14.). For the most part the results have remained stable over the three survey periods, with one exception. A statistically significant increase in the proportion of Albertans (18+) reporting other specified setting occurred from 2006 to 2008 (p < 0.05); however, the 2010 result is not statistically significant compared to the 2008 result. Figure 20.6 Percent of Albertans (18+) who had a complaint about specific health services, by hear care setting and year of survey 10 Inpatient Outpatient Emergency Public health clinic Walk-in clinic Family physician Other specified % 9.3% 22.8% 6.6% 12.8% 14.7% 11.7% % 7.7% 25.8% % 12.6% 22.5% % 28.4% 5.7% 9.2% 13.7% 22.6% 167
176 Focus of Serious Complaint Q125. Was your serious complaint about your own care, a family member s care, or both? Of the Albertans (18+) who reported they had a serious complaint regarding health care services they or a family member received, the majority of respondents (53.5%) stated that the complaint was made about their own care. Over the course of the three surveys, the results have remained stable. Figure 20.7 Focus of respondents complaints, by year of survey 10 Own care Your family member Both % 29.1% 20.3% % 32.1% 14.2% % 30.5%
177 21.0 Health Link 21.1 Awareness of Health Link Q127. Alberta has a province-wide service called "Health Link" which provides Albertans with toll-free access to nurse advice and general health and services information, 24-hours a day, 7 days a week. Were you aware of the Health Link service before today? Albertans (18+) have increasingly become aware of Health Link over time; the year over year increases were statistically significant from 2006 to 2010 (p < 0.05). The majority of Albertans (18+) in 2010 (74.8%) 28 were aware that Health Link provides toll-free access to nurse advice and general health and services information, 24-hours a day, 7 days a week. Figure 21.1 Percent of Albertans (18+) aware of Health Link, by year of survey 10 Yes No % 36.7% % 34.4% % 28.8% % 25.2% 28 Please be advised some slight variation may occur between the result presented in this report (74.8%) and the result the HQCA reviewed and approved as a Key Performance Indicator for Alberta Health and Wellness (AHW) (75.6%). The AHW result was based on a sample of 4,341 Albertans (margin of error is 1.5%) received on April 26-27, 2010, whereas the HQCA report value was based on an increased sample quota (5,500 vs. 4,500) and an extended data collection period (May 31, 2010 vs. April 30, 2010). Where results were rounded, values may differ due to rounding rules. 169
178 By Health Zone Between the zones, the Calgary, Central and Edmonton zones had more respondents aware of Health Link than the South zone (p < 0.05). In most zones, with the exception of the Edmonton Zone, the 2010 results were not statistically different compared to 2008, but there were significant increases compared to the 2004 and 2006 results (p < 0.05). The Edmonton zone results have remained stable since Figure 21.2 Percent of Albertans (18+) aware of Health Link, by health zone and year of survey 10 Alberta South Calgary Central Edmonton North % % 62.2% 71.3% 60.8% % 61.9% 62.7% 63.8% 70.8% 64.9% % 63.2% 69.4% 69.2% 76.7% % % 76.6% 75.2% 74.1% 170
179 21.2 Use of Health Link Q128. Have you called Health Link within the past year? The following analysis includes all individuals who reported they were aware of Health Link. In 2010, 35.5% of Albertans (18+), compared to 32.6% in 2008, had called Health Link in the past year; the slight increase was not statistically significant. Figure 21.3 Percent of Albertans (18+) who called Health Link, by year of survey % % 35.5%
180 Demographics In 2010, significantly more women had called Health Link versus men (p < 0.05). Additionally, more year olds called the service than and 65+ year olds. As for income and education, there was no statistically significant variation amongst income groups, or for those with a high school education compared to persons with more than a high school education. Amongst Albertans (18+), in 2010, those with excellent and very good self-rated health were less likely to call Health Link than persons with good, fair or poor self-rated health (p < 0.05). As well, having any children under 16 living within the household significantly increased the likelihood of calling Health Link, compared to not having children under 16 within the household (p < 0.05). Figure 21.4a Percent of Albertans (18+) who called Heath Link, by demographic factors 172
181 Figure 21.4b Percent of Albertans (18+) who called Heath Link, by demographic factors 173
182 21.3 Satisfaction with Health Link Q129. To what degree are you satisfied or dissatisfied with you experience with Health Link? This question was asked of persons who had called Health Link in the past year. For the most part, Albertans (18+) were satisfied with their experience with Health Link; 71.8% rated their satisfaction as 4 or 5 out of 5. The year over year satisfied results (4 or 5 out of 5) for 2010 compared to the 2008 were not statistically different; however, the 2010 results were significantly lower than the 2004 result pointing to a potential decreasing trend. Figure 21.5 Albertans (18+) satisfaction with their Health Link experience, by year of survey 10 Very satisfied Very dissatisfied % 24.6% 12.6% 5.1% 5.7% % 28.1% % 5.3% % 27.8% 14.9% 6.4% % 28.4% 13.3% 7.1% 7.9% 174
183 21.4 Followed Recommendations by the Health Link Nurse Q130. Thinking about the advice you got from Health Link, did you do exactly as recommended by the Health Link nurse? Albertans (18+) who had called Health Link were asked this question, and the majority reported that they did do exactly as recommended by the nurse. The slight variation over the years was not statistically significant. Figure 21.6 Percent of Albertans (18+) who followed the recommendations of the Health Link nurse, by year of survey 10 Yes No % 10.6% % 13.2% % 12.3% 175
184 In summary From 2003 to 2008, the HQCA survey findings showed signs of improvement in several areas. The 2010 results are relatively unchanged from The key factors Albertans associated with overall difficulty or ease of access to the health care system are how easy of difficult it is to access emergency department services and family doctors as well as how well their care is coordinated. Overall access, quality of care and satisfaction with family doctors are the key factors influencing Albertan s overall satisfaction. Clearly from the perspective of Albertans, improving access and coordination of care will improve their overall health care experience. As we do every time we conduct a survey, we provide this detailed technical report to Alberta Health and Wellness, Alberta Health Services and the regulated health professions so they can see how Albertans rate overall quality, access and satisfaction in terms of their health care experience. In addition, we will continue to work with our stakeholders to use the survey results to determine province wide initiatives that focus on areas of safety and quality improvement. Finally, the HQCA thanks those Albertans who participated in this survey and provided us with valuable information. 176
185


186
Emergency Department Patient Experience Survey Highlights
 Emergency Department Patient Experience Survey Highlights www.hqca.ca April 2008 Albertans get emergency and urgent care services in many different ways. People in cities sometimes go to emergency departments
Inpatient Experience Survey 2012 Research conducted by Ipsos MORI on behalf of Great Ormond Street Hospital
 1 Version 2 Internal Use Only Inpatient Experience Survey 2012 Research conducted by Ipsos MORI on behalf of Great Ormond Street Hospital Table of Contents 2 Introduction Overall findings and key messages
Outpatient Experience Survey 2012
 1 Version 2 Internal Use Only Outpatient Experience Survey 2012 Research conducted by Ipsos MORI on behalf of Great Ormond Street Hospital 16/11/12 Table of Contents 2 Introduction Overall findings and
Long-Stay Alternate Level of Care in Ontario Mental Health Beds
 Health System Reconfiguration Long-Stay Alternate Level of Care in Ontario Mental Health Beds PREPARED BY: Jerrica Little, BA John P. Hirdes, PhD FCAHS School of Public Health and Health Systems University
National Patient Safety Foundation at the AMA
 National Patient Safety Foundation at the AMA National Patient Safety Foundation at the AMA Public Opinion of Patient Safety Issues Research Findings Prepared for: National Patient Safety Foundation at
National Survey on Consumers Experiences With Patient Safety and Quality Information
 Summary and Chartpack The Kaiser Family Foundation/Agency for Healthcare Research and Quality/Harvard School of Public Health National Survey on Consumers Experiences With Patient Safety and Quality Information
Access to Health Care Services in Canada, 2003
 Access to Health Care Services in Canada, 2003 by Claudia Sanmartin, François Gendron, Jean-Marie Berthelot and Kellie Murphy Health Analysis and Measurement Group Statistics Canada Statistics Canada Health
The Agency for Co-operative Housing 2015 Client Satisfaction Survey. Prepared by TNS Canada. December 21, 2015
 The Agency for Co-operative Housing 015 Client Satisfaction Survey Prepared by TNS Canada December 1, 015 Contents 1 Background and Objectives 0 Methodology 0 Detailed Results 06 Agency Client Profile
INPATIENT SURVEY PSYCHOMETRICS
 INPATIENT SURVEY PSYCHOMETRICS One of the hallmarks of Press Ganey s surveys is their scientific basis: our products incorporate the best characteristics of survey design. Our surveys are developed by
Summary of Findings. Data Memo. John B. Horrigan, Associate Director for Research Aaron Smith, Research Specialist
 Data Memo BY: John B. Horrigan, Associate Director for Research Aaron Smith, Research Specialist RE: HOME BROADBAND ADOPTION 2007 June 2007 Summary of Findings 47% of all adult Americans have a broadband
Massachusetts Health Connector. Fiscal Year 2011 Commonwealth Care Member Survey
 Massachusetts Health Connector Fiscal Year 2011 Commonwealth Care Member Survey A First Look at a Unique Population The landmark 2006 Massachusetts health reform law created a new group of insured individuals
Fleet and Marine Corps Health Risk Assessment, 02 January December 31, 2015
 Fleet and Marine Corps Health Risk Assessment, 02 January December 31, 2015 Executive Summary The Fleet and Marine Corps Health Risk Appraisal is a 22-question anonymous self-assessment of the most common
2011 Client Satisfaction Survey Results
 2011 Client Satisfaction Survey Results 2011 Client Satisfaction Survey Results Prepared for: Access St. John s Prepared by: Sagacity Consulting Inc. November 2011 INTRODUCTION Background Research Objectives
Patient survey report Survey of adult inpatients 2011 The Royal Bournemouth and Christchurch Hospitals NHS Foundation Trust
 Patient survey report 2011 Survey of adult inpatients 2011 The Royal Bournemouth and Christchurch Hospitals NHS Foundation Trust The national survey of adult inpatients in the NHS 2011 was designed, developed
Shifting Public Perceptions of Doctors and Health Care
 Shifting Public Perceptions of Doctors and Health Care FINAL REPORT Submitted to: The Association of Faculties of Medicine of Canada EKOS RESEARCH ASSOCIATES INC. February 2011 EKOS RESEARCH ASSOCIATES
2013 Workplace and Equal Opportunity Survey of Active Duty Members. Nonresponse Bias Analysis Report
 2013 Workplace and Equal Opportunity Survey of Active Duty Members Nonresponse Bias Analysis Report Additional copies of this report may be obtained from: Defense Technical Information Center ATTN: DTIC-BRR
2005 Survey of Licensed Registered Nurses in Nevada
 2005 Survey of Licensed Registered Nurses in Nevada Prepared by: John Packham, PhD University of Nevada School of Medicine Tabor Griswold, MS University of Nevada School of Medicine Jake Burkey, MS Washington
Patient survey report Survey of adult inpatients in the NHS 2009 Airedale NHS Trust
 Patient survey report 2009 Survey of adult inpatients in the NHS 2009 The national survey of adult inpatients in the NHS 2009 was designed, developed and co-ordinated by the Acute Surveys Co-ordination
Disparities in Primary Health Care Experiences Among Canadians With Ambulatory Care Sensitive Conditions
 March 2012 Disparities in Primary Health Care Experiences Among Canadians With Ambulatory Care Sensitive Conditions Highlights This report uses the 2008 Canadian Survey of Experiences With Primary Health
Patient survey report National children's inpatient and day case survey 2014 The Mid Yorkshire Hospitals NHS Trust
 Patient survey report 2014 National children's inpatient and day case survey 2014 National NHS patient survey programme National children's inpatient and day case survey 2014 The Care Quality Commission
Access to Health Care Services in Canada, 2001
 Access to Health Care Services in Canada, 2001 by Claudia Sanmartin, Christian Houle, Jean-Marie Berthelot and Kathleen White Health Analysis and Measurement Group Statistics Canada Statistics Canada Health
Quality Management Building Blocks
 Quality Management Building Blocks Quality Management A way of doing business that ensures continuous improvement of products and services to achieve better performance. (General Definition) Quality Management
Missed Nursing Care: Errors of Omission
 Missed Nursing Care: Errors of Omission Beatrice Kalisch, PhD, RN, FAAN Titus Professor of Nursing and Chair University of Michigan Nursing Business and Health Systems Presented at the NDNQI annual meeting
Patient survey report Survey of adult inpatients in the NHS 2010 Yeovil District Hospital NHS Foundation Trust
 Patient survey report 2010 Survey of adult inpatients in the NHS 2010 The national survey of adult inpatients in the NHS 2010 was designed, developed and co-ordinated by the Co-ordination Centre for the
Patient survey report Inpatient survey 2008 Royal Devon and Exeter NHS Foundation Trust
 Patient survey report 2008 Inpatient survey 2008 Royal Devon and Exeter NHS Foundation Trust The national Inpatient survey 2008 was designed, developed and co-ordinated by the Acute Surveys Co-ordination
Patient survey report Survey of people who use community mental health services 2011 Pennine Care NHS Foundation Trust
 Patient survey report 2011 Survey of people who use community mental health services 2011 The national Survey of people who use community mental health services 2011 was designed, developed and co-ordinated
Medicare Spending and Rehospitalization for Chronically Ill Medicare Beneficiaries: Home Health Use Compared to Other Post-Acute Care Settings
 Medicare Spending and Rehospitalization for Chronically Ill Medicare Beneficiaries: Home Health Use Compared to Other Post-Acute Care Settings Executive Summary The Alliance for Home Health Quality and
FOCUS on Emergency Departments DATA DICTIONARY
 FOCUS on Emergency Departments DATA DICTIONARY Table of Contents Contents Patient time to see an emergency doctor... 1 Patient emergency department total length of stay (LOS)... 3 Length of time emergency
National Cancer Patient Experience Survey National Results Summary
 National Cancer Patient Experience Survey 2015 National Results Summary Introduction As in previous years, we are hugely grateful to the tens of thousands of cancer patients who responded to this survey,
Results of the Clatsop County Economic Development Survey
 Results of the Clatsop County Economic Development Survey Final Report for: Prepared for: Clatsop County Prepared by: Community Planning Workshop Community Service Center 1209 University of Oregon Eugene,
2016 National NHS staff survey. Results from Wirral University Teaching Hospital NHS Foundation Trust
 2016 National NHS staff survey Results from Wirral University Teaching Hospital NHS Foundation Trust Table of Contents 1: Introduction to this report 3 2: Overall indicator of staff engagement for Wirral
Research Brief IUPUI Staff Survey. June 2000 Indiana University-Purdue University Indianapolis Vol. 7, No. 1
 Research Brief 1999 IUPUI Staff Survey June 2000 Indiana University-Purdue University Indianapolis Vol. 7, No. 1 Introduction This edition of Research Brief summarizes the results of the second IUPUI Staff
Supplemental materials for:
 Supplemental materials for: Ricci-Cabello I, Avery AJ, Reeves D, Kadam UT, Valderas JM. Measuring Patient Safety in Primary Care: The Development and Validation of the "Patient Reported Experiences and
Central Zone Healthcare Plan. For Placement Only. Strategy Overview
 Alberta Health Services Central Zone Healthcare Plan For Placement Only Strategy Overview A plan for us Alberta Health Services (AHS) recognizes every community in Alberta is unique. That s why health
2015 Emergency Management and Preparedness Final Report
 2015 Emergency Management and Preparedness Final Report May 29, 2015 TABLE OF CONTENTS 1.0 SUMMARY OF FINDINGS 3 2.0 PROJECT BACKGROUND 7 3.0 METHODOLOGY 8 3.1 Project Initiation and Questionnaire Review
2011 National NHS staff survey. Results from London Ambulance Service NHS Trust
 2011 National NHS staff survey Results from London Ambulance Service NHS Trust Table of Contents 1: Introduction to this report 3 2: Overall indicator of staff engagement for London Ambulance Service NHS
2017 National Survey of Canadian Nurses: Use of Digital Health Technology in Practice Final Executive Report May, 2017
 2017 National Survey of Canadian Nurses: Use of Digital Health Technology in Practice Final Executive Report May, 2017 Table of contents Section Heading Background, methodology and sample profile 3 Key
Oklahoma Health Care Authority. ECHO Adult Behavioral Health Survey For SoonerCare Choice
 Oklahoma Health Care Authority ECHO Adult Behavioral Health Survey For SoonerCare Choice Executive Summary and Technical Specifications Report for Report Submitted June 2009 Submitted by: APS Healthcare
FUNCTIONAL DISABILITY AND INFORMAL CARE FOR OLDER ADULTS IN MEXICO
 FUNCTIONAL DISABILITY AND INFORMAL CARE FOR OLDER ADULTS IN MEXICO Mariana López-Ortega National Institute of Geriatrics, Mexico Flavia C. D. Andrade Dept. of Kinesiology and Community Health, University
s n a p s h o t Medi-Cal at a Crossroads: What Enrollees Say About the Program
 s n a p s h o t Medi-Cal at a Crossroads: What Enrollees Say About the Program May 2012 Introduction Medi-Cal, which currently provides health and long term care coverage for more than 7.5 million Californians,
Employee Telecommuting Study
 Employee Telecommuting Study June Prepared For: Valley Metro Valley Metro Employee Telecommuting Study Page i Table of Contents Section: Page #: Executive Summary and Conclusions... iii I. Introduction...
National findings from the 2013 Inpatients survey
 National findings from the 2013 Inpatients survey Introduction This report details the key findings from the 2013 survey of adult inpatient services. This is the eleventh survey and involved 156 acute
Navy and Marine Corps Public Health Center. Fleet and Marine Corps Health Risk Assessment 2013 Prepared 2014
 Navy and Marine Corps Public Health Center Fleet and Marine Corps Health Risk Assessment 2013 Prepared 2014 The enclosed report discusses and analyzes the data from almost 200,000 health risk assessments
Care Quality Commission (CQC) Technical details patient survey information 2011 Inpatient survey March 2012
 Technical details patient survey information 2011 Inpatient survey March 2012") Care Quality Commission (CQC) Technical details patient survey information 2011 Inpatient survey March 2012 Contents 1. Introduction... 1 2. Selecting data for the reporting... 1 3. The CQC organisation
Care Quality Commission (CQC) Technical details patient survey information 2011 Inpatient survey March 2012 Contents 1. Introduction... 1 2. Selecting data for the reporting... 1 3. The CQC organisation
What are the potential ethical issues to be considered for the research participants and
 What are the potential ethical issues to be considered for the research participants and researchers in the following types of studies? 1. Postal questionnaires 2. Focus groups 3. One to one qualitative
2016 National NHS staff survey. Results from Surrey And Sussex Healthcare NHS Trust
 2016 National NHS staff survey Results from Surrey And Sussex Healthcare NHS Trust Table of Contents 1: Introduction to this report 3 2: Overall indicator of staff engagement for Surrey And Sussex Healthcare
Predicting Transitions in the Nursing Workforce: Professional Transitions from LPN to RN
 Predicting Transitions in the Nursing Workforce: Professional Transitions from LPN to RN Cheryl B. Jones, PhD, RN, FAAN; Mark Toles, PhD, RN; George J. Knafl, PhD; Anna S. Beeber, PhD, RN Research Brief,
Inpatient Experience Survey 2016 Results for Royal Infirmary of Edinburgh
 Results for August, Official Statistics Contents Page Introduction 3 Notes of interpretation 4 Chapter 1: Rated results 6 Chapter 2: Comparison with previous surveys 28 Chapter 3: Variation in hospital
Inpatient Experience Survey 2016 Results for Western General Hospital, Edinburgh
 Results for, Edinburgh August, Official Statistics Contents Page Introduction 3 Notes of interpretation 4 Chapter 1: Rated results 6 Chapter 2: Comparison with previous surveys 28 Chapter 3: Variation
Inpatient Experience Survey 2016 Results for Dr Gray's Hospital, Elgin
 Results for, Elgin August, Official Statistics Contents Page Introduction 3 Notes of interpretation 4 Chapter 1: Rated results 6 Chapter 2: Comparison with previous surveys 28 Chapter 3: Variation in hospital
Patient survey report Mental health acute inpatient service users survey gether NHS Foundation Trust
 Patient survey report 2009 Mental health acute inpatient service users survey 2009 The mental health acute inpatient service users survey 2009 was coordinated by the mental health survey coordination centre
North Carolina. CAHPS 3.0 Adult Medicaid ECHO Report. December Research Park Drive Ann Arbor, MI 48108
 North Carolina CAHPS 3.0 Adult Medicaid ECHO Report December 2016 3975 Research Park Drive Ann Arbor, MI 48108 Table of Contents Using This Report 1 Executive Summary 3 Key Strengths and Opportunities
2017 National NHS staff survey. Results from The Newcastle Upon Tyne Hospitals NHS Foundation Trust
 2017 National NHS staff survey Results from The Newcastle Upon Tyne Hospitals NHS Foundation Trust Table of Contents 1: Introduction to this report 3 2: Overall indicator of staff engagement for The Newcastle
National Cancer Patient Experience Survey National Results Summary
 National Cancer Patient Experience Survey 2016 National Results Summary Index 4 Executive Summary 8 Methodology 9 Response rates and confidence intervals 10 Comparisons with previous years 11 This report
Valley Metro TDM Survey Results Spring for
 Valley Metro TDM Survey Results 2017 Spring 2017 for P a g e ii Table of Contents Section: Page #: Executive Summary... iv Conclusions... viii I. Introduction... 1 A. Background and Methodology... 1 B.
Practice nurses in 2009
 Practice nurses in 2009 Results from the RCN annual employment surveys 2009 and 2003 Jane Ball Geoff Pike Employment Research Ltd Acknowledgements This report was commissioned by the Royal College of Nursing
Suicide Among Veterans and Other Americans Office of Suicide Prevention
 Suicide Among Veterans and Other Americans 21 214 Office of Suicide Prevention 3 August 216 Contents I. Introduction... 3 II. Executive Summary... 4 III. Background... 5 IV. Methodology... 5 V. Results
Predicting use of Nurse Care Coordination by Patients in a Health Care Home
 Predicting use of Nurse Care Coordination by Patients in a Health Care Home Catherine E. Vanderboom PhD, RN Clinical Nurse Researcher Mayo Clinic Rochester, MN USA 3 rd Annual ICHNO Conference Chicago,
Provider Profiling. Partial Hospitalization Programs. 01/01/12 to 12/31/12
 Provider Profiling Partial Hospitalization Programs 01/01/12 to 12/31/12 Partial Hospitalization Programs CBHNP utilizes a provider profiling process that is an important provider-level quality improvement
Patient survey report Survey of people who use community mental health services Boroughs Partnership NHS Foundation Trust
 Patient survey report 2013 Survey of people who use community mental health services 2013 The survey of people who use community mental health services 2013 was designed, developed and co-ordinated by
GP Practice Survey. Survey results
 GP Practice Survey Survey results Contents Contents Objectives and methodology Key findings Profile of patients who completed the survey Frequency of visiting the surgery Awareness and usage of core surgery
Quality and Outcome Related Measures: What Are We Learning from New Brunswick s Primary Health Care Survey? Primary Health Care Report Series: Part 2
 Quality and Outcome Related Measures: What Are We Learning from New Brunswick s Primary Health Care Survey? Primary Health Care Report Series: Part 2 About us: Who we are: New Brunswickers have a right
Patient survey report Accident and emergency department survey 2012 North Cumbria University Hospitals NHS Trust
 Patient survey report 2012 Accident and emergency department survey 2012 The Accident and emergency department survey 2012 was designed, developed and co-ordinated by the Co-ordination Centre for the NHS
Survey of people who use community mental health services Leicestershire Partnership NHS Trust
 Survey of people who use community mental health services 2017 Survey of people who use community mental health services 2017 National NHS patient survey programme Survey of people who use community mental
As part. findings. appended. Decision
 Council, 4 December 2012 Revalidation: Fitness to practisee data analysis Executive summary and recommendations Introduction As part of the programme of work looking at continuing fitness to practise and
EVALUATION OF THE CARE MANAGEMENT OVERSIGHT PROJECT. Prepared By: Geneva Strech, M. Ed., MHR Betty Harris, M. A. John Vetter, M. A.
 University of Oklahoma College of Continuing Education EVALUATION OF THE CARE MANAGEMENT OVERSIGHT PROJECT June 30, 2011 Prepared By: Geneva Strech, M. Ed., MHR Betty Harris, M. A. John Vetter, M. A. Funding
2016 REPORT Community Care for the Elderly (CCE) Client Satisfaction Survey
 Client Satisfaction Survey") 2016 REPORT Community Care for the Elderly (CCE) Client Satisfaction Survey Program Services, Direct Service Workers, and Impact of Program on Lives of Clients i Florida Department of Elder Affairs, 2016
2016 REPORT Community Care for the Elderly (CCE) Client Satisfaction Survey Program Services, Direct Service Workers, and Impact of Program on Lives of Clients i Florida Department of Elder Affairs, 2016
Leicestershire Partnership NHS Trust Summary of Equality Monitoring Analyses of Service Users. April 2015 to March 2016
 Leicestershire Partnership NHS Trust Summary of Equality Monitoring Analyses of Service Users April 2015 to March 2016 NOT FOR PUBLICATION Table of Contents Introduction... 2 Principle findings from the
The Nature of Emergency Medicine
 Chapter 1 The Nature of Emergency Medicine In This Chapter The ED Laboratory The Patient The Illness The Unique Clinical Work Sense Making Versus Diagnosing The ED Environment The Role of Executive Leadership
Participant Satisfaction Survey Summary Report Fiscal Year 2012
 Participant Satisfaction Survey Summary Report Fiscal Year 2012 Prepared by: SPEC Associates Detroit, Michigan www.specassociates.org Introduction Since 2003, Area Agency on Aging 1-B (AAA 1-B) 1 has been
2012 Report. Client Satisfaction Survey PSA 9 RICK SCOTT. Program Services, Direct Service Workers, and. Impact of Programs on Lives of Clients
 RICK SCOTT GOVERNOR 2012 Report CHARLES T. CORLEY SECRETARY Client Satisfaction Survey Program Services, Direct Service Workers, and Impact of Programs on Lives of Clients PSA 9 elderaffairs.state.fl.us
UnitedHealthcare Community Plan 2016 Long Term Care Member/Responsible Party Satisfaction Survey
 AZ009-800E 602.255.8913 1 East Washington, Suite 800 877-395-5993 Fax Phoenix, AZ 85004 Objectives UnitedHealthcare Community Plan 2016 Long Term Care Member/Responsible Party Satisfaction Survey In support
Patient Follow Up Questionnaire
 Patient Follow Up Questionnaire Context The third strand of the Healthy Hearts in the West Initiative, Local provision of Cardiac Rehabilitation programmes (Phase 3 and Phase 4) and promotion of opportunities
Impact of Financial and Operational Interventions Funded by the Flex Program
 Impact of Financial and Operational Interventions Funded by the Flex Program KEY FINDINGS Flex Monitoring Team Policy Brief #41 Rebecca Garr Whitaker, MSPH; George H. Pink, PhD; G. Mark Holmes, PhD University
2017 National NHS staff survey. Results from Dorset County Hospital NHS Foundation Trust
 2017 National NHS staff survey Results from Dorset County Hospital NHS Foundation Trust Table of Contents 1: Introduction to this report 3 2: Overall indicator of staff engagement for Dorset County Hospital
1.4 Average Prospective Per Person Utilization by Clinical Risk Group Average Prospective Per Person Direct Costs...14
 The core mandate of the Health Quality Council of Alberta is to measure, monitor and assess the quality and safety of health care services in Alberta and to support improvement through collaboration with
Health System Outcomes and Measurement Framework
 Health System Outcomes and Measurement Framework December 2013 (Amended August 2014) Table of Contents Introduction... 2 Purpose of the Framework... 2 Overview of the Framework... 3 Logic Model Approach...
Nursing Education Program of Saskatchewan (NEPS) 2-Year Follow-Up Survey: 2004 Graduates
 2-Year Follow-Up Survey: 2004 Graduates") Nursing Education Program of Saskatchewan (NEPS) 2-Year Follow-Up Survey: 2004 Graduates Prepared for The College of Nursing of the University of Saskatchewan, the Nursing Division of the Saskatchewan
Nursing Education Program of Saskatchewan (NEPS) 2-Year Follow-Up Survey: 2004 Graduates Prepared for The College of Nursing of the University of Saskatchewan, the Nursing Division of the Saskatchewan
NC Division of Mental Health, Developmental Disabilities, and Substance Abuse Services (DMH/DD/SAS)
") NC Division of Mental Health, Developmental Disabilities, and Substance Abuse Services (DMH/DD/SAS) Perception of Care Survey of Alliance Consumers Fiscal Year 2014 Background Information The Division
NC Division of Mental Health, Developmental Disabilities, and Substance Abuse Services (DMH/DD/SAS) Perception of Care Survey of Alliance Consumers Fiscal Year 2014 Background Information The Division
Scottish Hospital Standardised Mortality Ratio (HSMR)
") ` 2016 Scottish Hospital Standardised Mortality Ratio (HSMR) Methodology & Specification Document Page 1 of 14 Document Control Version 0.1 Date Issued July 2016 Author(s) Quality Indicators Team Comments
` 2016 Scottish Hospital Standardised Mortality Ratio (HSMR) Methodology & Specification Document Page 1 of 14 Document Control Version 0.1 Date Issued July 2016 Author(s) Quality Indicators Team Comments
Standardization of the Description of Competencies of Western Canadian Licensed Practical Nurse (LPN) Practitioners Project
 Practitioners Project") EVALUATION REPORT Standardization of the Description of Competencies of Western Canadian Licensed Practical Nurse (LPN) Practitioners Project Prepared by: Steppingstones Partnership, Inc. Edmonton, AB
EVALUATION REPORT Standardization of the Description of Competencies of Western Canadian Licensed Practical Nurse (LPN) Practitioners Project Prepared by: Steppingstones Partnership, Inc. Edmonton, AB
Care Quality Commission (CQC) Technical details patient survey information 2012 Inpatient survey March 2012
 Technical details patient survey information 2012 Inpatient survey March 2012") Care Quality Commission (CQC) Technical details patient survey information 2012 Inpatient survey March 2012 Contents 1. Introduction... 1 2. Selecting data for the reporting... 1 3. The CQC organisation
Care Quality Commission (CQC) Technical details patient survey information 2012 Inpatient survey March 2012 Contents 1. Introduction... 1 2. Selecting data for the reporting... 1 3. The CQC organisation
California Community Clinics
 California Community Clinics A Financial and Operational Profile, 2008 2011 Prepared by Sponsored by Blue Shield of California Foundation and The California HealthCare Foundation TABLE OF CONTENTS Introduction
National Health Promotion in Hospitals Audit
 National Health Promotion in Hospitals Audit Acute & Specialist Trusts Final Report 2012 www.nhphaudit.org This report was compiled and written by: Mr Steven Knuckey, NHPHA Lead Ms Katherine Lewis, NHPHA
Call for Posters. Deadline for Submissions: May 15, Washington, DC Gaylord National Harbor Hotel October 18 21, 2015
 Call for Posters Washington, DC Gaylord National Harbor Hotel October 18 21, 2015 Deadline for Submissions: May 15, 2015 APhA is the official education provider and meeting manager of JFPS 2015. 15-123
Evidenced-Informed Training Intervention For Puerto Rican Caregivers of Persons with ADRDP
 Evidenced-Informed Training Intervention For Puerto Rican Caregivers of Persons with ADRDP Carmen D. Sánchez Salgado Ph.D. Ombudsman for the Elderly San Juan, Puerto Rico csanchez@oppea.pr.gov Background
Alberta Health Services. Strategic Direction
 Alberta Health Services Strategic Direction 2009 2012 PLEASE GO TO WWW.AHS-STRATEGY.COM TO PROVIDE FEEDBACK ON THIS DOCUMENT Defining Our Focus / Measuring Our Progress CONSULTATION DOCUMENT Introduction
Medicare Spending and Rehospitalization for Chronically Ill Medicare Beneficiaries: Home Health Use Compared to Other Post-Acute Care Settings
 Medicare Spending and Rehospitalization for Chronically Ill Medicare Beneficiaries: Home Health Use Compared to Other Post-Acute Care Settings May 11, 2009 Avalere Health LLC Avalere Health LLC The intersection
Type of intervention Secondary prevention of heart failure (HF)-related events in patients at risk of HF.
-related events in patients at risk of HF.") Emergency department observation of heart failure: preliminary analysis of safety and cost Storrow A B, Collins S P, Lyons M S, Wagoner L E, Gibler W B, Lindsell C J Record Status This is a critical abstract
Emergency department observation of heart failure: preliminary analysis of safety and cost Storrow A B, Collins S P, Lyons M S, Wagoner L E, Gibler W B, Lindsell C J Record Status This is a critical abstract
EVALUATION OF THE CARE MANAGEMENT OVERSIGHT PROJECT. June 30, 2011 Prepared By: Geneva Strech, M. Ed., MHR Betty Harris, M. A. John Vetter, M. A.
 University of Oklahoma College of Continuing Education EVALUATION OF THE CARE MANAGEMENT OVERSIGHT PROJECT June 30, 2011 Prepared By: Geneva Strech, M. Ed., MHR Betty Harris, M. A. John Vetter, M. A. Funding
2017 National NHS staff survey. Results from London North West Healthcare NHS Trust
 2017 National NHS staff survey Results from London North West Healthcare NHS Trust Table of Contents 1: Introduction to this report 3 2: Overall indicator of staff engagement for London North West Healthcare
Inpatient Patient Experience Survey 2014 Results for NHS Grampian
 Results for August, Official Statistics Contents Page Introduction 3 Chapter 1: Rated Results 4 Chapter 2: Comparison with Previous Surveys 19 Chapter 3: Variation in NHS Board Results across 28 Chapter
Survey of adult inpatients in the NHS, Care Quality Commission comparing results between national surveys from 2009 to 2010
 Royal United Hospital, Bath, NHS Trust Survey of adult inpatients in the NHS, Care Quality Commission comparing results between national surveys from 2009 to 2010 Please find below charts comparing the
Health Quality Ontario
 Health Quality Ontario The provincial advisor on the quality of health care in Ontario November 15, 2016 Under Pressure: Emergency department performance in Ontario Technical Appendix Table of Contents
Patient survey report Survey of adult inpatients 2016 Chesterfield Royal Hospital NHS Foundation Trust
 Patient survey report 2016 Survey of adult inpatients 2016 NHS patient survey programme Survey of adult inpatients 2016 The Care Quality Commission The Care Quality Commission is the independent regulator
Analyzing Recognition of Clinical Nurses Health Care using Q-methodology
 Analyzing Recognition of Clinical Nurses Health Care using Q-methodology Mihye Kim Department of Nursing, Hanyang University - Seoul Hospital, Wangsimniro, Seongdong-gu, Seoul 133-792, South Korea. E-mail:
2017 National NHS staff survey. Results from Royal Cornwall Hospitals NHS Trust
 2017 National NHS staff survey Results from Royal Cornwall Hospitals NHS Trust Table of Contents 1: Introduction to this report 3 2: Overall indicator of staff engagement for Royal Cornwall Hospitals NHS
CALIFORNIA HEALTHCARE FOUNDATION. Medi-Cal Versus Employer- Based Coverage: Comparing Access to Care JULY 2015 (REVISED JANUARY 2016)
") CALIFORNIA HEALTHCARE FOUNDATION Medi-Cal Versus Employer- Based Coverage: Comparing Access to Care JULY 2015 (REVISED JANUARY 2016) Contents About the Authors Tara Becker, PhD, is a statistician at the
CALIFORNIA HEALTHCARE FOUNDATION Medi-Cal Versus Employer- Based Coverage: Comparing Access to Care JULY 2015 (REVISED JANUARY 2016) Contents About the Authors Tara Becker, PhD, is a statistician at the
2017 National NHS staff survey. Results from North West Boroughs Healthcare NHS Foundation Trust
 2017 National NHS staff survey Results from North West Boroughs Healthcare NHS Foundation Trust Table of Contents 1: Introduction to this report 3 2: Overall indicator of staff engagement for North West
National Inpatient Survey. Director of Nursing and Quality
 Reporting to: Title Sponsoring Director Trust Board National Inpatient Survey Director of Nursing and Quality Paper 6 Author(s) Sarah Bloomfield, Director of Nursing and Quality, Sally Allen, Clinical