Navy and Marine Corps Public Health Center. Fleet and Marine Corps Health Risk Assessment 2013 Prepared 2014
|
|
|
- Shanon Owen
- 6 years ago
- Views:
Transcription

1 Navy and Marine Corps Public Health Center Fleet and Marine Corps Health Risk Assessment 2013 Prepared 2014 The enclosed report discusses and analyzes the data from almost 200,000 health risk assessments for active and reserve components of the Navy, Marine Corps and Coast Guard during calendar year Questions or comments about this report can be sent to the HRA Program Manager at (757) or to Commands needing additional information about implementing the HRA in 2013 can also contact the program manager.
2 Contents Executive Summary... 1 Background... 2 Methods... 3 Data Collection and Analyses... 3 Results... 5 Demographic Analysis... 5 HRA Risk Factor Analysis BMI Status Distribution of Healthy Versus Unhealthy Responses Distribution of Risk Categories Changes in Health Responses Perception of Health Mean Risk by Demographic Variables Days Away From Home Station Days Away From Home Station and Mean Risk Days Away From Home Station and Risk Score Days Away from Home Station and Unhealthy Behaviors Strengths and Limitations Demographics Risk Factors Days Away From Home Conclusion Appendix A Appendix B References i
3 Executive Summary The Fleet and Marine Corps Health Risk Assessment (HRA) is a 22-question self-assessment of many of the most common health risks for Department of the Navy (DON) service members. The HRA supports preventive health screening and counseling by healthcare providers during the annual Periodic Health Assessment (PHA), provides individual members with credible sources of health information on the Web, provides data to health educators to plan and implement community interventions, and provides commanding officers at all levels with snapshots of unit profiles. The HRA tool is web-based, but there is also a stand-alone Microsoft Excel version that can be used on ships with poor Internet connectivity. Completion of the voluntary assessment takes approximately three minutes and provides personalized reports to each individual. A total of 233,281 completed assessments were analyzed during the 12-month period of January 1, 2013 through December 31, 2013 and included responses from both active and reserve component (RC) members from the Navy (USN), Marine Corps (USMC), and Coast Guard (USCG). This report utilizes both descriptive and analytic methods to report the results by the total responses as well as by service component and specific demographic characteristics. Demographic variables that were examined included age, gender, race, rank, and service component. Analyses utilized one of two measures: 1) healthy or unhealthy risk ratings or 2) a risk score based on the total number of risk behaviors reported by an individual. The prevalence of specific risk factors has remained fairly constant from 2012, with the leading health risks being low consumption of fruits and vegetables, high consumption of high-fat foods, deficient dental hygiene (not flossing), and inadequate sleep. The mean number of risk factors showed that more USMC members qualified as high risk (29.9%), followed by the USMCR (26.7%), USN (24.1%), USNR (13.2%), USCG (11.9%), and USCGR (9.1%). The data also indicate that, in general, Navy and Coast Guard personnel were more likely than Marines to be classified as overweight. 1
4 Background Health risk assessments (HRAs) became widely used both in military and civilian settings beginning in the mid-1980s. HRAs are tools that can be used to educate patients, to assist healthcare professionals in counseling patients, and to inform decision makers of the overall health status of populations. Different versions of HRAs are available to assess a range of conditions and risk behaviors, and HRAs are often used to assess health concerns of specific age groups. The 2013 Fleet and Marine Corps HRA is a voluntary 22-question, self-reported, webbased assessment tool specifically designed to assess risk behaviors common to Department of the Navy (DON) military members. However, the topics and scoring criteria are also valid for the general United States (U.S.) adult population. To ensure maximum participation and to remove any stigma that might be associated with a specific risk behavior, no personal identifying information is collected and demographic data, such as age, are reported by categories. The questions are based on other validated tools, such as the Alcohol Use Disorders Identification Test (AUDIT), the Department of Defense (DOD) Survey of Health Related Behaviors Among Military Personnel, and the National Health and Nutrition Examination Survey (NHANES), or from input from subject matter experts. The questions address 10 risk categories that provide a snapshot of leading health indicators. The categories include: 1. tobacco use 2. alcohol use 3. safety 4. stress management 5. sexual health 6. physical activity 7. nutrition 8. supplement use 9. dental health 10. sleep problems 2
5 Methods Data Collection and Analyses Data from 236,510 surveys were collected from the most recent 12-month period, 01 January 2013 through 31 December The data were analyzed by the EpiData Center (EDC) at the Navy and Marine Corps Public Health Center (NMCPHC). Individual surveys were excluded from analysis for either of the following reasons: a. Records with blank fields, except for the race-related questions, were considered incomplete and were excluded from analysis. Blank fields for race-related questions were excluded from race-related analysis only. There were a total of 1,648 incomplete records across all services and 6,000 blank fields for race-related questions. b. Surveys completed by service members who identified themselves as Navy, Marine Corps, or Coast Guard members and had a rank of civilian were excluded from analysis (1,581). The total number of surveys included in the analysis was 233,281. All analyses utilized one of two measures: 1) healthy or unhealthy risk ratings or 2) a risk score. The 22 risk assessment responses were categorized healthy or unhealthy according to the standards listed in Appendix B. A risk score was tabulated based on the total number of risk categories in which one or more of the responses were reported as unhealthy. Risk scores ranged from 0-10 and were categorized into risk levels low, medium, and high: 0-2 risk categories = low risk 3-4 risk categories = medium risk 5 or more risk categories = high risk Risk scores do not predict early morbidity or mortality; rather, higher risk scores indicate a greater likelihood that members will utilize more healthcare services in the future than lower risk members. Days away from home station categories were created using the variable days away, which is the number of days from home station respondents indicated on deployment related questions. Descriptive analyses, frequencies, and percentages were used to describe survey respondents. Logistic regression examining the relationship between days away from home station and risk number was conducted using SAS software (Version 9.2 SAS Institute, Inc., Cary, North Carolina). 3
6 The following demographic variables were collected: age, gender, race, rank, and service. Member age was categorized using ranges of 17-19, 20-29, 30-39, 40-49, and 50 years and over. Race was categorized as Caucasian, African American, Asian and Pacific Islander, Hispanic, or Other. Rank was categorized as enlisted service members (E1-E5 or E6-E9), officers (O1-O3 or O4-O9), and warrant officers (W1-W5). E-10 and O-10 were not included in the analysis due to only one person being at those ranks and would be identifiable. Body mass index (BMI) was calculated from self-reported height and weight data according to the current Centers for Disease Control and Prevention (CDC) guidelines ([weight (height in inches) 2 ] x 703). 1 According to the CDC, BMI values that exceed healthy levels have been shown in published studies to be an independent risk factor for certain diseases and all-cause mortality. 4
7 Results Demographic Analysis There were 236,510 surveys completed for the 2013 HRA, of which 233,281 surveys completed by the study cohort were included in the analysis. Descriptive analyses of service demographics showed that the majority (52%) of survey respondents were active duty Navy service members, while 12% were Navy Reservists, 16% were active duty and reserve Marines, and 19% were active duty and reserve Coast Guard members (Figure 1). 5
8 The age distribution of survey respondents indicated that 50% of the respondents were in the year old age group (Figure 2). 6

9 Overall, Navy and Coast Guard service member respondents were older than the Marines survey respondents (Figure 3). The mean age of service member respondents was USN=29.9 years, USNR=35.5 years, USMC=26.4 years, USMCR=27.9 years, USCG=31.3 years, and USCGR=34.9 years. 7
10 With respect to gender, more males (82%) completed the HRA than females, which reflect the general male/female ratio of DON service members. The gender difference was especially evident in the Marine Corps, with fewer than 8% of the HRAs completed by females compared to 21% in the Navy. 8
. The USCG (71.")
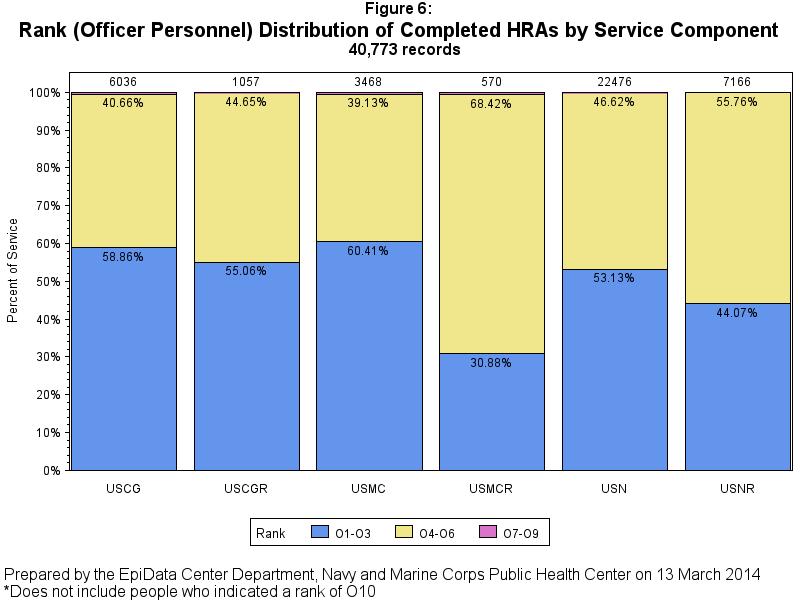
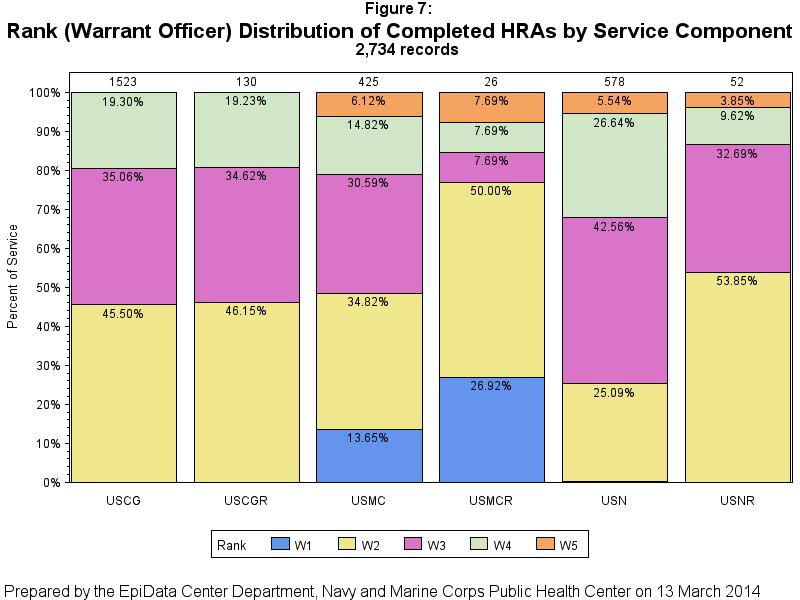
11 Distribution by respondent rank indicated that 81% of the surveys were completed by enlisted members, 17% by officers, and 1% by warrant officers. Figures 5-7 display the distribution of respondent ranks by service. The USMC and USMCR had the largest percentage of lower-ranking enlisted members (39.5% and 45.8%, respectively). The USCG (71.7% E4-E6 and 13.8% E7-E9) and USCGR (80.6% E4-E6 and 17.0% E7-E9) had the largest percentage of senior-ranking enlisted members. 9
12 10
13 11
, followed by Asian/Pacific Islander (13%), Hispanic (12%), African American (6%), and Other (4%) (Figure 8). 12")
14 Race varied somewhat between service components, but across services, survey respondents were predominantly Caucasian (64%), followed by Asian/Pacific Islander (13%), Hispanic (12%), African American (6%), and Other (4%) (Figure 8). 12

15 HRA Risk Factor Analysis BMI Status As a screening test, BMI usually correlates well in the U.S. population with an individual s amount of body fat, although some individuals, such as muscular athletes, may have BMIs that identify them as overweight even though they do not have excess body fat. Therefore, this analysis should not necessarily lead to the conclusion that all individuals exceeding these levels are overweight or obese. Rather, the analysis may support some general observations about weight across the services. Overall, 63% of service members were classified as overweight according to the CDC BMI standards for healthy adults. The analysis indicated that, in general, Navy and Coast Guard personnel were more likely than Marines to be classified as overweight or obese. Active duty Navy, Coast Guard, and Marine personnel are nearly equally as likely to be of normal BMI as reservists (Figure 9). 13
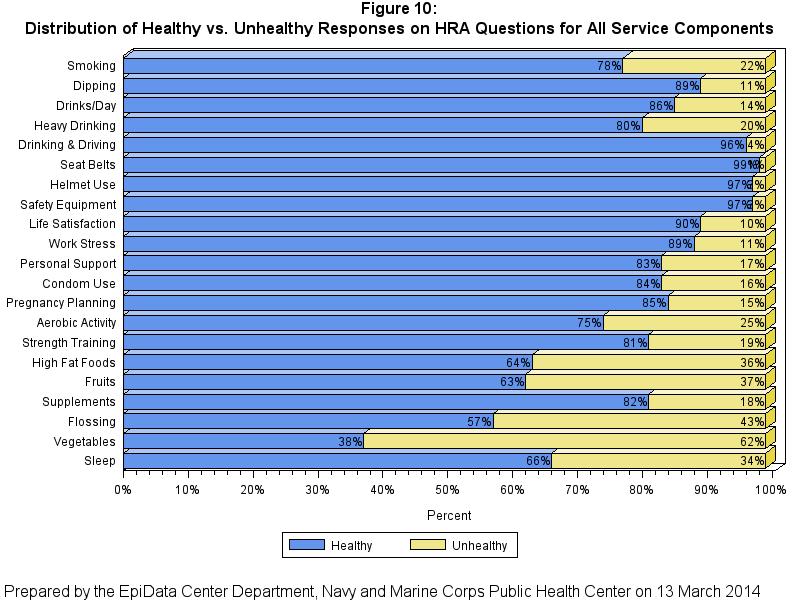
16 Distribution of Healthy Versus Unhealthy Responses As shown in Appendix B, each HRA response was classified as healthy or unhealthy based on the risk factors associated with that response. The next seven graphs (Figures 10-16) display the results of these questions by service component. Healthy (blue) and unhealthy (yellow) response frequencies are displayed along the horizontal axis which depicts total response percentage. A longer blue bar indicates more people were classified as healthy than unhealthy. Overall and for all components, the leading health risks (unhealthy ratings) were low daily intake of vegetables (62%), lack of dental flossing (43%), low daily intake of fruits (37%), and high daily intake of high-fat foods (36%). Among all respondents, other significant areas of concern included lack of sleep (34%), lack of aerobic activity (25%), smoking (22%), and heavy drinking (20%). Overall, the most common healthy behaviors reported by members included use of seat belts (99%), use of safety equipment (97%), and avoiding drinking and driving (96%) (Figure 10). 14
17 15
18 USN and USNR response distributions closely resembled one another (Figures 11 and 12). Both groups shared their top two risk factors of low intake of vegetables (66% and 56%, respectively) and lack of flossing (43% and 35%, respectively). In addition, 40% of USN and 31% of USNR members reported low intake of fruit; 40% of USN and 29% of USNR members also reported frequent consumption of high-fat foods. USN service members reported more frequent heavy drinking (21%) and a higher average number of drinks per day (15%) than did USNR members (12% and 8%, respectively). USN members reported a higher percentage of smoking (24%) than did USNR members (14%). More USN members also reported they did not get enough restful sleep (38%) compared with USNR members (24%). 16
19 17
20 The USMC and USMCR followed similar trends based on reported risks (Figures 13 and 14). Unhealthy responses for both groups included low intake of vegetables (72% and 66%, respectively), low levels of flossing (54% and 51%, respectively), and low intake of fruits (46% and 42%, respectively). USMC members more often reported higher levels of work stress (12%) than USMCR members (9%). USMC and USMCR members both reported a high percentage of heavy drinking (29% and 25%, respectively) and a high average number of drinks per day (21% and 19%, respectively). Members of both groups also reported high levels of tobacco use. Smoking was 32% and 23%, and smokeless tobacco use (dipping) was 22% and 16%, respectively. Both groups of Marines reported they commonly did not get enough restful sleep (41% and 33%, respectively). More USMCR members (8%) reported driving after drinking too much alcohol than USMC members (4%). Both groups of Marines also reported lack of condom use more frequently compared with Navy members (24% and 20% for USMC and USMCR, respectively). 18
21 19
22 The USCG and USCGR showed similar results (Figures 15 and 16). Members of both groups reported low intake of vegetables (49% for both), low levels of flossing (36% and 30%), high intake of high-fat foods (27% and 26%), and low intake of fruits (25% and 26%). USCG and USCGR members reported slightly lower percentages of smoking (17% and 10%, respectively) than other services. The USCG reported a lower unhealthy number of drinks per day (10%) and a lower percentage of heavy drinking (13%) than the USMC and USN. Like other service members, the USCG frequently reported inadequate sleep (25% and 19%). 20
23 21

24 Distribution of Risk Categories Figure 17 displays risk categories for each service component, based on the number of members falling within each risk category. Each service member was categorized as low, medium, or high risk based on the number of risk categories in which they reported unhealthy behaviors. Members in higher risk categories are considered more likely to utilize healthcare services in the future. Based on mean number of risk factors, USMC members were most often scored as high risk (29.9%), followed by the USMCR (26.7%), USN (24.1%), USNR (13.2%), USCG (11.9%), and USCGR (9.1%). Members of the USCGR most often scored in the low risk category (62.6%). 22
25 Changes in Health Responses Table 1 displays the percentage of respondents who were classified as healthy for both 2013 and the previous study period of July 1, 2011 to June 30, The percent change in the healthy response was calculated and appears in the last column; increases in values indicate healthier behaviors. Overall, most healthy responses remained similar or slightly improved, with the exception of smokeless tobacco use (dipping), which had a 0.1% decrease in healthy responses. Condom use and personal support improved significantly in 2013, with an increase of 8.4% and 8.2% in healthy responses, respectively. 23
26 24

27 Perception of Health Self-perception of one s current state of health has been shown to be fairly accurate. However, perception of current good health may not accurately reflect future health for members who report significant risk factors that are major determinants of health. Of all service members, 95% rated their health in general as either good or excellent (Figure 18), even though the scoring of HRA data shows many members reported risk factors that placed them in medium and high risk categories (Figure 17). 25
28 The differences in perception of health and risk category demonstrated that those who perceived their health to be unhealthy (i.e., self-rating their health as either fair or poor) were more likely to be in the high risk category compared to those who perceived themselves to be healthy. Of the small percentage of respondents who indicated their health was generally unhealthy (5% of respondents), the majority had risk scores that fell into the medium to high risk categories (88%) (Figure 19). 26
 than the other two categories (Figure 20). However, 87% of high risk individuals also perceived their health as good.")
29 The differences in perception of health and risk category were small but consistent, with lower risk groups having a higher perception of good health (98%) than the other two categories (Figure 20). However, 87% of high risk individuals also perceived their health as good. 27
30 Mean Risk by Demographic Variables A risk score for each individual was tabulated based on the total number of risk categories in which one or more behaviors were reported as unhealthy. There were a total of 10 risk categories. Risk scores were grouped into risk levels of low (0-2 risk categories), medium (3-4 risk categories), and high (5 or more risk categories). More males classified as high risk (22%) than females (16%) (Table 2). 28
31 Age was also examined (Table 3). Risk was highest for individuals 20 to 29 years old but then steadily decreased with age. More than 49% of younger members (age 17-29) were in the high risk category. The decreasing percentage of members in the high risk category after the age of 29 may be due to survivor effect or healthy worker effect, indicating that those who remain in the military tend to be healthier than those who leave the service. It may also be that some individuals reduce their risky lifestyle behaviors as they mature. 29
32 The same association between age and percentage of high risk members was demonstrated by comparing rank with risk categories (Table 4). The E1-E5 group, which is generally comprised of younger service members, had a greater percentage of members in the high risk category compared to E6-E9 personnel and the officer ranks. Senior officers (O6-O9) had a lower percentage of members in the high risk category compared to other officers. Warrant officers were generally most likely to be in the high risk category compared to all other officer ranks. 30
33 Race was also examined by risk category (Table 5). No strongly significant difference between race and risk category were noted. This has been the case in previous years reports. 31

34 Days Away From Home Station The relationship between days away from home station and unhealthy behavior response was examined. Using the days away variable, four time points were created: 0 days, 1-29 days, days, and days. In the entire population, 48% of individuals did not spend any time away from the home station, 23% spent 1-29 days away, 21% spent days away, and 8% spent days away from the home station (Figure 21). 32

35 Time away from home station was examined by service component (Figure 22). At least 50% of all USN and USNR members reported 0 days away from home station while 57-60% of all reserve branches reported spending 0 days away from home station. The USCG, USMC, and USN had the highest percentages for total days away with at least 50% of members reporting at least 1 day away from home station. USMC members reported having the greatest percentage of members away from home station for days (10%) while the USNR members only had 7% of individuals away from home station for days. USCG members reported having the lowest percentage of members away from home station less than 30 days (65%). 33

36 Total HRA risk score was examined in relation to the four time points using frequency distribution and logistic regression. The distribution of risk categories, determined by total HRA response risk score, was similar for people classified as a medium risk across all categories. Both the low risk and high risk categories showed a percentage response change over time. The percent of members in the low risk category decreased from 42% at 0 days away to 35% at days away. The percentage of members in the high risk category increased from 19% at 0 days away to 27% at days away (Figure 23). 34
37 Days Away From Home Station and Mean Risk Risk category was compared with the amount of time away from home station. As time away from home station increased, the percentage of members in the high risk category increased. Days Away From Home Station and Risk Score To evaluate the relationship between number of days away from home station and risk score, a logistic regression model was used. A risk score of greater than 2 (medium and high categories) was set as a dependent variable, while days away from home station was used as a predictive variable divided into four groups: 0 days away from home station, 1-29 days away from home station, days away from home station, and days away from home station. The model was found to be significant with the odds ratio (OR) increasing in each of the days away categories when compared to not leaving home station (Figure 24): OR [1-29 days] 1.04 (95% CI ), OR [ days] 1.12 (95% CI ), and OR [ days] 1.32 (95% CI ). 35
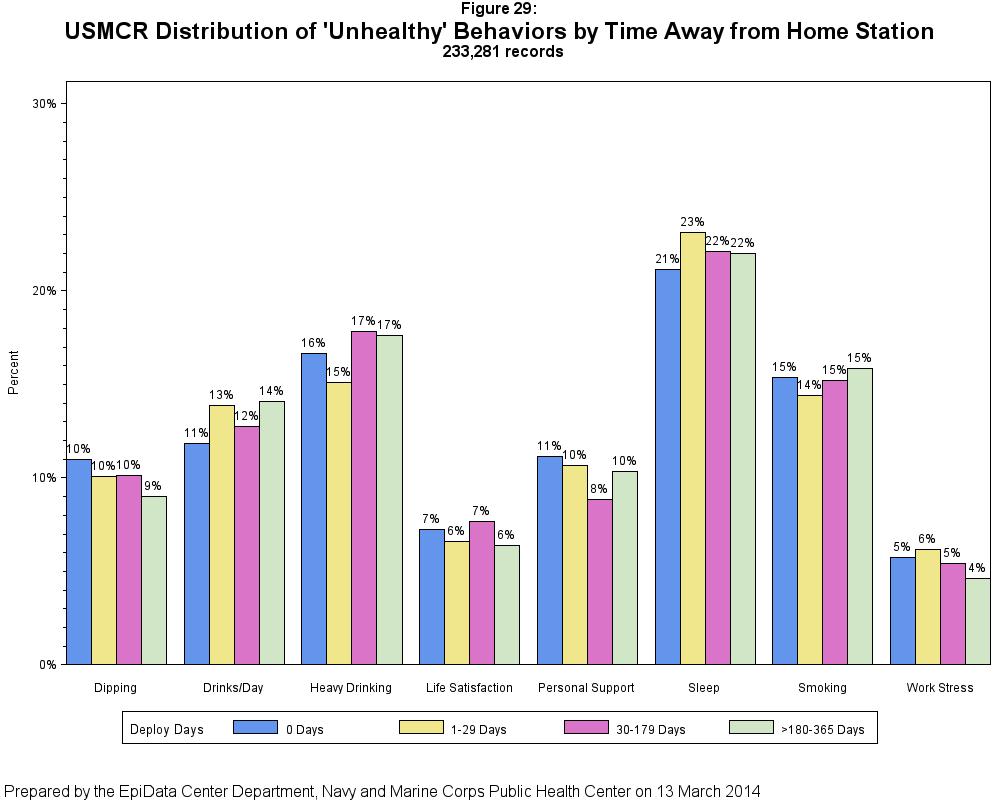
38 Days Away from Home Station and Unhealthy Behaviors Responses to questions about smoking, smokeless tobacco use (dipping), average number of drinks per day, heavy drinking, life satisfaction, work stress, personal support, and sleep were examined over the four time points. The responses to eight different questions addressing these topics were examined to determine any time-related differences in the reporting of unhealthy behaviors. The next seven graphs (Figures 25-31) display the results of unhealthy responses by selfreported time away from home station. Heavy drinking, average numbers of drinks per day, and work stress increased as time away from station increased, for all service components grouped together. However, lack of restful sleep decreased as time away from home station increased. 36
39 Frequency of unhealthy responses increased or stayed relatively stable for all risk factors for USN members as days away from home station increased (Figures 26 and 27), with the exception of sleep and smoking. Compared to USNR members, USN members reported higher average numbers of drinks per day, starting at 9% of all behaviors for those who spent 0 days away and increasing to 11% of all behaviors for those who spent days away. On the other hand, USNR members reported a greater lack of personal support, starting at 17% of all behaviors for those who spent 0 days away and increasing to 18% of all behaviors for those who spent days away. However, USNR members reporting a lack of personal support decreased back to 17% of all behaviors for those who spent > days away. Other behavior changes were relatively similar between the two groups. 37
40 38
41 Compared to Navy and Coast Guard members, Marines tended to report higher unhealthy number of drinks per day and a higher percentage of heavy drinking which generally increased as days away from home station increased (Figures 28 and 29). Frequency of unhealthy responses increased or stayed relatively stable for all risk factors for USN members as days away from home station increased, with the exception of sleep. Percentages between USMC and USMCR differed at most by 3%. 39
42 40
43 Compared to USCGR members, USCG members reported higher levels of work stress, starting at 7% of all behaviors for those who spent 0 days away and increasing to 9% of all behaviors for those who spent days away; USCG members also reported slightly higher levels of smoking than USCGR members. However, USCGR members reported a greater lack of personal support, peaking at 17% for those deployed 1-29 days, as compared to USCG s peak at 11%. Other behavior changes were relatively similar between the two groups (Figures 30 and 31). 41
44 42
45 Discussion Strengths and Limitations One strength of the survey results is that the Fleet and Marine Corps HRA questionnaire does not ask for any personal identifiers, making it more likely that participants will answer honestly about risky behaviors in which they engage. In regards to sampling bias, taking the assessment is merely a matter of commands implementation of the PHA process; thus, these responses would not represent merely a convenience sample. Limitations of this report can be attributed to the limitations of the data collection tool. As a self-reported survey, the results can be biased due to participant recall or by the tendency to report socially desirable responses. As such, some overestimation of positive behaviors and underestimation of negative behaviors may occur. Although there is no reason to suspect that individuals complete the questionnaire multiple times, there is no way to block or detect duplicate entries. It is also difficult to directly compare service components because the demographic characteristics that influence health behavior, as described earlier, such as age and job duties, vary significantly. Demographics The use of the HRA tool grew for some service components for 2013 as compared to 2012: USN (+24,096), USNR (+3833), USMC (+4,278), USCG (+2293), and USCGR (+373). However, the number of USMCR (-121) members who participated in the survey declined compared to last year. When interpreting the results, it is important to use caution if comparing groups that are dissimilar. For example, the Marine Corps is comprised of significantly younger members whose mission and environment may affect the results. It would be expected that younger members would report different types and levels of risk behaviors compared to older members. Similar differences in results could be attributed to gender differences. Although specific risk behaviors were not analyzed in this report by age or gender, the total number of risk behaviors (the risk number category) was examined for both of these variables. Not surprisingly, increasing age was inversely associated with the percentage of individuals who fell into the medium and high risk number category. In addition, female members had a lower mean risk number than males. 43
46 Risk Factors Collection and analysis of body composition was added to the HRA tool at the request of Navy customers. The tool uses BMI, a fairly reliable indicator of body fat for most people that is based on self-reported height and weight values and is an inexpensive and easy-to-perform method of screening for weight categories that may lead to health problems. 1 Military heightweight tables use this approach but are more lenient for establishing official standards. BMI can also overestimate body fat in lean, muscular individuals. Therefore, these data should not necessarily lead to the conclusion that all individuals exceeding healthy levels are either overweight or obese. Rather, the data may support some general observations about weight across the services. For example, these data indicate that, in general, Navy and Coast Guard personnel were more likely than Marines to be classified as overweight, and active duty Navy and Coast Guard personnel are nearly equally as likely to be of normal BMI as reservists. When compared to previous surveys, the prevalence of specific risk factors has remained fairly constant, with the leading health risks being low consumption of fruits and vegetables, high consumption of high-fat foods, lack of dental flossing, and lack of restful sleep. These results should be used to plan health promotion interventions that target priority areas. Although comparing individual service results to the total of all services may be tempting, it may be more appropriate to seek realistic and incremental percentages improvements when setting goals for the future. Days Away From Home The largest number of individuals who completed the HRA did not deploy at all last year (48%). When added to the number of members who were away from home for fewer than 30 days, the total percentage was 71%. USCG members were away from home for more days than members of other service components. As stated earlier, as time away from home station increased, both mean risk and percentage of members in the high risk category increased. Therefore, implementing health promotion activities may be especially important in a population that experiences frequent or long separations. 44
47 Conclusion The Fleet and Marine Corps HRA is a valuable tool for tailoring health messages to individuals. The personalized feedback and referrals to credible health websites provides participants with the knowledge and skills to better manage their personal health. From a more global, population health approach, the aggregate data in this HRA report provides each of the service components with valuable information that can be incorporated into comprehensive community health assessments, which is a first step in planning effective health promotion programs. Local HRA administrators have the ability to generate additional reports that identify risk at the individual unit level. Decision-makers can use the data in this report for strategic planning and the results of this report have a bearing on recruitment, retention, readiness, and quality of military life. 45
48 Appendix A 46
49 47
50 Appendix B CO Report Scoring Grid Health Indicator Health Behavior Unhealthy Rating Health Rating Perception 1. Perception of health c-d a-b Tobacco Use 2. Smoking a-c d-e 3. Smokeless Tobacco a-c d-e Alcohol Use 4. Drinks Per Day a-b c-d 5. Heavy Drinking a-c d-e 6. Drinking and Driving a-c d Injury Prevention 7. Seat Belt b-e a 8. Vehicle Helmets c-e a-b, f 9. Safety Equipment c-e a-b, f Stress Mngt 10. Life Satisfaction c-d a-b 11. Work Stress a-b c-e 12. Personal Support d-f a-c Sexual Health 13. Condom Use d-f a-c 22. Pregnancy Prevention e-g a-d Physical Activity 14. Aerobic Activity c-e a-b 15. Strength Training d-e a-c Nutrition 16. High Fat Foods a-c d-e 17. Fruits d-e a-c Supplements 18. Supplements a-c d-e Dental 19. Flossing c-e a-b Nutrition 20. Vegetables c-e a-b Sleep 21. Sleep c-e a-b BMI - BMI>25-48
51 References 1. Centers for Disease Control and Prevention BMI Web Site. Available at: Accessed March 29, Data Analysis Provided by: Navy and Marine Corps Public Health Center Travis M. Wallace, MPH Occupational-Environmental Epidemiology Division EpiData Center Department WWW NMCPHC MED NAVY MIL/ For comments and inquiries, contact: Mr. Michael R. (Bob) MacDonald, MS, CHES (757)
Fleet and Marine Corps Health Risk Assessment, 02 January December 31, 2015
 Fleet and Marine Corps Health Risk Assessment, 02 January December 31, 2015 Executive Summary The Fleet and Marine Corps Health Risk Appraisal is a 22-question anonymous self-assessment of the most common
Demographic Profile of the Active-Duty Warrant Officer Corps September 2008 Snapshot
 Issue Paper #44 Implementation & Accountability MLDC Research Areas Definition of Diversity Legal Implications Outreach & Recruiting Leadership & Training Branching & Assignments Promotion Retention Implementation
Population Representation in the Military Services
 Population Representation in the Military Services Fiscal Year 2008 Report Summary Prepared by CNA for OUSD (Accession Policy) Population Representation in the Military Services Fiscal Year 2008 Report
PROFILE OF THE MILITARY COMMUNITY
 2004 DEMOGRAPHICS PROFILE OF THE MILITARY COMMUNITY Acknowledgements ACKNOWLEDGEMENTS This report is published by the Office of the Deputy Under Secretary of Defense (Military Community and Family Policy),
The Prior Service Recruiting Pool for National Guard and Reserve Selected Reserve (SelRes) Enlisted Personnel
 Enlisted Personnel") Issue Paper #61 National Guard & Reserve MLDC Research Areas The Prior Service Recruiting Pool for National Guard and Reserve Selected Reserve (SelRes) Enlisted Personnel Definition of Diversity Legal
Issue Paper #61 National Guard & Reserve MLDC Research Areas The Prior Service Recruiting Pool for National Guard and Reserve Selected Reserve (SelRes) Enlisted Personnel Definition of Diversity Legal
Demographic Profile of the Officer, Enlisted, and Warrant Officer Populations of the National Guard September 2008 Snapshot
 Issue Paper #55 National Guard & Reserve MLDC Research Areas Definition of Diversity Legal Implications Outreach & Recruiting Leadership & Training Branching & Assignments Promotion Retention Implementation
2013 Workplace and Equal Opportunity Survey of Active Duty Members. Nonresponse Bias Analysis Report
 2013 Workplace and Equal Opportunity Survey of Active Duty Members Nonresponse Bias Analysis Report Additional copies of this report may be obtained from: Defense Technical Information Center ATTN: DTIC-BRR
Suicide Among Veterans and Other Americans Office of Suicide Prevention
 Suicide Among Veterans and Other Americans 21 214 Office of Suicide Prevention 3 August 216 Contents I. Introduction... 3 II. Executive Summary... 4 III. Background... 5 IV. Methodology... 5 V. Results
Appendix A Registered Nurse Nonresponse Analyses and Sample Weighting
 Appendix A Registered Nurse Nonresponse Analyses and Sample Weighting A formal nonresponse bias analysis was conducted following the close of the survey. Although response rates are a valuable indicator
Basic Concepts of Data Analysis for Community Health Assessment Module 5: Data Available to Public Health Professionals
 Basic Concepts of Data Analysis for Community Assessment Module 5: Data Available to Public Professionals Data Available to Public Professionals in Washington State Welcome to Data Available to Public
Reenlistment Rates Across the Services by Gender and Race/Ethnicity
 Issue Paper #31 Retention Reenlistment Rates Across the Services by Gender and Race/Ethnicity MLDC Research Areas Definition of Diversity Legal Implications Outreach & Recruiting Leadership & Training
Research Brief IUPUI Staff Survey. June 2000 Indiana University-Purdue University Indianapolis Vol. 7, No. 1
 Research Brief 1999 IUPUI Staff Survey June 2000 Indiana University-Purdue University Indianapolis Vol. 7, No. 1 Introduction This edition of Research Brief summarizes the results of the second IUPUI Staff
Navy and Marine Corps Public Health Center 620 John Paul Jones Circle, Suite 1100 Portsmouth VA 23708
 Navy and Marine Corps Public Health Center 620 John Paul Jones Circle, Suite 1100 Portsmouth VA 23708 2013 Blue H Navy Surgeon General s Health Promotion and Wellness Award Instructions 1. Background Information.
Patterns of Reserve Officer Attrition Since September 11, 2001
 CAB D0012851.A2/Final October 2005 Patterns of Reserve Officer Attrition Since September 11, 2001 Michelle A. Dolfini-Reed Ann D. Parcell Benjamin C. Horne 4825 Mark Center Drive Alexandria, Virginia 22311-1850
Department of Defense Health Related Behaviors Survey of Active Duty Military Personnel
 2011 Department of Defense Health Related Behaviors Survey of Active Duty Military Personnel February 2013 Sponsored by the Department of Defense, TRICARE Management Activity, Defense Health Cost Assessment
National Patient Safety Foundation at the AMA
 National Patient Safety Foundation at the AMA National Patient Safety Foundation at the AMA Public Opinion of Patient Safety Issues Research Findings Prepared for: National Patient Safety Foundation at
Effects of Overweight and Obesity on Recruitment in the Military
 Effects of Overweight and Obesity on Recruitment in the Military Tracey J. Smith, PhD, RD Military Nutrition Division U.S. Army Research Institute of Environmental Medicine Roundtable on Obesity Solutions
Officer Retention Rates Across the Services by Gender and Race/Ethnicity
 Issue Paper #24 Retention Officer Retention Rates Across the Services by Gender and Race/Ethnicity MLDC Research Areas Definition of Diversity Legal Implications Outreach & Recruiting Leadership & Training
Community Health Needs Assessment 2016
 Community Health Needs Assessment 2016 OSF ST. FRANCIS HOSPITAL & MEDICAL GROUP DELTA COUNTY CHNA 2016 Delta County 2 TABLE OF CONTENTS Executive Summary... 3 Introduction... 5 Methods... 6 Chapter 1.
Emerging Issues in USMC Recruiting: Assessing the Success of Cat. IV Recruits in the Marine Corps
 CAB D0014741.A1/Final August 2006 Emerging Issues in USMC Recruiting: Assessing the Success of Cat. IV Recruits in the Marine Corps Dana L. Brookshire Anita U. Hattiangadi Catherine M. Hiatt 4825 Mark
METHODOLOGY FOR INDICATOR SELECTION AND EVALUATION
 CHAPTER VIII METHODOLOGY FOR INDICATOR SELECTION AND EVALUATION The Report Card is designed to present an accurate, broad assessment of women s health and the challenges that the country must meet to improve
Supplementary Online Content
 Supplementary Online Content Ursano RJ, Kessler RC, Naifeh JA, et al; Army Study to Assess Risk and Resilience in Servicemembers (STARRS). Risk of suicide attempt among soldiers in army units with a history
Summary of Findings. Data Memo. John B. Horrigan, Associate Director for Research Aaron Smith, Research Specialist
 Data Memo BY: John B. Horrigan, Associate Director for Research Aaron Smith, Research Specialist RE: HOME BROADBAND ADOPTION 2007 June 2007 Summary of Findings 47% of all adult Americans have a broadband
AUGUST 2005 STATUS OF FORCES SURVEY OF ACTIVE-DUTY MEMBERS: TABULATIONS OF RESPONSES
 AUGUST 2005 STATUS OF FORCES SURVEY OF ACTIVE-DUTY MEMBERS: TABULATIONS OF RESPONSES Introduction to the Survey The Human Resources Strategic Assessment Program (HRSAP), Defense Manpower Data Center (DMDC),
GAO. DEFENSE BUDGET Trends in Reserve Components Military Personnel Compensation Accounts for
 GAO United States General Accounting Office Report to the Chairman, Subcommittee on National Security, Committee on Appropriations, House of Representatives September 1996 DEFENSE BUDGET Trends in Reserve
Oklahoma Health Care Authority. ECHO Adult Behavioral Health Survey For SoonerCare Choice
 Oklahoma Health Care Authority ECHO Adult Behavioral Health Survey For SoonerCare Choice Executive Summary and Technical Specifications Report for Report Submitted June 2009 Submitted by: APS Healthcare
The Marine Corps. Demographics Update
 The Marine Corps Demographics Update As of December 2016 Table of Contents Snapshot 02 Marine and Family 03 Age 15 Service Trends 17 Separations Gender/Ethnicity/Education Total Ready Reserve Selected
BARNES-JEWISH HOSPITAL 2016 COMMUNITY HEALTH NEEDS ASSESSMENT & IMPLEMENTATION PLAN
 BARNES-JEWISH HOSPITAL 2016 COMMUNITY HEALTH NEEDS ASSESSMENT & IMPLEMENTATION PLAN 1 TABLE OF CONTENTS Executive Summary... 3 Community Description... 4 Geography... 4 Population Trends... 5 Income...
The Marine Corps A Young and Vigorous Force
 The Marine Corps A Young and Vigorous Force Demographics Update Dec 2011 June 200 Demographics Update Dec 2011 Table of Contents MARINE AND FAMILY MEMBER SNAPSHOT 2 ACTIVE DUTY MARINE AND FAMILY STATUS
C.O.R.E. MISSION STATEMENT
 C.O.R.E. MISSION STATEMENT Comprehensive Opiate Recovery Experience RECOVERY WITH RESPECT Improving the lives of individuals through comprehensive opiate replacement services C.O.R.E. MEDICAL CLINIC IS
ONTARIO COUNTY HEALTH PROFILE. Finger Lakes Health Systems Agency, 2017
 ONTARIO COUNTY HEALTH PROFILE Finger Lakes Health Systems Agency, 2017 About the Report The purpose of this report is to provide a summary of health data specific to Ontario County. Where possible, benchmarks
King County City Health Profile Seattle
 King County City Health Profile Seattle Shoreline Kenmore/LFP Bothell/Woodinville NW Seattle North Seattle Kirkland North Ballard Fremont/Greenlake NE Seattle Kirkland Redmond QA/Magnolia Capitol Hill/E.lake
Licensed Nurses in Florida: Trends and Longitudinal Analysis
 Licensed Nurses in Florida: 2007-2009 Trends and Longitudinal Analysis March 2009 Addressing Nurse Workforce Issues for the Health of Florida www.flcenterfornursing.org March 2009 2007-2009 Licensure Trends
National Health Promotion in Hospitals Audit
 National Health Promotion in Hospitals Audit Acute & Specialist Trusts Final Report 2012 www.nhphaudit.org This report was compiled and written by: Mr Steven Knuckey, NHPHA Lead Ms Katherine Lewis, NHPHA
Palomar College ADN Model Prerequisite Validation Study. Summary. Prepared by the Office of Institutional Research & Planning August 2005
 Palomar College ADN Model Prerequisite Validation Study Summary Prepared by the Office of Institutional Research & Planning August 2005 During summer 2004, Dr. Judith Eckhart, Department Chair for the
Community Health Needs Assessment 2016
 Community Health Needs Assessment 2016 SAINT JAMES HOSPITAL known as OSF SAINT JAMES - JOHN W. ALBRECHT MEDICAL CENTER LIVINGSTON COUNTY CHNA 2016 Livingston County 2 TABLE OF CONTENTS Executive Summary...
MONROE COUNTY HEALTH PROFILE. Finger Lakes Health Systems Agency, 2017
 MONROE COUNTY HEALTH PROFILE Finger Lakes Health Systems Agency, 2017 About the Report The purpose of this report is to provide a summary of health data specific to Monroe County. Where possible, benchmarks
Within both PCTs, smokers were referred directly to the local stop smoking service at the time of the health check.
 Improving Healthy Lifestyles Pilot Site Evaluation Report Key findings The health check is a good opportunity to deliver brief lifestyle behaviour advice to patients, most of which is recalled three months
Issue Brief From The University of Memphis Methodist Le Bonheur Center for Healthcare Economics
 Issue Brief From The University of Memphis Methodist Le Bonheur Center for Healthcare Economics August 4, 2011 Non-Urgent ED Use in Tennessee, 2008 Cyril F. Chang, Rebecca A. Pope and Gregory G. Lubiani,
NC Division of Mental Health, Developmental Disabilities, and Substance Abuse Services (DMH/DD/SAS)
") NC Division of Mental Health, Developmental Disabilities, and Substance Abuse Services (DMH/DD/SAS) Perception of Care Survey of Alliance Consumers Fiscal Year 2014 Background Information The Division
NC Division of Mental Health, Developmental Disabilities, and Substance Abuse Services (DMH/DD/SAS) Perception of Care Survey of Alliance Consumers Fiscal Year 2014 Background Information The Division
Community Health Needs Assessment for Corning Hospital: Schuyler, NY and Steuben, NY:
 Community Health Needs Assessment for Corning Hospital: Schuyler, NY and Steuben, NY: November 2012 Approved February 20, 2013 One Guthrie Square Sayre, PA 18840 www.guthrie.org Page 1 of 18 Table of Contents
Throughout the 20th century, Americans experienced. Health-Related Services Provided by Public Health Educators
 Health-Related Services Provided by Public Health Educators Hans H. Johnson, EdD 1 Craig M. Becker, PhD 1 This study identifies the health-related services provided by public health educators. The investigators,
2015 DUPLIN COUNTY SOTCH REPORT
 2015 DUPLIN COUNTY SOTCH REPORT Reported March 2016 State of the County Health Report The State of the County Health Report provides a review of the current county health statistics and compares them to
STEUBEN COUNTY HEALTH PROFILE. Finger Lakes Health Systems Agency, 2017
 STEUBEN COUNTY HEALTH PROFILE Finger Lakes Health Systems Agency, 2017 About the Report The purpose of this report is to provide a summary of health data specific to Steuben County. Where possible, benchmarks
Assessing the Effects of Individual Augmentation on Navy Retention
 Assessing the Effects of Individual Augmentation on Navy Retention Ron Fricker & Sam Buttrey Eighth Annual Navy Workforce Research and Analysis Conference May 7, 2008 What is Individual Augmentation? Individual
The Centers for Medicare & Medicaid Services (CMS) strives to make information available to all. Nevertheless, portions of our files including
 strives to make information available to all. Nevertheless, portions of our files including") The Centers for Medicare & Medicaid Services (CMS) strives to make information available to all. Nevertheless, portions of our files including charts, tables, and graphics may be difficult to read using
The Centers for Medicare & Medicaid Services (CMS) strives to make information available to all. Nevertheless, portions of our files including charts, tables, and graphics may be difficult to read using
CHEMUNG COUNTY HEALTH PROFILE. Finger Lakes Health Systems Agency, 2017
 CHEMUNG COUNTY HEALTH PROFILE Finger Lakes Health Systems Agency, 2017 About the Report The purpose of this report is to provide a summary of health data specific to Chemung County. Where possible, benchmarks
Youth Attitude Tracking Study
 DMDC Report No. 2000-019 July 2000 Youth Attitude Tracking Study 1999 and Advertising Report For additional copies of this report, contact: Defense Technical Information Center ATTN: DTIC-BRR Defense Document
The Impact of Entrepreneurship Database Program
 The Impact of Entrepreneurship Database Program 2014 Year-End Data Summary (Released February, 2015) Peter W. Roberts, Sean Peters & Justin Koushyar (Social Enterprise @ Goizueta) in collaboration with
Union County Community Health Needs Assessment
 Community Health Needs Assessment November 2007 This page is intentionally left blank Community Health Needs Assessment November 2007 Health Department Needs Assessment Committee Winifred M. Holland, MPH,
MARINE AND FAMILY MEMBER SNAPSHOT 3 ACTIVE DUTY MARINE AND FAMILY STATUS 4 AGE 11 SERVICE TRENDS 12 SEPARATIONS 15 GENDER/ETHNICITY/EDUCATION 17
 1 Table of Contents MARINE AND FAMILY MEMBER SNAPSHOT 3 ACTIVE DUTY MARINE AND FAMILY STATUS 4 AGE 11 SERVICE TRENDS 12 SEPARATIONS 15 GENDER/ETHNICITY/EDUCATION 17 MARINE CORPS RESERVE DEMOGRAPHICS 19
Valley Metro TDM Survey Results Spring for
 Valley Metro TDM Survey Results 2017 Spring 2017 for P a g e ii Table of Contents Section: Page #: Executive Summary... iv Conclusions... viii I. Introduction... 1 A. Background and Methodology... 1 B.
BACK, NECK, AND SHOULDER PAIN IN HOME HEALTH CARE WORKERS
 BACK, NECK, AND SHOULDER PAIN IN HOME HEALTH CARE WORKERS Eric M. Wood, University of Utah Kurt T. Hegmann, University of Utah Arun Garg, University of Wisconsin-Milwaukee Stephen C. Alder, University
Satisfaction and Experience with Health Care Services: A Survey of Albertans December 2010
 Satisfaction and Experience with Health Care Services: A Survey of Albertans 2010 December 2010 Table of Contents 1.0 Executive Summary...1 1.1 Quality of Health Care Services... 2 1.2 Access to Health
Population Representation in the Military Services: Fiscal Year 2013 Summary Report
 Population Representation in the Military Services: Fiscal Year 2013 Summary Report 1 Introduction This is the 40 th annual Department of Defense (DOD) report describing characteristics of U.S. military
APNA 28th Annual Conference Session 2034: October 23, 2014
 Mary Ann Boyd, PhD, DNS, PMHCNS BC Wanda Bradshaw, RN BC, MSN Marceline Robinson, MSN, PMHCNS BC American Psychiatric Nurses Association Annual Meeting October 23, 2014 Indianapolis, IN Describe the military
NATIONAL GUARD BUREAU 111 SOUTH GEORGE MASON DRIVE ARLINGTON VA Refer to GC Conference Slides at bottom. ARNG-HRR 18 December 2015
 NATIONAL GUARD BUREAU 111 SOUTH GEORGE MASON DRIVE ARLINGTON VA 22204-1382 Refer to GC Conference Slides at bottom ARNG-HRR 18 December 2015 MEMORANDUM FOR NG J1 RRF (All-Entire RRF) SUBJECT: SMOM 16-008,
Differences in Male and Female Predictors of Success in the Marine Corps: A Literature Review
 Differences in Male and Female Predictors of Success in the Marine Corps: A Literature Review Shannon Desrosiers and Elizabeth Bradley February 2015 Distribution Unlimited This document contains the best
Analysis of VA Health Care Utilization among Operation Enduring Freedom (OEF), Operation Iraqi Freedom (OIF), and Operation New Dawn (OND) Veterans
, Operation Iraqi Freedom (OIF), and Operation New Dawn (OND) Veterans") Analysis of VA Health Care Utilization among Operation Enduring Freedom (OEF), Operation Iraqi Freedom (OIF), and Operation New Dawn (OND) Veterans Cumulative from 1 st Qtr FY 2002 through 1 st Qtr FY
Analysis of VA Health Care Utilization among Operation Enduring Freedom (OEF), Operation Iraqi Freedom (OIF), and Operation New Dawn (OND) Veterans Cumulative from 1 st Qtr FY 2002 through 1 st Qtr FY
Frequently Asked Questions 2012 Workplace and Gender Relations Survey of Active Duty Members Defense Manpower Data Center (DMDC)
") Frequently Asked Questions 2012 Workplace and Gender Relations Survey of Active Duty Members Defense Manpower Data Center (DMDC) The Defense Manpower Data Center (DMDC) Human Resources Strategic Assessment
Frequently Asked Questions 2012 Workplace and Gender Relations Survey of Active Duty Members Defense Manpower Data Center (DMDC) The Defense Manpower Data Center (DMDC) Human Resources Strategic Assessment
Patient survey report Outpatient Department Survey 2009 Airedale NHS Trust
 Patient survey report 2009 Outpatient Department Survey 2009 The national Outpatient Department Survey 2009 was designed, developed and co-ordinated by the Acute Surveys Co-ordination Centre for the NHS
Obesity and corporate America: one Wisconsin employer s innovative approach
 Focus On... Obesity Obesity and corporate America: one Wisconsin employer s innovative approach Amy Helwig, MD, MS; Dennis Schultz, MD, MSPH; Len Quadracci, MD Introduction The United States has an obesity
LIVINGSTON COUNTY HEALTH PROFILE. Finger Lakes Health Systems Agency, 2017
 LIVINGSTON COUNTY HEALTH PROFILE Finger Lakes Health Systems Agency, 2017 About the Report The purpose of this report is to provide a summary of health data specific to Livingston County. Where possible,
Impact of Scholarships
 Impact of Scholarships Fall 2016 Office of Institutional Effectiveness and Analytics December 13, 2016 Impact of Scholarships Office of Institutional Effectiveness and Analytics Executive Summary Scholarships
Patient survey report Survey of people who use community mental health services 2011 Pennine Care NHS Foundation Trust
 Patient survey report 2011 Survey of people who use community mental health services 2011 The national Survey of people who use community mental health services 2011 was designed, developed and co-ordinated
Topic 3. for the healthy lifestyle: noncommunicable diseases (NCDs) prevention and control module. Topic 3 - Community toolkit.
 prevention and control module. Topic 3 - Community toolkit.") 213mm Topic 3 Community toolkit for the healthy lifestyle: noncommunicable diseases (NCDs) prevention and control module In partnership with: International Federation of Pharmaceutical Manufacturers &
213mm Topic 3 Community toolkit for the healthy lifestyle: noncommunicable diseases (NCDs) prevention and control module In partnership with: International Federation of Pharmaceutical Manufacturers &
Wake Forest Baptist Health Lexington Medical Center. CHNA Implementation Strategy
 Wake Forest Baptist Health Lexington Medical Center CHNA Implementation Strategy Background Wake Forest Baptist Health - Lexington Medical Center (LMC) is committed to understanding, anticipating, assessing,
NUTRITION SCREENING SURVEYS IN HOSPITALS IN NORTHERN IRELAND,
 NUTRITION SCREENING SURVEYS IN HOSPITALS IN NORTHERN IRELAND, 2007-2011 A report based on the amalgamated data from the four Nutrition Screening Week surveys undertaken by BAPEN in 2007, 2008, 2010 and
Admissions and Readmissions Related to Adverse Events, NMCPHC-EDC-TR
 Admissions and Readmissions Related to Adverse Events, 2007-2014 By Michael J. Hughes and Uzo Chukwuma December 2015 Approved for public release. Distribution is unlimited. The views expressed in this
WELLNESS INTEREST SURVEY RESULTS Skidmore College
 WELLNESS INTEREST SURVEY RESULTS Skidmore College March 22, 2016 2016 MVP Health Care, Inc. DEMOGRAPHICS 474 surveys collected GENDER AGE Prefer not to disclose 7 1% No Answer 54 11% Male 112 24% 60 or
COMMUNITY HEALTH NEEDS ASSESSMENT HINDS, RANKIN, MADISON COUNTIES STATE OF MISSISSIPPI
 COMMUNITY HEALTH NEEDS ASSESSMENT HINDS, RANKIN, MADISON COUNTIES STATE OF MISSISSIPPI Sample CHNA. This document is intended to be used as a reference only. Some information and data has been altered
Avoidable Hospitalisation
 Avoidable Hospitalisation Introduction Avoidable hospitalisation is used to measure the occurrence of a severe illness that theoretically could have been avoided by either; Ambulatory sensitive hospitalisation
South Carolina Nursing Education Programs August, 2015 July 2016
 South Carolina Nursing Education Programs August, 2015 July 2016 Acknowledgments This document was produced by the South Carolina Office for Healthcare Workforce in the South Carolina Area Health Education
Scottish Hospital Standardised Mortality Ratio (HSMR)
") ` 2016 Scottish Hospital Standardised Mortality Ratio (HSMR) Methodology & Specification Document Page 1 of 14 Document Control Version 0.1 Date Issued July 2016 Author(s) Quality Indicators Team Comments
` 2016 Scottish Hospital Standardised Mortality Ratio (HSMR) Methodology & Specification Document Page 1 of 14 Document Control Version 0.1 Date Issued July 2016 Author(s) Quality Indicators Team Comments
DEPARTMENT OF THE NAVY BUREAU OF MEDICINE AND SURGERY 7700 ARLINGTON BOULEVARD FALLS CHURCH VA 22042
 DEPARTMENT OF THE NAVY BUREAU OF MEDICINE AND SURGERY 7700 ARLINGTON BOULEVARD FALLS CHURCH VA 22042 IN REPLY REFER TO BUMEDINST 6110.13B BUMED-M37 BUMED INSTRUCTION 6110.13B From: Chief, Bureau of Medicine
Colorado Community College System ACADEMIC YEAR NEED-BASED FINANCIAL AID APPLICANT DEMOGRAPHICS BASED ON 9 MONTH EFC
 Colorado Community College System ACADEMIC YEAR 2010-2011 NEED-BASED FINANCIAL AID APPLICANT DEMOGRAPHICS BASED ON 9 MONTH EFC SEPTEMBER 2013 1 2010-2011 Aid Recipients and Applicants For the academic
Authors alone are responsible for opinions expressed in the contribution and for its clearance through their federal health agency, if required.
 ORIGINAL ARTICLES Authors alone are responsible for opinions expressed in the contribution and for its clearance through their federal health agency, if required. MILITARY MEDICINE, 180, 5:513, 2015 A
Nevada County Health and Human Services FY14 Rural Health Care Services Outreach Grant Project Evaluation Report June 30, 2015
 Nevada County Health and Human Services FY14 Rural Health Care Services Outreach Grant Project Evaluation Report June 30, 2015 I. Executive Summary The vision of Nevada County Behavioral Health (NCBH)
June 25, Shamis Mohamoud, David Idala, Parker James, Laura Humber. AcademyHealth Annual Research Meeting
 Evaluation of the Maryland Health Home Program for Medicaid Enrollees with Severe Mental Illnesses or Opioid Substance Use Disorder and Risk of Additional Chronic Conditions June 25, 2018 Shamis Mohamoud,
A comparison of two measures of hospital foodservice satisfaction
 Australian Health Review [Vol 26 No 1] 2003 A comparison of two measures of hospital foodservice satisfaction OLIVIA WRIGHT, SANDRA CAPRA AND JUDITH ALIAKBARI Olivia Wright is a PhD Scholar in Nutrition
STEUBEN COUNTY HEALTH PROFILE
 STEUBEN COUNTY HEALTH PROFILE 2017 ABOUT THE REPORT The purpose of this report is to provide a summary of health data specific to Steuben County. Where possible, benchmarks have been given to compare county
Measuring the relationship between ICT use and income inequality in Chile
 Measuring the relationship between ICT use and income inequality in Chile By Carolina Flores c.a.flores@mail.utexas.edu University of Texas Inequality Project Working Paper 26 October 26, 2003. Abstract:
Statistical Analysis of the EPIRARE Survey on Registries Data Elements
 Deliverable D9.2 Statistical Analysis of the EPIRARE Survey on Registries Data Elements Michele Santoro, Michele Lipucci, Fabrizio Bianchi CONTENTS Overview of the documents produced by EPIRARE... 3 Disclaimer...
Interagency Council on Intermediate Sanctions
 Interagency Council on Intermediate Sanctions October 2011 Timothy Wong, ICIS Research Analyst Maria Sadaya, Judiciary Research Aide Hawaii State Validation Report on the Domestic Violence Screening Instrument
Implementation Strategy For the 2016 Community Health Needs Assessment North Texas Zone 2
 For the 2016 Community Health Needs Assessment North Texas Zone 2 Baylor Emergency Medical Center at Murphy Baylor Emergency Medical Center at Aubrey Baylor Emergency Medical Center at Colleyville Baylor
2005 Workplace and Equal Opportunity Survey of Active-Duty Members
 2005 Workplace and Equal Opportunity Survey of Active-Duty Members . Additional copies of this report may be obtained from: Defense Technical Information Center ATTN: DTIC-BRR 8725 John J. Kingman Rd.,
Population Representation in the Military Services: Fiscal Year 2011 Summary Report
 Population Representation in the Military Services: Fiscal Year 2011 Summary Report 1 Introduction This is the 39 th annual Department of Defense (DoD) report describing characteristics of U.S. military
New Facts and Figures on Hospice Care in America
 New Facts and Figures on Hospice Care in America NHPCO has just released the 2010 edition of NHPCO Facts and Figures: Hospice Care in America. Through an easy-to-read narrative that is written for the
Cardiovascular Disease Prevention and Control: Interventions Engaging Community Health Workers
 Cardiovascular Disease Prevention and Control: Interventions Engaging Community Health Workers Community Preventive Services Task Force Finding and Rationale Statement Ratified March 2015 Table of Contents
2005 Survey of Licensed Registered Nurses in Nevada
 2005 Survey of Licensed Registered Nurses in Nevada Prepared by: John Packham, PhD University of Nevada School of Medicine Tabor Griswold, MS University of Nevada School of Medicine Jake Burkey, MS Washington
Evaluation Of Yale New Haven Health System Employee Wellness Program
 Yale University EliScholar A Digital Platform for Scholarly Publishing at Yale Public Health Theses School of Public Health January 2015 Evaluation Of Yale New Haven Health System Employee Wellness Program
Please answer each question completely and return to NOHN as soon as possible. Once we have received your completed
 Thank you for participating in your Medicare Annual Wellness Visit with North Olympic Healthcare Network as recommended by your primary care provider. Your provider understands that as we age our preventive
Maternal and Child Health North Carolina Division of Public Health, Women's and Children's Health Section
 Maternal and Child Health North Carolina Division of Public Health, Women's and Children's Health Section Raleigh, North Carolina Assignment Description The WCHS is one of seven sections/centers that compose
Addressing Cost Barriers to Medications: A Survey of Patients Requesting Financial Assistance
 http://www.ajmc.com/journals/issue/2014/2014 vol20 n12/addressing cost barriers to medications asurvey of patients requesting financial assistance Addressing Cost Barriers to Medications: A Survey of Patients
ECONOMIC IMPACT OF SMALL BUSINESS DEVELOPMENT CENTER COUNSELING ACTIVITIES IN THE UNITED STATES:
 ECONOMIC IMPACT OF SMALL BUSINESS DEVELOPMENT CENTER COUNSELING ACTIVITIES IN THE UNITED STATES: 2015-2016 James J. Chrisman, Ph.D. 197 Edinburgh Drive Starkville, MS 39759 tel. 662-615-4373 jimkaren@bellsouth.net
from March 2003 to December 2011,
 Medical Evacuations from Operation Iraqi Freedom/Operation New Dawn, Active and Reserve Components, U.S. Armed Forces, 23-211 From January 23 to December 211, over 5, service members were medically evacuated
Determining Patterns of Reserve Attrition Since September 11, 2001
 CAB D0011483.A2/Final June 2005 Determining Patterns of Reserve Attrition Since September 11, 2001 Michelle A. Dolfini-Reed Ann D. Parcell Dave Gregory Benjamin C. Horne 4825 Mark Center Drive Alexandria,
Access to Health Care Services in Canada, 2003
 Access to Health Care Services in Canada, 2003 by Claudia Sanmartin, François Gendron, Jean-Marie Berthelot and Kellie Murphy Health Analysis and Measurement Group Statistics Canada Statistics Canada Health
EPSRC Care Life Cycle, Social Sciences, University of Southampton, SO17 1BJ, UK b
 Characteristics of and living arrangements amongst informal carers in England and Wales at the 2011 and 2001 Censuses: stability, change and transition James Robards a*, Maria Evandrou abc, Jane Falkingham
What Job Seekers Want:
 Indeed Hiring Lab I March 2014 What Job Seekers Want: Occupation Satisfaction & Desirability Report While labor market analysis typically reports actual job movements, rarely does it directly anticipate