1.6 Provide evidence of data-driven decision-making regarding budget formation, implementation, monitoring, and evaluation.
|
|
|
- Augustine Simmons
- 6 years ago
- Views:
Transcription
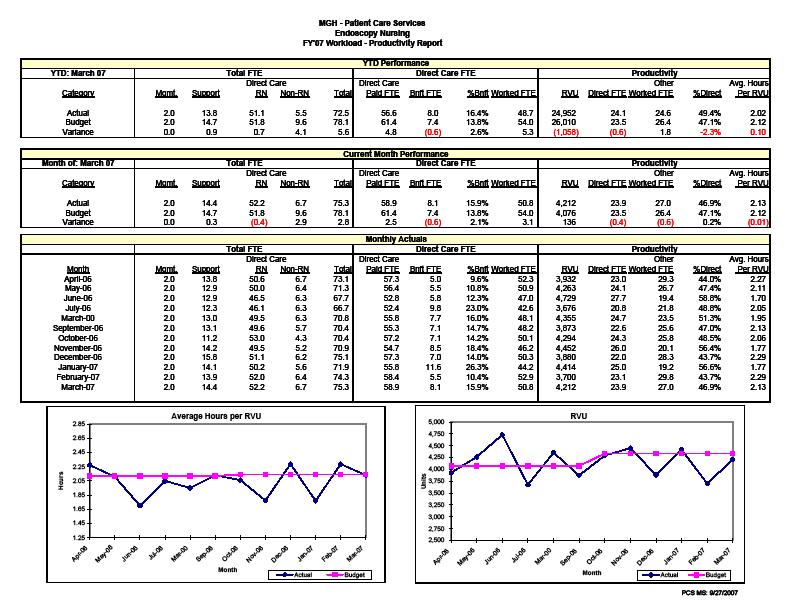
1 1.6 Provide evidence of data-driven decision-making regarding budget formation, implementation, monitoring, and evaluation. The framework for the budgeting process is the relationship between the services or products provided and the resources needed to provide them. Identification, measurement and projection of volume with associated revenue and resources with associated expense quantifies the plan for the organization, department and unit. Formation The formal budgeting process begins with the identification of the budget assumptions and operational goals for the coming fiscal year. Historical and current data are key to the projection of volume statistics. The organization uses operational and fiscal data sources (e.g., admissions and discharges, length of stay, discharge diagnoses, etc.) to identify trends and patterns in volume of services (attachment 1.6.a). Together with information about internal and external factors affecting the organization, these data are used to forecast overall volume. At the inpatient unit level, these volume projections are converted to a projected average daily census based on the comparison of the projected days by clinical service to the current unit distribution of patient days (derived from census reports). In converting this to nursing workload, the Nursing Directors and Associate Chief Nurses review data on current performance and trends in patient acuity from the QuadraMed AcuityPlus Productivity, Benchmarking and Outcomes System (the AcuityPlus System). A sample acuity trend graph used during the FY 2008 budget planning process is included as attachment 1.6.b. These data, together with information related to any anticipated changes that would affect budget predictions, such as new or developing programs, are used to project patient acuity and calculated nursing workload. Data from the AcuityPlus System are also used on an ongoing basis to measure productivity, relating direct care staff utilization to workload and resulting in a ratio of hours per workload index (HPWI). The productivity data are also used in the budget planning process to project staffing requirements (attachment 1.6.c). In other clinical departments, such as the Operating Room, Labor and Delivery, IV Therapy and the Endoscopy Unit, workload measurement programs have been developed internally. They measure procedural workload, metrics derived from volume adjusted for time and intensity of resource need. Regularly generated reports provide data related to both activity and productivity. The data are available for specific time periods and cumulatively for trending and forecasting 70
2 (attachment 1.6.d). In all areas, data are also available for variables such as staff mix and benefit time utilization. In addition to using internally generated data, there are situations in which data analysis provided by external consulting groups can be incorporated into the formation of the budget. For example, the Obstetric service retained an external consultant to look at patient flow and utilization of space and resources in the Obstetric areas to identify opportunities for increasing efficiency. Analysis of the data in the Labor/Delivery /Recovery (LDR) suite indicated potential benefits from the introduction of an obstetric scrub technician role. The unit piloted this role and determined that it had a positive impact on the management of unit activity. In the FY 2008 budget planning process, the RN mix was adjusted to reflect the new model that included scrub technicians (attachment 1.6.e). Implementation The finalized operational budget becomes the blueprint for implementation of the plans for the new fiscal year. For the most recent number of years, increases in nursing workload have led to increases in authorized full time equivalents (FTEs) and changes in direct care staffing mix or in level and type of support staff. One of the first issues in implementation, therefore, is recruiting and hiring into newly approved positions while continuing to fill positions vacated through normal turnover. To assist managers in position management, the department produces a monthly report comparing budgeted FTEs to FTEs on staff in the major personnel categories (Staff Nurse, non-rn direct care, clerical and environmental). The report details by unit the budgeted FTEs in each category, FTEs currently on staff (filled positions), vacancies, staff hired but not yet started and staff with identified future termination dates. A sample portion of the report for staff nurses is included as attachment 1.6.f. Generation of this report at the beginning of each month gives the Nursing Directors an opportunity to review their positions, determine priorities for recruitment and provide the Human Resource staff with information about their staffing needs. Implementation of the staffing plan includes both periodic scheduling and daily staffing. Staffing schedules are developed and produced in four-week cycles, tailored to the needs of the individual unit s patients and staff. Unit staff participate in the scheduling process according to established guidelines and under the direction of the Nursing Director. The core schedule is based on overall budget projections adjusted for predictable variations in workload, for example, weekday to weekend differences or seasonal fluctuations, as identified through analysis of trended unit- 71
3 specific data. Day-to-day and shift-to-shift staffing decisions are made by the Nursing Director, Resource Nurse or Staff Nurse delegate. Workload data from the classification system are available in real time (attachment 1.6.g) and are considered together with other information, such as projected patient turnover, staff skill and experience levels. Budget implementation also requires adjustments to the original plan as new or changing issues are identified. For example, on the vascular unit the night staff identified changing care needs related to increased patient acuity, numbers of admissions and later transfers from the postanesthesia recovery area. The Nursing Director reviewed the volume and patterns of admissions, transfers and sheath removals and concluded that additional staff nurse coverage was required on the night shift. In the nonsalary sector, Staff Nurses in the PICU identified an issue with the probes on oxygen saturation monitoring. The Departments of Nursing and Biomedical Engineering worked together with the vendor to identify issues for all areas using the product, and tested a variety of sensors and monitors. A trial was conducted on one step-down and three critical care units. Survey data from 161 nursing staff respondents were compiled and used as the basis for final product selection. Monitoring and Evaluation The department and the organization produce a variety of reports that monitor actual experience against budget. In addition to real-time data on capacity and workload, leadership and staff have access to data reports on operational, clinical, staff and fiscal parameters that are generated on appropriate schedules (daily, weekly, monthly, quarterly or annually) (attachment 1.6.h). As specific reports become available, they are placed on a common on-line network file location and the designated leadership are notified via with a hyperlink to the report (attachment 1.6.i). Because of the number of reports and the volume of data available, the department developed a nursing dashboard to provide Nursing Directors with unit-specific data as a tool for monitoring and evaluating unit performance. The dashboard was developed by the Patient Care Services Financial Management Systems staff who met with a group of interested Nursing Directors to identify the metrics that would be of most significance to the managers in evaluating their units. The dashboard includes metrics in each of the major data categories (operational, clinical, staff and fiscal). The metrics are updated as new data are generated. For example, workload data are updated weekly, fiscal data monthly, turnover data quarterly and staff satisfaction data annually. As they are 72
4 updated, the managers receive an with a hyperlink to the dashboard. The dashboard is also available on a shared drive for easy access at any time. A sample section of the dashboard is included as attachment 1.6.j. The data reported on the dashboard provide a snapshot of the status of the unit using data from various reports. The format includes benchmarks, target ranges and flags for metrics that are outside of the target ranges. In addition, there are links to the source reports so that managers are able to drill down as necessary for further information. The unit-based dashboard assists the Nursing Director in making informed decisions regarding ongoing unit management, utilization of existing resources and advocacy for additional resources when needed (attachment 1.6.k). Information from the dashboard, together with data from the underlying reports and from ad hoc analyses, become the basis for the formation of the budget in the next budget cycle. 73
5 Attachment 1.6.a FY08 INPATIENT & OBSERVATION BUDGET GH ADMISSIONS January January FY07 FORECAST Base FY08 Budget FY05 FY FY07 YTD YTD % VP Submits FY07 FC VP Submits FY08 Budget Actual Actual Budget Variance Variance FY07 FC v. FY07 Budget FY08 Bud v. FY07 Forecast Medicine 19,307 20,004 19, % 19,710 (280) -1.4% 20, % Surgery/Plastics/Burn 8,194 8,674 8, % 8, % 8, % Orthopaedics/Hand 3,738 3,823 4,000 (75) -5.7% 3,704 (296) -7.4% 3, % Neurosurgery 2,292 2,137 2,294 (2) -0.3% 2,266 (28) -1.2% 2, % Pediatrics 2,905 2,862 3,084 (44) -4.4% 2,955 (129) -4.2% 3, % Urology 1,277 1,234 1, % 1, % 1, % Neuromedicine 1,872 2,091 1, % 1, % 1,978 (16) -0.8% Gynecology 1,271 1,208 1, % 1, % 1, % Psychiatry % % % Oral/Max % % 161 (3) -1.8% Obstetrics 3,723 3,456 3, % 3,596 (54) -1.5% 3, % Total Admits 45,359 46,276 46, % 46,214 (565) -1.2% 47, % Hospice % % % Grand Total Admits 45,386 46,3 46, % 46,307 (502) -1.1% 47, % 74
6 Attachment 1.6.b Unit Workload/Productivity Trend - Ellison 14 Patient Classification Statistics - March 20 - February 2007 CENSUS WORKLOAD Avg. LOS Census Avg. Workload Mar- Apr- May- Jun- Jul- Aug- Sep- Oct- Nov- Dec- Jan- 07 Feb Mar- Apr- May- Jun- Jul- Aug- Sep- Oct- Nov- Dec- Jan- 07 Feb- 07 Actual Budget Linear (Actual) Actual Budget Linear (Actual) ACUITY HPWI Avg. Acuity Avg. LOS Census Mar- Apr- May- Jun- Jul- Aug- Sep- Oct- Nov- Dec- Jan- 07 Feb Mar- Apr- May- Jun- Jul- Aug- Sep- Oct- Nov- Dec- Jan-07 Feb- 07 Actual Budget Linear (Actual) Actual Budget Linear (Actual) 75
7 Attachment 1.6.c Massachusetts General Hospital 49 MG4137 Patient Care Services MG4518 FY'2007 Personnel Budget FTE's by Job Code PeopleSoft Dept. ID: MG4137 & MG4518 Total Nurse Manager: Ellen Fitzgerald Job Code Description Regular Overtime Authorized 0080 Operations Associate Ellison Patient Care Associate Staff Nurse Clinical Nurse Specialist Description FY' FY'07 Diff Adv. Nurse Practitioner Nurse Manager Midnight ADC Operations Coordinator Unit Service Associate Classification ADC Nurse, Staff-Entry Nurse, Staff-Clinician Acuity Nurse Staff-Advanced Clinician Nurse, Staff, Weekends-Clinician Workload Index Nurse, Staff, W/E-Clinical Scholar Total FTE's Hours / Workload Index FTE's by Job Code Shifts / 24 Hours PeopleSoft Dept. ID: MG4137 Total Job Code Description Regular Overtime Authorized Indirect Time 5.0% 5.0% 0.0% 0080 Operations Associate Benefit Time RN 10.3% 10.9% 0.6% 0259 Patient Care Associate Benefit Time Non-RN 13.0% 10.0% -3.0% 0430 Staff Nurse Non Productive Factor Clinical Nurse Specialist Adv. Nurse Practitioner Direct Care FTEs - WI Nurse Manager Operations Coordinator Staff Nurse Unit Service Associate Non RN Direct Nurse, Staff-Entry Total Direct Care FTE Nurse, Staff-Clinician Nurse Staff-Advanced Clinician Nurse Manager Nurse, Staff, Weekends-Clinician Other RN Nurse, Staff, W/E-Clinical Scholar Op. Assoc Total FTE's Unit Assist/ USA Other Support FTE's by Job Code Other Non-RN PeopleSoft Dept. ID: MG4518 Total Other FTE's Job Code Description Regular Overtime Authorized 0430 Staff Nurse Total FTE's Patient Care Associate Nurse, Staff-Clinician HPPD - Direct Care Worked Nurse, Staff, Weekends-Clinician HPPD - Direct Care Paid Total FTE's % RN Direct Care 85.2% 85.7% 0.5% % RN Total Budget 69.6% 70.3% 0.7% Notes: Other RN =1.2 CNS; 2.0 Advanced Nurse Practitioner Other Non-RN: 0.5 OC 76
8 Attachment 1.6.d 77
9 Attachment 1.6.e Massachusetts General Hospital Patient Care Services FY'07 Personnel Budget Nursing Director: Susan Caffrey FTE's by Job Code PeopleSoft Dept ID: MG4165 Blake 14 - LDR Total Job Code Description Regular Overtime Authorized Description FY'07 FY'08 Difference Staff Nurse (1.5) 0430 Staff Nurse Non RN Direct Clinical Nurse Specialist Nursing Director Total Direct Care FTE Operations Coordinator Unit Service Associate Nursing Director Birth Certificate Registrar Other RN Patient Care Info. Assoc Op. Associate Surgical Tech Unit Asst./ USA Team Leader, II Other Support Nurse, Staff-Clinician Other Non RN Nurse Staff-Advanced Clinician Other FTE's Nurse Staff-Clinical Scholar Nurse, Staff, Weekends-Clinician Total FTE's Nurse, Staff, W/E-Adv Clin Nurse, Staff, W/E-Clin Scholar Total FTE's % RN Direct Care 100.0% 94.9% -5.1% % RN Total Budget 72.0% 68.6% -3.3% Notes: Other RN = 0.5 CNS Other Support = 1.0 Team Leader. 1.0 Birth Certificate Registrar Other Non RN =1.0 Operations Coordinator 78
10 Attachment 1.6.f Budget FY 07 Authorized Positions Direct Care RN Filled Positions as of 3/2/2007 Job codes 132, 430, 442, 708, 1149 and 1201 thru 1219 MGH - PATIENT CARE SERVICES FILLED POSITION REPORT Cost Center Budget On Staff Hired Total Filled % Filled Vacant % Vacant Agency Super Group 846: Emergency Dept. Nursing Service Emergency Room MG % % 2.7 ED Observation - Nsg. MG % % Subtotal ED Nursing Service % % 2.7 Super Group 847: Perioperative Nursing Service OR Nursing Administration MG % % Main Operating Room MG % % 2.0 PACU Same Day Surgery Unit MG3615 MG7116 MG % 97.8% (1.4) % 2.2% 1.9 Pre-Admission Clinic MG % % Endoscopy MG % (5.9) -16.3% Endoscopy at CRP MG % % Instrument Room MG % % Subtotal Perioperative Nursing % % 3.9 Super Group 848: Cardiology/Cardiac Surgery Nursing Service Cardiac SICU MG % % 2.8 Ellison 8 MG % % 0.9 Ellison 9 CCU MG % (0.5) -1.2% 1.8 Ellison 10 MG % % 0.9 Ellison 11 CAU MG % % Subtotal Cardiology/Cardiac Surgery Nsg % % 6.4 Super Group 849:Surgical Nursing Service SICU MG % (4.3) -5.7% 0.9 Burn / Bigelow 13 MG4513 MG % % 0.9 Transplant / Blake 6 MG4163 MG % % 3.6 White 7 MG % % Ellison 7 MG % % 2.7 Ellison 19 MG % % Phillips House 22 MG % % Bigelow 14 MG % % Subtotal Surgical Nursing % %
 Date: 5/10/2007 Location Patient Name Type WI Notes ----------- ------------------------ ---- ----- ---- ------------------------------------ B0854")
11 Attachment 1.6.g Daily Assignment Report Unit: 04 CARD SICU (MGH) Date: 5/10/2007 Location Patient Name Type WI Notes B0854 A SURGERY, ONE B0856 A SURGERY, TWO B0866 A SURGERY, THREE B0868 A SURGERY, FOUR B0874 A SURGERY, FIVE B0876 A SURGERY, SIX B0878 A SURGERY, SEVEN B0882 A SURGERY, EIGHT B0886 A SURGERY, NINE B0888 A SURGERY, TEN B0892 B SURGERY, ELEVEN Total Workload: 34.6 Report Run Date: 5/10/ :37:29 AM 80

12 Attachment 1.6.h REGULAR REPORTS AVAILABLE TO LEADERSHIP AND STAFF 81
13 Attachment 1.6.i -----Original Message----- From: Stechmann, Scott Sent: Monday, April 23, :53 PM To: Keeley, Adele L., R.N.; Tubridy, Aileen, R.N.; Stefancyk, Amanda Lynn,R.N.; Peters-Lewis, Angelleen, R.N.; Kennedy, Ann,M.,Mgh Nursing, R.N.; Digiovine, Anthony D., R.N.; Mahoney, Barbara L., R.N.,MGH Nursing; Glass, Bonnell W., R.N.; Miller, Brenda, R.N.; Manley, Bessie A, R.N.; Feilteau, Charlene A., R.N.; Annese, Christine Donahue, R.N.; Caster, Coleen R.,R.N.,C., MN,FNP; Snydeman, Colleen K., R.N.; Tenney, Dawn L., R.N.; Burke, Debra, Mgh R.N.; Jenkins, Donna L., R.N.; Flaherty, Eileen D., R.N.; Fitzgerald, Ellen M., R.N.; Reardon, George; Peirce, Georgia W.; Somerville, Jacqueline A., R.N.; Madigan, Janet M.,R.N.; Mulligan, Janet L., R.N.; Quigley, Janet Dauphinee, R.N.; Ives Erickson, Jeanette, R.N.; Fitzmaurice, Joan, R.N.; Lafrancesca, Joanne, R.N.; Murphy, John C. Jr.,MGH Nursing, R.N.; Silva, Judith H., R.N.; Newell, Judith,A., R.N.; Myers, Kathleen, R.N.; Perleberg, Keith, R.N.; Pugsley, Lori, R.N.; Settle, Margaret D., R.N.; Shaw, Margaret L., R.N.; Ditomassi, Marianne, R.N.; Freehan, Marion L., R.N.; Prater, Marita, R.N.; Hughes, Maryfran, R.N.; Schnider, Maureen E.,R.N.; Lipkis-Orlando, Robin, R.N.; O'Malley, Rosemary, R.N.; Millar, Sally G., R.N. MGH; Stechmann, Scott; Bouvier, Sharon M.,R.N.; Gordon, Susan J.,R.N., Mgh Ellison 16; Tully, Susan M., R.N.; Morash, Susan, R.N.; Capodilupo, Theresa A, R.N.; Gallivan, Theresa M., R.N.; Moulaison, Walter J, R.N.; Caffrey, Susan,R.N.; Ciesielski, Scott, R.N.; Ellbeg, Mary Elizabeth; Sylvia, Mary H.,R.N.; Winne, Maria D., R.N.; Macchiano, Sara A.,R.N. Cc: McCarthy, Nancy J., R.N. Subject: Workload/Productivity Report The shared folder has been updated with the Workload/Productivity Report for the week ending Apr. 21, file:\\sfa7\pcsmgr$\workload_productivity_reports\winpfs_weekly_reports\fy'07\wrkld_prod_ xls I have also included the updated information and % classified on the dashboard. file:\\sfa7\pcsmgr$\dashboard\dashboard.xls. Scott Stechmann Massachusetts General Hospital Patient Care Services Management Systems Tel: (617) Fax: (617)
14 Attachment 1.6.j UNIT DASHBOARD - Sample Unit UNIT HEALTH COMPONENT METRIC Benchmark Flag Level < Flag Level > ALERT TRIGGER FORMULAS Trigger < Trigger > Actual Score Last Updated Links to Main Report Census OK ALERT! /22-4/28/07 Workload Productivity Acuity OK OK /22-4/28/07 Workload Productivity Operations Workload OK ALERT! /22-4/28/07 Workload Productivity % of Patients Classed 100% 100% 100% ALERT! OK 99% 4/22-4/28/07 % Classified % Occupancy (Noon) 0.0% 84.1% 93.0% OK ALERT! 93.3% March '07 Unit LOS ALERT! OK 3.34 March '07 Unit Activity/LOS Report Vacancy/LOS Graph Activity Ratio OK ALERT! 0.61 March '07 Unit Activity/LOS Report Patient Falls OK OK 2.51 March-07 Falls/HPWI graph Infection Rate (MRSA) OK OK 0.00 Q1 FY'07 Infection Rate (VRE) OK OK 0.00 Q1 FY'07 Clinical Infection Rate (Cdiff) OK ALERT! 1.42 Q1 FY'07 Quality Infection Rate (LRB) OK OK 0.00 Q1 FY'07 Hand Hygiene (Before) 80.0% 40.0% 90.0% OK OK 81.0% Q2 FY'07 Hand Hygiene (After) 80.0% 60.0% 90.0% OK OK 83.0% Q2 FY'07 Sample Portion of Unit-Based Dashboard 83
15 Attachment 1.6.k Portion of Notes Page from Unit-Based Dashboard METRIC OPERATIONAL DEFINITION SOURCE FREQUENCY RELIABILITY BENCH MARK FLAG OPERATIONS CENSUS LOS-adjusted WinPFS Weekly Monitored N/A - +/- 5% of budget contextual metric ACUITY WI / LOS-adjusted census WinPFS Weekly Monitored N/A - +/- 5% of budget contextual metric WORKLOAD Census x Acuity PCS MS calc from WinPFS data Weekly Consistent with monitoring N/A - contextual metric +/- 5% of budget % PATIENTS CLASSED % of patients classed / total patients WinPFS Weekly Monitored 100% <100% to be classed % OCCUPANCY Numerator = Noon census PATCOM WinPFS Denominator = Total operational beds Admitting report (Bedsliop) UNIT LOS (LOS adj days) / (D/C + trans out) PATCOM feed to WinPFS ACTIVITY RATIO (Adm + trans in + trans out + D/C) / MN census CLINICAL PATCOM feed to WinPFS PATIENT FALLS # falls / 1000 patient days Quality and Safety Monthly Primary source N/A - +/- 5% of budget contextual metric w/ changes Primary source Monthly Monthly Calculated from primary sources Calculated from primary sources 2.0% < previous FY minimum 2.0% > previous FY maximum +/- 5% of previous FY average +/- 5% of previous FY average Monthly Primary source 3.0 Upper = 3.0 Lower = 0.0 INFECTION RATE - MRSA # MRSA (hospital acquired) / 1000 patient days Infection Control Unit Quarterly Primary source 0.0% + / - 2 SD from mean of prev 8 quarters 84
Children units are included as attachment 5.11.c. The report indicates that Staff Nurse positions for both Ellison 17 and White 10 were filled to
 5.11 Describe how the various levels of nurse leaders ensure that the utilization of personnel resources is consistent with the established staffing plan, scheduling plan, patient needs, and model of care.
Page 347. Avg. Case. Change Length
 Page 345 EP 8 How nurses use trended data to formulate the staffing plan and acquire necessary resources to assure consistent application of the Care Delivery Model(s). The development of operational budgets
Exemplary Professional Practice: Staffing Scheduling and Budgeting Processes
 Exemplary Professional Practice: Staffing Scheduling and geting Processes EP10 Nurses use trended data in the budgeting process, with clinical nurse input, to redistribute existing nursing resources or
participate, which was made in part on the ability to impact the final measure set. The results, solutions and challenges realized during the pilot
 7.6 For clinical areas that are not included in national databases, explain how benchmarks and nursing-sensitive measures are selected, implemented, and evaluated by nurses at the organizational, departmental,
John Murphy, RN, MS Emergency and Trauma Nursing Alice Gervasini, RN, PhD Maryfran Hughes, RN, MSN Intravenous Therapy Nursing Janet Mulligan, RN, MS
 14.2 Submit a report that details the continuing education activities, self-directed learning activities, and attendance at nursing and interdisciplinary conferences of the CNO and nurse executive leadership
Board Briefing. Board Briefing of Nursing and Midwifery Staffing Levels. Date of Briefing August 2017 (July 2017 data)
") Board Briefing Board Briefing of Nursing and Midwifery Staffing Levels Date of Briefing August 2017 (July 2017 data) This paper is for: Sponsor: Chief Nurse- Dame Eileen Sills (DBE) Decision Author: Workforce
Board Briefing Board Briefing of Nursing and Midwifery Staffing Levels Date of Briefing August 2017 (July 2017 data) This paper is for: Sponsor: Chief Nurse- Dame Eileen Sills (DBE) Decision Author: Workforce
Staffing and Scheduling
 Staffing and Scheduling 1 One of the most critical issues confronting nurse executives today is nurse staffing. The major goal of staffing and scheduling systems is to identify the need for and provide
1. November RN VACANCY RATE: Overall 2320 RN vacancy rate for areas reported is 12.5%
 PATIENT CARE SERVICES REPORT Submitted to the Joint Conference Committee, December 2013 Terry Dentoni, RN, MSN, CNL, Interim Chief Nursing Officer 1. November 2013-2320 RN VACANCY RATE: Overall 2320 RN
1. March RN VACANCY RATE: Overall 2320 RN vacancy rate for areas reported is 13.8%
 PATIENT CARE SERVICES REPORT Submitted to the Joint Conference Committee, April 2014 Terry Dentoni, RN, MSN, CNL, Interim Chief Nursing Officer 1. March 2014-2320 RN VACANCY RATE: Overall 2320 RN vacancy
4/12/2016. High Reliability and Microsystem Stress. We have no financial, professional or personal conflict of interest to disclose.
 High Reliability and Microsystem Stress Helping leaders identify and mitigate unit level stress: Next steps towards the journey of high reliability Whittney Brady RN, DNP Jackie Hausfeld, RN, MSN, NEA-BC
PATIENT CARE SERVICES REPORT Submitted to the Joint Conference Committee, February 2013 Terry Dentoni, RN, MSN, CNL, Interim Chief Nursing Officer
 PATIENT CARE SERVICES REPORT Submitted to the Joint Conference Committee, February 2013 Terry Dentoni, RN, MSN, CNL, Interim Chief Nursing Officer 1. 2320 RN Vacancy Rates for the Month of January 2013
Riverside s Vigilance Care Delivery Systems include several concepts, which are applicable to staffing and resource acquisition functions.
 1 EP8: Describe and demonstrate how nurses used trended data to formulate the staffing plan and acquire necessary resources to assure consistent application of the Care Delivery System(s). Riverside Medical
How Does Payroll-Based Journal Reporting Impact Your Five Star? Don Feige, ezpbj
 How Does Payroll-Based Journal Reporting Impact Your Five Star? Don Feige, ezpbj About Our Speaker ezpbj provides easy-to-use software to manage all aspects of Payroll-Based Journal reporting ezpbj assembles,
Rebalancing the Cost Structure: Progressive Health Systems, Inc. Bob Haley, CEO Steve Hall, CFO
 Rebalancing the Cost Structure: Progressive Health Systems, Inc. Bob Haley, CEO Steve Hall, CFO THE MARKET & PHS S POSITION 2 Progressive Health Systems, Inc. (dba Pekin Hospital) Pekin, IL 3 4 5 Nearby
Benchmarking and Key Metrics Utilized by HSCT Administrators. Clint Divine, MBA, MSM Administrative Director, BMT
 Benchmarking and Key Metrics Utilized by HSCT Administrators Clint Divine, MBA, MSM Administrative Director, BMT 1 When you ve seen one HSCT program, you ve seen one HSCT program Although, there are many
OOD 4: A budget summary for the most recent fiscal year, actual to budget for nursing education, conference attendance and research.
 Page 244 OOD 4: A budget summary for the most recent fiscal year, actual to budget for nursing education, conference attendance and research. Education The Massachusetts General Hospital (MGH) Patient
Massachusetts ICU Acuity Meeting
 Massachusetts ICU Acuity Meeting Acuity Tool Certification and Reporting Requirements Acuity Tool Certification Template Suggested Guidance Acuity Tool Submission Details Submitting your acuity tool for
REASSESSING THE BED COORDINATOR S ROLE SHADY GROVE ADVENTIST HOSPITAL
 Publication Year: 2008 REASSESSING THE BED COORDINATOR S ROLE SHADY GROVE ADVENTIST HOSPITAL Summary: Creation of Bed Coordinator position to improve patient flow throughout the entire hospital Hospital:
Board Briefing. Board Briefing of Nursing and Midwifery Staffing Levels. Date of Briefing January 2018 (December 2017 data)
") Board Briefing Board Briefing of Nursing and Midwifery Staffing Levels Date of Briefing January 2018 (December 2017 data) This paper is for: Sponsor: Chief Nurse- Dame Eileen Sills (DBE) Decision Author:
Board Briefing Board Briefing of Nursing and Midwifery Staffing Levels Date of Briefing January 2018 (December 2017 data) This paper is for: Sponsor: Chief Nurse- Dame Eileen Sills (DBE) Decision Author:
The Case for Optimal Staffing: A Call to Action
 The Case for Optimal Staffing: A Call to Action 2015 ANCC National Magnet Conference October 7, 2015 2:30 3:30pm Session C721 Mary Jo Assi, DNP, RN, NEA BC, FNP BC Director of Nursing Practice and Work
Alaska Psychiatric Institute. Admissions & Demographic Annual Report
 Alaska Psychiatric Institute Admissions & Demographic Annual Report (As of 8/2/27) 1 Total Admissions FY, FY4, FY, FY, FY7 18 1 Number Of 14 12 1 8 FY FY4 FY FY FY7 4 2 FY Admissions - 1,227 FY Admisions
PATIENT CARE SERVICES REPORT Submitted to the Joint Conference Committee, May 2010 Sharon McCole-Wicher, RN, MS, Chief Nursing Officer
 PATIENT CARE SERVICES REPORT Submitted to the Joint Conference Committee, May 2010 Sharon McCole-Wicher, RN, MS, Chief Nursing Officer 1. April 2010 2320 RN VACANCY RATE: Overall 2320 RN vacancy rate for
Kentucky Sepsis Summit. August 2016
 1 Kentucky Sepsis Summit August 2016 St. Elizabeth Healthcare About Us: - 7 facilities & over 1200 licensed beds - Serving the NKY/Cincinnati Region in: - Orthopedic Care - Heart and Vascular Institute
UNIVERSITY OF ILLINOIS HOSPITAL & HEALTH SCIENCES SYSTEM HOSPITAL DASHBOARD
 September 8, 20 UNIVERSITY OF ILLINOIS HOSPITAL & HEALTH SCIENCES SYSTEM HOSPITAL DASHBOARD UI Health Metrics FY Q4 Actual FY Q4 Target FY Q4 Actual 4th Quarter % change FY vs FY Average Daily Census (ADC)
PATIENT CARE SERVICES REPORT Submitted to the Joint Conference Committee, November 2017
 Report Contents: PATIENT CARE SERVICES REPORT Submitted to the Joint Conference Committee, November By: Terry Dentoni, MSN, RN, CNL - ZSFG Chief Nursing Officer 1. Professional Nursing.....1 2. Emergency
Introduction. Staffing to demand increases bottom line revenue for the facility through increased volume and throughput and elimination of waste.
 Learning Objectives Define a process to determine the appropriate number of rooms to run per day based on historical inpatient and outpatient case volume. Organize a team consisting of surgeons, anesthesiologists,
Departments to Improve. February Chad Faiella RN, Terri Martin RN. 1 Process Excellence
 Coordination of Multiple Departments to Improve ED Throughput February 2011 Chad Faiella RN, Terri Martin RN 1 Agenda OhioHealth information Grant Medical Center facts Bed assignment process Key takeaways
LESSONS LEARNED IN LENGTH OF STAY (LOS)
") FEBRUARY 2014 LESSONS LEARNED IN LENGTH OF STAY (LOS) USING ANALYTICS & KEY BEST PRACTICES TO DRIVE IMPROVEMENT Overview Healthcare systems will greatly enhance their financial status with a renewed focus
FEBRUARY 2014 LESSONS LEARNED IN LENGTH OF STAY (LOS) USING ANALYTICS & KEY BEST PRACTICES TO DRIVE IMPROVEMENT Overview Healthcare systems will greatly enhance their financial status with a renewed focus
Webinar Control Panel
 Clear Communications Through Dashboard Reports 1 2012 Community Action Program Legal Services, Inc. Webinar Control Panel Raise your hand to ask a question Only enabled if you have entered your Audio Pin!
Quality Management Report 2017 Q2
 Quality Management Report 2017 Q2 Quality Management Program CMS STAR Ratings Member Satisfaction (CAHPS & HOS) HEDIS Risk Adjustment DHS Member Incident Reporting Member Satisfaction Surveys Pay for Performance
Matching Capacity and Demand:
 We have nothing to disclose Matching Capacity and Demand: Using Advanced Analytics for Improvement and ecasting Denise L. White, PhD MBA Assistant Professor Director Quality & Transformation Analytics
2013 ANCC National Magnet Conference
 2013 ANCC National Magnet Conference Our Expedition Everest Conquering the Staffing and Scheduling Yeti Session # C647, 3:30-4:30PM Thursday October 3, 2013 James Fenush Jr. MS, RN Director of Nursing,
UNIVERSITY OF ILLINOIS HOSPITAL & HEALTH SCIENCES SYSTEM HOSPITAL DASHBOARD
 UNIVERSITY OF ILLINOIS HOSPITAL & HEALTH SCIENCES SYSTEM HOSPITAL DASHBOARD January 19, 2017 UI Health Metrics FY17 Q1 Actual FY17 Q1 Target FY Q1 Actual Ist Quarter % change FY17 vs FY Discharges 4,836
The Triple Aim. Productivity: Digging Deep Enough 11/4/2013. quality and satisfaction); Improving the health of populations; and
; Improving the health of populations; and") NAHC Annual Conference October, 2013 Cindy Campbell, BSN, RN Associate Director Operational Consulting Fazzi Jeanie Stoker, BSN, RN, MPA, BC Director AnMed Health Home Care Context AnMed Health Home Health
NAHC Annual Conference October, 2013 Cindy Campbell, BSN, RN Associate Director Operational Consulting Fazzi Jeanie Stoker, BSN, RN, MPA, BC Director AnMed Health Home Care Context AnMed Health Home Health
University of Illinois Hospital and Clinics Dashboard May 2018
 May 17, 2018 University of Illinois Hospital and Clinics Dashboard May 2018 Combined Discharges and Observation Cases for the nine months ending March 2018 are 1.6% below budget and 4.9% lower than last
2013 ANCC National Magnet Conference
 2013 ANCC National Magnet Conference Our Expedition Everest Conquering the Staffing and Scheduling Yeti Session # C647, 3:30-4:30PM Thursday October 3, 2013 James Fenush Jr. MS, RN Director of Nursing,
Mark Stagen Founder/CEO Emerald Health Services
 The Value Proposition of Nurse Staffing September 2011 Mark Stagen Founder/CEO Emerald Health Services Agenda Nurse Staffing Industry Update Improving revenue trends in healthcare staffing 100% Percentage
UI Health Hospital Dashboard September 7, 2017
 UI Health Hospital Dashboard September 20 September 7, 20 UI Health Metrics FY Q4 Actual FY Q4 Target FY Q4 Actual 4th Quarter % change FY vs FY Discharges 4,558 4,680 4,720 Combined Observation Cases
Brent Treichler, M.D., FACEP Assistant Professor, UT Southwestern Department of Surgery, Division of Emergency Medicine Chief of Emergency Services,
 Brent Treichler, M.D., FACEP Assistant Professor, UT Southwestern Department of Surgery, Division of Emergency Medicine Chief of Emergency Services, Parkland Health and Hospital System September 13, 2010
Transitions in Care. Discharge Planning Pathway & Dashboard
 Transitions in Care Discharge Planning Pathway & Dashboard Scott Jarrett Executive Vice President and Chief of Clinical Programs Humber River Hospital Carol Hatcher Vice President Clinical Programs Humber
Workshop: Nursing Sensitive Indicators. Annelie Meiring and Suseth Goosen
 Workshop: Nursing Sensitive Indicators Annelie Meiring and Suseth Goosen The level of patient care your facility provides is imperative it dictates your facility's financial success, as well as its reputation
Leveraging the Accountable Care Unit Model to create a culture of Shared Accountability
 Leveraging the Accountable Care Unit Model to create a culture of Shared Accountability How we improved Patient Safety and Quality Outcomes at Northwest Hospital Our Journey to Shared Accountability Implementation
PATIENT CARE SERVICES REPORT Submitted to the Joint Conference Committee, August 2016
 Report Contents: PATIENT CARE SERVICES REPORT Submitted to the Joint Conference Committee, August By: Terry Dentoni, MSN, RN, CNL, SFGH Chief Nursing Officer 1. Professional Nursing..1 2. Emergency Department
Will PBJ erase your star rating?
 Will PBJ erase your star rating? How Payroll-Based Journal reporting impacts your Five-Star Carl Moellenkamp, CPA, CliftonLarsonAllen Don Feige, ezpbj Housekeeping 1. If you are experiencing technical
CCDM Programme Standards
 CCDM Programme Standards Standard 1.0 CCDM Governance Standard 1.0 The CCDM governance councils (organisation and ward/unit) ensure that care capacity demand management is planned, coordinated and appropriate
PSI-15 Lafayette General Health 2017 Nicholas E. Davies Enterprise Award of Excellence
 PSI-15 Lafayette General Health 2017 Nicholas E. Davies Enterprise Award of Excellence Rachel Brunt, RN, BSN, MBA-HCA, CIC, CPHQ, Director Quality Jessie Hanks, BS, RHIA, Director HIM Lafayette General
Integrated Performance Report Executive Summary (for NHS Fife Board Meeting) Produced in February 2018
 Produced in February 2018") 6b Integrated Performance Report Executive Summary (for NHS Fife Board Meeting) Produced in February 2018 2 Contents Integrated Performance Report: Executive Summary 5 Clinical Governance: Chair and Committee
6b Integrated Performance Report Executive Summary (for NHS Fife Board Meeting) Produced in February 2018 2 Contents Integrated Performance Report: Executive Summary 5 Clinical Governance: Chair and Committee
Learning from Patient Deaths: Update on Implementation and Reporting of Data: 5 th January 2018
 Learning from Patient Deaths: Update on Implementation and Reporting of Data: 5 th January 218 Purpose The purpose of this paper is to update the Trust Board on progress with implementing the mandatory
Balanced Scorecard Highlights
 Balanced Scorecard Highlights Highlights from 2011-12 fourth quarter (January to March) Sick Time The average sick hours per employee remains above target this quarter at 58. Human Resources has formed
STATISTICAL PRESS NOTICE MONTHLY CRITICAL CARE BEDS AND CANCELLED URGENT OPERATIONS DATA, ENGLAND March 2018
 STATISTICAL PRESS NOTICE MONTHLY CRITICAL CARE BEDS AND CANCELLED URGENT OPERATIONS DATA, ENGLAND March 2018 Main Findings March 2018: Critical Care Beds There were 4,064 adult critical care beds available
TL3EO: The CNO influences organization-wide change beyond the scope of nursing.
 Transformational Leadership: Advocacy and Influence TL3EO: The CNO influences organization-wide change beyond the scope of nursing. TL3EOa Provide one example, with supporting evidence, of a CNO-influenced
EXECUTIVE SUMMARY. Introduction. Methods
 EXECUTIVE SUMMARY Introduction University of Michigan (UM) General Pediatrics offers health services to patients through nine outpatient clinics located throughout South Eastern Michigan. These clinics
NHS performance statistics
 NHS performance statistics Published: 8 th February 218 Geography: England Official Statistics This monthly release aims to provide users with an overview of NHS performance statistics in key areas. Official
Board of Director s Meeting
 Board of Director s Meeting Meeting Date: 15 November 212 Agenda item: 6.1 Title: Purpose: Summary: Recommendation: Author: Presented by: QUALITY AND PATIENT SAFETY ASSURANCE COMMITTEE To provide an exception
Gantt Chart. Critical Path Method 9/23/2013. Some of the common tools that managers use to create operational plan
 Some of the common tools that managers use to create operational plan Gantt Chart The Gantt chart is useful for planning and scheduling projects. It allows the manager to assess how long a project should
Pharmaceutical Services Report to Joint Conference Committee September 2010
 Pharmaceutical Services Report to Joint Conference Committee September 21 Background: Pharmaceutical Services staffing has increased by 31 FTE from 26 due to program changes and to comply with regulatory
Celebrating our Successes 2014
 Celebrating our Successes 214 Nurse Involvement in Decision Making Groups 5 CODE SEPSIS: Time from Antibiotic Order to Administration 45 4 Time in Minutes from order to administration 35 3 25 2 15 1 5
PATIENT CARE SERVICES REPORT Submitted to the Joint Conference Committee, February 2009 Sue Currin, RN, MS, Chief Nursing Officer
 PATIENT CARE SERVICES REPORT Submitted to the Joint Conference Committee, February 2009 Sue Currin, RN, MS, Chief Nursing Officer 1. January 2009 2320 RN VACANCY RATE: Overall 2320 RN vacancy rate for
CHC-A Continuity Dashboard. All Sites Continuity - Asthma. 2nd Qtr-03. 2nd Qtr-04. 2nd Qtr-06. 4th Qtr-03. 4th Qtr-06. 3rd Qtr-04.
 PPC1: ACCESS AND COMMUNICATION Element B: Access and Communication Results Item 1: Visits with assigned PCP Continuity data is reviewed each month at our Office Redesign Committee (ORDC). The data is collected
NHS performance statistics
 NHS performance statistics Published: 14 th December 217 Geography: England Official Statistics This monthly release aims to provide users with an overview of NHS performance statistics in key areas. Official
Integrated Performance Report
 Integrated Performance Report M12 March 2015 Presented by: Paul Bostock (Chief Operating Officer) Des Holden (Medical Director) Fiona Alsop (Chief Nurse) Paul Simpson (Chief Financial Officer) An Associated
Tell Your Story with a Well- Designed Data Plan. Jackie McFarlin, RN, MPH,MSN, CIC VA North Texas Health Care System
 Tell Your Story with a Well- Designed Data Plan Jackie McFarlin, RN, MPH,MSN, CIC VA North Texas Health Care System Purposes of Presentation Describe the elements of a well designed data plan Guidelines
Quality Measure Indicators +Throughput Metrics + Automated Dashboard = Innovation to Improve Quality Goals
 Quality Measure Indicators +Throughput Metrics + Automated Dashboard = Innovation to Improve Quality Goals DMC Harper- Hutzel Hospital The DMC is an 8 facility academic medical center Harper-Hutzel is
LVHN Sepsis Quality Improvement Project
 LVHN Sepsis Quality Improvement Project Matthew McCambridge, MD, MS Chief Quality Officer 2015 Lehigh Valley Health Network Don Levick, MD, MBA Chief Medical Information Officer LVHN Sepsis Quality Improvement
Activity Based Cost Accounting and Payment Bundling
 Activity Based Cost Accounting and Payment Bundling 1 Agenda Introduction of Speakers Fast Facts about Jewish Senior Life/Jewish Home of Rochester Determining the need and uses for an Activity Based Cost
Renfrew Victoria Hospital
 Renfrew Victoria Hospital Implementation of a Functional Abilities Measurement Tool TEAM MEMBER NAMES: Randy Penney, Executive Sponsor Charlene Hanniman, Team Lead Stefanie Coughlin, Team Member Chris
How Allina Saved $13 Million By Optimizing Length of Stay
 Success Story How Allina Saved $13 Million By Optimizing Length of Stay EXECUTIVE SUMMARY Like most large healthcare systems throughout the country, Allina Health s financial health improves dramatically
BOARD OF DIRECTORS PAPER COVER SHEET. Meeting Date: 1 st December 2010
 BOARD OF DIRECTORS PAPER COVER SHEET Meeting Date: 1 st December 2010 Agenda Item: 9 Paper No: E Title: Management of Pressure Ulcers Purpose: For Information Summary: This paper provides a report on the
2018 GEORGIA WORKFORCE REPORT. Published by Compdata Surveys & Consulting on behalf of the Georgia Hospital Association
 2018 GEORGIA WORKFORCE REPORT Published by Compdata Surveys & Consulting on behalf of the Georgia Hospital Association TABLE OF CONTENTS Introduction... 1 Labor Force & Employment Levels... 2 Vacancy &
Relational Coordination: An Imperative Influencing our Capacity to Reach the Core
 Relational Coordination: An Imperative Influencing our Capacity to Reach the Core Linda Q. Everett, PhD, RN, NEA-BC, FAAN Executive Vice President & Chief Nurse Executive Indiana University Health 12/7/2012
Stakeholder input is gathered in several ways. Patients are given the opportunity to provide feedback, the SWOT analysis is based on information from
 Strategic Plan 27 Executive Summary The following is a summary of the information shared in this Operations Review and Plan. This plan highlights operational achievements and challenges, clinical outcomes
Nottingham University Hospitals Emergency Department Quality Issues Related to Performance
 RCCG/GB/14/123 Nottingham University Hospitals Emergency Department Quality Issues Related to Performance Introduction NUH have failed to meet the 95% 4 hour wait standard for a number of consecutive months.
Integrated Performance Report August 2017
 Integrated Performance Report Contents Section Page High Level Dashboard Balanced scorecard 3 Domain Scorecards and Director Commentaries Operational Performance 4 Quality and Patient Safety 9 Workforce
SOUTHAMPTON UNIVERSITY HOSPITALS NHS TRUST Trust Key Performance Indicators May Regular report to Trust Board
 SOUTHAMPTON UNIVERSITY HOSPITALS NHS TRUST Trust Key Performance Indicators May 20 Report to: Trust Board July 20 Report from: Sponsoring Executive: Aim of Report/Principle Topic: Review History to date:
The Digital ICU: Return On Innovation
 The Digital ICU: Return On Innovation Cheryl Hiddleson, MSN, RN, CCRN-E Director, Emory eicu Center May, 2017 The Digital ICU: Return on Innovation Cheryl Hiddleson MSN, RN, CCRN-E Director, Emory eicu
Aurora will expand its geographic coverage within Wisconsin to achieve its mission to: Aurora Health Care 1991 Strategic Plan
 Objectives To describe the 20-year evolution of Aurora Medical Group within Aurora Health Care To identify the cultural characteristics necessary to improve patient access from the patient s perspective
quarterly BOROUGH LABOR MARKET BRIEF Quarter 1
 quarterly BOROUGH LABOR MARKET BRIEF Quarter 1 january-march 2017 INDUSTRIES, JOBS, EMPLOYMENT, AND DEMOGRAPHIC TRENDS NYC AND THE FIVE BOROUGHS: brooklyn, bronx, manhattan, queens, staten island Contents
FLORIDA CENTER FOR HEALTH INFORMATION AND TRANSPARENCY
 FLORIDA CENTER FOR HEALTH INFORMATION AND TRANSPARENCY DATA CATALOG Rick Scott, Governor Justin M. Senior, Secretary Visit AHCA online at: www.floridahealthfinder.gov Revised 2017 TABLE OF CONTENTS PAGE
PATIENT CARE SERVICES REPORT Submitted to the Joint Conference Committee, March 2018
 Report Contents: PATIENT CARE SERVICES REPORT Submitted to the Joint Conference Committee, March By: Terry Dentoni, MSN, RN, CNL - ZSFG Chief Nursing Officer 1. Professional Nursing......1-2 2. Emergency
Integrated Performance Report
 Integrated Performance Report M06 September 2014 Presented by: Paul Bostock (Chief Operating Officer) Des Holden (Medical Director) Fiona Allsop (Chief Nurse) Paul Simpson (Chief Financial Officer) An
NHS Performance Statistics
 NHS Performance Statistics Published: 8 th March 218 Geography: England Official Statistics This monthly release aims to provide users with an overview of NHS performance statistics in key areas. Official
Avoiding the Cap Trap What Every Hospice Needs to Know. Matthew Gordon, CPA Principal Consultant / Founder Cap Doctor Associates, Inc.
 Avoiding the Cap Trap What Every Hospice Needs to Know Matthew Gordon, CPA Principal Consultant / Founder Cap Doctor Associates, Inc. Overview 11% of hospices exceeded the cap in 2012 with an average overage
State of California Health and Human Services Agency California Department of Public Health
 State of California Health and Human Services Agency California Department of Public Health MARK B HORTON, MD, MSPH Director ARNOLD SCHWARZENEGGER Governor AFL 10-07 TO: General Acute Care Hospitals SUBJECT:
Quarterly Diagnostics Census and Monthly Diagnostics Waiting Times and Activity Return Consultation
 Quarterly Diagnostics Census and Monthly Diagnostics Waiting Times and Activity Return Consultation NHS England INFORMATION READER BOX Directorate Medical Operations and Information Specialised Commissioning
What s Right in Healthcare. Covenant Health Knoxville, Tennessee
 What s Right in Healthcare Covenant Health Knoxville, Tennessee Getting the Framework Right How Evidence-Based Leadership Empowers 11,000 Professionals to Improve in Unison Journey to Excellence A Journey,
Creating Data-driven Strategies to Improve Hospital Outcomes
 Annual National Institute October 16, 2014 Creating Data-driven Strategies to Improve Hospital Outcomes A Case Manager s Guide Information Data Knowledge 1 2014 Conifer Health Solutions, LLC. All Rights
LAWRENCE GENERAL HOSPITAL RNs
 LAWRENCE GENERAL HOSPITAL RNs NEGOTIATION COMMITTEE Co-Chairperson Diane Lee OR Co-Chairperson Laurie Spheekas Telemetry Secretaries Kathleen Farah ICU Jean Tornatore Telemetry Treasurer Caroline Daniels
Monthly and Quarterly Activity Returns Statistics Consultation
 Monthly and Quarterly Activity Returns Statistics Consultation Monthly and Quarterly Activity Returns Statistics Consultation Version number: 1 First published: 08/02/2018 Prepared by: Classification:
HIMSS Nicholas E. Davies Award of Excellence Case Study Nebraska Medicine October 10, 2017
 HIMSS Nicholas E. Davies Award of Excellence Case Study Nebraska Medicine October 10, 2017 Nebraska Medicine $1.2 billion academic health system 8,000 employees More than 1,000 affiliated physicians Primary
Driving High-Value Care via Clinical Pathways. Andrew Buchert, MD Gabriella Butler, MSN, RN
 Driving High-Value Care via Clinical Pathways Andrew Buchert, MD Gabriella Butler, MSN, RN 1 Andrew Buchert, MD Medical Director, Clinical Resource Management Children s Hospital of Pittsburgh of UPMC
RTT Recovery Planning and Trajectory Development: A Cambridge Tale
 RTT Recovery Planning and Trajectory Development: A Cambridge Tale Linda Clarke Head of Operational Performance Addenbrooke s Hospital I Rosie Hospital Apr 2014 May 2014 Jun 2014 Jul 2014 Aug 2014 Sep
Hip Today Home Tomorrow:
 Hip Today Home Tomorrow: A Collaborative Effort between an Orthopedic Practice and a Hospital to Create an Innovative Outpatient Total Hip Replacement Program Kimberley Murray RN MS CNS-CNOR Kelly Keenan
Excellent Care for All Quality Improvement Plans (QIP): Progress Report for the 2015/16 QIP
: Progress Report for the 2015/16 QIP") Excellent Care for All Quality Improvement Plans (QIP): Progress Report for the 2015/16 QIP ID Measure/Indicator from 2015/16 1 Overall, how would you rate the care and services you received at the hospital?
Excellent Care for All Quality Improvement Plans (QIP): Progress Report for the 2015/16 QIP ID Measure/Indicator from 2015/16 1 Overall, how would you rate the care and services you received at the hospital?
MAGNET RECOGNITION PROGRAM SITE VISIT AGENDA MAGNET VERSION 12 NOV 1, 2017
 MAGNET RECOGNITION PROGRAM SITE VISIT AGENDA MAGNET 20150902 VERSION 12 NOV 1, 2017 CNE: Jeanette Ives Erickson, RN, DNP, FAAN Magnet Program Director: Marianne Ditomassi, RN, DNP, MBA, FAAN Executive
COVENTRY AND RUGBY CLINICAL COMMISSIONING GROUP
 COVENTRY AND RUGBY CLINICAL COMMISSIONING GROUP Report To: Governing Body 11 September 2013 Report From: Title of Report: Purpose of the Report: Jacqueline Barnes, Executive Nurse The Nursing and Quality
COPPER COUNTRY MENTAL HEALTH SERVICES ANNUAL QUALITY IMPROVEMENT REPORT FY Introduction
 COPPER COUNTRY MENTAL HEALTH SERVICES ANNUAL QUALITY IMPROVEMENT REPORT FY 2017 Introduction Copper Country Mental Health Services (CCMHS) focuses on improving the quality of our services and identifying
13.4 Provide three examples of interdisciplinary collaboration in which nurses have assumed a leadership role.
 13.4 Provide three examples of interdisciplinary collaboration in which nurses have assumed a leadership role. The planning and design process for the Building for the Third Century (B3C), the next major
Integrating Quality Into Your CDI Program: The Case for All-Payer Review
 7th Annual Association for Clinical Documentation Improvement Specialists Conference Integrating Quality Into Your CDI Program: The Case for All-Payer Review Katy Good, RN, BSN, CCDS, CCS CDI Program Coordinator
Section 1 - Key Performance Indicators
 Clinical Quality Report Month 6 2016/17 period ending 30th September 2016 Section 1 - Key Performance Indicators 1.1 NHS Improvement; Risk Assessment Framework Clostridium difficile Indicator M6 2 YTD
CAUTI Reduction A Clinton Memorial Presentation
 CAUTI Reduction 2016 A Clinton Memorial Presentation Clinton Memorial Statistics Rurally situated in a primarily agricultural community with a population of 42,000 The hospital is licensed for 165 beds