Academic Research and Development Expenditures:
|
|
|
- Beryl Shields
- 5 years ago
- Views:
Transcription
1 Academic Research and Development Expenditures: Fiscal Year 2001 Detailed Statistical Tables Division of Science Resources Statistics Directorate for Social, Behavioral, and Economic Sciences National Science Foundation April 2003
2 Academic Research and Development Expenditures: Fiscal Year 2001 Detailed Statistical Tables M. Marge Machen, Project Officer Division of Science Resources Statistics Directorate for Social, Behavioral, and Economic Sciences National Science Foundation April 2003
3 National Science Foundation Rita R. Colwell Director Directorate for Social, Behavioral, and Economic Sciences Norman M. Bradburn Assistant Director Division of Science Resources Statistics Lynda T. Carlson Mary J. Frase Division Director Deputy Director Ronald S. Fecso Chief Statistician Research and Development Statistics Program John E. Jankowski Program Director DIVISION OF SCIENCE RESOURCES STATISTICS The Division of Science Resources Statistics (SRS) fulfills the legislative mandate of the National Science Foundation Act to... provide a central clearinghouse for the collection, interpretation, and analysis of data on scientific and engineering resources and to provide a source of information for policy formulation by other agencies of the Federal Government... To carry out this mandate, SRS designs, supports, and directs periodic surveys as well as a variety of other data collections and research projects. These surveys yield the materials for SRS staff to compile, analyze, and disseminate quantitative information about domestic and international resources devoted to science, engineering, and technology. If you have any comments or suggestions about this or any other SRS product or report, we would like to hear from you. Please direct your comments to: National Science Foundation Division of Science Resources Statistics 4201 Wilson Blvd., Suite 965 Arlington, VA Telephone: (703) Fax: (703) srsweb@nsf.gov Suggested Citation National Science Foundation, Division of Science Resources Statistics, Academic Research and Development Expenditures: Fiscal Year 2001, NSF , Project Officer, M. Marge Machen (Arlington, VA 2003). April 2003 SRS data are available through the World Wide Web ( For more information about obtaining reports, contact paperpubs@nsf.gov or call (301) For NSF's Telephonic Device for the Deaf, dial (703) ii
4 ACKNOWLEDGMENTS The preparation of Academic Research and Development Expenditures, FY 2001, Detailed Statistical Tables, was managed by M. Marge Machen, Project Officer, National Science Foundation (NSF), Division of Science Resources Statistics (SRS), Research and Development Statistics Program (RDS), under the overall direction of John E. Jankowski, Program Director, (RDS). Guidance and review were provided by Lynda T. Carlson, Division Director, Mary J. Frase, Deputy Division Director, and Ron Fecso, Chief Mathematical Statistician, SRS. Tanya R. Gore and Rolfe W. Larson of the Information and Technology Services Program (ITSP) of SRS provided editing, processing, and final composition for this report. John R. Gawalt, Program Director of the ITSP, and his Web team handled electronic publication. ORC Macro International of Bethesda, MD, under NSF contract number SRS , prepared the tables, general and technical notes, and report copy. ORC Macro staff members who worked on this report were Jennifer Greer, Gail H. Henry, Mark Morgan, Elizabeth H. Peto, Michael Rossi, and Emily Wueker. iii
5
6 CONTENTS Section GENERAL NOTES... Page vii A.TECHNICAL NOTES... 1 Scope of the survey... 3 FY 2001 survey frame design... 3 Survey instrument... 3 Item Item 1A... 4 Item 1B... 4 Item Item Item 1A analysis... 4 Item 1B analysis... 6 Response rate... 8 National total and imputation... 8 Changes in basic research totals... 8 Data anomalies... 9 State tables... 9 Highest degree-granted tables Data availability Section A tables B. DETAILED STATISTICAL TABLES C. UNIVERSITY-ADMINISTERED FEDERALLY FUNDED RESEARCH AND DEVELOPMENT CENTERS: FY D.SURVEY INSTRUMENTS v
7
8 The data presented in this report were compiled from the National Science Foundation s (NSF) fiscal year (FY) 2001 Survey of Research and Development Expenditures at Universities and Colleges (academic R&D expenditures survey). They refer to science and engineering expenditures for separately budgeted research and development (R&D). Terms used in institutional accounting procedures are incorporated throughout the tables. The term separately budgeted R&D expenditures includes all funds expended for activities specifically organized to produce research outcomes and commissioned by an agency either external to the institution or separately budgeted by an organizational unit within the institution. Expenditures are funds actually spent by an institution during its fiscal year. Separately budgeted R&D equipment purchased from current funds includes all research equipment purchased under sponsored research project awards. GENERAL NOTES The terms imputation and imputed data refer to the computerized process by which NSF develops estimates of data when institutions do not furnish the information upon request. Using this process, estimates are developed that are based primarily on key data items reported in prior-year surveys. When these key data items are not available, estimates are based on figures derived from data of respondent institutions that have similar characteristics, including highest degree granted and type of institutional control (public or private). In this publication, the letter i is used to identify imputed data and the letter e is used when institutional respondents indicated that their data were estimated or when data required slight mathematical adjustments. Data presented in trend tables are assembled from the most recently completed survey cycle. Since prior years data are reviewed for consistency with currentyear responses and, when necessary, are revised in consultation with institutional respondents, references to prior years data should be restricted to this document. Federally funded research and development centers (FFRDCs) are R&D-performing organizations that range from the traditional contractor-owned/contractor-operated or Government-owned/contractor-operated organizational structures to various degrees of contractor/ Government control and ownership. FFRDCs are formed to achieve particular Federal R&D objectives that cannot be met as effectively by existing organizations. Requests for additional information concerning the survey findings for the current or prior surveys should be directed to M. Marge Machen at Research and Development Statistics Program Division of Science Resources Statistics National Science Foundation 4201 Wilson Boulevard, Suite 965 Arlington, VA Telephone: (703) Internet: mmachen@nsf.gov vii
9
10 SECTION A. TECHNICAL NOTES
11
12 SCOPE OF THE SURVEY Data for the National Science Foundation s (NSF) fiscal year (FY) 2001 report on research and development (R&D) expenditures were collected from 609 institutions of higher education in the United States and outlying areas. These institutions have doctoral programs in science and engineering (S&E), are historically black colleges or universities (HBCUs) that expend any amount of separately budgeted R&D in S&E, or are master s or bachelor s degree-granting institutions that expend at least $150,000 in separately budgeted R&D in S&E. In addition, the survey coverage was expanded to collect information on R&D about each of the Nation s 36 federally funded research and development centers (FFRDCs). Of these 36 FFRDCs, 16 are administered by academic institutions, 16 are administered by nonprofit organizations, and 4 are administered by industrial organizations. However, data for those FFRDCs administered by nonprofit organizations and those administered by industrial organizations in FY 2001 are not included in this report. To qualify, an FFRDC must be engaged in basic or applied research, development, or management of R&D activities, and the results of these activities must be directly monitored by the Federal Government usually a single agency in a relationship expected to be maintained on a long-term basis. The center must be operated, managed, and administered by either a university or consortium of universities as an autonomous organization or as an identifiable separate operating unit of its parent institution. Finally, 70 percent or more of the center s financial support must be received from the Federal Government. Although the same survey form (NSF Form 411) is used to collect data from both academic institutions and FFRDCs, the resulting data are presented separately in this report. The survey population was reviewed prior to electronic transmission of the questionnaires to ensure that each institutional classification was accurate. Characteristics of the schools were reviewed before and during the course of the survey to determine if changes had occurred (i.e., in highest degree granted or in terms of school openings, closings, or mergers). FY 2001 SURVEY FRAME DESIGN The Academic R&D Survey is a census of the full population of eligible academic institutions. NSF has 3 also conducted a population review each year to ensure that all institutions that meet the inclusion criteria are surveyed. This review is based on the survey frame design developed in FY 1998: All S&E doctorate-granting institutions and all HBCUs are surveyed. All S&E master s and bachelor s degree-granting institutions that reported at least $150,000 in separately budgeted R&D expenditures in S&E in the previous fiscal year are surveyed. NSF contacted the master s and bachelor s degree-granting institutions that were in the population prior to the census coverage to determine if they met the $150,000 expenditure criterion. Institutions with a minimum of $150,000 were added or retained in the survey population. In FY 2001, NSF conducted a population review using the above criteria. As a result of adding and deleting institutions from the survey population to comply with the inclusion criteria, the overall number of institutions surveyed decreased from 623 in FY 2000 to 609 in FY SURVEY INSTRUMENT Most major R&D performers have incorporated into their record-keeping systems the data that are essential to complete this survey, thereby ensuring a consistent format from one year to the next. Such consistency yields the most useful statistics for time series. As a rule, information to complete this questionnaire is found within the institutions year-end accounting records. The survey questionnaire consists of five main items: Item 1 is a request that institutions report their total current expenditures for separately budgeted science and engineering R&D for all activities specifically organized to produce research outcomes and either commissioned by an agency external to the institution or separately budgeted by an organizational unit (i.e., research centers) within the institution, by source of funds. In addition, schools are asked to provide the percentage of the total and the percentage of the federally financed expenditures that are considered basic research. Also included are research funds for which an outside organization, educational or other, is a subrecipient. Care should be observed when interpreting data on source of funds; for example, industry R&D support is limited to grants and
13 contracts for R&D activities from profit-making organizations. Total industry funds excludes research funded through unrestricted accounts and from corporate foundations, endowments, and fellowships to students; those funds would be included in an institution s own funding totals. An increasing number of institutions have linkages with industry and foundations via subcontracts, thus complicating the identification of funding source. In addition, institutional policy may determine whether unrestricted State support is reported as State or as institutional funding. Item 1A, added in FY 1996, is a request for total and federally financed current fund expenditures for separately budgeted science and engineering R&D passed through the institution to higher education and other subrecipients. Item 1B, added in FY 2000, is a request for total and federally financed current fund expenditures for separately budgeted science and engineering R&D received by the institution as a subrecipient. Schools are asked to break out the source of these funds from higher education and other passthrough entities. Item 2 is a request for total and federally financed current fund expenditures for separately budgeted R&D activities by detailed S&E fields. In the FY 1997 questionnaire, a subfield of bioengineering/biomedical engineering was added under Engineering. When interpreting these data at the detailed discipline level, users should keep in mind that there is considerable interdisciplinary and multidisciplinary activity. Item 3 is a request for the portions of total and federally financed expenditures reported in items 1 and 2 that were used for the purchase of research equipment out of current funds. This portion includes all research equipment purchased under sponsored research project awards and disbursed in the same detailed disciplines as in item 2. These data are of special interest to Federal and institutional policy makers in determining current funding levels for scientific research instrumentation. ITEM 1A ANALYSIS Item 1A was completed by 89.5 percent of the respondents. The total R&D expenditures passed through to subrecipients, $1.6 billion, represented 6.0 percent of item 1A respondents total R&D expenditures and 5.0 percent of all separately budgeted R&D in FY 2001 (table 1). The doctorate-granting institutions reported a higher percentage of passthrough funds than the nondoctorategranting institutions. Item 1A respondents from doctorate-granting institutions reported that $1.6 billion (6.1 percent) of their total R&D expenditures were passed through to subrecipients, versus $17 million (4.1 percent) of item 1A nondoctorate-granting respondents. Item 1A respondents from private institutions reported a higher percentage (7.1 percent) of passthrough funds than those from public institutions (5.5 percent). Respondents to this question reported $1.4 billion in Federal R&D funds passed through to subrecipients. This amount represented 8.7 percent of the Federal support reported by item 1A respondents and 7.2 percent of the $19 billion in total Federal support (table 2). Table A-6 shows the total amount of R&D expenditures passed through to subrecipients for the 100 institutions reporting the highest amounts. Table A-7 shows the total amount of Federal R&D expenditures passed through to subrecipients for the 100 institutions reporting the highest amounts. 4
14 Table 1. FY 2001 item 1A summary of total academic R&D expenditures Total R&D expenditures passed through to subrecipients Highest degree and control All respondents' total R&D 1 Item 1A respondents' total R&D 2 Total 3 Educational subrecipients Other subrecipients All academic institutions... 32,570,113 26,903,690 1,626, , ,516 Doctorate... 32,106,175 26,485,193 1,610, , ,515 Non-doctorate , ,497 16,970 8,672 8,001 Public... 22,245,928 17,318, , , ,705 Private... 10,324,185 9,584, , , ,811 1 This total is the amount prior to imputation for nonrespondents. 2 Item 1A measures the amount of R&D expenditures passed through the institution to subrecipients. 3 Detail may not sum to totals due to rounding and because some institutions provided only total and Federal R&D expenditure data passed through to subrecipients. SOURCE: National Science Foundation/Division of Science Resources Statistics, Survey of Research and Development Expenditures at Universities and Colleges, Fiscal Year 2001 Table 2. FY 2001 item 1A summary of Federal academic R&D expenditures Federal R&D expenditures passed through to subrecipients Highest degree and control All respondents' Federal R&D 1 Item 1A respondents' Federal R&D 2 Total 3 Educational subrecipients Other subrecipients All academic institutions... 19,077,450 15,869,304 1,379, , ,576 Doctorate... 18,786,515 15,605,164 1,365, , ,577 Non-doctorate , ,140 14,010 6,714 6,999 Public... 11,622,399 9,009, , , ,322 Private... 7,455,051 6,860, , , ,254 1 This total is the amount prior to imputation for nonrespondents. 2 Item 1A measures the amount of R&D expenditures passed through the institution to subrecipients. 3 Detail may not sum to totals due to rounding and because some institutions provided only total and Federal R&D expenditure data passed through to subrecipients. SOURCE: National Science Foundation/Division of Science Resources Statistics, Survey of Research and Development Expenditures at Universities and Colleges, Fiscal Year
15 ITEM 1B ANALYSIS Because this item is so closely related to item 1A, it will appear in these technical notes in much the same manner. In addition to the following summary and tables, NSF is including two ranking tables in the section A tables based on item 1B data. This item was completed by 87.8 percent of the respondents. The total R&D expenditures received as subrecipients, $1.8 billion, represented 6.9 percent of the item 1B respondents total R&D expenditures and 5.4 percent of all separately budgeted R&D in FY 2001 (table 3). The doctorate-granting institutions reported a lower percentage of funds received as subrecipients than the nondoctorate-granting institutions. Item 1B respondents from doctorate-granting institutions reported that $1.7 billion (6.9 percent) of their total R&D expenditures were received as subrecipients, versus $43 million (10.4 percent) of item 1B nondoctorate-granting respondents. Item 1B respondents from private institutions reported a slightly higher percentage (7.1 percent) of funds received as subrecipients than those from public institutions (6.8 percent). Respondents to this question reported $1.5 billion in Federal R&D funds received as subrecipients. This amount represented 10.1 percent of the Federal support reported by item 1B respondents and 7.9 percent of the $19 billion in total Federal support (table 4). Table A-8 shows the total amount of R&D expenditures received as subrecipients for the 100 institutions reporting the highest amounts. Table A-9 shows the total amount of Federal R&D expenditures received as subrecipients for the 100 institutions reporting the highest amounts. 6
16 Table 3. FY 2001 item 1B summary of total academic R&D expenditures Total R&D expenditures received as a subrecipient Highest degree and control All respondents' total R&D 1 Item 1B respondents' total R&D 2 Total 3 Higher education pass-through entities Other passthrough entities All academic institutions... 32,570,113 25,328,434 1,753, , ,344 Doctorate... 32,106,175 24,912,500 1,709, , ,929 Non-doctorate , ,934 43,206 16,791 26,415 Public... 22,245,928 16,418,956 1,118, , ,582 Private... 10,324,185 8,909, , , ,762 1 This total is the amount prior to imputation for nonrespondents. 2 Item 1B measures the amount of R&D expenditures received by the institution as a subrecipient. 3 Detail may not sum to totals due to rounding and because some institutions provided only total and Federal R&D expenditure data received as subrecipients. SOURCE: National Science Foundation/Division of Science Resources Statistics, Survey of Research and Development Expenditures at Universities and Colleges, Fiscal Year 2001 Table 4. FY 2001 item 1B summary of Federal academic R&D expenditures Federal R&D expenditures received as a subrecipient Highest degree and control All respondents' Federal R&D 1 Item 1B respondents' Federal R&D 2 Total 3 Higher education pass-through entities Other passthrough entities All academic institutions... 19,077,450 15,028,929 1,512, , ,854 Doctorate... 18,786,515 14,767,351 1,479, , ,915 Non-doctorate , ,578 33,760 12,821 20,939 Public... 11,622,399 8,625, , , ,659 Private... 7,455,051 6,402, , , ,195 1 This total is the amount prior to imputation for nonrespondents. 2 Item 1B measures the amount of R&D expenditures received by the institution as a subrecipient. 3 Detail may not sum to totals due to rounding and because some institutions provided only total and Federal R&D expenditure data received as subrecipients. SOURCE: National Science Foundation/Division of Science Resources Statistics, Survey of Research and Development Expenditures at Universities and Colleges, Fiscal Year
17 RESPONSE RATE The FY 2001 survey questionnaires were ed in November Respondents could choose to print and submit a pdf questionnaire from the Web or use a Web data collection system to respond to the survey. Every effort was made to maintain close contact with respondents in order to preserve both consistency and continuity in the resultant data. Questionnaires were carefully examined for completeness upon receipt. Computerized facsimiles of the survey data were then prepared for each institution, comparing the current and 2 prior years of data and noting any substantive disparities. A personalized message was sent to the respondents so they could provide revisions before final processing and tabulation of the data. The message included a Web link to the academic R&D expenditures Web-based data collection system, allowing respondents to view and correct their data via the Web. Respondents were asked to explain significant discrepancies between current and prior years reporting patterns previously verified as correct. They were encouraged to correct prior years data if anomalies were identified. When updated or amended figures covering past years were submitted, NSF changed trend data in this report and the underlying micro-data database correspondingly. Similarly, if a respondent institution underwent an organizational change, such as a merger, NSF incorporated the effects of such changes into prior years data. By the survey closing date at the beginning of October 2002, forms had been received from 580 universities and colleges out of the academic population of 609, resulting in a 95.2 percent response rate. Responses were received from 97.5 percent of all doctorate-granting institutions, where 98.4 percent of the estimated national R&D expenditures in S&E fields was disbursed. Also, forms were received from all of the 16 FFRDCs. Table A-1 displays a detailed breakdown of the response rates by highest degree granted. NATIONAL TOTAL AND IMPUTATION To provide a national estimate for all universities and colleges performing R&D in FY 2001, it was necessary to implement two statistical procedures. First, data were estimated by imputation for the 29 institutions that had not responded by the closing date of the survey, using imputation techniques that have been used consistently since FY Second, data were also imputed for universities and colleges that submitted only partial responses. The imputed total was $153 million, or 0.5 percent of the $33 billion total R&D expenditures, as shown in table A-2. Tables A-3a and A-3b present breakdowns of the total and Federal imputed amounts by S&E fields. The dollar amount imputed is displayed along with the percentage it represents of the national estimate for universities and colleges in a particular field. The amount imputed is similarly broken down by source of funds in table A-4. A number of surveyed institutions have responded only intermittently in past years, providing data one year, not responding for one or more subsequent years, and then providing data again. For the years in which no response was received, data have been imputed as previously described. Although the imputation algorithm accurately reflects national trends, it cannot account for specific trends at individual institutions. For this reason a separate backcasting of prior years data was performed, following current-year imputation. For each institution, formerly imputed key variables for items 1 through 3 were recomputed to ensure that the imputed data accurately represent the growth patterns shown by reported data. If data were reported for fiscal years 1996 and 2001 but not for the intervening years, for example, the difference between the reported figures for each item total was calculated and evenly distributed across the intervening years ( ). The new figures were spread across disciplines (items 2 and 3) or sources of support (item 1) on the basis of the most recent reporting pattern. A clean facsimile was generated for each of the institutions undergoing these procedures and returned to the school for comment. These procedures result in much more consistent reporting trends for individual institutions but have little effect upon aggregate figures reflecting national totals. CHANGES IN BASIC RESEARCH TOTALS The Division of Science Resources Statistics regularly reviews the methodologies used in its Survey of Research and Development Expenditures at Universities and Colleges with the goal of producing the 8
18 most accurate statistics possible for researchers and policy makers. A recent review of responses to the survey s item requesting the percentage of total and Federal research funds that are basic research 1 determined that the aggregate statistics could be improved by refining the imputation methodology for the item. For a number of reasons some universities and colleges are either unable or unwilling to respond to this item. Values must be imputed for them in order to present aggregate statistics. In the past, if a respondent did not reply to the basic research items, the prior year s basic research share (whether reported by or imputed for the respondent) was carried forward. Interviews with respondents revealed that in some cases abnormal or erroneous values (such as zero percent basic research) were imputed forward for several years. The revised imputation methodology carries forward the prior year s basic research share only if that year s data were reported or estimated by the respondent. In all other cases an econometric model is used to impute the amount of total and Federal basic research for the respondent. The model employed takes into account differences between public and private institutions and non-federal sources of R&D funding. Basic research statistics were reestimated for FY 1998 and forward. See table 5 for a summary of the changes the revised imputation methodology makes in the aggregate basic research totals, and tables B-2 and B-2a for the total and federally-financed basic research time series. DATA ANOMALIES Aggregate academic expenditure data are generally consistent from year to year, although data for individual institutions may vary considerably. Data anomalies may reflect true increases or decreases in expenditures or may Table 5. Academic basic research, before and after corrections and revised imputation methodology Basic research expenditures as percentage Expenditures of corresponding R&D expenditures Type of expenditure (in millions of dollars) (percent) Total R&D... 24,363 25,848 27,505 30, Federal R&D... 14,309 15,145 16,071 17, Non-Federal R&D... 10,054 10,703 11,434 12, Before corrections and revisions Total basic research... 16,593 17,445 18,931 20, Federal basic research... 10,310 10,915 11,865 12, Non-Federal basic research... 6,283 6,530 7,066 7, After corrections and revisions 2 Total basic research ,061 20,332 22, Federal basic research ,844 12,630 13, Non-Federal basic research ,217 7,702 8, Data in this category reflect basic research totals as reported in the Academic Research and Development Expenditures: Fiscal Year 2000 report. 2 Differences between data in this category and data in the previous category are the result of both respondent corrections to priorreported data as well as the implementation of a revised imputation methodology for the basic research items. KEY: R&D = Research and development; - = Not applicable. NOTES: Total R&D figures reflect respondent corrections from the 2001 survey cycle and therefore differ slightly from the figures published in the Academic Research and Development Expenditures: Fiscal Year 2000 report. SOURCE: National Science Foundation/Division of Science Resources Statistics, Survey of Academic Research and Development 1 Basic research is defined on the survey as research directed toward an increase of knowledge; it is research where the primary aim of the investigator is a fuller knowledge or understanding of the subject under study rather than a specific application thereof. 9
19 be the result of changes in reporting methodology. None were reported in FY STATE TABLES The detailed statistical tables showing R&D expenditures at individual institutions by State provide detailed campus listings by control and source of funds in table B-29 and by control and science and engineering field in table B-31. HIGHEST DEGREE-GRANTED TABLES Several longitudinal tables display data for institutions whose highest S&E degree granted is at the doctoral level. In tables produced prior to FY 1992, it would have been difficult to identify whether changes in yearly R&D expenditures were caused by changes in expenditure levels or in the number of doctorate-granting institutions. In order to maintain a consistent group of institutions across all years, the highest degree-granted status for each institution is based on the highest degree granted in the most recent year, FY DATA AVAILABILITY Data from this survey and previous reports are available on the World Wide Web at sbe/srs/rdexp/. Selected data items for institutions are available on the Web at start.htm. The institutional profiles cover data from this survey as well as data collected in NSF s other academic S&E surveys: the Survey of Graduate Students and Postdoctorates in Science and Engineering (graduate student survey) and the Survey of Federal Science and Engineering Support to Universities, Colleges, and Nonprofit Institutions (Federal S&E support survey). The profiles are also linked to the corresponding ranking table of each survey. Data for these and other surveys are available through the Web-Based Computer-Aided Science Policy Analysis and Research (WebCASPAR) database system, which provides an extensive and growing data library with multiyear statistics on the state of higher education in general and on academic S&E resources specifically. This data library is based on a set of standard institutional and field-of-science definitions across the multiple sources used to develop the database. The WebCASPAR program includes built-in help capabilities to facilitate the use and interpretation of the data. The latest version of WebCASPAR can be accessed via the Web at WebCASPAR data are drawn from a number of sources. All data are available for individual institutions, by State, and at the national level. Longitudinal data from surveys of universities and colleges conducted by the NSF Division of Science Resources Statistics include the academic R&D expenditures survey, the Federal S&E support survey, and the graduate student survey. Data from the surveys of universities and colleges conducted by the National Center for Education Statistics include earned degrees, opening fall enrollment, tuition, faculty salaries, tenure and fringe benefits, and financial statistics. 10
20 SECTION A. TABLES
21
22 SECTION A TABLES Table A-1. A-2. A-3a. A-3b. A-4. A-5. A-6. A-7. A-8. A-9. Response rates for the academic research and development expenditures survey, by respondent type and highest degree granted: fiscal year Imputed amounts for total research and development expenditures at universities and colleges, by highest degree granted: fiscal year Imputed amounts for total research and development expenditures at universities and colleges, by science and engineering field: fiscal year Imputed amounts for federally financed research and development expenditures at universities and colleges, by science and engineering field: fiscal year Imputed amounts for research and development expenditures at universities and colleges, by source of funds: fiscal year Number of surveyed institutions for the academic research and development expenditures survey, by respondent type and highest degree granted: fiscal years Total amount of R&D expenditures passed through to subrecipients by universities and colleges, ranked by amount passed through: fiscal year Total amount of Federal R&D expenditures passed through to subrecipients by universities and colleges, ranked by amount passed through: fiscal year Total amount of R&D expenditures received as a subrecipient by universities and colleges, ranked by amount received: fiscal year Total amount of Federal R&D expenditures received as a subrecipient by universities and colleges, ranked by amount received: fiscal year Page 13
23
24 Table A-1. Response rates for the academic research and development expenditures survey, by respondent type and highest degree granted: fiscal year 2001 Number in Number of Number of Total Response Respondent type and highest degree granted survey complete partial number of rate universe responses responses responses Total Universities and colleges Doctorate Master s Bachelor s and below Academically-administered FFRDCS SOURCE: National Science Foundation/Division of Science Resources Statistics, Survey of Research and Development Expenditures at Universities and Colleges, Fiscal Year
25 Table A-2. Imputed amounts for total research and development expenditures at universities and colleges, by highest degree granted: fiscal year 2001 [Dollars in millions] Total Imputed amount Highest degree granted separately Imputed amount as percent budgeted R&D of total expenditures Total... 32, Doctorate granting institutions... 32, Non-doctorate granting institutions NOTE: Because of rounding, detail may not add to totals. SOURCE: National Science Foundation/Division of Science Resources Statistics, Survey of Research and Development Expenditures at Universities and Colleges, Fiscal Year
26 Table A-3a. Imputed amounts for total research and development expenditures at universities and colleges, by science and engineering field: fiscal year 2001 [Dollars in millions] Total Imputed amount Science and engineering field separately Imputed amount as percent budgeted R&D of total expenditures Total... 32, Engineering... 5, Aeronautical and astronautical Bioengineering/biomedical Chemical Civil Electrical... 1, Mechanical Metallurgical and materials Other, n.e.c.... 1, Physical sciences... 2, Astronomy Chemistry... 1, Physics... 1, Other, n.e.c Environmental sciences... 1, Atmospheric Earth sciences Oceanography Other, n.e.c Mathematical sciences Computer sciences Life sciences... 19, Agricultural sciences... 2, Biological sciences... 5, Medical sciences... 10, Other, n.e.c Psychology Social sciences... 1, Economics Political science Sociology Other, n.e.c Other sciences, n.e.c KEY: n.e.c. = not elsewhere classified NOTES: The imputation rate at the total level is lower than the imputation rates at the S&E field levels because many institutions could provide totals but not the S&E field details. Because of rounding, detail may not add to totals. SOURCE: National Science Foundation/Division of Science Resources Statistics, Survey of Research and Development Expenditures at Universities and Colleges, Fiscal Year
27 Table A-3b. Imputed amounts for federally financed research and development expenditures at universities and colleges, by science and engineering field: fiscal year 2001 [Dollars in millions] Total Imputed amount Science and engineering field separately Imputed amount as percent budgeted R&D of total expenditures Total... 19, Engineering... 2, Aeronautical and astronautical Bioengineering/biomedical Chemical Civil Electrical Mechanical Metallurgical and materials Other, n.e.c Physical sciences... 1, Astronomy Chemistry Physics Other, n.e.c Environmental sciences... 1, Atmospheric Earth sciences Oceanography Other, n.e.c Mathematical sciences Computer sciences Life sciences... 11, Agricultural sciences Biological sciences... 3, Medical sciences... 6, Other, n.e.c Psychology Social sciences Economics Political science Sociology Other, n.e.c Other sciences, n.e.c KEY: n.e.c. = not elsewhere classified NOTES: The imputation rate at the total level is lower than the imputation rates at the S&E field levels because many institutions could provide totals but not the S&E field details. Because of rounding, detail may not add to totals. SOURCE: National Science Foundation/Division of Science Resources Statistics, Survey of Research and Development Expenditures at Universities and Colleges, Fiscal Year
28 Table A-4. Imputed amounts for research and development expenditures at universities and colleges, by source of funds: fiscal year 2001 [Dollars in millions] Total Imputed amount Source of funds separately Imputed amount as percent budgeted R&D of total expenditures Total... 32, Federal Government... 19, State and local government... 2, Industry... 2, Institutional funds... 6, All other sources... 2, NOTE: Because of rounding, detail may not add to totals. SOURCE: National Science Foundation/Division of Science Resources Statistics, Survey of Research and Development Expenditures at Universities and Colleges, Fiscal Year
29 Table A-5. Number of surveyed institutions for the academic research and development expenditures survey, by respondent type and highest degree granted: fiscal years Respondent type and highest degree granted FY 1996 FY 1997 FY 1998 FY 1999 FY 2000 FY 2001 Total Universities and colleges Doctorate Master s Bachelor s and below Academically-administered FFRDCS SOURCE: National Science Foundation/Division of Science Resources Statistics, Survey of Research and Development Expenditures at Universities and Colleges, Fiscal Year
30 Table A-6. Total amount of R&D expenditures passed through to subrecipients by universities and colleges, ranked by amount passed through: fiscal year 2001 Page 1 of 3 Amounts passed through Institutions ranked by total amount of R&D expenditures passed Total R&D Total R&D through1 expenditures expenditures passed through Educational Other subrecipients subrecipients Total, all institutions... 32,723,078 1,626, , ,516 1 Stanford University ,906 53, Duke University ,133 46,880 24,716 22,164 3 Harvard University ,107 44,898 14,534 30,364 4 Columbia U in City of NY ,497 41,382 23,174 18,208 5 University of Colorado ,472 39,628 13,607 26,021 6 U of Southern California ,597 37,614 20,458 17,156 7 U of MD at College Park ,383 37, ,357 8 U of Pennsylvania ,852 33,620 21,428 12,192 9 California Inst of Tech ,085 32,031 32, University of Michigan ,523 28,633 19,754 8,879 Total, 1st 10 institutions... 3,843, , , , University of Minnesota ,011 28, University of Arizona ,128 28,460 16,118 12, U of NC Chapel Hill ,576 28,237 11,637 16, U of WI-Madison ,143 27,638 18,487 9, U of IL Urbana-Champaign ,863 26,078 22,146 3, Ohio State University ,652 24,199 7,577 16, Baylor Col of Medicine ,461 23,984 20,072 3, Yale University ,514 23, Northwestern University ,933 23, University of Pittsburgh ,792 20,949 11,313 9,636 Total, 1st 20 institutions... 7,671, , , , MA Institute of Tech ,495 19,880 9,702 10, UT Houston Hlth Sci Ctr ,439 18,334 11,048 7, Cornell University ,828 17, Georgia Institute of Tech ,533 17, Washington University ,642 16,898 11,289 5, University of Chicago ,125 16,427 11,898 4, U of Alabama Birmingham ,702 16, U Mississippi, All Camp... 39,552 15,192 10,410 4, University of Florida ,312 14,651 13,186 1, NC State University ,259 13,529 7,076 6,453 Total, 1st 30 institutions... 10,513, , , , Purdue University ,917 13,104 9,187 3, Carnegie Mellon U ,882 12,703 6,589 6, U of South Florida ,550 12, New Mexico State Univ... 86,963 12,644 2,166 10, University of Rochester ,261 12,452 6,213 6, George Washington U... 73,805 12,315 12, Boston University ,031 11,189 6,743 4, U TX SW Med Ctr at Dallas ,376 10,984 1,609 9, University of Miami ,772 10,982 4,723 6, University of Utah ,597 10,940 6,017 4,923 Total, 1st 40 institutions... 12,225, , , ,589 21
31 Table A-6. Total amount of R&D expenditures passed through to subrecipients by universities and colleges, ranked by amount passed through: fiscal year 2001 Page 2 of 3 Amounts passed through Institutions ranked by total amount of R&D expenditures passed Total R&D Total R&D through1 expenditures expenditures passed through Educational Other subrecipients subrecipients 41 Mt Sinai Sch Med ,946 10,879 10, Emory University ,997 10,827 8,110 2, Rutgers the State U NJ ,793 10,749 7,479 3, Case Western Reserve U ,253 10,580 10, Vanderbilt University ,504 10,576 8,221 2, Indiana University ,899 10,543 4,993 5, Louisiana State U System ,911 10,511 4,741 5, University of Oklahoma ,695 10,391 2,037 8, U of New Hampshire... 87,879 10, Mississippi State U ,939 10,240 8,431 1,809 Total, 1st 50 institutions... 14,173,485 1,041, , , U of Iowa ,348 10, U TX at Austin ,104 10,069 5,233 4, VA Polytech Inst & St U ,323 9,753 5,822 3, Michigan State University ,946 9,739 7,343 2, University of Georgia ,298 9, U of IL Chicago ,098 9,210 4,855 4, University of Virginia ,547 9,091 5,287 3, Oregon State University ,925 8,976 6,094 2, U of Alaska Fairbanks ,195 8, Princeton University ,411 8,647 5,633 3,014 Total, 1st 60 institutions... 16,274,680 1,135, , , Wake Forest University... 98,343 8, New York University ,722 8,456 5,953 2, U TX MD Anderson Cncr Ctr ,746 8,408 5,899 2, Oregon Health & Science U ,785 8,262 3,438 4, University of Cincinnati ,895 7,874 3,730 4, University of Kentucky ,721 7,867 7, Dartmouth College ,096 7,808 4,018 3, Arizona State University ,763 7,739 3,202 4, Auburn University ,347 7,739 5,372 2, University of Kansas ,467 7,736 5,094 2,642 Total, 1st 70 institutions... 17,808,565 1,216, , , SUNY at Stony Brook ,487 7, University of Louisville... 72,857 7,558 4,534 3, Eastern VA Med School... 26,250 7,551 2,341 5, Florida State University ,817 7,355 2,678 4, NJ Inst of Technology... 44,177 7,277 7, Yeshiva University ,230 7,232 7, University of Connecticut ,366 6,921 4,501 2, U TX Hlth Sci Ctr San Ant ,154 6, , U of Nebraska at Lincoln ,520 6,535 4,476 2, U Med & Dent of NJ ,417 6,449 6,449 0 Total, 1st 80 institutions... 18,981,840 1,287, , ,402 22
32 Table A-6. Total amount of R&D expenditures passed through to subrecipients by universities and colleges, ranked by amount passed through: fiscal year 2001 Page 3 of 3 Amounts passed through Institutions ranked by total amount of R&D expenditures passed Total R&D Total R&D through1 expenditures expenditures passed through Educational Other subrecipients subrecipients 81 Drexel University... 27,698 6, U of Nevada Las Vegas... 27,008 6, University of Alabama, The... 33,133 6,325 5,140 1, University of New Mexico ,619 6,210 5,154 1, SUNY Hlth Sci Ctr Brklyn... 31,626e 5,973e 5,973e 0e 86 Med U of South Carolina ,687 5,905 1,603 4, University of Dayton... 41,343 5, , Wayne State University ,984 5,726 2,947 2, U of Missouri Columbia ,782 5,601 2,912 2, SUNY at Buffalo ,829 5,540 4,483 1,057 Total, 1st 90 institutions... 19,953,549 1,346, , , Montana St U Bozeman... 69,593 5, Washington State U ,937 5,473 3,576 1, Brown University... 91,636 5, Rice University... 42,675 5,204 4, Tulane University... 99,761 5,178 3,583 1, U MA Worcester ,221 5,134 5, S Illinois U Carbondale... 43,207 5,107 1,383 3, San Diego St University... 58,332 5,059 2,739 2, Florida International U... 44,291 4, , U TX at El Paso... 21,889 4,683 2,642 2,041 Total, 1st 100 institutions... 20,644,091 1,398, , ,758 Total, all other sampled institutions... 12,078, , ,553 76,758 1 Only the top 100 institutions that reported the largest amount of passed through funds are shown in this table. KEY: -- = not available e = estimated NOTE: Because of rounding, detail may not add to totals. SOURCE: National Science Foundation/Division of Science Resources Statistics, Survey of Research and Development Expenditures at Universities and Colleges, Fiscal Year
33 Table A-7. Total amount of Federal R&D expenditures passed through to subrecipients by universities and colleges, ranked by amount passed through: fiscal year 2001 Page 1 of 3 Institutions ranked by total amount of R&D Federal expenditures Federal R&D Federal R&D passed through 1 expenditures expenditures Federal amounts passed through passed through Educational Other subrecipients subrecipients Total, all institutions... 19,190,873 1,379, , ,576 1 Stanford University ,468 51, Columbia U in City of NY ,928 40,758 22,824 17,934 3 University of Colorado ,643 38,440 13,213 25,227 4 Harvard University ,414 35,315 13,533 21,782 5 U of Southern California ,207 33,726 18,552 15,174 6 California Inst of Tech ,554 32,031 32, U of Pennsylvania ,996 28,202 16,010 12,192 8 U of NC Chapel Hill ,615 27,650 11,253 16,397 9 U of MD at College Park ,515 27, , University of Minnesota ,289 26, Total, 1st 10 institutions... 2,734, , , , U of WI-Madison ,009 24,900 16,931 7, University of Arizona ,484 24,481 13,974 10, Duke University ,109 23,490 23, University of Michigan ,117 23,403 16,122 7, Baylor Col of Medicine ,394 23,283 19,548 3, U of IL Urbana-Champaign ,316 22,785 19,123 3, Yale University ,702 20, University of Pittsburgh ,571 18,345 9,356 8, Ohio State University ,092 18,301 6,618 11, Northwestern University ,129 17, Total, 1st 20 institutions... 5,120, , , , UT Houston Hlth Sci Ctr... 88,545 17,047 9,899 7, Cornell University ,466 16, MA Institute of Tech ,319 15,506 8,011 7, U of Alabama Birmingham ,625 15, Washington University ,928 15,333 10,833 4, University of Chicago ,566 15,220 10,858 4, U Mississippi, All Camp... 30,108 15,192 10,410 4, Carnegie Mellon U... 97,463 12,037 6,344 5, University of Florida ,744 11,971 10,774 1, New Mexico State Univ... 61,124 11,797 2,076 9,721 Total, 1st 30 institutions... 6,717, , , , Boston University ,771 11,189 6,743 4, U TX SW Med Ctr at Dallas ,820 10,984 1,609 9, Mt Sinai Sch Med ,344 10,879 10, University of Utah ,253 10,798 5,939 4, Purdue University... 98,151 10,741 8,589 2, George Washington U... 51,757 10,678 10, Emory University ,317 10,396 7,897 2, University of Oklahoma... 60,264 10,391 2,037 8, Mississippi State U... 65,493 10,151 8,378 1, Case Western Reserve U ,852 10,114 10,114 0 Total, 1st 40 institutions... 7,841, , , ,469 24
34 Table A-7. Total amount of Federal R&D expenditures passed through to subrecipients by universities and colleges, ranked by amount passed through: fiscal year 2001 Page 2 of 3 Institutions ranked by total amount of R&D Federal expenditures Federal R&D Federal R&D passed through 1 expenditures expenditures Federal amounts passed through passed through Educational Other subrecipients subrecipients 41 Rutgers the State U NJ... 77,156 9,816 6,546 3, U of South Florida... 58,826 9, U of New Hampshire... 45,223 9, Vanderbilt University ,230 9,129 7,517 1, Louisiana State U System... 94,625 9,097 3,747 5, Indiana University ,781 8,993 4,330 4, U of Iowa ,249 8, Michigan State University ,359 8,601 7,179 1, U TX MD Anderson Cncr Ctr... 94,053 8,408 5,899 2, New York University ,897 8,256 5,941 2,315 Total, 1st 50 institutions... 8,871, , , , VA Polytech Inst & St U... 77,384 8,201 5,601 2, University of Rochester ,945 8,155 5,393 2, Wake Forest University... 78,021 8, University of Virginia ,868 8,043 4,826 3, NC State University... 95,875 7,991 3,925 4, University of Cincinnati ,049 7,857 3,722 4, University of Georgia... 66,913 7, Oregon Health & Science U ,671 7,663 3,160 4, U TX at Austin ,184 7,519 4,610 2, U of Alaska Fairbanks... 55,287 7, Total, 1st 60 institutions... 9,970, , , , Auburn University... 40,097 7,343 5,105 2, Yeshiva University ,800 7,232 7, Arizona State University... 56,616 7,109 3,083 4, Dartmouth College... 69,844 6,898 3,812 3, SUNY at Stony Brook... 93,265 6, U TX Hlth Sci Ctr San Ant... 71,153 6, , U of Nebraska at Lincoln... 43,877 6,524 4,468 2, University of Miami ,803 6,467 3,304 3, University of Kansas... 74,494 6,457 4,451 2, U Med & Dent of NJ... 86,054 6,449 6,449 0 Total, 1st 70 institutions... 10,725,061 1,047, , , Florida State University... 57,075 6,428 2,556 3, Princeton University... 78,620 6,343 4,754 1, Drexel University... 20,159 6, University of Kentucky... 86,239 6,010 6, U of Nevada Las Vegas... 15,681 5, University of Connecticut... 70,013 5,991 4,209 1, University of New Mexico ,505 5,943 5, SUNY Hlth Sci Ctr Brklyn... 22,860e 5,896e 5,896e 0e 79 U of IL Chicago ,109 5,707 3,614 2, University of Dayton... 34,102 5, ,920 Total, 1st 80 institutions... 11,344,424 1,108, , ,515 25
35 Table A-7. Total amount of Federal R&D expenditures passed through to subrecipients by universities and colleges, ranked by amount passed through: fiscal year 2001 Page 3 of 3 Institutions ranked by total amount of R&D Federal expenditures Federal R&D Federal R&D passed through 1 expenditures expenditures Federal amounts passed through passed through Educational Other subrecipients subrecipients 81 Med U of South Carolina... 60,543 5,630 1,603 4, Oregon State University... 84,854 5,572 3,358 2, U of Missouri Columbia... 68,435 5,070 2,636 2, Rice University... 35,682 5,068 4, Wayne State University... 79,448 5,008 2,754 2, U MA Worcester... 79,453 4,968 4, University of Alabama, The... 22,183 4,961 4, Brown University... 58,367 4, SUNY at Buffalo... 96,595 4,897 3, Tulane University... 55,669 4,767 3,559 1,208 Total, 1st 90 institutions... 11,985,653 1,159, , , Montana St U Bozeman... 34,857 4, Rockefeller U, The... 55,362 4,480 4, NJ Inst of Technology... 18,530 4,468 4, U TX at El Paso... 16,167 4,385 2,642 1, U TX Med Br at Galveston... 64,682 4,322 2,915 1, Washington State U... 48,660 4,305 2,708 1, NM Inst Mining & Tech... 13,255 4, , Rush University... 37,301 4,134 4, West Virginia University... 29,440 3,931 1,889 2, U MD Biotechnology Inst... 11,053 3,930 3, Total, 1st 100 institutions... 12,314,960 1,201, , ,885 Total, all other sampled institutions... 6,875, , ,372 61,691 1 Only the top 100 institutions that reported the largest amount of passed through funds are shown in this table. KEY: -- = not available e = estimated NOTE: Because of rounding, detail may not add to totals. SOURCE: National Science Foundation/Division of Science Resources Statistics, Survey of Research and Development Expenditures at Universities and Colleges, Fiscal Year
36 Table A-8. Total amount of R&D expenditures received as a subrecipient by universities and colleges, ranked by amount received: fiscal year 2001 Page 1 of 3 Total R&D Institutions ranked by total amount Total R&D expenditures of R&D expenditures received1 expenditures received as a subrecipient Total, all institutions... 32,723,078 1,753,204 1 Texas A&M University ,041 61,139 2 MA Institute of Tech ,495 54,303 3 University of Michigan ,523 48,162 4 Stanford University ,906 47,201 5 Ohio State University ,652 40,559 6 U of WI-Madison ,143 34,688 7 U of Southern California ,597 32,482 8 University of Colorado ,472 31,270 9 Harvard University ,107 31, Columbia U in City of NY ,497 30,439 Total, 1st 10 institutions... 4,353, , U TX at Austin ,104 30, U of IL Urbana-Champaign ,863 28, Georgia Institute of Tech ,533 28, Rutgers the State U NJ ,793 26, California Inst of Tech ,085 26, Cornell University ,828 26, University of Minnesota ,011 26, Washington University ,642 23, University of Pittsburgh ,792 22, Mt Sinai Sch Med ,946 22,000 Total, 1st 20 institutions... 7,636, , University of Arizona ,128 21, U of South Carolina ,973 19, Northwestern University ,933 19, University of Florida ,312 19, U of Alaska Fairbanks ,195 19, University of New Mexico ,619 18, University of Rochester ,261 18, U of Alabama Birmingham ,702 17, Florida State University ,817 16, Yale University ,514 16,163 Total, 1st 30 institutions... 9,898, , University of Utah ,597 15, Duke University ,133 15, U of NC Chapel Hill ,576 15, University of Chicago ,125 15, University of Kentucky ,721 14, Arizona State University ,763 14, VA Polytech Inst & St U ,323 13, New York University ,722 13, Auburn University ,347 13, Carnegie Mellon U ,882 13,259 Total, 1st 40 institutions... 11,957,673 1,005,813 27
37 Table A-8. Total amount of R&D expenditures received as a subrecipient by universities and colleges, ranked by amount received: fiscal year 2001 Page 2 of 3 Total R&D Institutions ranked by total amount Total R&D expenditures of R&D expenditures received1 expenditures received as a subrecipient 41 Boston University ,031 12, U of IL Chicago ,098 12, Case Western Reserve U ,253 12, Indiana University ,899 12, Michigan State University ,946 11, Tulane University... 99,761 11, Baylor Col of Medicine ,461 11, Louisiana State U System ,911 10, Vanderbilt University ,504 10, U of Nebraska at Lincoln ,520 10,596 Total, 1st 50 institutions... 14,181,057 1,123, Oregon State University ,925 10, Montana St U Bozeman... 69,593 10, University of Connecticut ,366 9, U of Nevada Reno... 59,229 9, U of MD at College Park ,383 9, Mississippi State U ,939 8, Emory University ,997 8, U of Missouri Columbia ,782 8, SUNY at Stony Brook ,487 8, U TX MD Anderson Cncr Ctr ,746 8,200 Total, 1st 60 institutions... 15,835,504 1,215, U of Maine... 64,070 8, University of Cincinnati ,895 8, University of Delaware... 77,491 7, Temple University... 60,182 7, University of Kansas ,467 7, Catholic U of America... 17,539 7, Wayne State University ,984 7, Oregon Health & Science U ,785 7, New Mexico State Univ... 86,963 7, U Southern Mississippi... 20,286 7,220 Total, 1st 70 institutions... 16,824,166 1,293, U TX Hlth Sci Ctr San Ant ,154 7, University of Miami ,772 7, UT Houston Hlth Sci Ctr ,439 7, U of Alabama Huntsville... 43,731 6, Oklahoma State University... 90,311 6, Rice University... 42,675 6, MCP Hahnemann University... 32,462 6, Rush University... 70,219 6, Brown University... 91,636 6, U of Central Florida... 79,287 6,100 Total, 1st 80 institutions... 17,668,852 1,360,361 28
38 Table A-8. Total amount of R&D expenditures received as a subrecipient by universities and colleges, ranked by amount received: fiscal year 2001 Page 3 of 3 Total R&D Institutions ranked by total amount Total R&D expenditures of R&D expenditures received1 expenditures received as a subrecipient 81 Rockefeller U, The ,571 6, University of Alabama, The... 33,133 5, Syracuse University... 42,476 5, U of New Hampshire... 87,879 5, Portland State University... 16,838 5, Desert Research Institute... 29,697 5, Dartmouth College ,096 5, Woods Hole Oceanogr Inst... 91,029 5, NM Inst Mining & Tech... 28,392 5, Jackson State University... 25,663 5,505 Total, 1st 90 institutions... 18,278,626 1,418, Howard University... 30,148 5, Washington State U ,937 5, University of Oklahoma ,695 5, George Washington U... 73,805 5, University of Georgia ,298 5, Rensselaer Polytech Inst... 45,010 5, University of Louisville... 72,857 5, Tufts University ,806 5, Med U of South Carolina ,687 5, Thomas Jefferson U... 88,936 5,036 Total, 1st 100 institutions... 19,340,805 1,471,546 Total, all other sampled institutions... 13,382, ,658 1 Only the top 100 institutions that reported the largest amount of R&D expenditures received as a subrecipient are shown in this table. SOURCE: National Science Foundation/Division of Science Resources Statistics, Survey of Research and Development Expenditures at Universities and Colleges, Fiscal Year
39 Table A-9. Total amount of Federal R&D expenditures received as a subrecipient by universities and colleges, ranked by amount received: fiscal year 2001 Page 1 of 3 Institutions ranked by total amount Federal R&D of Federal R&D expenditures Federal R&D expenditures received 1 expenditures received as a subrecipient Total, all institutions... 19,190,873 1,512,911 1 Texas A&M University ,382 60,366 2 MA Institute of Tech ,319 54,303 3 University of Michigan ,117 45,419 4 Stanford University ,468 41,490 5 U of WI-Madison ,009 34,688 6 University of Colorado ,643 31,152 7 U TX at Austin ,184 30,047 8 Harvard University ,414 29,509 9 Columbia U in City of NY ,928 29, U of IL Urbana-Champaign ,316 26,671 Total, 1st 10 institutions... 2,855, , California Inst of Tech ,554 26, Cornell University ,466 25, Rutgers the State U NJ... 77,156 24, University of Minnesota ,289 23, Washington University ,928 22, U of Southern California ,207 22, Mt Sinai Sch Med ,344 22, University of Arizona ,484 21, University of Pittsburgh ,571 20, U of South Carolina... 51,983 19,847 Total, 1st 20 institutions... 4,791, , University of New Mexico ,505 18, U of Alabama Birmingham ,625 17, Northwestern University ,129 16, Florida State University... 57,075 16, University of Rochester ,945 16, Yale University ,702 16, University of Florida ,744 15, University of Utah ,253 15, University of Chicago ,566 15, University of Kentucky... 86,239 14,483 Total, 1st 30 institutions... 6,237, , VA Polytech Inst & St U... 77,384 13, U of NC Chapel Hill ,615 13, Auburn University... 40,097 13, Arizona State University... 56,616 13, Carnegie Mellon U... 97,463 13, Boston University ,771 12, U of IL Chicago ,109 12, Case Western Reserve U ,852 12, Tulane University... 55,669 11, Baylor Col of Medicine ,394 11,260 Total, 1st 40 institutions... 7,455, ,632 30
40 Table A-9. Total amount of Federal R&D expenditures received as a subrecipient by universities and colleges, ranked by amount received: fiscal year 2001 Page 2 of 3 Institutions ranked by total amount Federal R&D of Federal R&D expenditures Federal R&D expenditures received 1 expenditures received as a subrecipient 41 New York University ,897 10, Vanderbilt University ,230 10, U of Nebraska at Lincoln... 43,877 10, Oregon State University... 84,854 10, Michigan State University ,359 10, Indiana University ,781 9, University of Connecticut... 70,013 9, U of Nevada Reno... 31,386 9, Montana St U Bozeman... 34,857 8, Mississippi State U... 65,493 8,715 Total, 1st 50 institutions... 8,291,262 1,003, U of Missouri Columbia... 68,435 8, SUNY at Stony Brook... 93,265 8, U TX MD Anderson Cncr Ctr... 94,053 8, University of Delaware... 41,830 7, Emory University ,317 7, University of Kansas... 74,494 7, University of Cincinnati ,049 7, Catholic U of America... 13,308 7, Wayne State University... 79,448 7, New Mexico State Univ... 61,124 7,332 Total, 1st 60 institutions... 9,115,585 1,082, Oregon Health & Science U ,671 7, UT Houston Hlth Sci Ctr... 88,545 7, U Southern Mississippi... 18,061 6, Rice University... 35,682 6, U of Alabama Huntsville... 30,625 6, U TX Hlth Sci Ctr San Ant... 71,153 6, MCP Hahnemann University... 22,944 6, University of Miami ,803 6, Rush University... 37,301 6, Oklahoma State University... 25,636 6,411 Total, 1st 70 institutions... 9,669,006 1,150, Brown University... 58,367 6, U of Central Florida... 22,342 6, University of Alabama, The... 22,183 5, Dartmouth College... 69,844 5, Portland State University... 11,341 5, Woods Hole Oceanogr Inst... 75,670 5, NM Inst Mining & Tech... 13,255 5, Jackson State University... 22,750 5, University of Georgia... 66,913 5, Desert Research Institute... 22,018 5,382 Total, 1st 80 institutions... 10,053,689 1,207,655 31
41 Table A-9. Total amount of Federal R&D expenditures received as a subrecipient by universities and colleges, ranked by amount received: fiscal year 2001 Page 3 of 3 Institutions ranked by total amount Federal R&D of Federal R&D expenditures Federal R&D expenditures received 1 expenditures received as a subrecipient 81 University of Louisville... 25,116 5, Med U of South Carolina... 60,543 5, Tufts University... 71,669 5, U TX at El Paso... 16,167 4, Temple University... 41,643 4, Howard University... 27,848 4, George Mason University... 25,992 4, Thomas Jefferson U... 64,881 4, University of Idaho... 26,548 4, Kansas State University... 33,998 4,764 Total, 1st 90 institutions... 10,448,094 1,257, Michigan Tech University... 17,620 4, Wake Forest University... 78,021 4, U TX at Arlington... 9,413 4, West Virginia University... 29,440 4, Washington State U... 48,660 4, U of Missouri Rolla... 11,929 4, U of MA Amherst... 49,576 4, New York Medical College... 18,344 4, U of MD at College Park ,515 4, U of Arkansas Main... 23,172 4,012 Total, 1st 100 institutions... 10,879,784 1,300,699 Total, all other sampled institutions... 8,311, ,212 1 Only the top 100 institutions that reported the largest amount of R&D expenditures received as a subrecipient are shown in this table. SOURCE: National Science Foundation/Division of Science Resources Statistics, Survey of Research and Development Expenditures at Universities and Colleges, Fiscal Year
42 SECTION B. DETAILED STATISTICAL TABLES
43 Note To obtain accurate historical data, use only the latest detailed statistical tables for FY 2001 and not data published earlier. Institutions revise prior years data when important changes occur in reporting practices and program classifications, and only the latest tables incorporate such changes. 34
44 SECTION B. DETAILED STATISTICAL TABLES Table Page UNIVERSITIES AND COLLEGES R&D Expenditures B-1. B-2. B-2a. R&D expenditures at universities and colleges, by source of funds: fiscal years R&D expenditures at universities and colleges, by character of work: fiscal years Federally financed R&D expenditures at universities and colleges, by character of work: fiscal years R&D Expenditures, by Source of Funds and Science & Engineering Field B-3. B-4. B-5. B-6. B-7. B-8. B-9. B-10. B-11. B-12. B-13. B-14. B-15. B-16. B-17. R&D expenditures at universities and colleges, by source of funds and science and engineering field: fiscal years Federally financed R&D expenditures at universities and colleges, by science and engineering field: fiscal years Non-Federal R&D expenditures at universities and colleges, by source of funds and science and engineering field: fiscal years R&D expenditures at doctorate-granting institutions, by source of funds and science and engineering field: fiscal years Federally financed R&D expenditures at doctorate-granting institutions, by science and engineering field: fiscal years Non-Federal R&D expenditures at doctorate-granting institutions, by source of funds and science and engineering field: fiscal years R&D expenditures at public universities and colleges, by source of funds and science and engineering field: fiscal years Federally financed R&D expenditures at public universities and colleges, by science and engineering field: fiscal years Non-Federal R&D expenditures at public universities and colleges, by source of funds and science and engineering field: fiscal years R&D expenditures at private universities and colleges, by source of funds and science and engineering field: fiscal years Federally financed R&D expenditures at private universities and colleges, by science and engineering field: fiscal years Non-Federal R&D expenditures at private universities and colleges, by source of funds and science and engineering field: fiscal years R&D expenditures at doctorate-granting institutions, by source of funds, science and engineering field, and control: fiscal years 1994, 2000, and Federally financed R&D expenditures at doctorate-granting institutions, by science and engineering field and control: fiscal years 1994, 2000, and Non-Federal R&D expenditures at doctorate-granting institutions, by source of funds, science and engineering field, and control: fiscal years 1994, 2000, and
45 Table Page R&D Expenditures at Historically Black Colleges and Universities, by Source of Funds and Science & Engineering Field B-18. B-19. B-20. R&D expenditures at historically black colleges and universities, by source of funds and science and engineering field: fiscal years Federally financed R&D expenditures at historically black colleges and universities, by science and engineering field: fiscal years Non-Federal R&D expenditures at historically black colleges and universities, by source of funds and science and engineering field: fiscal years Geographic Distribution of R&D Expenditures B-21. B-22. B-23. B-24. B-25. B-26. B-27. B-28. B-29. B-30. B-31. R&D expenditures at universities and colleges, by geographic division and source of funds: fiscal year R&D expenditures at doctorate-granting institutions, by geographic division, State, and source of funds: fiscal year R&D expenditures at doctorate-granting institutions, by geographic division and State: fiscal years Federally financed R&D expenditures at doctorate-granting institutions, by geographic division and State: fiscal years State and local government-financed R&D expenditures at doctorate-granting institutions, by geographic division and State: fiscal years Industry-financed R&D expenditures at doctorate-granting institutions, by geographic division and State: fiscal years Institutionally financed R&D expenditures at doctorate-granting institutions, by geographic division and State: fiscal years All other sources of financed R&D expenditures at doctorate-granting institutions, by geographic division and State: fiscal years R&D expenditures at universities and colleges, by State, control, and source of funds: fiscal year R&D expenditures at doctorate-granting institutions, by geographic division, State, and science and engineering field: fiscal year R&D expenditures at universities and colleges, by State, control, and science and engineering field: fiscal year R&D Expenditures, in Descending Order of Amounts, by Institution B-32. Total R&D expenditures at universities and colleges, ranked by fiscal year 2001 total R&D expenditures: fiscal years B-33. Federally financed R&D expenditures at universities and colleges, ranked by fiscal year 2001 federally financed R&D expenditures: fiscal years B-34. Non-Federal R&D expenditures at universities and colleges, ranked by fiscal year 2001 non-federal R&D expenditures: fiscal years
46 Table B-35. B-36. B-37. B-38. B-39. B-40. B-41. B-42. B-43. B-44. B-45. B-46. Page R&D expenditures at universities and colleges, by source of funds: fiscal year R&D expenditures at public universities and colleges, by source of funds: fiscal year R&D expenditures at private universities and colleges, by source of funds: fiscal year Industry-sponsored R&D expenditures at universities and colleges, ranked by fiscal year 2001 industry-sponsored R&D expenditures: fiscal years R&D expenditures at universities and colleges, by science and engineering field: fiscal year Federally financed R&D expenditures at universities and colleges, by science and engineering field: fiscal year Non-Federal R&D expenditures at universities and colleges, by science and engineering field: fiscal year R&D expenditures at public universities and colleges, by science and engineering field: fiscal year Federally financed R&D expenditures at public universities and colleges, by science and engineering field: fiscal year R&D expenditures at private universities and colleges, by science and engineering field: fiscal year Federally financed R&D expenditures at private universities and colleges, by science and engineering field: fiscal year Total and federally financed R&D expenditures at historically black colleges and universities, ranked by fiscal year 2001 total R&D expenditures: fiscal years R&D Expenditures, by Science & Engineering Field and Selected Subfields, in Descending Order of Amounts, by Institution B-47. B-48. B-49. B-50. B-51. B-52. Total and federally financed R&D expenditures in engineering at universities and colleges, ranked by fiscal year 2001 total R&D expenditures in engineering: fiscal years R&D expenditures in engineering subfields at universities and colleges: fiscal year Federally financed R&D expenditures in engineering subfields at universities and colleges: fiscal year R&D expenditures in the physical sciences at universities and colleges, ranked by fiscal year 2001 R&D expenditures in the physical sciences: fiscal years and by subfield for fiscal year Federally financed R&D expenditures in the physical sciences at universities and colleges, ranked by fiscal year 2001 federally financed R&D expenditures in the physical sciences: fiscal years and by subfield for fiscal year Total and federally financed R&D expenditures in chemistry at universities and colleges, ranked by fiscal year 2001 total R&D expenditures in chemistry: fiscal years
47 Table B-53. B-54. B-55. B-56. B-57. B-58. B-59. B-60. B-61. B-62. B-63. B-64. B-65. Page Total and federally financed R&D expenditures in physics at universities and colleges, ranked by fiscal year 2001 total R&D expenditures in physics: fiscal years R&D expenditures in the environmental sciences at universities and colleges, ranked by fiscal year 2001 R&D expenditures in the environmental sciences: fiscal years and by subfield for Federally financed R&D expenditures in the environmental sciences at universities and colleges, ranked by fiscal year 2001 federally financed R&D expenditures in the environmental sciences: fiscal years and by subfield for fiscal year Total and federally financed R&D expenditures in the mathematical sciences at universities and colleges, ranked by fiscal year 2001 total R&D expenditures in the mathematical sciences: fiscal years Total and federally financed R&D expenditures in the computer sciences at universities and colleges, ranked by fiscal year 2001 total R&D expenditures in the computer sciences: fiscal years R&D expenditures in the life sciences at universities and colleges, ranked by fiscal year 2001 R&D expenditures in the life sciences: fiscal years and by subfield for fiscal year Federally financed R&D expenditures in the life sciences at universities and colleges, ranked by fiscal year 2001 federally financed R&D expenditures in the life sciences: fiscal years and by subfield for fiscal year Total and federally financed R&D expenditures in the agricultural sciences at universities and colleges, ranked by fiscal year 2001 total R&D expenditures in the agricultural sciences: fiscal years Total and federally financed R&D expenditures in the biological sciences at universities and colleges, ranked by fiscal year 2001 total R&D expenditures in the biological sciences: fiscal years Total and federally financed R&D expenditures in the medical sciences at universities and colleges, ranked by fiscal year 2001 total R&D expenditures in the medical sciences: fiscal years Total and federally financed R&D expenditures in psychology at universities and colleges, ranked by fiscal year 2001 total R&D expenditures in psychology: fiscal years R&D expenditures in the social sciences at universities and colleges, ranked by fiscal year 2001 R&D expenditures in the social sciences: fiscal years and by subfield for fiscal year Federally financed R&D expenditures in the social sciences at universities and colleges, ranked by fiscal year 2001 federally financed R&D expenditures in the social sciences: fiscal years and by subfield for fiscal year Current Fund Expenditures for Research Equipment, by Science & Engineering Field and Source of Funds B-66. B-67. Current fund expenditures for research equipment at universities and colleges, by science and engineering field and source of funds: fiscal years 1994, 2000, and Current fund expenditures for research equipment at doctorate-granting institutions, by science and engineering field and source of funds: fiscal years 1994, 2000, and
48 Table B-68. B-69. Page Current fund expenditures for research equipment at universities and colleges, by science and engineering field, source of funds, and type of control: fiscal year Total and federally financed current fund expenditures for research equipment at universities and colleges, ranked by fiscal year 2001 total current fund expenditures for research equipment: fiscal years UNIVERSITY-ADMINISTERED FEDERALLY FUNDED RESEARCH AND DEVELOPMENT CENTERS R&D Expenditures at University-Administered Federally Funded Research and Development Centers B-70. B-71. B-72. B-73. B-74. R&D expenditures at university-administered federally funded research and development centers, by character of work: fiscal years R&D expenditures at university-administered federally funded research and development centers, by science and engineering field: fiscal years Federally financed R&D expenditures at university-administered federally funded research and development centers, by science and engineering field: fiscal years R&D expenditures at university-administered federally funded research and development centers, by science and engineering field: fiscal year Total and federally financed R&D expenditures at university-administered federally funded research and development centers, ranked by fiscal year 2001 total R&D expenditures: fiscal years
49
50 Table B-1. R&D expenditures at universities and colleges, by source of funds: fiscal years [Dollars in millions] Source of funds Fiscal year Total Federal State and Institutional All other Government local Industry funds sources government , , ,474 1, ,715 1, ,921 1, ,149 1, ,225 1, ,335 1, ,500 1, ,630 1, ,884 1, ,022 2, ,409 2, ,729 2, ,067 2, ,625 3, ,366 3, ,063 4, ,847 4, , ,324 4, , ,882 4, , ,620 5, , ,687 6, , ,928 6, , ,153 7,343 1, , ,463 8,193 1, , ,977 8,991 1, ,698 1, ,286 9,638 1,324 1,127 3,006 1, ,585 10,234 1,474 1,204 3,367 1, ,818 11,093 1,491 1,279 3,547 1, ,951 11,957 1,559 1,360 3,589 1, ,023 12,646 1,554 1,422 3,827 1, ,165 13,328 1,689 1,489 4,047 1, ,040 13,836 1,811 1,605 4,170 1, ,363 14,309 1,909 1,737 4,697 1, ,848 15,145 1,944 1,888 5,002 1, ,505 16,071 2,019 2,028 5,395 1, ,042 17,508 2,196 2,152 5,933 2, ,723 19,191 2,315 2,234 6,553 2,430 1 Fiscal year 1978 data are estimated based on data collected from doctorate-granting institutions only. NOTE: Because of rounding, detail may not add to totals. SOURCE: National Science Foundation/Division of Science Resources Statistics, Survey of Research and Development Expenditures at Universities and Colleges, Fiscal Year
51 Table B-2. R&D expenditures at universities and colleges, by character of work: fiscal years [Dollars in millions] Character of work Basic research Applied research Fiscal year Total and development Amount Percent of Amount Percent of total total , ,275 1, ,474 1, ,715 1, ,921 1, ,149 1, ,225 1, ,335 1, ,500 1, ,630 2, ,884 2, ,022 2, ,409 2, ,729 2, , ,067 2, , , ,366 3, , ,063 4, , ,847 4, , ,324 4, , ,882 5, , ,620 5, , ,687 6, , ,928 7, , ,153 8, , ,463 8, , ,977 9, , ,286 10, , ,585 11, , ,818 12, , ,951 13, , ,023 13, , ,165 14, , ,040 15, , ,363 16, , ,848 19, , ,505 20, , ,042 22, , ,723 24, , Separate data for basic research and applied research and development were not collected for fiscal year Basic research statistics were re-estimated for FY 1998 and forward. KEY: -- = not available NOTES: R&D expenditures by character of work are based on estimates of basic research provided by universities and colleges. Because of rounding, detail may not add to totals. SOURCE: National Science Foundation/Division of Science Resources Statistics, Survey of Research and Development Expenditures at Universities and Colleges, Fiscal Year
52 Table B-2a. Federally financed R&D expenditures at universities and colleges, by character of work: fiscal years [Dollars in millions] Character of work Basic research Applied research Fiscal year Total and development Amount Percent of Amount Percent of total total , , , , , , , ,795 1, ,985 1, ,032 1, ,288 1, ,512 1, ,726 2, , ,598 2, , ,098 2, , ,571 3, , ,768 3, , ,989 3, , ,431 3, , ,064 4, , ,712 4, , ,343 5, , ,193 5, , ,991 6, , ,638 6, , ,234 7, , ,093 7, , ,957 8, , ,646 8, , ,328 9, , ,836 9, , ,309 10, , ,145 11, , ,071 12, , ,508 13, , ,191 15, , Separate data for basic research and applied research and development were not collected for fiscal year Basic research statistics were re-estimated for FY 1998 and forward. KEY: -- = not available NOTES: R&D expenditures by character of work are based on estimates of basic research provided by universities and colleges. Because of rounding, detail may not add to totals. SOURCE: National Science Foundation/Division of Science Resources Statistics, Survey of Research and Development Expenditures at Universities and Colleges, Fiscal Year
53 Table B-3. R&D expenditures at universities and colleges, by source of funds and science and engineering field: fiscal years Source and field Total... 21,022,804 22,165,352 23,039,875 24,363,240 25,847,559 27,504,933 30,041,964 32,723,078 Source of funds Federal Government... 12,646,128 13,328,036 13,835,880 14,309,340 15,144,829 16,070,661 17,508,301 19,190,873 State and local government... 1,553,775 1,688,915 1,810,712 1,908,880 1,943,534 2,019,347 2,195,888 2,315,208 Industry... 1,422,170 1,488,895 1,605,258 1,736,668 1,888,171 2,027,937 2,152,389 2,233,649 Institutional funds... 3,826,736 4,046,739 4,169,762 4,697,087 5,001,621 5,395,448 5,932,519 6,553,070 All other sources... 1,573,995 1,612,767 1,618,263 1,711,265 1,869,404 1,991,540 2,252,867 2,430,278 Field Engineering... 3,354,969 3,515,040 3,707,054 3,838,747 4,068,829 4,260,182 4,546,633 4,999,648 Aeronautical and astronautical , , , , , , , ,569 Bioengineering/biomedical , , , , ,336 Chemical , , , , , , , ,544 Civil , , , , , , , ,706 Electrical , , , ,920 1,042,288 1,016,553 1,115,835 1,160,439 Mechanical , , , , , , , ,388 Metallurgical and materials , , , , , , , ,931 Other, n.e.c , , , , , , ,459 1,072,735 All sciences... 17,667,835 18,650,312 19,332,821 20,524,493 21,778,730 23,244,751 25,495,331 27,723,430 Physical sciences... 2,176,900 2,255,399 2,257,151 2,370,288 2,482,134 2,603,777 2,708,242 2,800,364 Astronomy , , , , , , , ,037 Chemistry , , , , , , ,922 1,007,136 Physics , , ,279 1,058,300 1,078,243 1,148,698 1,205,548 1,236,502 Other, n.e.c , , , , , , , ,689 Environmental sciences... 1,396,046 1,433,047 1,488,210 1,532,004 1,623,631 1,690,751 1,763,341 1,826,827 Atmospheric , , , , , , , ,408 Earth sciences , , , , , , , ,539 Oceanography , , , , , , , ,406 Other, n.e.c , , , , , , , ,474 Mathematical sciences , , , , , , , ,274 Computer sciences , , , , , , , ,793 Life sciences... 11,466,122 12,185,822 12,713,267 13,587,882 14,592,790 15,610,045 17,460,397 19,189,112 Agricultural sciences... 1,661,335 1,814,246 1,910,064 1,966,003 1,995,484 2,035,149 2,175,269 2,318,081 Biological sciences... 3,708,991 3,833,845 3,909,455 4,180,330 4,580,830 5,029,285 5,613,179 5,943,596 Medical sciences... 5,638,536 6,069,977 6,390,735 6,907,794 7,471,677 7,993,971 8,986,177 10,176,728 Other, n.e.c , , , , , , , ,707 Psychology , , , , , , , ,865 Social sciences ,798 1,018,857 1,096,472 1,125,174 1,131,139 1,251,376 1,297,243 1,435,540 Economics , , , , , , , ,942 Political science , , , , , , , ,239 Sociology , , , , , , , ,181 Other, n.e.c , , , , , , , ,178 Other sciences, n.e.c , , , , , , , ,655 KEY: -- = not available n.e.c. = not elsewhere classified NOTE: Because of rounding, detail may not add to totals. SOURCE: National Science Foundation/Division of Science Resources Statistics, Survey of Research and Development Expenditures at Universities and Colleges, Fiscal Year
54 Table B-4. Federally financed R&D expenditures at universities and colleges, by science and engineering field: fiscal years Field Total... 12,646,128 13,328,036 13,835,880 14,309,340 15,144,829 16,070,661 17,508,301 19,190,873 Engineering... 1,993,364 2,101,658 2,232,190 2,255,827 2,353,658 2,440,183 2,571,678 2,843,770 Aeronautical and astronautical , , , , , , , ,453 Bioengineering/biomedical ,517 56,635 72,159 90, ,732 Chemical , , , , , , , ,828 Civil , , , , , , , ,594 Electrical , , , , , , , ,245 Mechanical , , , , , , , ,777 Metallurgical and materials , , , , , , , ,275 Other, n.e.c , , , , , , , ,866 All sciences... 10,652,764 11,226,378 11,603,690 12,053,513 12,791,171 13,630,478 14,936,623 16,347,103 Physical sciences... 1,562,803 1,637,156 1,629,679 1,682,621 1,761,115 1,860,315 1,911,267 1,971,510 Astronomy , , , , , , , ,737 Chemistry , , , , , , , ,288 Physics , , , , , , , ,576 Other, n.e.c , , , , , , , ,909 Environmental sciences , ,187 1,005,793 1,011,713 1,075,792 1,100,977 1,131,877 1,182,649 Atmospheric , , , , , , , ,110 Earth sciences , , , , , , , ,107 Oceanography , , , , , , , ,931 Other, n.e.c , , , , , , , ,501 Mathematical sciences , , , , , , , ,325 Computer sciences , , , , , , , ,230 Life sciences... 6,736,521 7,112,138 7,403,665 7,761,391 8,330,565 8,941,216 10,059,092 11,178,689 Agricultural sciences , , , , , , , ,350 Biological sciences... 2,436,960 2,488,704 2,528,368 2,682,613 2,935,562 3,214,280 3,649,980 3,872,150 Medical sciences... 3,537,413 3,826,902 4,023,857 4,226,893 4,559,251 4,861,041 5,441,759 6,248,659 Other, n.e.c , , , , , , , ,530 Psychology , , , , , , , ,103 Social sciences , , , , , , , ,467 Economics... 76,275 80,025 90,652 89,795 92,237 90,095 88,980 89,941 Political science... 49,844 59,648 62,247 51,766 53,112 54,047 62,708 71,945 Sociology... 96, , , , , , , ,188 Other, n.e.c , , , , , , , ,393 Other sciences, n.e.c , , , , , , , ,130 KEY: -- = not available n.e.c. = not elsewhere classified NOTE: Because of rounding, detail may not add to totals. SOURCE: National Science Foundation/Division of Science Resources Statistics, Survey of Research and Development Expenditures at Universities and Colleges, Fiscal Year
55 Table B-5. Non-Federal R&D expenditures at universities and colleges, by source of funds and science and engineering field: fiscal years Source and field Total... 8,376,676 8,837,316 9,203,995 10,053,900 10,702,730 11,434,272 12,533,663 13,532,205 Source of funds State and local government... 1,553,775 1,688,915 1,810,712 1,908,880 1,943,534 2,019,347 2,195,888 2,315,208 Industry... 1,422,170 1,488,895 1,605,258 1,736,668 1,888,171 2,027,937 2,152,389 2,233,649 Institutional funds... 3,826,736 4,046,739 4,169,762 4,697,087 5,001,621 5,395,448 5,932,519 6,553,070 All other sources... 1,573,995 1,612,767 1,618,263 1,711,265 1,869,404 1,991,540 2,252,867 2,430,278 Field Engineering... 1,361,605 1,413,382 1,474,864 1,582,920 1,715,171 1,819,999 1,974,955 2,155,878 Aeronautical and astronautical... 51,991 57,416 61,778 63,700 78,995 77,416 75,395 84,116 Bioengineering/biomedical ,274 45,322 64,401 81,088 90,604 Chemical , , , , , , , ,716 Civil , , , , , , , ,112 Electrical , , , , , , , ,194 Mechanical , , , , , , , ,611 Metallurgical and materials , , , , , , , ,656 Other, n.e.c , , , , , , , ,869 All sciences... 7,015,071 7,423,934 7,729,131 8,470,980 8,987,559 9,614,273 10,558,708 11,376,327 Physical sciences , , , , , , , ,854 Astronomy... 86,256 96,651 93, , , , , ,300 Chemistry , , , , , , , ,848 Physics , , , , , , , ,926 Other, n.e.c ,458 55,921 55,840 59,191 57,038 47,799 52,085 52,780 Environmental sciences , , , , , , , ,178 Atmospheric... 41,890 44,435 48,511 58,886 59,630 65,478 65,512 68,298 Earth sciences , , , , , , , ,432 Oceanography , , , , , , , ,475 Other, n.e.c , ,395 93,670 99, , , , ,973 Mathematical sciences... 76,571 73,865 80,183 87,377 96, , , ,949 Computer sciences , , , , , , , ,563 Life sciences... 4,729,601 5,073,684 5,309,602 5,826,491 6,262,225 6,668,829 7,401,305 8,010,423 Agricultural sciences... 1,168,204 1,282,809 1,350,493 1,417,712 1,462,122 1,490,447 1,597,826 1,704,731 Biological sciences... 1,272,031 1,345,141 1,381,087 1,497,717 1,645,268 1,815,005 1,963,199 2,071,446 Medical sciences... 2,101,123 2,243,075 2,366,878 2,680,901 2,912,426 3,132,930 3,544,418 3,928,069 Other, n.e.c , , , , , , , ,177 Psychology , , , , , , , ,762 Social sciences , , , , , , , ,073 Economics , , , , , , , ,001 Political science , , , , , , , ,294 Sociology... 99, , , , , , , ,993 Other, n.e.c , , , , , , , ,785 Other sciences, n.e.c , , , , , , , ,525 KEY: -- = not available n.e.c. = not elsewhere classified NOTE: Because of rounding, detail may not add to totals. SOURCE: National Science Foundation/Division of Science Resources Statistics, Survey of Research and Development Expenditures at Universities and Colleges, Fiscal Year
56 Table B-6. R&D expenditures at doctorate-granting institutions, by source of funds and science and engineering field: fiscal years Source and field Total... 20,680,773 21,797,182 22,655,732 23,940,340 25,391,445 27,056,601 29,589,621 32,213,590 Source of funds Federal Government... 12,438,537 13,104,006 13,602,735 14,049,527 14,868,567 15,809,847 17,228,972 18,875,815 State and local government... 1,514,040 1,645,636 1,767,188 1,861,151 1,891,932 1,948,373 2,152,528 2,267,195 Industry... 1,392,655 1,456,474 1,571,170 1,701,822 1,855,200 1,994,708 2,116,094 2,197,971 Institutional funds... 3,781,781 3,999,375 4,119,658 4,642,387 4,947,552 5,348,660 5,881,943 6,496,214 All other sources... 1,553,760 1,591,691 1,594,981 1,685,453 1,828,194 1,955,013 2,210,084 2,376,395 Field Engineering... 3,302,127 3,457,041 3,645,470 3,771,399 3,997,987 4,191,195 4,475,501 4,911,861 Aeronautical and astronautical , , , , , , , ,384 Bioengineering/biomedical , , , , ,691 Chemical , , , , , , , ,188 Civil , , , , , , , ,538 Electrical , , , ,811 1,027,461 1,004,350 1,103,186 1,147,750 Mechanical , , , , , , , ,595 Metallurgical and materials , , , , , , , ,336 Other, n.e.c , , , , , , ,579 1,051,379 All sciences... 17,378,646 18,340,141 19,010,262 20,168,941 21,393,458 22,865,406 25,114,120 27,301,729 Physical sciences... 2,109,592 2,186,055 2,181,260 2,289,708 2,392,254 2,526,454 2,631,930 2,721,442 Astronomy , , , , , , , ,211 Chemistry , , , , , , , ,435 Physics , , ,627 1,022,987 1,039,428 1,122,028 1,172,825 1,204,129 Other, n.e.c , , , , , , , ,667 Environmental sciences... 1,352,215 1,390,510 1,443,143 1,487,376 1,578,508 1,639,711 1,713,906 1,775,577 Atmospheric , , , , , , , ,365 Earth sciences , , , , , , , ,859 Oceanography , , , , , , , ,747 Other, n.e.c , , , , , , , ,606 Mathematical sciences , , , , , , , ,998 Computer sciences , , , , , , , ,233 Life sciences... 11,358,127 12,076,647 12,598,564 13,453,454 14,440,249 15,469,171 17,318,653 19,031,379 Agricultural sciences... 1,622,681 1,774,205 1,870,293 1,914,186 1,934,892 1,976,691 2,118,390 2,257,859 Biological sciences... 3,652,886 3,776,805 3,848,135 4,113,277 4,509,006 4,967,768 5,549,573 5,874,112 Medical sciences... 5,629,543 6,061,899 6,381,049 6,895,553 7,456,042 7,979,996 8,972,524 10,158,395 Other, n.e.c , , , , , , , ,013 Psychology , , , , , , , ,284 Social sciences , ,315 1,068,651 1,092,788 1,099,290 1,218,735 1,266,105 1,399,807 Economics , , , , , , , ,508 Political science , , , , , , , ,870 Sociology , , , , , , , ,394 Other, n.e.c , , , , , , , ,035 Other sciences, n.e.c , , , , , , , ,009 KEY: -- = not available n.e.c. = not elsewhere classified NOTE: Because of rounding, detail may not add to totals. SOURCE: National Science Foundation/Division of Science Resources Statistics, Survey of Research and Development Expenditures at Universities and Colleges, Fiscal Year
57 Table B-7. Federally financed R&D expenditures at doctorate-granting institutions, by science and engineering field: fiscal years Field Total... 12,438,537 13,104,006 13,602,735 14,049,527 14,868,567 15,809,847 17,228,972 18,875,815 Engineering... 1,966,856 2,071,611 2,197,686 2,217,245 2,313,222 2,402,345 2,532,562 2,796,601 Aeronautical and astronautical , , , , , , , ,025 Bioengineering/biomedical ,189 56,369 71,797 89, ,992 Chemical , , , , , , , ,599 Civil , , , , , , , ,904 Electrical , , , , , , , ,698 Mechanical , , , , , , , ,118 Metallurgical and materials , , , , , , , ,032 Other, n.e.c , , , , , , , ,233 All sciences... 10,471,681 11,032,395 11,405,049 11,832,282 12,555,345 13,407,502 14,696,410 16,079,214 Physical sciences... 1,519,444 1,591,217 1,580,999 1,632,130 1,702,070 1,808,028 1,860,703 1,917,666 Astronomy , , , , , , , ,992 Chemistry , , , , , , , ,805 Physics , , , , , , , ,312 Other, n.e.c , , , , , , , ,557 Environmental sciences , , , ,391 1,052,955 1,076,672 1,105,477 1,153,959 Atmospheric , , , , , , , ,710 Earth sciences , , , , , , , ,571 Oceanography , , , , , , , ,311 Other, n.e.c , , , , , , , ,367 Mathematical sciences , , , , , , , ,293 Computer sciences , , , , , , , ,878 Life sciences... 6,663,593 7,038,436 7,326,106 7,669,040 8,231,592 8,855,419 9,961,054 11,069,520 Agricultural sciences , , , , , , , ,414 Biological sciences... 2,404,116 2,453,091 2,490,065 2,640,926 2,889,725 3,174,392 3,605,907 3,821,682 Medical sciences... 3,530,509 3,821,074 4,016,766 4,217,597 4,549,010 4,852,622 5,432,963 6,236,172 Other, n.e.c , , , , , , , ,252 Psychology , , , , , , , ,645 Social sciences , , , , , , , ,918 Economics... 72,919 76,472 88,635 87,661 90,454 88,217 86,910 87,306 Political science... 49,426 59,199 61,604 51,155 52,152 53,358 61,889 70,408 Sociology... 93, , , , , , , ,824 Other, n.e.c , , , , , , , ,380 Other sciences, n.e.c , , , , , , , ,335 KEY: -- = not available n.e.c. = not elsewhere classified NOTE: Because of rounding, detail may not add to totals. SOURCE: National Science Foundation/Division of Science Resources Statistics, Survey of Research and Development Expenditures at Universities and Colleges, Fiscal Year
58 Table B-8. Non-Federal R&D expenditures at doctorate-granting institutions, by source of funds and science and engineering field: fiscal years Source and field Total... 8,242,236 8,693,176 9,052,997 9,890,813 10,522,878 11,246,754 12,360,649 13,337,775 Source of funds State and local government... 1,514,040 1,645,636 1,767,188 1,861,151 1,891,932 1,948,373 2,152,528 2,267,195 Industry... 1,392,655 1,456,474 1,571,170 1,701,822 1,855,200 1,994,708 2,116,094 2,197,971 Institutional funds... 3,781,781 3,999,375 4,119,658 4,642,387 4,947,552 5,348,660 5,881,943 6,496,214 All other sources... 1,553,760 1,591,691 1,594,981 1,685,453 1,828,194 1,955,013 2,210,084 2,376,395 Field Engineering... 1,335,271 1,385,430 1,447,784 1,554,154 1,684,765 1,788,850 1,942,939 2,115,260 Aeronautical and astronautical... 51,642 57,096 61,334 63,153 78,551 77,094 75,131 83,359 Bioengineering/biomedical ,274 45,286 62,895 79,462 88,699 Chemical , , , , , , , ,589 Civil , , , , , , , ,634 Electrical , , , , , , , ,052 Mechanical , , , , , , , ,477 Metallurgical and materials , , , , , , , ,304 Other, n.e.c , , , , , , , ,146 All sciences... 6,906,965 7,307,746 7,605,213 8,336,659 8,838,113 9,457,904 10,417,710 11,222,515 Physical sciences , , , , , , , ,776 Astronomy... 85,784 96,023 92, , , , , ,219 Chemistry , , , , , , , ,630 Physics , , , , , , , ,817 Other, n.e.c ,553 54,977 54,808 57,980 56,120 46,518 50,888 51,110 Environmental sciences , , , , , , , ,618 Atmospheric... 40,911 43,716 47,914 58,237 58,974 64,848 65,059 67,655 Earth sciences , , , , , , , ,288 Oceanography , , , , , , , ,436 Other, n.e.c ,210 98,018 88,652 95, ,811 97, , ,239 Mathematical sciences... 73,702 69,817 75,820 82,569 91,672 99, , ,705 Computer sciences , , , , , , , ,355 Life sciences... 4,694,534 5,038,211 5,272,458 5,784,414 6,208,657 6,613,752 7,357,599 7,961,859 Agricultural sciences... 1,159,079 1,272,097 1,339,988 1,404,907 1,441,064 1,464,739 1,580,014 1,683,445 Biological sciences... 1,248,770 1,323,714 1,358,070 1,472,351 1,619,281 1,793,376 1,943,666 2,052,430 Medical sciences... 2,099,034 2,240,825 2,364,283 2,677,956 2,907,032 3,127,374 3,539,561 3,922,223 Other, n.e.c , , , , , , , ,761 Psychology , , , , , , , ,639 Social sciences , , , , , , , ,889 Economics , , , , , , , ,202 Political science , , , , , , , ,462 Sociology... 96, , , , , , , ,570 Other, n.e.c , , , , , , , ,655 Other sciences, n.e.c , , , , , , , ,674 KEY: -- = not available n.e.c. = not elsewhere classified NOTE: Because of rounding, detail may not add to totals. SOURCE: National Science Foundation/Division of Science Resources Statistics, Survey of Research and Development Expenditures at Universities and Colleges, Fiscal Year
59 Table B-9. R&D expenditures at public universities and colleges, by source of funds and science and engineering field: fiscal years Source and field Total... 14,111,361 14,948,779 15,584,585 16,421,253 17,475,030 18,638,779 20,490,979 22,340,844 Source of funds Federal Government... 7,635,416 8,099,316 8,464,260 8,568,635 9,069,775 9,689,107 10,630,625 11,694,962 State and local government... 1,404,409 1,511,983 1,649,551 1,741,395 1,772,884 1,842,454 2,001,266 2,079,529 Industry ,542 1,003,151 1,076,379 1,175,729 1,279,605 1,334,983 1,436,283 1,489,479 Institutional funds... 3,190,167 3,386,601 3,418,074 3,887,739 4,214,678 4,559,632 4,997,478 5,541,775 All other sources , , ,321 1,047,755 1,138,088 1,212,603 1,425,327 1,535,099 Field Engineering... 2,287,425 2,441,092 2,587,903 2,686,594 2,866,185 3,046,376 3,286,737 3,620,505 Aeronautical and astronautical , , , , , , , ,431 Bioengineering/biomedical ,227 62,102 79, , ,541 Chemical , , , , , , , ,316 Civil , , , , , , , ,502 Electrical , , , , , , , ,447 Mechanical , , , , , , , ,153 Metallurgical and materials , , , , , , , ,015 Other, n.e.c , , , , , , , ,100 All sciences... 11,823,936 12,507,687 12,996,682 13,734,659 14,608,845 15,592,403 17,204,242 18,720,339 Physical sciences... 1,412,684 1,465,755 1,445,302 1,501,385 1,585,857 1,676,144 1,800,925 1,871,888 Astronomy , , , , , , , ,933 Chemistry , , , , , , , ,234 Physics , , , , , , , ,154 Other, n.e.c , , , , ,357 68,016 76,651 83,567 Environmental sciences... 1,099,645 1,134,854 1,192,953 1,224,826 1,283,245 1,356,926 1,422,438 1,486,480 Atmospheric , , , , , , , ,686 Earth sciences , , , , , , , ,227 Oceanography , , , , , , , ,923 Other, n.e.c , , , , , , , ,644 Mathematical sciences , , , , , , , ,190 Computer sciences , , , , , , , ,557 Life sciences... 7,587,119 8,069,544 8,431,633 8,982,774 9,637,480 10,251,768 11,480,178 12,594,321 Agricultural sciences... 1,607,108 1,759,082 1,858,052 1,905,549 1,930,454 1,978,767 2,113,932 2,244,682 Biological sciences... 2,339,395 2,410,661 2,458,683 2,621,208 2,888,356 3,194,672 3,584,708 3,711,699 Medical sciences... 3,384,190 3,638,982 3,815,961 4,138,071 4,494,909 4,758,201 5,351,759 6,141,713 Other, n.e.c , , , , , , , ,227 Psychology , , , , , , , ,636 Social sciences , , , , , , ,764 1,123,145 Economics , , , , , , , ,321 Political science... 96, , , , , , , ,795 Sociology , , , , , , , ,499 Other, n.e.c , , , , , , , ,530 Other sciences, n.e.c , , , , , , , ,122 KEY: -- = not available n.e.c. = not elsewhere classified NOTE: Because of rounding, detail may not add to totals. SOURCE: National Science Foundation/Division of Science Resources Statistics, Survey of Research and Development Expenditures at Universities and Colleges, Fiscal Year
60 Table B-10. Federally financed R&D expenditures at public universities and colleges, by science and engineering field: fiscal years Field Total... 7,635,416 8,099,316 8,464,260 8,568,635 9,069,775 9,689,107 10,630,625 11,694,962 Engineering... 1,179,171 1,276,867 1,384,333 1,372,223 1,441,099 1,515,475 1,626,316 1,823,246 Aeronautical and astronautical... 86,549 98,254 91, ,780 96, , , ,694 Bioengineering/biomedical ,111 26,487 29,489 41,104 63,657 Chemical... 94, , , , , , , ,473 Civil , , , , , , , ,609 Electrical , , , , , , , ,832 Mechanical , , , , , , , ,644 Metallurgical and materials , , , , , , , ,449 Other, n.e.c , , , , , , , ,888 All sciences... 6,456,245 6,822,449 7,079,927 7,196,412 7,628,676 8,173,632 9,004,309 9,871,716 Physical sciences , , , ,775 1,003,033 1,054,319 1,134,771 1,181,836 Astronomy , , ,318 98, , , , ,557 Chemistry , , , , , , , ,738 Physics , , , , , , , ,677 Other, n.e.c ,808 85,286 81,971 81, ,113 32,410 34,989 44,864 Environmental sciences , , , , , , , ,885 Atmospheric , , , , , , , ,398 Earth sciences , , , , , , , ,295 Oceanography , , , , , , , ,629 Other, n.e.c , , , , , ,875 94, ,563 Mathematical sciences , , , , , , , ,615 Computer sciences , , , , , , , ,526 Life sciences... 4,018,538 4,240,168 4,441,063 4,562,459 4,872,885 5,227,714 5,855,196 6,488,530 Agricultural sciences , , , , , , , ,007 Biological sciences... 1,400,039 1,423,696 1,460,785 1,531,067 1,672,591 1,849,848 2,134,197 2,203,590 Medical sciences... 2,015,794 2,175,790 2,279,683 2,345,929 2,546,412 2,694,867 2,956,981 3,440,135 Other, n.e.c , , , , , , , ,798 Psychology , , , , , , , ,625 Social sciences , , , , , , , ,479 Economics... 64,104 65,373 72,657 64,854 65,782 68,341 68,366 71,490 Political science... 23,973 29,587 31,904 27,413 28,444 29,580 31,008 36,786 Sociology... 66,276 75,849 86,287 87,836 85,626 84,423 97, ,931 Other, n.e.c , , , , , , , ,272 Other sciences, n.e.c , , , ,667 92, , , ,220 KEY: -- = not available n.e.c. = not elsewhere classified NOTE: Because of rounding, detail may not add to totals. SOURCE: National Science Foundation/Division of Science Resources Statistics, Survey of Research and Development Expenditures at Universities and Colleges, Fiscal Year
61 Table B-11. Non-Federal R&D expenditures at public universities and colleges, by source of funds and science and engineering field: fiscal years Source and field Total... 6,475,945 6,849,463 7,120,325 7,852,618 8,405,255 8,949,672 9,860,354 10,645,882 Source of funds State and local government... 1,404,409 1,511,983 1,649,551 1,741,395 1,772,884 1,842,454 2,001,266 2,079,529 Industry ,542 1,003,151 1,076,379 1,175,729 1,279,605 1,334,983 1,436,283 1,489,479 Institutional funds... 3,190,167 3,386,601 3,418,074 3,887,739 4,214,678 4,559,632 4,997,478 5,541,775 All other sources , , ,321 1,047,755 1,138,088 1,212,603 1,425,327 1,535,099 Field Engineering... 1,108,254 1,164,225 1,203,570 1,314,371 1,425,086 1,530,901 1,660,421 1,797,259 Aeronautical and astronautical... 37,626 45,116 46,991 53,731 58,306 67,326 63,516 68,737 Bioengineering/biomedical ,116 35,615 49,577 63,340 69,884 Chemical... 96, , , , , , , ,843 Civil , , , , , , , ,893 Electrical , , , , , , , ,615 Mechanical , , , , , , , ,509 Metallurgical and materials , , , , , , , ,566 Other, n.e.c , , , , , , , ,212 All sciences... 5,367,691 5,685,238 5,916,755 6,538,247 6,980,169 7,418,771 8,199,933 8,848,623 Physical sciences , , , , , , , ,052 Astronomy... 71,245 80,137 78,549 89,425 96, ,857 99, ,376 Chemistry , , , , , , , ,496 Physics , , , , , , , ,477 Other, n.e.c ,676 49,855 42,932 46,808 42,244 35,606 41,662 38,703 Environmental sciences , , , , , , , ,595 Atmospheric... 38,854 41,903 45,229 56,206 56,057 60,759 59,836 61,288 Earth sciences , , , , , , , ,932 Oceanography , , , , , , , ,294 Other, n.e.c ,865 81,032 74,301 79,532 83,410 85, , ,081 Mathematical sciences... 62,982 61,430 66,519 71,081 80,302 85,880 91,731 97,575 Computer sciences , , , , , , , ,031 Life sciences... 3,568,581 3,829,376 3,990,570 4,420,315 4,764,595 5,024,054 5,624,982 6,105,791 Agricultural sciences... 1,133,589 1,247,438 1,315,567 1,383,752 1,422,308 1,451,315 1,554,933 1,653,675 Biological sciences , , ,898 1,090,141 1,215,765 1,344,824 1,450,511 1,508,109 Medical sciences... 1,368,396 1,463,192 1,536,278 1,792,142 1,948,497 2,063,334 2,394,778 2,701,578 Other, n.e.c , , , , , , , ,429 Psychology... 87,943 91,927 92,511 99, , , , ,011 Social sciences , , , , , , , ,666 Economics , , , , , , , ,831 Political science... 72,718 78,566 81,388 83,458 81,002 92, , ,009 Sociology... 78,519 90,112 89, , , , , ,568 Other, n.e.c , , , , , , , ,258 Other sciences, n.e.c , , , , , , , ,902 KEY: -- = not available n.e.c. = not elsewhere classified NOTE: Because of rounding, detail may not add to totals. SOURCE: National Science Foundation/Division of Science Resources Statistics, Survey of Research and Development Expenditures at Universities and Colleges, Fiscal Year
62 Table B-12. R&D expenditures at private universities and colleges, by source of funds and science and engineering field: fiscal years Source and field Total... 6,911,443 7,216,573 7,455,290 7,941,987 8,372,529 8,866,154 9,550,985 10,382,234 Source of funds Federal Government... 5,010,712 5,228,720 5,371,620 5,740,705 6,075,054 6,381,554 6,877,676 7,495,911 State and local government , , , , , , , ,679 Industry , , , , , , , ,170 Institutional funds , , , , , , ,041 1,011,295 All other sources , , , , , , , ,179 Field Engineering... 1,067,544 1,073,948 1,119,151 1,152,153 1,202,644 1,213,806 1,259,896 1,379,143 Aeronautical and astronautical... 93,201 97,699 94,266 92,455 94,682 71,843 77,226 94,138 Bioengineering/biomedical ,564 39,855 57,494 67,200 77,795 Chemical... 88,305 91,355 90,371 79,638 81,887 94, , ,228 Civil... 68,462 69,269 72,960 72,328 69,015 81,608 91, ,204 Electrical , , , , , , , ,992 Mechanical , , , , , , , ,235 Metallurgical and materials... 71,367 76,752 89,757 99, , , , ,916 Other, n.e.c , , , , , , , ,635 All sciences... 5,843,899 6,142,625 6,336,139 6,789,834 7,169,885 7,652,348 8,291,089 9,003,091 Physical sciences , , , , , , , ,476 Astronomy... 82,023 90,015 88,947 99,552 95, , , ,104 Chemistry , , , , , , , ,902 Physics , , , , , , , ,348 Other, n.e.c ,845 56,312 67,697 76,436 81,360 84,454 80,856 95,122 Environmental sciences , , , , , , , ,347 Atmospheric... 38,334 32,154 31,602 32,455 41,074 51,555 53,720 54,722 Earth sciences , , , , , , , ,312 Oceanography... 53,557 50,159 49,688 49,345 55,467 91,329 89,542 91,483 Other, n.e.c , ,775 99, , ,183 67,163 82,373 82,830 Mathematical sciences , , , , , , , ,084 Computer sciences , , , , , , , ,236 Life sciences... 3,879,003 4,116,278 4,281,634 4,605,108 4,955,310 5,358,277 5,980,219 6,594,791 Agricultural sciences... 54,227 55,164 52,012 60,454 65,030 56,382 61,337 73,399 Biological sciences... 1,369,596 1,423,184 1,450,772 1,559,122 1,692,474 1,834,613 2,028,471 2,231,897 Medical sciences... 2,254,346 2,430,995 2,574,774 2,769,723 2,976,768 3,235,770 3,634,418 4,035,015 Other, n.e.c , , , , , , , ,480 Psychology , , ,885 97, , , , ,229 Social sciences , , , , , , , ,395 Economics... 44,870 42,940 45,866 54,002 53,085 49,109 49,289 42,621 Political science... 63,841 64,862 66,478 64,598 66,079 78,004 90, ,444 Sociology... 51,099 49,163 54,635 60,334 58,033 68,531 77,210 78,682 Other, n.e.c ,778 98,027 89,368 92,169 80,822 84,314 81,255 89,648 Other sciences, n.e.c , , , , , , , ,533 KEY: -- = not available n.e.c. = not elsewhere classified NOTE: Because of rounding, detail may not add to totals. SOURCE: National Science Foundation/Division of Science Resources Statistics, Survey of Research and Development Expenditures at Universities and Colleges, Fiscal Year
63 Table B-13. Federally financed R&D expenditures at private universities and colleges, by science and engineering field: fiscal years Field Total... 5,010,712 5,228,720 5,371,620 5,740,705 6,075,054 6,381,554 6,877,676 7,495,911 Engineering , , , , , , ,362 1,020,524 Aeronautical and astronautical... 78,836 85,399 79,479 82,486 73,993 61,753 65,347 78,759 Bioengineering/biomedical ,406 30,148 42,670 49,452 57,075 Chemical... 56,431 60,399 58,276 52,205 52,306 60,346 65,561 73,355 Civil... 44,307 44,399 46,679 45,183 40,660 48,640 56,079 59,985 Electrical , , , , , , , ,413 Mechanical , , , , , , , ,133 Metallurgical and materials... 45,311 52,032 64,199 74,054 75,468 77,228 74,600 71,826 Other, n.e.c , , , , , , , ,978 All sciences... 4,196,519 4,403,929 4,523,763 4,857,101 5,162,495 5,456,846 5,932,314 6,475,387 Physical sciences , , , , , , , ,674 Astronomy... 67,012 73,501 74,032 84,543 77, , , ,180 Chemistry , , , , , , , ,550 Physics , , , , , , , ,899 Other, n.e.c ,063 50,246 54,789 64,053 66,566 72,261 70,433 81,045 Environmental sciences , , , , , , , ,764 Atmospheric... 35,298 29,622 28,320 29,775 37,501 46,836 48,044 47,712 Earth sciences... 88,600 90,587 93,292 96, ,309 99,476 89,460 85,812 Oceanography... 47,767 42,486 40,671 42,099 48,381 80,750 81,194 83,302 Other, n.e.c ,265 81,412 79,894 90,381 91,192 50,896 62,430 62,938 Mathematical sciences ,532 97, ,259 94,981 98, , , ,710 Computer sciences , , , , , , , ,704 Life sciences... 2,717,983 2,871,970 2,962,602 3,198,932 3,457,680 3,713,502 4,203,896 4,690,159 Agricultural sciences... 19,612 19,793 17,086 26,494 25,216 17,250 18,444 22,343 Biological sciences... 1,036,921 1,065,008 1,067,583 1,151,546 1,262,971 1,364,432 1,515,783 1,668,560 Medical sciences... 1,521,619 1,651,112 1,744,174 1,880,964 2,012,839 2,166,174 2,484,778 2,808,524 Other, n.e.c , , , , , , , ,732 Psychology... 74,243 71,937 70,315 72,779 82,723 89, , ,478 Social sciences , , , , , , , ,988 Economics... 12,171 14,652 17,995 24,941 26,455 21,754 20,614 18,451 Political science... 25,871 30,061 30,343 24,353 24,668 24,467 31,700 35,159 Sociology... 29,914 28,563 32,664 32,726 33,304 37,489 39,596 38,257 Other, n.e.c ,945 40,632 34,477 32,125 30,193 32,840 32,847 42,121 Other sciences, n.e.c ,018 57,683 57,368 83,913 79,658 55,304 60,507 50,910 KEY: -- = not available n.e.c. = not elsewhere classified NOTE: Because of rounding, detail may not add to totals. SOURCE: National Science Foundation/Division of Science Resources Statistics, Survey of Research and Development Expenditures at Universities and Colleges, Fiscal Year
64 Table B-14. Non-Federal R&D expenditures at private universities and colleges, by source of funds and science and engineering field: fiscal years Source and field Total... 1,900,731 1,987,853 2,083,670 2,201,282 2,297,475 2,484,600 2,673,309 2,886,323 Source of funds State and local government , , , , , , , ,679 Industry , , , , , , , ,170 Institutional funds , , , , , , ,041 1,011,295 All other sources , , , , , , , ,179 Field Engineering , , , , , , , ,619 Aeronautical and astronautical... 14,365 12,300 14,787 9,969 20,689 10,090 11,879 15,379 Bioengineering/biomedical ,158 9,707 14,824 17,748 20,720 Chemical... 31,874 30,956 32,095 27,433 29,581 33,928 37,546 40,873 Civil... 24,155 24,870 26,281 27,145 28,355 32,968 35,310 41,219 Electrical... 59,253 57,488 65,380 68,674 68,682 68,729 84,072 84,579 Mechanical... 40,841 34,086 40,215 41,914 41,182 45,305 48,361 57,102 Metallurgical and materials... 26,056 24,720 25,558 25,365 34,209 29,073 28,747 35,090 Other, n.e.c ,807 64,737 66,978 61,891 57,680 54,181 50,871 63,657 All sciences... 1,647,380 1,738,696 1,812,376 1,932,733 2,007,390 2,195,502 2,358,775 2,527,704 Physical sciences , , , , , , , ,802 Astronomy... 15,011 16,514 14,915 15,009 18,021 9,959 9,211 12,924 Chemistry... 56,663 57,693 57,868 61,109 62,752 61,282 68,009 70,352 Physics... 45,254 38,635 42,626 43,556 42,628 38,203 43,178 41,449 Other, n.e.c.... 5,782 6,066 12,908 12,383 14,794 12,193 10,423 14,077 Environmental sciences... 44,471 54,086 53,080 48,249 52,003 55,867 59,775 60,583 Atmospheric... 3,036 2,532 3,282 2,680 3,573 4,719 5,676 7,010 Earth sciences... 22,017 22,518 21,412 18,234 21,353 24,302 25,808 25,500 Oceanography... 5,790 7,673 9,017 7,246 7,086 10,579 8,348 8,181 Other, n.e.c ,628 21,363 19,369 20,089 19,991 16,267 19,943 19,892 Mathematical sciences... 13,589 12,435 13,664 16,296 15,871 18,096 20,100 18,374 Computer sciences... 52,808 66,032 61,780 63,236 64,875 74,439 72,452 74,532 Life sciences... 1,161,020 1,244,308 1,319,032 1,406,176 1,497,630 1,644,775 1,776,323 1,904,632 Agricultural sciences... 34,615 35,371 34,926 33,960 39,814 39,132 42,893 51,056 Biological sciences , , , , , , , ,337 Medical sciences , , , , ,929 1,069,596 1,149,640 1,226,491 Other, n.e.c ,003 70,878 70,317 75,881 64,384 65,866 71,102 63,748 Psychology... 29,743 29,747 30,570 24,766 28,444 30,018 32,642 32,751 Social sciences , , , , , , , ,407 Economics... 32,699 28,288 27,871 29,061 26,630 27,355 28,675 24,170 Political science... 37,970 34,801 36,135 40,245 41,411 53,537 59,025 66,285 Sociology... 21,185 20,600 21,971 27,608 24,729 31,042 37,614 40,425 Other, n.e.c ,833 57,395 54,891 60,044 50,629 51,474 48,408 47,527 Other sciences, n.e.c ,352 72,096 65,065 84,995 66,973 87,262 92, ,623 KEY: -- = not available n.e.c. = not elsewhere classified NOTE: Because of rounding, detail may not add to totals. SOURCE: National Science Foundation/Division of Science Resources Statistics, Survey of Research and Development Expenditures at Universities and Colleges, Fiscal Year
65 Table B-15. R&D expenditures at doctorate-granting institutions, by source of funds, science and engineering field, and control: fiscal years 1994, 2000, and 2001 Source and field Total Public Private Total... 20,680,773 29,589,621 32,213,590 13,861,696 20,167,515 21,986,614 6,819,077 9,422,106 10,226,976 Source of funds Federal Government... 12,438,537 17,228,972 18,875,815 7,484,553 10,423,025 11,463,109 4,953,984 6,805,947 7,412,706 State and local government... 1,514,040 2,152,528 2,267,195 1,366,841 1,959,859 2,034, , , ,071 Industry... 1,392,655 2,116,094 2,197, ,230 1,414,770 1,469, , , ,161 Institutional funds... 3,781,781 5,881,943 6,496,214 3,158,493 4,965,309 5,501, , , ,073 All other sources... 1,553,760 2,210,084 2,376, ,579 1,404,552 1,518, , , ,965 Field Engineering... 3,302,127 4,475,501 4,911,861 2,246,976 3,238,575 3,573,177 1,055,151 1,236,926 1,338,684 Aeronautical and astronautical , , , , , ,659 93,106 76,863 87,725 Bioengineering/biomedical , , , , ,962 75,666 Chemical , , , , , ,285 87, , ,903 Civil , , , , , ,577 67,904 89,097 97,961 Electrical ,228 1,103,186 1,147, , , , , , ,562 Mechanical , , , , , , , , ,461 Metallurgical and materials , , , , , ,604 70, , ,732 Other, n.e.c , ,579 1,051, , , , , , ,674 All sciences... 17,378,646 25,114,120 27,301,729 11,614,720 16,928,940 18,413,437 5,763,926 8,185,180 8,888,292 Physical sciences... 2,109,592 2,631,930 2,721,442 1,368,835 1,752,112 1,823, , , ,256 Astronomy , , , , , ,717 81, , ,494 Chemistry , , , , , , , , ,521 Physics ,739 1,172,825 1,204, , , , , , ,300 Other, n.e.c , , , ,241 74,994 79,726 53,831 80,470 94,941 Environmental sciences.. 1,352,215 1,713,906 1,775,577 1,060,063 1,377,985 1,441, , , ,838 Atmospheric , , , , , ,207 36,779 52,749 53,158 Earth sciences , , , , , , , , ,545 Oceanography , , , , , ,516 53,354 89,240 91,231 Other, n.e.c , , , , , ,702 92,605 81,334 81,904 Mathematical sciences , , , , , , , , ,825 Computer sciences , , , , , , , , ,756 Life sciences... 11,358,127 17,318,653 19,031,379 7,510,534 11,377,121 12,476,052 3,847,593 5,941,532 6,555,327 Agricultural sciences 1,622,681 2,118,390 2,257,859 1,572,540 2,062,434 2,189,799 50,141 55,956 68,060 Biological sciences... 3,652,886 5,549,573 5,874,112 2,304,760 3,543,908 3,664,307 1,348,126 2,005,665 2,209,805 Medical sciences... 5,629,543 8,972,524 10,158,395 3,379,995 5,346,513 6,132,980 2,249,548 3,626,011 4,025,415 Other, n.e.c , , , , , , , , ,047 Psychology , , , , , ,580 99, , ,704 Social sciences ,685 1,266,105 1,399, , ,159 1,099, , , ,545 Economics , , , , , ,828 44,041 47,812 40,680 Political science , , ,870 95, , ,030 62,793 88,742 98,840 Sociology , , , , , ,950 49,067 72,946 75,444 Other, n.e.c , , , , , ,454 86,590 77,446 85,581 Other sciences, n.e.c , , , , , , , , ,041 KEY: -- = not available n.e.c. = not elsewhere classified NOTE: Because of rounding, detail may not add to totals. SOURCE: National Science Foundation/Division of Science Resources Statistics, Survey of Research and Development Expenditures at Universities and Colleges, Fiscal Year
66 Table B-16. Federally financed R&D expenditures at doctorate-granting institutions, by science and engineering field and control: fiscal years 1994, 2000, and 2001 Field Total Public Private Total... 12,438,537 17,228,972 18,875,815 7,484,553 10,423,025 11,463,109 4,953,984 6,805,947 7,412,706 Engineering... 1,966,856 2,532,562 2,796,601 1,156,247 1,595,347 1,790, , ,215 1,006,470 Aeronautical and astronautical , , ,025 80, , ,155 78,836 65,047 72,870 Bioengineering/biomedical , , ,889 63, ,891 56,378 Chemical , , ,599 93, , ,805 56,102 64,958 72,794 Civil , , , , , ,337 44,156 55,754 59,567 Electrical , , , , , , , , ,822 Mechanical , , , , , , , , ,591 Metallurgical and materials , , , , , ,381 45,270 74,346 71,651 Other, n.e.c , , , , , , , , ,797 All sciences... 10,471,681 14,696,410 16,079,214 6,328,306 8,827,678 9,672,978 4,143,375 5,868,732 6,406,236 Physical sciences... 1,519,444 1,860,703 1,917, ,987 1,100,417 1,145, , , ,694 Astronomy , , , , , ,430 66, , ,562 Chemistry , , , , , , , , ,400 Physics , , , , , , , , ,822 Other, n.e.c , , ,557 87,018 34,306 42,647 48,501 70,270 80,910 Environmental sciences ,005 1,105,477 1,153, , , , , , ,136 Atmospheric , , , , , ,456 33,813 47,140 46,254 Earth sciences , , , , , ,002 87,869 87,800 83,569 Oceanography , , , , , ,242 47,662 81,023 83,069 Other, n.e.c , , , ,633 91, ,123 79,200 62,273 62,244 Mathematical sciences , , ,293 99, , ,137 98, , ,156 Computer sciences , , , , , , , , ,384 Life sciences... 6,663,593 9,961,054 11,069,520 3,967,981 5,782,474 6,405,583 2,695,612 4,178,580 4,663,937 Agricultural sciences , , , , , ,012 15,612 15,225 19,402 Biological sciences... 2,404,116 3,605,907 3,821,682 1,380,645 2,104,776 2,168,040 1,023,471 1,501,131 1,653,642 Medical sciences... 3,530,509 5,432,963 6,236,172 2,012,919 2,953,944 3,434,241 1,517,590 2,479,019 2,801,931 Other, n.e.c , , , , , , , , ,962 Psychology , , , , , ,455 70,458 97, ,190 Social sciences , , , , , , , , ,384 Economics... 72,919 86,910 87,306 61,059 66,798 69,608 11,860 20,112 17,698 Political science... 49,426 61,889 70,408 23,632 30,427 35,774 25,794 31,462 34,634 Sociology... 93, , ,824 64,470 94, ,543 28,788 37,735 37,281 Other, n.e.c , , ,380 95, , ,609 37,359 30,492 39,771 Other sciences, n.e.c , , , , , ,980 33,256 57,022 46,355 KEY: -- = not available n.e.c. = not elsewhere classified NOTE: Because of rounding, detail may not add to totals. SOURCE: National Science Foundation/Division of Science Resources Statistics, Survey of Research and Development Expenditures at Universities and Colleges, Fiscal Year
67 Table B-17. Non-Federal R&D expenditures at doctorate-granting institutions, by source of funds, science and engineering field, and control: fiscal years 1994, 2000, and 2001 Source and field Total Public Private Total... 8,242,236 12,360,649 13,337,775 6,377,143 9,744,490 10,523,505 1,865,093 2,616,159 2,814,270 Source of funds State and local government... 1,514,040 2,152,528 2,267,195 1,366,841 1,959,859 2,034, , , ,071 Industry... 1,392,655 2,116,094 2,197, ,230 1,414,770 1,469, , , ,161 Institutional funds... 3,781,781 5,881,943 6,496,214 3,158,493 4,965,309 5,501, , , ,073 All other sources... 1,553,760 2,210,084 2,376, ,579 1,404,552 1,518, , , ,965 Field Engineering... 1,335,271 1,942,939 2,115,260 1,090,729 1,643,228 1,783, , , ,214 Aeronautical and astronautical... 51,642 75,131 83,359 37,372 63,315 68,504 14,270 11,816 14,855 Bioengineering/biomedical ,462 88, ,391 69, ,071 19,288 Chemical , , ,589 95, , ,480 31,546 36,749 39,109 Civil , , , , , ,240 23,748 33,343 38,394 Electrical , , , , , ,312 57,530 82,195 78,740 Mechanical , , , , , ,607 38,378 42,516 47,870 Metallurgical and materials , , , , , ,223 25,688 28,736 35,081 Other, n.e.c , , , , , ,269 53,382 47,285 58,877 All sciences... 6,906,965 10,417,710 11,222,515 5,286,414 8,101,262 8,740,459 1,620,551 2,316,448 2,482,056 Physical sciences , , , , , , , , ,562 Astronomy... 85, , ,219 71,153 99, ,287 14,631 8,473 11,932 Chemistry , , , , , ,509 51,172 60,860 63,121 Physics , , , , , ,339 43,167 39,999 37,478 Other, n.e.c ,553 50,888 51,110 50,223 40,688 37,079 5,330 10,200 14,031 Environmental sciences , , , , , ,916 43,608 57,685 58,702 Atmospheric... 40,911 65,059 67,655 37,945 59,450 60,751 2,966 5,609 6,904 Earth sciences , , , , , ,312 21,545 24,798 23,976 Oceanography , , , , , ,274 5,692 8,217 8,162 Other, n.e.c , , ,239 76, , ,579 13,405 19,061 19,660 Mathematical sciences... 73, , ,705 61,197 88,461 93,036 12,505 18,414 16,669 Computer sciences , , , , , ,983 51,807 70,684 71,372 Life sciences... 4,694,534 7,357,599 7,961,859 3,542,553 5,594,647 6,070,469 1,151,981 1,762,952 1,891,390 Agricultural sciences... 1,159,079 1,580,014 1,683,445 1,124,550 1,539,283 1,634,787 34,529 40,731 48,658 Biological sciences... 1,248,770 1,943,666 2,052, ,115 1,439,132 1,496, , , ,163 Medical sciences... 2,099,034 3,539,561 3,922,223 1,367,076 2,392,569 2,698, ,958 1,146,992 1,223,484 Other, n.e.c , , , , , ,676 60,839 70,695 63,085 Psychology , , ,639 84, , ,125 28,630 31,631 31,514 Social sciences , , , , , , , , ,161 Economics , , , , , ,220 32,181 27,700 22,982 Political science , , ,462 71, , ,256 36,999 57,280 64,206 Sociology... 96, , ,570 76, , ,407 20,279 35,211 38,163 Other, n.e.c , , , , , ,845 49,231 46,954 45,810 Other sciences, n.e.c , , , , , ,988 79,030 88, ,686 KEY: -- = not available n.e.c. = not elsewhere classified NOTE: Because of rounding, detail may not add to totals. SOURCE: National Science Foundation/Division of Science Resources Statistics, Survey of Research and Development Expenditures at Universities and Colleges, Fiscal Year
68 Table B-18. R&D expenditures at historically black colleges and universities, by source of funds and science and engineering field: fiscal years Source and field Total , , , , , , , ,533 Source of funds Federal Government , , , , , , , ,903 State and local government... 9,533 11,162 11,842 11,346 12,908 6,877 10,699 8,922 Industry... 6,724 6,481 6,450 5,182 5,030 5,388 6,084 6,871 Institutional funds... 17,187 21,050 19,697 13,962 10,696 14,681 13,163 18,837 All other sources... 3,434 3,406 3,257 5,623 15,923 11,366 5,286 7,000 Field Engineering... 26,906 35,433 42,823 49,739 48,164 31,905 29,411 33,295 Aeronautical and astronautical... 1,553 2,240 2,544 2,514 2,673 3,923 3,607 3,583 Bioengineering/biomedical Chemical... 1,355 2,070 2,203 5,010 4,660 2,643 2,979 3,313 Civil... 2,838 3,408 4,045 5,003 3,963 3,840 3,228 3,929 Electrical... 6,842 8,089 11,106 8,749 8,191 6,531 6,136 7,684 Mechanical... 7,438 9,548 10,849 16,704 17,899 8,186 6,705 7,374 Metallurgical and materials ,614 2,212 3,561 2, Other, n.e.c.... 6,690 8,464 9,864 8,034 8,077 6,347 5,706 6,493 All sciences , , , , , , , ,238 Physical sciences... 39,458 41,401 40,225 47,801 46,815 48,920 40,558 43,680 Astronomy... 2,614 4,295 5,853 7,269 4,384 4,567 4,306 2,403 Chemistry... 13,715 14,797 15,169 16,534 21,772 22,985 14,056 14,300 Physics... 22,542 21,297 18,935 23,633 20,206 20,800 22,133 26,291 Other, n.e.c , Environmental sciences... 6,087 15,562 17,218 14,214 14,700 11,327 11,226 12,995 Atmospheric ,129 1,810 1,871 4,036 1,726 Earth sciences ,756 2,509 1,753 2,958 2,443 2,850 5,723 Oceanography ,481 Other, n.e.c.... 4,195 12,476 13,643 11,147 9,759 6,566 3,400 4,065 Mathematical sciences... 3,589 5,709 6,504 6,358 5,248 5,054 5,674 5,656 Computer sciences... 5,020 8,837 16,906 15,738 14,299 15,916 14,568 19,982 Life sciences , , , , , , , ,465 Agricultural sciences... 51,099 49,035 48,015 58,412 60,086 48,706 51,590 58,001 Biological sciences... 45,477 43,517 51,172 54,739 57,852 45,581 48,364 59,366 Medical sciences... 15,428 13,110 18,361 21,871 21,009 25,449 30,604 32,674 Other, n.e.c.... 2,739 2,110 3,481 3,331 4,652 4,838 8,385 5,424 Psychology... 3,580 3,947 2,019 1,135 1,002 2,275 1,700 4,865 Social sciences... 8,914 10,228 9,528 9,666 7,920 8,347 11,058 13,059 Economics... 2,741 3,196 1,175 1,426 1,156 1,344 1,427 2,168 Political science Sociology... 3,162 3,593 4,691 2,964 3,033 2,877 4,254 4,023 Other, n.e.c.... 2,462 3,001 2,913 4,289 3,267 3,827 4,646 6,324 Other sciences, n.e.c.... 3,142 12,545 7,256 7,365 11,443 6,507 10,181 14,536 KEY: -- = not available n.e.c. = not elsewhere classified NOTE: Because of rounding, detail may not add to totals. SOURCE: National Science Foundation/Division of Science Resources Statistics, Survey of Research and Development Expenditures at Universities and Colleges, Fiscal Year
69 Table B-19. Federally financed R&D expenditures at historically black colleges and universities, by science and engineering field: fiscal years Field Total , , , , , , , ,903 Engineering... 21,746 30,955 37,300 45,068 41,139 27,644 25,479 28,419 Aeronautical and astronautical... 1,420 2,069 2,128 2,433 2,370 3,619 3,530 3,509 Bioengineering/biomedical Chemical... 1,091 1,803 1,891 4,511 3,668 2,171 2,765 3,109 Civil... 1,941 2,582 2,507 3,781 3,139 2,844 2,246 2,666 Electrical... 5,707 7,467 10,302 8,492 7,730 5,579 5,342 6,862 Mechanical... 6,237 8,566 9,685 15,077 14,657 7,423 6,189 6,784 Metallurgical and materials ,526 1,862 3,269 2, Other, n.e.c.... 5,249 6,942 8,925 7,346 7,022 5,650 4,677 5,019 All sciences , , , , , , , ,484 Physical sciences... 32,337 36,143 35,277 43,101 41,314 43,851 36,326 39,835 Astronomy... 2,518 4,095 5,730 7,246 4,371 4,209 3,874 1,940 Chemistry... 11,682 12,880 13,019 14,014 18,752 21,215 12,917 13,334 Physics... 17,596 18,263 16,312 21,511 17,979 17,920 19,528 23,925 Other, n.e.c Environmental sciences... 4,377 5,517 12,488 11,134 11,926 8,182 9,318 10,781 Atmospheric ,766 1,818 3,996 1,550 Earth sciences ,094 1, ,623 1,042 1,798 3,908 Oceanography ,376 Other, n.e.c.... 3,954 3,789 10,523 9,497 8,458 4,939 2,700 3,947 Mathematical sciences... 2,928 4,291 4,261 4,328 2,530 2,747 4,370 4,160 Computer sciences... 4,217 6,997 13,428 13,855 12,445 13,780 12,796 18,576 Life sciences... 97,711 94, , , , , , ,566 Agricultural sciences... 44,511 42,445 41,803 50,303 47,640 40,446 43,801 46,130 Biological sciences... 39,418 39,511 44,633 49,229 53,175 42,388 44,966 55,819 Medical sciences... 12,271 11,263 16,119 20,730 18,904 22,886 26,848 29,196 Other, n.e.c.... 1,511 1,087 2,281 1,714 3,741 3,629 6,403 4,421 Psychology... 2,930 3,665 1,729 1, ,777 1,334 4,534 Social sciences... 6,477 7,195 6,393 7,069 5,451 5,242 8,137 10,049 Economics... 2,595 2,904 1,014 1,258 1,063 1,171 1,121 1,955 Political science Sociology... 2,110 2,588 3,587 2,177 2,006 1,490 3,380 3,587 Other, n.e.c.... 1,498 1,530 1,367 3,177 2,128 2,447 3,128 4,102 Other sciences, n.e.c.... 1,838 10,266 6,550 6,700 9,389 3,941 8,309 9,983 KEY: -- = not available n.e.c. = not elsewhere classified NOTE: Because of rounding, detail may not add to totals. SOURCE: National Science Foundation/Division of Science Resources Statistics, Survey of Research and Development Expenditures at Universities and Colleges, Fiscal Year
70 Table B-20. Non-Federal R&D expenditures at historically black colleges and universities, by source of funds and science and engineering field: fiscal years Source and field Total... 36,878 42,099 41,246 36,113 44,557 38,312 35,232 41,630 Source of funds State and local government... 9,533 11,162 11,842 11,346 12,908 6,877 10,699 8,922 Industry... 6,724 6,481 6,450 5,182 5,030 5,388 6,084 6,871 Institutional funds... 17,187 21,050 19,697 13,962 10,696 14,681 13,163 18,837 All other sources... 3,434 3,406 3,257 5,623 15,923 11,366 5,286 7,000 Field Engineering... 5,160 4,478 5,523 4,671 7,025 4,261 3,932 4,876 Aeronautical and astronautical Bioengineering/biomedical Chemical Civil ,538 1, ,263 Electrical... 1, Mechanical... 1, ,164 1,627 3, Metallurgical and materials Other, n.e.c.... 1,441 1, , ,029 1,474 All sciences... 31,718 37,621 35,723 31,442 37,532 34,051 31,300 36,754 Physical sciences... 7,121 5,258 4,948 4,700 5,501 5,069 4,232 3,845 Astronomy Chemistry... 2,033 1,917 2,150 2,520 3,020 1,770 1, Physics... 4,946 3,034 2,623 2,122 2,227 2,880 2,605 2,366 Other, n.e.c Environmental sciences... 1,710 10,045 4,730 3,080 2,774 3,145 1,908 2,214 Atmospheric Earth sciences ,161 1,032 1,335 1,401 1,052 1,815 Oceanography Other, n.e.c ,687 3,120 1,650 1,301 1, Mathematical sciences ,418 2,243 2,030 2,718 2,307 1,304 1,496 Computer sciences ,840 3,478 1,883 1,854 2,136 1,772 1,406 Life sciences... 17,032 13,466 16,193 16,377 20,139 15,225 16,925 19,899 Agricultural sciences... 6,588 6,590 6,212 8,109 12,446 8,260 7,789 11,871 Biological sciences... 6,059 4,006 6,539 5,510 4,677 3,193 3,398 3,547 Medical sciences... 3,157 1,847 2,242 1,141 2,105 2,563 3,756 3,478 Other, n.e.c.... 1,228 1,023 1,200 1, ,209 1,982 1,003 Psychology Social sciences... 2,437 3,033 3,135 2,597 2,469 3,105 2,921 3,010 Economics Political science Sociology... 1,052 1,005 1, ,027 1, Other, n.e.c ,471 1,546 1,112 1,139 1,380 1,518 2,222 Other sciences, n.e.c.... 1,304 2, ,054 2,566 1,872 4,553 KEY: -- = not available n.e.c. = not elsewhere classified NOTE: Because of rounding, detail may not add to totals. SOURCE: National Science Foundation/Division of Science Resources Statistics, Survey of Research and Development Expenditures at Universities and Colleges, Fiscal Year
71 Table B-21. R&D expenditures at universities and colleges, by geographic division and source of funds: fiscal year 2001 [Dollars in millions] Division Total Federal Non-Federal Total... 32,723 19,191 13,532 New England... 2,560 1, Middle Atlantic... 4,773 2,981 1,792 East North Central... 4,697 2,558 2,139 West North Central... 2,215 1,136 1,079 South Atlantic... 6,127 3,578 2,549 East South Central... 1, West South Central... 3,072 1,574 1,498 Mountain... 2,034 1, Pacific... 5,767 3,427 2,340 Outlying Areas NOTE: Because of rounding, detail may not add to totals. SOURCE: National Science Foundation/Division of Science Resources Statistics, Survey of Research and Development Expenditures at Universities and Colleges, Fiscal Year
72 Table B-22. R&D expenditures at doctorate-granting institutions, by geographic division, State, and source of funds: fiscal year 2001 Page 1 of 2 Federal State Institu- All other Division and State Total Government and local Industry tional sources governments funds Total... 32,213,590 18,875,815 2,267,195 2,197,971 6,496,214 2,376,395 New England... 2,530,338 1,745,964 82, , , ,688 Connecticut , ,186 14,775 24,056 74,450 54,327 Maine... 64,070 23,873 7,886 3,562 24,631 4,118 Massachusetts... 1,558,338 1,131,468 38, ,438 78, ,090 New Hampshire , ,067 12,194 12,140 43,031 14,543 Rhode Island , ,560 5,511 2,229 29,617 3,647 Vermont... 75,597 48,810 4,052 6,434 12,338 3,963 Middle Atlantic... 4,700,735 2,934, , , , ,147 New Jersey , ,378 52,105 33, ,034 80,505 New York... 2,425,006 1,533, , , , ,949 Pennsylvania... 1,668,027 1,131,478 50, , , ,693 East North Central... 4,646,390 2,540, , ,458 1,188, ,864 Illinois... 1,268, ,648 81,109 57, ,663 85,050 Indiana , ,179 45,428 41, ,641 28,685 Michigan... 1,101, ,516 66,453 64, ,818 74,448 Ohio , ,751 80,080 85, ,722 74,915 Wisconsin , ,410 40,036 20, ,614 70,766 West North Central... 2,197,565 1,127, , , , ,066 Iowa , ,650 59,206 34, ,193 22,197 Kansas , ,218 44,617 12,318 74,129 21,357 Minnesota , ,378 58,053 26,458 79,800 33,531 Missouri , ,017 24,037 37, ,412 41,288 Nebraska ,407 76,361 7,007 17, ,800 12,457 North Dakota... 84,574 30,950 1,440 6,242 42,409 3,533 South Dakota... 32,185 16,407 9, ,631 2,703 South Atlantic... 6,031,281 3,505, , ,835 1,223, ,715 Delaware... 77,491 41,830 4,469 5,041 16,464 9,687 District of Columbia , ,538 2,679 12,789 3,822 15,457 Florida , , ,571 90, ,559 46,294 Georgia , ,261 78,060 94, ,816 43,502 Maryland... 1,638,869 1,190,690 59,492 71, , ,898 North Carolina... 1,114, , , , ,890 38,871 South Carolina , ,086 29,517 22, ,480 6,473 Virginia , ,783 69,282 45, ,940 36,425 West Virginia... 78,658 35,420 2,416 6,526 29,188 5,108 East South Central... 1,369, , ,052 64, ,339 76,657 Alabama , ,567 5,232 21,522 84,856 18,583 Kentucky , ,686 39,866 13,844 99,551 20,686 Mississippi , ,412 39,287 7,929 47,418 1,394 Tennessee , ,017 43,667 21,476 55,514 35,994 West South Central... 3,003,460 1,526, , , , ,692 Arkansas ,659 59,800 36,542 7,124 21,580 8,613 Louisiana , ,409 83,867 25,503 99,118 39,112 Oklahoma ,559 93,241 40,305 17,342 88,019 12,652 Texas... 2,196,233 1,199, , , , ,315 63
73 Table B-22. R&D expenditures at doctorate-granting institutions, by geographic division, State, and source of funds: fiscal year 2001 Page 2 of 2 Federal State Institu- All other Division and State Total Government and local Industry tional sources governments funds Mountain... 2,018,318 1,272, , , ,016 95,263 Arizona , ,716 14,269 29, ,472 21,167 Colorado , ,507 21,656 28,942 56,152 25,222 Idaho... 82,496 34,347 18,389 6,683 21,948 1,129 Montana ,128 54,051 18,298 8,532 20,919 1,328 Nevada ,934 69,085 10,275 5,078 27,681 3,815 New Mexico , ,884 11,860 12,297 55,841 8,092 Utah , ,163 21,445 15,002 54,787 33,730 Wyoming... 41,632 20,017 2,038 2,581 16, Pacific... 5,652,247 3,363, , ,661 1,150, ,179 Alaska ,195 55,287 2,999 28,352 23,557 0 California... 4,323,987 2,472, , , , ,750 Hawaii ,976 97,716 33,125 7,232 18,903 0 Oregon , ,327 41,274 14,310 35,283 18,332 Washington , ,763 17,174 47, ,779 22,097 Outlying Areas... 63,755 44,908 2,911 2,285 12,527 1,124 NOTE: Because of rounding, detail may not add to totals. SOURCE: National Science Foundation/Division of Science Resources Statistics, Survey of Research and Development Expenditures at Universities and Colleges, Fiscal Year
74 Table B-23. R&D expenditures at doctorate-granting institutions, by geographic division and State: fiscal years Page 1 of 2 Division and State Total... 20,680,773 21,797,182 22,655,732 23,940,340 25,391,445 27,056,601 29,589,621 32,213,590 New England... 1,785,924 1,804,527 1,859,407 1,976,396 2,048,610 2,147,460 2,329,915 2,530,338 Connecticut , , , , , , , ,794 Maine... 29,393 31,901 34,684 33,144 33,106 41,452 54,821 64,070 Massachusetts... 1,134,408 1,148,855 1,177,026 1,271,576 1,325,699 1,378,774 1,466,500 1,558,338 New Hampshire ,552 93,073 98, , , , , ,975 Rhode Island ,848 99, , , , , , ,564 Vermont... 51,775 54,065 53,659 59,526 57,832 64,049 63,391 75,597 Middle Atlantic... 3,137,604 3,313,035 3,372,963 3,481,082 3,694,046 3,921,876 4,339,839 4,700,735 New Jersey , , , , , , , ,702 New York... 1,655,487 1,735,458 1,732,340 1,779,991 1,881,274 2,028,668 2,241,066 2,425,006 Pennsylvania... 1,076,098 1,137,535 1,187,706 1,239,039 1,328,512 1,372,608 1,532,751 1,668,027 East North Central... 2,948,397 3,077,798 3,240,867 3,431,335 3,645,896 3,876,802 4,228,769 4,646,390 Illinois , , , ,515 1,011,054 1,086,793 1,157,321 1,268,364 Indiana , , , , , , , ,487 Michigan , , , , , ,028 1,001,761 1,101,475 Ohio , , , , , , , ,336 Wisconsin , , , , , , , ,728 West North Central... 1,401,054 1,475,739 1,514,263 1,618,559 1,674,919 1,810,900 1,995,060 2,197,565 Iowa , , , , , , , ,923 Kansas , , , , , , , ,639 Minnesota , , , , , , , ,220 Missouri , , , , , , , ,617 Nebraska , , , , , , , ,407 North Dakota... 55,709 59,617 71,849 56,096 56,945 61,695 67,406 84,574 South Dakota... 21,680 21,392 25,440 24,558 25,140 25,522 27,269 32,185 South Atlantic... 3,866,307 4,138,352 4,275,841 4,567,858 4,790,239 5,092,481 5,493,533 6,031,281 Delaware... 50,734 53,161 54,154 65,095 69,896 73,521 74,711 77,491 District of Columbia , , , , , , , ,285 Florida , , , , , , , ,794 Georgia , , , , , , , ,088 Maryland... 1,169,765 1,204,257 1,240,128 1,276,293 1,323,002 1,382,260 1,501,641 1,638,869 North Carolina , , , , , ,653 1,022,502 1,114,275 South Carolina , , , , , , , ,545 Virginia , , , , , , , ,276 West Virginia... 59,286 53,399 55,206 63,638 62,533 63,557 72,493 78,658 East South Central , , , ,151 1,089,345 1,154,314 1,289,819 1,369,501 Alabama , , , , , , , ,760 Kentucky , , , , , , , ,633 Mississippi , , , , , , , ,440 Tennessee , , , , , , , ,668 West South Central... 2,008,807 2,078,807 2,137,021 2,233,877 2,335,002 2,511,890 2,766,966 3,003,460 Arkansas... 81,414 88,667 94, , , , , ,659 Louisiana , , , , , , , ,009 Oklahoma , , , , , , , ,559 Texas... 1,477,858 1,485,644 1,527,990 1,607,052 1,671,824 1,800,582 2,002,166 2,196,233 65
75 Table B-23. R&D expenditures at doctorate-granting institutions, by geographic division and State: fiscal years Page 2 of 2 Division and State Mountain... 1,327,065 1,463,043 1,468,771 1,535,071 1,641,813 1,726,031 1,866,528 2,018,318 Arizona , , , , , , , ,548 Colorado , , , , , , , ,479 Idaho... 57,843 61,906 68,032 66,288 72,395 71,674 73,726 82,496 Montana... 53,057 66,879 71,518 70,591 72,425 79,847 94, ,128 Nevada... 79,121 86,902 84,970 88,331 83,888 91, , ,934 New Mexico , , , , , , , ,974 Utah , , , , , , , ,127 Wyoming... 38,464 40,470 40,553 47,753 48,500 47,197 43,094 41,632 Pacific... 3,302,941 3,493,109 3,781,718 4,038,564 4,383,983 4,724,304 5,204,663 5,652,247 Alaska... 76,093 72,216 71,381 70,943 75,606 88, , ,195 California... 2,465,183 2,597,919 2,817,913 3,049,252 3,314,274 3,572,900 3,962,940 4,323,987 Hawaii... 70,079 78, , , , , , ,976 Oregon , , , , , , , ,526 Washington , , , , , , , ,563 Outlying Areas... 51,407 69,636 72,719 76,447 87,592 90,543 74,529 63,755 NOTE: Because of rounding, detail may not add to totals. SOURCE: National Science Foundation/Division of Science Resources Statistics, Survey of Research and Development Expenditures at Universities and Colleges, Fiscal Year
76 Table B-24. Federally financed R&D expenditures at doctorate-granting institutions, by geographic division and State: fiscal years Page 1 of 2 Division and State Total... 12,438,537 13,104,006 13,602,735 14,049,527 14,868,567 15,809,847 17,228,972 18,875,815 New England... 1,199,237 1,235,543 1,251,886 1,355,533 1,433,429 1,493,941 1,606,136 1,745,964 Connecticut , , , , , , , ,186 Maine... 11,386 15,789 16,211 15,066 13,028 19,163 24,412 23,873 Massachusetts , , , , ,309 1,007,015 1,055,213 1,131,468 New Hampshire... 66,794 60,131 62,987 67,282 70,966 77,327 95, ,067 Rhode Island... 69,918 71,381 77,007 79,417 77,737 81,512 88, ,560 Vermont... 33,695 32,932 31,521 34,042 31,460 36,085 39,861 48,810 Middle Atlantic... 2,003,044 2,070,936 2,121,888 2,175,103 2,288,334 2,445,094 2,721,520 2,934,476 New Jersey , , , , , , , ,378 New York... 1,094,689 1,110,597 1,113,168 1,144,937 1,194,825 1,309,809 1,442,637 1,533,620 Pennsylvania , , , , , ,583 1,021,987 1,131,478 East North Central... 1,660,033 1,728,541 1,790,242 1,894,206 2,000,013 2,128,147 2,292,897 2,540,504 Illinois , , , , , , , ,648 Indiana , , , , , , , ,179 Michigan , , , , , , , ,516 Ohio , , , , , , , ,751 Wisconsin , , , , , , , ,410 West North Central , , , , , ,037 1,014,497 1,127,981 Iowa , , , , , , , ,650 Kansas... 64,115 70,026 68,823 75,116 80,214 88, , ,218 Minnesota , , , , , , , ,378 Missouri , , , , , , , ,017 Nebraska... 52,971 55,421 52,186 61,231 62,578 61,226 65,653 76,361 North Dakota... 27,537 27,841 35,659 24,207 23,191 25,923 29,343 30,950 South Dakota... 9,971 10,623 11,128 10,879 11,702 12,759 13,659 16,407 South Atlantic... 2,406,203 2,545,918 2,620,350 2,673,652 2,840,140 2,968,026 3,147,527 3,505,971 Delaware... 26,250 27,352 29,509 32,031 33,688 34,628 37,716 41,830 District of Columbia , , , , , , , ,538 Florida , , , , , , , ,670 Georgia , , , , , , , ,261 Maryland , , , ,562 1,007,296 1,053,523 1,084,937 1,190,690 North Carolina , , , , , , , ,693 South Carolina... 90, , , , , , , ,086 Virginia , , , , , , , ,783 West Virginia... 35,162 30,464 31,034 29,623 25,010 26,330 33,631 35,420 East South Central , , , , , , , ,682 Alabama , , , , , , , ,567 Kentucky... 58,080 59,811 64,756 75,649 76,003 81,720 92, ,686 Mississippi... 61,265 62,585 62,497 62,350 73,329 78, , ,412 Tennessee , , , , , , , ,017 West South Central , ,913 1,033,867 1,097,478 1,146,331 1,231,168 1,387,937 1,526,571 Arkansas... 29,506 33,427 32,917 35,146 38,165 42,467 54,407 59,800 Louisiana , , , , , , , ,409 Oklahoma... 59,053 59,504 72,817 71,421 81,689 86,046 90,872 93,241 Texas , , , , , ,841 1,079,576 1,199,121 67
77 Table B-24. Federally financed R&D expenditures at doctorate-granting institutions, by geographic division and State: fiscal years Page 2 of 2 Division and State Mountain , , , , ,357 1,065,685 1,180,108 1,272,770 Arizona , , , , , , , ,716 Colorado , , , , , , , ,507 Idaho... 19,527 21,307 20,410 20,476 25,444 28,116 28,888 34,347 Montana... 24,413 27,382 29,258 31,261 35,730 40,858 48,942 54,051 Nevada... 43,614 47,708 46,713 43,934 45,496 51,387 60,005 69,085 New Mexico , , , , , , , ,884 Utah , , , , , , , ,163 Wyoming... 15,115 15,373 14,991 15,003 17,806 19,109 16,556 20,017 Pacific... 2,250,169 2,380,426 2,581,293 2,537,345 2,708,150 2,908,714 3,132,366 3,363,988 Alaska... 40,770 37,285 30,351 28,127 31,505 34,647 46,605 55,287 California... 1,697,546 1,800,500 1,947,922 1,875,953 1,989,478 2,138,671 2,306,943 2,472,895 Hawaii... 39,392 44,238 66,902 72,421 86,886 93,418 95,419 97,716 Oregon , , , , , , , ,327 Washington , , , , , , , ,763 Outlying Areas... 29,540 39,353 42,210 43,048 45,275 50,810 42,803 44,908 NOTE: Because of rounding, detail may not add to totals. SOURCE: National Science Foundation/Division of Science Resources Statistics, Survey of Research and Development Expenditures at Universities and Colleges, Fiscal Year
78 Table B-25. State and local government-financed R&D expenditures at doctorate-granting institutions, by geographic division and State: fiscal years Page 1 of 2 Division and State Total... 1,514,040 1,645,636 1,767,188 1,861,151 1,891,932 1,948,373 2,152,528 2,267,195 New England... 35,706 42,583 57,780 56,889 60,421 61,973 78,669 82,443 Connecticut... 12,297 18,732 19,938 13,730 13,157 10,783 15,124 14,775 Maine... 2,290 2,005 1,594 1,551 1,796 1,389 5,872 7,886 Massachusetts... 12,503 13,443 25,244 29,774 31,663 33,637 40,100 38,025 New Hampshire... 2,890 3,963 7,308 7,990 8,300 8,961 9,747 12,194 Rhode Island... 3,154 1,986 1,172 1,161 2,857 4,485 4,564 5,511 Vermont... 2,572 2,454 2,524 2,683 2,648 2,718 3,262 4,052 Middle Atlantic , , , , , , , ,586 New Jersey... 39,167 39,535 42,834 37,274 39,773 45,013 46,015 52,105 New York... 77,386 99,617 83,812 80,674 78,761 82,155 99, ,148 Pennsylvania... 28,675 34,790 36,803 41,475 42,521 51,645 43,716 50,333 East North Central , , , , , , , ,106 Illinois... 43,863 47,279 47,358 53,968 49,572 60,265 71,372 81,109 Indiana... 19,823 22,463 23,232 23,826 25,517 27,877 34,369 45,428 Michigan... 41,394 51,836 48,587 50,845 56,061 57,543 62,929 66,453 Ohio... 48,287 45,556 55,084 70,078 74,406 67,991 83,373 80,080 Wisconsin... 41,621 42,549 42,093 41,073 43,524 42,552 45,092 40,036 West North Central , , , , , , , ,401 Iowa... 46,991 46,935 49,456 52,435 52,700 53,114 55,838 59,206 Kansas... 35,147 39,353 40,456 45,002 46,941 50,300 43,329 44,617 Minnesota... 45,786 49,543 47,842 50,539 47,118 49,082 52,346 58,053 Missouri... 19,270 21,486 21,691 21,342 23,506 24,812 25,619 24,037 Nebraska... 39,606 42,383 45,388 47,142 46,602 10,648 7,226 7,007 North Dakota... 1,493 1,534 1,555 1,070 1,123 1,965 2,417 1,440 South Dakota... 7,618 6,772 9,046 8,341 8,355 7,798 6,525 9,041 South Atlantic , , , , , , , ,686 Delaware... 2,180 2,144 2,410 2,977 4,600 5,310 4,032 4,469 District of Columbia... 1, ,446 1,267 1,593 2,582 3,328 2,679 Florida... 41,240 41,466 83,234 90,076 79,258 90, , ,571 Georgia... 44,663 55,663 61,862 68,844 69,604 73,687 76,599 78,060 Maryland... 88,927 79,375 84,411 82,072 62,896 76,138 82,069 59,492 North Carolina... 92,613 99, , , , , , ,200 South Carolina... 15,304 17,899 20,887 20,697 27,069 26,593 31,503 29,517 Virginia... 47,020 46,849 39,492 46,848 48,728 49,482 63,594 69,282 West Virginia... 1,936 2,023 2,289 2,413 2,954 3,149 2,907 2,416 East South Central... 66,600 75,753 82,190 79,932 86,605 90, , ,052 Alabama... 6,052 6,991 5,789 5,251 7,071 8,923 6,052 5,232 Kentucky... 6,197 9,589 11,467 7,446 14,254 12,441 20,840 39,866 Mississippi... 20,528 23,778 29,173 29,324 29,455 31,138 38,833 39,287 Tennessee... 33,823 35,395 35,761 37,911 35,825 38,196 38,484 43,667 West South Central , , , , , , , ,867 Arkansas... 23,342 24,233 26,073 29,690 33,089 32,499 34,621 36,542 Louisiana... 65,496 71,988 72,453 75,379 78,040 79,484 74,917 83,867 Oklahoma... 19,275 19,699 30,472 35,622 37,406 41,610 42,142 40,305 Texas , , , , , , , ,153 69
79 Table B-25. State and local government-financed R&D expenditures at doctorate-granting institutions, by geographic division and State: fiscal years Page 2 of 2 Division and State Mountain... 72, , , , , , , ,230 Arizona... 7,257 8,080 8,022 10,266 11,812 11,753 15,221 14,269 Colorado... 8,745 22,122 28,049 26,833 25,787 24,672 23,700 21,656 Idaho... 9,559 20,671 21,699 21,266 21,760 15,718 18,545 18,389 Montana... 9,268 12,914 13,433 14,368 13,784 13,719 16,763 18,298 Nevada... 4,570 6,460 3,538 4,411 4,533 5,442 7,032 10,275 New Mexico... 14,573 17,298 16,842 14,954 12,555 12,242 11,920 11,860 Utah... 14,808 15,431 16,810 17,876 17,556 19,852 20,365 21,445 Wyoming... 3,820 3,125 3,768 5,990 5,366 2,730 1,470 2,038 Pacific , , , , , , , ,913 Alaska... 4,625 5,607 5,842 3,964 3,680 3,913 3,267 2,999 California , , , , , , , ,341 Hawaii... 25,204 26,789 31,826 28,440 37,002 35,111 35,474 33,125 Oregon... 29,042 30,312 31,906 32,335 29,728 30,534 35,400 41,274 Washington... 11,416 13,761 11,356 14,845 12,748 15,219 14,268 17,174 Outlying Areas... 8,829 18,763 20,873 21,763 22,086 23,933 14,107 2,911 NOTE: Because of rounding, detail may not add to totals. SOURCE: National Science Foundation/Division of Science Resources Statistics, Survey of Research and Development Expenditures at Universities and Colleges, Fiscal Year
80 Table B-26. Industry-financed R&D expenditures at doctorate-granting institutions, by geographic division and State: fiscal years Page 1 of 2 Division and State Total... 1,392,655 1,456,474 1,571,170 1,701,822 1,855,200 1,994,708 2,116,094 2,197,971 New England , , , , , , , ,859 Connecticut... 18,814 20,327 23,378 25,387 25,916 25,904 28,102 24,056 Maine... 4,406 4,158 4,214 5,609 7,074 2,324 2,899 3,562 Massachusetts... 95,741 89, , , , , , ,438 New Hampshire... 4,309 3,919 3,886 4,880 6,209 8,939 9,197 12,140 Rhode Island... 2,831 1,991 2,340 1,995 2,074 2,901 2,735 2,229 Vermont... 4,878 5,467 5,231 5,399 5,513 7,112 5,713 6,434 Middle Atlantic , , , , , , , ,510 New Jersey... 30,042 25,861 23,703 26,186 27,128 30,227 29,633 33,680 New York... 90,450 94,693 94,056 96,133 93,123 97, , ,770 Pennsylvania , , , , , , , ,060 East North Central , , , , , , , ,458 Illinois... 42,948 42,519 48,582 48,587 56,246 55,164 54,352 57,894 Indiana... 31,873 34,542 35,539 33,321 40,336 41,461 42,009 41,554 Michigan... 47,802 51,758 59,031 57,538 59,396 60,998 66,197 64,240 Ohio... 49,197 54,316 71,745 82,653 87,999 80,319 87,337 85,868 Wisconsin... 19,297 16,873 18,300 19,075 18,258 18,036 19,957 20,902 West North Central... 98, , , , , , , ,743 Iowa... 18,410 19,376 22,269 24,211 30,997 35,706 32,455 34,677 Kansas... 7,861 11,434 12,131 11,907 12,104 19,182 23,269 12,318 Minnesota... 23,809 23,510 23,809 24,280 24,128 23,953 26,422 26,458 Missouri... 35,140 36,639 27,107 30,047 29,589 30,301 33,439 37,863 Nebraska... 10,664 10,933 12,268 13,686 16,749 17,231 17,635 17,782 North Dakota... 1,989 3,346 4,505 3,439 3,806 3,608 4,400 6,242 South Dakota South Atlantic , , , , , , , ,835 Delaware... 4,117 3,681 2,964 3,361 3,859 4,152 3,757 5,041 District of Columbia... 11,804 13,297 14,448 18,381 19,481 14,349 16,286 12,789 Florida... 37,516 36,382 46,717 55,762 51,668 63,533 78,456 90,700 Georgia... 53,469 55,129 63,791 73,284 85,820 89,612 92,212 94,449 Maryland... 45,843 55,986 58,767 41,067 41,631 33,641 50,035 71,874 North Carolina... 67,511 75,587 87,320 97, , , , ,621 South Carolina... 18,990 19,364 10,678 8,682 11,400 12,823 15,470 22,989 Virginia... 41,271 42,670 31,731 37,488 43,241 39,063 40,173 45,846 West Virginia... 4,058 3,160 3,608 3,719 4,547 5,532 7,510 6,526 East South Central... 65,446 71,065 77,337 71,065 79,101 74,385 66,369 64,771 Alabama... 25,170 29,164 29,706 29,685 30,279 22,287 19,581 21,522 Kentucky... 15,970 16,627 19,686 14,781 18,468 21,209 17,745 13,844 Mississippi... 8,885 8,929 11,122 9,169 10,399 9,570 10,973 7,929 Tennessee... 15,421 16,345 16,823 17,430 19,955 21,319 18,070 21,476 West South Central , , , , , , , ,810 Arkansas... 7,827 7,758 8,272 7,636 8,185 10,236 8,067 7,124 Louisiana... 19,975 21,410 23,466 32,737 29,653 25,534 25,522 25,503 Oklahoma... 10,958 11,453 11,804 14,036 13,320 14,764 16,754 17,342 Texas... 96, , , , , , , ,841 71
81 Table B-26. Industry-financed R&D expenditures at doctorate-granting institutions, by geographic division and State: fiscal years Page 2 of 2 Division and State Mountain... 96,402 86,825 89,540 92,129 99,936 98, , ,039 Arizona... 21,746 23,238 17,099 18,584 22,125 22,242 28,519 29,924 Colorado... 30,340 20,605 23,695 23,756 26,785 27,151 23,819 28,942 Idaho... 10,437 8,134 10,333 9,164 8,059 3,962 5,338 6,683 Montana... 3,965 5,825 7,000 8,470 8,437 8,326 9,997 8,532 Nevada... 7,054 6,941 8,042 5,464 5,355 5,196 5,532 5,078 New Mexico... 13,611 10,696 11,840 9,915 12,559 12,866 11,692 12,297 Utah... 8,064 9,456 9,445 14,550 13,502 15,730 17,853 15,002 Wyoming... 1,185 1,930 2,086 2,226 3,114 3,206 2,941 2,581 Pacific , , , , , , , ,661 Alaska... 4,441 5,470 9,965 12,769 16,081 19,340 19,686 28,352 California , , , , , , , ,017 Hawaii ,088 5,944 10,949 13,021 11,158 7,232 Oregon... 9,672 11,693 8,620 9,647 4,173 4,189 14,665 14,310 Washington... 36,350 39,429 39,329 40,882 41,528 54,477 61,984 47,750 Outlying Areas... 1,241 1,948 2,294 2,625 5,339 3,381 4,925 2,285 NOTE: Because of rounding, detail may not add to totals. SOURCE: National Science Foundation/Division of Science Resources Statistics, Survey of Research and Development Expenditures at Universities and Colleges, Fiscal Year
82 Table B-27. Institutionally financed R&D expenditures at doctorate-granting institutions, by geographic division and State: fiscal years Page 1 of 2 Division and State Total... 3,781,781 3,999,375 4,119,658 4,642,387 4,947,552 5,348,660 5,881,943 6,496,214 New England , , , , , , , ,384 Connecticut... 79,487 78,243 78,954 76,391 66,868 66,257 73,580 74,450 Maine... 10,907 9,357 12,172 10,526 10,810 16,326 19,674 24,631 Massachusetts... 96,382 91, , ,308 96,413 81,592 91,919 78,317 New Hampshire... 16,859 12,948 11,549 15,058 17,439 18,102 22,924 43,031 Rhode Island... 23,965 22,325 24,617 26,545 26,130 28,474 30,289 29,617 Vermont... 7,496 9,519 10,660 11,465 11,920 11,896 10,239 12,338 Middle Atlantic , , , , , , , ,016 New Jersey , , , , , , , ,034 New York , , , , , , , ,519 Pennsylvania , , , , , , , ,463 East North Central , , , , , ,336 1,062,820 1,188,458 Illinois , , , , , , , ,663 Indiana... 83, , , , , , , ,641 Michigan , , , , , , , ,818 Ohio , , , , , , , ,722 Wisconsin... 85,457 92,115 93,718 97, , , , ,614 West North Central , , , , , , , ,374 Iowa... 76,798 77,262 79,636 83,285 87,842 89, , ,193 Kansas... 53,884 52,517 52,546 56,752 56,206 58,179 69,864 74,129 Minnesota... 46,551 46,255 46,759 53,751 55,541 61,591 70,348 79,800 Missouri... 87,905 92,974 91, , , , , ,412 Nebraska... 40,842 46,329 44,096 50,105 55, , , ,800 North Dakota... 23,224 25,043 27,980 25,554 26,091 27,782 28,651 42,409 South Dakota... 2,616 2,341 3,024 3,043 2,647 2,397 3,825 3,631 South Atlantic , , , , , ,474 1,102,295 1,223,074 Delaware... 13,946 14,560 13,074 20,125 19,222 19,401 19,430 16,464 District of Columbia... 19,322 19,937 21,321 24,092 25,865 12,398 15,088 3,822 Florida , , , , , , , ,559 Georgia , , , , , , , ,816 Maryland... 94, , , , , , , ,915 North Carolina... 65,048 63,984 66, ,757 94, , , ,890 South Carolina... 54,049 53,994 48,596 65,914 84, , , ,480 Virginia... 68,544 64,531 61,909 74,018 76,562 85,076 97, ,940 West Virginia... 14,641 13,470 14,450 23,190 26,097 24,302 23,794 29,188 East South Central , , , , , , , ,339 Alabama... 78,018 79,861 77,312 84,747 82,108 78,983 87,899 84,856 Kentucky... 40,965 43,883 49,194 53,070 83, , ,395 99,551 Mississippi... 12,414 11,211 11,600 13,623 30,603 33,272 46,603 47,418 Tennessee... 40,912 45,116 50,204 52,844 53,525 58,943 67,116 55,514 West South Central , , , , , , , ,520 Arkansas... 17,495 19,987 21,459 24,261 25,542 14,856 20,321 21,580 Louisiana... 68,255 71,436 71,771 80,368 80,576 96,134 94,887 99,118 Oklahoma... 68,401 79,107 72,669 52,462 59,439 76,192 87,952 88,019 Texas , , , , , , , ,803 73
83 Table B-27. Institutionally financed R&D expenditures at doctorate-granting institutions, by geographic division and State: fiscal years Page 2 of 2 Division and State Mountain , , , , , , , ,016 Arizona , , , , , , , ,472 Colorado... 54,001 52,080 50,995 50,422 68,065 59,833 52,784 56,152 Idaho... 17,728 10,256 15,143 14,930 16,334 16,877 17,505 21,948 Montana... 14,902 20,172 21,133 15,684 13,435 15,528 15,658 20,919 Nevada... 22,603 24,798 25,924 30,749 24,314 25,484 29,040 27,681 New Mexico... 30,561 38,562 39,092 42,442 45,780 39,260 41,740 55,841 Utah... 30,278 28,065 26,618 40,376 42,561 46,220 43,818 54,787 Wyoming... 16,669 17,454 18,280 23,743 21,275 20,648 20,103 16,216 Pacific , , , , , ,142 1,001,196 1,150,506 Alaska... 26,253 23,850 25,217 26,082 24,340 30,908 32,937 23,557 California , , , , , , , ,984 Hawaii... 3,290 3,738 4,386 13,297 13,170 15,260 19,249 18,903 Oregon... 37,826 37,453 40,769 35,824 37,747 45,670 32,239 35,283 Washington... 58,959 77,212 76,573 69,433 74,732 77,072 99, ,779 Outlying Areas... 10,518 8,420 6,685 7,170 12,818 11,577 12,114 12,527 NOTE: Because of rounding, detail may not add to totals. SOURCE: National Science Foundation/Division of Science Resources Statistics, Survey of Research and Development Expenditures at Universities and Colleges, Fiscal Year
84 Table B-28. All other sources of financed R&D expenditures at doctorate-granting institutions, by geographic division and State: fiscal years Page 1 of 2 Division and State Total... 1,553,760 1,591,691 1,594,981 1,685,453 1,828,194 1,955,013 2,210,084 2,376,395 New England , , , , , , , ,688 Connecticut... 33,781 32,008 31,931 34,775 34,801 39,399 44,868 54,327 Maine ,250 1,964 4,118 Massachusetts , ,713 95,782 95, , , , ,090 New Hampshire... 10,700 12,112 12,908 12,295 14,409 13,806 13,824 14,543 Rhode Island... 1,980 1,725 2,130 2,859 3,181 3,496 3,599 3,647 Vermont... 3,134 3,693 3,723 5,937 6,291 6,238 4,316 3,963 Middle Atlantic , , , , , , , ,147 New Jersey... 29,251 33,434 29,016 34,968 39,171 43,194 73,704 80,505 New York , , , , , , , ,949 Pennsylvania... 59,943 65,534 66,801 69,752 68,170 84, , ,693 East North Central , , , , , , , ,864 Illinois... 69,657 64,082 62,603 75,453 79,767 82,245 80,293 85,050 Indiana... 18,464 19,521 19,798 20,122 19,483 17,452 20,438 28,685 Michigan... 60,776 57,594 76,555 71,879 68,734 62,507 69,744 74,448 Ohio... 62,613 58,828 46,249 49,219 49,335 57,724 68,276 74,915 Wisconsin... 52,970 50,823 53,452 55,567 59,153 60,185 67,314 70,766 West North Central... 80,046 85,170 90,793 99, , , , ,066 Iowa... 14,879 14,510 18,547 18,746 18,196 13,686 21,416 22,197 Kansas... 7,873 8,166 7,819 8,809 16,000 16,592 14,848 21,357 Minnesota... 20,826 22,544 23,990 34,525 28,943 29,056 32,395 33,531 Missouri... 30,310 33,343 32,323 28,801 42,259 45,173 52,178 41,288 Nebraska... 3,798 3,567 4,460 5,209 5,253 13,532 16,686 12,457 North Dakota... 1,466 1,853 2,150 1,826 2,734 2,417 2,595 3,533 South Dakota ,187 1,504 1,484 1,941 2,262 2,899 2,703 South Atlantic , , , , , , , ,715 Delaware... 4,241 5,424 6,197 6,601 8,527 10,030 9,776 9,687 District of Columbia... 15,432 14,643 17,018 16,433 18,999 19,342 23,316 15,457 Florida... 31,173 29,065 32,174 33,957 39,805 38,861 40,206 46,294 Georgia... 20,208 24,726 26,857 24,413 30,080 36,279 38,673 43,502 Maryland... 41,395 52,549 56,178 79,984 68,519 67, , ,898 North Carolina... 28,518 22,065 31,325 29,870 35,109 26,213 30,470 38,871 South Carolina... 17,921 19,388 17,705 20,820 10,572 14,204 12,022 6,473 Virginia... 24,231 28,086 21,493 24,302 29,542 25,227 29,965 36,425 West Virginia... 3,489 4,282 3,825 4,693 3,925 4,244 4,651 5,108 East South Central... 53,027 52,207 48,036 58,172 68,449 83,841 95,047 76,657 Alabama... 18,398 21,540 15,634 18,025 29,858 42,073 36,184 18,583 Kentucky... 4,814 4,874 3,273 7,292 8,743 8,748 16,924 20,686 Mississippi... 11,219 6,291 10,283 10,135 1, ,065 1,394 Tennessee... 18,596 19,502 18,846 22,720 27,917 32,301 38,874 35,994 West South Central , , , , , , , ,692 Arkansas... 3,244 3,262 5,285 6,401 7,154 7,120 7,078 8,613 Louisiana... 18,083 18,537 17,837 16,919 19,563 19,878 32,541 39,112 Oklahoma... 16,898 16,608 13,864 13,161 14,773 16,674 11,637 12,652 Texas , , , , , , , ,315 75
85 Table B-28. All other sources of financed R&D expenditures at doctorate-granting institutions, by geographic division and State: fiscal years Page 2 of 2 Division and State Mountain... 79,547 69,149 67,013 70,404 73,017 81,323 86,255 95,263 Arizona... 18,304 12,043 13,037 12,706 15,306 15,783 18,289 21,167 Colorado... 35,332 35,456 33,598 36,910 35,270 32,966 14,678 25,222 Idaho , ,001 3,450 1,129 Montana ,039 1,416 3,554 1,328 Nevada... 1, ,773 4,190 3,976 4,545 3,815 New Mexico... 13,807 7,283 8,310 7,200 5,266 4,850 5,792 8,092 Utah... 8,048 8,660 8,746 7,764 10,209 13,827 33,923 33,730 Wyoming... 1,675 2,588 1, ,504 2, Pacific , , , , , , , ,179 Alaska California , , , , , , , ,750 Hawaii... 1,759 3, Oregon... 20,545 21,041 20,198 17,767 27,355 16,518 16,145 18,332 Washington... 15,315 15,241 16,353 16,685 17,804 20,112 20,420 22,097 Outlying Areas... 1,279 1, ,841 2, ,124 NOTE: Because of rounding, detail may not add to totals. SOURCE: National Science Foundation/Division of Science Resources Statistics, Survey of Research and Development Expenditures at Universities and Colleges, Fiscal Year
86 Table B-29. R&D expenditures at universities and colleges, by State, control, and source of funds: fiscal year 2001 Page 1 of 15 State, control, Federal State Institu- All other and institution Total Government and local Industry tional sources governments funds United States, total... 32,723,078 19,190,873 2,315,208 2,233,649 6,553,070 2,430,278 Public, total... 22,340,844 11,694,962 2,079,529 1,489,479 5,541,775 1,535,099 Private, total... 10,382,234 7,495, , ,170 1,011, ,179 Alabama, total , ,522 5,232 21,522 85,133 20,890 Public, total , ,816 5,232 21,522 85,040 18,583 Alabama A&M University... 8,982 i 7,761 i 179 i 153 i 889 i 0 i Alabama State University... 1,433e 1,249e 0e 0e 184e 0e Auburn University ,347 40,097 1,146 4,683 56,227 4,194 U of Alabama Birmingham , , ,443 14,077 14,389 U of Alabama Huntsville... 43,731 30, ,956 7,243 0 U of South Alabama... 9,865e 8,276e 291e 1,298e 0e 0e University of Alabama, The... 33,133 22,183 2,541 1,989 6,420 0 Private, total... 10,106 7, ,307 Oakwood College i 447 i 0 i 0 i 93 i 27 i Selma University... 0e 0e 0e 0e 0e 0e Talladega College Tuskegee University... 9,539 7, ,280 Alaska, total ,601 58,129 3,212 28,778 25, Public, total ,601 58,129 3,212 28,778 25, U of Alaska Anchorage... 5,406 i 2,842 i 213 i 426 i 1,572 i 353 i U of Alaska Fairbanks ,195 55,287 2,999 28,352 23,557 0 Arizona, total , ,716 14,269 29, ,472 21,167 Public, total , ,716 14,269 29, ,472 21,167 Arizona State University ,763 56,616 4,149 5,641 48,574 3,783 Northern Arizona U... 14,657 9,616 1,710 1,349 1, University of Arizona , ,484 8,410 22, ,083 17,217 Arkansas, total ,741 64,030 36,942 7,484 23,358 8,927 Public, total ,741 64,030 36,942 7,484 23,358 8,927 Arkansas State University... 1, Arkansas Tech Univ U Arkansas Pine Bluff... 4,151 i 2,911 i 0 i 0 i 1,214 i 26 i U of AR at Little Rock... 2,088 2, U of Arkansas Main... 78,303 23,172 34,940 4,224 11,917 4,050 U of Arkansas Medical Sci... 51,921 34, ,900 9,458 4,563 U of Central Arkansas... 2,405 1, Private, total Philander Smith College California, total... 4,422,032 2,527, , , , ,154 Public, total... 3,299,233 1,647, , , , ,224 CA St Poly U Pomona... 2,498 2, CA St U Bakersfield... 3,703e 459e 798 i 399 i 563 i 1,484 i CA St U Chico... 3, , CA St U Dominguez Hills... 4,311 2,578 1, CA St U Fresno... 4, , ,600 0 CA St U Fullerton... 1,935 i 1,286 i 182 i 117 i 207 i 143 i CA St U Long Beach... 3,995 2, CA St U Los Angeles... 9,061 8, CA St U Monterey Bay... 1,911 1, CA St U Northridge... 6,190e 3,182e 578e 66e 1,267e 1,097e CA St U San Bernardino... 1, Cal Poly St U... 12,193 6,153 2,509 1, ,455 Humboldt State University... 6,282 i 2,945 i 965 i 989 i 510 i 873 i Naval Postgrad School... 40,889 i 40,121 i 255 i 344 i 0 i 169 i 77
87 Table B-29. R&D expenditures at universities and colleges, by State, control, and source of funds: fiscal year 2001 Page 2 of 15 State, control, Federal State Institu- All other and institution Total Government and local Industry tional sources governments funds California, continued: Public, continued: San Diego St University... 58,332 23,621 8,817 1,162 19,344 5,388 San Francisco State U... 5,223e 4,561e 166 i 496 i 0 i 0 i San Jose State University... 22,709 14,301 3,747 3,126 1, Sonoma State University U CA Berkeley , ,080 29,824 26, ,333 53,245 U CA Davis , ,937 50,044 16, ,268 39,158 U CA Irvine , ,735 8,384 15,803 30,581 23,363 U CA Los Angeles , ,858 59,365 32, ,229 98,810 U CA Riverside... 94,455 25,713 5,313 4,227 50,383 8,819 U CA San Diego , ,276 20,842 36, ,503 54,067 U CA San Francisco , ,489 21,902 35, ,652 79,173 U CA Santa Barbara ,372 76,828 2,956 6,001 19,341 11,246 U CA Santa Cruz... 64,253 29, ,004 23,258 9,913 Private, total... 1,122, ,606 30,908 76, ,793 33,930 Alliant International U Alliant University... 3,062e 1,578e 67 i 266 i 393 i 758 i Azusa Pacific U Biola University C R Drew U of Med & Sci... 36,717 27,415 8,230 1, CA Inst of Integral Stu California Inst of Tech , ,554 1,050 10,225 10,256 0 Chapman U Claremont Graduate U... 2,369 1, Fuller Theological Sem i 87 i 0 i 0 i 0 i 0 i Golden Gate University Harvey Mudd College... 6,443 i 1,156 i 93 i 459 i 566 i 4,169 i Loma Linda University... 26,451 i 20,494 i 0 i 4,538 i 1,296 i 123 i Occidental College... 1, Pepperdine University Pitzer College Point Loma Nazarene Col Pomona College... 1, Santa Clara University... 2,723 i 625 i 0 i 679 i 1,340 i 79 i Stanford University , ,468 5,433 35,012 30,920 27,073 U of Southern California , ,207 15,542 22,949 55,899 0 University San Francisco e 400e 200e 0e 100e 0e University of San Diego University of the Pacific... 1, Western U of Hlth Sci Colorado, total , ,664 21,934 29,497 57,315 25,540 Public, total , ,211 20,701 27,563 56,152 24,623 Colorado School of Mines... 23,654 12,314 1,626 9, Colorado State University , ,308 16,102 8,850 25,637 9,247 Fort Lewis College U of Colorado HSC , , ,750 14,192 9,207 U of Colorado, Boulder , ,195 1,683 3,600 15,228 5,712 U of Colorado, Col Spgs... 2,125 1, U of Colorado, Denver... 3,085 1, U of Northern Colorado... 1, U of Southern Colorado US Air Force Academy... 5,323 5, W State Coll Colorado Private, total... 14,700 9,453 1,233 1,934 1, Colorado College... 1, Regis University e 69e 0e 0e 0e 139e University of Denver... 12,944 9,248 1,233 1,
88 Table B-29. R&D expenditures at universities and colleges, by State, control, and source of funds: fiscal year 2001 Page 3 of 15 State, control, Federal State Institu- All other and institution Total Government and local Industry tional sources governments funds Connecticut, total , ,983 15,167 24,282 76,044 55,269 Public, total ,689 70,832 14,362 9,836 54,636 16,023 Central Connecticut St U Southern Connecticut St U e 215e 364e 17e 0e 0e US Coast Guard Academy University of Connecticut ,366 70,013 13,971 9,819 54,541 16,022 Private, total , , ,446 21,408 39,246 Connecticut College i 0 i 1 i 10 i 16 i 451 i Fairfield University... 1, ,385 0 Trinity College... 1,010e 326e 0e 96e 98e 490e University of Hartford... 1, University of New Haven... 1,492 1, Wesleyan University... 5,846 3, , Yale University , , ,119 18,487 37,683 Delaware, total... 79,985 44,052 4,712 5,041 16,486 9,694 Public, total... 79,985 44,052 4,712 5,041 16,486 9,694 Delaware State University... 2,494 2, University of Delaware... 77,491 41,830 4,469 5,041 16,464 9,687 District of Columbia, total , ,314 3,193 12,789 4,291 15,523 Public, total... 3,001 2, University of DC... 3,001 2, Private, total , ,306 2,735 12,789 3,822 15,457 American University... 2,565 1, Catholic U of America... 17,539 13, , Gallaudet University... 1,824 1, George Washington U... 73,805 51,757 1,815 5, ,398 Georgetown University... 99,228 93, , Howard University... 30,148 27, , Florida, total , , ,939 91, ,809 46,406 Public, total , , ,751 72, ,528 31,253 Florida A&M University... 23,865 22,477 1, Florida Atlantic U... 25,111 14,099 1,432 9, Florida International U... 44,291 23,940 11,037 8, Florida State University ,817 57,075 6, ,047 4,268 U of Central Florida... 79,287 22,342 6,115 5,288 45,542 0 U of North Florida... 1, U of South Florida ,550 58,826 8,819 11,152 76,057 16,696 U of West Florida... 7,395 4,785 1, ,156 0 University of Florida , ,744 74,057 36,417 99,204 9,890 Private, total , ,080 3,188 19,496 9,281 15,153 Bethune Cookman College Embry-Riddle Aero Univ... 7,711 6, Florida Inst of Tech... 6,195 2, ,420 1, Nova Southeastern U... 2,594 1, University of Miami , ,803 2,249 17,554 8,025 14,141 Georgia, total , ,593 78,760 96, ,178 43,509 Public, total , ,551 73,761 78, ,006 6,097 Albany State University... 1, , Fort Valley State U... 2,768e 2,417e 93e 258e 0e 0e Georgia Institute of Tech , ,836 10,771 59,691 92,235 0 Georgia Southern U
89 Table B-29. R&D expenditures at universities and colleges, by State, control, and source of funds: fiscal year 2001 Page 4 of 15 State, control, Federal State Institu- All other and institution Total Government and local Industry tional sources governments funds Georgia, continued: Public, continued: Georgia State University... 38,960 13,575 8, ,144 2,626 Kennesaw State Univ Medical Col of Georgia... 52,191 21, ,478 24,742 2,163 Savannah State Univ... 2,181 2, State U of West Georgia... 1, University of Georgia ,298 66,913 53,463 13, ,823 1,308 Private, total , ,042 4,999 17,856 29,172 37,412 Clark Atlanta University... 17,173 14, ,098 Emory University , ,317 4,001 7,950 19,857 34,872 Inst of Paper Sci & Tech... 13,929 2, ,828 2, Mercer University... 15,337 9, ,115 5,146 0 Morehouse College... 2,853 i 1,843 i 0 i 826 i 184 i 0 i Morehouse School of Med... 19,670 18, , Morris Brown College e 116e 0e 0e 0e 0e Spelman College... 3,406 3, Hawaii, total ,976 97,716 33,125 7,232 18,903 0 Public, total ,976 97,716 33,125 7,232 18,903 0 Univ of Hawaii at Manoa ,976 97,716 33,125 7,232 18,903 0 Idaho, total... 82,496 34,347 18,389 6,683 21,948 1,129 Public, total... 82,496 34,347 18,389 6,683 21,948 1,129 Boise State University... 6,153 3, Idaho State University... 8,847 3, ,060 2,370 0 University of Idaho... 67,496 26,548 17,149 3,634 19,036 1,129 Illinois, total... 1,280, ,522 82,742 59, ,854 85,510 Public, total , ,536 72,436 30, ,633 37,927 Chicago State University... 1,415 1, Illinois State University... 3,902 1, Northeastern Illinois U Northern Illinois U... 9,028 4, ,356 3,051 0 S Illinois U Carbondale... 43,207 10,868 10,301 5,484 12,204 4,350 S Illinois U Edwardsville... 1, U of IL Chicago , ,109 9,743 10,989 70,677 16,580 U of IL Springfield... 2, U of IL Urbana-Champaign , ,316 48,803 10, ,602 16,150 Western Illinois U... 7,759 5,501 1, Private, total , ,986 10,306 28, ,221 47,583 Bradley University... 1, DePaul University... 1,628 1, Finch U Hlth Sci Chicago... 8,037 6, , Illinois Inst of Tech... 14,722 10,917 1,624 1, Knox College Lake Forest College Loyola U of Chicago... 37,156 26, ,202 5,736 3,361 Midwestern University... 2, , Northwestern University , ,129 3,778 14,294 59,852 21,880 Rush University... 70,219 37, ,128 20,148 3,583 University of Chicago , ,566 4,451 1,746 14,088 18,274 Indiana, total , ,944 45,456 41, ,717 45,676 Public, total , ,378 42,432 37, ,973 28,685 Ball State University... 3,071 1, , Indiana State University... 1, , Indiana University , ,781 5,650 6, ,566 28,527 Purdue University ,917 98,151 36,485 29,765 90,
90 Table B-29. R&D expenditures at universities and colleges, by State, control, and source of funds: fiscal year 2001 Page 5 of 15 State, control, Federal State Institu- All other and institution Total Government and local Industry tional sources governments funds Indiana, continued: Private, total... 65,027 31,566 3,024 3,702 9,744 16,991 Rose-Hulman Inst of Tech... 18,540 1, ,984 University of Notre Dame... 46,096 29,801 2,996 3,631 9,668 0 Valparaiso University Iowa, total , ,361 59,668 34, ,688 22,377 Public, total , ,653 59,661 34, ,333 22,269 Iowa State University ,196 62,024 52,115 13,177 48,733 3,147 U of Iowa , ,249 7,084 21,394 52,571 19,050 U of Northern Iowa... 1, , Private, total... 3,305 1, , Des Moines U Ost Med Ctr Drake University Grinnell College i 0 i 340 i 52 i Maharishi U of Mgmt... 1,612 1, Kansas, total , ,732 45,153 12,484 74,134 22,297 Public, total , ,732 45,153 12,484 74,134 22,297 Kansas State University... 94,030 33,998 36,398 4,943 15,866 2,825 Pittsburg State U... 2, University of Kansas ,467 74,494 7,049 4,155 52,380 18,389 Wichita State University... 16,142 5,726 1,170 3,220 5, Kentucky, total , ,648 41,129 13, ,439 20,686 Public, total , ,317 41,129 13, ,439 19,962 Eastern Kentucky U Kentucky State University... 3,996 3, Murray State University... 2, University of Kentucky ,721 86,239 37,904 12,933 61,008 13,637 University of Louisville... 72,857 25,116 1, ,543 6,325 Western Kentucky Univ... 4,165 3, Private, total... 1, Spalding University... 1, Louisiana, total , ,794 84,579 25, ,102 39,205 Public, total , ,260 81,412 17,022 79,284 27,155 Grambling State U... 2,264e 2,200e 59e 0e 5e 0e Louisiana St U, A&M Colle ,271 49,167 66,114 8,016 46,182 8,792 Louisiana St U, Hlth Sci... 65,193 28,261 5,189 5,775 17,187 8,781 Louisiana St U, Shrevepor Louisiana Tech University... 3,480 1,856 1, McNeese State University Nicolls State U Southeastern Louisiana U Southern U A&M All Camp... 9,052 i 7,059 i 259 i 118 i 1,616 i 0 i Southern U New Orleans U of LA Lafayette... 32,073 12,130 3, ,316 8,459 U of LA at Monroe, The... 8,870 i 3,106 i 1,527 i 0 i 4,237 i 0 i University of New Orleans... 25,309 17,161 3,075 2,824 1,166 1,083 Private, total ,223 60,534 3,167 8,654 20,818 12,050 Dillard University Tulane University... 99,761 55,669 3,027 8,654 20,414 11,997 Xavier University of LA... 5,113 4, Maine, total... 68,034 25,124 8,536 3,769 25,528 5,077 Public, total... 65,614 24,011 8,536 3,562 25,280 4,225 U of Maine... 64,070 23,873 7,886 3,562 24,631 4,118 U of Southern Maine... 1,544 i 138 i 650 i 0 i 649 i 107 i 81
91 Table B-29. R&D expenditures at universities and colleges, by State, control, and source of funds: fiscal year 2001 Page 6 of 15 State, control, Federal State Institu- All other and institution Total Government and local Industry tional sources governments funds Maine, continued: Private, total... 2,420 1, Bates College Bowdoin College Colby College Maryland, total... 1,644,467 1,196,085 59,552 71, , ,023 Public, total , ,669 57,375 53, ,306 57,780 Bowie State University... 2,207 2, Coppin State College Morgan State University... 2,390 2, St Mary s Col of MD Towson University... 2, U MD Biotechnology Inst... 32,458 11,053 2,491 2,103 14,175 2,636 U MD Ctr for Environ Sci... 36,635 12,105 4, ,525 4,007 U of MD Baltimore ,007 99,091 26,603 41,226 34,323 37,764 U of MD Baltimore County... 29,641 23, ,131 2, U of MD Eastern Shore... 5,626 5, U of MD at College Park , ,515 21,519 7,315 80,378 12,656 US Naval Academy... 3,140 3, Unif Svcs U of Hlth Sci... 23,247 10, ,142 0 Private, total... 1,000, ,416 2,177 18,737 50,627 48,243 Johns Hopkins U , ,741 2,177 18,737 50,348 48,243 Loyola College Massachusetts, total... 1,576,517 1,140,358 38, ,284 80, ,688 Public, total , ,763 31,120 17,072 37,310 18,119 Bridgewater State College U of MA Amherst... 97,976 49,576 3,969 6,181 29,538 8,712 U of MA Boston... 11,672 2,546 1, ,663 3,016 U of MA Dartmouth... 9,488 4,928 2, ,411 0 U of MA Lowell... 20,656 11, ,911 1,587 0 U of MA Worcester ,221 79,453 22,088 3, ,363 Private, total... 1,325, ,595 7, ,212 42, ,569 Amherst College... 1, Boston College... 30,768 20, ,050 5,392 2,470 Boston University , , , ,877 Brandeis University... 52,818 30, ,000 16,669 Clark University... 3,039 2, College of the Holy Cross Hampshire College... 3, ,873 Harvard University , ,414 1,739 14, ,898 MA Col Phar Allied Hlth i 288 i 0 i 0 i MA Institute of Tech , , ,256 6,058 27,681 Mount Holyoke College... 1,734 1, New England Col of Opt... 1,608 1, Northeastern University... 34,467 23, ,530 5,116 0 Simmons College Smith College... 2, , Tufts University ,806 71,669 2,266 7,726 13,904 10,241 Wellesley College... 5,498 3, ,864 Wentworth Inst of Tech Woods Hole Oceanogr Inst... 91,029 75, ,273 12,417 Worcester Polytech Inst... 9,348 4, ,059 2,375 1,399 Michigan, total... 1,107, ,578 66,764 65, ,153 75,247 Public, total... 1,100, ,544 66,425 63, ,107 74,204 Central Michigan U... 2, , Eastern Michigan U... 2,992 1, Ferris State University Grand Valley State U... 1,
92 Table B-29. R&D expenditures at universities and colleges, by State, control, and source of funds: fiscal year 2001 Page 7 of 15 State, control, Federal State Institu- All other and institution Total Government and local Industry tional sources governments funds Michigan, continued: Public, continued: Michigan State University , ,359 46,395 10,953 87,885 8,354 Michigan Tech University... 29,613 17, ,176 6, Oakland University... 7,397 5, , University of Michigan , ,117 5,113 34, ,508 44,346 Wayne State University ,984 79,448 12,463 10,860 55,384 17,829 Western Michigan U... 14,976 6, ,537 2,509 Private, total... 6,507 2, ,045 1,046 1,043 Andrews University Calvin College... 1, Hope College... 1, Kettering University... 1, Lawrence Tech Univ U of Detroit Mercy... 1, Minnesota, total , ,955 58,468 26,963 81,784 34,038 Public, total , ,560 58,467 26,940 80,329 33,654 Minnesota State, Mankato St Cloud State Univ... 2,188 i 1,106 i 196 i 255 i 435 i 196 i University of Minnesota , ,289 58,053 26,454 79,757 33,458 Private, total... 4,258 2, , Augsburg College Carleton College... 1, Macalester College... 1, , St Olaf College University of St Thomas Mississippi, total , ,505 39,287 7,929 48,018 1,394 Public, total , ,098 39,287 7,929 47,418 1,394 Alcorn State University... 7,370 7, Jackson State University... 25,663 22, ,913 0 Mississippi State U ,939 65,493 32,357 6,744 42,345 0 Mississippi Valley St U... 1,316 1, U Mississippi, All Camp... 39,552 30,108 6, ,450 1,394 U Southern Mississippi... 20,286 18, Private, total... 1, Rust College Tougaloo College... 1, Missouri, total , ,999 25,166 37, ,074 41,289 Public, total ,303 95,843 18,289 9, ,024 9,276 Lincoln University... 2,236 2, Southeast Missouri St U Southwest Missouri St U... 1, , Truman State University i 195 i 2 i 9 i 627 i 1 i U of Missouri Columbia ,782 68,435 16,154 4,654 78,842 6,697 U of Missouri Kansas City... 18,795 8, ,665 8, U of Missouri Rolla... 28,799 11, ,088 11,530 1,771 U of Missouri St Louis... 10,084 4, , U of Missouri Sys Admn Private, total , ,156 6,877 28,061 60,050 32,013 Forest Inst of Prof Psy Kirksville Col Osteo Med Saint Louis University... 32,442 28, , U of Health Sci, The (MO)... 1, Washington University , ,928 6,519 24,865 58,634 31,696 83
93 Table B-29. R&D expenditures at universities and colleges, by State, control, and source of funds: fiscal year 2001 Page 8 of 15 State, control, Federal State Institu- All other and institution Total Government and local Industry tional sources governments funds Montana, total ,744 56,668 19,745 9,084 20,919 1,328 Public, total ,744 56,668 19,745 9,084 20,919 1,328 MT Tech of the U of MT... 4,616 2,617 1, Montana St U Bozeman... 69,593 34,857 16,502 7,041 11,193 0 Univ of Montana, The... 33,535 19,194 1,796 1,491 9,726 1,328 Nebraska, total ,638 76,507 7,007 17, ,825 12,517 Public, total ,964 69,232 5,993 11, ,480 12,419 U of Nebraska Med Ctr... 60,695 22,497 2,064 5,929 20,607 9,598 U of Nebraska at Kearney U of Nebraska at Lincoln ,520 43,877 3,899 5, ,217 2,619 U of Nebraska at Omaha... 5,518 2, , Private, total... 17,674 7,275 1,014 5,942 3, Creighton University... 17,674 7,275 1,014 5,942 3, Nevada, total ,934 69,085 10,275 5,078 27,681 3,815 Public, total ,934 69,085 10,275 5,078 27,681 3,815 Desert Research Institute... 29,697 22,018 2, ,889 2,450 U of Nevada Las Vegas... 27,008 15,681 4,045 1,938 5,344 0 U of Nevada Reno... 59,229 31,386 3,692 2,338 20,448 1,365 New Hampshire, total , ,067 12,194 12,140 43,031 14,543 Public, total... 87,879 45,223 8,603 7,751 19,298 7,004 U of New Hampshire... 87,879 45,223 8,603 7,751 19,298 7,004 Private, total ,096 69,844 3,591 4,389 23,733 7,539 Dartmouth College ,096 69,844 3,591 4,389 23,733 7,539 New Jersey, total , ,121 52,159 33, ,716 80,749 Public, total , ,205 45,942 25, ,235 60,317 Montclair State U NJ Inst of Technology... 44,177 18,530 8, ,730 14,365 Rutgers the State U NJ ,793 77,156 28,163 10,965 89,916 30,593 U Med & Dent of NJ ,417 86,054 9,170 13,496 38,378 15,319 Private, total ,317 87,916 6,217 8,271 42,481 20,432 Fairleigh Dickinson U Monmouth University Princeton University ,411 78,620 3,102 8,246 41,983 17,460 Rider University Seton Hall University Stevens Inst of Tech... 13,855 8,094 3, ,726 New Mexico, total , ,733 11,872 12,297 55,841 8,466 Public, total , ,733 11,872 12,297 55,841 8,466 NM Inst Mining & Tech... 28,392 13,255 1,998 6,204 6, New Mexico Highlands U... 2,235 1, New Mexico State Univ... 86,963 61,124 7,960 4,272 12,537 1,070 University of New Mexico , ,505 1,902 1,821 37,258 6,133 New York, total... 2,476,090 1,566, , , , ,899 Public, total , ,067 26,745 30, ,158 58,746 CUNY Baruch Col e 87e 49e 133e 106e 0e CUNY Brooklyn College... 6,442 2, ,971 1,012 CUNY City College... 17,099 13,022 1,903 1, CUNY Col Staten Island... 1,635 1, CUNY Grad Ctr... 2,906 1, ,289 CUNY H H Lehman Col... 2,255 2, CUNY Hunter College... 19,964 10,922 1, ,608 2,034 CUNY John Jay Col Cr Just... 1, CUNY Medger Evers Col
94 Table B-29. R&D expenditures at universities and colleges, by State, control, and source of funds: fiscal year 2001 Page 9 of 15 State, control, Federal State Institu- All other and institution Total Government and local Industry tional sources governments funds New York, continued: Public, continued: CUNY Queens College... 4,595 3, CUNY York College... 1, SUNY Col Env Sci & Frstry... 27,854 4,355 2,992 2,149 17, SUNY Col Old Westbury... 1,310e 1,067e 0e 0e 243e 0e SUNY Col at Brockport e 344e 283e 0e 67e 28e SUNY Col at Buffalo... 1, SUNY Col at Cortland SUNY Col at Fredonia SUNY Col at Geneseo SUNY Col at Oswego SUNY Col at Plattsburgh... 1, SUNY Col of Optometry... 1, SUNY Hlth Sci Ctr Brklyn... 31,626e 22,860e 229e 1,787e 4,094e 2,656e SUNY Upstate Med U... 17,948 10, ,133 SUNY at Albany... 70,119 46,671 7,819 1,017 7,024 7,588 SUNY at Binghamton... 18,992 6,392 2,286 2,493 4,755 3,066 SUNY at Buffalo ,829 96,595 5,220 11,598 50,091 23,325 SUNY at Stony Brook ,487 93,265 3,117 7,026 54,433 10,646 Private, total... 1,887,855 1,243, ,992 98, , ,153 Adelphi University Albany Col of Pharmacy... 1, Albany Medical College... 12,836 8, ,977 1,228 Alfred University... 6,678 1, ,244 1, Barnard College... 1,376 1, Clarkson University... 8,322 4, ,566 1,708 0 Colgate U... 1, Columbia U in City of NY , ,928 1,122 2,885 13,481 19,081 Cooper Union Cornell University , ,466 62,569 22,261 80,446 38,086 Fordham University... 3,639 1, ,101 Hamilton College Hofstra University Ithaca College... 2,034 1, Long Island University... 1, Manhattan College e 293e 100e 116e 0e 0e Mt Sinai Sch Med , ,344 2,698 18,133 17,134 29,637 New School University... 5,791 1, ,708 New York Inst Technology New York Medical College... 24,283 18, , ,152 New York University , ,897 2,739 6,535 25,514 26,037 Pace University All Cmp Polytechnic University... 8,277 4,063 1,568 2, Rensselaer Polytech Inst... 45,010 25,894 5,781 5,928 4,734 2,673 Rochester Inst of Tech... 11,416 5,612 2,306 2, Rockefeller U, The ,571 55,362 6,079 2,844 52,493 28,793 Skidmore College St John s University (NY)... 1,184e 938e 85e 0e 161e 0e Syracuse University... 42,476 30,036 3,693 1,420 2,223 5,104 Teachers Col, Columbia U... 9,676 5, ,059 Union College (NY)... 1, University of Rochester , ,945 9,839 23,782 20,092 13,603 Vassar College... 1,716e 321e 45e 0e 0e 1,350e Yeshiva University , , ,
95 Table B-29. R&D expenditures at universities and colleges, by State, control, and source of funds: fiscal year 2001 Page 10 of 15 State, control, Federal State Institu- All other and institution Total Government and local Industry tional sources governments funds North Carolina, total... 1,137, , , , ,944 40,672 Public, total , , ,108 50, ,312 9,726 Appalachian State U East Carolina University... 10,535 5,188 1,494 3, Elizabeth City State U... 1,248 1, Fayetteville State U NC A&T State University... 15,629 11, ,256 0 NC State University ,259 95,875 91,794 37,858 65,966 7,766 North Carolina Central U i 853 i 0 i 0 i 0 i 60 i U of NC Asheville... 1, U of NC Chapel Hill , ,615 15,914 6,971 59,076 0 U of NC Charlotte... 7,905 5, , U of NC Greensboro... 3,895 2, U of NC Wilmington... 10,307 7,242 1, , Western Carolina U Winston Salem State U... 6,057 4, Private, total , ,008 8, ,441 20,632 30,946 Bennett College i 583 i 0 i 48 i 0 i 180 i Duke University , ,109 7, ,063 19,275 25,938 Johnson C Smith U Shaw University i 100 i 0 i 0 i 0 i 0 i Wake Forest University... 98,343 78, ,330 1,357 4,828 North Dakota, total... 84,574 30,950 1,440 6,242 42,409 3,533 Public, total... 84,574 30,950 1,440 6,242 42,409 3,533 North Dakota State U... 64,882 15,207 1,440 3,784 41,533 2,918 U of North Dakota... 19,692 15, , Ohio, total , ,767 80,268 86, ,173 75,578 Public, total , ,505 76,035 74, ,314 56,300 Air Force Inst of Tech... 8,311 1, ,843 0 Bowling Green State U... 5,028 2, Central State University i 283 i 0 i 125 i 38 i 114 i Cleveland State U... 12,986 3,986 4,965 1,447 2, Kent State University... 11,316 8,158 1, Med Col of Ohio... 15,276 11, , Miami University (OH)... 12,804 3,324 1,015 1,021 6, NE Ohio Univ Col of Med... 4,532 2, , Ohio State University , ,092 54,867 54,736 86,275 33,682 Ohio University... 27,146 12,898 2,528 2,022 8, University of Akron... 22,266 8,672 1,366 2,557 6,737 2,934 University of Cincinnati , ,049 3,619 6,028 41,092 14,107 University of Toledo... 16,278 6, ,025 6, Wright State University... 32,033 15,417 3,140 3,269 9, Youngstown State Univ Private, total , ,262 4,233 11,408 13,859 19,278 Antioch University Case Western Reserve U , ,852 3,735 6,190 11,636 17,840 College of Wooster Denison University John Carroll University Oberlin College Ohio Wesleyan University i 185 i 0 i 0 i 0 i 70 i U of Findlay Union Institute, The... 1,217e 0e 0e 0e 592e 625e University of Dayton... 41,343 34, ,138 1, Wilberforce University i 236 i 0 i 0 i 44 i 0 i 86
96 Table B-29. R&D expenditures at universities and colleges, by State, control, and source of funds: fiscal year 2001 Page 11 of 15 State, control, Federal State Institu- All other and institution Total Government and local Industry tional sources governments funds Oklahoma, total ,217 96,349 40,615 17,382 88,219 12,652 Public, total ,664 89,008 39,520 14,124 87,360 12,652 Langston University... 2,863 2, Oklahoma State University... 90,311 25,636 24,904 3,688 34,866 1,217 U of Central Oklahoma University of Oklahoma ,695 60,264 14,306 10,396 52,294 11,435 Private, total... 12,553 7,341 1,095 3, University of Tulsa... 12,553 7,341 1,095 3, Oregon, total , ,324 41,449 14,489 35,864 18,897 Public, total , ,252 40,575 12,565 33,350 17,887 Oregon Health & Science U , ,671 2,879 11, ,697 Oregon State University ,925 84,854 36, ,261 4,863 Portland State University... 16,838 11, , Southern Oregon Univ University of Oregon... 36,881 32, ,850 1,441 Private, total... 21,394 15, ,924 2,514 1,010 Lewis and Clark College OGI Schl Sci & Eng OHSU... 18,798 14, ,725 1, Pacific University Reed College University of Portland Willamette University Pennsylvania, total... 1,687,457 1,144,586 51, , , ,771 Public, total , ,082 29,749 88, ,706 42,547 East Stroudsburg U of PA Indiana U of PA All Cmp Lincoln University (PA) Pennsylvania State U , ,951 23,504 67, ,417 8,536 Temple University... 60,182 41, ,400 6,290 5,888 University of Pittsburgh , ,571 5,149 14,817 32,183 28,072 West Chester U of PA e 697e 19e 17e 16e 45e Private, total , ,504 21,718 74,735 57,104 77,224 Allegheny College... 1, Bryn Mawr College... 3, ,117 0 Bucknell University... 1,791 1, Carnegie Mellon U ,882 97,463 3,401 23, ,527 Dickinson College... 1, Drexel University... 27,698 20, ,307 2,264 Duquesne University... 2,561 1, Franklin & Marshall Coll Haverford College... 1, Juniata College e 107e 0e 0e 0e 64e La Salle University Lafayette College... 1, Lehigh University... 29,058 13,961 6,151 5,532 3, MCP Hahnemann University.. 32,462 22,944 4,249 2, ,353 PA College of Optometry Phila Col Osteopathic Med St Joseph s Univ... 1,628 1, Swarthmore College Thomas Jefferson U... 88,936 64,881 3,933 12,326 1,686 6,110 U of Pennsylvania , ,996 1,952 28,227 43,655 44,022 U of Sci in Philadelphia Villanova University... 5,969 i 4,520 i 150 i 982 i 284 i 33 i Widener U All Campuses e 37e 0e 0e 0e 171e Rhode Island, total , ,560 5,511 2,229 29,617 3,647 Public, total... 50,835 43,161 5, , U of Rhode Island... 50,835 43,161 5, ,
97 Table B-29. R&D expenditures at universities and colleges, by State, control, and source of funds: fiscal year 2001 Page 12 of 15 State, control, Federal State Institu- All other and institution Total Government and local Industry tional sources governments funds Rhode Island, continued: Private, total... 91,729 58, ,788 28,074 3,394 Brown University... 91,636 58, ,777 28,024 3,394 Providence College i 32 i 0 i 11 i 50 i 0 i South Carolina, total , ,257 30,135 23, ,435 7,571 Public, total , ,798 30,022 23, ,405 7,336 Clemson University ,885 48,560 21,190 11,582 42, Coastal Carolina U... 1, College of Charleston... 3,069 1, Med U of South Carolina ,687 60,543 1,257 7,168 46,470 1,249 South Carolina State U... 2,915e 1,988e 24e 0e 279e 624e U of South Carolina ,973 51,983 7,070 4,239 41,914 4,767 Private, total... 3,837 3, Benedict College... 1,044 1, Claflin College... 2,074 1, Furman University South Dakota, total... 32,185 16,407 9, ,631 2,703 Public, total... 32,185 16,407 9, ,631 2,703 SD Sch of Mines & Tech... 6,922 4, , South Dakota State U... 19,717 8,456 8, ,057 1,473 U of South Dakota... 5,546 3, ,158 Tennessee, total , ,897 43,812 21,503 56,888 36,164 Public, total , ,825 43,270 18,467 35,710 20,230 East Tennessee State U... 8,222 3,572 1, ,723 Middle Tennessee State U Tennessee State U... 12,791 10, , Tennessee Tech U... 9,347 1,124 4,165 1,957 1, U of Tennessee ,292 78,558 33,867 15,364 17,118 15,385 U of Tennessee Chattanoo... 1, , U of Tennessee Martin Univ of Memphis, The... 29,445 11,012 3, ,640 1,673 Private, total , , ,036 21,178 15,934 Fisk University... 2,722 2, Le Moyne-Owen Coll... 1,268 1, Meharry Medical College... 10,268 i 10,015 i 0 i 0 i 0 i 253 i Vanderbilt University , , ,036 21,160 15,681 Texas, total... 2,244,117 1,231, , , , ,397 Public, total... 1,802, , , , , ,605 Lamar University... 3,441 2, Prairie View A&M U... 11,297 7,094 1, ,336 0 Sam Houston State U... 2,441 1, Southwest Texas St Univ... 8,884 3,854 3, ,608 Stephen F Austin St U... 4, ,017 Sul Ross State University TX A&M U Sys Hlth Sci Ctr... 40,859 18,384 8,138 1,050 8,424 4,863 Tarleton State University... 6,607 4, , Texas A&M Commerce Texas A&M Corpus Chri... 5,606 2,357 1, , Texas A&M Univ Kingsville... 6,919 1, ,201 1,897 Texas A&M University , , ,480 35, ,210 5,859 Texas Southern U... 2,468 1, Texas Tech University... 69,918 22,967 21,243 6,236 15,194 4,278 Texas Woman s University... 2,898 1,185 1, U Houston Clear Lake... 11,519 10, U North TX Hlth Sci Ctr... 11,035 6, ,891 2,402 0 U TX Hlth Sci Ctr San Ant ,154 71,153 6,441 9,677 20,797 7,086 U TX MD Anderson Cncr Ctr.. 212,746 94, ,717 58,853 33,123 88
98 Table B-29. R&D expenditures at universities and colleges, by State, control, and source of funds: fiscal year 2001 Page 13 of 15 State, control, Federal State Institu- All other and institution Total Government and local Industry tional sources governments funds Texas, continued: Public, continued: U TX Med Br at Galveston ,722 64,682 10,775 6,020 10,608 10,637 U TX SW Med Ctr at Dallas , ,820 9,516 13,320 5,942 61,778 U TX at Arlington... 17,486 9,413 1, ,612 0 U TX at Austin , ,184 19,939 30,310 36,266 13,405 U TX at Dallas... 15,684e 7,049e 3,164e 4,715e 394e 362e U TX at El Paso... 21,889 16,167 2,875 1,321 1,526 0 U TX at San Antonio... 11,331 8,012 3, U of Houston Downtown e 660e 0e 20e 157e 0e U of TX Pan American... 2,279 1, UT Houston Hlth Sci Ctr ,439 88,545 4,129 10,945 7,633 14,187 University of Houston... 51,567 21,876 15,472 1,992 7,726 4,501 University of North Texas... 7,380 2, ,846 West Texas A&M U... 4,515 2,681 1, Private, total , ,185 6,597 23,889 59,055 71,792 Abilene Christian Univ Baylor Col of Medicine , ,394 3,731 18,389 56,413 68,534 Baylor University... 2, Jarvis Christian College... 55e 55e 0e 0e 0e 0e Rice University... 42,675 35,682 1,784 3, ,013 Southern Methodist U... 8,948 5, , St Mary s University e 0e 169e 0e Texas Christian U... 3,678 2, Trinity University... 1,241e 746e 0e 1e 330e 164e University of Dallas Wiley College Utah, total , ,163 21,445 15,002 54,787 33,730 Public, total , ,504 20,190 12,618 51,977 32,667 University of Utah , ,253 2,166 6,023 35,021 27,134 Utah State University ,359 74,251 18,024 6,595 16,956 5,533 Private, total... 19,171 11,659 1,255 2,384 2,810 1,063 Brigham Young University... 19,171 11,659 1,255 2,384 2,810 1,063 Vermont, total... 76,882 50,095 4,052 6,434 12,338 3,963 Public, total... 75,597 48,810 4,052 6,434 12,338 3,963 University of Vermont... 75,597 48,810 4,052 6,434 12,338 3,963 Private, total... 1,285 1, Middlebury College... 1,285 1, Virginia, total , ,849 70,081 49, ,548 36,631 Public, total , ,731 69,849 40, ,293 28,179 Col of William & Mary... 35,829 15,288 3,327 1,165 14,148 1,901 George Mason University... 32,881 25, ,048 4,226 James Madison University... 1, Norfolk State University... 3,984 3, Old Dominion University... 24,659 15,280 3,789 2,885 2,705 0 Radford University University of Virginia , , ,733 11,661 6,988 VA Polytech Inst & St U ,323 77,384 58,232 18,355 52,534 9,818 Virginia Commonwealth U... 99,180 57,315 2,358 8,522 26,091 4,894 Virginia Military Inst Virginia State University... 5,066 4, Private, total... 40,521 21, ,464 1,255 8,452 Eastern VA Med School... 26,250 11, , ,255 Hampton University... 9,158 8, Institute of Textile Tech... 3, , University of Richmond... 1, Virginia Union University i 537 i 0 i 0 i 27 i 107 i 89
99 Table B-29. R&D expenditures at universities and colleges, by State, control, and source of funds: fiscal year 2001 Page 14 of 15 State, control, Federal State Institu- All other and institution Total Government and local Industry tional sources governments funds Washington, total , ,877 18,644 47, ,599 22,542 Public, total , ,555 18,644 47, ,452 22,542 Central Washington U... 1,880 1, E Washington Univ... 2,620 1, Evergreen State Coll U of Washington , ,103 11,716 43,312 88,309 11,186 W Washington Univ... 3,560 1, , Washington State U ,937 48,660 5,458 4,438 38,470 10,911 Private, total Whitman College West Virginia, total... 79,076 35,526 2,471 6,526 29,429 5,124 Public, total... 78,721 35,420 2,471 6,526 29,188 5,116 Bluefield State College Marshall U... 7,218 5, WV Sch of Osteo Med West Virginia State Col... 63e 0e 55e 0e 0e 8e West Virginia University... 71,311 29,440 2,276 6,328 28,261 5,006 Private, total Salem International Univ Wisconsin, total , ,441 40,423 22, ,671 72,414 Public, total , ,709 38,672 18, ,145 62,793 U of WI-Eau Claire U of WI-Green Bay U of WI-La Crosse... 1, U of WI-Madison , ,009 35,317 17, ,924 59,656 U of WI-Milwaukee... 23,492 11,089 2, ,398 1,504 U of WI-Oshkosh U of WI-Parkside U of WI-River Falls U of WI-Stevens Point... 1, U of WI-Stout... 1, U of WI-Superior U of WI-Whitewater Private, total... 93,210 67,732 1,751 4,580 9,526 9,621 Marquette University... 7,236 3,309 1,575 1, Medical Col of Wisconsin... 83,857 64, ,126 8,674 8,882 Milwaukee School of Eng... 2, , Wyoming, total... 41,632 20,017 2,038 2,581 16, Public, total... 41,632 20,017 2,038 2,581 16, University of Wyoming... 41,632 20,017 2,038 2,581 16, Guam, total... 3,752 3, Public, total... 3,752 3, University of Guam... 3,752 3,
100 Table B-29. R&D expenditures at universities and colleges, by State, control, and source of funds: fiscal year 2001 Page 15 of 15 State, control, Federal State Institu- All other and institution Total Government and local Industry tional sources governments funds Puerto Rico, total... 63,755 44,908 2,911 2,285 12,527 1,124 Public, total... 52,881 34,461 2,911 2,285 12,118 1,106 U PR Mayaguez Campus... 18,627 9,015 2,700 1,059 5, U PR Med Sci Campus... 23,913 19, ,121 2, U PR Rio Piedras Campus... 10,341 6, , Private, total... 10,874 10, Ponce School of Medicine... 3,842 3,736 0 i 0 i 91 i 15 i Pont Catholic U of PR, The U Ctrl Del Caribe Esc Med... 6,943 6, Virgin Islands, total... 3,310 1,957 1, Public, total... 3,310 1,957 1, U of the Virgin Islands... 3,310 i 1,957 i 1,257 i 96 i 0 i 0 i KEY: e = estimated i = imputed NOTES: Because of rounding, detail may not add to totals. Beginning in fiscal year 1998, this table reports data for all institutions. In prior years this table reported on doctorate-granting institutions only. SOURCE: National Science Foundation/Division of Science Resources Statistics, Survey of Research and Development Expenditures at Universities and Colleges, Fiscal Year
101 Table B-30. R&D expenditures at doctorate-granting institutions, by geographic division, State, and science and engineering field: fiscal year 2001 Page 1 of 2 Physical Environ- Math & Life Social Other Division and State Total Engineering sciences mental computer sciences Psychology sciences sciences sciences sciences Total... 32,213,590 4,911,861 2,721,442 1,775,577 1,264,231 19,031, ,284 1,399, ,009 New England... 2,530, , , , ,247 1,353,521 51, ,910 77,560 Connecticut ,794 35,868 29,679 11,346 8, ,913 11,996 10,766 2,162 Maine... 64,070 8,805 5,996 19,969 1,487 23, , Massachusetts... 1,558, , , ,006 83, ,923 24,913 86,000 58,810 New Hampshire ,975 33,238 6,706 41,668 5,712 89,991 5,882 6,225 7,553 Rhode Island ,564 19,694 10,165 29,744 12,613 51,425 7,079 5,964 5,880 Vermont... 75,597 1,738 1, ,807 66,357 1, ,272 Middle Atlantic... 4,700, , , , ,637 2,982, , ,892 33,354 New Jersey , ,083 64,738 36,371 26, ,217 12,323 49,108 3,467 New York... 2,425, , ,695 85,445 78,308 1,683,958 53,223 69,256 17,586 Pennsylvania... 1,668, , ,602 29,629 90,934 1,002,432 39,785 74,528 12,301 East North Central... 4,646, , , , ,421 2,680, , ,754 75,780 Illinois... 1,268, , ,623 42,495 74, ,893 28,662 55,058 18,955 Indiana ,487 92,978 69,719 8,730 18, ,324 15,480 55,947 28,423 Michigan... 1,101, ,408 91,946 12,258 26, ,627 20, ,956 3,471 Ohio , ,872 67,134 13,893 33, ,244 12,945 56,040 24,130 Wisconsin ,728 88,985 54,875 32,739 15, ,179 23,528 41, West North Central... 2,197, , ,461 53,731 53,341 1,562,743 33,618 87,217 39,843 Iowa ,923 68,871 25,616 6,723 11, ,357 4,839 21,360 8,514 Kansas ,639 43,247 17,592 11,760 6, ,477 3,435 9,334 9,046 Minnesota ,220 41,669 35,096 13,528 12, ,121 8,201 14, Missouri ,617 51,194 26,390 7,621 13, ,013 10,503 22,512 2,336 Nebraska ,407 26,422 10,497 8,439 7, ,561 6,000 11,213 13,438 North Dakota... 84,574 11,344 3,656 1,742 1,309 54, ,020 5,329 South Dakota... 32,185 3,864 1,614 3, , ,940 1,151 South Atlantic... 6,031,281 1,127, , , ,794 3,337,429 94, ,306 64,579 Delaware... 77,491 25,360 12,830 8,252 2,983 21,871 1,364 4,831 0 District of Columbia ,285 15,479 24, , ,665 4,021 12,976 1,403 Florida , ,088 93,073 94,042 23, ,199 34,271 54,569 15,796 Georgia , ,941 53,322 32,429 54, ,281 20,631 55,497 13,026 Maryland... 1,638, , , , , ,808 8,644 73,848 22,553 North Carolina... 1,114, ,779 59,176 38,369 33, ,160 10,143 51,229 3,292 South Carolina ,545 75,880 24,546 17,470 7, ,898 3,925 21,255 6,507 Virginia , ,240 42,244 58,166 14, ,895 11,376 21, West Virginia... 78,658 20,782 4,631 4, , ,746 East South Central... 1,369, ,078 84,074 36,508 39, ,900 27,957 39,820 42,297 Alabama ,760 75,171 23,959 9,153 11, ,596 7,876 4,624 9,584 Kentucky ,633 36,355 10, , ,009 3,276 7,501 12,027 Mississippi ,440 52,034 27,339 15,524 10,409 99,108 3,029 8,435 16,562 Tennessee ,668 67,518 22,297 11,049 13, ,187 13,776 19,260 4,124 West South Central... 3,003, , , ,505 98,031 1,958,990 30,986 77,265 22,581 Arkansas ,659 13,352 7,358 2,382 2, , , Louisiana ,009 61,566 23,262 35,655 9, ,303 1,549 15,989 12,191 Oklahoma ,559 41,476 21,592 31,394 5, ,045 12,465 18,779 2,961 Texas... 2,196, , , ,074 80,614 1,474,994 16,302 39,354 7,399 92
102 Table B-30. R&D expenditures at doctorate-granting institutions, by geographic division, State, and science and engineering field: fiscal year 2001 Page 2 of 2 Physical Environ- Math & Life Social Other Division and State Total Engineering sciences mental computer sciences Psychology sciences sciences sciences sciences Mountain... 2,018, , , ,396 57, ,550 40,988 75,017 99,578 Arizona ,548 95,775 95,510 21,730 14, ,136 9,845 27,732 7,308 Colorado ,479 79,057 88,387 69,773 10, ,772 15,585 16,887 11,314 Idaho... 82,496 15,307 4,318 6,121 1,827 48, ,144 2,774 Montana ,128 10,477 13,253 1,380 1,133 65, ,576 4,744 Nevada ,934 10,728 10,169 40,942 1,799 34,208 1,443 3,870 12,775 New Mexico ,974 91,083 14,421 13,235 7,142 85,349 7,897 7,458 45,389 Utah ,127 92,032 21,791 13,732 20, ,630 4,617 7,778 9,431 Wyoming... 41,632 3,644 3,069 6, , ,572 5,843 Pacific... 5,652, , , , ,344 3,326,742 76, ,474 90,403 Alaska ,195 7,344 13,599 30,488 16,300 16, ,346 California... 4,323, , , , ,103 2,533,207 56, ,792 52,474 Hawaii ,976 8,955 26,405 47, , ,763 10,094 Oregon ,526 22,234 16,883 42,770 16, ,511 10,164 12,848 1,238 Washington ,563 64,995 35,499 76,411 11, ,968 9,559 20,554 1,251 Outlying Areas... 63,755 9,669 4,676 6, ,630 1,314 2, NOTE: Because of rounding, detail may not add to totals. SOURCE: National Science Foundation/Division of Science Resources Statistics, Survey of Research and Development Expenditures at Universities and Colleges, Fiscal Year
103 Table B-31. R&D expenditures at universities and colleges, by State, control, and science and engineering field: fiscal year 2001 Page 1 of 15 State, control, Engi- Physical Environ- Math & Life Social Other and institution Total neering sciences mental computer sciences Psychology sciences sciences sciences sciences United States, total... 32,723,078 4,999,648 2,800,364 1,826,827 1,311,067 19,189, ,865 1,435, ,655 Public, total... 22,340,844 3,620,505 1,871,888 1,486, ,747 12,594, ,636 1,123, ,122 Private, total... 10,382,234 1,379, , , ,320 6,594, , , ,533 Alabama, total ,299 76,175 24,353 9,161 12, ,416 7,876 6,706 9,584 Public, total ,193 75,171 23,959 9,153 12, ,757 7,876 4,686 9,584 Alabama A&M University... 8,982 i 925 i 1,853 i 106 i 592 i 4,792 i 0 i 246 i 468 i Alabama State University... 1,433e 0e 0e 0e 210e 1,161e 0e 62e 0e Auburn University ,347 31,568 4, , ,131 8,536 U of Alabama Birmingham ,702 5,441 3, ,201 5, U of Alabama Huntsville... 43,731 16,671 9,769 5,772 9,600 1, U of South Alabama... 9,865e 601e 160e 762e 40e 7,836e 202e 264e 0e University of Alabama, The... 33,133 19,965 4,099 1, ,721 1,917 1, Private, total... 10,106 1, , ,020 0 Oakwood College i 0 i 202 i 8 i 21 i 336 i 0 i 0 i 0 i Selma University... 0e 0e 0e 0e 0e 0e 0e 0e 0e Talladega College Tuskegee University... 9,539 1, , ,020 0 Alaska, total ,601 7,344 13,599 30,488 16,300 16, ,752 Public, total ,601 7,344 13,599 30,488 16,300 16, ,752 U of Alaska Anchorage... 5,406 i 0 i 0 i 0 i 0 i 0 i 0 i 0 i 5,406 i U of Alaska Fairbanks ,195 7,344 13,599 30,488 16,300 16, ,346 Arizona, total ,548 95,775 95,510 21,730 14, ,136 9,845 27,732 7,308 Public, total ,548 95,775 95,510 21,730 14, ,136 9,845 27,732 7,308 Arizona State University ,763 42,485 22,231 9,798 5,159 15,307 6,399 10,114 7,270 Northern Arizona U... 14, ,148 1, , , University of Arizona ,128 52,486 72,131 10,549 9, ,319 3,403 16, Arkansas, total ,741 13,859 7,836 2,959 2, , , Public, total ,741 13,859 7,836 2,959 2, , , Arkansas State University... 1, Arkansas Tech Univ U Arkansas Pine Bluff... 4,151 i 0 i 156 i 0 i 14 i 3,279 i 0 i 86 i 616 i U of AR at Little Rock... 2, U of Arkansas Main... 78,303 12,353 7,002 2,189 1,696 51, ,123 0 U of Arkansas Medical Sci... 51, , U of Central Arkansas... 2, i 312 i 376 i 223 i 709 i 75 i 164 i 119 i Private, total Philander Smith College California, total... 4,422, , , , ,632 2,564,992 63, ,106 59,524 Public, total... 3,299, , , , ,067 2,004,007 52, ,575 42,037 CA St Poly U Pomona... 2, , CA St U Bakersfield... 3,703e 630 i 361 i 600 i 211 i 992 i 60 i 270 i 579 i CA St U Chico... 3, , , CA St U Dominguez Hills... 4, ,529 1, CA St U Fresno... 4, , CA St U Fullerton... 1,935 i 406 i 336 i 158 i 141 i 610 i 52 i 184 i 48 i CA St U Long Beach... 3,995 1, , CA St U Los Angeles... 9,061 1,381 1, , ,944 CA St U Monterey Bay... 1, i 153 i 192 i 94 i 299 i 20 i 115 i 847 i CA St U Northridge... 6,190e 795e 1,039e 171e 517e 3,239e 225e 204e 0e CA St U San Bernardino... 1, ,053 0 Cal Poly St U... 12,193 1, ,465 4,618 2, ,182 Humboldt State University... 6,282 i 912 i 21 i 531 i 422 i 3,747 i 9 i 517 i 123 i Naval Postgrad School... 40,889 i 10,876 i 2,617 i 9,854 i 8,341 i 0 i 0 i 5,561 i 3,640 i 94
104 Table B-31. R&D expenditures at universities and colleges, by State, control, and science and engineering field: fiscal year 2001 Page 2 of 15 State, control, Engi- Physical Environ- Math & Life Social Other and institution Total neering sciences mental computer sciences Psychology sciences sciences sciences sciences California, continued: Public, continued: San Diego St University... 58,332 7,843 3,744 2,952 3,071 22,063 6,714 5,142 6,803 San Francisco State U... 5,223e 1,263 i 790 i 637 i 406 i 1,558 i 168 i 277 i 124 i San Jose State University... 22,709 1,776 3,146 7,968 1,605 1,007 5, ,311 Sonoma State University U CA Berkeley , ,984 79,469 6,513 6, ,525 8,244 44,406 6,237 U CA Davis ,396 41,928 21,329 30,580 3, ,573 1,378 13,247 3,430 U CA Irvine ,866 18,035 17,693 3,982 7, ,618 3,768 8,539 2,410 U CA Los Angeles ,801 46,854 68,170 14,774 17, ,355 10,688 35,135 7,524 U CA Riverside... 94,455 11,528 7,168 3,849 1,647 60,284 1,742 5,850 2,387 U CA San Diego ,533 50,301 33, ,096 61, ,810 5,831 10,705 1,391 U CA San Francisco , , , ,523 0 U CA Santa Barbara ,372 35,393 24,757 22,963 10,721 4,334 5,912 10,531 1,761 U CA Santa Cruz... 64,253 2,259 31,117 13,048 2,883 10, , Private, total... 1,122, , ,416 34,216 92, ,985 11,574 20,531 17,487 Alliant International U Alliant University... 3,062e 171 i 68 i 33 i 50 i 999 i 17 i 94 i 1,630 i Azusa Pacific U Biola University C R Drew U of Med & Sci... 36, , CA Inst of Integral Stu California Inst of Tech ,085 46, ,479 10,771 4,762 33, ,975 Chapman U Claremont Graduate U... 2, , Fuller Theological Sem i 0 i 0 i 0 i 0 i 0 i 87 i 0 i 0 i Golden Gate University Harvey Mudd College... 6,443 i 1,742 i 978 i 66 i 233 i 2,782 i 46 i 267 i 329 i Loma Linda University... 26,451 i 0 i 0 i 0 i 0 i 23,324 i 0 i 897 i 2,230 i Occidental College... 1, Pepperdine University Pitzer College Point Loma Nazarene Col Pomona College... 1, Santa Clara University... 2,723 i 1,492 i 173 i 0 i 122 i 380 i 9 i 547 i 0 i Stanford University , ,194 54,140 8,270 20, ,312 4,906 8,888 0 U of Southern California ,597 49,865 10,030 14,440 66, ,096 5,013 7,666 1,881 University San Francisco e 164 i 100 i 7 i 36 i 326 i 9 i 35 i 23 i University of San Diego i 13 i 0 i 0 i 70 i 0 i 4 i 142 i University of the Pacific... 1, , Western U of Hlth Sci Colorado, total ,950 81,831 90,363 69,948 10, ,830 15,714 18,088 11,314 Public, total ,250 80,791 87,387 68,227 10, ,142 12,738 14,015 11,259 Colorado School of Mines... 23,654 16,288 5, Colorado State University ,144 28,708 8,564 15,671 2,481 89,852 3,004 3,068 9,796 Fort Lewis College U of Colorado HSC , , U of Colorado, Boulder ,418 31,674 70,712 51,306 6,864 20,961 9,345 8, U of Colorado, Col Spgs... 2, U of Colorado, Denver... 3, U of Northern Colorado... 1, U of Southern Colorado US Air Force Academy... 5,323 2,719 1, W State Coll Colorado Private, total... 14,700 1,040 2,976 1, ,688 2,976 4, Colorado College... 1, Regis University e 0e 133e 0e 0e 75e 0e 0e 0e University of Denver... 12,944 1,040 2,611 1, ,904 3,
105 Table B-31. R&D expenditures at universities and colleges, by State, control, and science and engineering field: fiscal year 2001 Page 3 of 15 State, control, Engi- Physical Environ- Math & Life Social Other and institution Total neering sciences mental computer sciences Psychology sciences sciences sciences sciences Connecticut, total ,745 37,518 30,241 11,385 9, ,534 12,335 11,779 2,180 Public, total ,689 28,693 7,179 9,127 2, ,611 6,849 8,854 2,162 Central Connecticut St U Southern Connecticut St U e 0e 0e 0e 0e 14e 241e 341e 0e US Coast Guard Academy University of Connecticut ,366 28,225 7,174 9,127 2, ,474 6,608 8,382 2,162 Private, total ,056 8,825 23,062 2,258 7, ,923 5,486 2, Connecticut College i 114 i 110 i 4 i 27 i 181 i 2 i 22 i 18 i Fairfield University... 1, Trinity College... 1,010e 809e 57e 0e 111e 33e 0e 0e 0e University of Hartford... 1, University of New Haven... 1, , Wesleyan University... 5, , , Yale University ,514 7,309 20,108 2,041 5, ,749 4,720 1,894 0 Delaware, total... 79,985 25,360 13,434 8,252 3,057 23,608 1,364 4, Public, total... 79,985 25,360 13,434 8,252 3,057 23,608 1,364 4, Delaware State University... 2, , University of Delaware... 77,491 25,360 12,830 8,252 2,983 21,871 1,364 4,831 0 District of Columbia, total ,110 15,479 24, , ,264 4,151 15,374 1,473 Public, total... 3, , University of DC... 3, , Private, total ,109 15,479 24, , ,893 4,151 14,442 1,403 American University... 2, Catholic U of America... 17,539 1,882 12, ,381 5 Gallaudet University... 1, ,466 0 George Washington U... 73,805 11,172 2, ,654 36, ,523 1,386 Georgetown University... 99, , , ,877 0 Howard University... 30,148 2,425 2, ,255 19,534 1,693 1, Florida, total , ,371 93,206 95,446 29, ,175 34,507 55,706 16,318 Public, total , ,701 90,092 60,313 27, ,524 25,982 52,953 15,796 Florida A&M University... 23,865 3,743 1,851 2,324 1,955 13, Florida Atlantic U... 25,111 11,233 1,053 2,593 1,530 4,386 1,591 2, Florida International U... 44,291 19,211 1,999 6,412 2,095 5, ,351 0 Florida State University ,817 11,889 42,586 14,893 6,726 12,834 5,922 18,967 0 U of Central Florida... 79,287 25,575 16,754 9, ,329 1,247 5,902 15,454 U of North Florida... 1, U of South Florida ,550 19,063 2,328 18, ,446 10,092 4,005 0 U of West Florida... 7, , ,003 0 University of Florida ,312 54,908 23,388 5,878 8, ,524 6,320 11,975 0 Private, total ,198 9,670 3,114 35,133 1, ,651 8,525 2, Bethune Cookman College Embry-Riddle Aero Univ... 7,711 6, Florida Inst of Tech... 6,195 1, ,122 1,517 1, Nova Southeastern U... 2, , University of Miami ,772 2,089 2,331 30, ,753 7,749 2,753 0 Georgia, total , ,716 55,651 35,902 55, ,957 21,083 56,308 14,090 Public, total , ,605 36,771 35,402 53, ,715 19,135 51,064 6,534 Albany State University... 1, Fort Valley State U... 2,768e 0e 0e 0e 0e 2,520e 0e 248e 0e Georgia Institute of Tech , ,581 21,086 16,924 43,810 7,108 4,128 5,512 6,384 Georgia Southern U
106 Table B-31. R&D expenditures at universities and colleges, by State, control, and science and engineering field: fiscal year 2001 Page 4 of 15 State, control, Engi- Physical Environ- Math & Life Social Other and institution Total neering sciences mental computer sciences Psychology sciences sciences sciences sciences Georgia, continued: Public, continued: Georgia State University... 38, , ,353 15,962 6,586 10,186 0 Kennesaw State Univ Medical Col of Georgia... 52, , Savannah State Univ... 2, , State U of West Georgia... 1, University of Georgia ,298 7,249 10,870 14,687 7, ,396 8,421 34,768 0 Private, total ,481 20,111 18, , ,242 1,948 5,244 7,556 Clark Atlanta University... 17,173 2,244 4, ,038 2, ,642 Emory University , , ,105 1,340 4,373 0 Inst of Paper Sci & Tech... 13,929 9,611 2, , Mercer University... 15,337 8, , Morehouse College... 2,853 i 0 i 293 i 0 i 63 i 1,097 i 273 i 213 i 914 i Morehouse School of Med... 19, , Morris Brown College e 0e 0e 0e 0e 0e 116e 0e 0e Spelman College... 3, , , Hawaii, total ,976 8,955 26,405 47, , ,763 10,094 Public, total ,976 8,955 26,405 47, , ,763 10,094 Univ of Hawaii at Manoa ,976 8,955 26,405 47, , ,763 10,094 Idaho, total... 82,496 15,307 4,318 6,121 1,827 48, ,144 2,774 Public, total... 82,496 15,307 4,318 6,121 1,827 48, ,144 2,774 Boise State University... 6,153 2, , Idaho State University... 8, , , ,397 University of Idaho... 67,496 12,122 2,496 4,284 1,557 42, ,764 1,198 Illinois, total... 1,280, , ,781 43,539 76, ,285 28,964 56,629 20,560 Public, total , ,177 63,673 38,191 67, ,110 17,813 41,603 16,863 Chicago State University... 1,415 0 i 0 i 0 i 0 i 0 i 0 i 0 i 1,415 i Illinois State University... 3, , Northeastern Illinois U Northern Illinois U... 9, , ,807 1, S Illinois U Carbondale... 43,207 9,179 1, , ,750 2,196 S Illinois U Edwardsville... 1, U of IL Chicago ,098 20,646 9,107 1,699 5, ,420 5,832 10,977 8,057 U of IL Springfield... 2, ,839 0 U of IL Urbana-Champaign , ,108 47,013 33,855 58, ,062 9,320 23,922 5,124 Western Illinois U... 7, , ,799 1, ,132 0 Private, total ,966 52,753 60,108 5,348 8, ,175 11,151 15,026 3,697 Bradley University... 1, DePaul University... 1, , Finch U Hlth Sci Chicago... 8, , Illinois Inst of Tech... 14,722 4,446 1, , Knox College Lake Forest College Loyola U of Chicago... 37, , ,351 1,615 2,377 0 Midwestern University... 2, , Northwestern University ,933 47,799 22, , ,035 2,894 9,523 3,513 Rush University... 70, ,935 1, University of Chicago , ,192 4,526 2, ,810 2,620 3,062 0 Indiana, total , ,322 72,870 8,730 21, ,324 15,480 55,947 28,423 Public, total ,391 81,756 55,773 8,730 17, ,210 13,751 54,721 20,416 Ball State University... 3, , Indiana State University... 1, Indiana University ,899 3,170 34,958 3,927 4, ,353 9,652 34,401 19,910 Purdue University ,917 78,561 20,461 4,011 12, ,206 4,010 18,
107 Table B-31. R&D expenditures at universities and colleges, by State, control, and science and engineering field: fiscal year 2001 Page 5 of 15 State, control, Engi- Physical Environ- Math & Life Social Other and institution Total neering sciences mental computer sciences Psychology sciences sciences sciences sciences Indiana, continued: Private, total... 65,027 24,566 17, ,288 8,114 1,729 1,226 8,007 Rose-Hulman Inst of Tech... 18,540 13,342 2, , University of Notre Dame... 46,096 11,222 13, ,852 8,114 1,729 1,226 8,007 Valparaiso University Iowa, total ,810 68,871 26,125 7,033 11, ,912 4,886 21,734 8,514 Public, total ,505 68,871 25,695 7,033 11, ,260 4,839 21,650 8,514 Iowa State University ,196 44,099 10,536 4,370 10,026 87, ,125 8,315 U of Iowa ,348 24,772 15,080 2,353 1, ,891 4,201 7, U of Northern Iowa... 1, , Private, total... 3, , Des Moines U Ost Med Ctr Drake University Grinnell College Maharishi U of Mgmt... 1, , Kansas, total ,800 45,056 17,638 11,760 6, ,605 3,435 9,492 9,046 Public, total ,800 45,056 17,638 11,760 6, ,605 3,435 9,492 9,046 Kansas State University... 94,030 15,099 9, ,705 60,229 1,151 3,530 1,585 Pittsburg State U... 2,161 1, University of Kansas ,467 15,850 6,269 10,900 4, ,210 1,474 5,726 7,461 Wichita State University... 16,142 12,298 1, , Kentucky, total ,895 36,402 14,350 1,189 4, ,367 3,444 8,106 12,777 Public, total ,840 36,402 14,350 1,189 3, ,346 3,170 8,106 12,777 Eastern Kentucky U Kentucky State University... 3, , Murray State University... 2, , University of Kentucky ,721 29,767 7, , , ,556 12,027 University of Louisville... 72,857 6,588 2, ,292 2,130 3,945 0 Western Kentucky Univ... 4, , Private, total... 1, Spalding University... 1, Louisiana, total ,356 61,943 26,120 35,945 10, ,335 1,846 16,102 13,340 Public, total ,133 53,701 20,975 34,585 9, ,840 1,500 12,104 7,596 Grambling State U... 2,264e 19e 786e 0e 1,137e 322e 0e 0e 0e Louisiana St U, A&M Colle ,271 31,362 11,679 31,511 3,973 94, , Louisiana St U, Hlth Sci... 65, , Louisiana St U, Shrevepor Louisiana Tech University... 3,480 1, ,005 McNeese State University Nicolls State U Southeastern Louisiana U Southern U A&M All Camp... 9,052 i 1,101 i 1,554 i 691 i 224 i 5,043 i 117 i 322 i 0 i Southern U New Orleans U of LA Lafayette... 32,073 6, ,694 18, ,090 1,209 U of LA at Monroe, The... 8,870 i 0 i 135 i 530 i 46 i 738 i 0 i 3,158 i 4,263 i University of New Orleans... 25,309 13,451 5,505 1, , ,890 0 Private, total ,223 8,242 5,145 1, , ,998 5,744 Dillard University Tulane University... 99,761 7,925 3,276 1, , ,998 5,259 Xavier University of LA... 5, , , Maine, total... 68,034 8,805 6,472 20,671 1,641 25, , Public, total... 65,614 8,805 5,996 20,281 1,563 24, , U of Maine... 64,070 8,805 5,996 19,969 1,487 23, , U of Southern Maine... 1,544 i 0 i 0 i 312 i 76 i 1,029 i 0 i 127 i 0 i 98
108 Table B-31. R&D expenditures at universities and colleges, by State, control, and science and engineering field: fiscal year 2001 Page 6 of 15 State, control, Engi- Physical Environ- Math & Life Social Other and institution Total neering sciences mental computer sciences Psychology sciences sciences sciences sciences Maine, continued: Private, total... 2, Bates College Bowdoin College Colby College Maryland, total... 1,644, , , , , ,981 8,657 73,939 22,669 Public, total ,267 83,444 54,958 65,825 29, ,488 4,717 64, Bowie State University... 2, , Coppin State College Morgan State University... 2, St Mary s Col of MD Towson University... 2, U MD Biotechnology Inst... 32, , , U MD Ctr for Environ Sci... 36, , U of MD Baltimore , , U of MD Baltimore County... 29,641 5,907 5,590 10,412 1,258 3, ,043 0 U of MD Eastern Shore... 5, , U of MD at College Park ,383 75,574 47,085 9,464 22,736 47,443 3,873 61,208 0 US Naval Academy... 3,140 1, Unif Svcs U of Hlth Sci... 23, , Private, total... 1,000, , ,597 36,577 94, ,493 3,940 9,698 22,144 Johns Hopkins U , , ,414 36,577 94, ,484 3,940 9,698 22,141 Loyola College Massachusetts, total... 1,576, , , ,698 84, ,427 25,635 89,248 62,746 Public, total ,384 28,477 27,402 11,379 16, ,948 6,933 11,851 1,906 Bridgewater State College U of MA Amherst... 97,976 18,811 20,876 4,537 14,700 29,894 5,360 2, U of MA Boston... 11, , , , U of MA Dartmouth... 9,488 3, ,466 1, U of MA Lowell... 20,656 6,443 5,208 1, ,005 1,142 1, U of MA Worcester , , Private, total... 1,325, , , ,319 68, ,479 18,702 77,397 60,840 Amherst College... 1, Boston College... 30, , ,590 2, ,266 0 Boston University ,031 18,219 13,499 3,106 2, ,512 4,879 2,074 8,766 Brandeis University... 52, , ,680 22,902 1,621 21,376 0 Clark University... 3, ,383 0 College of the Holy Cross Hampshire College... 3, , Harvard University ,107 4,931 35,170 13,765 4, ,884 3,964 31,132 0 MA Col Phar Allied Hlth i 0 i 0 i 0 i 417 i 0 i 0 i 0 i MA Institute of Tech , ,795 92,608 21,390 39,664 77,062 1,431 6,152 48,393 Mount Holyoke College... 1, New England Col of Opt... 1, , Northeastern University... 34,467 13,845 9, ,647 6,165 1,579 1,520 0 Simmons College Smith College... 2, Tufts University ,806 6,263 2, ,314 84,659 3,357 6,291 0 Wellesley College... 5, ,346 Wentworth Inst of Tech Woods Hole Oceanogr Inst... 91,029 19, , Worcester Polytech Inst... 9,348 7, Michigan, total... 1,107, ,426 92,997 13,316 27, ,588 20, ,081 3,471 Public, total... 1,100, ,281 90,907 13,152 26, ,599 20, ,645 3,353 Central Michigan U... 2, Eastern Michigan U... 2, Ferris State University Grand Valley State U... 1,
109 Table B-31. R&D expenditures at universities and colleges, by State, control, and science and engineering field: fiscal year 2001 Page 7 of 15 State, control, Engi- Physical Environ- Math & Life Social Other and institution Total neering sciences mental computer sciences Psychology sciences sciences sciences sciences Michigan, continued: Public, continued: Michigan State University ,946 20,845 45,432 2,618 5, ,803 5,401 21, Michigan Tech University... 29,613 19,688 1,916 1,132 1,083 4, Oakland University... 7,397 1,260 i 655 i 0 i 339 i 4,743 i 16 i 0 i 384 i University of Michigan , ,487 25,654 5,378 14, ,083 11,049 75, Wayne State University ,984 10,963 14, , ,180 2,749 5, Western Michigan U... 14,976 2,412 1,812 2,044 4,051 1, , Private, total... 6,507 2,145 2, Andrews University Calvin College... 1, Hope College... 1, Kettering University... 1,161 1, Lawrence Tech Univ U of Detroit Mercy... 1, Minnesota, total ,208 42,665 36,982 14,596 13, ,549 8,294 15, Public, total ,950 42,655 35,471 14,065 13, ,384 8,201 15, Minnesota State, Mankato St Cloud State Univ... 2,188 i 859 i 382 i 188 i 327 i 133 i 0 i 299 i 0 i University of Minnesota ,011 41,659 35,028 13,528 12, ,099 8,201 14,792 0 Private, total... 4, , , Augsburg College Carleton College... 1, Macalester College... 1, St Olaf College University of St Thomas Mississippi, total ,133 52,052 28,209 15,540 11, ,143 3,029 8,435 16,562 Public, total ,126 52,052 27,932 15,540 10, ,634 3,029 8,435 16,562 Alcorn State University... 7, , Jackson State University... 25, ,743 3,523 6,455 4,841 1,636 1,016 3,947 Mississippi State U ,939 44,736 5,282 6,298 3,093 79, ,950 2,459 Mississippi Valley St U... 1, U Mississippi, All Camp... 39,552 5,786 13, , ,118 3,883 U Southern Mississippi... 20,286 1,010 4,914 5, , ,273 Private, total... 1, Rust College Tougaloo College... 1, Missouri, total ,460 51,221 26,830 7,734 13, ,210 10,503 22,917 2,977 Public, total ,303 44,306 13,846 2,394 4, ,096 8,225 18,132 1,920 Lincoln University... 2, , Southeast Missouri St U Southwest Missouri St U... 1, Truman State University i 0 i 89 i 0 i 20 i 99 i 0 i 0 i 626 i U of Missouri Columbia ,782 22,637 4,956 1,204 1, ,701 5,274 14, U of Missouri Kansas City... 18, , ,508 13,472 1, U of Missouri Rolla... 28,799 21,610 5,278 1, U of Missouri St Louis... 10, , ,590 1,833 2, U of Missouri Sys Admn Private, total ,157 6,915 12,984 5,340 8, ,114 2,278 4,785 1,057 Forest Inst of Prof Psy Kirksville Col Osteo Med Saint Louis University... 32, , U of Health Sci, The (MO)... 1, , Washington University ,642 6,915 12,940 4,615 8, ,713 2,225 4,
110 Table B-31. R&D expenditures at universities and colleges, by State, control, and science and engineering field: fiscal year 2001 Page 8 of 15 State, control, Engi- Physical Environ- Math & Life Social Other and institution Total neering sciences mental computer sciences Psychology sciences sciences sciences sciences Montana, total ,744 11,966 13,386 4,195 1,133 65, ,576 4,744 Public, total ,744 11,966 13,386 4,195 1,133 65, ,576 4,744 MT Tech of the U of MT... 4,616 1, , Montana St U Bozeman... 69,593 10,477 11, , ,334 2,005 Univ of Montana, The... 33, , , ,242 2,739 Nebraska, total ,638 26,422 10,622 8,446 7, ,622 6,006 11,245 13,438 Public, total ,964 26,422 10,438 8,375 7, ,229 6,006 11,225 13,438 U of Nebraska Med Ctr... 60, , U of Nebraska at Kearney U of Nebraska at Lincoln ,520 24,584 9,965 8,347 6,546 79,194 5,802 9,662 13,420 U of Nebraska at Omaha... 5,518 1, , , Private, total... 17, , Creighton University... 17, , Nevada, total ,934 10,728 10,169 40,942 1,799 34,208 1,443 3,870 12,775 Public, total ,934 10,728 10,169 40,942 1,799 34,208 1,443 3,870 12,775 Desert Research Institute... 29, , ,932 U of Nevada Las Vegas... 27,008 4,732 4,532 11, , ,176 3 U of Nevada Reno... 59,229 5,996 5,637 6, ,445 1,217 1,694 5,840 New Hampshire, total ,975 33,238 6,706 41,668 5,712 89,991 5,882 6,225 7,553 Public, total... 87,879 19,101 2,872 40,098 1,004 15,501 1,197 5,733 2,373 U of New Hampshire... 87,879 19,101 2,872 40,098 1,004 15,501 1,197 5,733 2,373 Private, total ,096 14,137 3,834 1,570 4,708 74,490 4, ,180 Dartmouth College ,096 14,137 3,834 1,570 4,708 74,490 4, ,180 New Jersey, total , ,083 65,247 36,566 26, ,607 12,323 49,108 4,101 Public, total ,153 65,147 34,193 20,705 15, ,299 8,420 27,826 3,407 Montclair State U NJ Inst of Technology... 44,177 31,572 6, , ,902 Rutgers the State U NJ ,793 33,575 26,867 20,511 11, ,092 8,420 27,826 1,505 U Med & Dent of NJ , , Private, total ,317 53,936 31,054 15,861 11,279 27,308 3,903 21, Fairleigh Dickinson U i 0 i 0 i 0 i 46 i 11 i 106 i 60 i Monmouth University Princeton University ,411 46,947 29,244 13,293 10,601 26,431 3,892 19,003 0 Rider University Seton Hall University i 247 i 0 i 0 i 579 i 0 i 0 i 0 i Stevens Inst of Tech... 13,855 6,989e 1,448e 2,567e 678e 0e 0e 2,173e 0e New Mexico, total ,209 91,448 15,438 13,260 7,142 85,515 8,559 7,458 45,389 Public, total ,209 91,448 15,438 13,260 7,142 85,515 8,559 7,458 45,389 NM Inst Mining & Tech... 28,392 15,846 1,959 7, , New Mexico Highlands U... 2, , New Mexico State Univ... 86,963 50,500 5,851 3,913 3,912 20, , University of New Mexico ,619 24,737 6,611 1,961 3,081 62,419 7,168 6,180 44,462 New York, total... 2,476, , ,956 88,752 83,737 1,697,387 57,517 72,985 18,491 Public, total ,235 66,408 64,693 32,898 23, ,580 18,634 27,260 3,883 CUNY Baruch Col e 0e 59e 0e 46e 14e 3e 253e 0e CUNY Brooklyn College... 6, , , , CUNY City College... 17,099 4,896 6, ,552 3, CUNY Col Staten Island... 1, CUNY Grad Ctr... 2, , CUNY H H Lehman Col... 2, , CUNY Hunter College... 19, , ,232 2,899 2, CUNY John Jay Col Cr Just... 1, CUNY Medger Evers Col
111 Table B-31. R&D expenditures at universities and colleges, by State, control, and science and engineering field: fiscal year 2001 Page 9 of 15 State, control, Engi- Physical Environ- Math & Life Social Other and institution Total neering sciences mental computer sciences Psychology sciences sciences sciences sciences New York, continued: Public, continued: CUNY Queens College... 4, , CUNY York College... 1, SUNY Col Env Sci & Frstry... 27,854 9,749e 2,228e 2,785e 0e 12,813e 0e 279e 0e SUNY Col Old Westbury... 1,310e 0e 392e 0e 169e 749e 0e 0e 0e SUNY Col at Brockport e 0e 38e 128e 16e 534e 0e 6e 0e SUNY Col at Buffalo... 1, SUNY Col at Cortland SUNY Col at Fredonia SUNY Col at Geneseo SUNY Col at Oswego SUNY Col at Plattsburgh... 1, SUNY Col of Optometry... 1, , SUNY Hlth Sci Ctr Brklyn... 31,626e 0e 0e 0e 0e 31,626e 0e 0e 0e SUNY Upstate Med U... 17, , SUNY at Albany... 70, ,541 7,226 2,272 41,335 2,213 8,532 0 SUNY at Binghamton... 18,992 6,786 2,064 1,049 1,066 2,425 2,482 2, SUNY at Buffalo ,829 29,725 9,189 1,283 8, ,859 3,360 5,041 2,106 SUNY at Stony Brook ,487 15,110 25,283 17,199 7,977 95,885 3,464 3,569 0 Private, total... 1,887, , ,263 55,854 59,858 1,346,807 38,883 45,725 14,608 Adelphi University Albany Col of Pharmacy... 1, , Albany Medical College... 12, , Alfred University... 6,678 6, Barnard College... 1, Clarkson University... 8,322 6,642 1, Colgate U... 1, Columbia U in City of NY ,497 16,702 34,612 46,375 6, ,793 3,469 5, Cooper Union Cornell University ,828 53,444 61,239 3,790 19, ,381 6,425 14,737 0 Fordham University... 3, ,132 1, Hamilton College Hofstra University Ithaca College... 2, , Long Island University... 1, Manhattan College e 489e 20e 0e 0e 0e 0e 0e 0e Mt Sinai Sch Med , , New School University... 5, ,026 0 New York Inst Technology New York Medical College... 24, , New York University , , , ,633 11,233 7, Pace University All Cmp Polytechnic University... 8,277 6, Rensselaer Polytech Inst... 45,010 34,069 5,519 1,774 2, Rochester Inst of Tech... 11,416 4,950 4, , Rockefeller U, The , , , , Skidmore College St John s University (NY)... 1,184e 0e 0e 9e 5e 898e 257e 15e 0e Syracuse University... 42,476 8,941 4,890 1,047 5,430 2,417 1,254 5,509 12,988 Teachers Col, Columbia U... 9, ,085 5,004 0 Union College (NY)... 1, University of Rochester ,261 49,396 12, , ,659 10, Vassar College... 1,716e 397 i 357 i 0 i 99 i 746 i 2 i 63 i 52 i Yeshiva University , ,
112 Table B-31. R&D expenditures at universities and colleges, by State, control, and science and engineering field: fiscal year 2001 Page 10 of 15 State, control, Engi- Physical Environ- Math & Life Social Other and institution Total neering sciences mental computer sciences Psychology sciences sciences sciences sciences North Carolina, total... 1,137, ,724 61,339 43,970 34, ,448 10,502 53,752 5,078 Public, total ,697 95,999 46,364 35,564 29, ,056 6,630 38,808 4,272 Appalachian State U East Carolina University... 10, , Elizabeth City State U... 1, Fayetteville State U NC A&T State University... 15,629 9, , NC State University ,259 81,949 25,574 16,099 17, ,775 1,238 8,968 2,627 North Carolina Central U i 0 i 233 i 0 i 0 i 597 i 0 i 83 i 0 i U of NC Asheville... 1, U of NC Chapel Hill , ,161 12,615 8, ,300 4,282 25,281 0 U of NC Charlotte... 7,905 4, ,277 1, U of NC Greensboro... 3, , U of NC Wilmington... 10, , , ,600 Western Carolina U Winston Salem State U... 6, , ,550 0 Private, total ,582 16,725 14,975 8,406 5, ,392 3,872 14, Bennett College i 0 i 151 i 0 i 50 i 264 i 10 i 150 i 186 i Duke University ,133 16,530 13,377 8,406 5, ,897 3,862 14,794 0 Johnson C Smith U Shaw University i 0 i 0 i 0 i 0 i 100 i 0 i 0 i 0 i Wake Forest University... 98, , , North Dakota, total... 84,574 11,344 3,656 1,742 1,309 54, ,020 5,329 Public, total... 84,574 11,344 3,656 1,742 1,309 54, ,020 5,329 North Dakota State U... 64,882 1,513 3, ,217 48, ,549 3,780 U of North Dakota... 19,692 9, , , ,549 Ohio, total , ,430 68,601 14,242 33, ,094 13,068 56,076 24,317 Public, total , ,103 60,251 13,567 32, ,669 12,066 49,883 13,799 Air Force Inst of Tech... 8,311 3,590 1, , ,270 Bowling Green State U... 5, , , Central State University i 225 i 8 i 213 i 33 i 27 i 9 i 10 i 35 i Cleveland State U... 12,986 3, ,923 1,418 Kent State University... 11, , ,163 1, Med Col of Ohio... 15, , Miami University (OH)... 12, i 3,252 i 309 i 2 i 2,848 i 734 i 2,325 i 2,933 i NE Ohio Univ Col of Med... 4, , Ohio State University ,652 96,297 23,906 8,746 24, ,406 5,719 30,546 3,293 Ohio University... 27,146 11,876 4, ,377 1, University of Akron... 22,266 7,175 8, ,389 0 University of Cincinnati ,895 26,114 4, , ,386 2,957 University of Toledo... 16,278 8,359 3, , Wright State University... 32,033 4,085 1, ,242 19,406 1, Youngstown State Univ Private, total ,040 61,327 8, ,425 1,002 6,193 10,518 Antioch University Case Western Reserve U ,253 22,050 6, , ,951 10,394 College of Wooster Denison University John Carroll University Oberlin College Ohio Wesleyan University i 0 i 92 i 0 i 6 i 157 i 0 i 0 i 0 i U of Findlay Union Institute, The... 1,217e 0e 0e 0e 0e 0e 0e 1,217e 0e University of Dayton... 41,343 38,997 1, Wilberforce University i 280 i 0 i 0 i 0 i 0 i 0 i 0 i 0 i 103
113 Table B-31. R&D expenditures at universities and colleges, by State, control, and science and engineering field: fiscal year 2001 Page 11 of 15 State, control, Engi- Physical Environ- Math & Life Social Other and institution Total neering sciences mental computer sciences Psychology sciences sciences sciences sciences Oklahoma, total ,217 41,511 21,782 31,394 6, ,985 12,465 18,779 3,161 Public, total ,664 32,650 19,985 31,299 5, ,164 12,285 18,650 3,161 Langston University... 2, , Oklahoma State University... 90,311 18,589 6,105 1,728 1,854 50, ,630 2,961 U of Central Oklahoma University of Oklahoma ,695 14,026 13,690 29,571 3,323 66,128 11,937 10,020 0 Private, total... 12,553 8,861 1, University of Tulsa... 12,553 8,861 1, Oregon, total ,023 22,485 17,464 42,822 16, ,859 10,164 13,065 1,238 Public, total ,629 19,377 13,266 39,299 7, ,621 10,159 12,856 1,218 Oregon Health & Science U , ,290 5, Oregon State University ,925 17,005 4,783 36,295 2,871 89, ,220 1,133 Portland State University... 16,838 2, ,318 2,146 1, , Southern Oregon Univ University of Oregon... 36, ,911 1,685 2,816 17,783 4,373 2,023 0 Private, total... 21,394 3,108 4,198 3,523 9,093 1, Lewis and Clark College OGI Schl Sci & Eng OHSU... 18,798 2,857 3,508 3,388 9, Pacific University Reed College University of Portland Willamette University Pennsylvania, total... 1,687, , ,285 30,756 92,051 1,006,248 40,462 75,239 14,348 Public, total , ,265 76,460 23,620 15, ,652 28,928 33,178 6,933 East Stroudsburg U of PA Indiana U of PA All Cmp Lincoln University (PA) Pennsylvania State U , ,823 55,196 22,550 10, ,925 12,530 19,577 5,334 Temple University... 60,182 1,814 6, ,228 11,604 2,522 0 University of Pittsburgh ,792 15,614 13, , ,753 4,791 10,570 1,152 West Chester U of PA e 0e 177e 94e 32e 476e 0e 15e 0e Private, total , ,803 43,825 7,136 76, ,596 11,534 42,061 7,415 Allegheny College... 1, Bryn Mawr College... 3, , Bucknell University... 1,791 1, Carnegie Mellon U ,882 40,635 9,311 3,373 63,592 11,757 6,460 8, Dickinson College... 1, Drexel University... 27,698 22,767 2, , Duquesne University... 2, , Franklin & Marshall Coll Haverford College... 1, Juniata College e 0e 33e 4e 0e 134e 0e 0e 0e La Salle University Lafayette College... 1, Lehigh University... 29,058 23,902 3, MCP Hahnemann University.. 32, , PA College of Optometry Phila Col Osteopathic Med St Joseph s Univ... 1, Swarthmore College Thomas Jefferson U... 88, , U of Pennsylvania ,852 14,247 23, , ,006 3,483 31,948 4,722 U of Sci in Philadelphia Villanova University... 5,969 i 3,781 i 1,520 i 68 i 170 i 339 i 91 i 0 i 0 i Widener U All Campuses e 0e 0e 37e 30e 0e 0e 0e 141e Rhode Island, total ,564 19,694 10,165 29,744 12,613 51,425 7,079 5,964 5,880 Public, total... 50,835 5, , ,995 4,408 1,042 5,846 U of Rhode Island... 50,835 5, , ,995 4,408 1,042 5,
114 Table B-31. R&D expenditures at universities and colleges, by State, control, and science and engineering field: fiscal year 2001 Page 12 of 15 State, control, Engi- Physical Environ- Math & Life Social Other and institution Total neering sciences mental computer sciences Psychology sciences sciences sciences sciences Rhode Island, continued: Private, total... 91,729 14,337 9,556 5,499 12,280 42,430 2,671 4, Brown University... 91,636 14,337 9,546 5,499 12,280 42,396 2,666 4,912 0 Providence College i 0 i 10 i 0 i 0 i 34 i 5 i 10 i 34 i South Carolina, total ,404 76,308 27,206 20,083 8, ,833 4,201 22,713 6,507 Public, total ,567 75,930 26,568 20,004 7, ,850 4,027 22,379 6,507 Clemson University ,885 50,307 8,047 1,021 3,614 50, ,718 1,791 Coastal Carolina U... 1, College of Charleston... 3, , Med U of South Carolina , , South Carolina State U... 2,915e 50 i 1,398 i 0 i 0 i 640 i 0 i 827 i 0 i U of South Carolina ,973 25,573 16,499 16,449 3,450 27,153 3,596 12,537 4,716 Private, total... 3, , Benedict College... 1, Claflin College... 2, Furman University South Dakota, total... 32,185 3,864 1,614 3, , ,940 1,151 Public, total... 32,185 3,864 1,614 3, , ,940 1,151 SD Sch of Mines & Tech... 6,922 2, , ,139 South Dakota State U... 19,717 1, , U of South Dakota... 5, , , Tennessee, total ,264 68,480 25,136 11,049 14, ,312 13,777 19,868 4,144 Public, total ,502 52,854 12,440 10,544 12, ,331 10,176 13,546 3,785 East Tennessee State U... 8, , , Middle Tennessee State U Tennessee State U... 12,791 4,485 1, , Tennessee Tech U... 9,347 8, U of Tennessee ,292 36,141 9,533 6,736 10,476 90, ,226 1,456 U of Tennessee Chattanoo... 1, U of Tennessee Martin Univ of Memphis, The... 29,445 3, ,753 1,127 3,241 9,788 5,551 1,588 Private, total ,762 15,626 12, , ,981 3,601 6, Fisk University... 2, , Le Moyne-Owen Coll... 1, e 80 0e 665e 0e 0e 0e 0e Meharry Medical College... 10,268 i 0 i 0 i 347 i 8 i 9,913 i 0 i 0 i 0 i Vanderbilt University ,504 15,103 9, ,059 3,601 6, Texas, total... 2,244, , , ,957 82,673 1,492,504 16,384 40,050 8,483 Public, total... 1,802, , , ,368 70,021 1,102,505 12,884 39,094 7,338 Lamar University... 3, , Prairie View A&M U... 11,297 2, , Sam Houston State U... 2, ,415 0 Southwest Texas St Univ... 8, , , Stephen F Austin St U... 4, , Sul Ross State University TX A&M U Sys Hlth Sci Ctr... 40, , Tarleton State University... 6, , , Texas A&M Commerce Texas A&M Corpus Chri... 5,606 2, , Texas A&M Univ Kingsville... 6, , Texas A&M University , ,227 25,848 80,789 10, ,264 2,898 7,543 2,273 Texas Southern U... 2, , Texas Tech University... 69,918 15,751 6,028 11,425 1,704 31, , Texas Woman s University... 2, , U Houston Clear Lake... 11,519 10, U North TX Hlth Sci Ctr... 11, , U TX Hlth Sci Ctr San Ant , , U TX MD Anderson Cncr Ctr.. 212, , , ,
115 Table B-31. R&D expenditures at universities and colleges, by State, control, and science and engineering field: fiscal year 2001 Page 13 of 15 State, control, Engi- Physical Environ- Math & Life Social Other and institution Total neering sciences mental computer sciences Psychology sciences sciences sciences sciences Texas, continued: Public, continued: U TX Med Br at Galveston ,722 1, , U TX SW Med Ctr at Dallas , , U TX at Arlington... 17,486 9,865 3, , ,256 0 U TX at Austin , ,119 58,845 24,932 39,806 41,544 4,336 13,898 1,624 U TX at Dallas... 15,684e 2,816e 4,202e 1,436e 908e 3,642e 0e 1,545e 1,135e U TX at El Paso... 21,889 7,321 1,483 5,467 1,200 4, U TX at San Antonio... 11, , ,702 0 U of Houston Downtown e 54e 20e 26e 493e 244e 0e 0e 0e U of TX Pan American... 2, , UT Houston Hlth Sci Ctr , , University of Houston... 51,567 19,320 9,405 1,026 4,052 11,804 3,445 2,514 1 University of North Texas... 7, ,427 1, West Texas A&M U... 4,515 2, , Private, total ,518 12,511 17,166 3,589 12, ,999 3, ,145 Abilene Christian Univ Baylor Col of Medicine , , Baylor University... 2, , Jarvis Christian College... 55e 0 i 0 i 0 i 0 i 55 i 0 i 0 i 0 i Rice University... 42,675 9,972 12,701 1,101 11,295 6, Southern Methodist U... 8,948 2,274 1,533 2,152 1,134 1, St Mary s University i 0 i 0 i 0 i 0 i 0 i 0 i 362 i Texas Christian U... 3, , Trinity University... 1,241e 0e 460e 1e 61e 713e 0e 6e 0e University of Dallas Wiley College Utah, total ,127 92,032 21,791 13,732 20, ,630 4,617 7,778 9,431 Public, total ,956 84,727 18,080 13,511 18, ,887 4,053 5,946 9,170 University of Utah ,597 25,565 14,605 4,989 17, ,721 2,271 2,433 0 Utah State University ,359 59,162 3,475 8,522 1,569 34,166 1,782 3,513 9,170 Private, total... 19,171 7,305 3, ,534 3, , Brigham Young University... 19,171 7,305 3, ,534 3, , Vermont, total... 76,882 1,757 2, ,807 66,854 1, ,272 Public, total... 75,597 1,738 1, ,807 66,357 1, ,272 University of Vermont... 75,597 1,738 1, ,807 66,357 1, ,272 Private, total... 1, Middlebury College... 1, i 695 i 74 i 0 i 497 i 0 i 0 i 0 i Virginia, total , ,584 47,789 58,371 14, ,914 12,274 22, Public, total , ,500 39,645 57,364 14, ,805 12,053 22, Col of William & Mary... 35, ,728 24,956 1,139 1, ,447 0 George Mason University... 32,881 9, ,399 1,733 4,448 1,871 7,977 0 James Madison University... 1, Norfolk State University... 3, , Old Dominion University... 24,659 13,122 1,769 3,692 1,565 3, Radford University University of Virginia ,547 25,838 11,538 5,189 4,464 98,876 3, VA Polytech Inst & St U ,323 80,349 9,298 15,734 4,581 94,248 2,015 10,098 0 Virginia Commonwealth U... 99,180 3,279 5, ,501 3,096 1,091 0 Virginia Military Inst Virginia State University... 5, , , Private, total... 40,521 3,084 8,144 1, , Eastern VA Med School... 26, , Hampton University... 9, , Institute of Textile Tech... 3,171 2, University of Richmond... 1, Virginia Union University i 38 i 170 i 39 i 43 i 271 i 43 i 64 i 3 i 106
116 Table B-31. R&D expenditures at universities and colleges, by State, control, and science and engineering field: fiscal year 2001 Page 14 of 15 State, control, Engi- Physical Environ- Math & Life Social Other and institution Total neering sciences mental computer sciences Psychology sciences sciences sciences sciences Washington, total ,579 65,004 36,880 78,480 11, ,277 10,147 22,371 1,647 Public, total ,110 65,004 36,792 78,312 11, ,149 10,147 22,326 1,647 Central Washington U... 1, E Washington Univ... 2, ,525 0 Evergreen State Coll U of Washington ,626 49,629 29,784 73,448 10, ,532 9,316 10,019 0 W Washington Univ... 3, , , Washington State U ,937 15,366 5,715 2, , ,535 1,251 Private, total Whitman College West Virginia, total... 79,076 20,782 4,640 4, , ,746 Public, total... 78,721 20,782 4,639 4, , ,746 Bluefield State College Marshall U... 7,218 3, , WV Sch of Osteo Med West Virginia State Col... 63e 0e 8e 0e 0e 55e 0e 0e 0e West Virginia University... 71,311 17,269 4,047 4, , ,245 Private, total Salem International Univ Wisconsin, total ,618 90,828 55,499 34,344 16, ,149 23,681 42,763 2,133 Public, total ,408 86,913 54,359 34,344 16, ,811 23,575 41,753 1,562 U of WI-Eau Claire U of WI-Green Bay U of WI-La Crosse... 1, U of WI-Madison ,143 82,652 49,127 29,040 14, ,813 22,838 35, U of WI-Milwaukee... 23,492 4,260 4,608 3,699 1,367 3, , U of WI-Oshkosh U of WI-Parkside U of WI-River Falls U of WI-Stevens Point... 1, , U of WI-Stout... 1, U of WI-Superior U of WI-Whitewater Private, total... 93,210 3,915 1, , , Marquette University... 7,236 2,073 1, , , Medical Col of Wisconsin... 83, , Milwaukee School of Eng... 2,117 1, Wyoming, total... 41,632 3,644 3,069 6, , ,572 5,843 Public, total... 41,632 3,644 3,069 6, , ,572 5,843 University of Wyoming... 41,632 3,644 3,069 6, , ,572 5,843 Guam, total... 3, , Public, total... 3, , University of Guam... 3, ,
117 Table B-31. R&D expenditures at universities and colleges, by State, control, and science and engineering field: fiscal year 2001 Page 15 of 15 State, control, Engi- Physical Environ- Math & Life Social Other and institution Total neering sciences mental computer sciences Psychology sciences sciences sciences sciences Puerto Rico, total... 63,755 9,669 4,676 6, ,630 1,314 2, Public, total... 52,881 9,669 4,609 6, ,823 1,314 2, U PR Mayaguez Campus... 18,627 9,363 2,445 4, , U PR Med Sci Campus... 23, , U PR Rio Piedras Campus... 10, ,164 1, ,485 1,314 2,000 0 Private, total... 10, , Ponce School of Medicine... 3,842 0 i 0 i 0 i 0 i 3,842 i 0 i 0 i 0 i Pont Catholic U of PR, The U Ctrl Del Caribe Esc Med... 6, , Virgin Islands, total... 3, , Public, total... 3, , U of the Virgin Islands... 3,310 i 0 i 0 i 442 i 819 i 1,954 i 0 i 95 i 0 i KEY: e = estimated i = imputed NOTES: Because of rounding, detail may not add to totals. Beginning in fiscal year 1998, this table reports data for all institutions. In prior years this table reported on doctorate-granting institutions only. SOURCE: National Science Foundation/Division of Science Resources Statistics, Survey of Research and Development Expenditures at Universities and Colleges, Fiscal Year
118 Table B-32. Total R&D expenditures at universities and colleges, ranked by fiscal year 2001 total R&D expenditures: fiscal years Page 1 of 13 Institution and ranking Total, all institutions... 21,022,804 22,165,352 23,039,875 24,363,240 25,847,559 27,504,933 30,041,964 32,723,078 1 Johns Hopkins U , , , , , , , ,246 2 U CA Los Angeles , , , , , , , ,801 3 U of WI-Madison , , , , , , , ,143 4 University of Michigan , , , , , , , ,523 5 U of Washington , , , , , , , ,626 6 U CA San Diego , , , , , , , ,533 7 U CA San Francisco , , , , , , , ,975 8 Stanford University , , , , , , , ,906 9 U of Pennsylvania , , , , , , , , University of Minnesota , , , , , , , ,011 Total, 1st 10 institutions... 3,773,534 3,942,989 4,114,432 4,315,945 4,582,503 4,903,333 5,328,404 5,983, Pennsylvania State U , , , , , , , , U CA Berkeley , , , , , , , , Cornell University , , , , , , , , MA Institute of Tech , , , , , , , , U CA Davis , , , , , , , , Texas A&M University , , , , , , , , Washington University , , , , , , , , U of IL Urbana-Champaign , , , , , , , , Ohio State University , , , , , , , , Baylor Col of Medicine , , , , , , , ,461 Total, 1st 20 institutions... 6,494,676 6,778,247 7,044,818 7,460,115 7,941,559 8,529,146 9,304,056 10,176, Duke University , , , , , , , , Harvard University ,459e 276, , , , , , , University of Arizona , , , , , , , , University of Colorado , , , , , , , , University of Florida , , , , , , , , Columbia U in City of NY , , , , , , , , University of Pittsburgh , , , , , , , , U of Southern California , , , , , , , , Yale University , , , , , , , , Georgia Institute of Tech , , , , , , , ,533 Total, 1st 30 institutions... 8,693,791 9,106,172 9,486,573 10,030,968 10,690,008 11,494,503 12,531,345 13,687, U of NC Chapel Hill , , , , , , , , NC State University , , , , , , , , U TX at Austin , , , , , , , , University of Georgia , , , , , , , , Louisiana State U System , , , , , , , , U of MD at College Park , , , , , , , , Michigan State University , , , , , , , , Indiana University , , , , , , , , Northwestern University , , , , , , , , U of Iowa , , , , , , , ,348 Total, 1st 40 institutions... 10,508,363 10,993,226 11,452,437 12,108,219 12,862,127 13,840,588 15,062,203 16,433, Purdue University , , , , , , , , U of MD Baltimore , , , , , , , , Emory University , , , , , , , , Rutgers the State U NJ , , , , , , , , University of Rochester , , , , , , , , U of IL Chicago , , , , , , , , U of Alabama Birmingham , , , , , , , , U TX SW Med Ctr at Dallas , , , , , , , , VA Polytech Inst & St U , , , , , , , , California Inst of Tech , , , , , , , ,085 Total, 1st 50 institutions... 11,918,977 12,493,477 12,983,495 13,782,922 14,651,835 15,742,230 17,183,612 18,753,
119 Table B-32. Total R&D expenditures at universities and colleges, ranked by fiscal year 2001 total R&D expenditures: fiscal years Page 2 of 13 Institution and ranking U TX MD Anderson Cncr Ctr.. 122, , , , , , , , University of Kentucky , , , , , , , , Case Western Reserve U , , , , , , , , University of Utah , , , , , , , , University of Chicago , , , , , , , , University of Cincinnati... 93,599 91, , , , , , , New York University , , , , , , , , SUNY at Buffalo , , , , , , , , Vanderbilt University , , , , , , , , U CA Irvine , , , , , , , ,866 Total, 1st 60 institutions... 13,094,594 13,705,578 14,264,689 15,158,393 16,158,788 17,348,891 18,991,762 20,704, Iowa State University , , , , , , , , Mt Sinai Sch Med... 86,179 92,008 92,405 94, , , , , Wayne State University... 94, , , , , , , , U of Missouri Columbia , , , , , , , , Boston University... 90, , , , , , , , U of South Florida... 86,186 92,758 94,157 99, , , , , SUNY at Stony Brook , , , , , , , , University of Connecticut , , , , , , , , U Med & Dent of NJ... 86,866 96,365 98, , , , , , U of Tennessee System , , , , , , , ,898 Total, 1st 70 institutions... 14,219,530 14,888,243 15,466,426 16,423,281 17,475,297 18,768,029 20,561,299 22,412, Colorado State University , , , , , , , , U of Nebraska at Lincoln , , , , ,857e 131, , , Univ of Hawaii at Manoa... 70,079 78, , , , , , , University of New Mexico... 90, , , , , , , , University of Kansas... 95, , , , , , , , Oregon State University , , , , , , , , University of Miami , , , , , , , , University of Virginia , ,679 97, , , , , , Princeton University , , , , , , , , University of Oklahoma... 95, , , , , , , ,695 Total, 1st 80 institutions... 15,256,613 16,021,932 16,604,231 17,624,489 18,782,569 20,131,121 22,006,290 23,956, Yeshiva University... 92,881 94,739e 91,430 96,819 99, , , , Mississippi State U... 76,201 72,145 84,124 84, , , , , Rockefeller U, The... 74,458 99, , , , , , , Carnegie Mellon U , , , , , , , , Oregon Health & Science U... 63,875 74,726 80,333 98, ,374 i 120,429 i 131, , UT Houston Hlth Sci Ctr... 66,432 74,664 82,803 95, , , , , Clemson University... 76,572 82,883 84,836 84,034 90,150 99, , , Utah State University... 79,085 82,468 81,709 91,292 94,228 95, , , Arizona State University... 62,563 77,009 84,653 80,740 92, , , , Med U of South Carolina... 46,249 57,495 54,426 57,111 57,940 55,819 65, ,687 Total, 1st 90 institutions... 16,017,509 16,863,068 17,490,654 18,557,552 19,780,627 21,200,925 23,183,026 25,285, U CA Santa Barbara... 73,619 78,737 91,284 91,149 96, , , , U TX Hlth Sci Ctr San Ant... 83,535 87,336 83,028 86,019 82,357 87, , , Florida State University... 76,588 86,060 78,125 95,908 94,463 97, , , U of MA Worcester... 61,790 62,441 63,341 71,346 82,950 83,040 97, , U of Alaska Fairbanks... 76,093 72,216 71,381 70,943 75,606 88, , , U of South Carolina... 74,001 79,710 78,619 77,855 92, , , , Dartmouth College... 57,845 50,525 52,945 61,619 64,964 69,522 78, , Washington State U... 94,819 96,810 98,641 97,700 95,422 96, , , Auburn University... 84,769 85,566 87,358 85,460 87,768 80,544 92, , Tufts University... 73,749 77,093 79,356 83,568 92, , , ,806 Total, 1st 100 institutions... 16,774,317 17,639,562 18,274,732 19,379,119 20,645,106 22,116,544 24,196,649 26,391,
120 Table B-32. Total R&D expenditures at universities and colleges, ranked by fiscal year 2001 total R&D expenditures: fiscal years Page 3 of 13 Institution and ranking U TX Med Br at Galveston... 72,773 72,569 73,759 77,683 86,488 93,580 97, , Tulane University... 83, ,231 83,660 86,427 87,858 87,324 89,785 99, Georgetown University... 82, , , , , , ,211 99, Virginia Commonwealth U... 76,597 76,529 79,018 78,948 80,538 79,785 88,220 99, Wake Forest University... 52,581 68,388 75,331 75,290 76,893 82,827 86,840 98, U of MA Amherst... 65,344 66,082 73,678 85,811 89,970 86,576 96,907 97, U CA Riverside... 60,995 62,539 71,495 75,486 79,775 75,821 83,580 94, Kansas State University... 65,696 71,103 71,222 76,896 81,233 85,580 91,790 94, Brown University... 55,146 56,269 67,621 71,411 73,977 76,330 81,476 91, Woods Hole Oceanogr Inst... 81,345 80,235 73,015 77,407 75,011 71,722 81,547 91,029 Total, 1st 110 institutions... 17,471,340 18,395,928 19,056,113 20,203,592 21,493,460 22,967,515 25,127,901 27,359, Oklahoma State University... 70,808 75,906 82,960 62,480 71,466 83,108 88,285 90, Thomas Jefferson U... 56,932 65,705 69,154 69,228 69,460 78,410 89,626 88, U of New Hampshire... 43,707 42,548 45,693 45,886 52,359 57,613 72,108 87, New Mexico State Univ... 80,286 81,455 76,493 81,024 77,370 79,877 79,695 86, Medical Col of Wisconsin... 49,604 44,169 47,365 51,629 56,021 61,446 70,581 83, U of Central Florida... 33,599 37,147 21,488 38,592 35,530 42,466 47,646 79, U of Arkansas Main... 57,815 59,410 59,753 64,868 71,686 61,585 70,817 78, University of Delaware... 50,734 53,161 54,154 65,095 69,896 73,521 74,711 77, University of Vermont... 51,775 54,065 53,659 59,526 57,832 64,049 63,391 75, George Washington U... 38,429 43,488 49,263 55,158 74,481 66,757 69,300 73,805 Total, 1st 120 institutions... 18,005,029 18,952,982 19,616,095 20,797,078 22,129,561 23,636,347 25,854,061 28,181, University of Louisville... 20,475 22,835 29,655 33,434 39,147 57,051 64,062 72, West Virginia University... 58,604 53,072 54,844 63,312 62,362 63,392 66,130 71, Rush University... 39,736 44,322 48,772 49,969 55,277 60,957 68,189 70, SUNY at Albany... 43,353 38,771 66,247 57,415 50,568 64,278 82,792 70, Texas Tech University... 39,455 40,824 43,000 46,645 53,126 58,488 66,263 69, Montana St U Bozeman... 36,149 47,998 50,097 49,440 52,292 55,475 65,324 69, University of Idaho... 49,338 52,529 56,198 57,582 i 58,967 62,531 61,347 67, North Dakota State U... 36,977 40,677 43,661 35,197 40,007 44,696 50,063 64, U CA Santa Cruz... 42,457 44,294 51,062 49,428 56,533 52,902 56,212 64, U of Maine... 29,393 31,901 34,684 33,144 33,106 41,452 54,821 64,070 Total, 1st 130 institutions... 18,400,966 19,370,205 20,094,315 21,272,644 22,630,946 24,197,569 26,489,264 28,866, U of Nebraska Med Ctr... 33,997 38,287 42,612 45,365 50,453 54,205 51,547 60, Temple University... 56,308 54,742 56,533 54,500 63,024 53,940 52,466 60, U of Nevada Reno... 42,176 46,783 47,977 52,703 45,476 47,939 56,248 59, San Diego St University... 29,309 35,287 43,201 40,586 41,915 45,579 55,002 58, Brandeis University... 34,835 36,451 36,760 40,145 44,589 48,305 47,658 52, Medical Col of Georgia... 28,020 31,369 35,971 38,725 39,806 41,103 45,596 52, U of Arkansas Medical Sci... 22,762 28,389 33,354 37,336 39,487 44,066 49,074 51, University of Houston... 43,131 44,993 49,178 45,916 42,297 43,370 48,902 51, U of Rhode Island... 46,631 43,103 i 39,575 40,522 37,940 44,452 48,135 50, University of Notre Dame... 22,833 23,332 24,556 24,116 28,873 30,483 34,524 46,096 Total, 1st 140 institutions... 18,760,968 19,752,941 20,504,032 21,692,558 23,064,806 24,651,011 26,978,416 29,410, Rensselaer Polytech Inst... 37,191 37,247 37,917 38,803e 38,560 39,034 40,762 45, Florida International U... 13,520 16,375 16,856 17,359 17,880 25,061 34,649 44, NJ Inst of Technology... 29,983 30,940 39,110 38,728 40,982 40,982 47,895 44, U of Alabama Huntsville... 31,482 36,736 38,176 32,817 36,946 40,203 41,274 43, S Illinois U Carbondale... 30,497 29,631 28,578 30,043 30,490 33,169 36,354 43, Rice University... 33,309 34,446 39,696 43,601 41,067 41,069 41,840 42, Syracuse University... 38,650 33,939 34,322 34,642 37,322 39,640 40,063 42, University of Wyoming... 38,464 40,470 40,553 47,753 48,500 47,197 43,094 41, University of Dayton... 47,768 46,084 43,188 45,437 45,000 36,937 39,345 41, Naval Postgrad School... 26,538 27,510 30,706 32,333 34,095 34,095e 37,502 i 40,889 i Total, 1st 150 institutions... 19,088,370 20,086,319 20,853,134 22,054,074 23,435,648 25,028,398 27,381,194 29,839,
121 Table B-32. Total R&D expenditures at universities and colleges, ranked by fiscal year 2001 total R&D expenditures: fiscal years Page 4 of 13 Institution and ranking TX A&M U Sys Hlth Sci Ctr ,736 40, U Mississippi, All Camp... 25,000 26,862 26,215 26,231 28,079 17,298 44,927 39, Georgia State University... 17,100 17,867 18,114 27,069 31,153 36,523 36,600 38, Loyola U of Chicago... 36,830 33,098 i 29,365 30,994 34,241 29,001 30,034 37, University of Oregon... 31,170 30,386 33,654 31,487 33,315 32,695 35,934 36, C R Drew U of Med & Sci... 9,347 12,500 16,386 17,205e 17,205e 24,484 31,045 36, U MD Ctr for Environ Sci... 19,817 21,100 21,448 21,377 24,038 26,816 31,605 36, Col of William & Mary... 20,443 20,597 25,183 24,051 25,966 31,322 33,299 35, Northeastern University... 19,104 19,850 17,980 19,822 26,385 30,209 35,340 34, Univ of Montana, The... 16,908 18,881 21,421 21,151 20,133 24,372 29,590 33,535 Total, 1st 160 institutions... 19,284,089 20,287,460 21,062,900 22,273,461 23,676,163 25,281,118 27,715,304 30,210, University of Alabama, The... 21,960 23,479 21,806 23,671 23,935 28,909 31,847 33, George Mason University... 18,871 22,221 23,230 19,126 22,543 26,766 26,793 32, MCP Hahnemann U... 45,218 41,237 48,790 85,748 95,984 27,516 41,670 32, U MD Biotechnology Inst... 14,839 18,062 22,933 29,117 31,861 31,172 29,946 32, Saint Louis University... 20,844 22,686 25,099 26,517 26,943 27,817 31,002 32, U of LA Lafayette... 11,099 13,416 13,429 22,381 24,768 30,735 32,692 32, Wright State University... 19,388 18,661 17,381 17,291 19,676 23,131 29,092 32, SUNY Hlth Sci Ctr Brklyn... 27,773 30,781 30,254 i 29,727 27,517 28,840 31,626 31,626e 169 Boston College... 10,724 13,298 14,504 14,746 17,774 21,726 27,767 30, Howard University... 19,836 24,819 28,894 27,873 23,673 23,557 27,254 30,148 Total, 1st 170 institutions... 19,494,641 20,516,120 21,309,220 22,569,658 23,990,837 25,551,287 28,024,993 30,530, Desert Research Institute... 21,459 22,851 20,100 20,000 21,500 23,376 25,691 29, U of MD Baltimore County... 8,117 11,868 14,304 19,799 18,155 21,854 26,044 29, Michigan Tech University... 21,786 22,798 23,882 24,140 26,522 28,074 27,204 29, Univ of Memphis, The... 13,305 14,642 18,429 21,271 22,486 24,280 27,381 29, Lehigh University... 29,188 35,117 34,780 26,451 26,115 27,902 25,506 29, U of Missouri Rolla... 19,706 21,220 20,235 20,895 21,740 25,893 25,968 28, NM Inst Mining & Tech... 20,945 19,584 20,580 21,974 22,791 26,061 23,636 28, SUNY Col Env Sci & Frstry... 21,839 21,904 i 21,969 20,540 22,036 25,385 26,663 27, Drexel University... 20,886 19,389 19,322 19,267 19,603 22,397 24,876 27, Ohio University... 16,425 19,713 18,329 21,008 21,469 21,437 23,767 27,146 Total, 1st 180 institutions... 19,688,297 20,725,206 21,521,150 22,785,003 24,213,254 25,797,946 28,281,729 30,817, U of Nevada Las Vegas... 15,486 17,268 16,893 15,628 16,912 20,170 24,215 27, Loma Linda University... 9,204 9,270 10,837 13,396 12,788 18,818 24,369 26,451 i 183 Eastern VA Med School... 17,873 17,823 17,730 19,109 21,672 24,096 23,299 26, Jackson State University... 4,697 4,960 i 5,224 5,135 6,111 8,823 12,027 25, Florida Atlantic U... 11,236 13,776 10,576 10,521 14,265 17,151 19,535 25, Old Dominion University... 14,911 14,439 17,577 18,583 20,150 23,030 25,058 24, New York Medical College... 18,725 18,424 16,372 16,890 19,159 20,436 23,348 24, U PR Med Sci Campus... 17,765 17,354 15,005 15,575 19,830 17,114 21,373 23, Florida A&M University... 24,691 20,797 22,474 25,415 19,066 21,622 21,612 23, Colorado School of Mines... 13,880 16,585 i 19,291 19,221 20,681 21,715 21,795 23,654 Total, 1st 190 institutions... 19,836,765 20,875,902 21,673,129 22,944,476 24,383,888 25,990,921 28,498,360 31,068, U of WI-Milwaukee... 19,180 19,684 19,679 19,995 20,807 21,325 20,010 23, Unif Svcs U of Hlth Sci... 27,334 39,612 36,851 18,812 20,309 22,898 23,987 23, San Jose State University... 21,005 i 21,005 i 21,005 i 21,005 i 21,005e 21,005e 21,005e 22, University of Akron... 16,783 15,589 15,507 17,999 16,326 16,279 19,495 22, U TX at El Paso... 12,062 12,705 13,548 15,850 14,092 21,961 20,877 21, U of MA Lowell... 15,155 15,505 18,515 18,695 19,372 19,413 19,334 20, U Southern Mississippi... 8,413 8,827 9,112 9,078 11,117 16,211 17,706 20, CUNY Hunter College... 12,264 12,421 15,021 14,037 13,497 15,934 15,047 19, South Dakota State U... 14,083 13,448 14,925 15,671 15,631 15,599 16,784 19, U of North Dakota... 18,732 18,940 28,188 20,899 16,938 16,999 17,343 19,692 Total, 1st 200 institutions... 20,001,776 21,053,638 21,865,480 23,116,517 24,552,982 26,178,545 28,689,948 31,282,
122 Table B-32. Total R&D expenditures at universities and colleges, ranked by fiscal year 2001 total R&D expenditures: fiscal years Page 5 of 13 Institution and ranking Morehouse School of Med... 7,522 7,896 13,206 13,218 13,614 13,622 16,889 19, Brigham Young University... 13,859 14,102 11,791e 11,502e 11,963 23,985 17,237 19, SUNY at Binghamton... 15,803 17,106 18,500 19,310 20,754 17,998 18,661 18, OGI Schl Sci & Eng OHSU... 20,859 22,141 21,412 20,045 21,047e 19,818 18,856 18, U of Missouri Kansas City... 11,420 11,727 12,597 11,734 12,875 14,331 19,647 18, U PR Mayaguez Campus... 22,967 40,393 44,502 48,857 51,181 55,648 34,683 18, Rose-Hulman Inst of Tech i 759 i 851 i 943 i 1,035 i 1,132 4,994 18, SUNY Upstate Med U... 11,751 13,177 14,093 14,914 14,089 15,099 17,095 17, Creighton University... 9,645 11,036 11,641 13,127 15,011 16,015 15,841 17, Catholic U of America... 7,542 7,670 7,427 8,845 9,418 13,317 9,329 17,539 Total, 1st 210 institutions... 20,123,811 21,199,645 22,021,500 23,279,012 24,723,969 26,369,510 28,863,180 31,468, U TX at Arlington... 17,453 21,135 24,010 37,509 19,075 11,450 10,723 17, Clark Atlanta University... 12,709 25,245 34,566 28,893 29,637 19,467 16,891 17, CUNY City College... 18,831 22,695 22,166 22,526 21,147 15,888 17,059 17, Portland State University... 7,146 7,920 9,376 9,285 10,507 13,940 16,494 16, University of Toledo... 8,043 7,436 8,180e 8,729 11,512 11,819 13,694 16, Wichita State University... 7,483 9,691 9,904 11,797 13,117 14,555 16,213 16, U TX at Dallas... 14,492 14,027 i 13,562 14,561 15,211 16,028 15,684 15,684e 218 NC A&T State University... 13,637 15,774 15,991 15,817 14,816 14,741 13,400 15, Mercer University... 14,201 11,181 13,641 13,704 14,995 17,250 18,138 15, Med Col of Ohio... 12,471 13,008 13,367 13,469 11,425 12,467 13,747 15,276 Total, 1st 220 institutions... 20,250,277 21,347,757 22,186,263 23,455,302 24,885,411 26,517,115 29,015,223 31,631, Western Michigan U... 9,145 9,033 9,606 10,035 11,532 13,727 14,230 14, Illinois Inst of Tech... 8,853 11,923 16,000 16,182 14,013 13,438 13,734 14, Northern Arizona U... 10,290 10,856 11,572 10,800 11,652 11,857 12,570 14, Inst of Paper Sci & Tech... 8,995 9,640 12,532 i 15,424e 15,424e 10,533e 10,533e 13, Stevens Inst of Tech... 13,460 13,766 15,249 12,179 12,944 13,794 15,879 13, Cleveland State U... 10,570 10,496 10,690 i 10,884e 11,211e 11,893e 10,214 12, University of Denver... 6,671 11,091 8,349 9,019 10,589 10,247 8,383 12, Albany Medical College... 10,324 14,981 7,888 6,965 8,236 10,377 11,522 12, Miami University (OH)... 6,731 7,137 8,847 9,644 6,738 10,964 10,674 12, Tennessee State U... 6,916 7,431 9,137 8,629 9,329 10,762 11,285 12,791 Total, 1st 230 institutions... 20,342,232 21,454,111 22,296,133 23,565,063 24,997,079 26,634,707 29,134,247 31,767, University of Tulsa... 7,945 8,107 9,565 9,776 8,235 10,040 10,054 12, Cal Poly St U... 4,676 i 5,000 i 5,324 i 5,648 i 5,972 11,892 12,133 12, U of MA Boston... 10,962 9,146 10,898 11,194 11,491 11,132 12,058 11, U Houston Clear Lake... 4,979 i 4,157 i 3,335 i 2,513 i 1,691 5,963 7,091 11, Rochester Inst of Tech... 11,528 6,370 8,118 8,398 8,133e 9,340e 4,755 11, U TX at San Antonio... 3,982 4,760 i 5,538 15,890 7,220 7,780 10,292 11, Kent State University... 11,312 10,802 11,497 11,439 12,690 11,083 10,817 11, Prairie View A&M U... 8,306 8,019 10,621 9,768 9,952 10,157 9,464 11, U North TX Hlth Sci Ctr... 5,475 5,381 6,499 7,258 8,921 9,689 10,131 11, East Carolina University... 8,245 7,772 6,817 6,600 7,644 9,014 8,461 10,535 Total, 1st 240 institutions... 20,419,642 21,523,625 22,374,345 23,653,547 25,079,028 26,730,797 29,229,503 31,882, U PR Rio Piedras Campus... 5,434 5,554 6,116 6,671 9,959 9,885 9,308 10, U of NC Wilmington... 6,002 i 6,303 i 6,604 i 6,905 i 7,208 7,647 7,859 10, Meharry Medical College... 10,336 10,738 11,212 11,212e 11,212e 9,460 9,460e 10,268 i 244 U of Missouri St Louis... 6,664 7,503 7,600 8,150 9,462 10,294 9,898 10, U of South Alabama... 13,917 13,426 14,873 13,083 11,990 11,990e 9,865 9,865e 246 Teachers Col, Columbia U i 1,005 1,381 6,775 7,206 8,561 9, Tuskegee University... 7,121 7,446 9,061 33,046 37,354 9,223 8,893 9, U of MA Dartmouth... 3,134 3,709 4,092 4,197 4,902 5,820 6,905 9, Worcester Polytech Inst... 11,602 11,611 9,407 10,710 9,637 9,618 10,315 9, Tennessee Tech U... 9,357 10,184 9,188 9,053 9,661 9,204 8,878 9,347 Total, 1st 250 institutions... 20,493,677 21,600,835 22,453,503 23,757,955 25,197,188 26,821,144 29,319,445 31,980,
123 Table B-32. Total R&D expenditures at universities and colleges, ranked by fiscal year 2001 total R&D expenditures: fiscal years Page 6 of 13 Institution and ranking Hampton University... 5,342 6,344 3,854 8,002 7,140 7,472 9,323 9, CA St U Los Angeles... 3,025 i 2,527 i 2,029 i 1,531 i 1,033 i 535 9,062 9, Southern U A&M All Camp... 6,512 9,639 10,748 10,249 9,063 9,296 8,302 9,052 i 254 Northern Illinois U... 11,445 12,600 11,674 7,466 6,725 6,455 7,431 9, Alabama A&M University... 11,098 9,417 9,615 i 9,813e 14,143 11,562 8,238 8,982 i 256 Southern Methodist U... 8,277 7,595 9,050 8,220 7,964 9,401 9,713 8, Southwest Texas St Univ... 3,450 i 3,413 i 3,376 i 3,339 i 3,299 3,597 4,507 8, U of LA at Monroe, The... 5,282 5,409 6,134 7,112 6,140 8,135 8,135e 8,870 i 259 Idaho State University... 6,052 6,092 8,732 5,495 10,016 5,642 8,899 8, Clarkson University... 10,412 9,314 8,264 6,964 6,345 6,989 7,751 8,322 Total, 1st 260 institutions... 20,564,572 21,673,185 22,526,979 23,826,146 25,269,056 26,890,228 29,400,806 32,070, Air Force Inst of Tech... 7,057 5,960 5,877 7,619 4,240 4,316 7,771 8, Polytechnic University... 11,869 10,897 10,964 8,452 6,373 9,050 15,500 8, East Tennessee State U... 2,283 2,205 2,255 2,252 3,152 3,351 6,494 8, Finch U Hlth Sci Chicago... 7,057 6,692 7,022 6,672 6,672e 6,764 7,587 8, U of NC Charlotte... 5,362 i 5,688 i 6,014 i 6,340 i 6,669 9,041 7,790 7, Western Illinois U... 13,780 14,009 13,517 14,152 15,882 10,049 8,489 7, Embry-Riddle Aero Univ... 2,228 i 2,332 i 2,436 i 2,540 i 2,647 2,647e 2,700e 7, Oakland University... 6,285 7,168 6,832 6,598 7,272 6,422 6,422e 7, U of West Florida... 1,850 i 2,461 i 3,072 i 3,683 i 4,294 4,588 6,248 7, University of North Texas... 10,110 10,616 11,250 10,678 8,813 7,487 9,108 7,380 Total, 1st 270 institutions... 20,632,453 21,741,213 22,596,218 23,895,132 25,335,070 26,953,943 29,478,915 32,148, Alcorn State University... 3,099 3,233 i 3,368 4,243 i 5,119 5,223 8,034 7, Marquette University... 5,322 5,588 5,946 5,855 6,763 6,469 7,653 7, Marshall U ,231 7, U Ctrl Del Caribe Esc Med... 2,139 2,897 2,626 2,456 3,558 i 4,660 5,677 6, SD Sch of Mines & Tech... 4,718 4,795 5,015 4,301 4,550 4,161 5,743 6, Texas A&M Univ Kingsville... 4,553 i 5,243 i 5,933 i 6,623 i 7,317 6,397 7,404 6, Alfred University... 4,712 4,667 4,217 3,694 5,275 5,857 6,442 6, Tarleton State University... 2,760 2,535 2,987 2,695 3,954 3,905 3,872 6, Harvey Mudd College... 2,569 i 3,194 i 3,819 i 4,444 i 5,069 i 5,699e 5,699e 6,443 i 280 CUNY Brooklyn College... 1,783 2,436 2,800 2,969 3,132e 5,293 6,342 6,442 Total, 1st 280 institutions... 20,664,648 21,776,007 22,633,163 23,932,592 25,379,832 27,001,673 29,542,012 32,217, Humboldt State University... 3,461 i 3,699 i 3,937 i 4,175 i 4,417 5,557 5,557e 6,282 i 282 Florida Inst of Tech... 4,384 7,973 8,013 5,077 5,848 5,830 6,058 6, CA St U Northridge... 5,702 i 4,821 i 3,940 i 3,059 i 2,175 3,230 6,190 6,190e 284 Boise State University... 2,453 3,285 3,102 3,211 3,412 3,501 3,480 6, Winston Salem State U ,123 1,406 2,034 2,468 1,712 3,447 6, Villanova University... 1,848 1,996 2,040 2,141 4,714 3,950 5,280 5,969 i 287 Wesleyan University... 5,112 5,093 5,245 5,927 5,146 5,373 5,673 5, New School University... 4,383 4,592 i 4,801 i 5,011 3,705 5,230 5,209 5, U of MD Eastern Shore... 1,128 1,880 1,980 2,187 2,265 2,508 3,895 5, Texas A&M Corpus Chri ,999 5,606 Total, 1st 290 institutions... 20,694,059 21,810,469 22,667,627 23,965,414 25,413,982 27,038,564 29,592,800 32,276, U of South Dakota... 2,879 3,149 5,500 4,586 4,959 5,762 4,742 5, U of Nebraska at Omaha... 1,493 i 1,589 i 1,685 i 1,781 i 1,879 4,097 4,923 5, Wellesley College... 1,747 1,782 4,944 4,943 4,943e 5,128 i 5,313 i 5, U of Alaska Anchorage... 0 i 0 i 0 i 0 i 0e 4,782 4,782e 5,406 i 295 U.S. Air Force Academy... 2,397 i 2,838 i 3,279 i 3,720 i 4,163 3,761 4,551 5, San Francisco State U... 5,383 i 5,307 i 5,231 i 5,155 i 5,079 i 5,000e 5,223e 5,223e 297 Xavier University of LA... 4,176 10,048 5,188 5,527 5,388 3,294 3,425 5, Virginia State University... 4,569 3,134 3,270 3,988 3,338 2,611 4,422 5, Bowling Green State U... 3,874 3,700 3,942 3,542 3,392 3,454 3,454e 5, MT Tech of the U of MT... 2,718 i 3,096 i 3,474 i 3,852 i 4,230 i 4,613 4,155 4,616 Total, 1st 300 institutions... 20,723,295 21,845,112 22,704,140 24,002,508 25,451,353 27,081,066 29,637,790 32,329,
124 Table B-32. Total R&D expenditures at universities and colleges, ranked by fiscal year 2001 total R&D expenditures: fiscal years Page 7 of 13 Institution and ranking CUNY Queens College... 2,705 3,397 2,980 2,686 3,353 3,083 3,827 4, NE Ohio Univ Col of Med... 2,446 3,193 2,493 2,990 2,918 3,389 4,011 4, CA St U Fresno... 5,072 i 6,309 i 7,546 i 8,785 10,345 11,450 11,598 4, West Texas A&M U i 1,291 i 1,711 i 2,131 i 2,551 2,267 1,751 4, CA St U Dominguez Hills... 1,903 i 3,225 i 4,547 i 5,869 i 7,191 i 8, , Western Kentucky Univ... 1,982 i 3,071 i 4,160 i 5,249 i 6,342 3,287 3,770 4, U Arkansas Pine Bluff... 3,446 4,780 3,424 3,974 4,151 4,151e 4,151 i 4,151 i 308 Stephen F Austin St U... 2,820 3,392 3,990 5,083 4,213 4,892 5,289 4, Kentucky State University... 2,665 2,920 2,773 2, e 2,354 i 3, CA St U Long Beach... 5,509 i 5,676 i 5,843 5,843 18,563 i 31,283 32,551 3,995 Total, 1st 310 institutions... 20,752,714 21,882,366 22,743,607 24,047,257 25,511,693 27,154,098 29,708,090 32,372, Norfolk State University ,273 2,239 1,401 2,524 2,995 3,408 3, CA St U Chico... 2,158 3,413 1,629 3,558 3,376 3,106 2,390 3, Illinois State University... 5,071 5,166 4,608 4,596 4,688e 4,326 4,434 3, U of NC Greensboro... 2,309 2,437 2,028 1,882 2,619 2,368 2,368e 3, Ponce School of Medicine... 3,102 3,418 4,450 2,802 2,953 i 3,105 3,403 3, University of Guam... 2,765 i 2,777 i 2,789 i 2,801 i 2,819 2,829 4,130 3, CA St U Bakersfield i 490 i 418 i 346 i 274 i 200e 3,703 3,703e 318 Texas Christian U... 3,110 2,783 2,787 3,175 3,125 4,061 3,050 3, Fordham University... 2,241 2,067 2,712 3,663 2,247 3,134 3,584 3, W Washington Univ... 2,785 i 3,017 i 3,249 i 3,481 i 3,716 3,894 3,433 3,560 Total, 1st 320 institutions... 20,777,488 21,909,207 22,770,516 24,074,962 25,540,034 27,184,116 29,741,993 32,410, Louisiana Tech University... 2,315 2,707 i 3,100 5,379 i 7,659 7,659e 928 3, Lamar University... 3,052 2,189 2,407 1,988 3,051 3,739 3,204 3, Spelman College... 1,089 1,435 1,084 2,553 1,744 2,007 2,082 3, U of the Virgin Islands... 2,794 3,811 i 4,828 4,828e 4,828e 3,310 3,310e 3,310 i 325 Institute of Textile Tech... 2,297 2,642 2,781 2,813 2,776 2,346 2,638 3, Hampshire College... 1,978 2,380 i 2,782 i 3,185 2,972 2,900 2,658 3, US Naval Academy... 5,107 i 4,494 i 3,881 i 3,268 i 2,651 2,316 2,786 3, Ball State University... 2,002 2,248 2,667 3,076 2,361 2,056 2,429 3, College of Charleston... 1,445 i 1,581 i 1,717 i 1,853 i 1,989 2,100 3,047 3, Bryn Mawr College... 2,559 2,403 3,432 7,016 4,231 3,929 2,791 3,066 Total, 1st 330 institutions... 20,802,126 21,935,097 22,799,195 24,110,921 25,574,296 27,216,478 29,767,866 32,442, Alliant University ,062e 332 Clark University... 2,711 2,228 1,954 2,417 2,147 2,651 2,908 3, University of DC... 3,211 3,227 i 3,244 3,244e 3,074 3,394 2,737 3, Eastern Michigan U... 1,192 i 1,255 i 1,318 i 1,381 i 1,444 i 1,512 4,118 2, South Carolina State U... 5,181 4,091 i 3,000 2,855 2,885 2,900 2,915 2,915e 336 CUNY Grad Ctr... 2,674 3,449 i 4,224 i 4,999 5,109 1, , Texas Woman s University... 1,458 1,712 1,818 2,224 2,359 2,179 3,005 2, Langston University... 2,046 3,187 2,521 1,828 2,031 2,340 2,553 2, Morehouse College , e 592e 2,853 2,853e 2,853 i 340 Fort Valley State U... 2,648 3,009 2,474 2,863 2,989 2,937 2,768 2,768e Total, 1st 340 institutions... 20,824,239 21,958,329 22,820,340 24,133,324 25,596,926 27,238,342 29,792,462 32,471, Santa Clara University... 1,815e 1,895 i 1,954 i 2,077 i 2,189 i 2,326 i 2,509 i 2,723 i 342 Fisk University... 1,631 1,800 i 1,969 1,969e 2,909 4,034 3,401 2, Baylor University... 1,179 1,471 1,251 2,233 2,032 2,032e 3,307 2, E Washington Univ... 2,445 i 2,445 i 2,445 i 2,445 i 2,445e 2,356 2,108 2, Nova Southeastern U... 1,245 1,265 1,258 1,402 1,986 3,106 2,919 2, Smith College... 1,920 1,728 i 1,536 i 1,344 1,295 1,107 2,582 2, American University... 3,226 3,063 3,279 3,029 3,453 2,987 2,245 2, Duquesne University... 1,115 1, ,396 1,297 2,025 2,662 2, CA St Poly U Pomona... 2,363 i 2,105 i 1,847 i 1,589 i 1,331 i 1,069 1,703 2, Delaware State University... 3,987 1,036 2,071 1,947 2,883 2,765 3,415 2,494 Total, 1st 350 institutions... 20,845,165 21,976,577 22,838,811 24,152,755 25,618,746 27,262,149 29,819,313 32,497,
125 Table B-32. Total R&D expenditures at universities and colleges, ranked by fiscal year 2001 total R&D expenditures: fiscal years Page 8 of 13 Institution and ranking Texas Southern U... 2,612 4,173 3,820 3,867 2,690 2,507 2,182 2, Sam Houston State U... 2,321 3,905 i 5,490 5,849 4,532 3,892 3,053 2, Midwestern University... 1,928 2,126 1,512 2,250 1,840 1,701 2,470 2, U of Central Arkansas ,758 2, Morgan State University... 3,558 3,663 i 3,768 i 3,873 i 3,981 1,066 4,371 2, Claremont Graduate U... 1,229 1,017 1, ,870 2,416 2, Murray State University ,235 1,059 1,490 2,043 1,966 2,084 2, Towson University ,452 2,138 2, U of TX Pan American... 1,208 i 1,321 i 1,434 i 1,547 i 1,664 1,684 1,688 2, Grambling State U ,455 2,634 1,997 1,997e 2,264 2,264e Total, 1st 360 institutions... 20,859,352 21,994,401 22,858,638 24,175,414 25,638,853 27,280,284 29,843,737 32,521, CUNY H H Lehman Col... 1,454 1,327 i 1,199 1,247e 1,308 i 1,370 1,632 2, Lincoln University... 3,121 2,934 2,970 2,899 3,313 2,686 2,502 2, New Mexico Highlands U... 1,485 2,035 i 2,585 2,627 i 2,669 i 2,712 6,511 2, Bowie State University ,672 4,511 2,675 2,675e 2, St Cloud State Univ i 985 i 1,301 i 1,617 i 1,935 1,935e 1,935e 2,188 i 366 Savannah State Univ , Pittsburg State U ,631 1,614 1,663 2, Milwaukee School of Eng i 1,152 i 1,335 i 1,518 i 1,704 1,776 2,020 2, U of AR at Little Rock ,400e 2, Claflin College ,254 1, e 2,074 Total, 1st 370 institutions... 20,868,499 22,004,042 22,869,704 24,189,925 25,657,658 27,296,120 29,867,535 32,543, Ithaca College i 770 i 1,013 i 1,256 i 1,499 2,066 2,565 2, Central Michigan U... 1, e 1, e e 2, U of IL Springfield , Albany State University... 3,687e 3,687 i 3,687e 3,687e 1,019 1,019e 1,393 1, U of Northern Iowa... 1,404 2,165 1,944 1,623 1,682 1,542 1,744 1, CA St U Fullerton... 1,749 i 1,749 i 1,749 i 1,749 i 1,749e 1,749 i 1,712 i 1,935 i 377 Macalester College i 590 i 811 i 1,032 i 1,253 i 1,474 i 1,695 i 1, CA St U Monterey Bay , CA St U San Bernardino i 248 i 294 i 340 i 390 3,301 1,797 1, Central Washington U i 1,074 i 1,237 i 1,400 i 1,563 i 1,731 2,006 1,880 Total, 1st 380 institutions... 20,878,682 22,014,883 22,881,482 24,201,855 25,666,813 27,309,757 29,882,112 32,562, U of WI-Stevens Point... 1,649 1,871 1,649 1,324 1,112 1,302 1,227 1, Gallaudet University... 3,271 i 3,007 i 2,743 i 2,479 i 2,212 2,348 1,752 1, Amherst College... 1,694 i 1,664 i 1,634 i 1,604 i 1,573 1,498 1,859 1, Bucknell University i 885 i 997 i 1,109 i 1,221 i 1,335 1,835 1, Mount Holyoke College i 892 i 936 i 980 i 1,033 1,721 1,835 1, Vassar College i 596 i 596 i 596 i 596e 1,156 i 1,716 1,716e 387 Colgate U ,664 1, Fairfield University i 521 i 629 i 737 i 845 i 953 i 1,061 1, CUNY Col Staten Island... 7, , ,208 1, DePaul University... 1,329 1,182 1,300 1,103 1,233 1, ,628 Total, 1st 390 institutions... 20,896,300 22,026,455 22,892,867 24,212,581 25,677,652 27,322,077 29,897,132 32,580, St Joseph s Univ i 322 i 413 i 504 i , Maharishi U of Mgmt ,632 1, New England Col of Opt ,111 1,734 1,643 1,228 1, U of WI-La Crosse ,133 1,310 1,045 1,185 1,113 1,404 1, SUNY Col at Buffalo... 1,460 1,604 2,570 2,448 1,157 1,689 1,683 1, Southwest Missouri St U... 2,292 i 2,169 i 2,046 i 1,923 i 1,797 1,324 1,324e 1, Colorado College i 279 i 257 i 235 i ,213 1, U of Southern Maine i 480 i 524 i 568 i 614 1,366 1,366e 1,544 i 399 Occidental College... 2,220 i 2,220 i 2,220 i 2,220 i 2,220e , Dickinson College , ,528 Total, 1st 400 institutions... 20,905,017 22,035,505 22,902,930 24,222,635 25,688,954 27,332,210 29,909,522 32,595,
126 Table B-32. Total R&D expenditures at universities and colleges, ranked by fiscal year 2001 total R&D expenditures: fiscal years Page 9 of 13 Institution and ranking Indiana State University... 1,042 1,208 1,548 1,265 5,255 4,977 4,196 1, University of New Haven i e 558e e 1, James Madison University... 1,041 i 1,172 i 1,303 i 1,434 i 1,568 1,781 1,121 1, SUNY Col of Optometry ,135 1,001 1, Alabama State University... 1,055 1,000 1, ,177 1,365 1,365e 1,433e 406 Hope College i 920 i 949 i 978 i 1,007 i 1, , Chicago State University... 1, ,266 1,263 1, Barnard College... 1,306 1, e 1,172 1,181 1,347 1, State U of West Georgia i 614 i 821 i 1,028 i 1,235 i 1,442 i 1,655 1, Arkansas State University i 868 i 899 i 930 i 962 1,527 1,203 1,347 Total, 1st 410 institutions... 20,914,028 22,044,315 22,912,289 24,231,847 25,703,269 27,348,121 29,923,793 32,609, Mississippi Valley St U , SUNY Col Old Westbury ,310 1,310e 413 Calvin College i 673 i 763 i 853 i 943 i 1,033 1,191 1, Pomona College... 1,316 i 1,240 i 1,164 i 1,088 i 1,010 1,619 1,791 1, Middlebury College i 774 i 767 i 760 i 753 i 742 1,371 1, University of Richmond... 1, ,035 1,099 1,178 1, S Illinois U Edwardsville... 1,743 i 1,549 i 1,355 i 1,161 i 966 1,316 1,344 1, U of NC Asheville i 601 i 636 i 671 i 706 i , Le Moyne-Owen Coll ,451 1,053 1,700 1, U of Northern Colorado e 701 1,128 1,265 Total, 1st 420 institutions... 20,921,173 22,050,972 22,919,568 24,239,670 25,711,996 27,357,612 29,936,501 32,622, Elizabeth City State U i 1,098 1, ,040 1,558 1, Trinity University... 1,383 i 1,280 i 1,177 i 1,074 i 971 i 867 1,241 1,241e 423 University of the Pacific , ,020 1, U of Detroit Mercy... 2,527 2,950 2,555 2,260 1,853 1,870 1,767 1, U of North Florida , Union Institute, The... 1,008 1,155 1,173 1,024 i 875 1,023 1,217 1,217e 427 Albany Col of Pharmacy ,360 1, Long Island University ,221 1,406 1,267 1, Bradley University i 887 i 1,089 i 1,291 i 1,493 1,341 1,371 1, St John s University (NY)... 1,103 1,068 1,903 2,216 1,572 1,617 1,184 1,184e Total, 1st 430 institutions... 20,928,624 22,060,278 22,929,578 24,252,417 25,721,551 27,367,775 29,948,486 32,634, Haverford College ,077 1,304 1,303 1,104 1,191 1, Carleton College i 936 i 934 i 932 i 930 i 927 1,245 1, U of Health Sci, The (MO) e 677 1, Grand Valley State U ,810 1, ,138 1, Kettering University i 379 i 396 i 413 i , SUNY Col at Plattsburgh... 1,108 1,520 1, , , CUNY York College ,311 1,526 1,392 1,341 1, CUNY John Jay Col Cr Just ,325 1,442 1,274 1, U of WI-Stout... 1,500 1,305 1,523 1,306 1, ,236 1, University of Hartford ,061 1,068 Total, 1st 440 institutions... 20,936,084 22,068,244 22,939,306 24,261,586 25,731,761 27,377,706 29,959,270 32,646, Spalding University , Union College (NY)... 1, , ,043 1,002 1, Benedict College... 1, e 800 i 966 i 1,143 1, Coastal Carolina U ,277 1, Allegheny College i 592 i 627 i 662 i 697 i , Trinity College i 919 i 1,076 i 1,233 i 1,390 i 1,552 1,010 1,010e 447 Lafayette College i 550 i 575 i 600 i , Tougaloo College... 1,502 1,606 i 1,710 i 1,815 1,180 1, , Colby College i 332 i 350 i 368 i Swarthmore College... 1, e 996e 966 Total, 1st 450 institutions... 20,943,273 22,074,971 22,946,165 24,268,454 25,738,721 27,385,179 29,967,430 32,656,
127 Table B-32. Total R&D expenditures at universities and colleges, ranked by fiscal year 2001 total R&D expenditures: fiscal years Page 10 of 13 Institution and ranking East Stroudsburg U of PA i 415 i 532 i 649 i 766 i 887e Loyola College... 1,569 1,386 1, ,303 1,445 1, Bates College Phila Col Osteopathic Med , Hamilton College i 475 i 475 i 475 i 475e 751 i 1, Bethune Cookman College North Carolina Central U i 869e e 808 i 913 i 458 Kirksville Col Osteo Med Rider University Youngstown State Univ i 462 i 607 i 752 i Total, 1st 460 institutions... 20,948,312 22,080,676 22,952,309 24,274,444 25,745,305 27,392,685 29,975,984 32,665, Georgia Southern U... 1,125 i 1,067 i 1,009 i 951 i 893 i U of Houston Downtown i 964 i 996 i 1,028 i 1,060 i 1, e 463 Truman State University e 684 i e 738 i 834 i 464 Seton Hall University... 3,072 2,411e 2,400e 2,400e 2,400 1, Reed College i 561 i 521 i 481 i 441 i 400e Bennett College e e 811 i 811 i 467 PA College of Optometry i 649 i 564 i 479 i 394 i Middle Tennessee State U U of Central Oklahoma i 164 i 180 i 196 i 215 1, West Chester U of PA... 1,113 1, e Total, 1st 470 institutions... 20,957,219 22,089,622 22,959,693 24,281,807 25,753,242 27,400,562 29,983,643 32,673, SUNY Col at Oswego... 1,192 1,056 i Sul Ross State University Eastern Kentucky U... 6,498 i 12,539 i 18,580 i 24,621 i 30,662 i 36, Des Moines U Ost Med Ctr Montclair State U i 159 i 206 i 253 i 300 i 347 i Western Carolina U CUNY Medger Evers Col Indiana U of PA All Cmp e U of Southern Colorado... 1,251 1,464 1, Appalachian State U Total, 1st 480 institutions... 20,967,908 22,106,222 22,982,515 24,310,345 25,788,274 27,441,952 29,989,656 32,681, Minnesota State, Mankato... 1,115 i 1,320 i 1,525 i 1,730 i 1, Sonoma State University SUNY Col at Brockport e e 484 Furman University University of Portland Andrews University e Simmons College i 556 i 650 i 744 i 838 i University San Francisco i 717 i 663 i 609 i 555 i 500e e 489 Franklin & Marshall Coll i 1,006 i 1,056 i 1,106 i 1,158 1,424 1, Nicolls State U Total, 1st 490 institutions... 20,972,457 22,111,470 22,988,482 24,316,477 25,794,661 27,447,229 29,996,228 32,688, Lawrence Tech Univ i 155 i 139 i 123 i Southern U New Orleans Virginia Union University e 671 i 671 i 494 U of WI-Oshkosh Radford University College of the Holy Cross , Hofstra University... 1,786 2, Southeastern Louisiana U i 584 i 681 i 778 i 875 i 976 1, SUNY Col at Geneseo Lincoln University (PA) i 1,135 1,032 1, Total, 1st 500 institutions... 20,976,732 22,116,455 22,993,629 24,320,599 25,800,206 27,452,487 30,002,722 32,695,
128 Table B-32. Total R&D expenditures at universities and colleges, ranked by fiscal year 2001 total R&D expenditures: fiscal years Page 11 of 13 Institution and ranking Virginia Military Inst U of WI-Green Bay Southern Connecticut St U i 263 i 245 i 227 i 209 i e 504 Fayetteville State U i U of WI-Parkside U of Sci in Philadelphia e New York Inst Technology Oakwood College e 567 i 509 Central State University... 1,791 1,789 i 1,786 1,786e 1,497 1,497e 560e 560 i 510 Grinnell College i 332 i 332 i 332 i 332e 4,300 1, Total, 1st 510 institutions... 20,981,831 22,121,890 22,999,275 24,326,077 25,805,239 27,461,062 30,008,749 32,700, Arkansas Tech Univ i 485 i 464 i 443 i John Carroll University i 719 i 807 i 895 i 983 i 1,072 1,072e U of WI-Eau Claire Bowdoin College Manhattan College... 1,064 i 939 i 814 i 689 i e 516 Cooper Union... 1,515 i 1,515 i 1,515 i 1,515 i 1,515e Augsburg College i 554 i 492 i 430 i 368 i Evergreen State Coll i 426 i 494 i 562 i 630 i 698 i Connecticut College i 432 i 432 i 432 i 432e 432 i 423 i 478 i 520 McNeese State University e Total, 1st 520 institutions... 20,988,100 22,127,927 23,005,719 24,331,972 25,811,646 27,466,607 30,014,458 32,705, Whitman College i 559 i 522 i 485 i US Coast Guard Academy i 306 i 304 i 302 i Chapman U i 193 i 229 i 265 i 301 i 337 i St Olaf College i 358 i 395 i 432 i 469 i Lewis and Clark College i 347 i 386 i 425 i MA Col Phar Allied Hlth e 253 i U of WI-Superior... 1,705 1, Valparaiso University e 426e Denison University i 384 i 367 i 350 i 333 i Pace University All Cmp... 0e Total, 1st 530 institutions... 20,992,674 22,132,516 23,009,504 24,335,403 25,815,600 27,471,160 30,018,767 32,710, SUNY Col at Cortland CUNY Baruch Col i e 533 Lake Forest College i 40 i 60 i 80 i Bridgewater State College i 525 i 460 i 395 i 330 i Western U of Hlth Sci e 332 i Drake University i 369 i 364 i 359 i 354 i St Mary s University i 350 i 234 i 118 i Salem International Univ Dillard University e Willamette University Total, 1st 540 institutions... 20,995,080 22,134,584 23,011,669 24,337,058 25,818,323 27,473,799 30,022,867 32,713, Oberlin College i 399 i 456 i 513 i 570 i 627 i W State Coll Colorado i 126 i 122 i 118 i Pitzer College i Abilene Christian Univ i 414 i 387 i 360 i Fort Lewis College Pacific University Kennesaw State Univ La Salle University i U of WI-River Falls College of Wooster e Total, 1st 550 institutions... 20,997,682 22,137,154 23,014,192 24,339,590 25,821,046 27,476,392 30,025,972 32,716,
129 Table B-32. Total R&D expenditures at universities and colleges, ranked by fiscal year 2001 total R&D expenditures: fiscal years Page 12 of 13 Institution and ranking Wilberforce University e 280 i 280 i 280 i 552 Northeastern Illinois U , Texas A&M Commerce U of WI-Whitewater Central Connecticut St U i 210 i 211 i 212 i 213 i 214 i Ohio Wesleyan University e 255 i 557 St Mary s Col of MD Skidmore College i 211 i 192 i 173 i University of San Diego U of Nebraska at Kearney i 84 i 96 i 108 i 120 i 132 i Total, 1st 560 institutions... 21,000,497 22,141,145 23,016,675 24,342,445 25,823,320 27,478,269 30,028,960 32,719, SUNY Col at Fredonia Fairleigh Dickinson U e 140e Southeast Missouri St U i 610 i 521 i 432 i 343 i 250e University of St Thomas i 281 i 289 i 297 i i Regis University i 105 i 111 i 117 i e 566 Widener U All Campuses e 567 Southern Oregon Univ i 243 i 278 i Johnson C Smith U... 2,083 1,307 1,307 1,546 4,299 8, Point Loma Nazarene Col i 162 i 162 i 162 i 162 i 162 i U of Findlay Total, 1st 570 institutions... 21,004,480 22,144,375 23,019,687 24,346,243 25,829,407 27,488,349 30,031,207 32,721, Juniata College i 203 i 194 i 185 i 176 i e 572 Knox College i 529 i 474 i 419 i 364 i 309 i Adelphi University e WV Sch of Osteo Med Monmouth University e Morris Brown College... 1,010 3,796 3, e 321 i e 577 Shaw University e 100 i 578 Providence College e 93 i 579 Pont Catholic U of PR, The e Fuller Theological Sem e 80 80e 87 i Total, 1st 580 institutions... 21,007,555 22,150,245 23,025,298 24,348,963 25,831,562 27,490,250 30,032,754 32,722, University of Dallas Ferris State University e West Virginia State Col e 63e 584 Wentworth Inst of Tech... 1,504 1,155 1, , Jarvis Christian College e 586 Alliant International U Antioch University Azusa Pacific U e Biola University Bluefield State College Total, 1st 590 institutions... 21,009,647 22,151,740 23,026,707 24,350,142 25,833,465 27,491,387 30,033,391 32,723, CA Inst of Integral Stu Coppin State College Forest Inst of Prof Psy Golden Gate University Pepperdine University Philander Smith College e 72 72e Rust College Selma University i e e 599 Talladega College e U of Missouri Sys Admn Total, 1st 600 institutions... 21,011,939 22,153,133 23,027,347 24,350,649 25,834,341 27,491,991 30,033,820 32,723,
130 Table B-32. Total R&D expenditures at universities and colleges, ranked by fiscal year 2001 total R&D expenditures: fiscal years Page 13 of 13 Institution and ranking Wiley College Total, 1st 601 institutions... 21,011,939 22,153,133 23,027,347 24,350,649 25,834,341 27,491,991 30,033,820 32,723,078 Total, all other sampled institutions... 10,865 12,219 12,528 12,591 13,218 12,942 8, Johns Hopkins University includes the Applied Physics Laboratory, with $482 million in total R&D expenditures. 2 These data do not include R&D expenditures at university-associated federally funded research and development centers. See tables B-73 and B-74. KEY: -- = not available e = estimated i = imputed NOTE: Because of rounding, detail may not add to totals. SOURCE: National Science Foundation/Division of Science Resources Statistics, Survey of Research and Development Expenditures at Universities and Colleges, Fiscal Year
131 Table B-33. Federally financed R&D expenditures at universities and colleges, ranked by fiscal year 2001 federally financed R&D expenditures: fiscal years Page 1 of 13 Institution and ranking Total, all institutions... 12,646,128 13,328,036 13,835,880 14,309,340 15,144,829 16,070,661 17,508,301 19,190,873 1 Johns Hopkins U , , , , , , , ,741 2 U of Washington , , , , , , , ,103 3 University of Michigan , , , , , , , ,117 4 Stanford University , , , , , , , ,468 5 U of Pennsylvania , , , , , , , ,996 6 U CA San Diego , , , , , , , ,276 7 Columbia U in City of NY , , , , , , , ,928 8 U CA Los Angeles , , , , , , , ,858 9 University of Colorado , , , , , , , , MA Institute of Tech , , , , , , , ,319 Total, 1st 10 institutions... 2,800,765 2,883,263 2,988,681 3,061,018 3,262,978 3,443,649 3,717,135 4,034, U of WI-Madison , , , , , , , , Harvard University , , , , , , , , Washington University , , , , , , , , U CA San Francisco , , , , , , , , University of Pittsburgh , , , , , , , , University of Minnesota , , , , , , , , Yale University , , , , , , , , U of Southern California , , , , , , , , Pennsylvania State U , , , , , , , , Cornell University , , , , , , , ,466 Total, 1st 20 institutions... 4,581,750 4,760,453 4,900,895 5,043,774 5,321,476 5,659,958 6,137,439 6,717, Baylor Col of Medicine... 92,404 94,197 92,294 97, , , , , U of NC Chapel Hill , , , , , , , , Duke University , , , , , , , , U CA Berkeley , , , , , , , , University of Arizona , , , , , , , , U of IL Urbana-Champaign , , , , , , , , U TX at Austin , , , , , , , , U of Alabama Birmingham... 98, , , , , , , , California Inst of Tech , , , , , , , , Emory University... 88,735 92,724 95, , , , , ,317 Total, 1st 30 institutions... 5,858,051 6,090,323 6,278,866 6,494,546 6,908,824 7,383,934 8,014,640 8,748, University of Rochester , , , , , , , , Ohio State University , , , , , , , , Case Western Reserve U... 97, , , , , , , , Northwestern University... 83,684 90, , , , , , , University of Chicago , , , , , , , , U of Iowa... 99, , , , , , , , U CA Davis , , , , , , , , Boston University... 72,551 83,473 87,946 97, , , , , Texas A&M University , , , , , , , , Vanderbilt University... 92,439 92,185 95,684 98, , , , ,230 Total, 1st 40 institutions... 6,904,802 7,179,198 7,403,583 7,641,381 8,134,962 8,697,076 9,435,007 10,305, U of MD at College Park... 86,051 94,071 99, , , , , , Georgia Institute of Tech... 97, , , , , , , , University of Florida... 79,630 79,361 86,973 94, , , , , U TX SW Med Ctr at Dallas... 71,468 78,892 81,468 89,357 97, , , , New York University... 89,013 93,759 90,010 94, , , , , University of Cincinnati... 56,361 55,107 72,543 78,292 90, , , , University of Utah... 81,263 83,554 93,788 99, , , , , U of IL Chicago... 57,074 57,528 58,991 70,739 73,797 86, , , University of Virginia... 83,670 85,244 75,256 82,488 99, , , , Indiana University... 81,657 86,041 90,881 95,931 95, , , ,781 Total, 1st 50 institutions... 7,688,064 7,997,647 8,269,336 8,561,427 9,142,778 9,798,999 10,604,322 11,616,
132 Table B-33. Federally financed R&D expenditures at universities and colleges, ranked by fiscal year 2001 federally financed R&D expenditures: fiscal years Page 2 of 13 Institution and ranking Michigan State University... 73,855 77,499 77,243 82,977 81,146 89,835 97, , University of Miami... 91,563 97,111 96, , , , , , Oregon Health & Science U... 43,629 49,429 51,338 68,637 82,146 i 95,655 i 109, , University of New Mexico... 51,780 90,897 76,850 76,978 84,365 84, , , Mt Sinai Sch Med... 55,188 58,991 61,599 60,914 69,995 84,624 98, , Yeshiva University... 70,718 72,132e 73,396 77,936 80,000 89, , , U CA Irvine... 67,245 69,655 72,994 64,293 66,602 75,505 88, , Colorado State University... 66,464 75,216 74,930 79,393 80,451 91, , , U of MD Baltimore... 59,727 59,596 65,211 72,100 78,037 84,516 91,212 99, Purdue University... 82,148 93,256 91,632 91,969 92,844 95,708 92,010 98,151 Total, 1st 60 institutions... 8,350,381 8,741,429 9,011,245 9,338,140 9,959,856 10,693,324 11,590,418 12,678, Univ of Hawaii at Manoa... 39,392 44,238 66,902 72,421 86,886 93,418 95,419 97, Carnegie Mellon U ,790 84,758 91,830 91,527 95,046 90,408 91,191 97, SUNY at Buffalo... 81,814 75,713 87,813 78,092 76,037 85,490 96,410 96, NC State University... 69,608 68,675 74,485 69,473 79,533 66,310 77,328 95, Louisiana State U System... 52,064 61,456 64,524 65,257 67,090 75,831 89,007 94, U TX MD Anderson Cncr Ctr.. 42,416 44,711 42,794 49,702 63,074 69,413 81,872 94, Georgetown University... 54,992 74,328 81,704 84,198 84,801 83,972 98,836 93, SUNY at Stony Brook... 72,673 76,505 79,570 86,568 91,531 93,937 96,641 93, UT Houston Hlth Sci Ctr... 46,821 54,762 61,456 67,205 70,446 71,288 79,665 88, University of Kentucky... 48,801 50,014 51,450 62,128 60,760 66,184 73,858 86,239 Total, 1st 70 institutions... 8,946,752 9,376,589 9,713,773 10,064,711 10,735,060 11,489,575 12,470,645 13,616, U Med & Dent of NJ... 40,687 45,734 47,505 57,471 59,828 61,730 75,318 86, Oregon State University... 65,069 68,687 79,977 80,131 82,416 81,649 80,398 84, U of MA Worcester... 34,923 36,970 40,198 43,350 53,766 55,516 64,212 79, Wayne State University... 43,354 46,246 46,264 53,707 57,646 57,610 64,320 79, Princeton University ,544 63,903 69,386 69,667 69,005 72,974 74,681 78, U of Tennessee System... 82,288 76,294 73,724 74,049 69,793 70,187 72,059 78, Wake Forest University... 36,722 50,719 55,845 54,287 56,705 60,293 65,585 78, VA Polytech Inst & St U... 73,490 79,074 80,319 87,657 82,734 75,386 71,127 77, Rutgers the State U NJ... 68,149 72,567 67,588 68,225 69,829 75,664 79,711 77, U CA Santa Barbara... 59,336 63,443 73,400 64,915 68,680 74,026 80,754 76,828 Total, 1st 80 institutions... 9,509,314 9,980,226 10,347,979 10,718,170 11,405,462 12,174,610 13,198,810 14,413, Woods Hole Oceanogr Inst... 74,219 72,759 61,820 66,386 64,765 59,534 67,036 75, University of Kansas... 40,816 42,209 41,858 46,733 50,567 57,272 68,950 74, Utah State University... 46,128 48,431 43,764 49,594 54,903 54,433 57,378 74, Tufts University... 49,672 50,481 53,508 55,421 61,167 62,836 64,677 71, U TX Hlth Sci Ctr San Ant... 51,671 54,433 51,203 53,478 51,954 56,904 65,251 71, University of Connecticut... 48,286 50,096 53,009 49,503 53,189 55,496 66,144 70, Dartmouth College... 41,762 39,059 39,682 43,154 45,053 46,741 56,369 69, U of Missouri Columbia... 31,299 32,420 38,938 43,335 45,448 53,875 65,420 68, University of Georgia... 55,005 57,509 56,254 54,364 54,712 56,080 62,678 66, Mississippi State U... 33,918 33,158 34,637 34,928 42,004 46,528 53,808 65,493 Total, 1st 90 institutions... 9,982,090 10,460,781 10,822,652 11,215,066 11,929,224 12,724,309 13,826,521 15,121, Thomas Jefferson U... 43,215 49,335 51,475 49,091 51,728 56,369 67,448 64, U TX Med Br at Galveston... 32,775 33,204 38,323 42,006 48,588 55,061 61,357 64, Medical Col of Wisconsin... 31,459 31,098 34,527 39,364 43,831 47,087 55,034 64, Iowa State University ,439 58,766 54,904 52,938 51,196 54,179 59,976 62, New Mexico State Univ... 59,632 57,210 53,552 57,165 56,587 56,875 57,073 61, Med U of South Carolina... 28,507 36,417 40,637 37,790 36,473 30,997 41,432 60, University of Oklahoma... 35,266 37,112 42,679 45,756 54,451 57,589 60,542 60, U of South Florida... 19,910 29,558 29,751 31,068 35,930 42,005 50,557 58, Brown University... 36,864 37,432 42,139 43,664 44,412 45,276 49,943 58, Virginia Commonwealth U... 47,923 46,694 45,454 44,982 48,167 48,175 52,137 57,315 Total, 1st 100 institutions... 10,374,080 10,877,607 11,256,093 11,658,890 12,400,587 13,217,922 14,382,020 15,733,
133 Table B-33. Federally financed R&D expenditures at universities and colleges, ranked by fiscal year 2001 federally financed R&D expenditures: fiscal years Page 3 of 13 Institution and ranking Florida State University... 39,775 45,947 39,527 52,945 50,451 55,666 56,830 57, Arizona State University... 30,699 35,215 38,947 37,700 41,359 53,905 49,935 56, Tulane University... 42,354 60,837 49,720 49,708 52,924 50,779 52,080 55, Rockefeller U, The... 39,990 38,993 37,369 43,979 43,845 45,010 45,211 55, U of Alaska Fairbanks... 40,770 37,285 30,351 28,127 31,505 34,647 46,605 55, U of South Carolina... 37,918 44,292 51,269 37,005 42,586 48,490 51,872 51, George Washington U... 24,379 28,031 30,490 34,182 45,072 49,944 49,627 51, U of MA Amherst... 32,730 32,126 37,969 40,925 43,196 39,877 44,712 49, University of Vermont... 33,695 32,932 31,521 34,042 31,460 36,085 39,861 48, Washington State U... 45,691 49,043 48,807 45,030 44,510 44,610 48,441 48,660 Total, 1st 110 institutions... 10,742,081 11,282,308 11,652,063 12,062,533 12,827,495 13,676,935 14,867,194 16,264, Clemson University... 24,133 28,734 28,109 28,092 28,199 27,064 31,304 48, SUNY at Albany... 23,607 24,468 48,395 41,190 33,894 46,242 62,059 46, U of New Hampshire... 25,032 21,072 23,305 24,128 25,913 30,586 38,921 45, U of Nebraska at Lincoln... 35,471 36,897 32,352 41,269 41,888e 36,977 37,831 43, U of Rhode Island... 33,025 33,927 i 34,829 i 35,733 33,308 36,207 38,538 43, University of Delaware... 26,250 27,352 29,509 32,031 33,688 34,628 37,716 41, Temple University... 27,140 28,303 28,720 26,374 28,793 29,734 38,213 41, Naval Postgrad School... 26,225 27,155 29,873 31,618 33,308 33,308e 36,476 i 40,121 i 119 Auburn University... 27,747 27,544 31,401 27,412 27,706 27,058 31,515 40, Rush University... 14,831 18,124 22,480 24,382 28,444 31,119 32,573 37,301 Total, 1st 120 institutions... 11,005,542 11,555,884 11,961,036 12,374,762 13,142,636 14,009,858 15,252,340 16,692, Rice University... 25,672 26,429 33,238 37,935 34,772 35,012 35,144 35, Montana St U Bozeman... 15,738 17,233 17,667 19,707 23,982 26,231 30,564 34, U of Arkansas Medical Sci... 13,410 16,117 16,796 19,249 21,857 26,392 29,962 34, University of Dayton... 39,994 37,842 34,413 36,196 36,329 30,755 31,717 34, Kansas State University... 21,547 25,266 24,769 25,781 27,001 28,102 31,185 33, University of Oregon... 22,204 23,789 26,411 26,020 27,041 27,336 30,793 32, U of Nevada Reno... 18,799 21,377 20,971 20,813 20,383 24,587 26,267 31, U of Alabama Huntsville... 21,583 25,417 26,141 21,731 23,772 25,166 25,939 30, U Mississippi, All Camp... 15,836 17,466 15,571 15,696 16,463 9,952 28,107 30, Syracuse University... 19,309 19,341 18,361 23,780 i 29,200 30,050 29,620 30,036 Total, 1st 130 institutions... 11,219,634 11,786,161 12,195,374 12,621,670 13,403,436 14,273,441 15,551,638 17,019, Brandeis University... 21,585 22,741 23,233 25,233 28,098 29,423 26,444 30, University of Notre Dame... 16,358 17,424 18,886 19,173 23,053 23,614 27,362 29, West Virginia University... 34,622 30,258 30,800 29,443 24,985 26,264 28,013 29, U CA Santa Cruz... 23,802 26,043 31,727 24,005 29,881 25,084 25,959 29, Saint Louis University... 18,120 19,351 21,483 23,218 23,341 23,722 26,453 28, Howard University... 15,196 21,137 26,253 25,884 21,501 21,658 25,292 27, C R Drew U of Med & Sci... 7,674 10,500 15,288 16,052e 16,052e 22,212 21,969 27, University of Idaho... 16,586 18,239 16,481 17,416 i 18,352 24,263 23,014 26, Loyola U of Chicago... 23,587 20,209 i 16,831 14,771 17,685 17,588 20,695 26, George Mason University... 12,679 14,939 16,430 14,652 17,268 19,492 20,669 25,992 Total, 1st 140 institutions... 11,409,843 11,987,002 12,412,786 12,831,517 13,623,652 14,506,761 15,797,508 17,300, Rensselaer Polytech Inst... 22,090 24,250 24,748 22,785 21,774 22,803 25,555 25, U CA Riverside... 23,743 25,127 27,727 24,006 22,999 19,994 21,085 25, Oklahoma State University... 20,440 18,951 25,034 21,455 23,220 23,179 24,770 25, University of Louisville... 9,274 9,782 13,306 13,521 15,067 15,536 17,713 25, Florida International U... 10,936 13,030 13,415 13,828 14,243 15,757 20,296 23, U of Maine... 11,386 15,789 16,211 15,066 13,028 19,163 24,412 23, U of MD Baltimore County... 6,080 7,131 8,135 9,816 12,618 15,624 20,244 23, San Diego St University... 12,268 16,436 17,181 20,237 19,721 19,724 22,802 23, Northeastern University... 16,037 17,113 14,706 16,321 21,454 22,776 26,916 23, U of Arkansas Main... 16,040 17,231 16,019 15,772 16,156 15,851 20,778 23,172 Total, 1st 150 institutions... 11,558,137 12,151,842 12,589,268 13,004,324 13,803,932 14,697,168 16,022,079 17,544,
134 Table B-33. Federally financed R&D expenditures at universities and colleges, ranked by fiscal year 2001 federally financed R&D expenditures: fiscal years Page 4 of 13 Institution and ranking Texas Tech University... 11,360 11,450 13,013 14,901 17,481 20,242 21,480 22, MCP Hahnemann U... 26,324 23,905 27,723 48,062 61,102 17,281 27,379 22, SUNY Hlth Sci Ctr Brklyn... 16,695 18,374 18,685 i 18,996 18,318 21,053 22,860 22,860e 154 Jackson State University... 4,220 4,461 i 4,702 3,960 5,326 7,925 10,690 22, U of Nebraska Med Ctr... 12,256 13,375 14,029 13,990 15,663 17,167 19,878 22, Florida A&M University... 20,730 19,430 20,118 22,547 15,726 20,693 16,278 22, U of Central Florida... 16,549 20,077 18,714 13,361 13,502 16,048 13,801 22, University of Alabama, The... 11,482 12,236 12,238 13,118 14,909 17,601 19,486 22, Desert Research Institute... 15,272 15,867 14,600 13,900 15,400 16,552 19,923 22, University of Houston... 22,830 22,633 25,448 21,695 22,018 20,443 21,365 21,876 Total, 1st 160 institutions... 11,715,855 12,313,650 12,758,538 13,188,854 14,003,377 14,872,173 16,215,219 17,769, Medical Col of Georgia... 9,121 11,007 11,338 11,904 13,127 13,991 15,210 21, Loma Linda University... 5,082 5,416 5,878 8,061 7,834 12,217 18,811 20,494 i 163 Drexel University... 11,006 9,444 11,613 10,545 10,929 12,914 14,292 20, Boston College... 7,938 9,990 11,137 11,207 12,778 14,492 16,673 20, University of Wyoming... 15,115 15,373 14,991 15,003 17,806 19,109 16,556 20, U PR Med Sci Campus... 11,973 12,433 12,191 12,978 11,843 13,971 16,657 19, Univ of Montana, The... 8,675 10,149 11,591 11,554 11,748 14,627 18,378 19, NJ Inst of Technology... 12,572 15,109 20,561 21,287 21,127 21,127 17,381 18, TX A&M U Sys Hlth Sci Ctr ,321 18, New York Medical College... 14,913 13,778 11,657 11,866 13,639 14,029 17,975 18,344 Total, 1st 170 institutions... 11,812,250 12,416,349 12,869,495 13,303,259 14,124,208 15,008,650 16,381,473 17,965, Morehouse School of Med... 6,663 6,996 11,747 12,099 12,461 12,948 15,419 18, U Southern Mississippi... 7,291 7,500 7,587 7,766 9,536 14,124 15,084 18, Michigan Tech University... 10,984 12,807 12,603 12,941 13,938 16,107 16,650 17, U TX at El Paso... 9,085 9,511 10,471 12,873 10,758 18,292 16,416 16, U of North Dakota... 16,660 16,157 23,976 17,775 13,404 13,615 13,880 15, U of Nevada Las Vegas... 9,543 10,464 11,142 9,221 9,713 10,248 13,815 15, Wright State University... 9,624 9,619 9,502 10,001 10,832 12,365 12,543 15, Col of William & Mary... 10,426 11,731 13,020 10,911 11,097 11,892 13,031 15, Old Dominion University... 7,888 7,968 9,266 10,736 12,346 13,706 14,908 15, North Dakota State U... 10,877 11,684 11,683 6,432 9,787 12,308 15,463 15,207 Total, 1st 180 institutions... 11,911,291 12,520,786 12,990,492 13,414,014 14,238,080 15,144,255 16,528,682 18,128, Clark Atlanta University... 11,025 15,821 25,345 25,943 24,079 12,116 16,170 14, San Jose State University... 11,825 i 11,825 i 11,825 i 11,825 i 11,825e 11,825e 11,825e 14, Florida Atlantic U... 6,797 9,643 6,500 7,653 9,582 11,036 12,359 14, OGI Schl Sci & Eng OHSU... 10,458 11,512 11,215 14,282 14,996e 15,303 13,743 14, Lehigh University... 15,363 21,410 22,409 14,882 13,019 13,161 12,726 13, Georgia State University... 6,771 6,277 5,818 7,544 11,284 14,310 12,090 13, Catholic U of America... 6,058 6,467 5,901 6,910 7,161 11,064 7,680 13, NM Inst Mining & Tech... 7,582 8,447 7,205 10,496 8,959 10,719 8,652 13, CUNY City College... 13,585 15,512 16,169 15,221 14,437 12,393 13,059 13, Ohio University... 5,836 7,587 8,046 9,790 10,323 10,544 11,695 12,898 Total, 1st 190 institutions... 12,006,591 12,635,287 13,110,925 13,538,560 14,363,745 15,266,726 16,648,681 18,265, Colorado School of Mines... 8,161 8,847 i 9,534 9,330 8,694 10,704 11,995 12, U of LA Lafayette... 1,998 2,307 2,936 4,699 5,834 9,430 12,164 12, U MD Ctr for Environ Sci... 5,452 5,952 5,998 6,240 7,440 8,116 10,805 12, NC A&T State University... 10,132 12,501 12,521 13,362 12,924 12,454 11,187 11, U of Missouri Rolla... 6,472 5,834 7,542 8,080 7,934 8,731 9,804 11, Brigham Young University... 8,126 8,615 8,752e 9,223 i 9,694 11,414 10,378 11, Eastern VA Med School... 10,162 9,824 10,203 10,618 9,449 11,354 12,114 11, Med Col of Ohio... 8,726 9,243 9,559 9,766 8,107 9,219 9,944 11, Portland State University... 4,377 4,659 5,675 5,960 6,881 9,313 11,217 11, U of MA Lowell... 7,281 8,097 10,257 11,560 12,259 10,354 9,905 11,196 Total, 1st 200 institutions... 12,077,478 12,711,166 13,193,902 13,627,398 14,452,961 15,367,815 16,758,194 18,382,
135 Table B-33. Federally financed R&D expenditures at universities and colleges, ranked by fiscal year 2001 federally financed R&D expenditures: fiscal years Page 5 of 13 Institution and ranking U of WI-Milwaukee... 7,977 7,749 8,026 8,156 8,936 9,190 8,425 11, U MD Biotechnology Inst... 6,079 7,037 7,529 8,719 11,789 13,911 11,157 11, Univ of Memphis, The... 4,027 4,565 4,954 5,413 5,849 6,364 11,177 11, CUNY Hunter College... 7,156 6,152 6,083 6,895 6,414 7,526 8,650 10, Illinois Inst of Tech... 6,738 9,119 11,183 11,668 9,946 9,777 10,926 10, S Illinois U Carbondale... 9,931 10,100 8,836 8,632 7,801 7,660 10,130 10, SUNY Upstate Med U... 6,555 6,854 6,764 7,188 6,487 7,889 8,461 10, U Houston Clear Lake... 4,582 i 3,753 i 2,924 i 2,095 i 1,266 5,387 6,383 10, Tennessee State U... 6,031 6,478 7,983 7,569 7,978 8,522 8,873 10, Unif Svcs U of Hlth Sci... 18,124 25,858 24,621 9,218 7,547 9,696 11,023 10,105 Total, 1st 210 institutions... 12,154,678 12,798,831 13,282,805 13,702,951 14,526,974 15,453,737 16,853,399 18,490, Meharry Medical College... 10,154 10,208 11,004 11,004e 11,004e 9,192 9,192e 10,015 i 212 Northern Arizona U... 5,614 6,469 6,938 8,176 6,812 7,111 7,842 9, U TX at Arlington... 4,637 8,692 14,804 26,829 11,294 6,089 5,106 9, University of Denver... 6,144 9,877 7,415 7,888 9,385 9,081 7,439 9, Mercer University... 11,115 9,178 10,832 10,741 12,043 12,657 11,350 9, U PR Mayaguez Campus... 9,369 18,048 19,568 21,052 21,903 23,784 11,837 9, University of Akron... 4,016 4,231 4,793 5,146 4,042 7,140 7,081 8, CA St U Los Angeles... 2,700 i 2,253 i 1,806 i 1,359 i 912 i 463 8,344 8, Albany Medical College... 8,344 8,686 6,691 5,632 6,545 7,437 7,691 8, South Dakota State U... 5,711 5,622 5,500 5,650 5,812 6,086 7,448 8,456 Total, 1st 220 institutions... 12,222,482 12,882,095 13,372,156 13,806,428 14,616,726 15,542,777 16,936,729 18,580, Hampton University... 5,078 6,130 3,854 7,777 6,801 7,168 8,994 8, U of South Alabama... 8,838 9,135 9,747 9,709 9,451 9,451e 8,276 8,276e 223 U of Missouri Kansas City... 4,758 4,506 5,087 5,380 6,199 7,206 7,490 8, Kent State University... 6,005 6,506 7,729 7,577 8,251 8,212 7,736 8, Stevens Inst of Tech... 7,644 8,677 9,222 6,174 6,667 7,084 8,785 8, U TX at San Antonio... 2,685 3,398 i 4,111 11,553 5,112 5,463 7,441 8, Alabama A&M University... 8,954 8,075 8,249 i 8,423e 10,518 8,558 7,056 7,761 i 228 Alcorn State University... 3,039 3,202 i 3,365 4,242 i 5,119 5,223 8,034 7, University of Tulsa... 3,319 3,441 5,104 4,190 4,002 5,272 5,498 7, Creighton University... 4,653 4,474 5,046 5,129 4,096 4,929 5,541 7,275 Total, 1st 230 institutions... 12,277,455 12,939,639 13,433,670 13,876,582 14,682,942 15,611,343 17,011,580 18,659, Tuskegee University... 6,694 7,200 8,231 29,930 26,894 6,942 6,694 7, U of NC Wilmington... 4,554 i 4,440 i 4,326 i 4,212 i 4,098 4,431 5,336 7, Prairie View A&M U... 5,693 6,284 10,325 9,315 9,612 8,675 7,679 7, Southern U A&M All Camp... 4,620 7,480 7,724 7,774 6,983 6,689 6,418 7,059 i 235 U TX at Dallas... 7,224 6,404 i 5,583 6,719 8,115 7,700 7,049 7,049e 236 Embry-Riddle Aero Univ... 1,578 i 1,542 i 1,506 i 1,470 i 1,432 1,432e 1,551e 6, University of Toledo... 3,505 3,187 3,506e 2,937 5,366 5,682 6,312 6, U Ctrl Del Caribe Esc Med... 1,664 2,387 2,353 2,072 3,208 i 4,345 5,347 6, U North TX Hlth Sci Ctr... 4,045 3,985 4,847 5,273 5,645 5,370 5,799 6, SUNY at Binghamton... 5,100 5,659 5,661 6,218 6,205 5,761 6,319 6,392 Total, 1st 240 institutions... 12,322,132 12,988,207 13,487,732 13,952,502 14,760,500 15,668,370 17,070,084 18,728, Finch U Hlth Sci Chicago... 5,214 4,789 5,209 5,022 5,022e 4,860 5,117 6, Western Michigan U... 2,699 2,753 3,336 3,618 4,023 4,165 4,584 6, Cal Poly St U... 1,372 i 2,015 i 2,658 i 3,301 i 3,948 7,673 7,605 6, U PR Rio Piedras Campus... 3,660 3,315 3,866 4,275 5,460 5,654 5,620 6, Marshall U ,618 5, Wichita State University... 1,752 2,551 2,196 2,602 2,646 3,260 5,228 5, U of MD Eastern Shore... 1,128 1,880 1,980 2,187 2,265 2,508 3,895 5, Teachers Col, Columbia U i ,900 4,119 5,613 5, Rochester Inst of Tech... 2,478 1,731 2,545 2,523 2,339e 2,690 2,664 5, Southern Methodist U... 4,984 4,352 6,007 4,543 4,836 6,387 6,302 5,587 Total, 1st 250 institutions... 12,346,149 13,012,025 13,516,025 13,981,313 14,793,964 15,709,752 17,122,330 18,787,
136 Table B-33. Federally financed R&D expenditures at universities and colleges, ranked by fiscal year 2001 federally financed R&D expenditures: fiscal years Page 6 of 13 Institution and ranking Western Illinois U... 8,983 9,045 9,016 8,804 10,867 6,595 6,112 5, Oakland University... 3,202 3,860 3,222 3,303 3,218 3,033 3,033e 5, East Carolina University... 5,188 4,964 4,079 3,904 4,027 4,832 4,388 5, U of NC Charlotte... 2,675 i 3,043 i 3,411 i 3,779 i 4,150 4,780 5,380 5, US Air Force Academy... 2,371 i 2,786 i 3,201 i 3,616 i 4,033 3,699 4,505 5, U of MA Dartmouth... 2,771 3,221 3,433 2,884 3,731 3,983 3,228 4, Winston Salem State U ,246 1,874 1,898 1,619 3,216 4, U of West Florida... 1,012 i 1,460 i 1,908 i 2,356 i 2,806 3,624 4,521 4, Xavier University of LA... 4,176 8,979 5,106 5,473 5,355 3,240 3,174 4, San Francisco State U... 3,909 i 3,854 i 3,799 i 3,744 i 3,689 i 3,630e 4,561e 4,561e Total, 1st 260 institutions... 12,381,216 13,054,034 13,554,446 14,021,050 14,837,738 15,748,787 17,164,448 18,837, Villanova University... 1,061 1,362 1,390 1,471 2,470 i 3,470 4,035 4,520 i 262 Worcester Polytech Inst... 9,584 8,552 6,967 7,315 5,230 4,292 4,219 4, SD Sch of Mines & Tech... 2,903 3,369 3,278 2,990 3,221 3,300 4,127 4, SUNY Col Env Sci & Frstry... 3,351 3,186 i 3,021 2,690 2,715 3,874 4,332 4, U of Missouri St Louis... 2,559 2,840 3,349 3,650 3,975 4,841 4,523 4, Clarkson University... 6,115 4,793 3,794 3,368 3,010 3,694 3,837 4, Northern Illinois U... 6,238 5,764 4,809 3,460 3,344 3,727 3,603 4, Virginia State University... 4,529 2,599 2,735 3,453 2,792 2,061 3,602 4, Tarleton State University ,177 1,483 1,623 1,426 4, Polytechnic University... 6,872 6,863 6,329 3,485 2,843 4,595 8,200 4,063 Total, 1st 270 institutions... 12,425,000 13,094,034 13,591,029 14,054,109 14,868,821 15,784,264 17,206,352 18,880, Cleveland State U... 4,620 3,457 3,522 i 3,588e 3,696e 3,655e 3,318 3, Boise State University... 1,452 1,597 1,875 1,932 1,892 2,595 2,151 3, Norfolk State University ,256 2,187 1,388 2,442 2,970 3,273 3, Wesleyan University... 2,710 2,651 3,889 3,731 3,570 3,640 4,058 3, Southwest Texas St Univ... 1,944 i 1,737 i 1,530 i 1,323 i 1,116 1,871 3,519 3, Idaho State University... 1,489 1,471 2,054 1,128 5,200 1,258 3,723 3, Ponce School of Medicine... 2,874 3,150 4,212 2,607 2,783 i 2,960 3,257 3, Kentucky State University... 2,665 2,920 2,761 2, e 2,179 i 3, East Tennessee State U... 1, ,368 1,400 2,768 3, U of South Dakota... 1,357 1,632 2,350 2,239 2,669 3,373 2,084 3,534 Total, 1st 280 institutions... 12,445,808 13,114,735 13,616,147 14,074,898 14,894,260 15,808,689 17,236,682 18,918, CUNY Queens College... 1,663 2,023 1,365 1,637 2,323 1,884 2,604 3, Wellesley College... 1,537 1,568 2,533 2,304 2,304e 2,684 i 3,064 i 3, University of Guam... 1,946 i 2,011 i 2,076 i 2,141 i 2,206 2,242 3,165 3, Miami University (OH)... 2,789 2,314 2,633 2,876 2,687 3,302 2,674 3, Marquette University... 2,640 2,394 2,270 2,421 3,510 3,416 3,085 3, Western Kentucky Univ... 1,037 i 1,560 i 2,083 i 2,606 i 3,130 2,287 2,711 3, Spelman College , ,282 1,700 1,832 1,978 3, CA St U Northridge... 1,569 i 1,504 i 1,439 i 1,374 i 1,309 2,324 3,182 3,182e 289 US Naval Academy... 5,019 i 4,398 i 3,777 i 3,156 i 2,534 2,234 2,770 3, U of LA at Monroe, The... 1,600 1,724 1,573 2,308 1,466 2,824 2,824e 3,106 i Total, 1st 290 institutions... 12,466,562 13,135,508 13,636,884 14,097,003 14,917,429 15,833,718 17,264,739 18,951, Inst of Paper Sci & Tech... 1,629 2,341 3,043 i 3,746e 3,746e 3,398e 3,398e 2, Humboldt State University... 1,460 i 1,641 i 1,822 i 2,003 i 2,185 2,629 2,629e 2,945 i 293 University of North Texas... 2,858 3,696 3,492 3,703 2,621 2,617 3,618 2, U Arkansas Pine Bluff... 2,341 3,661 2,747 2,838 2,911 2,911e 2,911 i 2,911 i 295 CA St U Long Beach... 4,712 i 4,859 i 5,013 5,013e 8,471 i 11,929 12,964 2, Langston University... 1,929 2,661 2,521 1,828 2,031 2,340 2,553 2, U of Alaska Anchorage... 0 i 0 i 0 i 0 i 0e 2,537 2,537e 2,842 i 298 Texas Christian U... 2,600 1,972 2,159 2,541 2,493 3,257 2,441 2, U of NC Greensboro... 1,971 2,172 1,730 1,581 1,829 1,535 1,535e 2, CUNY Brooklyn College... 1,138 1,666 1,408 1,492 1,574e 2,228 2,866 2,776 Total, 1st 300 institutions... 12,487,200 13,160,177 13,660,819 14,121,748 14,945,290 15,869,099 17,302,191 18,979,
137 Table B-33. Federally financed R&D expenditures at universities and colleges, ranked by fiscal year 2001 federally financed R&D expenditures: fiscal years Page 7 of 13 Institution and ranking U of Nebraska at Omaha i 675 i 759 i 843 i 931 2,153 2,403 2, West Texas A&M U i 59 i 76 i 93 i , MT Tech of the U of MT... 1,783 i 2,029 i 2,275 i 2,521 i 2,767 i 3,014 2,744 2, Florida Inst of Tech... 1,654 2,213 2,980 2,292 2,152 2,735 2,980 2, Clark University... 2,301 1,910 1,756 2,134 1,660 2,651 1,652 2, CA St U Dominguez Hills... 1,090 i 1,658 i 2,226 i 2,794 i 3,362 i 3, , Fisk University... 1,514 1,741 i 1,969 1,969e 2,909 2,846 2,652 2, U of MA Boston... 2,382 2,454 2,706 3,075 3,160 2,951 3,378 2, CA St Poly U Pomona i 968 i 993 i 1,018 i 1,043 i 1,069 1,703 2, Fort Valley State U... 2,591 2,936 2,338 2,471 2,359 2,318 2,417 2,417e Total, 1st 310 institutions... 12,502,091 13,176,820 13,678,897 14,140,958 14,965,747 15,892,861 17,323,169 19,005, Bowling Green State U... 2,317 2,347 2,391 i 2,436 2,029 1,847 1,847e 2, Morgan State University... 3,423 3,557 i 3,691 i 3,825 i 3,960 1,066 4,371 2, Texas A&M Corpus Chri ,363 2, Lincoln University... 2,869 2,702 2,681 2,584 2,635 i 2,686 2,502 2, Delaware State University... 3, ,787 1,833 2,734 2,055 3,052 2, Lamar University... 2,320 1,549 1,451 1,169 2,307 2,914 2,330 2, Grambling State U ,450 2,630 1,936 1,936e 2,200 2,200e 318 Savannah State Univ i , U of AR at Little Rock ,400e 2, NE Ohio Univ Col of Med... 1,136 1,459 1,068 1,530 1,430 1,693 2,002 2,072 Total, 1st 320 institutions... 12,518,125 13,189,792 13,693,733 14,157,281 14,983,109 15,907,571 17,347,141 19,028, CUNY H H Lehman Col... 1,130 1,011 i e 1,071 i 1,216 1,444 2, Bowie State University ,672 4,403 2,360 2,360e 2, University of DC... 1,811e 1,784 i 1,756 1,756e 1,898 1,829 1,629 2, American University... 3,052 2,807 2,864 2,672 3,163 2,735 1,886 1, College of Charleston i 999 i 1,240 i 1,481 i 1,724 1,553 1,607 1, South Carolina State U... 2,739 2,325 i 1,910 1,948 1,968 1,978 1,988 1,988e 327 Fordham University... 1,304 1,327 1,421 1, ,725 2,101 1, Duquesne University ,531 1,902 1, Claflin College ,074 1, e 1, U of the Virgin Islands... 1,653 2,040 i 2,428 2,428e 2,428e 1,957 1,957e 1,957 i Total, 1st 330 institutions... 12,532,324 13,203,300 13,707,384 14,174,422 15,002,428 15,924,705 17,364,265 19,048, Texas Southern U... 2,353 3,474 3,474 3,707 2,504 2,292 1,844 1, Louisiana Tech University i 1,395 i 1,840 i 2,287 2,287e 631 1, New Mexico Highlands U... 1,459 1,902 i 2,345 2,446 i 2,547 i 2,648 3,747 1, Morehouse College e 591e 1,843 1,843e 1,843 i 335 Texas A&M Univ Kingsville... 1,190 i 1,361 i 1,532 i 1,703 i 1,874 1,771 2,179 1, Sam Houston State U... 1,694 3,094 i 4,495 4,974 2,527 3,225 2,128 1, Gallaudet University... 2,779 i 2,614 i 2,449 i 2,284 i 2,119 2,264 1,682 1, Nova Southeastern U ,003 1,500 2,637 2,060 1, Eastern Michigan U i 570 i 651 i 732 i 813 i 895 1,213 1, Air Force Inst of Tech... 2,426 2,229 2,291 4,212 2,228 1,540 5,371 1,671 Total, 1st 340 institutions... 12,546,834 13,220,998 13,727,468 14,197,914 15,021,418 15,946,107 17,386,963 19,066, E Washington Univ i 804 i 804 i 804 i 804e 1,244 1,366 1, Ithaca College i 504 i 693 i 882 i 1,075 1,607 2,131 1, Illinois State University... 2,347 2,632 2,110 2,420 2,468e 2,057 2,108 1, Alliant University ,578e 345 University of New Haven i i 104 i 19 19e 1, CUNY Grad Ctr... 2,341 2,709 i 3,077 i 3,445 3, , Rose-Hulman Inst of Tech i 336 i 438 i 540 i 642 i , Chicago State University... 1, ,254 1,248 1, Central Washington U i 692 i 813 i 934 i 1,055 i 1,179 1,426 1, Mississippi Valley St U ,316 Total, 1st 350 institutions... 12,555,136 13,230,066 13,737,000 14,208,428 15,032,185 15,955,225 17,397,047 19,081,
138 Table B-33. Federally financed R&D expenditures at universities and colleges, ranked by fiscal year 2001 federally financed R&D expenditures: fiscal years Page 8 of 13 Institution and ranking W Washington Univ... 1,293 i 1,456 i 1,619 i 1,782 i 1,954 2,004 1,548 1, U of TX Pan American... 1,011 i 1,066 i 1,121 i 1,176 i 1,233 1,068 1,135 1, CA St U Fullerton... 1,028 i 1,028 i 1,028 i 1,028 i 1,028e 1,028 i 1,148 i 1,286 i 354 CA St U Monterey Bay , Middlebury College i 601 i 622 i 643 i 664 i 688 1,371 1, Barnard College... 1, e 1,038 1,008 1,198 1, Le Moyne-Owen Coll ,404 1,031 1,700 1, Alabama State University... 1, ,133 1,190 1,190e 1,249e 359 Elizabeth City State U i 753 1, ,040 1,558 1, Maharishi U of Mgmt ,213 1,213 Total, 1st 360 institutions... 12,562,122 13,237,137 13,743,791 14,215,675 15,041,214 15,964,282 17,409,108 19,093, U of Central Arkansas , Texas Woman s University ,006 1,304 1,485 1,306 1,440 1, New England Col of Opt ,020 1, , Ball State University ,459 1, , Alfred University , ,348 1,491 1,227 1, Harvey Mudd College i 578 i 691 i 804 i 917 i 1,032 1,032e 1,156 i 367 DePaul University , St Joseph s Univ i 265 i 330 i 395 i , CUNY Col Staten Island , Tennessee Tech U... 1,208 1,182 1,250 1,205 1,065 1,222 1,452 1,124 Total, 1st 370 institutions... 12,567,904 13,243,227 13,750,963 14,223,357 15,050,031 15,972,637 17,419,035 19,105, Bucknell University i 419 i 483 i 547 i 611 i , St Cloud State Univ i 511 i 669 i 827 i e 987e 1,106 i 373 New School University i 748 i , , SUNY Col Old Westbury ,067 1,067e 375 Claremont Graduate U , Benedict College i 552 i 552 i 745 i 938 i 1,143 1, Mount Holyoke College i 630 i 663 i 696 i ,135 1, Hampshire College i 964 i 1,155 1, U of Northern Colorado e SUNY Col of Optometry Total, 1st 380 institutions... 12,572,476 13,248,028 13,756,605 14,229,920 15,057,029 15,980,097 17,428,344 19,115, Haverford College , CA St U Chico ,090 1, Stephen F Austin St U ,684 2,285 1, St John s University (NY) ,227 1, , e 385 Bethune Cookman College CUNY York College ,271 1,480 1,372 1, Long Island University ,197 1,116 1, James Madison University i 565 i 617 i 669 i U of WI-La Crosse , Bryn Mawr College... 1,294 1,411 1, Total, 1st 390 institutions... 12,577,903 13,254,281 13,763,912 14,239,951 15,066,824 15,989,121 17,436,891 19,124, North Carolina Central U i 795 i 786 i 777e 761 i 853 i 392 Amherst College... 1,004 i 969 i 934 i 899 i Georgia Southern U i 796 i 805 i 814 i 823 i Bates College Seton Hall University... 3,072 1,214e 1,228 i 1,243e 1,243 1, U of WI-Stout University of Richmond Occidental College... 1,513 i 1,513 i 1,513 i 1,513 i 1,513e Smith College i 695 i Albany Col of Pharmacy Total, 1st 400 institutions... 12,586,969 13,261,561 13,771,623 14,247,613 15,074,862 15,995,280 17,444,941 19,133,
139 Table B-33. Federally financed R&D expenditures at universities and colleges, ranked by fiscal year 2001 federally financed R&D expenditures: fiscal years Page 9 of 13 Institution and ranking Dickinson College , Murray State University Trinity University i 804 i 777 i 750 i 723 i e 404 Albany State University i 675e 675e 1,019 1,019e Coastal Carolina U , CUNY John Jay Col Cr Just Kirksville Col Osteo Med U of North Florida CUNY Medger Evers Col Macalester College i 271 i 344 i 417 i 490 i 563 i 636 i 713 Total, 1st 410 institutions... 12,589,624 13,264,451 13,774,842 14,250,823 15,080,057 15,999,857 17,450,812 19,140, SUNY Col at Plattsburgh Colgate U U of Southern Colorado... 1,131 1, West Chester U of PA , e 415 PA College of Optometry i 415 i 383 i 351 i 319 i Towson University , Carleton College i 356 i 366 i 376 i 386 i Hope College i 638 i 697 i 756 i 815 i Swarthmore College e 586e Pomona College i 425 i 410 i 395 i Total, 1st 420 institutions... 12,594,869 13,269,907 13,779,477 14,254,838 15,084,609 16,005,306 17,457,403 19,147, CA St U San Bernardino i 168 i 198 i 228 i Loyola College... 1,564 1, ,191 1,397 1, U of Houston Downtown i 880 i 870 i 860 i 850 i e 424 Southern U New Orleans e State U of West Georgia i 285 i 408 i 531 i 654 i 777 i Santa Clara University e 439 i 450 i 479 i 506 i 533 i 574 i 625 i 427 Lincoln University (PA) i 1, , Franklin & Marshall Coll i 610 i 647 i 684 i Sonoma State University Union College (NY) Total, 1st 430 institutions... 12,599,314 13,275,004 13,784,776 14,259,745 15,090,426 16,011,492 17,463,889 19,153, CA St U Fresno i 1,016 i 1,199 i 1,382 i 1,565 i 1,749e 1, Bennett College i 93e e 583 i 583 i 433 SUNY Col at Oswego i University of Hartford Midwestern University Virginia Union University e 537 i 537 i 437 Baylor University e Calvin College i 276 i 283 i 290 i 297 i Pittsburg State U Augsburg College i 554 i 492 i 430 i 368 i Total, 1st 440 institutions... 12,602,756 13,278,816 13,788,511 14,263,866 15,095,622 16,016,806 17,469,722 19,159, Radford University University of the Pacific , Evergreen State Coll i 358 i 393 i 428 i 463 i 498 i Furman University US Coast Guard Academy i 306 i 304 i 302 i Montclair State U i 87 i 98 i 109 i 120 i 131 i CA St U Bakersfield i 225 i 192 i 159 i 126 i 92e e 448 Indiana U of PA All Cmp e Oakwood College e 447 i 450 College of the Holy Cross , Total, 1st 450 institutions... 12,604,608 13,282,204 13,792,969 14,268,624 15,098,735 16,019,946 17,473,916 19,164,
140 Table B-33. Federally financed R&D expenditures at universities and colleges, ranked by fiscal year 2001 federally financed R&D expenditures: fiscal years Page 10 of 13 Institution and ranking Southwest Missouri St U i 425 i 482 i 539 i e Youngstown State Univ i 256 i 339 i 422 i Milwaukee School of Eng i 90 i 130 i 170 i Allegheny College i 256 i 255 i 254 i 253 i Tougaloo College i 867 i St Olaf College i 259 i 299 i 339 i 379 i Hofstra University... 1,786 2, University San Francisco i 390 i 343 i 296 i 249 i 200e e 459 Phila Col Osteopathic Med Grand Valley State U Total, 1st 460 institutions... 12,608,957 13,287,142 13,795,997 14,272,029 15,102,056 16,023,553 17,477,797 19,168, U of NC Asheville i 262 i 250 i 238 i 226 i Hamilton College i 359 i 359 i 359 i 359e 414 i U of Health Sci, The (MO) e U of Northern Iowa , Western Carolina U Lafayette College i 287 i 289 i 291 i U of WI-Parkside SUNY Col at Geneseo SUNY Col at Brockport e e 470 Southeastern Louisiana U i 233 i 311 i 389 i 467 i Total, 1st 470 institutions... 12,611,357 13,290,167 13,798,844 14,274,888 15,105,178 16,026,632 17,481,130 19,171, SUNY Col at Buffalo... 1,095 1,029 1,786 1,207 1,054 1, Spalding University U of WI-Green Bay Trinity College i 370 i 409 i 448 i 487 i e 475 Whitman College i 132 i 108 i 84 i Arkansas State University i 79 i 102 i 125 i Vassar College i 517 i 517 i 517 i 517e 419 i e 478 S Illinois U Edwardsville i 289 i 275 i 261 i Valparaiso University i 231 i Fayetteville State U i 503 i Total, 1st 480 institutions... 12,614,693 13,293,548 13,802,990 14,278,107 15,108,741 16,030,304 17,484,594 19,175, Kennesaw State Univ Middle Tennessee State U Pace University All Cmp... 0e Manhattan College i 614 i 519 i 424 i e 485 Central Michigan U i i e University of Portland McNeese State University e U of WI-Eau Claire Bradley University i 295 i 407 i 519 i Oberlin College i 399 i 456 i 513 i 570 i 627 i Total, 1st 490 institutions... 12,616,980 13,295,739 13,805,307 14,280,395 15,111,790 16,033,311 17,487,795 19,177, Central State University... 1,180 1,171 i 1,162 i 1,153 i 1,144 1,144e 283e 283 i 492 Appalachian State U Reed College i 357 i 343 i 329 i 315 i 300e SUNY Col at Cortland U of WI-Oshkosh Kettering University i 148 i 162 i 176 i U of WI-Stevens Point Indiana State University Pitzer College i U of WI-Whitewater Total, 1st 500 institutions... 12,620,877 13,299,811 13,809,218 14,284,148 15,115,222 16,036,377 17,490,314 19,180,
141 Table B-33. Federally financed R&D expenditures at universities and colleges, ranked by fiscal year 2001 federally financed R&D expenditures: fiscal years Page 11 of 13 Institution and ranking College of Wooster i U of Central Oklahoma i 66 i 66 i 66 i La Salle University i Wilberforce University e 236 i 236 i 236 i 505 Eastern Kentucky U... 1,549 i 2,719 i 3,889 i 5,059 i 6,229 i 7, St Mary s Col of MD John Carroll University i 578 i 701 i 824 i 947 i 1,072 1,072e Fort Lewis College Lake Forest College... 5 i 10 i 15 i 20 i U of Detroit Mercy... 1,339 1, Total, 1st 510 institutions... 12,625,435 13,305,455 13,815,840 14,291,898 15,123,750 16,046,297 17,493,130 19,182, Southern Connecticut St U i 212 i 184 i 156 i 128 i e 512 Lewis and Clark College i 197 i 234 i 271 i U of Sci in Philadelphia e Dillard University e Johnson C Smith U... 1,803 1,083 1,083 1,546 4,299 8, Truman State University... 58e 91 i e 174 i 195 i 517 Lawrence Tech Univ i 47 i 48 i 49 i St Mary s University i 160 i 108 i 56 i Rider University Ohio Wesleyan University e 185 i Total, 1st 520 institutions... 12,628,574 13,307,940 13,818,722 14,294,972 15,129,125 16,056,174 17,495,158 19,184, University of San Diego Grinnell College i 117 i 117 i 117 i 117e New York Inst Technology Minnesota State, Mankato i 261 i 298 i 335 i Des Moines U Ost Med Ctr Drake University i 183 i 179 i 175 i 171 i Abilene Christian Univ i 196 i 186 i 176 i Fairfield University i 133 i 147 i 161 i 175 i 189 i Pacific University Southern Oregon Univ i 161 i 200 i Total, 1st 530 institutions... 12,630,552 13,309,606 13,820,046 14,296,362 15,130,726 16,057,906 17,497,616 19,186, Knox College i 370 i 347 i 324 i 301 i 278 i East Stroudsburg U of PA i 226 i 289 i 352 i 415 i Colby College i 86 i 88 i 90 i U of Nebraska at Kearney... 7 i 14 i 21 i 28 i 35 i 42 i Andrews University e Bowdoin College Central Connecticut St U i 86 i 95 i 104 i 113 i 122 i U of Southern Maine i 330 i 299 i 268 i e 138 i 539 Colorado College i 91 i 96 i 101 i Arkansas Tech Univ i 47 i 49 i 51 i Total, 1st 540 institutions... 12,632,202 13,311,249 13,821,970 14,297,923 15,132,410 16,059,527 17,499,085 19,188, MA Col Phar Allied Hlth e 64i U of IL Springfield Denison University i 166 i 179 i 192 i 205 i SUNY Col at Fredonia Morris Brown College ,796 2, e 321 i e 546 Southeast Missouri St U i 129 i 146 i 163 i 180 i 200e Juniata College i 59 i 77 i 95 i 113 i e 548 Salem International Univ Adelphi University... 98e Shaw University e 100 i Total, 1st 550 institutions... 12,633,644 13,315,823 13,825,274 14,299,449 15,133,987 16,060,933 17,500,495 19,189,
142 Table B-33. Federally financed R&D expenditures at universities and colleges, ranked by fiscal year 2001 federally financed R&D expenditures: fiscal years Page 12 of 13 Institution and ranking Fairleigh Dickinson U... 53e 53e 35 i Point Loma Nazarene Col i 53 i 58 i 63 i 68 i 73 i Sul Ross State University Monmouth University e Pont Catholic U of PR, The e University of St Thomas i 134 i 141 i 148 i i CUNY Baruch Col i e 558 Fuller Theological Sem i e 80 80e 87 i 559 Texas A&M Commerce U of WI-River Falls Total, 1st 560 institutions... 12,634,945 13,317,046 13,826,455 14,300,686 15,134,997 16,061,789 17,501,495 19,190, U of WI-Superior... 1,411 1, Chapman U i 20 i 30 i 40 i 50 i 60 i Regis University i 79 i 72 i 65 i e 564 Willamette University Skidmore College i 28 i 42 i 56 i Bridgewater State College i 359 i 299 i 239 i 179 i Ferris State University e Wentworth Inst of Tech... 1,434 1,155 1, Jarvis Christian College e 570 Northeastern Illinois U Total, 1st 570 institutions... 12,638,538 13,320,196 13,828,704 14,302,039 15,136,696 16,062,986 17,502,632 19,190, Widener U All Campuses e 572 Providence College e 32 i 573 Simmons College i 272 i 233 i 194 i 155 i Cooper Union i 50 i 50 i 50 i 50e University of Dallas Virginia Military Inst W State Coll Colorado i 47 i 45 i 43 i Alliant International U Antioch University Azusa Pacific U e 0 Total, 1st 580 institutions... 12,639,302 13,320,885 13,829,345 14,302,557 15,137,463 16,063,500 17,502,944 19,190, Biola University Bluefield State College CA Inst of Integral Stu Connecticut College i 96 i 65 i 34 i 0e 0 i 0 i 0 i 585 Coppin State College Forest Inst of Prof Psy Golden Gate University Institute of Textile Tech Nicolls State U Pepperdine University Total, 1st 590 institutions... 12,639,647 13,321,189 13,829,526 14,302,606 15,137,469 16,063,511 17,502,958 19,190, Philander Smith College e 72 72e Rust College Selma University i e e 594 Talladega College i U of Findlay U of Missouri Sys Admn Union Institute, The i e 598 WV Sch of Osteo Med West Virginia State Col e 0e 600 Western U of Hlth Sci e 127 i 0 Total, 1st 600 institutions... 12,641,176 13,322,268 13,829,974 14,303,125 15,138,322 16,064,066 17,503,570 19,190,
143 Table B-33. Federally financed R&D expenditures at universities and colleges, ranked by fiscal year 2001 federally financed R&D expenditures: fiscal years Page 13 of 13 Institution and ranking Wiley College Total, 1st 601 institutions... 12,641,176 13,322,268 13,829,974 14,303,125 15,138,322 16,064,066 17,503,570 19,190,873 Total, all other sampled institutions... 4,952 5,768 5,906 6,215 6,507 6,595 4, Johns Hopkins University includes the Applied Physics Laboratory, with $463 million in federally financed R&D expenditures. 2 These data do not include R&D expenditures at university-associated federally funded research and development centers. See tables B-73 and B-74. KEY: -- = not available e = estimated i = imputed NOTE: Because of rounding, detail may not add to totals. SOURCE: National Science Foundation/Division of Science Resources Statistics, Survey of Research and Development Expenditures at Universities and Colleges, Fiscal Year
144 Table B-34. Non-Federal R&D expenditures at universities and colleges, ranked by fiscal year 2001 non-federal R&D expenditures: fiscal years Page 1 of 5 Institution and ranking Total, all institutions... 8,376,676 8,837,316 9,203,995 10,053,900 10,702,730 11,434,272 12,533,663 13,532,205 1 U CA Los Angeles... 89, , , , , , , ,943 2 U of WI-Madison , , , , , , , ,134 3 U CA Davis , , , , , , , ,459 4 Texas A&M University , , , , , , , ,659 5 U CA San Francisco... 99, ,471 98, , , , , ,486 6 U CA Berkeley , , , , , , , ,193 7 Ohio State University , , , , , , , ,560 8 University of Florida... 68, , , , , , , ,568 9 U CA San Diego... 65,735 72,888 79, , , , , , Pennsylvania State U , , , , , , , ,115 Total, 1st 10 institutions... 1,215,808 1,321,946 1,425,476 1,745,242 1,926,872 2,076,731 2,323,906 2,576, University of Georgia , , , , , , , , University of Michigan , , , , , , , , NC State University , , , , , , , , Cornell University , , , , , , , , University of Minnesota , , , , , , , , U of IL Urbana-Champaign , , , , , , , , Louisiana State U System , , , , , , , , University of Arizona , , , , , , , , Georgia Institute of Tech... 96, , , , , , , , Rutgers the State U NJ , , , , , , , ,637 Total, 1st 20 institutions... 2,420,361 2,610,025 2,769,290 3,217,917 3,478,040 3,714,845 4,093,381 4,450, Duke University... 71,870 70,177 92,604 95, , , , , Purdue University... 90, , , , , , , , U of Washington... 72,912 97,876 93,777 89,175 95, , , , Michigan State University... 89, , , , , , , , Baylor Col of Medicine... 94,461 96,178 92,319 94, , , , , Indiana University... 54,960 59,471 63,379 69,267 75,914 92, , , U of MD Baltimore... 51,139 48,278 56,996 62,708 65,284 56, , , VA Polytech Inst & St U... 74,823 69,427 63,496 82,151 84,384 93, , , MA Institute of Tech ,050 97, ,068 99, , , , , University of Kentucky... 56,738 61,920 67,271 62, , , , ,482 Total, 1st 30 institutions... 3,181,329 3,425,282 3,628,865 4,095,805 4,454,339 4,832,790 5,433,326 5,898, U of MD at College Park , , , ,999 93, , , , Washington University... 54,079 62,179 63,443 75,433 82,377 97, , , Johns Hopkins U... 72,351 82,638 88, , , , , , U TX MD Anderson Cncr Ctr.. 79,941 77,470 78,170 79,876 78,186 85, , , U of Pennsylvania... 65,052 71,498 72,263 79,016 85, , , , Iowa State University... 99,543 96,166 97, , , , , , U of Nebraska at Lincoln... 67,275 70,824 70,108 75,831 76,969e 94,069 98, , U of South Florida... 66,276 63,200 64,406 68,581 68,395 81,956 94, , U of IL Chicago... 56,667 61,853 62,549 68,557 77,942 88,687 93, , U of Missouri Columbia... 89,957 90,450 80,141 84,843 90,613 95,127 93, ,347 Total, 1st 40 institutions... 3,944,767 4,217,434 4,422,573 4,948,151 5,314,583 5,803,513 6,479,338 7,055, U of Iowa... 57,500 61,778 72,582 75,880 83,751 84,497 96, , U TX at Austin ,016 84,737 93,798 87,067 79,761 93,209 93,922 99, Northwestern University... 86,265 83,344 86,452 92,651 95, ,162 95,536 99, Stanford University... 50,002 45,714 56,153 63,038 67,883 72,602 90,739 98, Wayne State University... 51,278 59,894 65,887 70,676 80,810 89,222 92,494 96, U of Southern California... 57,540 58,553 64,977 67,437 78,259 81,122 89,573 94, University of Connecticut... 88,454 89,860 94,513 91,337 81,259 79,490 94,940 94, U TX SW Med Ctr at Dallas... 46,930 46,409 48,694 51,232 56,511 63,524 80,051 90, SUNY at Buffalo... 59,278 68,055 49,888 57,571 75,613 81,333 91,282 90, Rockefeller U, The... 34,468 60,355 68,226 66,020 71,649 76,509 78,927 90,209 Total, 1st 50 institutions... 4,587,498 4,876,133 5,123,743 5,671,060 6,085,403 6,626,183 7,382,982 8,010,
145 Table B-34. Non-Federal R&D expenditures at universities and colleges, ranked by fiscal year 2001 non-federal R&D expenditures: fiscal years Page 2 of 5 Institution and ranking University of Oklahoma... 60,481 65,225 66,392 68,631 72,410 84,496 90,360 88, U of Tennessee System... 71,052 75,022 75,607 80,181 80,901 88,743 91,631 83, University of Kansas... 54,885 58,493 58,791 62,160 66,548 75,480 79,720 81, U of NC Chapel Hill... 52,575 52,492 51,495 67,395 63,791 69,832 74,278 81, Mississippi State U... 42,283 38,987 49,487 49,229 58,406 64,368 78,695 81, University of Pittsburgh... 36,388 41,970 39,866 41,700 45,331 54,859 66,654 80, U CA Irvine... 37,533 40,253 46,653 55,376 63,813 66,337 70,163 78, U Med & Dent of NJ... 46,179 50,631 51,030 52,912 54,663 64,547 65,633 76, Clemson University... 52,439 54,149 56,727 55,942 61,951 72,277 83,599 75, SUNY at Stony Brook... 40,578 46,106 46,807 50,056 50,235 55,045 66,666 75,222 Total, 1st 60 institutions... 5,081,891 5,399,461 5,666,598 6,254,642 6,703,452 7,322,167 8,150,381 8,812, Harvard University... 88,276e 72,457 79,396 77,349 54,224 60,174 60,111 71, Yale University... 53,514 56,951 57,907 56,412 57,634 60,646 64,687 70, Princeton University... 40,743 40,254 42,994 44,882 46,991 51,263 60,194 70, University of Utah... 22,508 22,088 20,635 36,589 42,234 42,127 63,317 70, Oregon State University... 54,703 54,715 51,357 51,336 55,824 57,636 60,353 69, U CA Riverside... 37,252 37,412 43,768 51,480 56,776 55,827 62,495 68, Mt Sinai Sch Med... 30,991 33,017 30,806 33,862 39,453 43,141 51,658 67, University of Rochester... 31,622 32,642 31,981 36,834 43,844 44,274 46,742 67, Emory University... 47,451 55,454 53,931 55,097 54,839 56,354 61,156 66, Auburn University... 57,022 58,022 55,957 58,048 60,062 53,486 61,097 66,250 Total, 1st 70 institutions... 5,545,973 5,862,473 6,135,330 6,756,531 7,215,333 7,847,095 8,742,191 9,501, University of Cincinnati... 37,238 36,052 55,190 63,312 69,388 52,677 61,610 64, Oklahoma State University... 50,368 56,955 57,926 41,025 48,246 59,929 63,515 64, Arizona State University... 31,864 41,794 45,706 43,040 50,660 53,279 58,182 62, New York University... 50,189 55,176 55,864 59,171 55,026 56,055 65,042 60, Kansas State University... 44,149 45,837 46,453 51,115 54,232 57,478 60,605 60, Colorado State University... 45,993 46,956 51,771 49,187 59,728 58,338 50,850 59, Washington State U... 49,128 47,767 49,834 52,670 50,912 52,333 56,355 59, Univ of Hawaii at Manoa... 30,687 34,191 44,300 47,686 61,121 63,392 65,881 59, U of South Carolina... 36,083 35,418 27,350 40,850 50,199 57,345 52,526 57, U of Central Florida... 17,050 17,070 2,774 25,231 22,028 26,418 33,845 56,945 Total, 1st 80 institutions... 5,938,722 6,279,689 6,572,498 7,229,818 7,736,873 8,384,339 9,310,602 10,107, University of Colorado... 76,104 74,266 73,784 77,615 82,861 73,932 53,241 56, Florida State University... 36,813 40,113 38,598 42,963 44,012 42,007 48,265 56, Med U of South Carolina... 17,742 21,078 13,789 19,321 21,467 24,822 23,811 56, U of Arkansas Main... 41,775 42,179 43,734 49,096 55,530 45,734 50,039 55, U of Alaska Fairbanks... 35,323 34,931 41,030 42,816 44,101 54,178 55,895 54, North Dakota State U... 26,100 28,993 31,978 28,765 30,220 32,388 34,600 49, U of MA Amherst... 32,614 33,956 35,709 44,886 46,774 46,699 52,195 48, University of Louisville... 11,201 13,053 16,349 19,913 24,080 41,515 46,349 47, Carnegie Mellon U... 34,790 40,901 44,684 43,427 42,404 51,766 46,789 47, University of New Mexico... 38,535 38,457 39,768 39,174 41,545 30,874 33,538 47,114 Total, 1st 90 institutions... 6,289,719 6,647,616 6,951,921 7,637,794 8,169,867 8,828,254 9,755,324 10,627, Utah State University... 32,957 34,037 37,945 41,698 39,325 40,931 45,783 47, Texas Tech University... 28,095 29,374 29,987 31,744 35,645 38,246 44,783 46, Tulane University... 41,531 39,394 33,940 36,719 34,934 36,545 37,705 44, U TX Hlth Sci Ctr San Ant... 31,864 32,903 31,825 32,541 30,403 30,900 38,573 44, U of New Hampshire... 18,675 21,476 22,388 21,758 26,446 27,027 33,187 42, University of Miami... 29,912 31,625 33,340 34,372 35,480 37,725 39,162 41, West Virginia University... 23,982 22,814 24,044 33,869 37,377 37,128 38,117 41, Virginia Commonwealth U... 28,674 29,835 33,564 33,966 32,371 31,610 36,083 41, University of Idaho... 32,752 34,290 39,717 40,166 i 40,615 38,268 38,333 40, Yeshiva University... 22,163 22,607e 18,034 18,883 19,000 22,091 37,987 40,430 Total, 1st 100 institutions... 6,580,324 6,945,971 7,256,705 7,963,510 8,501,463 9,168,725 10,145,037 11,059,
146 Table B-34. Non-Federal R&D expenditures at universities and colleges, ranked by fiscal year 2001 non-federal R&D expenditures: fiscal years Page 3 of 5 Institution and ranking Vanderbilt University... 17,666 19,039 21,319 23,854 28,889 32,788 41,940 40, U of Maine... 18,007 16,112 18,473 18,078 20,078 22,289 30,409 40, U CA Santa Barbara... 14,283 15,294 17,884 26,234 27,354 30,535 37,400 39, Case Western Reserve U... 35,970 33,897 33,534 40,833 44,056 42,154 42,471 39, Dartmouth College... 16,083 11,466 13,263 18,465 19,911 22,781 22,505 39, University of Chicago... 19,372 21,674 21,570 28,848 25,653 27,085 29,806 38, U of Nebraska Med Ctr... 21,741 24,912 28,583 31,375 34,790 37,038 31,669 38, U TX Med Br at Galveston... 39,998 39,365 35,436 35,677 37,900 38,519 36,539 38, U of Alabama Birmingham... 43,016 51,339 44,389 53,257 60,890 66,892 58,152 37, UT Houston Hlth Sci Ctr... 19,611 19,902 21,347 28,433 31,547 34,019 39,922 36,894 Total, 1st 110 institutions... 6,826,071 7,198,971 7,512,503 8,268,564 8,832,531 9,522,825 10,515,850 11,447, Columbia U in City of NY... 33,316 38,496 40,751 32,157 37,284 39,429 36,530 36, University of Delaware... 24,484 25,809 24,645 33,064 36,208 38,893 36,995 35, U CA Santa Cruz... 18,655 18,251 19,335 25,423 26,652 27,818 30,253 35, Montana St U Bozeman... 20,411 30,765 32,430 29,733 28,310 29,244 34,760 34, San Diego St University... 17,041 18,851 26,020 20,349 22,194 25,855 32,200 34, Tufts University... 24,077 26,612 25,848 28,147 30,963 38,036 41,106 34, Brown University... 18,282 18,837 25,482 27,747 29,565 31,054 31,533 33, Rush University... 24,905 26,198 26,292 25,587 26,833 29,838 35,616 32, S Illinois U Carbondale... 20,566 19,531 19,742 21,411 22,689 25,509 26,224 32, U of MA Worcester... 26,867 25,471 23,143 27,996 29,184 27,524 33,375 31,768 Total, 1st 120 institutions... 7,054,675 7,447,792 7,776,191 8,540,178 9,122,413 9,836,025 10,854,442 11,788, Medical Col of Georgia... 18,899 20,362 24,633 26,821 26,679 27,112 30,386 31, University of Houston... 20,301 22,360 23,730 24,221 20,279 22,927 27,537 29, U of Nevada Reno... 23,377 25,406 27,006 31,890 25,093 23,352 29,981 27, University of Vermont... 18,080 21,133 22,138 25,484 26,372 27,964 23,530 26, University of Virginia... 45,834 51,435 22,078 31,597 39,962 23,282 24,732 26, New Mexico State Univ... 20,654 24,245 22,941 23,859 20,783 23,002 22,622 25, NJ Inst of Technology... 17,411 15,831 18,549 17,441 19,855 19,855 30,514 25, Georgia State University... 10,329 11,590 12,296 19,525 19,869 22,213 24,510 25, Oregon Health & Science U... 20,246 25,297 28,995 29,682 27,228 i 24,774 i 22,321 25, U MD Ctr for Environ Sci... 14,365 15,148 15,450 15,137 16,598 18,700 20,800 24,530 Total, 1st 130 institutions... 7,264,171 7,680,599 7,994,007 8,785,835 9,365,131 10,069,206 11,111,375 12,056, Thomas Jefferson U... 13,717 16,370 17,679 20,137 17,732 22,041 22,178 24, SUNY Col Env Sci & Frstry... 18,488 18,718 i 18,948 17,850 19,321 21,511 22,331 23, SUNY at Albany... 19,746 14,303 17,852 16,225 16,674 18,036 20,733 23, Brandeis University... 13,250 13,710 13,527 14,912 16,491 18,882 21,214 22, TX A&M U Sys Hlth Sci Ctr ,415 22, George Washington U... 14,050 15,457 18,773 20,976 29,409 16,813 19,673 22, University of Wyoming... 23,349 25,097 25,562 32,750 30,694 28,088 26,538 21, California Inst of Tech... 15,444 17,293 14,531 13,663 7,318 16,913 25,789 21, U MD Biotechnology Inst... 8,760 11,025 15,404 20,398 20,072 17,261 18,789 21, Boston University... 17,953 20,236 22,320 22,870 25,626 17,712 20,299 21,260 Total, 1st 140 institutions... 7,408,928 7,832,808 8,158,603 8,965,616 9,548,468 10,246,463 11,320,334 12,280, Col of William & Mary... 10,017 8,866 12,163 13,140 14,869 19,430 20,268 20, Florida International U... 2,584 3,345 3,441 3,531 3,637 9,304 14,353 20, Wake Forest University... 15,859 17,669 19,486 21,003 20,188 22,534 21,255 20, U of LA Lafayette... 9,101 11,109 10,493 17,682 18,934 21,305 20,528 19, Medical Col of Wisconsin... 18,145 13,071 12,838 12,265 12,190 14,359 15,547 19, Rensselaer Polytech Inst... 15,101 12,997 13,169 16,018 16,786 16,231 15,207 19, Temple University... 29,168 26,439 27,813 28,126 34,231 24,206 14,253 18, Univ of Memphis, The... 9,278 10,077 13,475 15,858 16,637 17,916 16,204 18, U of Arkansas Medical Sci... 9,352 12,272 16,558 18,087 17,630 17,674 19,112 17, Rose-Hulman Inst of Tech i 423 i 413 i 403 i 393 i 384 4,574 17,083 Total, 1st 150 institutions... 7,527,966 7,949,076 8,288,452 9,111,729 9,703,963 10,409,806 11,481,635 12,472,
147 Table B-34. Non-Federal R&D expenditures at universities and colleges, ranked by fiscal year 2001 non-federal R&D expenditures: fiscal years Page 4 of 5 Institution and ranking U of Missouri Rolla... 13,234 15,386 12,693 12,815 13,806 17,162 16,164 16, Wright State University... 9,764 9,042 7,879 7,290 8,844 10,766 16,549 16, University of Notre Dame... 6,475 5,908 5,670 4,943 5,820 6,869 7,162 16, Woods Hole Oceanogr Inst... 7,126 7,476 11,195 11,021 10,246 12,188 14,511 15, NM Inst Mining & Tech... 13,363 11,137 13,375 11,478 13,832 15,342 14,984 15, Lehigh University... 13,825 13,707 12,371 11,569 13,096 14,741 12,780 15, Eastern VA Med School... 7,711 7,999 7,527 8,491 12,223 12,742 11,185 14, Univ of Montana, The... 8,233 8,732 9,830 9,597 8,385 9,745 11,212 14, Ohio University... 10,589 12,126 10,283 11,218 11,146 10,893 12,072 14, University of Akron... 12,767 11,358 10,714 12,853 12,284 9,139 12,414 13,594 Total, 1st 160 institutions... 7,631,053 8,051,947 8,389,989 9,213,004 9,813,645 10,529,393 11,610,668 12,625, Unif Svcs U of Hlth Sci... 9,210 13,754 12,230 9,594 12,762 13,202 12,964 13, U of Alabama Huntsville... 9,899 11,319 12,035 11,086 13,174 15,037 15,335 13, SUNY at Binghamton... 10,703 11,447 12,839 13,092 14,549 12,237 12,342 12, Syracuse University... 19,341 14,598 15,961 10,862 8,122 9,590 10,443 12, U of WI-Milwaukee... 11,203 11,935 11,653 11,839 11,871 12,135 11,585 12, Michigan Tech University... 10,802 9,991 11,279 11,199 12,584 11,967 10,554 11, Colorado School of Mines... 5,719 7,738 i 9,757 9,891 11,987 11,011 9,800 11, U of Nevada Las Vegas... 5,943 6,804 5,751 6,407 7,199 9,922 10,400 11, South Dakota State U... 8,372 7,826 9,425 10,021 9,819 9,513 9,336 11, Florida Atlantic U... 4,439 4,133 4,076 2,868 4,683 6,115 7,176 11,012 Total, 1st 170 institutions... 7,726,684 8,151,492 8,494,995 9,309,863 9,920,395 10,640,122 11,720,603 12,745, Inst of Paper Sci & Tech... 7,366 7,299 9,489 i 11,678e 11,678e 7,135e 7,135e 10, University of Alabama, The... 10,478 11,243 9,568 10,553 9,026 11,308 12,361 10, Northeastern University... 3,067 2,737 3,274 3,501 4,931 7,433 8,424 10, Loyola U of Chicago... 13,243 12,889 i 12,534 16,223 16,556 11,413 9,339 10, Boston College... 2,786 3,308 3,367 3,539 4,996 7,234 11,094 10, U of Missouri Kansas City... 6,662 7,221 7,510 6,354 6,676 7,125 12,157 10, Wichita State University... 5,731 7,140 7,708 9,195 10,471 11,295 10,985 10, Creighton University... 4,992 6,562 6,595 7,998 10,915 11,086 10,300 10, U PR Mayaguez Campus... 13,598 22,345 24,934 27,805 29,278 31,864 22,846 9, University of Toledo... 4,538 4,249 4,674e 5,792 6,146 6,137 7,382 9,577 Total, 1st 180 institutions... 7,799,145 8,236,485 8,584,648 9,412,501 10,031,068 10,752,152 11,832,626 12,850, MCP Hahnemann U... 18,894 17,332 21,067 37,686 34,882 10,235 14,291 9, Miami University (OH)... 3,942 4,823 6,214 6,768 4,051 7,662 8,000 9, U of MA Lowell... 7,874 7,408 8,258 7,135 7,113 9,059 9,429 9, U Mississippi, All Camp... 9,164 9,396 10,644 10,535 11,616 7,346 16,820 9, Old Dominion University... 7,023 6,471 8,311 7,847 7,804 9,324 10,150 9, C R Drew U of Med & Sci... 1,673 2,000 1,098 1,153e 1,153e 2,272 9,076 9, U of MA Boston... 8,580 6,692 8,192 8,119 8,331 8,181 8,680 9, CUNY Hunter College... 5,108 6,269 8,938 7,142 7,083 8,408 6,397 9, Cleveland State U... 5,950 7,039 7,168 i 7,296e 7,515e 8,238e 6,896 9, Western Michigan U... 6,446 6,280 6,270 6,417 7,509 9,562 9,646 8,784 Total, 1st 190 institutions... 7,873,799 8,310,195 8,670,808 9,512,599 10,128,125 10,832,439 11,932,011 12,943,
148 Table B-34. Non-Federal R&D expenditures at universities and colleges, ranked by fiscal year 2001 non-federal R&D expenditures: fiscal years Page 5 of 5 Institution and ranking SUNY Hlth Sci Ctr Brklyn... 11,078 12,407 11,569 i 10,731 9,199 7,787 8,766 8,766e 192 U TX at Dallas... 7,268 7,623 i 7,979 7,842 7,096 8,328 8,635 8,635e 193 San Jose State University... 9,180 i 9,180 i 9,180 i 9,180 i 9,180e 9,180e 9,180e 8, Tennessee Tech U... 8,149 9,002 7,938 7,848 8,596 7,982 7,426 8, U TX at Arlington... 12,816 12,443 9,206 10,680 7,781 5,361 5,617 8, Desert Research Institute... 6,187 6,984 5,500 6,100 6,100 6,824 5,768 7, U of Rhode Island... 13,606 9,176 i 4,746 4,789 4,632 8,245 9,597 7, Drexel University... 9,880 9,945 7,709 8,722 8,674 9,483 10,584 7, Brigham Young University... 5,733 5,487 3,039e 2,279e 2,269 12,571 6,859 7, University of Dayton... 7,774 8,242 8,775 9,241 8,671 6,182 7,628 7,241 Total, 1st 200 institutions... 7,965,470 8,400,684 8,746,449 9,590,011 10,200,323 10,914,382 12,012,071 13,022,917 Total, all other sampled institutions , , , , , , , ,288 KEY: -- = not available e = estimated i = imputed NOTE: Because of rounding, detail may not add to totals. SOURCE: National Science Foundation/Division of Science Resources Statistics, Survey of Research and Development Expenditures at Universities and Colleges, Fiscal Year
149 Table B-35. R&D expenditures at universities and colleges, by source of funds: fiscal year 2001 Page 1 of 5 Federal State Institu- Institution and ranking Total Govt. & local Industry tional Other govts. funds Total, all institutions... 32,723,078 19,190,873 2,315,208 2,233,649 6,553,070 2,430,278 1 Johns Hopkins U , ,741 2,177 18,737 50,348 48,243 2 U CA Los Angeles , ,858 59,365 32, ,229 98,810 3 U of WI-Madison , ,009 35,317 17, ,924 59,656 4 University of Michigan , ,117 5,113 34, ,508 44,346 5 U of Washington , ,103 11,716 43,312 88,309 11,186 6 U CA San Diego , ,276 20,842 36, ,503 54,067 7 U CA San Francisco , ,489 21,902 35, ,652 79,173 8 Stanford University , ,468 5,433 35,012 30,920 27,073 9 U of Pennsylvania , ,996 1,952 28,227 43,655 44, University of Minnesota , ,289 58,053 26,454 79,757 33,458 Total, 1st 10 institutions... 5,983,616 3,949, , ,561 1,003, , Pennsylvania State U , ,951 23,504 67, ,417 8, U CA Berkeley , ,080 29,824 26, ,333 53, Cornell University , ,466 62,569 22,261 80,446 38, MA Institute of Tech , , ,256 6,058 27, U CA Davis , ,937 50,044 16, ,268 39, Texas A&M University , , ,480 35, ,210 5, Washington University , ,928 6,519 24,865 58,634 31, U of IL Urbana-Champaign , ,316 48,803 10, ,602 16, Ohio State University , ,092 54,867 54,736 86,275 33, Baylor Col of Medicine , ,394 3,731 18,389 56,413 68,534 Total, 1st 20 institutions... 10,176,333 6,128, , ,608 1,939, , Duke University , ,109 7, ,063 19,275 25, Harvard University , ,414 1,739 14, , University of Arizona , ,484 8,410 22, ,083 17, University of Colorado , ,643 2,668 9,002 29,802 15, University of Florida , ,744 74,057 36,417 99,204 9, Columbia U in City of NY , ,928 1,122 2,885 13,481 19, University of Pittsburgh , ,571 5,149 14,817 32,183 28, U of Southern California , ,207 15,542 22,949 55, Yale University , , ,119 18,487 37, Georgia Institute of Tech , ,836 10,771 59,691 92,235 0 Total, 1st 30 institutions... 13,687,418 8,521, , ,541 2,419,110 1,031, U of NC Chapel Hill , ,615 15,914 6,971 59, NC State University ,259 95,875 91,794 37,858 65,966 7, U TX at Austin , ,184 19,939 30,310 36,266 13, University of Georgia ,298 66,913 53,463 13, ,823 1, Louisiana State U System ,911 94,625 74,420 16,648 64,535 18, U of MD at College Park , ,515 21,519 7,315 80,378 12, Michigan State University , ,359 46,395 10,953 87,885 8, Indiana University , ,781 5,650 6, ,566 28, Northwestern University , ,129 3,778 14,294 59,852 21, U of Iowa , ,249 7,084 21,394 52,571 19,050 Total, 1st 40 institutions... 16,433,075 9,884,094 1,070,077 1,150,450 3,165,028 1,163, Purdue University ,917 98,151 36,485 29,765 90, U of MD Baltimore ,007 99,091 26,603 41,226 34,323 37, Emory University , ,317 4,001 7,950 19,857 34, Rutgers the State U NJ ,793 77,156 28,163 10,965 89,916 30, University of Rochester , ,945 9,839 23,782 20,092 13, U of IL Chicago , ,109 9,743 10,989 70,677 16, U of Alabama Birmingham , , ,443 14,077 14, U TX SW Med Ctr at Dallas , ,820 9,516 13,320 5,942 61, VA Polytech Inst & St U ,323 77,384 58,232 18,355 52,534 9, California Inst of Tech , ,554 1,050 10,225 10,256 0 Total, 1st 50 institutions... 18,753,634 11,218,246 1,253,877 1,325,470 3,573,105 1,382,
150 Table B-35. R&D expenditures at universities and colleges, by source of funds: fiscal year 2001 Page 2 of 5 Federal State Institu- Institution and ranking Total Govt. & local Industry tional Other govts. funds 51 U TX MD Anderson Cncr Ctr.. 212,746 94, ,717 58,853 33, University of Kentucky ,721 86,239 37,904 12,933 61,008 13, Case Western Reserve U , ,852 3,735 6,190 11,636 17, University of Utah , ,253 2,166 6,023 35,021 27, University of Chicago , ,566 4,451 1,746 14,088 18, University of Cincinnati , ,049 3,619 6,028 41,092 14, New York University , ,897 2,739 6,535 25,514 26, SUNY at Buffalo ,829 96,595 5,220 11,598 50,091 23, Vanderbilt University , , ,036 21,160 15, U CA Irvine , ,735 8,384 15,803 30,581 23,363 Total, 1st 60 institutions... 20,704,892 12,442,715 1,322,492 1,422,079 3,922,149 1,595, Iowa State University ,196 62,024 52,115 13,177 48,733 3, Mt Sinai Sch Med , ,344 2,698 18,133 17,134 29, Wayne State University ,984 79,448 12,463 10,860 55,384 17, U of Missouri Columbia ,782 68,435 16,154 4,654 78,842 6, Boston University , , , , U of South Florida ,550 58,826 8,819 11,152 76,057 16, SUNY at Stony Brook ,487 93,265 3,117 7,026 54,433 10, University of Connecticut ,366 70,013 13,971 9,819 54,541 16, U Med & Dent of NJ ,417 86,054 9,170 13,496 38,378 15, U of Tennessee System ,898 78,611 33,867 15,391 18,474 15,555 Total, 1st 70 institutions... 22,412,549 13,299,506 1,475,799 1,534,237 4,364,125 1,738, Colorado State University , ,308 16,102 8,850 25,637 9, U of Nebraska at Lincoln ,520 43,877 3,899 5, ,217 2, Univ of Hawaii at Manoa ,976 97,716 33,125 7,232 18, University of New Mexico , ,505 1,902 1,821 37,258 6, University of Kansas ,467 74,494 7,049 4,155 52,380 18, Oregon State University ,925 84,854 36, ,261 4, University of Miami , ,803 2,249 17,554 8,025 14, University of Virginia , , ,733 11,661 6, Princeton University ,411 78,620 3,102 8,246 41,983 17, University of Oklahoma ,695 60,264 14,306 10,396 52,294 11,435 Total, 1st 80 institutions... 23,956,625 14,184,815 1,594,479 1,606,430 4,740,744 1,830, Yeshiva University , , , Mississippi State U ,939 65,493 32,357 6,744 42, Rockefeller U, The ,571 55,362 6,079 2,844 52,493 28, Carnegie Mellon U ,882 97,463 3,401 23, , Oregon Health & Science U , ,671 2,879 11, , UT Houston Hlth Sci Ctr ,439 88,545 4,129 10,945 7,633 14, Clemson University ,885 48,560 21,190 11,582 42, Utah State University ,359 74,251 18,024 6,595 16,956 5, Arizona State University ,763 56,616 4,149 5,641 48,574 3, Med U of South Carolina ,687 60,543 1,257 7,168 46,470 1,249 Total, 1st 90 institutions... 25,285,165 14,951,119 1,687,944 1,692,978 5,037,741 1,915, U CA Santa Barbara ,372 76,828 2,956 6,001 19,341 11, U TX Hlth Sci Ctr San Ant ,154 71,153 6,441 9,677 20,797 7, Florida State University ,817 57,075 6, ,047 4, U of MA Worcester ,221 79,453 22,088 3, , U of Alaska Fairbanks ,195 55,287 2,999 28,352 23, U of South Carolina ,973 51,983 7,070 4,239 41,914 4, Dartmouth College ,096 69,844 3,591 4,389 23,733 7, Washington State U ,937 48,660 5,458 4,438 38,470 10, Auburn University ,347 40,097 1,146 4,683 56,227 4, Tufts University ,806 71,669 2,266 7,726 13,904 10,241 Total, 1st 100 institutions... 26,391,083 15,573,168 1,748,494 1,766,692 5,320,731 1,981,
151 Table B-35. R&D expenditures at universities and colleges, by source of funds: fiscal year 2001 Page 3 of 5 Federal State Institu- Institution and ranking Total Govt. & local Industry tional Other govts. funds 101 U TX Med Br at Galveston ,722 64,682 10,775 6,020 10,608 10, Tulane University... 99,761 55,669 3,027 8,654 20,414 11, Georgetown University... 99,228 93, , Virginia Commonwealth U... 99,180 57,315 2,358 8,522 26,091 4, Wake Forest University... 98,343 78, ,330 1,357 4, U of MA Amherst... 97,976 49,576 3,969 6,181 29,538 8, U CA Riverside... 94,455 25,713 5,313 4,227 50,383 8, Kansas State University... 94,030 33,998 36,398 4,943 15,866 2, Brown University... 91,636 58, ,777 28,024 3, Woods Hole Oceanogr Inst... 91,029 75, ,273 12,417 Total, 1st 110 institutions... 27,359,443 16,165,805 1,812,393 1,825,439 5,505,285 2,050, Oklahoma State University... 90,311 25,636 24,904 3,688 34,866 1, Thomas Jefferson U... 88,936 64,881 3,933 12,326 1,686 6, U of New Hampshire... 87,879 45,223 8,603 7,751 19,298 7, New Mexico State Univ... 86,963 61,124 7,960 4,272 12,537 1, Medical Col of Wisconsin... 83,857 64, ,126 8,674 8, U of Central Florida... 79,287 22,342 6,115 5,288 45, U of Arkansas Main... 78,303 23,172 34,940 4,224 11,917 4, University of Delaware... 77,491 41,830 4,469 5,041 16,464 9, University of Vermont... 75,597 48,810 4,052 6,434 12,338 3, George Washington U... 73,805 51,757 1,815 5, ,398 Total, 1st 120 institutions... 28,181,872 16,614,583 1,909,356 1,881,670 5,669,361 2,106, University of Louisville... 72,857 25,116 1, ,543 6, West Virginia University... 71,311 29,440 2,276 6,328 28,261 5, Rush University... 70,219 37, ,128 20,148 3, SUNY at Albany... 70,119 46,671 7,819 1,017 7,024 7, Texas Tech University... 69,918 22,967 21,243 6,236 15,194 4, Montana St U Bozeman... 69,593 34,857 16,502 7,041 11, University of Idaho... 67,496 26,548 17,149 3,634 19,036 1, North Dakota State U... 64,882 15,207 1,440 3,784 41,533 2, U CA Santa Cruz... 64,253 29, ,004 23,258 9, U of Maine... 64,070 23,873 7,886 3,562 24,631 4,118 Total, 1st 130 institutions... 28,866,590 16,905,764 1,986,569 1,924,315 5,898,182 2,151, U of Nebraska Med Ctr... 60,695 22,497 2,064 5,929 20,607 9, Temple University... 60,182 41, ,400 6,290 5, U of Nevada Reno... 59,229 31,386 3,692 2,338 20,448 1, San Diego St University... 58,332 23,621 8,817 1,162 19,344 5, Brandeis University... 52,818 30, ,000 16, Medical Col of Georgia... 52,191 21, ,478 24,742 2, U of Arkansas Medical Sci... 51,921 34, ,900 9,458 4, University of Houston... 51,567 21,876 15,472 1,992 7,726 4, U of Rhode Island... 50,835 43,161 5, , University of Notre Dame... 46,096 29,801 2,996 3,631 9,668 0 Total, 1st 140 institutions... 29,410,456 17,205,115 2,027,599 1,951,586 6,024,008 2,202, Rensselaer Polytech Inst... 45,010 25,894 5,781 5,928 4,734 2, Florida International U... 44,291 23,940 11,037 8, NJ Inst of Technology... 44,177 18,530 8, ,730 14, U of Alabama Huntsville... 43,731 30, ,956 7, S Illinois U Carbondale... 43,207 10,868 10,301 5,484 12,204 4, Rice University... 42,675 35,682 1,784 3, , Syracuse University... 42,476 30,036 3,693 1,420 2,223 5, University of Wyoming... 41,632 20,017 2,038 2,581 16, University of Dayton... 41,343 34, ,138 1, Naval Postgrad School... 40,889 i 40,121 i 255 i 344 i 0 i 169 i Total, 1st 150 institutions... 29,839,887 17,474,930 2,072,382 1,989,995 6,070,315 2,232,
152 Table B-35. R&D expenditures at universities and colleges, by source of funds: fiscal year 2001 Page 4 of 5 Federal State Institu- Institution and ranking Total Govt. & local Industry tional Other govts. funds 151 TX A&M U Sys Hlth Sci Ctr... 40,859 18,384 8,138 1,050 8,424 4, U Mississippi, All Camp... 39,552 30,108 6, ,450 1, Georgia State University... 38,960 13,575 8, ,144 2, Loyola U of Chicago... 37,156 26, ,202 5,736 3, University of Oregon... 36,881 32, ,850 1, C R Drew U of Med & Sci... 36,717 27,415 8,230 1, U MD Ctr for Environ Sci... 36,635 12,105 4, ,525 4, Col of William & Mary... 35,829 15,288 3,327 1,165 14,148 1, Northeastern University... 34,467 23, ,530 5, Univ of Montana, The... 33,535 19,194 1,796 1,491 9,726 1,328 Total, 1st 160 institutions... 30,210,478 17,693,237 2,114,017 2,002,587 6,147,451 2,253, University of Alabama, The... 33,133 22,183 2,541 1,989 6, George Mason University... 32,881 25, ,048 4, MCP Hahnemann U... 32,462 22,944 4,249 2, , U MD Biotechnology Inst... 32,458 11,053 2,491 2,103 14,175 2, Saint Louis University... 32,442 28, , U of LA Lafayette... 32,073 12,130 3, ,316 8, Wright State University... 32,033 15,417 3,140 3,269 9, SUNY Hlth Sci Ctr Brklyn... 31,626e 22,860e 229e 1,787e 4,094e 2,656e 169 Boston College... 30,768 20, ,050 5,392 2, Howard University... 30,148 27, , Total, 1st 170 institutions... 30,530,502 17,901,904 2,131,724 2,022,567 6,197,473 2,276, Desert Research Institute... 29,697 22,018 2, ,889 2, U of MD Baltimore County... 29,641 23, ,131 2, Michigan Tech University... 29,613 17, ,176 6, Univ of Memphis, The... 29,445 11,012 3, ,640 1, Lehigh University... 29,058 13,961 6,151 5,532 3, U of Missouri Rolla... 28,799 11, ,088 11,530 1, NM Inst Mining & Tech... 28,392 13,255 1,998 6,204 6, SUNY Col Env Sci & Frstry... 27,854 4,355 2,992 2,149 17, Drexel University... 27,698 20, ,307 2, Ohio University... 27,146 12,898 2,528 2,022 8, Total, 1st 180 institutions... 30,817,845 18,052,806 2,153,970 2,049,739 6,272,460 2,288, U of Nevada Las Vegas... 27,008 15,681 4,045 1,938 5, Loma Linda University... 26,451 i 20,494 i 0 i 4,538 i 1,296 i 123 i 183 Eastern VA Med School... 26,250 11, , , Jackson State University... 25,663 22, , Florida Atlantic U... 25,111 14,099 1,432 9, Old Dominion University... 24,659 15,280 3,789 2,885 2, New York Medical College... 24,283 18, , , U PR Med Sci Campus... 23,913 19, ,121 2, Florida A&M University... 23,865 22,477 1, Colorado School of Mines... 23,654 12,314 1,626 9, Total, 1st 190 institutions... 31,068,702 18,225,067 2,166,848 2,089,157 6,288,003 2,299,
153 Table B-35. R&D expenditures at universities and colleges, by source of funds: fiscal year 2001 Page 5 of 5 Federal State Institu- Institution and ranking Total Govt. & local Industry tional Other govts. funds 191 U of WI-Milwaukee... 23,492 11,089 2, ,398 1, Unif Svcs U of Hlth Sci... 23,247 10, , San Jose State University... 22,709 14,301 3,747 3,126 1, University of Akron... 22,266 8,672 1,366 2,557 6,737 2, U TX at El Paso... 21,889 16,167 2,875 1,321 1, U of MA Lowell... 20,656 11, ,911 1, U Southern Mississippi... 20,286 18, CUNY Hunter College... 19,964 10,922 1, ,608 2, South Dakota State U... 19,717 8,456 8, ,057 1, U of North Dakota... 19,692 15, , Total, 1st 200 institutions... 31,282,620 18,349,779 2,189,224 2,107,251 6,327,948 2,308,418 Total, all other sampled institutions... 1,440, , , , , ,860 1 Johns Hopkins University includes the Applied Physics Laboratory. KEY: e = estimated i = imputed NOTE: Because of rounding, detail may not add to totals. SOURCE: National Science Foundation/Division of Science Resources Statistics, Survey of Research and Development Expenditures at Universities and Colleges, Fiscal Year
154 Table B-36. R&D expenditures at public universities and colleges, by source of funds: fiscal year 2001 Page 1 of 4 Federal State Institu- Institution and ranking Total Govt. & local Industry tional Other govts. funds Total, all institutions... 22,340,844 11,694,962 2,079,529 1,489,479 5,541,775 1,535,099 1 U CA Los Angeles , ,858 59,365 32, ,229 98,810 2 U of WI-Madison , ,009 35,317 17, ,924 59,656 3 University of Michigan , ,117 5,113 34, ,508 44,346 4 U of Washington , ,103 11,716 43,312 88,309 11,186 5 U CA San Diego , ,276 20,842 36, ,503 54,067 6 U CA San Francisco , ,489 21,902 35, ,652 79,173 7 University of Minnesota , ,289 58,053 26,454 79,757 33,458 8 Pennsylvania State U , ,951 23,504 67, ,417 8,536 9 U CA Berkeley , ,080 29,824 26, ,333 53, U CA Davis , ,937 50,044 16, ,268 39,158 Total, 1st 10 institutions... 5,368,347 2,942, , ,023 1,290, , Texas A&M University , , ,480 35, ,210 5, U of IL Urbana-Champaign , ,316 48,803 10, ,602 16, Ohio State University , ,092 54,867 54,736 86,275 33, University of Arizona , ,484 8,410 22, ,083 17, University of Colorado , ,643 2,668 9,002 29,802 15, University of Florida , ,744 74,057 36,417 99,204 9, University of Pittsburgh , ,571 5,149 14,817 32,183 28, Georgia Institute of Tech , ,836 10,771 59,691 92, U of NC Chapel Hill , ,615 15,914 6,971 59, NC State University ,259 95,875 91,794 37,858 65,966 7,766 Total, 1st 20 institutions... 8,906,975 4,825, , ,551 2,110, , U TX at Austin , ,184 19,939 30,310 36,266 13, University of Georgia ,298 66,913 53,463 13, ,823 1, Louisiana State U System ,911 94,625 74,420 16,648 64,535 18, U of MD at College Park , ,515 21,519 7,315 80,378 12, Michigan State University , ,359 46,395 10,953 87,885 8, Indiana University , ,781 5,650 6, ,566 28, U of Iowa , ,249 7,084 21,394 52,571 19, Purdue University ,917 98,151 36,485 29,765 90, U of MD Baltimore ,007 99,091 26,603 41,226 34,323 37, Rutgers the State U NJ ,793 77,156 28,163 10,965 89,916 30,593 Total, 1st 30 institutions... 11,522,581 5,986,691 1,048, ,293 2,886, , U of IL Chicago , ,109 9,743 10,989 70,677 16, U of Alabama Birmingham , , ,443 14,077 14, U TX SW Med Ctr at Dallas , ,820 9,516 13,320 5,942 61, VA Polytech Inst & St U ,323 77,384 58,232 18,355 52,534 9, U TX MD Anderson Cncr Ctr.. 212,746 94, ,717 58,853 33, University of Kentucky ,721 86,239 37,904 12,933 61,008 13, University of Utah , ,253 2,166 6,023 35,021 27, University of Cincinnati , ,049 3,619 6,028 41,092 14, SUNY at Buffalo ,829 96,595 5,220 11,598 50,091 23, U CA Irvine , ,735 8,384 15,803 30,581 23,363 Total, 1st 40 institutions... 13,607,734 7,149,553 1,183, ,502 3,306,078 1,023, Iowa State University ,196 62,024 52,115 13,177 48,733 3, Wayne State University ,984 79,448 12,463 10,860 55,384 17, U of Missouri Columbia ,782 68,435 16,154 4,654 78,842 6, U of South Florida ,550 58,826 8,819 11,152 76,057 16, SUNY at Stony Brook ,487 93,265 3,117 7,026 54,433 10, University of Connecticut ,366 70,013 13,971 9,819 54,541 16, U Med & Dent of NJ ,417 86,054 9,170 13,496 38,378 15, U of Tennessee System ,898 78,611 33,867 15,391 18,474 15, Colorado State University , ,308 16,102 8,850 25,637 9, U of Nebraska at Lincoln ,520 43,877 3,899 5, ,217 2,619 Total, 1st 50 institutions... 15,285,078 7,891,414 1,352,943 1,045,835 3,857,774 1,137,
155 Table B-36. R&D expenditures at public universities and colleges, by source of funds: fiscal year 2001 Page 2 of 4 Federal State Institu- Institution and ranking Total Govt. & local Industry tional Other govts. funds 51 Univ of Hawaii at Manoa ,976 97,716 33,125 7,232 18, University of New Mexico , ,505 1,902 1,821 37,258 6, University of Kansas ,467 74,494 7,049 4,155 52,380 18, Oregon State University ,925 84,854 36, ,261 4, University of Virginia , , ,733 11,661 6, University of Oklahoma ,695 60,264 14,306 10,396 52,294 11, Mississippi State U ,939 65,493 32,357 6,744 42, Oregon Health & Science U , ,671 2,879 11, , UT Houston Hlth Sci Ctr ,439 88,545 4,129 10,945 7,633 14, Clemson University ,885 48,560 21,190 11,582 42, Total, 1st 60 institutions... 16,740,355 8,755,384 1,506,826 1,118,279 4,149,605 1,210, Utah State University ,359 74,251 18,024 6,595 16,956 5, Arizona State University ,763 56,616 4,149 5,641 48,574 3, Med U of South Carolina ,687 60,543 1,257 7,168 46,470 1, U CA Santa Barbara ,372 76,828 2,956 6,001 19,341 11, U TX Hlth Sci Ctr San Ant ,154 71,153 6,441 9,677 20,797 7, Florida State University ,817 57,075 6, ,047 4, U of MA Worcester ,221 79,453 22,088 3, , U of Alaska Fairbanks ,195 55,287 2,999 28,352 23, U of South Carolina ,973 51,983 7,070 4,239 41,914 4, Washington State U ,937 48,660 5,458 4,438 38,470 10,911 Total, 1st 70 institutions... 17,881,833 9,387,233 1,583,803 1,194,599 4,450,731 1,265, Auburn University ,347 40,097 1,146 4,683 56,227 4, U TX Med Br at Galveston ,722 64,682 10,775 6,020 10,608 10, Virginia Commonwealth U... 99,180 57,315 2,358 8,522 26,091 4, U of MA Amherst... 97,976 49,576 3,969 6,181 29,538 8, U CA Riverside... 94,455 25,713 5,313 4,227 50,383 8, Kansas State University... 94,030 33,998 36,398 4,943 15,866 2, Oklahoma State University... 90,311 25,636 24,904 3,688 34,866 1, U of New Hampshire... 87,879 45,223 8,603 7,751 19,298 7, New Mexico State Univ... 86,963 61,124 7,960 4,272 12,537 1, U of Central Florida... 79,287 22,342 6,115 5,288 45,542 0 Total, 1st 80 institutions... 18,820,983 9,812,939 1,691,344 1,250,174 4,751,687 1,314, U of Arkansas Main... 78,303 23,172 34,940 4,224 11,917 4, University of Delaware... 77,491 41,830 4,469 5,041 16,464 9, University of Vermont... 75,597 48,810 4,052 6,434 12,338 3, University of Louisville... 72,857 25,116 1, ,543 6, West Virginia University... 71,311 29,440 2,276 6,328 28,261 5, SUNY at Albany... 70,119 46,671 7,819 1,017 7,024 7, Texas Tech University... 69,918 22,967 21,243 6,236 15,194 4, Montana St U Bozeman... 69,593 34,857 16,502 7,041 11, University of Idaho... 67,496 26,548 17,149 3,634 19,036 1, North Dakota State U... 64,882 15,207 1,440 3,784 41,533 2,918 Total, 1st 90 institutions... 19,538,550 10,127,557 1,803,196 1,294,824 4,953,190 1,359, U CA Santa Cruz... 64,253 29, ,004 23,258 9, U of Maine... 64,070 23,873 7,886 3,562 24,631 4, U of Nebraska Med Ctr... 60,695 22,497 2,064 5,929 20,607 9, Temple University... 60,182 41, ,400 6,290 5, U of Nevada Reno... 59,229 31,386 3,692 2,338 20,448 1, San Diego St University... 58,332 23,621 8,817 1,162 19,344 5, Medical Col of Georgia... 52,191 21, ,478 24,742 2, U of Arkansas Medical Sci... 51,921 34, ,900 9,458 4, University of Houston... 51,567 21,876 15,472 1,992 7,726 4, U of Rhode Island... 50,835 43,161 5, , Total, 1st 100 institutions... 20,111,825 10,420,150 1,849,875 1,323,030 5,111,237 1,407,
156 Table B-36. R&D expenditures at public universities and colleges, by source of funds: fiscal year 2001 Page 3 of 4 Federal State Institu- Institution and ranking Total Govt. & local Industry tional Other govts. funds 101 Florida International U... 44,291 23,940 11,037 8, NJ Inst of Technology... 44,177 18,530 8, ,730 14, U of Alabama Huntsville... 43,731 30, ,956 7, S Illinois U Carbondale... 43,207 10,868 10,301 5,484 12,204 4, University of Wyoming... 41,632 20,017 2,038 2,581 16, Naval Postgrad School... 40,889 i 40,121 i 255 i 344 i 0 i 169 i 107 TX A&M U Sys Hlth Sci Ctr... 40,859 18,384 8,138 1,050 8,424 4, U Mississippi, All Camp... 39,552 30,108 6, ,450 1, Georgia State University... 38,960 13,575 8, ,144 2, University of Oregon... 36,881 32, ,850 1,441 Total, 1st 110 institutions... 20,526,004 10,658,550 1,905,698 1,347,820 5,176,016 1,437, U MD Ctr for Environ Sci... 36,635 12,105 4, ,525 4, Col of William & Mary... 35,829 15,288 3,327 1,165 14,148 1, Univ of Montana, The... 33,535 19,194 1,796 1,491 9,726 1, University of Alabama, The... 33,133 22,183 2,541 1,989 6, George Mason University... 32,881 25, ,048 4, U MD Biotechnology Inst... 32,458 11,053 2,491 2,103 14,175 2, U of LA Lafayette... 32,073 12,130 3, ,316 8, Wright State University... 32,033 15,417 3,140 3,269 9, SUNY Hlth Sci Ctr Brklyn... 31,626e 22,860e 229e 1,787e 4,094e 2,656e 120 Desert Research Institute... 29,697 22,018 2, ,889 2,450 Total, 1st 120 institutions... 20,855,904 10,836,790 1,930,581 1,361,386 5,260,989 1,466, U of MD Baltimore County... 29,641 23, ,131 2, Michigan Tech University... 29,613 17, ,176 6, Univ of Memphis, The... 29,445 11,012 3, ,640 1, U of Missouri Rolla... 28,799 11, ,088 11,530 1, NM Inst Mining & Tech... 28,392 13,255 1,998 6,204 6, SUNY Col Env Sci & Frstry... 27,854 4,355 2,992 2,149 17, Ohio University... 27,146 12,898 2,528 2,022 8, U of Nevada Las Vegas... 27,008 15,681 4,045 1,938 5, Jackson State University... 25,663 22, , Florida Atlantic U... 25,111 14,099 1,432 9, Total, 1st 130 institutions... 21,134,576 10,984,084 1,948,898 1,393,491 5,334,834 1,473, Old Dominion University... 24,659 15,280 3,789 2,885 2, U PR Med Sci Campus... 23,913 19, ,121 2, Florida A&M University... 23,865 22,477 1, Colorado School of Mines... 23,654 12,314 1,626 9, U of WI-Milwaukee... 23,492 11,089 2, ,398 1, Unif Svcs U of Hlth Sci... 23,247 10, , San Jose State University... 22,709 14,301 3,747 3,126 1, University of Akron... 22,266 8,672 1,366 2,557 6,737 2, U TX at El Paso... 21,889 16,167 2,875 1,321 1, U of MA Lowell... 20,656 11, ,911 1,587 0 Total, 1st 140 institutions... 21,364,926 11,125,118 1,967,828 1,421,407 5,372,408 1,478,
157 Table B-36. R&D expenditures at public universities and colleges, by source of funds: fiscal year 2001 Page 4 of 4 Federal State Institu- Institution and ranking Total Govt. & local Industry tional Other govts. funds 141 U Southern Mississippi... 20,286 18, CUNY Hunter College... 19,964 10,922 1, ,608 2, South Dakota State U... 19,717 8,456 8, ,057 1, U of North Dakota... 19,692 15, , SUNY at Binghamton... 18,992 6,392 2,286 2,493 4,755 3, U of Missouri Kansas City... 18,795 8, ,665 8, U PR Mayaguez Campus... 18,627 9,015 2,700 1,059 5, SUNY Upstate Med U... 17,948 10, , U TX at Arlington... 17,486 9,413 1, , CUNY City College... 17,099 13,022 1,903 1, Total, 1st 150 institutions... 21,553,532 11,235,142 1,987,387 1,433,569 5,405,466 1,491,968 Total, all other sampled institutions , ,820 92,142 55, ,309 43,131 KEY: e = estimated i = imputed NOTE: Because of rounding, detail may not add to totals. SOURCE: National Science Foundation/Division of Science Resources Statistics, Survey of Research and Development Expenditures at Universities and Colleges, Fiscal Year
158 Table B-37. R&D expenditures at private universities and colleges, by source of funds: fiscal year 2001 Page 1 of 3 Federal State Institu- Institution and ranking Total Govt. & local Industry tional Other govts. funds Total, all institutions... 10,382,234 7,495, , ,170 1,011, ,179 1 Johns Hopkins U , ,741 2,177 18,737 50,348 48,243 2 Stanford University , ,468 5,433 35,012 30,920 27,073 3 U of Pennsylvania , ,996 1,952 28,227 43,655 44,022 4 Cornell University , ,466 62,569 22,261 80,446 38,086 5 MA Institute of Tech , , ,256 6,058 27,681 6 Washington University , ,928 6,519 24,865 58,634 31,696 7 Baylor Col of Medicine , ,394 3,731 18,389 56,413 68,534 8 Duke University , ,109 7, ,063 19,275 25,938 9 Harvard University , ,414 1,739 14, , Columbia U in City of NY , ,928 1,122 2,885 13,481 19,081 Total, 1st 10 institutions... 4,721,167 3,516,763 93, , , , U of Southern California , ,207 15,542 22,949 55, Yale University , , ,119 18,487 37, Northwestern University , ,129 3,778 14,294 59,852 21, Emory University , ,317 4,001 7,950 19,857 34, University of Rochester , ,945 9,839 23,782 20,092 13, California Inst of Tech , ,554 1,050 10,225 10, Case Western Reserve U , ,852 3,735 6,190 11,636 17, University of Chicago , ,566 4,451 1,746 14,088 18, New York University , ,897 2,739 6,535 25,514 26, Vanderbilt University , , ,036 21,160 15,681 Total, 1st 20 institutions... 7,097,158 5,293, , , , , Mt Sinai Sch Med , ,344 2,698 18,133 17,134 29, Boston University , , , , University of Miami , ,803 2,249 17,554 8,025 14, Princeton University ,411 78,620 3,102 8,246 41,983 17, Yeshiva University , , , Rockefeller U, The ,571 55,362 6,079 2,844 52,493 28, Carnegie Mellon U ,882 97,463 3,401 23, , Dartmouth College ,096 69,844 3,591 4,389 23,733 7, Tufts University ,806 71,669 2,266 7,726 13,904 10, Tulane University... 99,761 55,669 3,027 8,654 20,414 11,997 Total, 1st 30 institutions... 8,502,664 6,201, , , , , Georgetown University... 99,228 93, , Wake Forest University... 98,343 78, ,330 1,357 4, Brown University... 91,636 58, ,777 28,024 3, Woods Hole Oceanogr Inst... 91,029 75, ,273 12, Thomas Jefferson U... 88,936 64,881 3,933 12,326 1,686 6, Medical Col of Wisconsin... 83,857 64, ,126 8,674 8, George Washington U... 73,805 51,757 1,815 5, , Rush University... 70,219 37, ,128 20,148 3, Brandeis University... 52,818 30, ,000 16, University of Notre Dame... 46,096 29,801 2,996 3,631 9,668 0 Total, 1st 40 institutions... 9,298,631 6,784, , , , , Rensselaer Polytech Inst... 45,010 25,894 5,781 5,928 4,734 2, Rice University... 42,675 35,682 1,784 3, , Syracuse University... 42,476 30,036 3,693 1,420 2,223 5, University of Dayton... 41,343 34, ,138 1, Loyola U of Chicago... 37,156 26, ,202 5,736 3, C R Drew U of Med & Sci... 36,717 27,415 8,230 1, Northeastern University... 34,467 23, ,530 5, MCP Hahnemann U... 32,462 22,944 4,249 2, , Saint Louis University... 32,442 28, , Boston College... 30,768 20, ,050 5,392 2,470 Total, 1st 50 institutions... 9,674,147 7,059, , , , ,
159 Table B-37. R&D expenditures at private universities and colleges, by source of funds: fiscal year 2001 Page 2 of 3 Federal State Institu- Institution and ranking Total Govt. & local Industry tional Other govts. funds 51 Howard University... 30,148 27, , Lehigh University... 29,058 13,961 6,151 5,532 3, Drexel University... 27,698 20, ,307 2, Loma Linda University... 26,451 i 20,494 i 0 i 4,538 i 1,296 i 123 i 55 Eastern VA Med School... 26,250 11, , , New York Medical College... 24,283 18, , , Morehouse School of Med... 19,670 18, , Brigham Young University... 19,171 11,659 1,255 2,384 2,810 1, OGI Schl Sci & Eng OHSU... 18,798 14, ,725 1, Rose-Hulman Inst of Tech... 18,540 1, ,984 Total, 1st 60 institutions... 9,914,214 7,216, , , , , Creighton University... 17,674 7,275 1,014 5,942 3, Catholic U of America... 17,539 13, , Clark Atlanta University... 17,173 14, , Mercer University... 15,337 9, ,115 5, Illinois Inst of Tech... 14,722 10,917 1,624 1, Inst of Paper Sci & Tech... 13,929 2, ,828 2, Stevens Inst of Tech... 13,855 8,094 3, , University of Denver... 12,944 9,248 1,233 1, Albany Medical College... 12,836 8, ,977 1, University of Tulsa... 12,553 7,341 1,095 3, Total, 1st 70 institutions... 10,062,776 7,307, , , , , Rochester Inst of Tech... 11,416 5,612 2,306 2, Meharry Medical College... 10,268 i 10,015 i 0 i 0 i 0 i 253 i 73 Teachers Col, Columbia U... 9,676 5, , Tuskegee University... 9,539 7, , Worcester Polytech Inst... 9,348 4, ,059 2,375 1, Hampton University... 9,158 8, Southern Methodist U... 8,948 5, , Clarkson University... 8,322 4, ,566 1, Polytechnic University... 8,277 4,063 1,568 2, Finch U Hlth Sci Chicago... 8,037 6, , Total, 1st 80 institutions... 10,155,765 7,369, , , , , Embry-Riddle Aero Univ... 7,711 6, Marquette University... 7,236 3,309 1,575 1, U Ctrl Del Caribe Esc Med... 6,943 6, Alfred University... 6,678 1, ,244 1, Harvey Mudd College... 6,443 i 1,156 i 93 i 459 i 566 i 4,169 i 86 Florida Inst of Tech... 6,195 2, ,420 1, Villanova University... 5,969 i 4,520 i 150 i 982 i 284 i 33 i 88 Wesleyan University... 5,846 3, , New School University... 5,791 1, , Wellesley College... 5,498 3, ,864 Total, 1st 90 institutions... 10,220,075 7,404, , , , ,
160 Table B-37. R&D expenditures at private universities and colleges, by source of funds: fiscal year 2001 Page 3 of 3 Federal State Institu- Institution and ranking Total Govt. & local Industry tional Other govts. funds 91 Xavier University of LA... 5,113 4, Ponce School of Medicine... 3,842 3,736 0 i 0 i 91 i 15 i 93 Texas Christian U... 3,678 2, Fordham University... 3,639 1, , Spelman College... 3,406 3, Institute of Textile Tech... 3, , Hampshire College... 3, , Bryn Mawr College... 3, , Alliant University... 3,062e 1,578e 67 i 266 i 393 i 758 i 100 Clark University... 3,039 2, Total, 1st 100 institutions... 10,255,243 7,426, , , , ,641 Total, all other sampled institutions ,991 69,117 4,529 15,462 22,345 15,538 1 Johns Hopkins University includes the Applied Physics Laboratory. KEY: e = estimated i = imputed NOTE: Because of rounding, detail may not add to totals. SOURCE: National Science Foundation/Division of Science Resources Statistics, Survey of Research and Development Expenditures at Universities and Colleges, Fiscal Year
161 Table B-38. Industry-sponsored R&D expenditures at universities and colleges, ranked by fiscal year 2001 industry-sponsored R&D expenditures: fiscal years Page 1 of 5 Institution and ranking Total, all institutions... 1,422,170 1,488,895 1,605,258 1,736,668 1,888,171 2,027,937 2,152,389 2,233,649 1 Duke University... 30,241 32,560 42,797 48,178 65, , , ,063 2 MA Institute of Tech... 55,500 52,757 62,699 59,204 60,538 75,444 83,082 97,256 3 Pennsylvania State U... 45,408 50,225 52,771 56,666 63,319 65,698 64,393 67,658 4 Georgia Institute of Tech... 27,832 26,104 39,136 48,094 58,377 62,752 64,508 59,691 5 Ohio State University... 14,883 21,827 30,870 36,685 40,401 52,034 57,075 54,736 6 U of Washington... 33,199 36,892 36,180 37,744 38,370 51,319 57,405 43,312 7 U of MD Baltimore... 15,411 17,797 19,450 18,581 20,783 11,572 29,892 41,226 8 NC State University... 22,101 26,264 26,067 26,834 31,429 31,478 32,804 37,858 9 U CA San Diego... 9,764 11,363 15,130 23,725 27,010 31,356 34,541 36, University of Florida... 10,858 10,611 23,532 25,217 21,393 28,183 34,879 36,417 Total, 1st 10 institutions , , , , , , , , U CA San Francisco... 10,977 13,890 16,989 26,931 34,369 36,830 34,964 35, Texas A&M University... 28,576 31,452 26,947 31,816 33,674 34,722 31,084 35, Stanford University... 14,714 16,446 19,167 23,839 27,404 31,516 41,013 35, University of Michigan... 26,732 28,987 34,975 31,411 33,029 34,432 35,515 34, U CA Los Angeles... 13,394 14,892 15,788 23,144 28,310 34,404 33,427 32, U TX at Austin... 4,268 3,257 i 15,029 29,887 31,326 39,729 24,740 30, Purdue University... 21,639 25,147 25,720 26,090 26,988 28,856 29,997 29, U of Alaska Fairbanks... 4,441 5,470 9,965 12,769 16,081 19,340 19,686 28, U of Pennsylvania... 12,107 11,900 9,445 18,964 25,593 30,269 32,632 28, U CA Berkeley... 12,547 13,842 15,128 21,253 20,902 21,928 27,851 26,791 Total, 1st 20 institutions , , , , , , , , U TX MD Anderson Cncr Ctr ,271 26, University of Minnesota... 23,726 23,427 23,726 24,196 24,094 23,933 26,392 26, Washington University... 20,629 21,977 18,700 21,205 19,869 19,964 22,691 24, University of Rochester... 10,261 12,810 11,605 14,147 17,653 18,226 17,595 23, Carnegie Mellon U... 14,112 17,763 21,521 18,016 19,136 17,761 21,136 23, U of Southern California... 14,502 17,668 21,592 21,606 24,125 23,111 25,298 22, University of Arizona... 15,053 15,300 13,106 14,964 16,392 16,660 22,412 22, Cornell University... 17,199 17,752 14,915 8,215 11,253 12,053 12,697 22, U of Iowa... 10,205 11,359 14,862 15,712 17,262 20,778 17,262 21, Johns Hopkins U... 10,418 10,652 12,388 13,917 14,761 15,317 15,751 18,737 Total, 1st 30 institutions , , , , ,955 1,011,295 1,080,784 1,128, Baylor Col of Medicine... 11,919 12,217 13,655 14,420 16,588 19,400 17,578 18, VA Polytech Inst & St U... 12,580 11,500 11,365 11,385 12,132 13,287 14,869 18, Mt Sinai Sch Med... 5,934 5,571 3,288 6,994 7,588 9,257 12,141 18, University of Miami... 11,140 11,831 12,321 12,200 13,338 15,752 17,028 17, U of WI-Madison... 13,729 12,948 13,871 14,832 14,371 14,172 16,127 17, U CA Davis... 7,423 8,053 9,387 10,731 14,238 16,242 17,891 16, Louisiana State U System... 9,037 10,432 11,298 13,331 12,157 13,187 15,108 16, U CA Irvine... 6,243 9,139 10,391 12,712 15,981 16,539 18,615 15, U of Tennessee System... 10,699 11,077 11,759 12,675 12,551 15,093 12,740 15, University of Pittsburgh... 7,561 8,208 7,880 9,753 10,436 12,990 14,676 14,817 Total, 1st 40 institutions , , , , ,335 1,157,214 1,237,557 1,298, Northwestern University... 9,203 7,257 9,378 10,498 13,292 14,168 12,860 14, Yale University... 11,145 13,623 15,322 16,629 15,829 15,242 14,355 14, Harvard University... 10,228 8,395 i 12,522 11,588 10,361 11,790 12,189 14, University of Georgia... 8,773 10,595 9,861 10,283 10,534 11,034 12,276 13, U Med & Dent of NJ... 8,984 8,164 7,741 8,519 8,841 10,736 10,001 13, Wake Forest University... 9,064 11,144 12,697 16,246 15,546 16,320 15,125 13, U TX SW Med Ctr at Dallas... 13,092 14,986 13,801 12,737 13,926 16,197 14,861 13, Iowa State University... 8,185 8,017 7,407 8,499 13,717 14,905 15,075 13, University of Kentucky... 11,790 12,011 13,374 11,259 13,668 15,109 11,213 12, Thomas Jefferson U... 7,455 8,105 9,553 9,851 10,155 12,081 12,324 12,326 Total, 1st 50 institutions , , ,071 1,014,152 1,124,204 1,294,796 1,367,836 1,433,
162 Table B-38. Industry-sponsored R&D expenditures at universities and colleges, ranked by fiscal year 2001 industry-sponsored R&D expenditures: fiscal years Page 2 of 5 Institution and ranking SUNY at Buffalo... 8,143 13,390 13,186 14,480 3,021 5,485 5,590 11, Clemson University... 5,410 5,469 5,887 5,253 6,641 8,445 9,768 11, Oregon Health & Science U ,685 4,597 7,036 1,757 i 1,599 i 12,430 11, U of South Florida... 6,338 4,782 3,282 3,747 5,397 6,236 10,873 11, U of IL Urbana-Champaign... 13,527 11,832 12,365 11,761 13,636 12,864 12,693 10, U of IL Chicago... 5,061 6,174 6,746 6,947 9,424 9,683 11,010 10, Rutgers the State U NJ... 7,796 7,797 7,079 8,848 9,038 9,833 8,843 10, Michigan State University... 6,271 7,853 6,818 6,973 7,250 7,647 11,230 10, UT Houston Hlth Sci Ctr... 6,313 6,212 7,403 9,780 11,106 12,872 13,029 10, Wayne State University... 7,988 7,973 8,977 10,959 11,207 10,660 10,932 10,860 Total, 1st 60 institutions , , ,411 1,099,936 1,202,681 1,380,120 1,474,234 1,544, University of Oklahoma... 4,887 5,630 6,650 6,871 7,661 7,756 9,499 10, California Inst of Tech... 4,947 5,105 4,447 3,789 2,001 6,332 8,919 10, University of Connecticut... 7,651 6,640 8,026 8,572 9,905 10,355 13,540 9, U TX Hlth Sci Ctr San Ant... 7,300 8,922 9,021 9,051 10,845 10,777 10,707 9, Florida Atlantic U... 1,909 1,777 1,776 1,922 3,981 5,681 6,387 9, Colorado School of Mines... 5,087 6,601 i 8,114 8,038 9,877 9,292 7,870 9, Rush University... 4,993 4,970 5,872 7,232 8,911 8,154 8,762 9, University of Colorado... 13,312 7,607 8,902 9,403 9,963 9,867 9,356 9, Colorado State University... 11,793 5,736 6,320 5,712 6,155 7,213 6,519 8, Tulane University... 10,018 10,115 11,276 12,913 10,734 11,914 10,340 8,654 Total, 1st 70 institutions , ,934 1,053,815 1,173,439 1,282,714 1,467,461 1,566,133 1,639, Virginia Commonwealth U... 7,089 6,074 7,435 9,172 8,478 8,062 7,495 8, Boston University... 8,695 8,804 8,726 8,916 9,461 7,601 8,574 8, U of Alabama Birmingham... 14,772 19,219 17,354 16,233 16,842 10,181 7,752 8, Florida International U ,843 8, Princeton University... 8,089 6,335 4,483 4,441 5,242 5,965 6,881 8, Emory University... 8,966 11,473 6,383 6,700 7,670 7,794 7,513 7, U of New Hampshire... 1,476 1,723 1,315 1,600 3,635 4,395 4,923 7, University of Virginia... 14,826 15,442 4,552 7,627 12,428 4,891 6,954 7, Tufts University... 5,131 4,687e 4,970 5,344 5,560 7,027 8,118 7, U of MD at College Park... 18,433 25,431 24,044 5,009 2,127 3,053 1,028 7,315 Total, 1st 80 institutions ,460 1,042,634 1,133,604 1,239,024 1,354,716 1,527,159 1,627,214 1,720, Univ of Hawaii at Manoa ,088 5,944 10,949 13,021 11,158 7, Med U of South Carolina... 5,534 6,026 1,134 1,371 2,737 2,202 2,880 7, Montana St U Bozeman... 3,139 5,143 5,489 6,976 7,378 i 7,079 8,523 7, SUNY at Stony Brook... 5,012 5,850 5,848 7,119 6,908 7,416 7,567 7, U of NC Chapel Hill... 2,379 2,403 2,592 3,311 4,860 5,886 6,835 6, U of MA Lowell... 3,695 3,599 5,779 4,920 5,099 6,234 7,204 6, Inst of Paper Sci & Tech... 1,971 1,235 1,606 i 1,976e 1,976e 1,250 i 1,250 i 6, Mississippi State U... 5,913 6,165 7,599 5,469 7,470 7,892 7,955 6, Utah State University... 2,265 3,322 4,614 3,356 2,744 3,998 7,885 6, New York University... 5,929 6,461 10,461 8,502 8,391 7,502 7,767 6,535 Total, 1st 90 institutions... 1,008,731 1,083,137 1,186,814 1,287,968 1,413,228 1,589,639 1,696,238 1,789, University of Vermont... 4,878 5,467 5,231 5,399 5,513 7,112 5,713 6, Indiana University... 5,689 5,815 5,357 4,242 6,333 4,820 5,384 6, West Virginia University... 4,058 3,160 3,608 3,719 4,547 5,532 7,185 6, Eastern VA Med School... 4,064 5,975 5,039 5,762 7,448 8,561 6,044 6, Texas Tech University... 5,474 5,441 5,634 5,650 5,549 5,682 5,946 6, NM Inst Mining & Tech... 6,057 5,165 6,895 4,723 6,385 7,034 6,373 6, Case Western Reserve U... 5,708 5,427 5,784 5,662 6,984 6,157 5,890 6, U of MA Amherst... 4,868 4,760 5,738 5,778 6,236 5,796 5,535 6, University of Cincinnati... 10,405 8,630 16,697 22,907 24,388 5,989 5,166 6, University of Utah... 4,087 4,319 3,825 10,374 10,007 8,951 7,940 6,023 Total, 1st 100 institutions... 1,064,019 1,137,296 1,250,622 1,362,184 1,496,618 1,655,273 1,757,414 1,851,
163 Table B-38. Industry-sponsored R&D expenditures at universities and colleges, ranked by fiscal year 2001 industry-sponsored R&D expenditures: fiscal years Page 3 of 5 Institution and ranking U TX Med Br at Galveston... 6,115 5,991 6,008 7,301 5,319 6,366 6,146 6, U CA Santa Barbara... 2,711 2,576 2,988 3,106 3,809 4,742 5,499 6, Creighton University... 3,467 3,885 4,517 5,094 6,475 6,242 6,084 5, U of Nebraska Med Ctr... 3,639 3,903 4,286 3,941 5,471 5,445 5,486 5, Rensselaer Polytech Inst... 5,925 6,135 6,210 9,340 10,974 10,084 6,581 5, U of Nebraska at Lincoln... 3,558 3,145 3,465 4,651 4,721e 5,466 5,991 5, Arizona State University... 5,780 7,169 2,758 3,376 4,609 4,267 4,700 5, Lehigh University... 7,303 6,767 6,832 6,790 6,074 6,669 5,636 5, Northeastern University... 2,002 2,334 2,072 2,827 3,530 2,981 3,567 5, S Illinois U Carbondale... 2,347 2,325 2,033 1,954 2,306 2,462 2,355 5,484 Total, 1st 110 institutions... 1,106,866 1,181,526 1,291,791 1,410,564 1,549,906 1,709,997 1,809,459 1,909, Temple University... 6,011 5,458 5,173 4,690 8,855 1, , U of Central Florida... 2,272 2,272 1,207 9,800 4,019 4,873 5,833 5, University of Dayton... 5,313 5,834 6,160 5,541 6,285 4,454 5,598 5, George Washington U... 2,676 4,314 5,704 7,865 7,575 4,001 4,220 5, University of Delaware... 4,117 3,681 2,964 3,361 3,859 4,152 3,757 5, Georgetown University... 6,773 6,148 6,737 8,421 9,383 7,939 9,795 4, U of Alabama Huntsville... 2,948 3,390 4,752 5,110 5,883 5,071 4,532 4, Kansas State University... 3,111 2,701 2,243 2,943 3,445 3,746 4,057 4, U TX at Dallas... 1,220 1,166 i 1,113 1, ,336 4,715 4,715e 120 Auburn University... 3,055 3,243 4,212 4,644 4,452 3,649 3,917 4,683 Total, 1st 120 institutions... 1,144,362 1,219,733 1,332,056 1,464,214 1,604,643 1,750,502 1,856,071 1,959, U of Missouri Columbia... 10,299 10,114 3,158 3,777 4,348 3,832 4,007 4, Loma Linda University... 2,514 2,499 3,273 3,291 3,192 4,310 4,181 4,538 i 123 Washington State U... 3,151 2,537 3,149 3,138 3,158 3,158 4,579 4, Dartmouth College... 2,833 2,196 2,571 3,280 2,574 4,544 4,274 4, New Mexico State Univ... 3,516 2,444 2,556 2,393 2,843 2,892 3,466 4, U of South Carolina... 8,046 7,869 3,657 2,058 2,022 2,176 2,822 4, U CA Riverside... 1,103 1,109 1,702 1,905 1,929 3,893 3,345 4, U of Arkansas Main... 5,605 4,809 4,474 4,130 5,145 6,198 4,746 4, Michigan Tech University... 2,885 2,840 3,636 3,819 3,747 3,578 3,834 4, University of Kansas... 4,320 8,149 9,356 8,201 8,281 14,393 15,712 4,155 Total, 1st 130 institutions... 1,188,634 1,264,299 1,369,588 1,500,206 1,641,882 1,799,476 1,907,037 2,002, East Carolina University... 1,952 1,624 1,441 1,476 1,996 2,627 3,158 3, North Dakota State U... 1,261 1,532 1,534 1,273 1,449 1,300 2,044 3, Oklahoma State University... 3,381 2,902 2,334 3,252 2,887 3,447 4,076 3, University of Idaho... 7,495 5,977 6,478 6,551 i 6,496 1,903 2,764 3, University of Notre Dame... 3,710 2,665 3,511 1,979 2,020 2,920 2,279 3, New York Medical College... 1,807 1,792 1,532 1,810 2,461 3,742 3,294 3, U of Maine... 4,406 4,158 4,214 5,609 7,074 2,324 2,899 3, Medical Col of Georgia... 3,575 3,484 2,995 2,578 3,072 3,603 3,609 3, U of MA Worcester... 3,776 2,492 1,146 2,129 2,631 4,265 3,467 3, Wright State University... 1,429 1,641 1,250 1,409 1,325 1,717 2,968 3,269 Total, 1st 140 institutions... 1,221,426 1,292,566 1,396,023 1,528,272 1,673,293 1,827,324 1,937,595 2,038, University of Tulsa... 2,652 2,921 2,820 3,913 2,772 3,561 3,179 3, Alfred University... 2,012 1,967 1,755 1,633 1,946 2,414 3,066 3, Wichita State University ,043 3,500 3, Rice University... 3,837 2,726 1,898 1,779 1,435 1,645 2,858 3, Saint Louis University... 1,545 2,087 2,483 2,618 2,733 3,113 3,018 3, San Jose State University... 4,324 i 4,324 i 4,324 i 4,324 i 4,324e 4,324e 4,324e 3, U of Missouri Rolla... 1,122 1,316 2,364 1,575 1,361 2,079 2,543 3, Institute of Textile Tech... 2,239 2,586 2,742 2,792 2,650 2,161 2,357 3, Vanderbilt University... 3,033 3,124 3,097 2,583 4,036 3,730 4,063 3, U of Arkansas Medical Sci... 2,158 2,884 3,733 3,440 3,040 3,889 3,321 2,900 Total, 1st 150 institutions... 1,244,778 1,317,085 1,421,771 1,553,692 1,697,968 1,855,283 1,969,824 2,069,
164 Table B-38. Industry-sponsored R&D expenditures at universities and colleges, ranked by fiscal year 2001 industry-sponsored R&D expenditures: fiscal years Page 4 of 5 Institution and ranking Columbia U in City of NY... 1,632 1,478 2,559 1,637 3,018 2,630 3,362 2, Old Dominion University... 1,061 1,771 2,233 2,357 1,974 2,787 3,533 2, Rockefeller U, The... 4,031 2,660 2,800 2,577 2,641 2,707 2,775 2, Rochester Inst of Tech... 1,420 1,122 1,246 1,395 1,462e , MCP Hahnemann U... 5,556 4,675 5,060 8,525 6,835 1,552 2,967 2, University of Wyoming... 1,185 1,930 2,086 2,226 3,114 3,206 2,941 2, University of Akron... 3,822 3,542 3,313 3,411 2,767 2,150 3,090 2, Polytechnic University... 2,589 1,566 2,857 3,074 2,093 2,135 2,100 2, SUNY at Binghamton... 1,502 2,074 1,799 1,516 2,726 3,584 3,327 2, U of North Dakota ,814 2,971 2,166 2,357 2,308 2,356 2,458 Total, 1st 160 institutions... 1,268,304 1,339,717 1,448,695 1,582,576 1,726,955 1,879,111 1,997,192 2,096, Brigham Young University... 1,712 1,815 1,006 i 820 i 751 2,781 2,028 2, U of Nevada Reno... 1,674 1,756 1,399 1,806 1,394 1,374 2,557 2, SUNY Col Env Sci & Frstry... 2,044 1,772 i 1,500 1,831 1,768 2,037 1,914 2, U of MD Baltimore County ,231 1,803 2,484 2,858 2,649 2,159 2, Medical Col of Wisconsin... 4,164 2,222 3,019 2,757 1,692 2,151 1,931 2, Howard University... 1,741 2,342 1,057 1,059 1,519 1,774 1,874 2, U MD Biotechnology Inst , Idaho State University... 2,546 1,431 3,479 2,332 1,055 1,915 2,256 2, Boston College ,487 2, University of Toledo... 1,694 1,467 1,613 i 1, ,245 2,013 2,025 Total, 1st 170 institutions... 1,285,747 1,354,938 1,464,721 1,598,038 1,740,489 1,896,819 2,016,326 2,117, Ohio University... 2,690 2,526 2,322 2,132 1,948 2,843 1,591 2, University of Houston... 1,183 1,600 1,341 1,815 1,707 1,762 1,689 1, University of Alabama, The... 2,332 1,920 1,407 1,345 1,301 1,577 1,941 1, Tennessee Tech U... 1,235 1,488 1,367 1,252 2,492 1, , U of Nevada Las Vegas... 1,582 1,828 1,443 2,058 2,461 2,596 2,131 1, U North TX Hlth Sci Ctr ,389 2,105 1, University of New Mexico... 4,038 3,087 2,389 2,799 3,331 2,940 1,853 1, SUNY Hlth Sci Ctr Brklyn... 4,306 5,232 4,808 i 4,385 3,045 2,261 1,787 1,787e 179 Brown University... 1,467 1,057 1,716 1,506 1,603 1,795 1,530 1, University of Chicago... 1,324 1,679 1,306 1,634 1,684 1,621 1,462 1,746 Total, 1st 180 institutions... 1,306,477 1,375,698 1,483,204 1,617,222 1,760,614 1,918,318 2,033,105 2,136, OGI Schl Sci & Eng OHSU... 2,973 3,042 2,757 1,253 1,316e 1,429 1,315 1, U of Missouri Kansas City , CUNY City College... 1,211 1,322 1,039 2, ,531 1,659 1, Clarkson University... 1,658 1,698 1,779 1,512 1,500 1,226 1,447 1, University of Denver , Univ of Montana, The ,511 1,494 1,059 1,247 1,474 1, Cleveland State U ,246 1,184 i 1,291 i 1,330e 1,448 i 969 1, Milwaukee School of Eng i 1,021 i 1,159 i 1,296 i 1,463 1,434 1,472 1, Florida Inst of Tech ,999 i 2,354 1,040 1,822 1, , Syracuse University... 4,522 2,321 2,550 1,910 i 1,418 1,470 6,329 1,420 Total, 1st 190 institutions... 1,321,169 1,390,313 1,498,002 1,630,615 1,772,753 1,930,285 2,049,417 2,152,
165 Table B-38. Industry-sponsored R&D expenditures at universities and colleges, ranked by fiscal year 2001 industry-sponsored R&D expenditures: fiscal years Page 5 of 5 Institution and ranking Oakland University ,068 1, ,002 1,002e 1, Northern Illinois U ,127 2,222 1, ,050 1, Northern Arizona U , ,124 1,315 1,407 1, U TX at El Paso , U of South Alabama... 2,063 1,392 1,981 2,353 1,779 1,779e 1,298 1,298e 196 Illinois Inst of Tech... 1,254 1,634 4,000 3,524 2,469 2,451 1,549 1, Cal Poly St U i 594 i 530 i 468 i , Smith College i 0 i ,747 1, Loyola U of Chicago... 3,795 3,461 i 4,271 3,211 3,024 1,922 1,484 1, Indiana State University ,611 4,591 3,928 1,180 Total, 1st 200 institutions... 1,332,143 1,401,793 1,514,214 1,643,696 1,788,560 1,945,415 2,064,717 2,165,009 Total, all other sampled institutions... 90,027 87,102 91,044 92,972 99,611 82,522 87,672 68,640 KEY: e = estimated i = imputed NOTE: Because of rounding, detail may not add to totals. SOURCE: National Science Foundation/Division of Science Resources Statistics, Survey of Research and Development Expenditures at Universities and Colleges, Fiscal Year
166 Table B-39. R&D expenditures at universities and colleges, by science and engineering field: fiscal year 2001 Page 1 of 5 Engi- Physical Environ- Math & Life Psy- Social Other Institution and ranking Total neering sciences mental computer sciences chology sciences sciences sciences sciences Total, all institutions... 32,723,078 4,999,648 2,800,364 1,826,827 1,311,067 19,189, ,865 1,435, ,655 1 Johns Hopkins U , , ,414 36,577 94, ,484 3,940 9,698 22,141 2 U CA Los Angeles ,801 46,854 68,170 14,774 17, ,355 10,688 35,135 7,524 3 U of WI-Madison ,143 82,652 49,127 29,040 14, ,813 22,838 35, University of Michigan , ,487 25,654 5,378 14, ,083 11,049 75, U of Washington ,626 49,629 29,784 73,448 10, ,532 9,316 10, U CA San Diego ,533 50,301 33, ,096 61, ,810 5,831 10,705 1,391 7 U CA San Francisco , , , , Stanford University , ,194 54,140 8,270 20, ,312 4,906 8, U of Pennsylvania ,852 14,247 23, , ,006 3,483 31,948 4, University of Minnesota ,011 41,659 35,028 13,528 12, ,099 8,201 14,792 0 Total, 1st 10 institutions... 5,983, , , , ,040 3,809,101 80, ,398 35, Pennsylvania State U , ,823 55,196 22,550 10, ,925 12,530 19,577 5, U CA Berkeley , ,984 79,469 6,513 6, ,525 8,244 44,406 6, Cornell University ,828 53,444 61,239 3,790 19, ,381 6,425 14, MA Institute of Tech , ,795 92,608 21,390 39,664 77,062 1,431 6,152 48, U CA Davis ,396 41,928 21,329 30,580 3, ,573 1,378 13,247 3, Texas A&M University , ,227 25,848 80,789 10, ,264 2,898 7,543 2, Washington University ,642 6,915 12,940 4,615 8, ,713 2,225 4, U of IL Urbana-Champaign , ,108 47,013 33,855 58, ,062 9,320 23,922 5, Ohio State University ,652 96,297 23,906 8,746 24, ,406 5,719 30,546 3, Baylor Col of Medicine , , Total, 1st 20 institutions... 10,176,333 1,713, , , ,348 6,008, , , , Duke University ,133 16,530 13,377 8,406 5, ,897 3,862 14, Harvard University ,107 4,931 35,170 13,765 4, ,884 3,964 31, University of Arizona ,128 52,486 72,131 10,549 9, ,319 3,403 16, University of Colorado ,472 33,021 71,362 51,590 7, ,571 9,635 9,274 1, University of Florida ,312 54,908 23,388 5,878 8, ,524 6,320 11, Columbia U in City of NY ,497 16,702 34,612 46,375 6, ,793 3,469 5, University of Pittsburgh ,792 15,614 13, , ,753 4,791 10,570 1, U of Southern California ,597 49,865 10,030 14,440 66, ,096 5,013 7,666 1, Yale University ,514 7,309 20,108 2,041 5, ,749 4,720 1, Georgia Institute of Tech , ,581 21,086 16,924 43,810 7,108 4,128 5,512 6,384 Total, 1st 30 institutions... 13,687,418 2,166,427 1,177, , ,768 8,245, , , , U of NC Chapel Hill , ,161 12,615 8, ,300 4,282 25, NC State University ,259 81,949 25,574 16,099 17, ,775 1,238 8,968 2, U TX at Austin , ,119 58,845 24,932 39,806 41,544 4,336 13,898 1, University of Georgia ,298 7,249 10,870 14,687 7, ,396 8,421 34, Louisiana State U System ,911 44,813 17,231 32,636 4, , , U of MD at College Park ,383 75,574 47,085 9,464 22,736 47,443 3,873 61, Michigan State University ,946 20,845 45,432 2,618 5, ,803 5,401 21, Indiana University ,899 3,170 34,958 3,927 4, ,353 9,652 34,401 19, Northwestern University ,933 47,799 22, , ,035 2,894 9,523 3, U of Iowa ,348 24,772 15,080 2,353 1, ,891 4,201 7, Total, 1st 40 institutions... 16,433,075 2,582,717 1,472, , ,117 9,743, , , , Purdue University ,917 78,561 20,461 4,011 12, ,206 4,010 18, U of MD Baltimore , , Emory University , , ,105 1,340 4, Rutgers the State U NJ ,793 33,575 26,867 20,511 11, ,092 8,420 27,826 1, University of Rochester ,261 49,396 12, , ,659 10, U of IL Chicago ,098 20,646 9,107 1,699 5, ,420 5,832 10,977 8, U of Alabama Birmingham ,702 5,441 3, ,201 5, U TX SW Med Ctr at Dallas , , VA Polytech Inst & St U ,323 80,349 9,298 15,734 4,581 94,248 2,015 10, California Inst of Tech ,085 46, ,479 10,771 4,762 33, ,975 Total, 1st 50 institutions... 18,753,634 2,897,062 1,672, , ,131 11,320, , , ,
167 Table B-39. R&D expenditures at universities and colleges, by science and engineering field: fiscal year 2001 Page 2 of 5 Engi- Physical Environ- Math & Life Psy- Social Other Institution and ranking Total neering sciences mental computer sciences chology sciences sciences sciences sciences 51 U TX MD Anderson Cncr Ctr.. 212, , , , University of Kentucky ,721 29,767 7, , , ,556 12, Case Western Reserve U ,253 22,050 6, , ,951 10, University of Utah ,597 25,565 14,605 4,989 17, ,721 2,271 2, University of Chicago , ,192 4,526 2, ,810 2,620 3, University of Cincinnati ,895 26,114 4, , ,386 2, New York University , , , ,633 11,233 7, SUNY at Buffalo ,829 29,725 9,189 1,283 8, ,859 3,360 5,041 2, Vanderbilt University ,504 15,103 9, ,059 3,601 6, U CA Irvine ,866 18,035 17,693 3,982 7, ,618 3,768 8,539 2,410 Total, 1st 60 institutions... 20,704,892 3,063,421 1,784, , ,859 12,810, , , , Iowa State University ,196 44,099 10,536 4,370 10,026 87, ,125 8, Mt Sinai Sch Med , , Wayne State University ,984 10,963 14, , ,180 2,749 5, U of Missouri Columbia ,782 22,637 4,956 1,204 1, ,701 5,274 14, Boston University ,031 18,219 13,499 3,106 2, ,512 4,879 2,074 8, U of South Florida ,550 19,063 2,328 18, ,446 10,092 4, SUNY at Stony Brook ,487 15,110 25,283 17,199 7,977 95,885 3,464 3, University of Connecticut ,366 28,225 7,174 9,127 2, ,474 6,608 8,382 2, U Med & Dent of NJ , , U of Tennessee System ,898 36,580 9,579 6,736 10,852 90, ,834 1,476 Total, 1st 70 institutions... 22,412,549 3,258,317 1,872, , ,611 14,023, , , , Colorado State University ,144 28,708 8,564 15,671 2,481 89,852 3,004 3,068 9, U of Nebraska at Lincoln ,520 24,584 9,965 8,347 6,546 79,194 5,802 9,662 13, Univ of Hawaii at Manoa ,976 8,955 26,405 47, , ,763 10, University of New Mexico ,619 24,737 6,611 1,961 3,081 62,419 7,168 6,180 44, University of Kansas ,467 15,850 6,269 10,900 4, ,210 1,474 5,726 7, Oregon State University ,925 17,005 4,783 36,295 2,871 89, ,220 1, University of Miami ,772 2,089 2,331 30, ,753 7,749 2, University of Virginia ,547 25,838 11,538 5,189 4,464 98,876 3, Princeton University ,411 46,947 29,244 13,293 10,601 26,431 3,892 19, University of Oklahoma ,695 14,026 13,690 29,571 3,323 66,128 11,937 10,020 0 Total, 1st 80 institutions... 23,956,625 3,467,056 1,991,851 1,134, ,432 14,806, , , , Yeshiva University , , Mississippi State U ,939 44,736 5,282 6,298 3,093 79, ,950 2, Rockefeller U, The , , , , Carnegie Mellon U ,882 40,635 9,311 3,373 63,592 11,757 6,460 8, Oregon Health & Science U , ,290 5, UT Houston Hlth Sci Ctr , , Clemson University ,885 50,307 8,047 1,021 3,614 50, ,718 1, Utah State University ,359 59,162 3,475 8,522 1,569 34,166 1,782 3,513 9, Arizona State University ,763 42,485 22,231 9,798 5,159 15,307 6,399 10,114 7, Med U of South Carolina , , Total, 1st 90 institutions... 25,285,165 3,704,381 2,044,686 1,163, ,128 15,655, ,178 1,012, , U CA Santa Barbara ,372 35,393 24,757 22,963 10,721 4,334 5,912 10,531 1, U TX Hlth Sci Ctr San Ant , , Florida State University ,817 11,889 42,586 14,893 6,726 12,834 5,922 18, U of MA Worcester , , U of Alaska Fairbanks ,195 7,344 13,599 30,488 16,300 16, , U of South Carolina ,973 25,573 16,499 16,449 3,450 27,153 3,596 12,537 4, Dartmouth College ,096 14,137 3,834 1,570 4,708 74,490 4, , Washington State U ,937 15,366 5,715 2, , ,535 1, Auburn University ,347 31,568 4, , ,131 8, Tufts University ,806 6,263 2, ,314 84,659 3,357 6,291 0 Total, 1st 100 institutions... 26,391,083 3,851,914 2,158,756 1,254,715 1,023,212 16,231, ,155 1,074, ,
168 Table B-39. R&D expenditures at universities and colleges, by science and engineering field: fiscal year 2001 Page 3 of 5 Engi- Physical Environ- Math & Life Psy- Social Other Institution and ranking Total neering sciences mental computer sciences chology sciences sciences sciences sciences 101 U TX Med Br at Galveston ,722 1, , Tulane University... 99,761 7,925 3,276 1, , ,998 5, Georgetown University... 99, , , , Virginia Commonwealth U... 99,180 3,279 5, ,501 3,096 1, Wake Forest University... 98, , , U of MA Amherst... 97,976 18,811 20,876 4,537 14,700 29,894 5,360 2, U CA Riverside... 94,455 11,528 7,168 3,849 1,647 60,284 1,742 5,850 2, Kansas State University... 94,030 15,099 9, ,705 60,229 1,151 3,530 1, Brown University... 91,636 14,337 9,546 5,499 12,280 42,396 2,666 4, Woods Hole Oceanogr Inst... 91,029 19, , Total, 1st 110 institutions... 27,359,443 3,943,869 2,222,526 1,342,798 1,055,012 16,874, ,662 1,100, , Oklahoma State University... 90,311 18,589 6,105 1,728 1,854 50, ,630 2, Thomas Jefferson U... 88, , U of New Hampshire... 87,879 19,101 2,872 40,098 1,004 15,501 1,197 5,733 2, New Mexico State Univ... 86,963 50,500 5,851 3,913 3,912 20, , Medical Col of Wisconsin... 83, , U of Central Florida... 79,287 25,575 16,754 9, ,329 1,247 5,902 15, U of Arkansas Main... 78,303 12,353 7,002 2,189 1,696 51, , University of Delaware... 77,491 25,360 12,830 8,252 2,983 21,871 1,364 4, University of Vermont... 75,597 1,738 1, ,807 66,357 1, , George Washington U... 73,805 11,172 2, ,654 36, ,523 1,386 Total, 1st 120 institutions... 28,181,872 4,108,257 2,278,282 1,408,953 1,083,532 17,312, ,201 1,136, , University of Louisville... 72,857 6,588 2, ,292 2,130 3, West Virginia University... 71,311 17,269 4,047 4, , , Rush University... 70, ,935 1, SUNY at Albany... 70, ,541 7,226 2,272 41,335 2,213 8, Texas Tech University... 69,918 15,751 6,028 11,425 1,704 31, , Montana St U Bozeman... 69,593 10,477 11, , ,334 2, University of Idaho... 67,496 12,122 2,496 4,284 1,557 42, ,764 1, North Dakota State U... 64,882 1,513 3, ,217 48, ,549 3, U CA Santa Cruz... 64,253 2,259 31,117 13,048 2,883 10, , U of Maine... 64,070 8,805 5,996 19,969 1,487 23, , Total, 1st 130 institutions... 28,866,590 4,183,041 2,354,216 1,470,331 1,096,499 17,722, ,847 1,168, , U of Nebraska Med Ctr... 60, , Temple University... 60,182 1,814 6, ,228 11,604 2, U of Nevada Reno... 59,229 5,996 5,637 6, ,445 1,217 1,694 5, San Diego St University... 58,332 7,843 3,744 2,952 3,071 22,063 6,714 5,142 6, Brandeis University... 52, , ,680 22,902 1,621 21, Medical Col of Georgia... 52, , U of Arkansas Medical Sci... 51, , University of Houston... 51,567 19,320 9,405 1,026 4,052 11,804 3,445 2, U of Rhode Island... 50,835 5, , ,995 4,408 1,042 5, University of Notre Dame... 46,096 11,222 13, ,852 8,114 1,729 1,226 8,007 Total, 1st 140 institutions... 29,410,456 4,234,593 2,399,775 1,505,260 1,109,216 18,029, ,585 1,204, , Rensselaer Polytech Inst... 45,010 34,069 5,519 1,774 2, Florida International U... 44,291 19,211 1,999 6,412 2,095 5, , NJ Inst of Technology... 44,177 31,572 6, , , U of Alabama Huntsville... 43,731 16,671 9,769 5,772 9,600 1, S Illinois U Carbondale... 43,207 9,179 1, , ,750 2, Rice University... 42,675 9,972 12,701 1,101 11,295 6, Syracuse University... 42,476 8,941 4,890 1,047 5,430 2,417 1,254 5,509 12, University of Wyoming... 41,632 3,644 3,069 6, , ,572 5, University of Dayton... 41,343 38,997 1, Naval Postgrad School... 40,889 i 10,876 i 2,617 i 9,854 i 8,341 i 0 i 0 i 5,561 i 3,640 i Total, 1st 150 institutions... 29,839,887 4,417,725 2,450,161 1,538,663 1,153,011 18,092, ,605 1,228, ,
169 Table B-39. R&D expenditures at universities and colleges, by science and engineering field: fiscal year 2001 Page 4 of 5 Engi- Physical Environ- Math & Life Psy- Social Other Institution and ranking Total neering sciences mental computer sciences chology sciences sciences sciences sciences 151 TX A&M U Sys Hlth Sci Ctr... 40, , U Mississippi, All Camp... 39,552 5,786 13, , ,118 3, Georgia State University... 38, , ,353 15,962 6,586 10, Loyola U of Chicago... 37, , ,351 1,615 2, University of Oregon... 36, ,911 1,685 2,816 17,783 4,373 2, C R Drew U of Med & Sci... 36, , U MD Ctr for Environ Sci... 36, , Col of William & Mary... 35, ,728 24,956 1,139 1, , Northeastern University... 34,467 13,845 9, ,647 6,165 1,579 1, Univ of Montana, The... 33, , , ,242 2,739 Total, 1st 160 institutions... 30,210,478 4,437,771 2,495,014 1,603,666 1,161,512 18,278, ,695 1,252, , University of Alabama, The... 33,133 19,965 4,099 1, ,721 1,917 1, George Mason University... 32,881 9, ,399 1,733 4,448 1,871 7, MCP Hahnemann U... 32, , U MD Biotechnology Inst... 32, , , Saint Louis University... 32, , U of LA Lafayette... 32,073 6, ,694 18, ,090 1, Wright State University... 32,033 4,085 1, ,242 19,406 1, SUNY Hlth Sci Ctr Brklyn... 31,626e 0e 0e 0e 0e 31,626e 0e 0e 0e 169 Boston College... 30, , ,590 2, , Howard University... 30,148 2,425 2, ,255 19,534 1,693 1, Total, 1st 170 institutions... 30,530,502 4,479,544 2,511,915 1,623,018 1,189,844 18,465, ,016 1,269, , Desert Research Institute... 29, , , U of MD Baltimore County... 29,641 5,907 5,590 10,412 1,258 3, , Michigan Tech University... 29,613 19,688 1,916 1,132 1,083 4, Univ of Memphis, The... 29,445 3, ,753 1,127 3,241 9,788 5,551 1, Lehigh University... 29,058 23,902 3, U of Missouri Rolla... 28,799 21,610 5,278 1, NM Inst Mining & Tech... 28,392 15,846 1,959 7, , SUNY Col Env Sci & Frstry... 27,854 9,749e 2,228e 2,785e 0e 12,813e 0e 279e 0e 179 Drexel University... 27,698 22,767 2, , Ohio University... 27,146 11,876 4, ,377 1, Total, 1st 180 institutions... 30,817,845 4,614,441 2,539,576 1,674,674 1,195,959 18,501, ,204 1,278, , U of Nevada Las Vegas... 27,008 4,732 4,532 11, , , Loma Linda University... 26,451 i 0 i 0 i 0 i 0 i 23,324 i 0 i 897 i 2,230 i 183 Eastern VA Med School... 26, , Jackson State University... 25, ,743 3,523 6,455 4,841 1,636 1,016 3, Florida Atlantic U... 25,111 11,233 1,053 2,593 1,530 4,386 1,591 2, Old Dominion University... 24,659 13,122 1,769 3,692 1,565 3, New York Medical College... 24, , U PR Med Sci Campus... 23, , Florida A&M University... 23,865 3,743 1,851 2,324 1,955 13, Colorado School of Mines... 23,654 16,288 5, Total, 1st 190 institutions... 31,068,702 4,664,061 2,558,217 1,699,476 1,208,891 18,628, ,359 1,285, ,
170 Table B-39. R&D expenditures at universities and colleges, by science and engineering field: fiscal year 2001 Page 5 of 5 Engi- Physical Environ- Math & Life Psy- Social Other Institution and ranking Total neering sciences mental computer sciences chology sciences sciences sciences sciences 191 U of WI-Milwaukee... 23,492 4,260 4,608 3,699 1,367 3, , Unif Svcs U of Hlth Sci... 23, , San Jose State University... 22,709 1,776 3,146 7,968 1,605 1,007 5, , University of Akron... 22,266 7,175 8, , U TX at El Paso... 21,889 7,321 1,483 5,467 1,200 4, U of MA Lowell... 20,656 6,443 5,208 1, ,005 1,142 1, U Southern Mississippi... 20,286 1,010 4,914 5, , , CUNY Hunter College... 19, , ,232 2,899 2, South Dakota State U... 19,717 1, , U of North Dakota... 19,692 9, , , ,549 Total, 1st 200 institutions... 31,282,620 4,703,327 2,592,336 1,727,165 1,214,816 18,695, ,983 1,303, ,990 Total, all other sampled institutions... 1,440, , ,028 99,662 96, ,563 50, ,086 63,665 1 Johns Hopkins University includes the Applied Physics Laboratory. KEY: e = estimated i = imputed NOTE: Because of rounding, detail may not add to totals. SOURCE: National Science Foundation/Division of Science Resources Statistics, Survey of Research and Development Expenditures at Universities and Colleges, Fiscal Year
171 Table B-40. Federally financed R&D expenditures at universities and colleges, by science and engineering field: fiscal year 2001 Page 1 of 5 Engi- Physical Environ- Math & Life Psy- Social Other Institution and ranking Total neering sciences mental computer sciences chology sciences sciences sciences sciences Total, all institutions... 19,190,873 2,843,770 1,971,510 1,182, ,555 11,178, , , ,130 1 Johns Hopkins U , , ,309 34,923 92, ,565 3,691 6,613 6,583 2 U of Washington ,103 30,547 20,482 66,244 9, ,001 7,998 1, University of Michigan ,117 91,611 20,839 3,232 8, ,732 5,701 53, Stanford University ,468 92,036 48,502 5,926 17, ,486 3,880 2, U of Pennsylvania ,996 10,666 21, , ,706 3,050 8,997 2,060 6 U CA San Diego ,276 24,190 25,428 71,006 50, ,951 4,931 3, Columbia U in City of NY ,928 13,852 33,143 44,889 6, ,271 3,268 4, U CA Los Angeles ,858 28,438 31,178 8,561 9, ,320 7,251 4, University of Colorado ,643 24,704 64,575 47,056 6, ,083 8,097 7,140 1, MA Institute of Tech , ,226 89,881 18,652 27,496 59,054 1,326 1,840 3,844 Total, 1st 10 institutions... 4,034, , , , ,615 2,178,169 49,193 94,410 14, U of WI-Madison ,009 50,565 32,878 21,731 9, ,022 16,715 15, Harvard University ,414 4,156 31,346 12,415 3, ,400 3,648 13, Washington University ,928 4,247 9,644 2,508 6, ,345 1,864 3, U CA San Francisco , , , University of Pittsburgh ,571 7,823 11, , ,847 4,540 5,402 1, University of Minnesota ,289 25,585 26,233 6,566 9, ,638 5,269 3, Yale University ,702 5,887 17,867 1,836 5, ,209 3, U of Southern California ,207 37,144 6,910 10,499 63, ,682 3,895 2, Pennsylvania State U , ,576 36,777 10,656 5,440 67,800 6,864 6,220 1, Cornell University ,466 29,776 44,655 1,722 13, ,510 1,942 3,894 0 Total, 1st 20 institutions... 6,717, , , , ,045 4,061,487 97, ,855 17, Baylor Col of Medicine , , U of NC Chapel Hill , ,755 7,640 5, ,779 3,871 18, Duke University ,109 12,075 10,799 4,719 4, ,792 3,184 11, U CA Berkeley ,080 54,554 52,604 3,515 5,207 82,235 4,239 5, University of Arizona ,484 31,493 40,321 6,523 6, ,356 1,705 7, U of IL Urbana-Champaign ,316 60,525 30,747 11,765 39,467 39,942 5,754 4,127 2, U TX at Austin ,184 72,061 42,500 10,355 31,753 27,681 3,735 6, U of Alabama Birmingham ,625 3,532 2, ,745 5, California Inst of Tech ,554 41, ,362 10,319 4,687 31, , Emory University , , ,073 1, Total, 1st 30 institutions... 8,748,153 1,248, , , ,540 5,272, , ,225 21, University of Rochester ,945 41,036 11, , ,254 6, Ohio State University ,092 25,802 13,936 5,287 2,913 94,278 4,068 14, Case Western Reserve U ,852 16,639 5, , , Northwestern University ,129 28,746 15, , ,710 2,305 3, University of Chicago , ,664 4,148 2, ,766 2,588 2, U of Iowa ,249 9,489 12, , ,891 3,423 1, U CA Davis ,937 14,571 14,233 12,924 2, , ,539 1, Boston University ,771 16,275 12,961 2,960 2, ,993 4,773 1,504 8, Texas A&M University ,382 31,514 11,292 55,728 6,678 40,985 1,761 1, Vanderbilt University ,230 11,750 8, ,681 2,643 4, Total, 1st 40 institutions... 10,305,306 1,444,017 1,130, , ,113 6,316, , ,494 31, U of MD at College Park ,515 39,841 32,982 7,068 13,336 16,447 2,677 33, Georgia Institute of Tech ,836 94,589 9,894 7,941 20,557 3,335 1,937 2,587 2, University of Florida ,744 25,759 14,446 2,905 5,188 85,415 4,233 1, U TX SW Med Ctr at Dallas , , New York University , , , ,365 9,219 3, University of Cincinnati ,049 12,244 1, , , University of Utah ,253 15,283 10,502 3,761 11,839 83,618 1, U of IL Chicago ,109 10,384 5, ,784 96,837 3,475 2,694 1, University of Virginia ,868 19,932 9,901 4,382 3,540 81,774 2, Indiana University , ,231 1,174 2,248 82,786 6,380 5, Total, 1st 50 institutions... 11,616,178 1,662,651 1,237, , ,058 7,112, , ,832 37,
172 Table B-40. Federally financed R&D expenditures at universities and colleges, by science and engineering field: fiscal year 2001 Page 2 of 5 Engi- Physical Environ- Math & Life Psy- Social Other Institution and ranking Total neering sciences mental computer sciences chology sciences sciences sciences sciences 51 Michigan State University ,359 6,970 28, ,874 59,016 3,853 9, University of Miami ,803 1,463 2,217 27, ,619 7,625 2, Oregon Health & Science U , ,328 5, University of New Mexico ,505 20,384 5,570 1,825 2,675 41,371 5,050 1,942 30, Mt Sinai Sch Med , , Yeshiva University , , U CA Irvine ,735 7,433 12,331 2,660 4,893 67,873 3,115 2, Colorado State University ,308 19,973 6,900 13,143 1,624 48,151 2,839 1,736 6, U of MD Baltimore... 99, , Purdue University... 98,151 30,109 13,134 2,683 4,865 41,501 2,262 3, Total, 1st 60 institutions... 12,678,945 1,748,983 1,306, , ,129 7,863, , ,207 75, Univ of Hawaii at Manoa... 97,716 5,825 13,645 30, , ,074 6, Carnegie Mellon U... 97,463 25,672 7, ,379 8,271 4,336 6, SUNY at Buffalo... 96,595 17,080 4, ,694 67,588 1,463 2, NC State University... 95,875 32,403 12,176 5,239 7,955 34, , Louisiana State U System... 94,625 19,823 10,861 10, , , U TX MD Anderson Cncr Ctr.. 94, , ,058 88, Georgetown University... 93, , , , SUNY at Stony Brook... 93,265 7,084 16,748 10,408 4,839 50,667 2, UT Houston Hlth Sci Ctr... 88, , University of Kentucky... 86,239 13,318 5, ,954 60, ,134 3,063 Total, 1st 70 institutions... 13,616,947 1,870,188 1,385, , ,724 8,434, , ,602 87, U Med & Dent of NJ... 86, , Oregon State University... 84,854 10,654 3,908 30,081 2,197 36, , U of MA Worcester... 79, , Wayne State University... 79,448 4,225 7, ,031 1,805 1, Princeton University... 78,620 23,363 18,987 7,812 5,979 17,546 2,195 2, U of Tennessee System... 78,611 14,608 7,486 4,865 6,091 44, , Wake Forest University... 78, , VA Polytech Inst & St U... 77,384 32,817 4,135 12,693 2,756 22,598 1,210 1, Rutgers the State U NJ... 77,156 12,271 13,166 8,734 4,945 30,684 3,029 4, U CA Santa Barbara... 76,828 23,566 19,170 13,227 7,528 3,127 4,221 5, Total, 1st 80 institutions... 14,413,376 1,991,692 1,460, , ,940 8,895, , ,206 89, Woods Hole Oceanogr Inst... 75,670 15, , University of Kansas... 74,494 7,895 2,736 2, ,887 1,205 1,877 2, Utah State University... 74,251 48,154 2,658 3,048 1,155 14,796 1,131 1,804 1, Tufts University... 71,669 4,217 2, ,031 61,006 1, U TX Hlth Sci Ctr San Ant... 71, , University of Connecticut... 70,013 5,640 3,653 5, ,914 3,910 2, Dartmouth College... 69,844 10,294 2, ,673 47,443 3, , U of Missouri Columbia... 68,435 8,446 2, ,950 3,000 4, University of Georgia... 66,913 1,065 3,377 5,628 1,300 49,294 3,585 2, Mississippi State U... 65,493 30,887 1,611 5, , ,431 1,388 Total, 1st 90 institutions... 15,121,311 2,123,658 1,481, , ,297 9,314, , ,546 96, Thomas Jefferson U... 64, , U TX Med Br at Galveston... 64, , Medical Col of Wisconsin... 64, , Iowa State University... 62,024 16,995 5,811 2,640 3,044 25, , New Mexico State Univ... 61,124 39,664 5,255 2,972 3,100 8, , Med U of South Carolina... 60, , University of Oklahoma... 60,264 3,661 7,654 13, ,057 4,426 2, U of South Florida... 58,826 6, , ,731 3, Brown University... 58,367 9,239 5,136 3,756 7,769 29,599 1,868 1, Virginia Commonwealth U... 57,315 1,797 3, ,836 2, Total, 1st 100 institutions... 15,733,340 2,202,273 1,509, , ,713 9,744, , ,850 97,
173 Table B-40. Federally financed R&D expenditures at universities and colleges, by science and engineering field: fiscal year 2001 Page 3 of 5 Engi- Physical Environ- Math & Life Psy- Social Other Institution and ranking Total neering sciences mental computer sciences chology sciences sciences sciences sciences 101 Florida State University... 57,075 7,099 19,716 10,675 3,017 6,016 3,907 6, Arizona State University... 56,616 18,454 9,700 8,657 3,102 8,385 4,251 1,814 2, Tulane University... 55,669 3,531 1, , ,345 3, Rockefeller U, The... 55, , ,451 51, U of Alaska Fairbanks... 55,287 5,095 6,590 27, , , U of South Carolina... 51,983 15,061 8,495 5,827 1,679 14,110 2,416 4, George Washington U... 51,757 8,371 2, ,644 23, , U of MA Amherst... 49,576 6,605 11,495 2,426 9,948 14,740 3, University of Vermont... 48, ,253 43, Washington State U... 48,660 8,622 4,589 2, , , Total, 1st 110 institutions... 16,264,135 2,276,015 1,577, , ,065 9,991, , , , Clemson University... 48,560 23,994 4, , , SUNY at Albany... 46, ,036 3, ,658 1,438 4, U of New Hampshire... 45,223 7,377 1,908 25, , , U of Nebraska at Lincoln... 43,877 5,783 6,021 3,875 1,167 20,905 3,666 1, U of Rhode Island... 43,161 4, , ,705 3, , University of Delaware... 41,830 13,213 9,118 5,955 1,786 7,151 1,113 3, Temple University... 41,643 1,391 6, ,133 7, Naval Postgrad School... 40,121 i 10,672 i 2,528 i 9,669 i 8,341 i 0 i 0 i 5,497 i 3,414 i 119 Auburn University... 40,097 15,112 2, , ,129 4, Rush University... 37, , Total, 1st 120 institutions... 16,692,619 2,358,492 1,612, , ,479 10,160, , , , Rice University... 35,682 7,007 10,359 1,101 10,836 5, Montana St U Bozeman... 34,857 6,353 9, , , U of Arkansas Medical Sci... 34, , University of Dayton... 34,102 32,310 1, Kansas State University... 33,998 5,500 8, , , University of Oregon... 32, ,766 1,461 2,548 16,016 4,048 1, U of Nevada Reno... 31,386 3,710 4,344 4, , U of Alabama Huntsville... 30,625 13,049 7,157 4,650 4, U Mississippi, All Camp... 30,108 4,930 11, , ,861 2, Syracuse University... 30,036 5,848 4, ,242 2,163 1,250 3,418 8,723 Total, 1st 130 institutions... 17,019,864 2,437,336 1,677, , ,486 10,277, , , , Brandeis University... 30, , ,631 17,263 1,474 5, University of Notre Dame... 29,801 7,549 12, ,703 5,446 1, West Virginia University... 29,440 7,567 2,518 2, , U CA Santa Cruz... 29,201 1,457 11,894 6,209 2,041 6, Saint Louis University... 28, , Howard University... 27,848 1,981 1, ,878 18,240 1,693 1, C R Drew U of Med & Sci... 27, , University of Idaho... 26,548 6,210 1,426 2,171 1,210 14, Loyola U of Chicago... 26, , ,694 1,415 1, George Mason University... 25,992 7, ,352 1,476 2,910 1,728 4,598 0 Total, 1st 140 institutions... 17,300,731 2,469,768 1,713, , ,143 10,433, , , , Rensselaer Polytech Inst... 25,894 18,391 3,522 1,218 2, U CA Riverside... 25,713 3,090 5,088 1, ,700 1,534 1, Oklahoma State University... 25,636 7,051 2, , ,281 1, University of Louisville... 25,116 2,240 1, ,988 1, Florida International U... 23,940 10,384 1,080 3,466 1,132 3, , U of Maine... 23,873 2,099 4,739 8, , U of MD Baltimore County... 23,695 3,488 4,990 9,072 1,016 3, , San Diego St University... 23,621 1,840 2,275 1,783 1,433 11,931 3, Northeastern University... 23,532 8,842 7, ,262 4,690 1, U of Arkansas Main... 23,172 6,250 4, , Total, 1st 150 institutions... 17,544,923 2,533,443 1,750,499 1,026, ,335 10,518, , , ,
174 Table B-40. Federally financed R&D expenditures at universities and colleges, by science and engineering field: fiscal year 2001 Page 4 of 5 Engi- Physical Environ- Math & Life Psy- Social Other Institution and ranking Total neering sciences mental computer sciences chology sciences sciences sciences sciences 151 Texas Tech University... 22,967 5,249 1,864 5, , MCP Hahnemann U... 22, , SUNY Hlth Sci Ctr Brklyn... 22,860e 0e 0e 0e 0e 22,860e 0e 0e 0e 154 Jackson State University... 22, ,318 3,123 5,722 4,292 1, , U of Nebraska Med Ctr... 22, , Florida A&M University... 22,477 2,465 1,754 2,324 1,955 13, U of Central Florida... 22,342 3,799 5,363 2, ,669 1,146 2,701 3, University of Alabama, The... 22,183 12,955 2,585 1, ,737 1,877 1, Desert Research Institute... 22, , , University of Houston... 21,876 5,316 4, ,740 6,830 1, Total, 1st 160 institutions... 17,769,837 2,563,672 1,770,214 1,058, ,207 10,624, , , , Medical Col of Georgia... 21, , Loma Linda University... 20,494 i 0 i 0 i 0 i 0 i 17,367 i 0 i 897 i 2,230 i 163 Drexel University... 20,159 16,665 1, , Boston College... 20, , ,695 1, , University of Wyoming... 20,017 2,201 2,180 3, , , U PR Med Sci Campus... 19, , Univ of Montana, The... 19, , , , NJ Inst of Technology... 18,530 12,729 4, , TX A&M U Sys Hlth Sci Ctr... 18, , New York Medical College... 18, , Total, 1st 170 institutions... 17,965,631 2,595,279 1,785,133 1,063, ,192 10,744, , , , Morehouse School of Med... 18, , U Southern Mississippi... 18,061 1,009 3,620 5, , , Michigan Tech University... 17,620 11,300 1, , U TX at El Paso... 16,167 4,803 1,273 4,894 1,167 2, U of North Dakota... 15,743 7, , , U of Nevada Las Vegas... 15,681 2,110 1,297 9, , Wright State University... 15,417 1,682 1, ,415 10, Col of William & Mary... 15, ,380 9,213 1, Old Dominion University... 15,280 9,440 1,013 2, North Dakota State U... 15, , , ,361 1,581 Total, 1st 180 institutions... 18,128,222 2,633,835 1,801,087 1,097, ,620 10,794, , , , Clark Atlanta University... 14,354 2,062 3, , , San Jose State University... 14, ,954 4, , Florida Atlantic U... 14,099 8, ,865 1,436 1, OGI Schl Sci & Eng OHSU... 14, ,205 2,719 7, Lehigh University... 13,961 9,968 2, Georgia State University... 13, , ,300 3,456 1, Catholic U of America... 13,308 1,444 10, NM Inst Mining & Tech... 13,255 7, , , CUNY City College... 13,022 2,786 4, ,539 2, Ohio University... 12,898 6,219 2, , Total, 1st 190 institutions... 18,265,067 2,673,996 1,833,669 1,108, ,324 10,814, , , ,
175 Table B-40. Federally financed R&D expenditures at universities and colleges, by science and engineering field: fiscal year 2001 Page 5 of 5 Engi- Physical Environ- Math & Life Psy- Social Other Institution and ranking Total neering sciences mental computer sciences chology sciences sciences sciences sciences 191 Colorado School of Mines... 12,314 6,169 5, U of LA Lafayette... 12,130 2, , U MD Ctr for Environ Sci... 12, , NC A&T State University... 11,937 8, , U of Missouri Rolla... 11,929 8,963 2, Brigham Young University... 11,659 4,941 2, , Eastern VA Med School... 11, , Med Col of Ohio... 11, , Portland State University... 11,341 1, ,534 1, , U of MA Lowell... 11,196 2,409 4,066 1, , Total, 1st 200 institutions... 18,382,429 2,708,293 1,848,616 1,124, ,666 10,853, , , ,538 Total, all other sampled institutions , , ,894 58,623 51, ,002 40,051 52,916 21,592 1 Johns Hopkins University includes the Applied Physics Laboratory. KEY: e = estimated i = imputed NOTE: Because of rounding, detail may not add to totals. SOURCE: National Science Foundation/Division of Science Resources Statistics, Survey of Research and Development Expenditures at Universities and Colleges, Fiscal Year
176 Table B-41. Non-Federal R&D expenditures at universities and colleges, by science and engineering field: fiscal year 2001 Page 1 of 5 Engi- Physical Environ- Math & Life Psy- Social Other Institution and ranking Total neering sciences mental computer sciences chology sciences sciences sciences sciences Total, all institutions... 13,532,205 2,155, , , ,512 8,010, , , ,525 1 U CA Los Angeles ,943 18,416 36,992 6,213 7, ,035 3,437 30,684 7,501 2 U of WI-Madison ,134 32,087 16,249 7,309 5, ,791 6,123 20, U CA Davis ,459 27,357 7,096 17,656 1, , ,708 2,422 4 Texas A&M University ,659 92,713 14,556 25,061 3, ,279 1,137 6,223 2,169 5 U CA San Francisco , , , , U CA Berkeley ,193 74,430 26,865 2,998 1,688 83,290 4,005 38,700 6,217 7 Ohio State University ,560 70,495 9,970 3,459 21, ,128 1,651 16,057 2,974 8 University of Florida ,568 29,149 8,942 2,973 3, ,109 2,087 10, U CA San Diego ,257 26,111 7,757 48,090 11, , ,943 1, Pennsylvania State U ,115 73,247 18,419 11,894 4,691 81,125 5,666 13,357 3,716 Total, 1st 10 institutions... 2,576, , , ,653 61,004 1,590,256 25, ,136 26, University of Georgia ,385 6,184 7,493 9,059 6, ,102 4,836 32, University of Michigan ,406 51,876 4,815 2,146 5, ,351 5,348 22, NC State University ,384 49,546 13,398 10,860 9, , ,616 1, Cornell University ,362 23,668 16,584 2,068 5, ,871 4,483 10, University of Minnesota ,722 16,074 8,795 6,962 2, ,461 2,932 11, U of IL Urbana-Champaign ,547 43,583 16,266 22,090 18,992 69,120 3,566 19,795 2, Louisiana State U System ,286 24,990 6,370 21,971 3, , , University of Arizona ,644 20,993 31,810 4,026 2,486 97,963 1,698 8, Georgia Institute of Tech , ,992 11,192 8,983 23,253 3,773 2,191 2,925 3, Rutgers the State U NJ ,637 21,304 13,701 11,777 7,052 75,408 5,391 23,585 1,419 Total, 1st 20 institutions... 4,450, , , , ,354 2,598,035 56, ,731 35, Duke University ,024 4,455 2,578 3, , , Purdue University ,766 48,452 7,327 1,328 7,460 74,705 1,748 15, U of Washington ,523 19,082 9,302 7,204 1, ,531 1,318 8, Michigan State University ,587 13,875 16,513 1,973 2, ,787 1,548 11, Baylor Col of Medicine , , Indiana University ,118 2,568 17,727 2,753 2,280 66,567 3,272 28,563 19, U of MD Baltimore , , VA Polytech Inst & St U ,939 47,532 5,163 3,041 1,825 71, , MA Institute of Tech ,176 46,569 2,727 2,738 12,168 18, ,312 44, University of Kentucky ,482 16,449 2, , ,422 8,964 Total, 1st 30 institutions... 5,898,042 1,008, , , ,660 3,563,726 66, , , U of MD at College Park ,868 35,733 14,103 2,396 9,400 30,996 1,196 28, Washington University ,714 2,668 3,296 2,107 1, , , Johns Hopkins U ,505 6,820 2,105 1,654 1,115 88, ,085 15, U TX MD Anderson Cncr Ctr.. 118, , , , U of Pennsylvania ,856 3,581 2, ,327 84, ,951 2, Iowa State University ,172 27,104 4,725 1,730 6,982 61, ,710 7, U of Nebraska at Lincoln ,643 18,801 3,944 4,472 5,379 58,289 2,136 8,106 12, U of South Florida ,724 12,569 1,624 7, ,715 6,275 3, U of IL Chicago ,989 10,262 3,135 1,248 1,576 74,583 2,357 8,283 6, U of Missouri Columbia ,347 14,191 2, ,751 2,274 9, Total, 1st 40 institutions... 7,055,553 1,139, , , ,801 4,340,459 82, , , U of Iowa ,099 15,283 2,380 1, , , U TX at Austin... 99,920 38,058 16,345 14,577 8,053 13, ,188 1, Northwestern University... 99,804 19,053 7, ,924 61, ,121 3, Stanford University... 98,438 19,158 5,638 2,344 3,051 60,826 1,026 6, Wayne State University... 96,536 6,738 7, , , U of Southern California... 94,390 12,721 3,120 3,941 2,911 64,414 1,118 4,670 1, University of Connecticut... 94,353 22,585 3,521 4,075 1,462 51,560 2,698 6,290 2, U TX SW Med Ctr at Dallas... 90, , SUNY at Buffalo... 90,234 12,645 5, ,572 60,271 1,897 2,807 1, Rockefeller U, The... 90, , ,218 85, Total, 1st 50 institutions... 8,010,092 1,286, , , ,087 4,978,519 92, , ,
177 Table B-41. Non-Federal R&D expenditures at universities and colleges, by science and engineering field: fiscal year 2001 Page 2 of 5 Engi- Physical Environ- Math & Life Psy- Social Other Institution and ranking Total neering sciences mental computer sciences chology sciences sciences sciences sciences 51 University of Oklahoma... 88,431 10,365 6,036 15,974 3,046 38,071 7,511 7, U of Tennessee System... 83,287 21,972 2,093 1,871 4,761 46, ,782 1, University of Kansas... 81,973 7,955 3,533 8,517 4,010 49, ,849 4, U of NC Chapel Hill... 81, ,406 4,975 3,436 62, , Mississippi State U... 81,446 13,849 3,671 1,113 2,154 56, ,519 1, University of Pittsburgh... 80,221 7,791 1, ,131 63, , U CA Irvine... 78,131 10,602 5,362 1,322 2,928 49, ,759 1, U Med & Dent of NJ... 76, , Clemson University... 75,325 26,313 3, ,925 34, ,792 1, SUNY at Stony Brook... 75,222 8,026 8,535 6,791 3,138 45, ,703 0 Total, 1st 60 institutions... 8,812,452 1,393, , , ,616 5,500, , , , Harvard University... 71, ,824 1, , , Yale University... 70,812 1,422 2, , , Princeton University... 70,791 23,584 10,257 5,481 4,622 8,885 1,697 16, University of Utah... 70,344 10,282 4,103 1,228 5,174 47, , Oregon State University... 69,071 6, , , , U CA Riverside... 68,742 8,438 2,080 2,696 1,001 47, ,348 2, Mt Sinai Sch Med... 67, , University of Rochester... 67,316 8,360 1, ,405 3, Emory University... 66, , , , Auburn University... 66,250 16,456 1, , ,002 3,645 Total, 1st 70 institutions... 9,501,753 1,468, , , ,486 5,990, , , , University of Cincinnati... 64,846 13,870 2, , ,951 2, Oklahoma State University... 64,675 11,538 4,013 1,336 1,090 38, ,349 1, Arizona State University... 62,147 24,031 12,531 1,141 2,057 6,922 2,148 8,300 5, New York University... 60, ,674 51,268 2,014 3, Kansas State University... 60,032 9,599 1, , , Colorado State University... 59,836 8,735 1,664 2, , ,332 2, Washington State U... 59,277 6,744 1, , , Univ of Hawaii at Manoa... 59,260 3,130 12,760 16, , ,689 3, U of South Carolina... 57,990 10,512 8,004 10,622 1,771 13,043 1,180 8,517 4, U of Central Florida... 56,945 21,776 11,391 6, , ,201 11,918 Total, 1st 80 institutions... 10,107,586 1,578, , , ,434 6,293, , , , University of Colorado... 56,829 8,317 6,787 4, ,488 1,538 2, Florida State University... 56,742 4,790 22,870 4,218 3,709 6,818 2,015 12, Med U of South Carolina... 56, , U of Arkansas Main... 55,131 6,103 2,300 1,392 1,561 40, , U of Alaska Fairbanks... 54,908 2,249 7,009 3,379 16,195 2, , North Dakota State U... 49, , ,188 2, U of MA Amherst... 48,400 12,206 9,381 2,111 4,752 15,154 1,476 2, University of Louisville... 47,741 4,348 1, , , Carnegie Mellon U... 47,419 14,963 2,060 3,059 19,213 3,486 2,124 2, University of New Mexico... 47,114 4,353 1, ,048 2,118 4,238 13,774 Total, 1st 90 institutions... 10,627,689 1,636, , , ,519 6,550, , , , Utah State University... 47,108 11, , , ,709 7, Texas Tech University... 46,951 10,502 4,164 5, , , Tulane University... 44,092 4,394 1, , , U TX Hlth Sci Ctr San Ant... 44, , U of New Hampshire... 42,656 11, , , ,118 2, University of Miami... 41, , , West Virginia University... 41,871 9,702 1,529 1, , Virginia Commonwealth U... 41,865 1,482 1, , University of Idaho... 40,948 5,912 1,070 2, , , Yeshiva University... 40, , Total, 1st 100 institutions... 11,059,580 1,692, , , ,096 6,851, , , ,
178 Table B-41. Non-Federal R&D expenditures at universities and colleges, by science and engineering field: fiscal year 2001 Page 3 of 5 Engi- Physical Environ- Math & Life Psy- Social Other Institution and ranking Total neering sciences mental computer sciences chology sciences sciences sciences sciences 101 Vanderbilt University... 40,274 3,353 1, , , U of Maine... 40,197 6,706 1,257 11, , , U CA Santa Barbara... 39,544 11,827 5,587 9,736 3,193 1,207 1,691 5,013 1, Case Western Reserve U... 39,401 5, , ,683 10, Dartmouth College... 39,252 3,843 1, ,035 27,047 1, , University of Chicago... 38, , , U of Nebraska Med Ctr... 38, , U TX Med Br at Galveston... 38,040 1, , U of Alabama Birmingham... 37,077 1,909 1, , UT Houston Hlth Sci Ctr... 36, , Total, 1st 110 institutions... 11,447,016 1,726, , , ,970 7,127, , , , Columbia U in City of NY... 36,569 2,850 1,469 1, , , University of Delaware... 35,661 12,147 3,712 2,297 1,197 14, , U CA Santa Cruz... 35, ,223 6, , , Montana St U Bozeman... 34,736 4,124 2, , , San Diego St University... 34,711 6,003 1,469 1,169 1,638 10,132 2,999 4,555 6, Tufts University... 34,137 2, ,653 1,422 5, Brown University... 33,269 5,098 4,410 1,743 4,511 12, , Rush University... 32, , S Illinois U Carbondale... 32,339 8,073 1, , ,912 1, U of MA Worcester... 31, , Total, 1st 120 institutions... 11,788,176 1,767, , , ,433 7,330, , , , Medical Col of Georgia... 31, , University of Houston... 29,691 14,004 4, ,312 4,974 1,712 2, U of Nevada Reno... 27,843 2,286 1,293 2, , ,155 5, University of Vermont... 26, , , University of Virginia... 26,679 5,906 1, , New Mexico State Univ... 25,839 10, , NJ Inst of Technology... 25,647 18,843 2, , , Georgia State University... 25, , ,662 3,130 8, Oregon Health & Science U... 25, , U MD Ctr for Environ Sci... 24, , Total, 1st 130 institutions... 12,056,766 1,820, , , ,960 7,467, , , , Thomas Jefferson U... 24, , SUNY Col Env Sci & Frstry... 23,499 9,226e 1,923e 2,567e 0e 9,547e 0e 236e 0e 133 SUNY at Albany... 23, ,505 3,864 1,349 5, , Brandeis University... 22, , , , TX A&M U Sys Hlth Sci Ctr... 22, , George Washington U... 22,048 2, ,010 13, , University of Wyoming... 21,615 1, , , , California Inst of Tech... 21,531 4,567 4, , , U MD Biotechnology Inst... 21, , , Boston University... 21,260 1, , Total, 1st 140 institutions... 12,280,889 1,840, , , ,616 7,594, , , , Col of William & Mary... 20, ,348 15, Florida International U... 20,351 8, , , , Wake Forest University... 20, , U of LA Lafayette... 19,943 3, ,731 10, , Medical Col of Wisconsin... 19, , Rensselaer Polytech Inst... 19,116 15,678 1, Temple University... 18, ,095 4,374 1, Univ of Memphis, The... 18,433 2, , ,411 5,251 2,843 1, U of Arkansas Medical Sci... 17, , Rose-Hulman Inst of Tech... 17,083 12,952 1, , Total, 1st 150 institutions... 12,472,773 1,884, , , ,931 7,679, , , ,
179 Table B-41. Non-Federal R&D expenditures at universities and colleges, by science and engineering field: fiscal year 2001 Page 4 of 5 Engi- Physical Environ- Math & Life Psy- Social Other Institution and ranking Total neering sciences mental computer sciences chology sciences sciences sciences sciences 151 U of Missouri Rolla... 16,870 12,647 2, Wright State University... 16,616 2, ,827 9, University of Notre Dame... 16,295 3,673 1, , , Woods Hole Oceanogr Inst... 15,359 3, , NM Inst Mining & Tech... 15,137 8,007 1,112 5, Lehigh University... 15,097 13, Eastern VA Med School... 14, , Univ of Montana, The... 14, , ,500 2, Ohio University... 14,248 5,657 1, , University of Akron... 13,594 4,901 4, ,002 0 Total, 1st 160 institutions... 12,625,191 1,939, , , ,122 7,720, , , , Unif Svcs U of Hlth Sci... 13, , U of Alabama Huntsville... 13,106 3,622 2,612 1,122 4, SUNY at Binghamton... 12,600 4,820 1, , , Syracuse University... 12,440 3, , ,091 4, U of WI-Milwaukee... 12,403 2,659 2,086 2, , , Michigan Tech University... 11,993 8, , Colorado School of Mines... 11,340 10, U of Nevada Las Vegas... 11,327 2,622 3,235 2, , South Dakota State U... 11, , Florida Atlantic U... 11,012 3, , , , Total, 1st 170 institutions... 12,745,815 1,978, , , ,913 7,753, , , , Inst of Paper Sci & Tech... 10,982 7,548 2, , University of Alabama, The... 10,950 7,010 1, Northeastern University... 10,935 5,003 2, , , Loyola U of Chicago... 10, , , Boston College... 10, , ,895 1, , U of Missouri Kansas City... 10, ,077 6, Wichita State University... 10,416 8, Creighton University... 10, , U PR Mayaguez Campus... 9,612 5, , University of Toledo... 9,577 5,610 1, , Total, 1st 180 institutions... 12,850,632 2,018, , , ,914 7,787, , , , MCP Hahnemann U... 9, , Miami University (OH)... 9, i 2,214 i 129 i 1 i 1,886 i 320 i 2,011 i 2,581 i 183 U of MA Lowell... 9,460 4,034 1, , , U Mississippi, All Camp... 9, , , , Old Dominion University... 9,379 3, , , C R Drew U of Med & Sci... 9, , U of MA Boston... 9, , , , CUNY Hunter College... 9, , , , Cleveland State U... 9,000 1, ,645 1, Western Michigan U... 8,784 2, ,265 1, , Total, 1st 190 institutions... 12,943,167 2,030, , , ,063 7,823, , , ,
180 Table B-41. Non-Federal R&D expenditures at universities and colleges, by science and engineering field: fiscal year 2001 Page 5 of 5 Engi- Physical Environ- Math & Life Psy- Social Other Institution and ranking Total neering sciences mental computer sciences chology sciences sciences sciences sciences 191 SUNY Hlth Sci Ctr Brklyn... 8,766e 0e 0e 0e 0e 8,766e 0e 0e 0e 192 U TX at Dallas... 8,635e 2,268e 1,700e 416e 633e 1,866e 0e 747e 1,005e 193 San Jose State University... 8,408 1,025 1,192 3, , Tennessee Tech U... 8,223 7, U TX at Arlington... 8,073 5,689 1, Desert Research Institute... 7, , , U of Rhode Island... 7, , , , Drexel University... 7,539 6, Brigham Young University... 7,512 2,364 1, , , University of Dayton... 7,241 6, Total, 1st 200 institutions... 13,022,917 2,062, , , ,020 7,838, , , ,022 Total, all other sampled institutions ,288 93,431 60,824 39,735 28, ,121 14,866 66,316 33,503 KEY: e = estimated i = imputed NOTE: Because of rounding, detail may not add to totals. SOURCE: National Science Foundation/Division of Science Resources Statistics, Survey of Research and Development Expenditures at Universities and Colleges, Fiscal Year
181 Table B-42. R&D expenditures at public universities and colleges, by science and engineering field: fiscal year 2001 Page 1 of 4 Engi- Physical Environ- Math & Life Psy- Social Other Institution and ranking Total neering sciences mental computer sciences chology sciences sciences sciences sciences Total, all institutions... 22,340,844 3,620,505 1,871,888 1,486, ,747 12,594, ,636 1,123, ,122 1 U CA Los Angeles ,801 46,854 68,170 14,774 17, ,355 10,688 35,135 7,524 2 U of WI-Madison ,143 82,652 49,127 29,040 14, ,813 22,838 35, University of Michigan , ,487 25,654 5,378 14, ,083 11,049 75, U of Washington ,626 49,629 29,784 73,448 10, ,532 9,316 10, U CA San Diego ,533 50,301 33, ,096 61, ,810 5,831 10,705 1,391 6 U CA San Francisco , , , , University of Minnesota ,011 41,659 35,028 13,528 12, ,099 8,201 14, Pennsylvania State U , ,823 55,196 22,550 10, ,925 12,530 19,577 5,334 9 U CA Berkeley , ,984 79,469 6,513 6, ,525 8,244 44,406 6, U CA Davis ,396 41,928 21,329 30,580 3, ,573 1,378 13,247 3,430 Total, 1st 10 institutions... 5,368, , , , ,746 3,347,322 90, ,094 24, Texas A&M University , ,227 25,848 80,789 10, ,264 2,898 7,543 2, U of IL Urbana-Champaign , ,108 47,013 33,855 58, ,062 9,320 23,922 5, Ohio State University ,652 96,297 23,906 8,746 24, ,406 5,719 30,546 3, University of Arizona ,128 52,486 72,131 10,549 9, ,319 3,403 16, University of Colorado ,472 33,021 71,362 51,590 7, ,571 9,635 9,274 1, University of Florida ,312 54,908 23,388 5,878 8, ,524 6,320 11, University of Pittsburgh ,792 15,614 13, , ,753 4,791 10,570 1, Georgia Institute of Tech , ,581 21,086 16,924 43,810 7,108 4,128 5,512 6, U of NC Chapel Hill , ,161 12,615 8, ,300 4,282 25, NC State University ,259 81,949 25,574 16,099 17, ,775 1,238 8,968 2,627 Total, 1st 20 institutions... 8,906,975 1,533, , , ,033 5,127, , ,834 46, U TX at Austin , ,119 58,845 24,932 39,806 41,544 4,336 13,898 1, University of Georgia ,298 7,249 10,870 14,687 7, ,396 8,421 34, Louisiana State U System ,911 44,813 17,231 32,636 4, , , U of MD at College Park ,383 75,574 47,085 9,464 22,736 47,443 3,873 61, Michigan State University ,946 20,845 45,432 2,618 5, ,803 5,401 21, Indiana University ,899 3,170 34,958 3,927 4, ,353 9,652 34,401 19, U of Iowa ,348 24,772 15,080 2,353 1, ,891 4,201 7, Purdue University ,917 78,561 20,461 4,011 12, ,206 4,010 18, U of MD Baltimore , , Rutgers the State U NJ ,793 33,575 26,867 20,511 11, ,092 8,420 27,826 1,505 Total, 1st 30 institutions... 11,522,581 1,932,186 1,028, , ,999 6,539, , ,938 71, U of IL Chicago ,098 20,646 9,107 1,699 5, ,420 5,832 10,977 8, U of Alabama Birmingham ,702 5,441 3, ,201 5, U TX SW Med Ctr at Dallas , , VA Polytech Inst & St U ,323 80,349 9,298 15,734 4,581 94,248 2,015 10, U TX MD Anderson Cncr Ctr.. 212, , , , University of Kentucky ,721 29,767 7, , , ,556 12, University of Utah ,597 25,565 14,605 4,989 17, ,721 2,271 2, University of Cincinnati ,895 26,114 4, , ,386 2, SUNY at Buffalo ,829 29,725 9,189 1,283 8, ,859 3,360 5,041 2, U CA Irvine ,866 18,035 17,693 3,982 7, ,618 3,768 8,539 2,410 Total, 1st 40 institutions... 13,607,734 2,167,828 1,108, , ,951 8,130, , ,067 99, Iowa State University ,196 44,099 10,536 4,370 10,026 87, ,125 8, Wayne State University ,984 10,963 14, , ,180 2,749 5, U of Missouri Columbia ,782 22,637 4,956 1,204 1, ,701 5,274 14, U of South Florida ,550 19,063 2,328 18, ,446 10,092 4, SUNY at Stony Brook ,487 15,110 25,283 17,199 7,977 95,885 3,464 3, University of Connecticut ,366 28,225 7,174 9,127 2, ,474 6,608 8,382 2, U Med & Dent of NJ , , U of Tennessee System ,898 36,580 9,579 6,736 10,852 90, ,834 1, Colorado State University ,144 28,708 8,564 15,671 2,481 89,852 3,004 3,068 9, U of Nebraska at Lincoln ,520 24,584 9,965 8,347 6,546 79,194 5,802 9,662 13,420 Total, 1st 50 institutions... 15,285,078 2,397,797 1,201, , ,754 9,217, , , ,
182 Table B-42. R&D expenditures at public universities and colleges, by science and engineering field: fiscal year 2001 Page 2 of 4 Engi- Physical Environ- Math & Life Psy- Social Other Institution and ranking Total neering sciences mental computer sciences chology sciences sciences sciences sciences 51 Univ of Hawaii at Manoa ,976 8,955 26,405 47, , ,763 10, University of New Mexico ,619 24,737 6,611 1,961 3,081 62,419 7,168 6,180 44, University of Kansas ,467 15,850 6,269 10,900 4, ,210 1,474 5,726 7, Oregon State University ,925 17,005 4,783 36,295 2,871 89, ,220 1, University of Virginia ,547 25,838 11,538 5,189 4,464 98,876 3, University of Oklahoma ,695 14,026 13,690 29,571 3,323 66,128 11,937 10, Mississippi State U ,939 44,736 5,282 6,298 3,093 79, ,950 2, Oregon Health & Science U , ,290 5, UT Houston Hlth Sci Ctr , , Clemson University ,885 50,307 8,047 1,021 3,614 50, ,718 1,791 Total, 1st 60 institutions... 16,740,355 2,599,251 1,284, , ,514 10,082, , , , Utah State University ,359 59,162 3,475 8,522 1,569 34,166 1,782 3,513 9, Arizona State University ,763 42,485 22,231 9,798 5,159 15,307 6,399 10,114 7, Med U of South Carolina , , U CA Santa Barbara ,372 35,393 24,757 22,963 10,721 4,334 5,912 10,531 1, U TX Hlth Sci Ctr San Ant , , Florida State University ,817 11,889 42,586 14,893 6,726 12,834 5,922 18, U of MA Worcester , , U of Alaska Fairbanks ,195 7,344 13,599 30,488 16,300 16, , U of South Carolina ,973 25,573 16,499 16,449 3,450 27,153 3,596 12,537 4, Washington State U ,937 15,366 5,715 2, , ,535 1,251 Total, 1st 70 institutions... 17,881,833 2,796,463 1,413,365 1,022, ,867 10,607, , , , Auburn University ,347 31,568 4, , ,131 8, U TX Med Br at Galveston ,722 1, , Virginia Commonwealth U... 99,180 3,279 5, ,501 3,096 1, U of MA Amherst... 97,976 18,811 20,876 4,537 14,700 29,894 5,360 2, U CA Riverside... 94,455 11,528 7,168 3,849 1,647 60,284 1,742 5,850 2, Kansas State University... 94,030 15,099 9, ,705 60,229 1,151 3,530 1, Oklahoma State University... 90,311 18,589 6,105 1,728 1,854 50, ,630 2, U of New Hampshire... 87,879 19,101 2,872 40,098 1,004 15,501 1,197 5,733 2, New Mexico State Univ... 86,963 50,500 5,851 3,913 3,912 20, , U of Central Florida... 79,287 25,575 16,754 9, ,329 1,247 5,902 15,454 Total, 1st 80 institutions... 18,820,983 2,992,309 1,492,853 1,087, ,957 11,093, , , , U of Arkansas Main... 78,303 12,353 7,002 2,189 1,696 51, , University of Delaware... 77,491 25,360 12,830 8,252 2,983 21,871 1,364 4, University of Vermont... 75,597 1,738 1, ,807 66,357 1, , University of Louisville... 72,857 6,588 2, ,292 2,130 3, West Virginia University... 71,311 17,269 4,047 4, , , SUNY at Albany... 70, ,541 7,226 2,272 41,335 2,213 8, Texas Tech University... 69,918 15,751 6,028 11,425 1,704 31, , Montana St U Bozeman... 69,593 10,477 11, , ,334 2, University of Idaho... 67,496 12,122 2,496 4,284 1,557 42, ,764 1, North Dakota State U... 64,882 1,513 3, ,217 48, ,549 3,780 Total, 1st 90 institutions... 19,538,550 3,095,480 1,553,066 1,126, ,040 11,539, , , , U CA Santa Cruz... 64,253 2,259 31,117 13,048 2,883 10, , U of Maine... 64,070 8,805 5,996 19,969 1,487 23, , U of Nebraska Med Ctr... 60, , Temple University... 60,182 1,814 6, ,228 11,604 2, U of Nevada Reno... 59,229 5,996 5,637 6, ,445 1,217 1,694 5, San Diego St University... 58,332 7,843 3,744 2,952 3,071 22,063 6,714 5,142 6, Medical Col of Georgia... 52, , U of Arkansas Medical Sci... 51, , University of Houston... 51,567 19,320 9,405 1,026 4,052 11,804 3,445 2, U of Rhode Island... 50,835 5, , ,995 4,408 1,042 5,846 Total, 1st 100 institutions... 20,111,825 3,146,874 1,616,553 1,194, ,595 11,849, , , ,
183 Table B-42. R&D expenditures at public universities and colleges, by science and engineering field: fiscal year 2001 Page 3 of 4 Engi- Physical Environ- Math & Life Psy- Social Other Institution and ranking Total neering sciences mental computer sciences chology sciences sciences sciences sciences 101 Florida International U... 44,291 19,211 1,999 6,412 2,095 5, , NJ Inst of Technology... 44,177 31,572 6, , , U of Alabama Huntsville... 43,731 16,671 9,769 5,772 9,600 1, S Illinois U Carbondale... 43,207 9,179 1, , ,750 2, University of Wyoming... 41,632 3,644 3,069 6, , ,572 5, Naval Postgrad School... 40,889 i 10,876 i 2,617 i 9,854 i 8,341 i 0 i 0 i 5,561 i 3,640 i 107 TX A&M U Sys Hlth Sci Ctr... 40, , U Mississippi, All Camp... 39,552 5,786 13, , ,118 3, Georgia State University... 38, , ,353 15,962 6,586 10, University of Oregon... 36, ,911 1,685 2,816 17,783 4,373 2,023 0 Total, 1st 110 institutions... 20,526,004 3,244,228 1,667,841 1,226, ,452 11,990, , , , U MD Ctr for Environ Sci... 36, , Col of William & Mary... 35, ,728 24,956 1,139 1, , Univ of Montana, The... 33, , , ,242 2, University of Alabama, The... 33,133 19,965 4,099 1, ,721 1,917 1, George Mason University... 32,881 9, ,399 1,733 4,448 1,871 7, U MD Biotechnology Inst... 32, , , U of LA Lafayette... 32,073 6, ,694 18, ,090 1, Wright State University... 32,033 4,085 1, ,242 19,406 1, SUNY Hlth Sci Ctr Brklyn... 31,626e 0e 0e 0e 0e 31,626e 0e 0e 0e 120 Desert Research Institute... 29, , ,932 Total, 1st 120 institutions... 20,855,904 3,283,576 1,682,074 1,329, ,671 12,116, , , , U of MD Baltimore County... 29,641 5,907 5,590 10,412 1,258 3, , Michigan Tech University... 29,613 19,688 1,916 1,132 1,083 4, Univ of Memphis, The... 29,445 3, ,753 1,127 3,241 9,788 5,551 1, U of Missouri Rolla... 28,799 21,610 5,278 1, NM Inst Mining & Tech... 28,392 15,846 1,959 7, , SUNY Col Env Sci & Frstry... 27,854 9,749e 2,228e 2,785e 0e 12,813e 0e 279e 0e 127 Ohio University... 27,146 11,876 4, ,377 1, U of Nevada Las Vegas... 27,008 4,732 4,532 11, , , Jackson State University... 25, ,743 3,523 6,455 4,841 1,636 1,016 3, Florida Atlantic U... 25,111 11,233 1,053 2,593 1,530 4,386 1,591 2, Total, 1st 130 institutions... 21,134,576 3,388,271 1,713,629 1,374, ,964 12,163, ,597 1,013, , Old Dominion University... 24,659 13,122 1,769 3,692 1,565 3, U PR Med Sci Campus... 23, , Florida A&M University... 23,865 3,743 1,851 2,324 1,955 13, Colorado School of Mines... 23,654 16,288 5, U of WI-Milwaukee... 23,492 4,260 4,608 3,699 1,367 3, , Unif Svcs U of Hlth Sci... 23, , San Jose State University... 22,709 1,776 3,146 7,968 1,605 1,007 5, , University of Akron... 22,266 7,175 8, , U TX at El Paso... 21,889 7,321 1,483 5,467 1,200 4, U of MA Lowell... 20,656 6,443 5,208 1, ,005 1,142 1, Total, 1st 140 institutions... 21,364,926 3,448,399 1,745,565 1,401, ,425 12,240, ,694 1,027, ,
184 Table B-42. R&D expenditures at public universities and colleges, by science and engineering field: fiscal year 2001 Page 4 of 4 Engi- Physical Environ- Math & Life Psy- Social Other Institution and ranking Total neering sciences mental computer sciences chology sciences sciences sciences sciences 141 U Southern Mississippi... 20,286 1,010 4,914 5, , , CUNY Hunter College... 19, , ,232 2,899 2, South Dakota State U... 19,717 1, , U of North Dakota... 19,692 9, , , , SUNY at Binghamton... 18,992 6,786 2,064 1,049 1,066 2,425 2,482 2, U of Missouri Kansas City... 18, , ,508 13,472 1, U PR Mayaguez Campus... 18,627 9,363 2,445 4, , SUNY Upstate Med U... 17, , U TX at Arlington... 17,486 9,865 3, , , CUNY City College... 17,099 4,896 6, ,552 3, Total, 1st 150 institutions... 21,553,532 3,491,632 1,771,969 1,416, ,074 12,311, ,016 1,038, ,569 Total, all other sampled institutions , ,873 99,919 70,308 55, ,741 22,620 84,625 42,553 KEY: e = estimated i = imputed NOTE: Because of rounding, detail may not add to totals. SOURCE: National Science Foundation/Division of Science Resources Statistics, Survey of Research and Development Expenditures at Universities and Colleges, Fiscal Year
185 Table B-43. Federally financed R&D expenditures at public universities and colleges, by science and engineering field: fiscal year 2001 Page 1 of 3 Engi- Physical Environ- Math & Life Psy- Social Other Institution and ranking Total neering sciences mental computer sciences chology sciences sciences sciences sciences Total, all institutions... 11,694,962 1,823,246 1,181, , ,141 6,488, , , ,220 1 U of Washington ,103 30,547 20,482 66,244 9, ,001 7,998 1, University of Michigan ,117 91,611 20,839 3,232 8, ,732 5,701 53, U CA San Diego ,276 24,190 25,428 71,006 50, ,951 4,931 3, U CA Los Angeles ,858 28,438 31,178 8,561 9, ,320 7,251 4, University of Colorado ,643 24,704 64,575 47,056 6, ,083 8,097 7,140 1,364 6 U of WI-Madison ,009 50,565 32,878 21,731 9, ,022 16,715 15, U CA San Francisco , , , University of Pittsburgh ,571 7,823 11, , ,847 4,540 5,402 1,087 9 University of Minnesota ,289 25,585 26,233 6,566 9, ,638 5,269 3, Pennsylvania State U , ,576 36,777 10,656 5,440 67,800 6,864 6,220 1,618 Total, 1st 10 institutions... 3,156, , , , ,755 1,962,259 67, ,328 4, U of NC Chapel Hill , ,755 7,640 5, ,779 3,871 18, U CA Berkeley ,080 54,554 52,604 3,515 5,207 82,235 4,239 5, University of Arizona ,484 31,493 40,321 6,523 6, ,356 1,705 7, U of IL Urbana-Champaign ,316 60,525 30,747 11,765 39,467 39,942 5,754 4,127 2, U TX at Austin ,184 72,061 42,500 10,355 31,753 27,681 3,735 6, U of Alabama Birmingham ,625 3,532 2, ,745 5, Ohio State University ,092 25,802 13,936 5,287 2,913 94,278 4,068 14, U of Iowa ,249 9,489 12, , ,891 3,423 1, U CA Davis ,937 14,571 14,233 12,924 2, , ,539 1, Texas A&M University ,382 31,514 11,292 55,728 6,678 40,985 1,761 1, Total, 1st 20 institutions... 4,991, , , , ,407 2,940, , ,511 8, U of MD at College Park ,515 39,841 32,982 7,068 13,336 16,447 2,677 33, Georgia Institute of Tech ,836 94,589 9,894 7,941 20,557 3,335 1,937 2,587 2, University of Florida ,744 25,759 14,446 2,905 5,188 85,415 4,233 1, U TX SW Med Ctr at Dallas , , University of Cincinnati ,049 12,244 1, , , University of Utah ,253 15,283 10,502 3,761 11,839 83,618 1, U of IL Chicago ,109 10,384 5, ,784 96,837 3,475 2,694 1, University of Virginia ,868 19,932 9,901 4,382 3,540 81,774 2, Indiana University , ,231 1,174 2,248 82,786 6,380 5, Michigan State University ,359 6,970 28, ,874 59,016 3,853 9, Total, 1st 30 institutions... 6,284, , , , ,900 3,693, , ,218 14, Oregon Health & Science U , ,328 5, University of New Mexico ,505 20,384 5,570 1,825 2,675 41,371 5,050 1,942 30, U CA Irvine ,735 7,433 12,331 2,660 4,893 67,873 3,115 2, Colorado State University ,308 19,973 6,900 13,143 1,624 48,151 2,839 1,736 6, U of MD Baltimore... 99, , Purdue University... 98,151 30,109 13,134 2,683 4,865 41,501 2,262 3, Univ of Hawaii at Manoa... 97,716 5,825 13,645 30, , ,074 6, SUNY at Buffalo... 96,595 17,080 4, ,694 67,588 1,463 2, NC State University... 95,875 32,403 12,176 5,239 7,955 34, , Louisiana State U System... 94,625 19,823 10,861 10, , , Total, 1st 40 institutions... 7,290,876 1,076, , , ,122 4,287, , ,089 61, U TX MD Anderson Cncr Ctr.. 94, , ,058 88, SUNY at Stony Brook... 93,265 7,084 16,748 10,408 4,839 50,667 2, UT Houston Hlth Sci Ctr... 88, , University of Kentucky... 86,239 13,318 5, ,954 60, ,134 3, U Med & Dent of NJ... 86, , Oregon State University... 84,854 10,654 3,908 30,081 2,197 36, , U of MA Worcester... 79, , Wayne State University... 79,448 4,225 7, ,031 1,805 1, U of Tennessee System... 78,611 14,608 7,486 4,865 6,091 44, , VA Polytech Inst & St U... 77,384 32,817 4,135 12,693 2,756 22,598 1,210 1,175 0 Total, 1st 50 institutions... 8,138,782 1,158, , , ,592 4,908, , ,196 65,
186 Table B-43. Federally financed R&D expenditures at public universities and colleges, by science and engineering field: fiscal year 2001 Page 2 of 3 Engi- Physical Environ- Math & Life Psy- Social Other Institution and ranking Total neering sciences mental computer sciences chology sciences sciences sciences sciences 51 Rutgers the State U NJ... 77,156 12,271 13,166 8,734 4,945 30,684 3,029 4, U CA Santa Barbara... 76,828 23,566 19,170 13,227 7,528 3,127 4,221 5, University of Kansas... 74,494 7,895 2,736 2, ,887 1,205 1,877 2, Utah State University... 74,251 48,154 2,658 3,048 1,155 14,796 1,131 1,804 1, U TX Hlth Sci Ctr San Ant... 71, , University of Connecticut... 70,013 5,640 3,653 5, ,914 3,910 2, U of Missouri Columbia... 68,435 8,446 2, ,950 3,000 4, University of Georgia... 66,913 1,065 3,377 5,628 1,300 49,294 3,585 2, Mississippi State U... 65,493 30,887 1,611 5, , ,431 1, U TX Med Br at Galveston... 64, , Total, 1st 60 institutions... 8,848,200 1,297, , , ,718 5,317, , ,147 71, Iowa State University... 62,024 16,995 5,811 2,640 3,044 25, , New Mexico State Univ... 61,124 39,664 5,255 2,972 3,100 8, , Med U of South Carolina... 60, , University of Oklahoma... 60,264 3,661 7,654 13, ,057 4,426 2, U of South Florida... 58,826 6, , ,731 3, Virginia Commonwealth U... 57,315 1,797 3, ,836 2, Florida State University... 57,075 7,099 19,716 10,675 3,017 6,016 3,907 6, Arizona State University... 56,616 18,454 9,700 8,657 3,102 8,385 4,251 1,814 2, U of Alaska Fairbanks... 55,287 5,095 6,590 27, , , U of South Carolina... 51,983 15,061 8,495 5,827 1,679 14,110 2,416 4, Total, 1st 70 institutions... 9,429,257 1,411, , , ,268 5,567, , ,416 76, U of MA Amherst... 49,576 6,605 11,495 2,426 9,948 14,740 3, University of Vermont... 48, ,253 43, Washington State U... 48,660 8,622 4,589 2, , , Clemson University... 48,560 23,994 4, , , SUNY at Albany... 46, ,036 3, ,658 1,438 4, U of New Hampshire... 45,223 7,377 1,908 25, , , U of Nebraska at Lincoln... 43,877 5,783 6,021 3,875 1,167 20,905 3,666 1, U of Rhode Island... 43,161 4, , ,705 3, , University of Delaware... 41,830 13,213 9,118 5,955 1,786 7,151 1,113 3, Temple University... 41,643 1,391 6, ,133 7, Total, 1st 80 institutions... 9,887,268 1,484, , , ,834 5,773, , ,498 81, Naval Postgrad School... 40,121 i 10,672 i 2,528 i 9,669 i 8,341 i 0 i 0 i 5,497 i 3,414 i 82 Auburn University... 40,097 15,112 2, , ,129 4, Montana St U Bozeman... 34,857 6,353 9, , , U of Arkansas Medical Sci... 34, , Kansas State University... 33,998 5,500 8, , , University of Oregon... 32, ,766 1,461 2,548 16,016 4,048 1, U of Nevada Reno... 31,386 3,710 4,344 4, , U of Alabama Huntsville... 30,625 13,049 7,157 4,650 4, U Mississippi, All Camp... 30,108 4,930 11, , ,861 2, West Virginia University... 29,440 7,567 2,518 2, , Total, 1st 90 institutions... 10,224,351 1,551, , , ,430 5,913, , ,025 95,
187 Table B-43. Federally financed R&D expenditures at public universities and colleges, by science and engineering field: fiscal year 2001 Page 3 of 3 Engi- Physical Environ- Math & Life Psy- Social Other Institution and ranking Total neering sciences mental computer sciences chology sciences sciences sciences sciences 91 U CA Santa Cruz... 29,201 1,457 11,894 6,209 2,041 6, University of Idaho... 26,548 6,210 1,426 2,171 1,210 14, George Mason University... 25,992 7, ,352 1,476 2,910 1,728 4, U CA Riverside... 25,713 3,090 5,088 1, ,700 1,534 1, Oklahoma State University... 25,636 7,051 2, , ,281 1, University of Louisville... 25,116 2,240 1, ,988 1, Florida International U... 23,940 10,384 1,080 3,466 1,132 3, , U of Maine... 23,873 2,099 4,739 8, , U of MD Baltimore County... 23,695 3,488 4,990 9,072 1,016 3, , San Diego St University... 23,621 1,840 2,275 1,783 1,433 11,931 3, Total, 1st 100 institutions... 10,477,686 1,597,310 1,028, , ,746 6,005, , ,731 97,176 Total, all other sampled institutions... 1,217, , , ,771 66, ,734 45,129 64,748 39,044 KEY: i = imputed NOTE: Because of rounding, detail may not add to totals. SOURCE: National Science Foundation/Division of Science Resources Statistics, Survey of Research and Development Expenditures at Universities and Colleges, Fiscal Year
188 Table B-44. R&D expenditures at private universities and colleges, by science and engineering field: fiscal year 2001 Page 1 of 3 Engi- Physical Environ- Math & Life Psy- Social Other Institution and ranking Total neering sciences mental computer sciences chology sciences sciences sciences sciences Total, all institutions... 10,382,234 1,379, , , ,320 6,594, , , ,533 1 Johns Hopkins U , , ,414 36,577 94, ,484 3,940 9,698 22,141 2 Stanford University , ,194 54,140 8,270 20, ,312 4,906 8, U of Pennsylvania ,852 14,247 23, , ,006 3,483 31,948 4,722 4 Cornell University ,828 53,444 61,239 3,790 19, ,381 6,425 14, MA Institute of Tech , ,795 92,608 21,390 39,664 77,062 1,431 6,152 48,393 6 Washington University ,642 6,915 12,940 4,615 8, ,713 2,225 4, Baylor Col of Medicine , , Duke University ,133 16,530 13,377 8,406 5, ,897 3,862 14, Harvard University ,107 4,931 35,170 13,765 4, ,884 3,964 31, Columbia U in City of NY ,497 16,702 34,612 46,375 6, ,793 3,469 5, Total, 1st 10 institutions... 4,721, , , , ,402 3,033,993 33, ,842 76, U of Southern California ,597 49,865 10,030 14,440 66, ,096 5,013 7,666 1, Yale University ,514 7,309 20,108 2,041 5, ,749 4,720 1, Northwestern University ,933 47,799 22, , ,035 2,894 9,523 3, Emory University , , ,105 1,340 4, University of Rochester ,261 49,396 12, , ,659 10, California Inst of Tech ,085 46, ,479 10,771 4,762 33, , Case Western Reserve U ,253 22,050 6, , ,951 10, University of Chicago , ,192 4,526 2, ,810 2,620 3, New York University , , , ,633 11,233 7, Vanderbilt University ,504 15,103 9, ,059 3,601 6, Total, 1st 20 institutions... 7,097, , , , ,908 4,680,287 76, , , Mt Sinai Sch Med , , Boston University ,031 18,219 13,499 3,106 2, ,512 4,879 2,074 8, University of Miami ,772 2,089 2,331 30, ,753 7,749 2, Princeton University ,411 46,947 29,244 13,293 10,601 26,431 3,892 19, Yeshiva University , , Rockefeller U, The , , , , Carnegie Mellon U ,882 40,635 9,311 3,373 63,592 11,757 6,460 8, Dartmouth College ,096 14,137 3,834 1,570 4,708 74,490 4, , Tufts University ,806 6,263 2, ,314 84,659 3,357 6, Tulane University... 99,761 7,925 3,276 1, , ,998 5,259 Total, 1st 30 institutions... 8,502,664 1,031, , , ,801 5,642, , , , Georgetown University... 99, , , , Wake Forest University... 98, , , Brown University... 91,636 14,337 9,546 5,499 12,280 42,396 2,666 4, Woods Hole Oceanogr Inst... 91,029 19, , Thomas Jefferson U... 88, , Medical Col of Wisconsin... 83, , George Washington U... 73,805 11,172 2, ,654 36, ,523 1, Rush University... 70, ,935 1, Brandeis University... 52, , ,680 22,902 1,621 21, University of Notre Dame... 46,096 11,222 13, ,852 8,114 1,729 1,226 8,007 Total, 1st 40 institutions... 9,298,631 1,087, , , ,621 6,179, , , , Rensselaer Polytech Inst... 45,010 34,069 5,519 1,774 2, Rice University... 42,675 9,972 12,701 1,101 11,295 6, Syracuse University... 42,476 8,941 4,890 1,047 5,430 2,417 1,254 5,509 12, University of Dayton... 41,343 38,997 1, Loyola U of Chicago... 37, , ,351 1,615 2, C R Drew U of Med & Sci... 36, , Northeastern University... 34,467 13,845 9, ,647 6,165 1,579 1, MCP Hahnemann U... 32, , Saint Louis University... 32, , Boston College... 30, , ,590 2, ,266 0 Total, 1st 50 institutions... 9,674,147 1,193, , , ,918 6,329, , , ,
189 Table B-44. R&D expenditures at private universities and colleges, by science and engineering field: fiscal year 2001 Page 2 of 3 Engi- Physical Environ- Math & Life Psy- Social Other Institution and ranking Total neering sciences mental computer sciences chology sciences sciences sciences sciences 51 Howard University... 30,148 2,425 2, ,255 19,534 1,693 1, Lehigh University... 29,058 23,902 3, Drexel University... 27,698 22,767 2, , Loma Linda University... 26,451 i 0 i 0 i 0 i 0 i 23,324 i 0 i 897 i 2,230 i 55 Eastern VA Med School... 26, , New York Medical College... 24, , Morehouse School of Med... 19, , Brigham Young University... 19,171 7,305 3, ,534 3, , OGI Schl Sci & Eng OHSU... 18,798 2,857 3,508 3,388 9, Rose-Hulman Inst of Tech... 18,540 13,342 2, , Total, 1st 60 institutions... 9,914,214 1,266, , , ,858 6,447, , , , Creighton University... 17, , Catholic U of America... 17,539 1,882 12, , Clark Atlanta University... 17,173 2,244 4, ,038 2, , Mercer University... 15,337 8, , Illinois Inst of Tech... 14,722 4,446 1, , Inst of Paper Sci & Tech... 13,929 9,611 2, , Stevens Inst of Tech... 13,855 6,989e 1,448e 2,567e 678e 0e 0e 2,173e 0e 68 University of Denver... 12,944 1,040 2,611 1, ,904 3, Albany Medical College... 12, , University of Tulsa... 12,553 8,861 1, Total, 1st 70 institutions... 10,062,776 1,309, , , ,082 6,497, , , , Rochester Inst of Tech... 11,416 4,950 4, , Meharry Medical College... 10,268 i 0 i 0 i 347 i 8 i 9,913 i 0 i 0 i 0 i 73 Teachers Col, Columbia U... 9, ,085 5, Tuskegee University... 9,539 1, , , Worcester Polytech Inst... 9,348 7, Hampton University... 9, , Southern Methodist U... 8,948 2,274 1,533 2,152 1,134 1, Clarkson University... 8,322 6,642 1, Polytechnic University... 8,277 6, Finch U Hlth Sci Chicago... 8, , Total, 1st 80 institutions... 10,155,765 1,339, , , ,380 6,524, , , , Embry-Riddle Aero Univ... 7,711 6, Marquette University... 7,236 2,073 1, , , U Ctrl Del Caribe Esc Med... 6, , Alfred University... 6,678 6, Harvey Mudd College... 6,443 i 1,742 i 978 i 66 i 233 i 2,782 i 46 i 267 i 329 i 86 Florida Inst of Tech... 6,195 1, ,122 1,517 1, Villanova University... 5,969 i 3,781 i 1,520 i 68 i 170 i 339 i 91 i 0 i 0 i 88 Wesleyan University... 5, , , New School University... 5, , Wellesley College... 5, ,346 Total, 1st 90 institutions... 10,220,075 1,361, , , ,829 6,542, , , ,
190 Table B-44. R&D expenditures at private universities and colleges, by science and engineering field: fiscal year 2001 Page 3 of 3 Engi- Physical Environ- Math & Life Psy- Social Other Institution and ranking Total neering sciences mental computer sciences chology sciences sciences sciences sciences 91 Xavier University of LA... 5, , , Ponce School of Medicine... 3,842 0 i 0 i 0 i 0 i 3,842 i 0 i 0 i 0 i 93 Texas Christian U... 3, , Fordham University... 3, ,132 1, Spelman College... 3, , , Institute of Textile Tech... 3,171 2, Hampshire College... 3, , Bryn Mawr College... 3, , Alliant University... 3,062e 171 i 68 i 33 i 50 i 999 i 17 i 94 i 1,630 i 100 Clark University... 3, ,383 0 Total, 1st 100 institutions... 10,255,243 1,364, , , ,166 6,553, , , ,828 Total, all other sampled institutions ,991 14,519 25,932 7,242 11,154 41,523 8,438 12,478 5,705 1 Johns Hopkins University includes the Applied Physics Laboratory. KEY: e = estimated i = imputed NOTE: Because of rounding, detail may not add to totals. SOURCE: National Science Foundation/Division of Science Resources Statistics, Survey of Research and Development Expenditures at Universities and Colleges, Fiscal Year
191 Table B-45. Federally financed R&D expenditures at private universities and colleges, by science and engineering field: fiscal year 2001 Page 1 of 3 Engi- Physical Environ- Math & Life Psy- Social Other Institution and ranking Total neering sciences mental computer sciences chology sciences sciences sciences sciences Total, all institutions... 7,495,911 1,020, , , ,414 4,690, , ,988 50,910 1 Johns Hopkins U , , ,309 34,923 92, ,565 3,691 6,613 6,583 2 Stanford University ,468 92,036 48,502 5,926 17, ,486 3,880 2, U of Pennsylvania ,996 10,666 21, , ,706 3,050 8,997 2,060 4 Columbia U in City of NY ,928 13,852 33,143 44,889 6, ,271 3,268 4, MA Institute of Tech , ,226 89,881 18,652 27,496 59,054 1,326 1,840 3,844 6 Harvard University ,414 4,156 31,346 12,415 3, ,400 3,648 13, Washington University ,928 4,247 9,644 2,508 6, ,345 1,864 3, Yale University ,702 5,887 17,867 1,836 5, ,209 3, U of Southern California ,207 37,144 6,910 10,499 63, ,682 3,895 2, Cornell University ,466 29,776 44,655 1,722 13, ,510 1,942 3,894 0 Total, 1st 10 institutions... 3,561, , , , ,290 2,099,228 30,542 48,527 13, Baylor Col of Medicine , , Duke University ,109 12,075 10,799 4,719 4, ,792 3,184 11, California Inst of Tech ,554 41, ,362 10,319 4,687 31, , Emory University , , ,073 1, University of Rochester ,945 41,036 11, , ,254 6, Case Western Reserve U ,852 16,639 5, , , Northwestern University ,129 28,746 15, , ,710 2,305 3, University of Chicago , ,664 4,148 2, ,766 2,588 2, Boston University ,771 16,275 12,961 2,960 2, ,993 4,773 1,504 8, Vanderbilt University ,230 11,750 8, ,681 2,643 4, Total, 1st 20 institutions... 5,314, , , , ,706 3,375,815 54,221 75,983 22, New York University , , , ,365 9,219 3, University of Miami ,803 1,463 2,217 27, ,619 7,625 2, Mt Sinai Sch Med , , Yeshiva University , , Carnegie Mellon U... 97,463 25,672 7, ,379 8,271 4,336 6, Georgetown University... 93, , , , Princeton University... 78,620 23,363 18,987 7,812 5,979 17,546 2,195 2, Wake Forest University... 78, , Woods Hole Oceanogr Inst... 75,670 15, , Tufts University... 71,669 4,217 2, ,031 61,006 1, Total, 1st 30 institutions... 6,267, , , , ,906 4,014,032 79,676 95,131 23, Dartmouth College... 69,844 10,294 2, ,673 47,443 3, , Thomas Jefferson U... 64, , Medical Col of Wisconsin... 64, , Brown University... 58,367 9,239 5,136 3,756 7,769 29,599 1,868 1, Tulane University... 55,669 3,531 1, , ,345 3, Rockefeller U, The... 55, , ,451 51, George Washington U... 51,757 8,371 2, ,644 23, , Rush University... 37, , Rice University... 35,682 7,007 10,359 1,101 10,836 5, University of Dayton... 34,102 32,310 1, Total, 1st 40 institutions... 6,794, , , , ,163 4,377,720 87, ,747 29, Syracuse University... 30,036 5,848 4, ,242 2,163 1,250 3,418 8, Brandeis University... 30, , ,631 17,263 1,474 5, University of Notre Dame... 29,801 7,549 12, ,703 5,446 1, Saint Louis University... 28, , Howard University... 27,848 1,981 1, ,878 18,240 1,693 1, C R Drew U of Med & Sci... 27, , Loyola U of Chicago... 26, , ,694 1,415 1, Rensselaer Polytech Inst... 25,894 18,391 3,522 1,218 2, Northeastern University... 23,532 8,842 7, ,262 4,690 1, MCP Hahnemann U... 22, , Total, 1st 50 institutions... 7,067, , , , ,454 4,524,979 96, ,423 38,
192 Table B-45. Federally financed R&D expenditures at private universities and colleges, by science and engineering field: fiscal year 2001 Page 2 of 3 Engi- Physical Environ- Math & Life Psy- Social Other Institution and ranking Total neering sciences mental computer sciences chology sciences sciences sciences sciences 51 Loma Linda University... 20,494 i 0 i 0 i 0 i 0 i 17,367 i 0 i 897 i 2,230 i 52 Drexel University... 20,159 16,665 1, , Boston College... 20, , ,695 1, , New York Medical College... 18, , Morehouse School of Med... 18, , Clark Atlanta University... 14,354 2,062 3, , , OGI Schl Sci & Eng OHSU... 14, ,205 2,719 7, Lehigh University... 13,961 9,968 2, Catholic U of America... 13,308 1,444 10, Brigham Young University... 11,659 4,941 2, , Total, 1st 60 institutions... 7,231, , , , ,508 4,586,173 97, ,244 45, Eastern VA Med School... 11, , Illinois Inst of Tech... 10,917 3, , Meharry Medical College... 10,015 i 0 i 0 i 347 i 8 i 9,660 i 0 i 0 i 0 i 64 University of Denver... 9, ,813 1, ,172 2, Mercer University... 9,076 8, Albany Medical College... 8, , Hampton University... 8, , Stevens Inst of Tech... 8,094 4,670e 1,142e 811e 288e 0e 0e 1,183e 0e 69 University of Tulsa... 7,341 5,099 1, Creighton University... 7, , Total, 1st 70 institutions... 7,321, , , , ,243 4,630, , ,319 45, Tuskegee University... 7, , , Embry-Riddle Aero Univ... 6,987 5, U Ctrl Del Caribe Esc Med... 6, , Finch U Hlth Sci Chicago... 6, , Teachers Col, Columbia U... 5, ,480 1, Rochester Inst of Tech... 5,612 1,467 2, , Southern Methodist U... 5, , Xavier University of LA... 4, , , Villanova University... 4,520 i 3,047 i 924 i 11 i 168 i 280 i 90 i 0 i 0 i 80 Worcester Polytech Inst... 4,506 3, Total, 1st 80 institutions... 7,379,536 1,002, , , ,728 4,653, , ,441 46, Clarkson University... 4,286 3, Polytechnic University... 4,063 3, Wesleyan University... 3, , , Ponce School of Medicine... 3,736 0 i 0 i 0 i 0 i 3,736 i 0 i 0 i 0 i 85 Wellesley College... 3, , Marquette University... 3, , Spelman College... 3, , , Inst of Paper Sci & Tech... 2,947 2, Texas Christian U... 2, , Florida Inst of Tech... 2, Total, 1st 90 institutions... 7,413,916 1,013, , , ,930 4,663, , ,020 48,
193 Table B-45. Federally financed R&D expenditures at private universities and colleges, by science and engineering field: fiscal year 2001 Page 3 of 3 Engi- Physical Environ- Math & Life Psy- Social Other Institution and ranking Total neering sciences mental computer sciences chology sciences sciences sciences sciences 91 Clark University... 2, , Fisk University... 2, , American University... 1, Fordham University... 1, , Duquesne University... 1, , Claflin College... 1, Morehouse College... 1,843 i 0 i 263 i 0 i 63 i 954 i 257 i 94 i 212 i 98 Gallaudet University... 1, , Nova Southeastern U... 1, Ithaca College... 1, , Total, 1st 100 institutions... 7,434,018 1,013, , , ,440 4,667, , ,856 48,551 Total, all other sampled institutions... 61,893 7,069 12,395 3,670 5,974 22,903 5,391 2,132 2,359 1 Johns Hopkins University includes the Applied Physics Laboratory. KEY: e = estimated i = imputed NOTE: Because of rounding, detail may not add to totals. SOURCE: National Science Foundation/Division of Science Resources Statistics, Survey of Research and Development Expenditures at Universities and Colleges, Fiscal Year
194 Table B-46. Total and federally financed R&D expenditures at historically black colleges and universities, ranked by fiscal year 2001 total R&D expenditures: fiscal years Page 1 of 2 Total Federally financed Institution and ranking Total, all institutions , , , , , , , ,903 1 Howard University... 23,673 23,557 27,254 30,148 21,501 21,658 25,292 27,848 2 Jackson State University... 6,111 8,823 12,027 25,663 5,326 7,925 10,690 22,750 3 Florida A&M University... 19,066 21,622 21,612 23,865 15,726 20,693 16,278 22,477 4 Morehouse School of Med... 13,614 13,622 16,889 19,670 12,461 12,948 15,419 18,127 5 Clark Atlanta University... 29,637 19,467 16,891 17,173 24,079 12,116 16,170 14,354 6 NC A&T State University... 14,816 14,741 13,400 15,629 12,924 12,454 11,187 11,937 7 Tennessee State U... 9,329 10,762 11,285 12,791 7,978 8,522 8,873 10,210 8 Prairie View A&M U... 9,952 10,157 9,464 11,297 9,612 8,675 7,679 7,094 9 Meharry Medical College... 11,212e 9,460 9,460e 10,268 i 11,004e 9,192 9,192e 10,015 i 10 Tuskegee University... 37,354 9,223 8,893 9,539 26,894 6,942 6,694 7,259 Total, 1st 10 institutions , , , , , , , , Hampton University... 7,140 7,472 9,323 9,158 6,801 7,168 8,994 8, Southern U A&M All Camp... 9,063 9,296 8,302 9,052 i 6,983 6,689 6,418 7,059 i 13 Alabama A&M University... 14,143 11,562 8,238 8,982 i 10,518 8,558 7,056 7,761 i 14 Alcorn State University... 5,119 5,223 8,034 7,370 5,119 5,223 8,034 7, Winston Salem State U... 2,468 1,712 3,447 6,057 1,898 1,619 3,216 4, U of MD Eastern Shore... 2,265 2,508 3,895 5,626 2,265 2,508 3,895 5, Xavier University of LA... 5,388 3,294 3,425 5,113 5,355 3,240 3,174 4, Virginia State University... 3,338 2,611 4,422 5,066 2,792 2,061 3,602 4, U Arkansas Pine Bluff... 4,151 4,151e 4,151 i 4,151 i 2,911 2,911e 2,911 i 2,911 i 20 Kentucky State University e 2,354 i 3, e 2,179 i 3,655 Total, 1st 20 institutions , , , , , , , , Norfolk State University... 2,524 2,995 3,408 3,984 2,442 2,970 3,273 3, Spelman College... 1,744 2,007 2,082 3,406 1,700 1,832 1,978 3, U of the Virgin Islands... 4,828e 3,310 3,310e 3,310 i 2,428e 1,957 1,957e 1,957 i 24 University of DC... 3,074 3,394 2,737 3,001 1,898 1,829 1,629 2, South Carolina State U... 2,885 2,900 2,915 2,915e 1,968 1,978 1,988 1,988e 26 Langston University... 2,031 2,340 2,553 2,863 2,031 2,340 2,553 2, Morehouse College e 2,853 2,853e 2,853 i 591e 1,843 1,843e 1,843 i 28 Fort Valley State U... 2,989 2,937 2,768 2,768e 2,359 2,318 2,417 2,417e 29 Fisk University... 2,909 4,034 3,401 2,722 2,909 2,846 2,652 2, Delaware State University... 2,883 2,765 3,415 2,494 2,734 2,055 3,052 2,222 Total, 1st 30 institutions , , , , , , , , Texas Southern U... 2,690 2,507 2,182 2,468 2,504 2,292 1,844 1, Morgan State University... 3,981 1,066 4,371 2,390 3,960 1,066 4,371 2, Grambling State U... 1,997 1,997e 2,264 2,264e 1,936 1,936e 2,200 2,200e 34 Lincoln University... 3,313 2,686 2,502 2,236 2,635 i 2,686 2,502 2, Bowie State University... 4,511 2,675 2,675e 2,207 4,403 2,360 2,360e 2, Savannah State Univ , i , Claflin College... 1, e 2,074 1, e 1, Albany State University... 1,019 1,019e 1,393 1,972 1,019 1,019e Alabama State University... 1,177 1,365 1,365e 1,433e 1,133 1,190 1,190e 1,249e 40 Mississippi Valley St U , ,316 Total, 1st 40 institutions , , , , , , , , Le Moyne-Owen Coll... 1,451 1,053 1,700 1,268 1,404 1,031 1,700 1, Elizabeth City State U ,040 1,558 1, ,040 1,558 1, Benedict College i 966 i 1,143 1, i 938 i 1,143 1, Tougaloo College... 1,180 1, , Bethune Cookman College North Carolina Central U e 808 i 913 i 786 i 777e 761 i 853 i 47 Bennett College e 811 i 811 i e 583 i 583 i 48 Southern U New Orleans e Virginia Union University e 671 i 671 i e 537 i 537 i 50 Lincoln University (PA)... 1, , Total, 1st 50 institutions , , , , , , , ,
195 Table B-46. Total and federally financed R&D expenditures at historically black colleges and universities, ranked by fiscal year 2001 total R&D expenditures: fiscal years Page 2 of 2 Total Federally financed Institution and ranking Fayetteville State U Oakwood College e 567 i e 447 i 53 Central State University... 1,497 1,497e 560e 560 i 1,144 1,144e 283e 283 i 54 Dillard University e e Wilberforce University e 280 i 280 i 280 i 236e 236 i 236 i 236 i 56 Johnson C Smith U... 4,299 8, ,299 8, Morris Brown College e 321 i e 525e 321 i e 58 Shaw University e 100 i e 100 i 59 West Virginia State Col e 63e 0 0 0e 0e 60 Jarvis Christian College e e Total, 1st 60 institutions , , , , , , , , Bluefield State College Coppin State College Philander Smith College... 73e 72 72e 0 73e 72 72e 0 64 Rust College Selma University e e 210e e 66 Talladega College... 0e i Wiley College Knoxville College Total, 1st 68 institutions , , , , , , , ,903 KEY: -- = not available e = estimated i = imputed NOTE: Because of rounding, detail may not add to totals. SOURCE: National Science Foundation/Division of Science Resources Statistics, Survey of Research and Development Expenditures at Universities and Colleges, Fiscal Year
196 Table B-47. Total and federally financed R&D expenditures in engineering at universities and colleges, ranked by fiscal year 2001 total R&D expenditures in engineering: fiscal years Page 1 of 3 Total Federally financed Institution and ranking Total, all institutions... 4,068,829 4,260,182 4,546,633 4,999,648 2,353,658 2,440,183 2,571,678 2,843,770 1 Johns Hopkins U , , , , , , , ,116 2 Georgia Institute of Tech , , , ,581 72,542 73,638 81,862 94,589 3 Pennsylvania State U , , , ,823 85,368 80,195 99, ,576 4 MA Institute of Tech , , , , , , , ,226 5 University of Michigan , , , ,487 68,083 84,757 88,108 91,611 6 U CA Berkeley... 99, , , ,984 48,225 51,323 56,757 54,554 7 Texas A&M University , , , ,227 27,986 31,065 31,008 31,514 8 Stanford University , , , , ,752 98,864 91,594 92,036 9 U TX at Austin... 81,547 95, , ,119 46,499 61,383 65,769 72, U of IL Urbana-Champaign... 87,557 91,373 95, ,108 51,751 53,912 57,385 60,525 Total, 1st 10 institutions... 1,306,706 1,339,988 1,442,550 1,541, , , , , Ohio State University... 70,275 77,090 82,705 96,297 18,760 20,467 21,302 25, U of WI-Madison... 56,512 61,363 71,293 82,652 34,042 34,500 41,315 50, NC State University... 80,278 80,586 76,839 81,949 33,161 27,008 25,259 32, VA Polytech Inst & St U... 48,844 53,530 66,963 80,349 25,000 25,584 26,084 32, Purdue University... 68,096 70,106 71,515 78,561 34,899 36,509 31,300 30, U of MD at College Park... 67,267 76,548 76,091 75,574 38,734 42,645 40,494 39, Utah State University... 33,933 32,083 41,074 59,162 29,337 27,360 31,180 48, University of Florida... 48,621 46,186 47,513 54,908 21,735 20,227 23,973 25, Cornell University... 44,687 49,641 54,860 53,444 28,416 31,243 30,977 29, University of Arizona... 42,394 43,094 48,272 52,486 24,232 25,320 29,305 31,493 Total, 1st 20 institutions... 1,867,613 1,930,215 2,079,675 2,256,636 1,131,333 1,157,996 1,226,341 1,334, New Mexico State Univ... 46,187 47,632 46,790 50,500 37,487 38,257 39,179 39, Clemson University... 26,584 30,583 35,374 50,307 8,315 8,331 9,636 23, U CA San Diego... 46,169 47,725 46,660 50,301 27,585 25,273 24,534 24, U of Southern California... 38,686 42,148 46,319 49,865 30,530 32,688 34,857 37, U of Washington... 34,277 34,889 39,009 49,629 21,927 21,875 24,906 30, University of Rochester... 38,158 41,864 46,494 49,396 34,243 36,235 40,942 41, Northwestern University... 42,636 42,618 44,685 47,799 27,047 30,446 30,492 28, Princeton University... 35,805 39,080 41,026 46,947 20,707 22,316 21,220 23, U CA Los Angeles... 42,967 46,108 46,434 46,854 28,171 29,527 29,689 28, California Inst of Tech... 35,630 40,470 43,662 46,377 31,536 37,675 35,711 41,810 Total, 1st 30 institutions... 2,254,712 2,343,332 2,516,128 2,744,611 1,398,881 1,440,619 1,517,507 1,653, Louisiana State U System... 35,605 37,781 41,628 44,813 13,535 15,326 18,937 19, Mississippi State U... 22,862 30,713 38,107 44,736 15,833 20,914 25,329 30, Iowa State University... 40,370 40,019 47,049 44,099 14,229 13,207 16,863 16, Arizona State University... 32,745 34,378 36,612 42,485 12,501 13,841 13,978 18, U CA Davis... 27,726 29,528 35,197 41,928 10,216 10,069 12,693 14, University of Minnesota... 37,595 38,564 41,343 41,659 24,122 24,055 24,515 25, Carnegie Mellon U... 34,363 38,676 36,892 40,635 23,142 24,272 24,754 25, University of Dayton... 41,418 33,386 36,325 38,997 34,141 28,403 29,831 32, U of Tennessee System... 27,827 27,772 32,928 36,580 12,855 11,676 11,971 14, U CA Santa Barbara... 34,985 37,147 38,902 35,393 26,427 27,670 28,834 23,566 Total, 1st 40 institutions... 2,590,208 2,691,296 2,901,111 3,155,936 1,585,882 1,630,052 1,725,212 1,875, Rensselaer Polytech Inst... 23,963 28,275 31,036 34,069 11,925 14,857 17,616 18, Rutgers the State U NJ... 25,908 29,097 33,681 33,575 11,517 12,867 15,101 12, University of Colorado... 28,935 26,187 31,174 33,021 16,824 15,925 23,331 24, NJ Inst of Technology... 19,714 19,714 18,274 31,572 11,162 11,162 3,358 12, Auburn University... 17,239 20,575 23,859 31,568 10,644 11,392 12,106 15, University of Kentucky... 25,174 27,478 31,426 29,767 9,871 10,140 12,253 13, SUNY at Buffalo... 27,690 29,946 32,301 29,725 14,129 14,579 16,121 17, Colorado State University... 17,998 13,670 15,452 28,708 8,653 6,430 8,162 19, University of Connecticut... 24,166 23,793 27,294 28,225 5,564 6,041 5,228 5, University of Cincinnati... 21,569 25,453 24,127 26,114 11,992 12,801 11,604 12,244 Total, 1st 50 institutions... 2,822,564 2,935,484 3,169,735 3,462,280 1,698,163 1,746,246 1,850,092 2,027,
197 Table B-47. Total and federally financed R&D expenditures in engineering at universities and colleges, ranked by fiscal year 2001 total R&D expenditures in engineering: fiscal years Page 2 of 3 Total Federally financed Institution and ranking University of Virginia... 22,490 21,706 23,937 25,838 14,551 16,643 18,361 19, U of Central Florida... 6,383 8,353 9,157 25,575 1,997 2,774 2,914 3, U of South Carolina... 17,116 21,578 23,095 25,573 10,545 12,595 14,923 15, University of Utah... 19,174 21,816 25,293 25,565 12,197 13,405 15,561 15, University of Delaware... 23,408 26,908 23,730 25,360 10,647 11,701 12,009 13, U of Iowa... 21,888 20,409 22,921 24,772 8,642 8,495 9,534 9, University of New Mexico... 27,243 26,998 26,464 24,737 20,093 21,305 21,979 20, U of Nebraska at Lincoln... 20,029 i 22,112 22,365 24,584 3,771 i 4,257 4,400 5, Lehigh University... 20,354 22,190 19,503 23,902 8,842 9,152 8,460 9, Drexel University... 12,867 17,351 15,828 22,767 8,025 10,620 9,795 16,665 Total, 1st 60 institutions... 3,013,516 3,144,905 3,382,028 3,710,953 1,797,473 1,857,193 1,968,028 2,156, U of Missouri Columbia... 16,606 20,312 21,818 22,637 4,254 6,105 8,669 8, Case Western Reserve U... 28,340 26,239 25,518 22,050 18,166 17,695 17,301 16, U of Missouri Rolla... 15,086 18,277 19,698 21,610 5,439 6,141 7,161 8, Michigan State University... 17,837 16,673 20,695 20,845 5,096 4,913 5,913 6, U of IL Chicago... 12,979 15,107 19,007 20,646 5,007 5,696 9,333 10, University of Alabama, The... 11,474 13,241 17,058 19,965 8,518 9,939 11,227 12, Michigan Tech University... 16,959 18,896 18,387 19,688 8,166 9,581 10,041 11, University of Houston... 19,097 17,661 18,081 19,320 7,783 5,423 5,721 5, Florida International U... 8,906 10,359 14,641 19,211 7,470 8,984 8,576 10, Woods Hole Oceanogr Inst... 12,016 12,999 16,637 19,180 9,096 9,297 12,801 15,368 Total, 1st 70 institutions... 3,172,816 3,314,669 3,573,568 3,916,105 1,876,468 1,940,967 2,064,771 2,263, U of New Hampshire... 5,520 8,207 12,462 19,101 1,409 2,889 4,789 7, U of South Florida... 15,728 12,902 16,698 19,063 6,284 5,106 4,615 6, U of MA Amherst... 16,264 15,146 17,476 18,811 5,894 5,747 6,800 6, Oklahoma State University... 12,899 14,655 16,752 18,589 5,604 5,706 6,465 7, Boston University... 14,969 16,110 17,455 18,219 10,610 14,767 15,274 16, U CA Irvine... 11,658 12,461 15,518 18,035 4,288 4,787 5,590 7, West Virginia University... 18,923 20,601 20,560 17,269 9,472 10,188 8,668 7, Oregon State University... 14,178 14,440 13,903 17,005 9,364 9,648 8,651 10, Columbia U in City of NY... 14,901 15,645 16,393 16,702 11,438 13,450 13,068 13, U of Alabama Huntsville... 14,387 16,887 17,154 16,671 7,260 8,556 8,964 13,049 Total, 1st 80 institutions... 3,312,243 3,461,723 3,737,939 4,095,570 1,948,091 2,021,811 2,147,655 2,360, Duke University... 13,710 14,650 15,249 16,530 10,155 11,002 11,358 12, Colorado School of Mines... 14,296 14,578 13,878 16,288 4,977 5,967 5,195 6, University of Kansas... 13,751 13,085 12,403 15,850 7,674 5,799 5,570 7, NM Inst Mining & Tech... 15,526 16,835 14,393 15,846 5,878 7,807 5,912 7, Texas Tech University... 16,221 16,384 16,748 15,751 6,628 6,861 6,178 5, University of Pittsburgh... 7,532 8,912 11,858 15,614 3,656 4,168 6,595 7, Washington State U... 12,321 14,288 16,660 15,366 6,982 7,727 9,878 8, SUNY at Stony Brook... 10,083 11,047 15,574 15,110 6,498 6,410 8,098 7, Vanderbilt University... 7,529 9,764 12,223 15,103 4,669 6,595 8,667 11, Kansas State University... 12,972 13,356 15,935 15,099 5,110 4,526 5,611 5,500 Total, 1st 90 institutions... 3,436,184 3,594,622 3,882,860 4,252,127 2,010,318 2,088,673 2,220,717 2,440,
198 Table B-47. Total and federally financed R&D expenditures in engineering at universities and colleges, ranked by fiscal year 2001 total R&D expenditures in engineering: fiscal years Page 3 of 3 Total Federally financed Institution and ranking Brown University... 9,568 9,529 9,958 14,337 5,958 5,250 5,626 9, U of Pennsylvania... 12,785 13,911 13,315 14,247 10,123 10,598 9,651 10, Dartmouth College... 7,133 7,365 8,691 14,137 5,088 5,526 7,112 10, University of Oklahoma... 14,008 15,592 15,163 14,026 3,264 3,176 4,122 3, Northeastern University... 11,274 13,118 11,680 13,845 8,960 9,835 8,250 8, Rose-Hulman Inst of Tech i 839 3,691 13, i Old Dominion University... 7,933 10,056 11,712 13,122 5,542 6,196 7,558 9, U of Arkansas Main... 11,576 9,638 12,460 12,353 4,714 3,896 6,504 6, Wichita State University... 10,531 11,369 12,808 12,298 1,686 1,723 3,166 3, University of Idaho... 8,878 10,635 9,838 12,122 1,413 3,243 4,563 6,210 Total, 1st 100 institutions... 3,530,115 3,696,674 3,992,176 4,385,956 2,057,299 2,138,609 2,277,486 2,508,571 Total, all other sampled institutions , , , , , , , ,199 1 Johns Hopkins University includes the Applied Physics Laboratory. KEY: i = imputed NOTE: Because of rounding, detail may not add to totals. SOURCE: National Science Foundation/Division of Science Resources Statistics, Survey of Research and Development Expenditures at Universities and Colleges, Fiscal Year
199 Table B-48. R&D expenditures in engineering subfields at universities and colleges: fiscal year 2001 Page 1 of 3 Aero/ Bioengin- Metal- Institution and ranking Total astro- eering/ Chemical Civil Elec- Mechan- lurgical Other nautical Biomed- trical ical and ical materials Total, all institutions... 4,999, , , , ,706 1,160, , ,931 1,072,735 1 Johns Hopkins U ,936 27,534 i 12,420 i 7,045 i 5,721 i 83,674 i 57,643 i 538 i 90,361 i 2 Georgia Institute of Tech ,581 18,276 7,431 7,735 11,448 93,696 26,526 10,919 25,550 3 Pennsylvania State U ,823 3,920 2,648 13,167 17,742 49,599 21,798 41,587 33,362 4 MA Institute of Tech ,795 14,856 13,117 16,843 11,898 29,195 21,736 14,598 26,552 5 University of Michigan ,487 4,785 6,563 4,768 12,793 41,480 28,180 4,627 40,291 6 U CA Berkeley , ,866 36,696 62, ,829 7 Texas A&M University ,227 7,015 1,870 9,135 43,123 5,895 14,175 3,976 39,038 8 Stanford University ,194 7, ,001 8,800 27,251 20,318 3,060 36,762 9 U TX at Austin ,119 9,313 3,109 7,888 17,555 30,270 10,773 16,867 14, U of IL Urbana-Champaign ,108 4, ,526 17,424 33,984 14,450 14,597 13,598 Total, 1st 10 institutions... 1,541,254 97,187 47,254 85, , , , , , Ohio State University... 96,297 3, ,441 6,861 13,072 11,609 20,385 34, U of WI-Madison... 82, ,079 6,920 5,743 8,897 4,031 2,998 51, NC State University... 81,949 4,973 6,344 19,677 11,593 11,540 7,804 8,220 11, VA Polytech Inst & St U... 80,349 4, ,891 16,829 23,569 12,676 4,636 15, Purdue University... 78,561 5,300 6,633 6,875 12,890 19,617 12,989 1,679 12, U of MD at College Park... 75,574 10, ,375 6,774 12,705 12,225 5,108 26, Utah State University... 59,162 33, ,071 15, , University of Florida... 54,908 3,744 1,487 3,222 15,010 4,659 3,225 12,276 11, Cornell University... 53,444 3, ,545 7,030 17,989 1,252 3,551 16, University of Arizona... 52,486 3,675 1,676 4,650 10,840 14,906 13, ,273 Total, 1st 20 institutions... 2,256, ,124 66, , , , , , , New Mexico State Univ... 50,500 18, ,654 1,555 9, ,835 13, Clemson University... 50, ,020 7,658 5,138 9,302 10,917 5,239 9, U CA San Diego... 50, ,986 4, ,960 5, , U of Southern California... 49,865 2,887 2,988 1,919 5,248 27,133 2,272 2,014 5, U of Washington... 49,629 3,029 4,713 6,928 11,063 2,422 1,464 20, University of Rochester... 49, , ,186 35, , Northwestern University... 47, ,801 3,793 4,095 5,579 4,323 14,458 11, Princeton University... 46,947 9, ,649 3,804 19, , U CA Los Angeles... 46, ,724 2,638 22,316 14,372 3,138 1, California Inst of Tech... 46,377 8, ,646 4,849 14,596 5,029 1,642 5,916 Total, 1st 30 institutions... 2,744, ,764 89, , , , , , , Louisiana State U System... 44, ,121 6,541 1,268 4,863 11,440 18, Mississippi State U... 44,736 2, ,538 2,060 6,153 2, , Iowa State University... 44,099 10, ,126 6,089 1,350 2,863 15, Arizona State University... 42, ,876 3,333 9,770 10,985 9, , U CA Davis... 41, ,354 4,793 11,998 5,553 7, , University of Minnesota... 41,659 4, ,547 8,696 7,190 9, , Carnegie Mellon U... 40, ,259 7,085 3,090 12,707 2,483 5,003 9, University of Dayton... 38,997 4, ,112 9,648 16,518 6, U of Tennessee System... 36,580 7, ,113 2, ,996 7, U CA Santa Barbara... 35, , ,748 2,432 10, Total, 1st 40 institutions... 3,155, , , , , , , , , Rensselaer Polytech Inst... 34, ,159 4,082 4,443 2,084 3,930 16, Rutgers the State U NJ... 33, ,610 2,070 3,437 6,790 5,100 7,404 2, University of Colorado... 33,021 13, ,773 6,347 5,674 3, NJ Inst of Technology... 31, ,880 11,779 5,661 2, , Auburn University... 31, ,689 3,554 4,588 2,686 1,592 8, University of Kentucky... 29, , ,247 2, , SUNY at Buffalo... 29,725 7,784 2,657 1,634 11,332 1, , Colorado State University... 28, ,559 1,191 5,413 3,349 3, University of Connecticut... 28, ,389 10,782 3,618 1,259 9, University of Cincinnati... 26,114 3, ,602 8,034 9,031 2,140 1, Total, 1st 50 institutions... 3,462, , , , , , , , ,
200 Table B-48. R&D expenditures in engineering subfields at universities and colleges: fiscal year 2001 Page 2 of 3 Aero/ Bioengin- Metal- Institution and ranking Total astro- eering/ Chemical Civil Elec- Mechan- lurgical Other nautical Biomed- trical ical and ical materials 51 University of Virginia... 25, ,742 1,974 1,988 6,221 4,271 6,781 1, U of Central Florida... 25,575 1, ,149 3,165 1,303 16,249 1, U of South Carolina... 25, ,280 1,815 11,429 3, , University of Utah... 25, ,958 5,690 7,452 1,528 2,179 3,625 1, University of Delaware... 25, ,324 5,913 4,956 3, , U of Iowa... 24, ,132 2,559 8,837 2,207 3, , University of New Mexico... 24, ,028 5,510 6, ,669 1, U of Nebraska at Lincoln... 24, ,210 3,071 5,482 4,199 2,539 1,735 5, Lehigh University... 23, ,471 7,211 2,626 2,815 5,530 3, Drexel University... 22, ,107 1,560 2,494 11,384 1,613 2,502 1,107 Total, 1st 60 institutions... 3,710, , , , , , , , , U of Missouri Columbia... 22, ,285 4,693 4,255 2,060 3,601 5, Case Western Reserve U... 22, ,297 5, ,547 4,424 3, U of Missouri Rolla... 21, ,528 4,787 3,369 6,771 3, Michigan State University... 20, ,874 3,006 3,481 4,746 1,989 2, U of IL Chicago... 20, ,391 1,023 2,613 8,495 4, University of Alabama, The... 19,965 3, ,321 3, ,629 3,254 4, Michigan Tech University... 19, ,622 5,664 1,152 5,269 3,611 2, University of Houston... 19,320 2, ,313 2,546 2,772 2,039 6, Florida International U... 19, , , Woods Hole Oceanogr Inst... 19,180 1,360 i 0 i 1,415 i 1,493 i 4,763 i 4,113 i 0 i 6,036 i Total, 1st 70 institutions... 3,916, , , , , , , , , U of New Hampshire... 19, ,469 10,259 1, U of South Florida... 19, ,694 3,532 1,063 1, U of MA Amherst... 18, ,748 3,816 6,617 4, Oklahoma State University... 18, ,428 2,143 1,836 2, , Boston University... 18, , , , U CA Irvine... 18, ,284 2,499 4,564 5,209 3, West Virginia University... 17, ,634 2,435 3,933 7, , Oregon State University... 17, , ,497 2,280 1,396 1,634 5, Columbia U in City of NY... 16, ,050 1, , ,065 8, U of Alabama Huntsville... 16, , ,300 5, ,115 Total, 1st 80 institutions... 4,095, , , , , , , , , Duke University... 16, , ,367 6,483 3, Colorado School of Mines... 16, , ,818 2, University of Kansas... 15,850 2, ,199 3,527 6, NM Inst Mining & Tech... 15, , , Texas Tech University... 15, ,371 4,639 5, , University of Pittsburgh... 15, ,907 3, , ,225 2, Washington State U... 15, ,691 1,106 2,950 3,178 2,224 2, SUNY at Stony Brook... 15, , ,741 2,289 6,414 1, Vanderbilt University... 15, ,381 1,038 1,775 6,702 2, Kansas State University... 15, ,494 2, , ,468 Total, 1st 90 institutions... 4,252, , , , ,854 1,009, , , ,
201 Table B-48. R&D expenditures in engineering subfields at universities and colleges: fiscal year 2001 Page 3 of 3 Aero/ Bioengin- Metal- Institution and ranking Total astro- eering/ Chemical Civil Elec- Mechan- lurgical Other nautical Biomed- trical ical and ical materials 91 Brown University... 14,337 1,017 i 0 i 1,032 i 1,096 i 3,441 i 3,278 i 0 i 4,473 i 92 U of Pennsylvania... 14, ,033 1, ,616 3,105 3, Dartmouth College... 14, ,705 1, , University of Oklahoma... 14, ,985 3,493 2,747 2, Northeastern University... 13, , ,705 1, , Rose-Hulman Inst of Tech... 13, , ,013 5, , Old Dominion University... 13,122 2, ,516 1, , U of Arkansas Main... 12, ,443 4,595 1, , Wichita State University... 12,298 10, University of Idaho... 12, ,472 2,085 1,138 2,263 4,462 Total, 1st 100 institutions... 4,385, , , , ,128 1,042, , , ,068 Total, all other sampled institutions ,692 43,723 29,246 61,524 80, ,443 99,705 36, ,667 1 Johns Hopkins University includes the Applied Physics Laboratory. KEY: i = imputed NOTE: Because of rounding, detail may not add to totals. SOURCE: National Science Foundation/Division of Science Resources Statistics, Survey of Research and Development Expenditures at Universities and Colleges, Fiscal Year
202 Table B-49. Federally financed R&D expenditures in engineering subfields at universities and colleges: fiscal year 2001 Page 1 of 3 Aero/ Bioengin- Metal- Institution and ranking Total astro- eering/ Chemical Civil Elec- Mechan- lurgical Other nautical Biomed- trical ical and ical materials Total, all institutions... 2,843, , , , , , , , ,866 1 Johns Hopkins U ,116 26,671 i 10,302 i 5,817 i 4,579 i 83,163 i 56,798 i 513 i 90,273 2 Pennsylvania State U ,576 1,689 1,501 7,320 5,133 36,520 13,143 21,043 24,227 3 MA Institute of Tech ,226 12,812 9,991 11,212 7,343 20,334 11,114 8,560 20,860 4 Georgia Institute of Tech... 94,589 8,576 3,487 3,629 5,372 43,965 12,447 5,124 11,989 5 Stanford University... 92,036 6, ,354 6,807 21,179 16,780 2,363 32,291 6 University of Michigan... 91,611 3,701 2,525 2,708 6,801 29,503 16,390 1,511 28,472 7 U TX at Austin... 72,061 7,803 2,397 2,830 1,135 26,227 8,652 10,740 12,277 8 U of IL Urbana-Champaign... 60,525 3, ,937 9,700 21,122 7,203 9,700 6,152 9 U CA Berkeley... 54, ,392 8,847 31, , U of WI-Madison... 50, ,326 4,219 3,529 5,343 1,335 1,637 33,176 Total, 1st 10 institutions... 1,006,859 71,225 31,582 49,418 59, , ,862 61, , Utah State University... 48,154 30, ,535 13, , California Inst of Tech... 41,810 7, ,013 4,849 13,196 4,840 1,523 5, University of Rochester... 41, , ,331 30, , U of MD at College Park... 39,841 8, ,136 1,387 9,917 6,889 3,793 8, New Mexico State Univ... 39,664 16, , , ,657 8, U of Southern California... 37,144 2,305 2,669 1,185 3,231 20,420 2,076 1,830 3, VA Polytech Inst & St U... 32,817 1, ,276 10,902 6,201 2,131 4, NC State University... 32,403 3, ,162 3,841 5,921 2,832 4,488 3, University of Dayton... 32,310 3, ,369 14,930 5, Texas A&M University... 31,514 3, ,263 6,513 1,759 3, ,012 Total, 1st 20 institutions... 1,383, ,941 36,023 72,833 86, , ,460 91, , University of Arizona... 31,493 2, ,520 8,385 7,780 7, , Mississippi State U... 30, , , U of Washington... 30,547 2,474 2,810 3,417 6,880 1, , Purdue University... 30,109 2,791 1,964 1,966 2,642 10,591 3,403 1,196 5, Cornell University... 29,776 2, ,311 2,118 9, ,347 11, Northwestern University... 28, ,254 1,970 2,335 3,990 2,668 7,351 8, U CA Los Angeles... 28, , ,208 10,475 1, Ohio State University... 25, ,835 1,586 4,046 4,513 6,805 6, University of Florida... 25,759 2, ,342 4,375 2,228 1,996 7,283 6, Carnegie Mellon U... 25, ,754 2,478 8,214 1,616 3,148 6,117 Total, 1st 30 institutions... 1,670, ,805 44,138 94, , , , , , University of Minnesota... 25,585 3, ,194 3,412 4,718 6, , University of Colorado... 24,704 11, ,535 4,508 3,746 2, U CA San Diego... 24, ,203 3, ,680 4, , Clemson University... 23, ,474 1,563 5,439 4,928 2,364 4, U CA Santa Barbara... 23, , ,234 1,657 7, Princeton University... 23,363 4, ,839 2,476 7, , University of New Mexico... 20, ,607 4,298 4, , Colorado State University... 19, , ,739 2, University of Virginia... 19, ,270 1,485 1,643 4,258 2,892 5,937 1, Louisiana State U System... 19, , ,179 3,943 11,913 Total, 1st 40 institutions... 1,896, ,610 64, , , , , , , Arizona State University... 18, ,890 2,104 4,321 4,066 3, , Rensselaer Polytech Inst... 18, ,834 1,809 3,689 1,705 2,826 5, SUNY at Buffalo... 17,080 7,740 1, ,132 1, Iowa State University... 16,995 7, ,253 2, ,013 2, Drexel University... 16, , ,775 1,111 1,643 1, Case Western Reserve U... 16, ,228 2, ,061 3,587 3, Boston University... 16, , , , Woods Hole Oceanogr Inst... 15,368 1,094 i 0 i 1,195 i 1,207 i 4,016 i 2,981 i 0 i 4, University of Utah... 15, ,745 3,934 3, ,921 2, Auburn University... 15, ,433 2,469 2,710 1,917 1,201 3,936 Total, 1st 50 institutions... 2,062, ,176 87, , , , , , ,
203 Table B-49. Federally financed R&D expenditures in engineering subfields at universities and colleges: fiscal year 2001 Page 2 of 3 Aero/ Bioengin- Metal- Institution and ranking Total astro- eering/ Chemical Civil Elec- Mechan- lurgical Other nautical Biomed- trical ical and ical materials 51 U of South Carolina... 15, ,513 1,097 7,908 1, U of Tennessee System... 14,608 4, ,641 1, ,289 3, U CA Davis... 14, ,703 3,023 1,897 2,305 1, , Columbia U in City of NY... 13, , , University of Kentucky... 13, , ,311 1, , University of Delaware... 13, ,417 3,065 2,509 1, , U of Alabama Huntsville... 13, , ,191 4, , University of Alabama, The... 12,955 3, ,793 1, ,121 2,136 2, NJ Inst of Technology... 12, ,553 1, Rutgers the State U NJ... 12, , ,904 4,414 3,019 1,010 Total, 1st 60 institutions... 2,198, ,563 91, , , , , , , University of Cincinnati... 12, ,961 4, Duke University... 12, , ,046 2, Vanderbilt University... 11, , ,239 5,669 1, Michigan Tech University... 11, , ,362 2, Naval Postgrad School... 10,672 i 3,542 i 0 i 0 i 0 i 4,365 i 2,145 i 620 i 0 66 U of Pennsylvania... 10, ,469 1, ,323 2,405 2, Oregon State University... 10, , ,248 1, , Florida International U... 10, , U of IL Chicago... 10, ,204 2, Dartmouth College... 10, ,214 1, ,145 Total, 1st 70 institutions... 2,308, , , , , , , , , U Houston Clear Lake... 10,214 10, Lehigh University... 9, ,016 1,810 1,612 1,379 3, U of Iowa... 9, ,224 3,113 1,647 1, , Old Dominion University... 9,440 1, , Brown University... 9, i 0 i 710 i 729 i 2,428 i 1,789 i 0 i 2, U of Missouri Rolla... 8, ,149 2,636 1,322 2, Northeastern University... 8, , , , Washington State U... 8, ,560 1,115 1,558 2, U of Missouri Columbia... 8, ,173 2, , George Washington U... 8,371 1, , ,867 Total, 1st 80 institutions... 2,400, , , , , , , , , NC A&T State University... 8, ,516 1,775 2, , Florida Atlantic U... 8, , , Mercer University... 8, ,770 4, University of Kansas... 7,895 1, ,164 1,696 3, NM Inst Mining & Tech... 7, , , University of Pittsburgh... 7, , , George Mason University... 7, , , U of North Dakota... 7, , West Virginia University... 7, ,171 2,146 3, University of Notre Dame... 7,549 1, ,102 1,259 3, Total, 1st 90 institutions... 2,478, , , , , , , , ,
204 Table B-49. Federally financed R&D expenditures in engineering subfields at universities and colleges: fiscal year 2001 Page 3 of 3 Aero/ Bioengin- Metal- Institution and ranking Total astro- eering/ Chemical Civil Elec- Mechan- lurgical Other nautical Biomed- trical ical and ical materials 91 U CA Irvine... 7, ,751 1,042 2,025 2, U of New Hampshire... 7, ,876 2,616 1, Florida State University... 7, , , SUNY at Stony Brook... 7, ,085 1,365 3, Oklahoma State University... 7, , Rice University... 7, , , Michigan State University... 6, , ,319 2, U of MA Amherst... 6, ,379 1, U of South Florida... 6, ,548 1, Montana St U Bozeman... 6, , , , Total, 1st 100 institutions... 2,548, , , , , , , , ,702 Total, all other sampled institutions ,564 24,185 10,396 37,940 38,049 66,653 44,612 22,565 51,164 1 Johns Hopkins University includes the Applied Physics Laboratory. KEY: i = imputed NOTE: Because of rounding, detail may not add to totals. SOURCE: National Science Foundation/Division of Science Resources Statistics, Survey of Research and Development Expenditures at Universities and Colleges, Fiscal Year
205 Table B-50. R&D expenditures in the physical sciences at universities and colleges, ranked by fiscal year 2001 R&D expenditures in the physical sciences: fiscal years and by subfield for 2001 Page 1 of , by subfield Institution and ranking Astronomy Chemistry Physics Other Total, all institutions... 2,482,134 2,603,777 2,708,242 2,800, ,037 1,007,136 1,236, ,689 1 Johns Hopkins U , ,817 97, ,414 40,837 12,124 52,412 6,041 2 California Inst of Tech... 86, , , ,479 33,249 15,357 58, MA Institute of Tech ,899 92,189 92,198 92,608 14,693 18,063 58,449 1,403 4 U CA Berkeley... 76,164 93,676 90,306 79,469 8,383 21,339 48,272 1,475 5 University of Arizona... 71,248 83,227 83,227 72,131 57,604 9,908 4, University of Colorado... 45,369 48,157 72,003 71,362 42,268 14,229 14, U CA Los Angeles... 36,402 41,873 45,035 68,170 20,284 15,071 32, Cornell University... 60,854 79,447 70,153 61,239 9,899 11,013 34,050 6,277 9 U TX at Austin... 83,029 65,875 56,338 58,845 8,306 11,640 37,520 1, Pennsylvania State U... 25,966 37,420 42,461 55,196 15,729 18,042 21, Total, 1st 10 institutions , , , , , , ,000 17, Stanford University... 58,555 54,521 53,594 54, ,752 6,103 32, U of WI-Madison... 38,814 41,526 46,678 49,127 5,865 12,935 22,952 7, U of MD at College Park... 50,105 53,959 53,718 47,085 7,280 7,242 18,202 14, U of IL Urbana-Champaign... 45,258 48,846 48,612 47,013 5,918 20,091 21, Michigan State University... 30,143 31,712 39,788 45, ,488 34, Florida State University... 50,612 41,417 43,626 42, ,635 30, Harvard University... 27,527 30,424 32,530 35,170 3,225 17,446 12,745 1, University of Minnesota... 17,404 17,382 24,475 35,028 1,954 8,860 24, Indiana University... 21,275 25,926 29,682 34, ,316 19, Columbia U in City of NY... 24,154 21,500 26,104 34,612 4,251 7,983 2,493 19,885 Total, 1st 20 institutions... 1,081,476 1,139,030 1,165,701 1,203, , , ,340 93, University of Chicago... 29,352 34,942 35,534 33,192 14,099 9,403 8, U CA San Diego... 37,948 36,154 33,652 33,185 6,110 11,131 13,566 2, U CA Santa Cruz... 22,681 22,600 23,844 31,117 16,778 5,838 8, U of Washington... 22,595 26,090 27,122 29,784 3,318 9,597 16, Princeton University... 28,114 28,018 27,100 29,244 3,928 11,314 14, Rutgers the State U NJ... 20,261 22,632 23,768 26, ,190 13, Univ of Hawaii at Manoa... 26,192 24,828 26,699 26,405 20,594 1,698 4, Texas A&M University... 20,765 28,733 24,131 25, ,206 7,363 1, University of Michigan... 23,072 21,915 23,407 25,654 1,107 10,957 13, NC State University... 15,387 15,759 20,814 25, ,143 14, Total, 1st 30 institutions... 1,327,843 1,400,701 1,431,772 1,489, , , ,202 99, SUNY at Stony Brook... 23,978 24,363 24,797 25,283 1,222 6,730 17, U CA Santa Barbara... 18,068 21,057 23,459 24, ,656 12,191 5, Ohio State University... 19,733 19,535 24,446 23,906 1,505 12,174 10, U of Pennsylvania... 24,546 24,775 24,780 23, ,110 12, University of Florida... 21,774 21,498 20,005 23,388 2,150 11,460 9, Northwestern University... 15,888 18,142 20,408 22, ,733 5,218 3, Arizona State University... 19,916 19,937 19,021 22, ,416 4,258 5, U CA Davis... 13,053 14,193 18,183 21, ,771 4,872 9, Georgia Institute of Tech... 21,968 19,539 21,141 21, ,027 11, U of MA Amherst... 23,045 18,041 20,094 20,876 5,901 10,509 4, Total, 1st 40 institutions... 1,529,812 1,601,781 1,648,106 1,719, , , , , Purdue University... 22,130 21,007 20,095 20, ,194 8, Yale University... 17,397 18,596 18,830 20,108 1,022 6,751 12, U CA Irvine... 17,542 17,328 16,519 17, ,863 7, Louisiana State U System... 13,540 16,153 17,479 17, ,632 8, U of NC Chapel Hill... 11,750 15,851 17,580 17, ,652 4, U of Central Florida... 9,795 10,970 13,656 16, ,714 13, U of South Carolina... 11,655 12,078 12,921 16, ,228 4,508 2, U of Iowa... 15,049 14,766 15,985 15,080 1,001 3,820 10, University of Utah... 11,105 13,983 15,453 14, ,086 4, Wayne State University... 10,777 11,190 11,683 14, ,874 7,642 0 Total, 1st 50 institutions... 1,670,552 1,753,703 1,808,307 1,889, , , , ,
206 Table B-50. R&D expenditures in the physical sciences at universities and colleges, ranked by fiscal year 2001 R&D expenditures in the physical sciences: fiscal years and by subfield for 2001 Page 2 of , by subfield Institution and ranking Astronomy Chemistry Physics Other 51 University of Notre Dame... 13,158 13,360 15,252 13, ,960 4, U CA San Francisco ,332 13, , University of Oklahoma... 12,401 12,958 15,549 13, ,574 3, U of Alaska Fairbanks... 14,507 i 32,102 37,044 13, ,137 11, Boston University... 12,897 11,945 12,569 13,499 1,029 2,557 4,629 5, U Mississippi, All Camp... 4,111 4,411 10,177 13, , Duke University... 15,187 17,061 13,288 13, ,417 8, University of Pittsburgh... 10,108 10,668 11,914 13, ,943 4, Washington University... 8,942 10,457 10,535 12, ,035 7, University of Rochester... 13,815 13,049 13,461 12,860 1,219 3,246 8,395 0 Total, 1st 60 institutions... 1,775,678 1,879,714 1,960,428 2,023, , , , , University of Delaware... 9,466 10,144 11,038 12, ,043 2,582 4, Catholic U of America... 5,094 7,987 6,628 12, ,353 3,053 8, Rice University... 9,187 10,698 11,909 12,701 1,999 7,390 3, Montana St U Bozeman... 6,682 7,279 10,712 11, ,542 7, University of Virginia... 11,639 11,938 12,397 11,538 1,548 6,583 3, University of Georgia... 10,061 9,866 10,068 10, ,977 3, Iowa State University... 9,599 9,105 9,232 10, ,503 5, U of Southern California... 11,068 10,415 10,177 10, ,010 1, U of Nebraska at Lincoln... 5,467 i 10,463 10,888 9, ,475 4, Kansas State University... 7,348 7,916 8,062 9, ,561 7,396 0 Total, 1st 70 institutions... 1,861,289 1,975,525 2,061,539 2,136, , , , , Vanderbilt University... 10,725 14,698 12,865 9, ,171 6, U of Alabama Huntsville... 6,447 8,624 8,185 9, ,413 4, Northeastern University... 6,158 6,722 12,507 9, ,677 7, U of Tennessee System... 11,586 12,404 10,933 9, ,044 6, Brown University... 8,005 8,027 8,806 9, ,330 5, University of Houston... 7,770 9,102 8,571 9, ,074 3, Emory University... 5,989 6,304 8,355 9, ,037 1, Carnegie Mellon U... 8,485 8,586 7,942 9, ,867 5, VA Polytech Inst & St U... 9,015 8,030 10,223 9, ,461 1, SUNY at Buffalo... 10,913 10,338 9,790 9, ,711 3, Total, 1st 80 institutions... 1,946,382 2,068,360 2,159,716 2,231, , , , , U of IL Chicago... 8,597 8,317 8,186 9, ,023 5, Colorado State University... 10,450 8,514 8,469 8, ,917 2, SUNY at Albany... 6,201 8,051 10,423 8, ,252 7, University of Akron... 8,380 6,820 8,279 8, , Clemson University... 5,769 6,049 6,996 8, ,933 4, University of Oregon... 7,325 7,728 7,267 7, ,969 3, Boston College... 4,410 6,377 7,638 7, ,843 1, University of Kentucky... 5,386 5,623 8,068 7, ,121 3, Hampton University... 4,942 5,463 3,826 7, , University of Connecticut... 4,253 4,671 7,097 7, ,666 3,508 0 Total, 1st 90 institutions... 2,012,095 2,135,973 2,235,965 2,312, , ,058 1,035, ,
207 Table B-50. R&D expenditures in the physical sciences at universities and colleges, ranked by fiscal year 2001 R&D expenditures in the physical sciences: fiscal years and by subfield for 2001 Page 3 of , by subfield Institution and ranking Astronomy Chemistry Physics Other 91 U CA Riverside... 6,516 6,883 7,627 7, ,859 2, U of Arkansas Main... 4,983 3,955 5,560 7, ,273 3, Temple University... 1,611 2,303 4,676 6, , Kent State University... 8,213 6,844 6,620 6, ,077 1,741 4, NJ Inst of Technology... 3,127 3,127 1,382 6, ,449 4, University of New Mexico... 10,518 8,679 11,000 6, ,639 3, University of Kansas... 10,356 11,388 10,207 6, ,099 2, Oklahoma State University... 5,432 7,005 6,282 6, ,363 3, CUNY City College... 8,273 6,843 6,253 6, ,053 2, Texas Tech University... 5,435 6,401 5,230 6, ,150 1,878 0 Total, 1st 100 institutions... 2,076,559 2,199,401 2,300,802 2,378, , ,987 1,067, ,089 Total, all other sampled institutions , , , ,201 10, , ,570 24,600 1 Johns Hopkins University includes the Applied Physics Laboratory KEY: i = imputed NOTE: Because of rounding, detail may not add to totals. SOURCE: National Science Foundation/Division of Science Resources Statistics, Survey of Research and Development Expenditures at Universities and Colleges, Fiscal Year
208 Table B-51. Federally financed R&D expenditures in the physical sciences at universities and colleges, ranked by fiscal year 2001 federally financed R&D expenditures in the physical sciences: fiscal years and by subfield for 2001 Page 1 of , by subfield Institution and ranking Astronomy Chemistry Physics Other Total, all institutions... 1,761,115 1,860,315 1,911,267 1,971, , , , ,909 1 Johns Hopkins U , ,458 95, ,309 39,785 11,681 51,802 6,041 2 California Inst of Tech... 85, , , ,362 32,772 13,092 57, MA Institute of Tech... 88,749 89,506 89,453 89,881 14,642 16,380 57,628 1,231 4 University of Colorado... 30,826 35,611 64,056 64,575 39,049 12,242 12, U CA Berkeley... 41,521 55,380 53,882 52,604 3,630 14,617 34, Stanford University... 54,226 49,719 48,464 48, ,425 5,770 29,307 7 Cornell University... 42,519 64,965 53,842 44,655 2,984 7,743 29,203 4,725 8 U TX at Austin... 73,686 48,402 41,510 42,500 3,596 5,163 33, University of Arizona... 43,855 53,756 50,078 40,321 29,292 7,336 3, Pennsylvania State U... 14,039 23,617 27,124 36,777 13,005 10,201 13,571 0 Total, 1st 10 institutions , , , , , , ,820 42, Columbia U in City of NY... 21,098 20,581 25,462 33,143 4,241 7,306 2,018 19, U of MD at College Park... 31,953 32,933 34,162 32,982 5,809 5,825 13,938 7, U of WI-Madison... 28,330 28,915 31,742 32,878 2,656 7,301 17,960 4, Harvard University... 26,770 29,956 29,920 31,346 3,202 14,166 12,225 1, U CA Los Angeles... 24,211 27,925 29,115 31, ,339 19, U of IL Urbana-Champaign... 31,570 32,938 33,653 30,747 3,922 12,239 14, Michigan State University... 19,658 20,998 25,026 28, ,425 23, University of Chicago... 26,486 32,554 31,905 27,664 13,751 5,643 8, University of Minnesota... 14,874 14,357 18,442 26,233 1,614 6,476 18, U CA San Diego... 28,576 27,724 25,391 25,428 4,494 8,742 10,310 1,882 Total, 1st 20 institutions , , , , , , ,603 77, U of Pennsylvania... 23,326 22,655 22,163 21, ,112 11, University of Michigan... 17,171 17,108 18,693 20, ,722 10, U of Washington... 16,608 19,299 20,168 20,482 1,650 6,437 12, Florida State University... 25,596 22,962 21,881 19, ,873 15, U CA Santa Barbara... 13,938 16,479 17,170 19, ,657 9,260 5, Princeton University... 19,863 20,381 18,039 18,987 1,524 6,291 11, Yale University... 15,267 16,174 15,835 17, ,854 11, Indiana University... 17,336 17,701 17,177 17, ,212 10, SUNY at Stony Brook... 16,404 16,514 16,751 16, ,446 11, Northwestern University... 10,954 12,193 14,565 15, ,383 3,492 1,632 Total, 1st 30 institutions... 1,034,102 1,094,687 1,102,330 1,121, , , ,323 85, University of Florida... 10,061 13,638 12,162 14,446 1,436 7,228 5, U CA Davis... 8,968 9,574 12,936 14, ,645 3,206 5, Ohio State University... 11,209 11,827 12,728 13,936 1,036 6,734 6, U of NC Chapel Hill... 8,181 12,453 13,796 13, ,150 3, Univ of Hawaii at Manoa... 12,873 12,752 14,039 13,645 8,528 1,258 3, Rutgers the State U NJ... 10,537 12,310 12,579 13, ,972 5, Purdue University... 14,045 13,162 12,804 13, ,831 5, Boston University... 10,550 11,472 12,004 12, ,374 4,535 5, University of Notre Dame... 11,410 11,755 13,117 12, ,177 4, U of Iowa... 11,749 11,564 12,384 12,700 1,001 2,427 9,272 0 Total, 1st 40 institutions... 1,143,685 1,215,194 1,230,879 1,256, , , ,805 95, U CA Irvine... 12,479 12,187 11,410 12, ,180 5, NC State University... 8,565 6,258 9,498 12, ,427 6, U CA Santa Cruz... 8,323 8,250 9,449 11,894 4,515 3,852 3, U Mississippi, All Camp... 3,206 3,859 9,574 11, , U of MA Amherst... 13,750 9,026 10,292 11,495 4,009 5,467 2, University of Pittsburgh... 8,348 9,009 10,273 11, ,812 3, University of Rochester... 12,645 12,076 12,455 11,298 1,115 2,691 7, Texas A&M University... 11,139 11,842 11,732 11, ,629 4, U CA San Francisco ,033 11, , Louisiana State U System... 8,015 9,094 9,796 10, ,828 5,033 0 Total, 1st 50 institutions... 1,230,155 1,296,795 1,334,391 1,371, , , ,771 96,
209 Table B-51. Federally financed R&D expenditures in the physical sciences at universities and colleges, ranked by fiscal year 2001 federally financed R&D expenditures in the physical sciences: fiscal years and by subfield for 2001 Page 2 of , by subfield Institution and ranking Astronomy Chemistry Physics Other 51 Duke University... 12,906 14,936 11,171 10, ,619 8, University of Utah... 9,158 12,515 10,264 10, ,483 3, Catholic U of America... 3,865 7,042 5,737 10, ,833 6, Rice University... 7,225 8,674 9,784 10,359 1,812 5,627 2, University of Virginia... 10,171 10,575 10,236 9,901 1,427 5,328 3, Georgia Institute of Tech... 9,631 8,362 8,759 9, ,236 5, Arizona State University... 9,996 9,978 9,177 9, ,237 2,724 1, Washington University... 6,770 7,644 7,848 9, ,826 5, Montana St U Bozeman... 5,355 5,718 8,079 9, ,632 5, University of Delaware... 6,868 7,113 7,945 9, ,023 1,625 3,470 Total, 1st 60 institutions... 1,312,100 1,389,352 1,423,391 1,471, , , , , U of South Carolina... 7,236 7,007 8,076 8, ,316 2, Kansas State University... 5,819 6,181 6,605 8, ,856 6, Vanderbilt University... 9,043 13,027 10,673 8, ,717 5, University of Oklahoma... 6,079 6,383 8,894 7, ,025 1, U of Tennessee System... 7,175 7,641 6,445 7, ,467 5, Wayne State University... 4,376 4,399 5,114 7, ,053 3, Northeastern University... 5,474 5,036 11,091 7, ,851 5, Carnegie Mellon U... 5,728 5,804 6,276 7, ,341 4, U of Alabama Huntsville... 4,940 6,235 5,626 7, ,665 3, U of Southern California... 8,799 8,099 7,862 6, ,187 1,494 0 Total, 1st 70 institutions... 1,376,769 1,459,164 1,500,053 1,548, , , , , Colorado State University... 7,529 6,706 6,338 6, ,916 1, University of Oregon... 6,034 6,503 6,075 6, ,256 3, Hampton University... 4,603 5,159 3,547 6, , U of Alaska Fairbanks... 7,805 i 16,116 21,678 6, , Temple University... 1,046 1,264 4,072 6, , Emory University... 4,701 4,845 5,658 6, , U of Nebraska at Lincoln... 4,269 i 5,508 5,504 6, ,480 2, U of IL Chicago... 4,840 4,801 5,412 5, ,793 3, Iowa State University... 5,258 4,528 4,714 5, ,860 2, Boston College... 3,420 4,708 5,424 5, ,331 1,394 0 Total, 1st 80 institutions... 1,426,274 1,519,302 1,568,475 1,611, , , , , University of New Mexico... 7,997 7,562 8,668 5, ,961 3, U of Central Florida... 4,300 3,884 3,106 5, ,234 4, Case Western Reserve U... 5,044 5,413 4,297 5, ,985 2, Georgetown University... 3,364 4,372 3,980 5, , University of Kentucky... 3,422 3,319 5,029 5, ,249 2, New Mexico State Univ... 3,395 3,838 3,556 5, ,732 1, Kent State University... 5,274 5,414 4,643 5, ,306 3, Brown University... 4,117 4,179 4,771 5, ,158 2, U CA Riverside... 5,299 4,966 5,578 5, ,104 1, Colorado School of Mines... 2,510 3,430 5,842 5, ,530 0 Total, 1st 90 institutions... 1,470,996 1,565,679 1,617,945 1,663, , , , ,
210 Table B-51. Federally financed R&D expenditures in the physical sciences at universities and colleges, ranked by fiscal year 2001 federally financed R&D expenditures in the physical sciences: fiscal years and by subfield for 2001 Page 3 of , by subfield Institution and ranking Astronomy Chemistry Physics Other 91 U of MD Baltimore County... 5,711 2,066 3,227 4, ,012 1, CUNY City College... 6,683 5,538 4,995 4, ,913 1, University of Houston... 4,051 4,872 3,897 4, ,889 1, U of Maine ,654 6,459 4, , U of Arkansas Main... 2,345 2,288 2,858 4, ,134 2, Washington State U... 3,615 4,258 4,090 4, ,245 2, Syracuse University... 5,954 5,249 4,925 4, ,929 2, Clemson University... 1,805 1,648 1,906 4, ,835 2, U of Nevada Reno... 1,752 3,774 4,659 4, , NJ Inst of Technology... 1,958 1, , ,459 2,883 0 Total, 1st 100 institutions... 1,505,607 1,600,984 1,655,654 1,710, , , , ,240 Total, all other sampled institutions , , , ,313 6, , ,844 12,669 1 Johns Hopkins University includes the Applied Physics Laboratory. KEY: i = imputed NOTE: Because of rounding, detail may not add to totals. SOURCE: National Science Foundation/Division of Science Resources Statistics, Survey of Research and Development Expenditures at Universities and Colleges, Fiscal Year
211 Table B-52. Total and federally financed R&D expenditures in chemistry at universities and colleges, ranked by fiscal year 2001 total R&D expenditures in chemistry: fiscal years Page 1 of 3 Total Federally financed Institution and ranking Total, all institutions , , ,922 1,007, , , , ,288 1 U CA Berkeley... 20,638 21,071 21,471 21,339 14,637 14,195 15,774 14,617 2 U of IL Urbana-Champaign... 18,038 19,426 17,667 20,091 11,436 11,621 10,294 12,239 3 MA Institute of Tech... 11,050 17,050 18,756 18,063 9,201 15,244 16,690 16,380 4 Pennsylvania State U... 16,075 15,962 16,075 18,042 8,852 9,727 9,797 10,201 5 Harvard University... 11,185 14,112 16,957 17,446 10,639 13,890 14,788 14,166 6 Texas A&M University... 9,560 17,576 15,385 17,206 5,211 5,571 6,986 6,629 7 Stanford University... 12,306 11,835 12,947 15,752 10,658 9,778 10,973 13,425 8 California Inst of Tech... 17,760 16,310 15,538 15,357 17,629 13,829 12,866 13,092 9 U CA Los Angeles... 11,769 13,158 13,564 15,071 9,521 10,604 10,432 11, Indiana University... 7,982 8,202 10,812 14,316 6,047 5,733 5,988 6,212 Total, 1st 10 institutions , , , , , , , , University of Colorado... 12,948 11,889 12,251 14,229 10,446 9,618 10,281 12, U CA San Francisco ,332 13, ,033 11, Northwestern University... 9,843 10,471 11,373 13,733 7,096 8,126 8,865 10, Rutgers the State U NJ... 9,622 11,543 12,351 13,190 6,790 7,673 8,071 7, U of WI-Madison... 12,011 13,196 14,758 12,935 7,695 8,287 8,094 7, U of NC Chapel Hill... 8,368 8,583 10,080 12,652 5,905 6,159 7,556 10, Arizona State University... 9,583 8,782 8,979 12,416 4,287 4,035 4,304 5, Purdue University... 12,548 12,021 11,260 12,194 8,212 7,523 6,958 7, Ohio State University... 9,679 8,110 13,141 12,174 5,069 4,629 5,529 6, Johns Hopkins U... 18,541 18,297 12,616 12,124 18,280 17,961 12,217 11,681 Total, 1st 20 institutions , , , , , , , , U TX at Austin... 11,397 11,159 10,142 11,640 7,123 6,547 5,749 5, Florida State University... 7,890 9,395 11,631 11,635 3,304 4,536 4,229 3, University of Florida... 11,675 11,034 10,070 11,460 5,309 7,682 6,088 7, Princeton University... 8,973 9,477 9,850 11,314 5,727 6,092 6,068 6, NC State University... 4,507 4,372 7,813 11,143 2,288 1,998 4,016 5, U CA San Diego... 10,297 10,725 9,831 11,131 7,802 8,710 7,251 8, U of Pennsylvania... 11,669 10,994 12,886 11,110 11,283 10,624 11,992 10, Cornell University... 12,031 14,132 14,002 11,013 8,682 9,633 9,103 7, University of Michigan... 7,820 7,744 9,009 10,957 6,230 5,862 7,317 8, University of Oklahoma... 9,922 10,225 12,512 10,574 4,656 4,817 7,377 6,025 Total, 1st 30 institutions , , , , , , , , U of MA Amherst... 11,131 10,269 11,267 10,509 6,240 4,921 5,667 5, Michigan State University... 5,507 6,106 8,247 10,488 3,641 3,969 4,486 5, University of Utah... 7,398 9,359 8,420 10,086 6,122 8,668 7,172 7, University of Arizona... 6,588 8,524 9,699 9,908 4,882 6,396 7,265 7, U CA Irvine... 8,425 10,036 9,683 9,863 6,335 7,289 6,979 7, U of Washington... 7,097 8,100 9,167 9,597 4,978 5,578 6,493 6, University of Chicago... 8,189 9,484 8,676 9,403 6,671 8,349 6,519 5, U of South Carolina... 7,357 7,727 9,321 9,228 4,679 4,849 5,826 5, Georgia Institute of Tech... 10,869 8,919 9,962 9,027 4,765 3,817 4,127 4, University of Notre Dame... 8,658 9,006 10,010 8,960 7,740 7,998 8,826 8,177 Total, 1st 40 institutions , , , , , , , , University of Minnesota... 7,574 7,241 8,472 8,860 6,446 5,799 6,122 6, Louisiana State U System... 5,752 8,350 8,543 8,632 3,297 5,085 5,254 5, University of Akron... 8,326 6,775 8,214 8,108 1,497 2,487 2,507 3, Emory University... 5,230 5,535 7,155 8,037 4,181 4,162 4,917 5, U of Southern California... 7,900 7,545 7,551 8,010 6,089 5,758 5,762 5, Columbia U in City of NY... 8,753 7,377 7,072 7,983 7,849 6,899 6,747 7, University of Pittsburgh... 6,097 6,435 7,459 7,943 4,765 5,270 6,436 6, Rice University... 4,518 5,516 6,605 7,390 3,094 3,892 4,856 5, U of MD at College Park... 6,635 8,330 6,197 7,242 4,269 4,580 5,060 5, University of Georgia... 6,118 6,266 6,560 6,977 1,839 1,691 1,736 2,087 Total, 1st 50 institutions , , , , , , , ,
212 Table B-52. Total and federally financed R&D expenditures in chemistry at universities and colleges, ranked by fiscal year 2001 total R&D expenditures in chemistry: fiscal years Page 2 of 3 Total Federally financed Institution and ranking Wayne State University... 5,330 5,841 5,760 6,874 3,116 3,489 3,984 4, U CA Davis... 4,562 5,010 5,972 6,771 3,480 4,196 4,752 5, Yale University... 6,997 7,329 6,888 6,751 5,921 5,914 5,369 5, SUNY at Stony Brook... 6,533 7,240 6,774 6,730 4,320 4,892 4,773 4, U CA Santa Barbara... 5,620 6,997 7,056 6,656 4,175 5,364 4,946 4, University of Virginia... 5,847 6,715 7,697 6,583 4,918 5,774 5,892 5, VA Polytech Inst & St U... 7,037 6,257 7,724 6,461 3,482 3,271 3,435 2, University of Houston... 5,008 5,891 5,411 6,074 2,537 3,077 2,437 2, University of Delaware... 4,243 4,711 5,418 6,043 2,877 2,735 3,576 4, Colorado State University... 7,753 6,401 5,666 5,917 5,650 5,072 4,230 4,916 Total, 1st 60 institutions , , , , , , , , Boston College... 3,942 5,549 5,230 5,843 3,087 4,120 3,914 4, U CA Santa Cruz... 4,448 4,793 5,610 5,838 2,774 3,133 3,557 3, SUNY at Buffalo... 7,426 7,347 6,852 5,711 4,110 4,045 3,403 2, Iowa State University... 6,003 5,023 5,139 5,503 3,107 2,158 2,272 2, U of Nebraska at Lincoln... 3,308 i 6,005 6,062 5,475 2,492 i 3,387 3,397 3, U of Alabama Huntsville... 1,717 1,708 1,837 5,413 1,376 1,015 1,023 3, Virginia Commonwealth U... 2,799 3,604 5,338 5,269 1,395 1,928 2,936 3, Washington University... 4,321 5,323 4,975 5,035 3,376 3,921 3,643 3, Georgetown University... 4,868 5,176e 4,569 4,870 3,170 4,137 3,634 4, U CA Riverside... 3,495 4,028 4,422 4,859 2,861 2,810 3,053 3,104 Total, 1st 70 institutions , , , , , , , , U Southern Mississippi... 4,315 3,902 3,960 4,741 3,245 2,667 2,861 3, Mississippi State U... 2,575 2,289 4,643 4,550 1,589 1,238 1,179 1, Montana St U Bozeman... 2,961 3,180 4,331 4,542 2,596 2,507 2,869 3, Duke University... 4,485 3,851 4,210 4,417 2,767 2,187 2,403 2, Brown University... 3,450 3,638 4,140 4,330 1,793 1,909 2,290 2, U of Missouri Rolla... 3,061 4,126 3,298 4, ,312 1,514 1, Texas Tech University... 3,877 4,483 3,208 4,150 1,029 1, , University of Kentucky... 2,614 2,760 4,787 4,121 1,662 1,574 3,159 3, CUNY Hunter College... 2,956 3,469 3,344 4,101 1,823 2,164 2,267 2, U of IL Chicago... 3,244 3,770 4,075 4,023 2,158 2,064 2,765 2,793 Total, 1st 80 institutions , , , , , , , , University of Oregon... 2,923 3,071 3,265 3,969 2,432 2,566 2,614 3, Clemson University... 2,865 3,294 3,777 3, ,029 1, Oregon State University... 4,996 4,860 4,812 3,895 4,110 4,206 3,919 3, U of Iowa... 3,421 3,505 3,560 3,820 2,125 2,361 2,232 2, Southwest Texas St Univ ,548 2,475 3, ,097 2, U of Central Florida ,416 4,146 3, , University of Connecticut... 2,145 2,155 3,689 3, ,044 1,836 1, OGI Schl Sci & Eng OHSU... 3,020e 3,517 3,414 3,508 2,697e 3,214 3,170 3, Case Western Reserve U... 5,307 4,379 4,494 3,489 3,095 3,661 2,700 2, U of Missouri Columbia... 2,670 3,083 3,133 3,356 1,181 1,448 1,228 1,426 Total, 1st 90 institutions , , , , , , , ,
213 Table B-52. Total and federally financed R&D expenditures in chemistry at universities and colleges, ranked by fiscal year 2001 total R&D expenditures in chemistry: fiscal years Page 3 of 3 Total Federally financed Institution and ranking Jackson State University ,736 3,127 3, ,458 2,790 2, U of MD Baltimore County... 2,855 1,979 2,237 3,280 1,917 1,307 1,954 3, U of Arkansas Main... 2,527 2,117 2,517 3,273 1,150 1,299 1,536 2, University of Rochester... 6,734 5,405 4,097 3,246 6,120 4,901 3,493 2, Vanderbilt University... 3,068 2,873 3,227 3,171 2,506 2,499 2,910 2, Brigham Young University... 2,103 2,588 2,840 3,152 1,872 1,871 1,893 2, University of Kansas... 7,177 8,800 7,134 3,099 3,805 4,335 4,725 1, CUNY City College... 4,336 2,696 2,512 3,053 3,862 2,539 2,327 2, Washington State U... 2,154 2,660 2,466 3,048 1,713 2,209 2,013 2, U of Tennessee System... 3,963 4,333 3,660 3,044 2,433 2,764 2,137 2,467 Total, 1st 100 institutions , , , , , , , ,925 Total, all other sampled institutions , , , , , , , ,363 KEY: e = estimated i = imputed NOTE: Because of rounding, detail may not add to totals. SOURCE: National Science Foundation/Division of Science Resources Statistics, Survey of Research and Development Expenditures at Universities and Colleges, Fiscal Year
214 Table B-53. Total and federally financed R&D expenditures in physics at universities and colleges, ranked by fiscal year 2001 total R&D expenditures in physics: fiscal years Page 1 of 3 Total Federally financed Institution and ranking Total, all institutions... 1,078,243 1,148,698 1,205,548 1,236, , , , ,576 1 California Inst of Tech... 57,992 45,343 61,073 58,873 57,790 44,186 57,536 57,498 2 MA Institute of Tech... 83,416 55,054 56,131 58,449 75,875 54,205 55,491 57,628 3 Johns Hopkins U... 74,433 65,247 50,215 52,412 73,601 64,556 49,549 51,802 4 U CA Berkeley... 37,263 53,113 49,397 48,272 23,724 37,628 34,223 34,352 5 U TX at Austin... 15,293 44,967 36,507 37,520 12,278 37,271 31,781 33,578 6 Michigan State University... 24,636 25,606 31,541 34,944 16,017 17,029 20,540 23,494 7 Cornell University... 35,255 38,721 37,188 34,050 30,184 33,610 30,174 29,203 8 U CA Los Angeles... 20,943 25,023 27,683 32,337 13,465 16,193 17,389 19,839 9 Florida State University... 10,348 31,861 31,797 30,696 4,174 18,284 17,463 15, University of Minnesota... 7,054 7,625 13,407 24,214 5,948 6,493 10,068 18,143 Total, 1st 10 institutions , , , , , , , , U of WI-Madison... 16,192 18,187 21,817 22,952 13,343 14,600 16,927 17, Pennsylvania State U... 5,532 15,964 18,668 21,380 2,962 11,165 13,234 13, U of IL Urbana-Champaign... 21,928 23,569 24,871 21,004 16,908 17,628 19,253 14, Indiana University... 12,613 17,050 18,017 19,987 10,922 11,674 10,922 10, U of MD at College Park... 27,699 26,869 24,791 18,202 17,999 16,990 16,989 13, SUNY at Stony Brook... 16,078 15,406 16,515 17,331 10,826 10,555 10,844 11, U of Washington... 11,303 13,549 15,090 16,869 9,859 11,497 12,365 12, University of Colorado... 9,983 10,396 17,121 14,088 8,487 8,855 15,265 12, NC State University... 10,861 11,387 11,036 14,006 6,277 4,260 5,481 6, Princeton University... 15,542 14,923 13,369 14,002 12,188 12,566 10,546 11,172 Total, 1st 20 institutions , , , , , , , , Rutgers the State U NJ... 10,639 11,089 11,417 13,677 3,747 4,637 4,508 5, U CA San Diego... 16,504 14,206 13,057 13,566 13,073 10,920 9,776 10, U of Central Florida... 9,273 9,554 9,510 13,040 3,953 3,148 2,282 4, University of Michigan... 13,187 11,706 11,496 13,013 9,695 10,093 10,070 10, Harvard University... 8,957 10,456 10,173 12,745 8,883 10,314 9,823 12, U Mississippi, All Camp... 3,254 3,896 9,505 12,706 2,635 3,477 9,025 11, U of Pennsylvania... 12,877 13,781 11,894 12,585 12,043 12,031 10,171 11, Yale University... 9,619 10,474 10,994 12,335 8,910 9,736 9,936 11, U CA Santa Barbara... 12,448 14,060 16,394 12,191 9,763 11,115 12,215 9, Georgia Institute of Tech... 11,097 10,620 11,179 11,843 4,865 4,545 4,632 5,557 Total, 1st 30 institutions , , , , , , , , U of Alaska Fairbanks... 7,599 i 16,548 i 19,096 11,804 4,922 i 10,163 i 13,670 5, U of Iowa... 10,488 10,135 11,282 10,259 8,662 8,282 9,137 9, Ohio State University... 8,725 9,932 9,549 10,086 5,188 6,237 6,032 6, University of Florida... 8,025 8,275 7,652 9,209 3,904 4,801 4,673 5, Duke University... 10,702 13,210 9,078 8,960 10,139 12,749 8,768 8, University of Chicago... 8,112 8,940 10,447 8,821 7,567 8,352 9,875 8, U CA Santa Cruz... 5,511 5,326 5,226 8,501 4,034 3,235 3,458 3, University of Rochester... 5,259 6,723 7,820 8,395 4,774 6,289 7,474 7, Purdue University... 9,582 8,986 8,835 8,267 5,833 5,639 5,846 5, Louisiana State U System... 7,155 6,982 8,929 8,237 4,718 4,009 4,542 5,033 Total, 1st 40 institutions , , , , , , , , Washington University... 4,621 5,134 5,560 7,905 3,394 3,723 4,205 5, U CA Irvine... 9,068 7,240 6,800 7,830 6,144 4,898 4,431 5, Wayne State University... 5,447 5,349 5,923 7,642 1, ,130 3, Kansas State University... 5,394 5,395 5,717 7,396 4,478 4,311 4,953 6, Texas A&M University... 6,963 8,683 7,568 7,363 3,862 5,301 4,255 4, SUNY at Albany... 4,903 6,697 8,940 7,289 1,631 1, Montana St U Bozeman... 3,721 4,099 6,381 7,257 2,759 3,211 5,210 5, Hampton University... 4,502 5,313 3,637 7,115 4,163 5,009 3,358 6, Northeastern University... 3,516 4,156 9,463 7,019 3,339 3,149 8,685 5, Vanderbilt University... 7,657 11,825 9,638 6,732 6,537 10,528 7,763 5,588 Total, 1st 50 institutions , , , , , , , ,
215 Table B-53. Total and federally financed R&D expenditures in physics at universities and colleges, ranked by fiscal year 2001 total R&D expenditures in physics: fiscal years Page 2 of 3 Total Federally financed Institution and ranking U of Tennessee System... 7,623 8,071 7,273 6,535 4,742 4,877 4,308 5, Stanford University... 4,060 4,777 5,007 6,103 3,836 4,546 4,698 5, Temple University ,112 3,702 6, ,219 5, Carnegie Mellon U... 4,879 4,871 5,041 5,646 3,696 3,725 4,342 4, Northwestern University... 4,535 4,247 5,061 5,218 3,568 3,404 3,577 3, Brown University... 4,555 4,389 4,666 5,216 2,324 2,270 2,481 2, U of IL Chicago... 5,353 4,547 4,111 5,084 2,682 2,737 2,647 3, Iowa State University... 3,596 4,082 4,093 5,033 2,151 2,370 2,442 2, University of Notre Dame... 4,500 4,354 5,242 4,986 3,670 3,757 4,291 4, Colorado School of Mines... 2,520 3,348 5,265 4,918 2,069 2,979 4,946 4,530 Total, 1st 60 institutions , , , , , , , , U CA Davis... 4,829 4,892 4,772 4,872 3,548 3,180 3,133 3, U of Maine... 1,364 3,932 7,886 4, ,367 6,230 4, Boston University... 4,440 4,034 4,417 4,629 4,033 3,882 4,374 4, University of Arizona... 4,371 4,280 5,368 4,619 3,288 3,233 4,364 3, U of NC Chapel Hill... 3,382 7,268 7,500 4,509 2,276 6,294 6,240 3, U of South Carolina... 4,298 4,351 3,600 4,508 2,557 2,158 2,250 2, U of Nebraska at Lincoln... 2,159 i 4,458 4,826 4,490 1,777 i 2,121 2,107 2, NJ Inst of Technology... 1,196 1,196 1,382 4, , U TX MD Anderson Cncr Ctr.. 3,445 3,678 3,707 4,409 2,583 2,542 2,670 3, U of Alabama Huntsville... 4,730 6,916 6,348 4,356 3,564 5,220 4,603 3,492 Total, 1st 70 institutions , , , , , , , , University of Utah... 3,707 4,624 4,051 4,319 3,036 3,847 3,092 3, University of Pittsburgh... 3,141 3,584 3,929 4,310 2,801 3,109 3,326 3, U of MA Amherst... 11,238 7,243 8,238 4,295 7,510 4,105 4,612 2, Arizona State University... 4,498 4,579 3,893 4,258 3,370 3,341 2,802 2, Clemson University... 2,904 2,755 3,219 4, , Univ of Hawaii at Manoa... 2,002 2,179 2,592 4,044 1,722 1,999 2,353 3, University of Oregon... 4,402 4,657 4,002 3,942 3,602 3,937 3,461 3, University of Georgia... 3,943 3,600 3,508 3,893 1,155 1,095 1,281 1, U of Arkansas Main... 2,456 1,838 3,043 3,729 1, ,322 2, University of Kentucky... 2,772 2,863 3,281 3,588 1,760 1,745 1,870 2,058 Total, 1st 80 institutions , , ,417 1,026, , , , , U of MA Lowell... 3,106 3,313 3,194 3,556 2,609 2,628 2,514 2, University of Connecticut... 2,108 2,516 3,408 3,508 1,236 1,584 1,756 1, University of New Mexico... 7,409 5,448 8,172 3,492 5,840 5,085 6,459 3, Oklahoma State University... 3,765 4,375 3,642 3,475 1,798 1,344 1,088 1, University of Virginia... 4,627 4,256 3,515 3,407 4,235 3,913 3,262 3, SUNY at Buffalo... 2,953 2,395 2,407 3, , University of Houston... 2,762 3,211 2,822 3,331 1,514 1,795 1,460 1, Rice University... 2,604 2,767 2,890 3,312 2,408 2,450 2,559 2, Clark Atlanta University... 2,800 1,716 i 3,473 3,290 2,425 1,220 i 3,471 3, West Virginia University... 1,855 2,413 3,032 3,206 1,253 1,704 1,828 1,949 Total, 1st 90 institutions , ,785 1,034,972 1,060, , , , ,
216 Table B-53. Total and federally financed R&D expenditures in physics at universities and colleges, ranked by fiscal year 2001 total R&D expenditures in physics: fiscal years Page 3 of 3 Total Federally financed Institution and ranking Ohio University... 2,908 2,999 3,081 3,151 2,148 2,202 2,151 2, University of Oklahoma... 2,479 2,733 3,037 3,116 1,423 1,566 1,517 1, Catholic U of America... 1,934 2,248 1,377 3,053 1,929 2,093 1,347 2, Brandeis University... 1,664 1,746 2,156 2,968 1,482 1,302 1,537 2, U of Nevada Reno ,486 2,908 2, ,398 2,908 2, Col of William & Mary... 2,429 2,733 2,860 2,872 2,122 2,392 2,479 2, Northern Illinois U... 1,658 2,079 2,313 2, ,245 1,171 1, CUNY City College... 3,937 3,657 3,377 2,707 2,821 2,955 2,627 1, Syracuse University... 3,882 4,123 2,721 2,703 3,870 3,125 2,648 2, Fisk University... 2,323 2,639 3,289 2,702 2,323 2,342 2,652 2,559 Total, 1st 100 institutions ,551 1,015,228 1,062,091 1,089, , , , ,884 Total, all other sampled institutions , , , ,261 95,146 92,584 98, ,692 KEY: i = imputed NOTE: Because of rounding, detail may not add to totals. SOURCE: National Science Foundation/Division of Science Resources Statistics, Survey of Research and Development Expenditures at Universities and Colleges, Fiscal Year
217 Table B-54. R&D expenditures in the environmental sciences at universities and colleges, ranked by fiscal year 2001 R&D expenditures in the environmental sciences: fiscal years and by subfield for 2001 Page 1 of , by subfield Institution and ranking Atmos- Earth Oceanpheric sciences ography Other Total, all institutions... 1,623,631 1,690,751 1,763,341 1,826, , , , ,474 1 U CA San Diego , , , ,096 14, ,595 1,229 2 Texas A&M University... 69,912 69,296 85,330 80,789 4,103 4,184 61,520 10,982 3 U of Washington... 61,755 60,382 64,112 73,448 16,955 7,692 48, Woods Hole Oceanogr Inst... 62,995 58,723 64,910 71,849 5,207 i 23,720 i 18,719 i 24,203 i 5 University of Colorado... 74,325 71,479 62,770 51,590 15,537 35, Univ of Hawaii at Manoa... 48,594 52,019 51,453 47,185 3,106 12,101 23,746 8,232 7 Columbia U in City of NY... 43,154 44,003 49,198 46,375 4, ,255 2,872 8 U of New Hampshire... 25,772 27,107 36,418 40,098 10,036 3,119 15,133 11,810 9 U MD Ctr for Environ Sci... 24,038 26,816 31,605 36, ,275 32, Johns Hopkins U... 43,528 44,700 37,558 36,577 7,640 i 2,138 i 12,257 i 14,542 i Total, 1st 10 institutions , , , ,642 81,554 92, ,100 74, Oregon State University... 30,233 31,385 33,940 36,295 1,489 2,051 25,165 7, U of IL Urbana-Champaign... 25,265 28,452 28,497 33,855 2,666 29, , Louisiana State U System... 22,684 27,441 31,665 32, ,290 20,089 6, University of Miami... 31,067 28,452 28,353 30,957 18, ,178 1, U CA Davis... 6,547 6,981 9,958 30, ,671 5,789 23, U of Alaska Fairbanks... 33,814 i 18,756 21,644 30,488 12,097 8,793 8,581 1, University of Oklahoma... 23,374 27,018 29,158 29,571 21,790 7, U of WI-Madison... 24,864 25,695 28,001 29,040 16,355 4,577 3,257 4, Col of William & Mary... 18,538 23,707 23,938 24, , U TX at Austin... 19,477 20,980 24,134 24, ,684 4, Total, 1st 20 institutions , , , , , , , , U of Rhode Island... 19,105 22,602 23,212 24, , U CA Santa Barbara... 16,853 24,007 28,009 22, ,000 18,350 1, Desert Research Institute... 14,400 17,043 19,513 22,765 14,497 8, Pennsylvania State U... 23,552 26,740 20,396 22,550 7,599 13, , MA Institute of Tech... 15,900 23,494 22,009 21,390 9,075 8,049 3, Rutgers the State U NJ... 14,668 17,959 20,936 20, ,916 10, U of Maine... 10,269 11,974 15,214 19, ,474 11, U of South Florida... 14,243 17,526 19,197 18, ,277 17, SUNY at Stony Brook... 16,566 19,413 17,379 17,199 1,599 5,280 10, Georgia Institute of Tech... 14,505 13,224 23,382 16, , ,240 Total, 1st 30 institutions , ,332 1,067,075 1,114, , , , , U of South Carolina... 13,496 17,812 15,868 16, ,917 4,324 4, NC State University... 16,743 17,945 15,699 16, ,799 8, VA Polytech Inst & St U... 29,232 21,462 16,786 15, , , Colorado State University... 14,656 14,773 14,402 15,671 14,277 1, Florida State University... 15,775 13,871 14,303 14,893 6,693 3,891 4, U CA Los Angeles... 8,060 9,960 14,893 14,774 4,463 3, , University of Georgia... 11,229 12,694 13,994 14, ,392 9, U of Southern California... 14,202 12,095 14,394 14, ,280 3, Harvard University... 13,271 14,089 13,868 13, , , University of Minnesota... 10,824 12,986 12,762 13, ,856 1,737 4,935 Total, 1st 40 institutions... 1,098,367 1,143,019 1,214,044 1,264, , , , , Princeton University... 8,816 10,630 12,946 13,293 2,749 7, , U CA Santa Cruz... 11,390 12,880 13,839 13, ,760 8,225 1, U of NC Chapel Hill... 10,127 11,271 11,382 12, ,587 5, U of Nevada Las Vegas... 6,331 7,862 10,579 11, , Texas Tech University... 1,046 2,565 7,842 11, , , University of Kansas... 9,463 9,858 10,919 10, , California Inst of Tech... 18,285 14,611 13,846 10, , University of Arizona... 10,067 11,071 10,343 10,549 3,704 6, U of MD Baltimore County ,442 5,373 10,412 10, Naval Postgrad School... 8,218 i 8,218 i 9,038 i 9,854 i 5,804 i 0 i 4,050 i 0 i Total, 1st 50 institutions... 1,182,110 1,237,427 1,320,151 1,378, , , , ,
218 Table B-54. R&D expenditures in the environmental sciences at universities and colleges, ranked by fiscal year 2001 R&D expenditures in the environmental sciences: fiscal years and by subfield for 2001 Page 2 of , by subfield Institution and ranking Atmos- Earth Oceanpheric sciences ography Other 51 Arizona State University... 5,154 16,451 11,532 9, , U of MD at College Park... 8,331 6,828 6,402 9,464 5,117 4, U of Central Florida... 8,353 9,068 8,250 9,416 9, University of Connecticut... 9,224 7,486 8,259 9, , Ohio State University... 9,481 8,355 7,512 8, , , Utah State University... 11,134 11,712 8,453 8,522 1,865 6, Duke University... 7,554 7,629 7,556 8, ,761 2,522 4, U of Nebraska at Lincoln... 11,863 i 11,314 12,710 8,347 1,582 6, Stanford University... 8,025 8,260 8,111 8, , University of Delaware... 8,180 9,288 9,960 8, ,356 0 Total, 1st 60 institutions... 1,269,409 1,333,818 1,408,896 1,467, , , , , U MD Biotechnology Inst... 7,917 7,747 7,442 8, , San Jose State University... 9,427e 9,427e 9,427e 7,968 1, , George Mason University ,059 7, , NM Inst Mining & Tech... 4,868 6,741 6,535 7, , , SUNY at Albany... 6,152 6,443 6,379 7,226 7, U of Tennessee System... 11,609 10,882 9,330 6, , , U CA Berkeley... 5,755 7,244 7,132 6, , University of Wyoming... 10,387 6,542 7,968 6,483 2,519 3, U of Nevada Reno... 4,476 6,747 6,552 6, , , Florida International U ,072 6,372 6, , Total, 1st 70 institutions... 1,330,509 1,399,715 1,481,092 1,537, , , , , Mississippi State U... 4,060 3,199 3,540 6, , University of Florida... 6,709 5,070 3,830 5, ,866 3, U of Alabama Huntsville... 5,177 5,287 5,241 5,772 5, U Southern Mississippi... 2,535 6,876 6,238 5, , Brown University... 5,372 5,535 5,370 5, , U TX at El Paso... 1,832 6,703 4,423 5, , University of Michigan... 24,737 6,292 6,307 5, ,177 1, University of Virginia... 4,771 5,590 5,589 5,189 5, University of Utah... 4,057 3,756 4,040 4,989 2,356 2, Washington University... 3,420 4,385 4,374 4, , Total, 1st 80 institutions... 1,393,179 1,452,408 1,530,044 1,592, , , , , U of MA Amherst... 7,143 7,587 3,887 4, , , U PR Mayaguez Campus... 4,601 4,421 3,642 4, , West Virginia University... 2,348 3,335 5,671 4, , University of Chicago... 7,742 5,966 5,663 4, , U of NC Wilmington... 5,469 5,098 5,070 4, , Iowa State University... 1,737 3,343 3,803 4, , University of Idaho... 5,112 3,932 4,656 4, , , Purdue University... 3,614 4,272 4,096 4,011 1, , U CA Irvine... 2,249 3,023 3,373 3, , Tarleton State University... 3,659 3,559 3,717 3, , Total, 1st 90 institutions... 1,436,853 1,496,944 1,573,622 1,635, , , , ,
219 Table B-54. R&D expenditures in the environmental sciences at universities and colleges, ranked by fiscal year 2001 R&D expenditures in the environmental sciences: fiscal years and by subfield for 2001 Page 3 of , by subfield Institution and ranking Atmos- Earth Oceanpheric sciences ography Other 91 Indiana University... 1,762 6,428 3,070 3, , New Mexico State Univ... 5,053 3,421 2,940 3,913 2, U CA Riverside... 9,394 8,968 11,115 3, , , Cornell University... 4,101 4,170 4,221 3, , , Univ of Memphis, The... 2,916 3,416 4,095 3, , U of WI-Milwaukee... 3,325 3,638 3,675 3, , Old Dominion University... 5,380 6,199 5,788 3, , Jackson State University ,972 3, , U of MA Dartmouth ,288 2,227 3, , OGI Schl Sci & Eng OHSU... 4,964e 3,759 3,582 3, ,673 Total, 1st 100 institutions... 1,475,314 1,538,231 1,616,307 1,672, , , , ,734 Total, all other sampled institutions , , , ,001 16,304 82,430 12,527 42,740 KEY: e = estimated i = imputed NOTE: Because of rounding, detail may not add to totals. SOURCE: National Science Foundation/Division of Science Resources Statistics, Survey of Research and Development Expenditures at Universities and Colleges, Fiscal Year
220 Table B-55. Federally financed R&D expenditures in the environmental sciences at universities and colleges, ranked by fiscal year 2001 federally financed R&D expenditures in the environmental sciences: fiscal years and by subfield for fiscal year 2001 Page 1 of , by subfield Institution and ranking Atmos- Earth Oceanpheric sciences ography Other Total, all institutions... 1,075,792 1,100,977 1,131,877 1,182, , , , ,501 1 U CA San Diego... 60,437 65,829 72,813 71,006 11, , U of Washington... 58,248 55,954 58,356 66,244 15,623 6,469 44, Woods Hole Oceanogr Inst... 55,669 50,237 54,235 60,302 4,101 i 21,121 i 15,317 i 19,763 i 4 Texas A&M University... 52,659 53,624 61,397 55,728 2,361 1,019 48,916 3,432 5 University of Colorado... 62,358 61,055 56,172 47,056 14,323 31, Columbia U in City of NY... 40,462 40,712 46,838 44,889 4, ,364 2,803 7 Johns Hopkins U... 42,063 42,057 35,596 34,923 7,640 i 1,941 i 12,220 i 13,122 i 8 Univ of Hawaii at Manoa... 33,624 32,859 30,503 30,569 2,623 7,166 16,821 3,959 9 Oregon State University... 25,699 26,936 28,487 30,081 1,412 1,346 22,408 4, University of Miami... 27,452 25,455 25,388 27,240 16, ,217 1,516 Total, 1st 10 institutions , , , ,038 80,551 71, ,575 50, U of Alaska Fairbanks... 17,767 i 8,091 10,884 27,109 11,700 8,116 7, U of New Hampshire... 15,315 18,008 24,122 25,935 4,857 2,521 10,653 7, U of Rhode Island... 18,314 20,105 20,311 22, , U of WI-Madison... 17,243 16,406 17,784 21,731 16,355 1, , MA Institute of Tech... 14,147 20,150 20,410 18,652 8,085 6,523 3, Desert Research Institute... 9,300 11,720 14,685 16,435 9,532 6, University of Oklahoma... 11,419 13,541 14,805 13,597 12,086 1, U CA Santa Barbara... 11,478 16,140 17,649 13, ,270 10,587 1, Colorado State University... 10,630 11,630 12,451 13,143 11,989 1, U CA Davis... 1,995 1,809 2,265 12, ,050 1,308 10,566 Total, 1st 20 institutions , , , , , , ,432 73, VA Polytech Inst & St U... 27,820 20,094 14,804 12, , Harvard University... 12,839 13,424 12,362 12, , U MD Ctr for Environ Sci... 7,440 8,116 10,805 12, , U of IL Urbana-Champaign... 9,168 10,463 10,468 11,765 2,056 8, U of South Florida... 10,314 11,034 11,782 11, , Florida State University... 9,725 9,700 10,330 10,675 4,914 2,949 2, Louisiana State U System... 5,886 6,223 9,649 10, ,049 7, Pennsylvania State U... 12,290 15,554 10,886 10,656 3,616 6, U of Southern California... 10,277 8,698 9,513 10, ,167 3, SUNY at Stony Brook... 11,187 13,432 11,745 10,408 1,318 3,886 5,204 0 Total, 1st 30 institutions , , , , , , ,081 98, U TX at Austin... 6,537 5,904 10,450 10, ,434 1, California Inst of Tech... 16,912 14,141 11,353 10, , Naval Postgrad School... 8,029 i 8,029 i 8,792 i 9,669 i 5,772 i 0 i 3,897 i 0 i 34 Col of William & Mary... 6,828 7,769 7,847 9, , U of Nevada Las Vegas... 4,328 5,658 8,350 9, , U of MD Baltimore County ,602 4,654 9,072 9, U of Maine... 5,085 6,205 6,399 8, ,955 5, Rutgers the State U NJ... 6,082 8,361 8,947 8, ,095 1, Arizona State University... 4,721 15,030 10,167 8, , U CA Los Angeles... 5,663 6,611 8,514 8,561 3,869 2, ,568 Total, 1st 40 institutions , , , , , , , , Georgia Institute of Tech... 6,359 5,660 9,687 7, , , Princeton University... 5,815 6,696 8,035 7,812 2,143 3, , U of NC Chapel Hill... 6,048 6,337 6,118 7, ,466 2, George Mason University ,970 7, , U of MD at College Park... 6,704 5,381 4,604 7,068 3,650 3, University of Minnesota... 4,587 6,120 5,940 6, ,898 1,020 1, University of Arizona... 5,990 6,625 6,209 6,523 2,237 4, U CA Santa Cruz... 5,519 5,945 5,864 6, ,239 3, University of Delaware... 5,596 6,173 6,630 5, , Stanford University... 5,920 6,041 6,029 5, , Total, 1st 50 institutions , , , , , , , ,
221 Table B-55. Federally financed R&D expenditures in the environmental sciences at universities and colleges, ranked by fiscal year 2001 federally financed R&D expenditures in the environmental sciences: fiscal years and by subfield for fiscal year 2001 Page 2 of , by subfield Institution and ranking Atmos- Earth Oceanpheric sciences ography Other 51 Texas Tech University ,386 3,054 5, , U of South Carolina... 6,062 6,712 6,655 5, ,450 1,777 1, University of Georgia... 3,683 5,026 4,845 5, ,206 4, U Southern Mississippi... 2,358 6,489 5,860 5, , Ohio State University... 6,145 5,662 3,953 5, , , NC State University... 6,654 5,727 5,291 5, ,666 3, Mississippi State U... 2,677 2,162 2,522 5, , University of Connecticut... 3,689 4,107 4,573 5, , U TX at El Paso... 1,308 6,125 3,769 4, , U of Tennessee System... 6,744 7,051 5,444 4, , ,702 Total, 1st 60 institutions , , , , , , , , Duke University... 3,235 3,921 4,638 4, ,247 1,297 2, U of Alabama Huntsville... 4,165 4,198 4,261 4,650 4, University of Virginia... 4,048 4,834 4,865 4,382 4, San Jose State University... 4,363e 4,363e 4,363e 4,283 1, , U of NC Wilmington... 3,321 3,191 3,839 4, , University of Chicago... 6,420 4,617 5,111 4, , U of Nevada Reno... 2,650 4,787 4,307 4, , University of Wyoming... 4,453 3,518 3,873 3,984 1,986 1, U of Nebraska at Lincoln... 8,821 i 6,857 7,264 3,875 1,346 2, University of Utah... 3,097 3,053 3,453 3,761 2,259 1, Total, 1st 70 institutions , , ,994 1,023, , , , , Brown University... 3,718 3,748 3,377 3, , U CA Berkeley... 2,525 4,051 3,734 3, , Florida International U ,001 3,732 3, , SUNY at Albany... 2,619 2,991 3,207 3,362 3, University of Michigan... 18,623 4,292 4,319 3, , Jackson State University ,743 3, , Utah State University... 6,682 6,739 3,053 3,048 1,470 1, U MD Biotechnology Inst... 4,995 5,894 2,773 3, , New Mexico State Univ... 4,151 2,672 2,145 2,972 2, Boston University... 2,560 3,095 2,918 2, ,237 Total, 1st 80 institutions , ,654 1,009,995 1,056, , , , , University of Florida... 2,073 2,527 1,924 2, , U of Central Florida... 2,117 2,420 1,543 2,803 2, OGI Schl Sci & Eng OHSU... 3,997e 3,034 2,949 2, , Purdue University... 2,411 2,731 2,683 2, , U CA Irvine... 1,590 2,263 1,982 2, , Iowa State University ,006 2,071 2, , West Virginia University... 1,021 1,439 2,180 2, , Washington State U ,124 1,614 2, , Washington University... 2,594 2,779 2,757 2, , U of MA Amherst... 2,967 2,764 2,038 2, , Total, 1st 90 institutions , ,741 1,031,736 1,082, , , , ,
222 Table B-55. Federally financed R&D expenditures in the environmental sciences at universities and colleges, ranked by fiscal year 2001 federally financed R&D expenditures in the environmental sciences: fiscal years and by subfield for fiscal year 2001 Page 3 of , by subfield Institution and ranking Atmos- Earth Oceanpheric sciences ography Other 91 Old Dominion University... 2,333 3,665 3,283 2, , University of Kansas... 2,173 2,287 2,547 2, , Florida A&M University... 1,418 1,331 1,720 2, , U PR Mayaguez Campus... 3,051 2,916 1,826 2, , University of Idaho... 2,451 2,046 2,685 2, , Southern Methodist U... 1,726 2,609 2,117 1, , NM Inst Mining & Tech... 1,954 1,827 1,549 1, , SD Sch of Mines & Tech... 1,712 1,796 2,125 1,904 1, Yale University... 1,840 1,780 2,317 1, , University of New Mexico... 1,443 1,636 1,735 1, , Total, 1st 100 institutions ,548 1,021,634 1,053,640 1,103, , , , ,883 Total, all other sampled institutions... 84,244 79,343 78,237 78,875 7,441 46,039 9,777 15,618 KEY: e = estimated i = imputed NOTE: Because of rounding, detail may not add to totals. SOURCE: National Science Foundation/Division of Science Resources Statistics, Survey of Research and Development Expenditures at Universities and Colleges, Fiscal Year
223 Table B-56. Total and federally financed R&D expenditures in the mathematical sciences at universities and colleges, ranked by fiscal year 2001 total R&D expenditures in the mathematical sciences: fiscal years Page 1 of 3 Total Federally financed Institution and ranking Total, all institutions , , , , , , , ,325 1 Johns Hopkins U ,293 24,302 24,195 23,901 29,271 24,238 24,072 23,763 2 U TX at Austin... 15,683 13,911 15,011 16,304 10,156 9,585 9,699 11,148 3 George Washington U... 13,477 13,910 16,276 14,654 11,537 13,376 15,835 13,644 4 Boston College... 7,951 9,562 12,077 14,514 6,331 6,780 7,295 9,695 5 NC State University... 9,088 8,995 10,839 11,795 3,444 2,511 4,494 4,586 6 Georgia Institute of Tech... 4,403 3,963 5,829 7,885 1,931 1,696 2,415 3,700 7 U TX MD Anderson Cncr Ctr.. 2,715 3,625 5,142 7, ,239 2,058 8 Brown University... 7,499 7,308 7,439 6,807 4,675 5,035 4,760 4,405 9 New York University... 5,828 5,652 5,555 6,780 5,570 5,005 4,746 6, Rutgers the State U NJ... 10,335 9,748 8,728 6,733 6,266 5,664 4,652 2,960 Total, 1st 10 institutions , , , ,714 79,325 74,745 79,207 82, Iowa State University... 5,771 6,272 6,907 6,276 2,727 2,782 3,182 2, U CA Berkeley... 4,602 4,069 5,730 6,070 3,927 3,230 4,476 4, U CA Los Angeles... 4,226 4,748 4,957 5,988 3,553 4,115 3,426 4, Pennsylvania State U... 2,986 3,358 3,750 5,881 1,832 2,140 2,318 2, University of Florida... 4,676 4,687 4,705 5,711 2,739 2,564 2,600 3, Texas A&M University... 2,600 2,764 3,684 5,334 1,674 1,791 2,715 3, University of Georgia... 4,362 4,778 4,732 5, MA Institute of Tech... 2,469 5,138 5,097 5,046 2,303 4,131 4,169 4, Stanford University... 4,049 4,577 5,146 4,737 3,804 4,303 4,672 4, SUNY at Stony Brook... 4,575 5,071 4,903 4,732 3,002 3,447 3,006 2,877 Total, 1st 20 institutions , , , , , , , , University of Minnesota... 5,965 5,069 4,327 4,682 4,844 4,172 3,579 3, U of Washington... 3,247 3,724 4,366 4,603 3,000 3,259 3,849 3, U of WI-Madison... 3,180 3,643 3,833 4,461 1,832 1,857 1,767 2, Florida State University... 1,772 4,346 2,275 4, ,499 1, U of IL Chicago... 1,944 2,694 3,324 4,204 1,292 1,680 2,291 3, University of Michigan... 3,127 3,170 3,115 4,117 2,230 2,573 2,448 3, Purdue University... 3,762 3,195 3,277 3,797 1,869 1,452 1,533 2, Western Michigan U... 2,759 2,321 3,038 3,712 1,842 1,578 2,225 2, Princeton University... 1,791 2,560 3,158 3,663 1,448 1,781 1,928 2, Naval Postgrad School... 3,048 i 3,048 i 3,344 i 3,639 i 3,021 i 3,021 i 3,308 i 3,639 i Total, 1st 30 institutions , , , , , , , , Carnegie Mellon U... 3,671 3,845 3,757 3,224 3,015 3,164 3,322 2, U of South Carolina... 8,501 7,546 9,911 3,105 1,986 1,586 2,108 1, University of Arizona... 3,121 2,409 2,999 2,905 2,270 1,753 2,124 2, U of MA Amherst... 1,788 1,567 2,298 2,900 1,167 1,190 1,653 2, U of IL Urbana-Champaign... 2,011 2,259 2,597 2,730 1,102 1,235 1,316 1, VA Polytech Inst & St U... 2,973 2,395 2,666 2,626 1,958 1,370 1,503 1, Cornell University... 2,448 2,634 2,487 2,625 1,547 1,889 1,729 2, San Diego St University ,956 2,853 2, ,609 1, U of Nebraska at Lincoln i 1,891 2,016 2, i U CA Santa Barbara... 2,157 2,403 2,842 2,448 1,655 1,656 1,604 1,067 Total, 1st 40 institutions , , , , , , , , U of Southern California... 2,043 2,051 2,387 2,337 1,846 1,835 2,202 1, Rice University... 2,392 2,466 2,809 2,300 2,253 2,239 2,660 2, Washington University... 1,208 1,194 1,814 2,224 1, ,628 1, Indiana University... 1,290 1,519 2,077 2, ,033 1, University of Chicago... 1,519 1,514 2,038 2,010 1,444 1,511 1,980 1, Ohio State University... 1,370 1,500 1,751 1, ,202 1,364 1, Boston University... 3,042 2,545 1,384 1,979 2,857 2,402 1,274 1, University of Colorado... 1,875 2,013 2,144 1,979 1,417 1,418 1,948 1, Arizona State University... 1,245 1,132 1,677 1, , U CA Davis... 1, ,156 1, ,033 Total, 1st 50 institutions , , , , , , , ,
224 Table B-56. Total and federally financed R&D expenditures in the mathematical sciences at universities and colleges, ranked by fiscal year 2001 total R&D expenditures in the mathematical sciences: fiscal years Page 2 of 3 Total Federally financed Institution and ranking Clemson University... 2,265 2,005 2,319 1, Harvard University... 1,462 1,674 1,887 1,769 1,379 1,647 1,853 1, Portland State University ,270 1, , Michigan State University , , Duke University ,277 1,666 1, ,143 1,545 1, Louisiana State U System... 1,550 1,247 1,346 1, CA St U Dominguez Hills... 0 i 166 i 0 1,528 0 i 102 i U of MD at College Park ,015 1, University of New Haven i 13 13e 1, i 11 11e 1, Rockefeller U, The ,086 1, Total, 1st 60 institutions , , , , , , , , Ithaca College ,379 1,767 1, ,307 1,767 1, U of Missouri Columbia... 1,348 1,447 1,335 1, Yale University... 2,439 2,357 1,570 1,297 2,305 2,173 1,253 1, University of Delaware... 1,527 1,288 1,386 1,289 1, University of Vermont , Rensselaer Polytech Inst... 1, ,261 1, , U CA Irvine ,178 1,038 1, U CA San Diego... 1,477 1,115 1,078 1,249 1, Colorado State University... 1,503 1,599 1,418 1, NJ Inst of Technology , Total, 1st 70 institutions , , , , , , , , University of Pittsburgh , U of NC Chapel Hill , CUNY City College , , U of Pennsylvania e 1,084 1, ,035 1, U of Iowa , Utah State University , University of Utah... 1,290 1,512 1,356 1,006 1,112 1,249 1, U of LA Lafayette Mississippi State U Tulane University Total, 1st 80 institutions , , , , , , , , Oklahoma State University , University of Louisville ,483 1, Northwestern University... 1, , University of New Mexico U of the Virgin Islands... 1,477e 819e 819e 819 i 0e 0 0e 0 i 86 Illinois State University e i e i Western Illinois U Texas Tech University... 1, , Univ of Memphis, The U of MA Dartmouth... 1,266 1, , Total, 1st 90 institutions , , , , , , , ,
225 Table B-56. Total and federally financed R&D expenditures in the mathematical sciences at universities and colleges, ranked by fiscal year 2001 total R&D expenditures in the mathematical sciences: fiscal years Page 3 of 3 Total Federally financed Institution and ranking SUNY at Buffalo... 1,431 1,284 1, Emory University Columbia U in City of NY , , U of MD Baltimore County University of Houston San Jose State University e 268e 268e e 92e 92e U CA Santa Cruz U of WI-Milwaukee Kansas State University U PR Mayaguez Campus Total, 1st 100 institutions , , , , , , , ,190 Total, all other sampled institutions... 45,967 44,220 43,611 41,196 30,138 26,453 29,737 28,135 1 Johns Hopkins University includes the Applied Physics Laboratory. KEY: e = estimated i = imputed NOTE: Because of rounding, detail may not add to totals. SOURCE: National Science Foundation/Division of Science Resources Statistics, Survey of Research and Development Expenditures at Universities and Colleges, Fiscal Year
226 Table B-57. Total and federally financed R&D expenditures in the computer sciences at universities and colleges, ranked by fiscal year 2001 total R&D expenditures in the computer sciences: fiscal years Page 1 of 3 Total Federally financed Institution and ranking Total, all institutions , , , , , , , ,230 1 Johns Hopkins U ,991 71,050 70,525 70,155 72,340 70,459 69,244 69,178 2 U of Southern California... 49,893 56,745 50,745 64,269 40,661 46,741 46,312 61,724 3 Carnegie Mellon U... 58,795 58,744 54,838 60,368 45,249 38,709 36,882 41,511 4 U CA San Diego... 18,913 36,657 50,199 59,965 11,057 28,339 38,444 49,094 5 U of IL Urbana-Champaign... 56,715 65,803 61,032 55,729 34,823 41,976 41,162 37,891 6 Georgia Institute of Tech... 29,329 31,259 34,339 35,925 12,858 13,379 14,227 16,857 7 MA Institute of Tech... 14,590 34,061 34,384 34,618 11,366 26,622 23,290 23,241 8 U TX at Austin... 6,919 18,109 24,350 23,502 5,261 14,811 18,970 20,605 9 Ohio State University... 13,761 17,249 21,050 22,758 2,522 2,356 1,576 1, U of MD at College Park... 19,868 23,521 19,617 21,229 12,005 14,176 12,029 12,515 Total, 1st 10 institutions , , , , , , , , Cornell University... 19,309 17,683 16,474 17,187 14,195 11,714 9,941 11, U of Alaska Fairbanks... 0 i 11,178 12,899 16,159 0 i University of Utah... 11,181 11,441 13,614 16,007 10,057 11,017 10,684 10, Stanford University... 18,390 17,449 13,732 15,459 16,270 15,767 11,573 12, U of MA Amherst... 9,314 10,481 11,046 11,800 6,120 7,265 7,181 7, U CA Los Angeles... 6,763 8,007 7,681 11,313 5,139 5,519 5,190 5, U of Tennessee System... 7,016 7,494 7,981 10,451 3,622 2,600 2,787 5, University of Michigan... 5,295 9,545 9,110 10,184 1,452 2,560 3,386 5, U of WI-Madison... 7,481 7,360 8,441 9,910 5,837 5,291 6,079 6, U of Alabama Huntsville... 4,923 5,971 7,374 9,599 3,178 3,963 4,950 4,630 Total, 1st 20 institutions , , , , , , , , OGI Schl Sci & Eng OHSU... 9,073e 9,519 8,194 9,045 6,797e 7,522 6,380 7, Rice University... 10,275 10,839 10,590 8,995 9,819 10,595 10,251 8, U of Pennsylvania... 8,207 8,829e 9,034 8,939 5,905 7,037 7,664 7, Purdue University... 4,925 5,583 7,220 8,528 2,345 2,778 2,995 2, U CA Santa Barbara... 7,039 2,162 2,525 8,273 5,046 1,252 2,069 6, University of Minnesota... 6,285 7,225 7,763 8,022 3,900 4,216 5,585 5, U of NC Chapel Hill... 8,339 9,531 8,632 7,850 5,358 6,401 5,552 4, SUNY at Buffalo... 5,656 7,270 7,413 7,489 1,977 2,576 2,015 2, New York University... 6,306 5,959 5,920 7,220 3,892 3,620 3,720 4, Princeton University... 4,493 4,565 5,657 6,938 2,216 2,012 2,600 3,869 Total, 1st 30 institutions , , , , , , , , U CA Irvine... 4,259 4,854 5,040 6,572 2,296 2,933 3,241 4, U of Washington... 5,676 4,956 4,872 6,295 4,818 4,254 4,050 5, Washington University... 8,019 8,205 7,263 6,254 5,304 5,666 5,189 4, University of Arizona... 6,293 4,836 4,686 6,158 4,421 3,524 3,488 4, Jackson State University ,203 2,526 6, ,880 2,199 5, Columbia U in City of NY... 4,074 4,966 5,867 5,907 3,830 4,738 5,547 5, University of Colorado... 6,718 6,990 6,053 5,577 4,851 5,671 5,185 4, Brown University... 5,149 4,729 4,646 5,473 3,462 3,036 2,898 3, U of West Florida... 2,247 3,022 4,429 5,303 1,468 2,332 3,773 3, Rutgers the State U NJ... 6,617 6,152 6,432 5,264 2,383 2,488 2,259 1,985 Total, 1st 40 institutions , , , , , , , , NC State University... 2,876 3,007 5,175 5,234 1,713 1,393 2,733 3, Syracuse University... 10,823 11,495 6,601 4,889 6,376 8,714 4,670 2, Texas A&M University... 4,476 3,237 3,309 4,865 1,259 1,575 1,903 2, Naval Postgrad School... 3,930 i 3,930 i 4,307 i 4,702 i 3,916 i 3,916 i 4,289 i 4,702 i 45 Cal Poly St U ,647 4,274 4, ,646 4,225 4, California Inst of Tech... 11,000 10,113 5,969 4,402 10,996 10,041 5,559 4, Yale University... 1,998 2,408 2,411 4,396 1,682 1,898 1,316 3, Dartmouth College ,010 1,976 4, ,469 1,648 3, Pennsylvania State U... 1,020 1,145 5,878 4, ,346 3, University of Kansas ,223 3,619 4, Total, 1st 50 institutions , , , , , , , ,
227 Table B-57. Total and federally financed R&D expenditures in the computer sciences at universities and colleges, ranked by fiscal year 2001 total R&D expenditures in the computer sciences: fiscal years Page 2 of 3 Total Federally financed Institution and ranking U of Nebraska at Lincoln i 2,392 3,203 4, i University of Virginia... 5,680 5,194 3,544 4,020 4,982 4,683 3,242 3, Northwestern University... 3,011 3,173 3,700 3,899 1,769 1,815 1,893 2, Iowa State University... 5,129 3,003 3,060 3, Wright State University ,429 4,076 3, ,073 1, Michigan State University... 2,848 2,990 3,677 3,745 1,440 1,635 1,791 1, New Mexico State Univ... 4,338 5,129 4,486 3,662 3,504 4,091 3,452 2, Duke University... 1,758 1,595 2,421 3,595 1,076 1,082 1,799 2, University of Houston... 2,561 2,780 3,267 3,292 1,780 1,798 2,043 2, SUNY at Stony Brook... 3,341 3,496 2,956 3,245 2,206 1,806 1,744 1,962 Total, 1st 60 institutions , , , , , , , , Rockefeller U, The... 1,927 1,498 1,907 3, Arizona State University... 2,851 2,540 3,224 3,183 1,141 1,073 1,351 1, University of Pittsburgh... 2,690 2,935 2,273 3,030 2,353 2,656 1,873 2, Howard University... 1,536 1,171 2,325 3,012 1,416 1,075 1,933 2, Louisiana State U System... 1,377 2,104 2,076 2, University of Oklahoma... 2,322 2,709 2,713 2, U of LA Lafayette... 2,526 3,714 3,308 2, ,829 1, University of Georgia... 2,529 2,706 2,883 2, University of Florida... 3,578 3,955 2,404 2,608 2,371 2,679 1,956 2, Oregon State University... 1,888 1,887 1,983 2,547 1,515 1,505 1,600 2,009 Total, 1st 70 institutions , , , , , , , , Harvard University... 1,277 1,386 2,017 2,492 1,229 1,308 1,602 1, Florida State University... 2,053 2,674 3,140 2,477 1,518 2,055 1,860 2, Indiana University... 2,827 2,492 3,839 2,395 1,505 1,112 1,529 1, Rose-Hulman Inst of Tech... 0 i ,391 0 i University of Oregon... 2,707 3,252 3,075 2,379 2,404 2,921 2,683 2, University of Rochester... 2,652 3,103 2,307 2,288 2,549 2,986 2,226 2, University of New Mexico... 2,601 2,797 2,323 2,244 1,926 2,246 2,038 1, SUNY at Albany , Mississippi State U... 1,125 1,960 2,199 2, , U CA Santa Cruz... 1,520 1,605 2,028 2,136 1,165 1,329 1,612 1,742 Total, 1st 80 institutions , , , , , , , , Florida International U ,003 2,303 2, ,319 1,349 1, U CA Davis... 2,458 2,522 2,563 2,053 1,961 1,896 1, Bowie State University... 2,026 2,109 2,109e 2,007 2,026 1,913 1,913e 1, NJ Inst of Technology... 2,249 2, ,958 1,181 1, VA Polytech Inst & St U... 2,315 2,168 2,208 1,955 1,617 1,526 1,030 1, University of Kentucky ,084 1,368 1, ,038 1, Clemson University... 1,807 1,294 1,497 1, University of Connecticut... 1, ,436 1, Florida A&M University ,902 1,781 1, ,902 1,177 1, University of Delaware... 3,947 2,015 1,727 1,694 2,431 1, Total, 1st 90 institutions , , , , , , , ,
228 Table B-57. Total and federally financed R&D expenditures in the computer sciences at universities and colleges, ranked by fiscal year 2001 total R&D expenditures in the computer sciences: fiscal years Page 3 of 3 Total Federally financed Institution and ranking Drexel University... 1,273 1,172 1,212 1, , U of Arkansas Main , U of Missouri Kansas City ,177 1,288 1, , Rensselaer Polytech Inst... 2,160 1, ,505 1, Florida Inst of Tech ,034 1, U of Maine ,058 1, Air Force Inst of Tech ,198 1, Northeastern University , , University of Idaho , , U CA Riverside , Total, 1st 100 institutions , , , , , , , ,756 Total, all other sampled institutions... 60,291 71,440 69,460 68,733 34,430 36,663 40,901 43,474 1 Johns Hopkins University includes the Applied Physics Laboratory. KEY: e = estimated i = imputed NOTE: Because of rounding, detail may not add to totals. SOURCE: National Science Foundation/Division of Science Resources Statistics, Survey of Research and Development Expenditures at Universities and Colleges, Fiscal Year
229 Table B-58. R&D expenditures in the life sciences at universities and colleges, ranked by fiscal year 2001 R&D expenditures in the life sciences: fiscal years and by subfield for fiscal year 2001 Page 1 of , by subfield Institution and ranking Agri- Biocultural logical Medical Other sciences sciences sciences Total, all institutions... 14,592,790 15,610,045 17,460,397 19,189,112 2,318,081 5,943,596 10,176, ,707 1 U CA San Francisco , , , , , , U CA Los Angeles , , , ,355 7,362 18, ,136 5,058 3 Johns Hopkins U , , , , , ,656 26,288 4 U of Washington , , , ,532 19, , ,027 5,119 5 Baylor Col of Medicine , , , , , , U of Pennsylvania , , , , , ,791 9,799 7 U of WI-Madison , , , ,813 40, , ,242 4,199 8 Washington University , , , , , ,732 7,203 9 University of Minnesota , , , ,099 68,399 54, ,593 12, University of Michigan , , , ,083 4,313 90, ,148 44,418 Total, 1st 10 institutions... 2,829,366 3,131,149 3,503,020 4,006, ,408 1,047,362 2,703, , U CA Davis , , , , , ,269 92, Duke University , , , , , , University of Pittsburgh , , , , , ,251 6, Cornell University , , , ,381 64,188 64, , Yale University , , , ,749 1,609 90, , Harvard University , , , , , , Stanford University , , , , , , U CA San Diego , , , , , ,301 1, University of Florida , , , , ,287 48,437 94,164 3, Columbia U in City of NY , , , , , ,959 1,475 Total, 1st 20 institutions... 4,852,683 5,390,003 6,045,561 6,816, ,644 1,684,848 4,588, , U of MD Baltimore , , , , , ,206 11, U of NC Chapel Hill , , , , , ,484 22, U TX SW Med Ctr at Dallas , , , , , , Emory University , , , , , ,895 40, U of Alabama Birmingham , , , , , , University of Arizona , , , ,319 49,212 66,847 85,213 2, U TX MD Anderson Cncr Ctr.. 135, , , , , , U of Iowa , , , , , ,647 18, Ohio State University , , , ,406 40,794 58,416 81,376 16, University of Georgia , , , ,396 89,594 73,668 25, Total, 1st 30 institutions... 6,450,545 7,075,455 7,984,690 8,940, ,244 2,370,358 5,734, , U of Southern California , , , , , ,220 9, University of Colorado , , , , , ,409 4, Mt Sinai Sch Med , , , , , , U of IL Chicago , , , , , ,543 10, Northwestern University , , , , ,340 96,134 7, U CA Berkeley , , , ,525 68,053 59,752 37, Michigan State University , , , ,803 68,798 71,116 20,705 3, U Med & Dent of NJ , , , , , , Louisiana State U System , , , ,836 55,497 62,038 42, University of Rochester , , , , , ,323 6,462 Total, 1st 40 institutions... 7,733,961 8,443,906 9,535,160 10,631, ,622 2,903,091 6,657, , University of Kentucky , , , ,696 56,652 2,767 91,612 3, University of Cincinnati , , , , ,764 98,809 4, Case Western Reserve U , , , , , , Texas A&M University , , , ,264 69,231 32,798 51, New York University , , , , ,407 74,482 31, Vanderbilt University , , , , ,259 73,053 8, Indiana University , , , , ,528 99,307 5, Pennsylvania State U... 99, , , ,925 70,405 27,305 48,279 2, Yeshiva University... 99, , , , ,931 80,845 31, University of Chicago , , , , ,696 97, Total, 1st 50 institutions... 8,920,541 9,689,574 10,942,388 12,143, ,990 3,311,060 7,476, ,
230 Table B-58. R&D expenditures in the life sciences at universities and colleges, ranked by fiscal year 2001 R&D expenditures in the life sciences: fiscal years and by subfield for fiscal year 2001 Page 2 of , by subfield Institution and ranking Agri- Biocultural logical Medical Other sciences sciences sciences 51 NC State University , , , ,775 73,787 69, , Wayne State University , , , , , ,074 2, Rockefeller U, The , , , , ,770 4, Oregon Health & Science U ,735 i 116,422 i 126, , ,636 78,024 11, University of Utah... 94,383 98, , , ,329 58,897 35, SUNY at Buffalo... 93, , , , ,465 83,824 7, UT Houston Hlth Sci Ctr , , , , ,043 80,144 7, U of Missouri Columbia... 98, , , ,701 52,127 33,827 33,376 5, Boston University... 83,544 94, , , , ,662 1, U CA Irvine... 86,093 94, , , ,508 51,110 0 Total, 1st 60 institutions... 9,919,269 10,774,122 12,134,961 13,442,195 1,108,904 3,776,587 8,109, , Med U of South Carolina... 57,940 55,819e 65, , ,502 58,654 27, U of South Florida... 63,616 82,586 95, , , ,226 1, Purdue University... 96, , , ,206 43,419 52,406 14,705 5, U TX Hlth Sci Ctr San Ant... 82,357 87, , , ,249 74, U of MA Worcester... 82,950 83,040 97, , ,724 44,349 31, U of IL Urbana-Champaign... 81,436 87,213 97, ,062 50,984 48,419 6,653 3, University of Miami... 92,385 97, , , ,616 86, Rutgers the State U NJ... 91,706 97,017 99, ,092 37,103 41,922 20,121 6, University of Kansas... 66,492 82,370 95, , ,805 42,092 12, U TX Med Br at Galveston... 85,219 92,274 96, , ,447 51, Total, 1st 70 institutions... 10,719,395 11,641,562 13,096,510 14,545,952 1,240,429 4,149,497 8,620, , University of Connecticut... 79,719 81,970 97, ,474 7,881 39,168 50,147 3, University of Virginia... 88,752 82,763 91,269 98, ,679 56,158 1, Wake Forest University... 75,987 81,220 85,675 96, , SUNY at Stony Brook... 77,768 79,447 89,558 95, ,662 40, VA Polytech Inst & St U... 66,495 73,781 84,265 94,248 68,669 12,751 4,526 8, U of Tennessee System... 85,380 92,957 95,074 90,646 24,050 31,864 33,114 1, Georgetown University ,347 98,480e 119,611 90, ,562 81, Colorado State University... 77,765 96,230 96,098 89,852 63,426 18,474 7, Oregon State University... 83,238 83,992 82,485 89,498 56,223 28,355 3,429 1, Thomas Jefferson U... 69,460 78,410 89,626 88, ,390 42,211 1,335 Total, 1st 80 institutions... 11,530,306 12,490,812 14,027,996 15,480,771 1,460,678 4,430,819 9,035, , Iowa State University... 75,816 78,037 79,334 87,087 48,689 33,480 4, Virginia Commonwealth U... 70,968 69,763 75,323 85, ,591 54,798 2, Tufts University... 73,437 80,592 83,227 84, ,730 9,544 1, Medical Col of Wisconsin... 56,021 61,446 70,581 83, ,617 49, U of Nebraska at Lincoln... 74,011 i 62,623 64,285 79,194 46,128 30, , Mississippi State U... 62,253 65,748 75,070 79,165 72,172 1,438 5, MA Institute of Tech... 42,744 66,924 73,228 77, ,635 17,128 1, Tulane University... 72,246 72,140 70,301 76, ,885 30,315 34, Dartmouth College... 49,978 53,543 59,803 74, ,824 70, Washington State U... 64,805 65,632 70,714 71,436 26,130 38,620 3,410 3,276 Total, 1st 90 institutions... 12,172,585 13,167,260 14,749,862 16,279,926 1,653,953 4,746,566 9,279, , Rush University... 52,378 58,166 67,122 68, ,274 53,634 2, University of Vermont... 51,015 56,013 56,067 66,357 5,641 23,789 31,810 5, University of Oklahoma... 56,247 62,471 63,984 66, ,644 35,612 1, University of New Mexico... 40,612 36,824 46,280 62, ,014 19,147 12, U of Nebraska Med Ctr... 50,453 54,205 51,547 60, ,607 25, U CA Riverside... 49,242 45,241 47,470 60,284 23,315 34,875 2, Kansas State University... 54,268 56,739 59,728 60,229 43,352 16, Auburn University... 48,586 51,324 56,273 58,552 38,916 13,447 3,382 2, Univ of Hawaii at Manoa... 57,016 62,503 63,662 58,455 13,441 9,415 21,053 14, University of Louisville... 31,008 42,131 49,922 56, ,270 30,579 6,443 Total, 1st 100 institutions... 12,663,410 13,692,877 15,311,917 16,898,272 1,778,618 4,971,476 9,503, ,
231 Table B-58. R&D expenditures in the life sciences at universities and colleges, ranked by fiscal year 2001 R&D expenditures in the life sciences: fiscal years and by subfield for fiscal year 2001 Page 3 of , by subfield Institution and ranking Agri- Biocultural logical Medical Other sciences sciences sciences 101 Medical Col of Georgia... 39,806 41,103 45,596 52, ,271 21, U of Arkansas Medical Sci... 39,487 44,066 49,074 51, ,946 33, U of Arkansas Main... 46,523 43,733 47,239 51,556 48,697 1, Oklahoma State University... 38,293 45,141 49,269 50,096 27,169 18,430 3, Clemson University... 47,941 54,023 62,486 50,058 37,620 11, North Dakota State U... 32,362 33,813 37,124 48,943 45,518 1,988 1, U of MD at College Park... 33,772 35,966 37,526 47,443 29,836 8, , West Virginia University... 34,199 33,247 32,628 43,380 8,860 9,349 25, University of Idaho... 41,187 40,633 39,812 42,957 33,879 7,572 1, Brown University... 30,976 34,242 38,501 42, ,679 29,146 8,571 Total, 1st 110 institutions... 13,047,956 14,098,844 15,751,172 17,379,213 2,010,197 5,084,095 9,621, , Montana St U Bozeman... 32,362 33,283 39,492 42,114 31,020 10, U TX at Austin... 25,821 30,561 39,125 41, ,195 11, SUNY at Albany... 28,221 38,486 55,159 41, , TX A&M U Sys Hlth Sci Ctr ,719 40, , C R Drew U of Med & Sci... 17,205e 24,484 31,045 36, , Temple University... 46,219 39,957 30,675 36, ,645 17,843 1, George Washington U... 26,872 23,269 23,310 36, , Utah State University... 32,316 33,636 35,626 34,166 21,080 7,848 5, California Inst of Tech... 32,425 26,791 31,931 33, , MCP Hahnemann U... 95,984 27,254 41,267 31, ,563 17,001 2,374 Total, 1st 120 institutions... 13,385,381 14,376,565 16,104,521 17,753,876 2,062,404 5,237,029 9,785, , SUNY Hlth Sci Ctr Brklyn... 27,517 28,840 31,626 31,626e 0e 18,509e 13,041e 76e 122 U of Nevada Reno... 21,761 18,855 26,014 31,445 11,564 15,016 4, Saint Louis University... 26,000 27,118 29,888 31, ,097 14,250 4, Texas Tech University... 22,446 24,337 27,413 31,241 11,705 11,820 6, Loyola U of Chicago... 28,980 25,799 25,087 30, ,616 15, U of MA Amherst... 26,555 26,596 32,453 29,894 11,275 15, , U of South Carolina... 18,180 23,387 24,371 27, ,555 19,033 1, Princeton University... 17,843 19,429 23,185 26, , Eastern VA Med School... 21,672 24,096 23,299 26, ,486 16, S Illinois U Carbondale... 16,616 18,967 23,401 25,714 8,786 5,668 10, Total, 1st 130 institutions... 13,612,951 14,613,989 16,371,258 18,045,309 2,105,734 5,372,680 9,887, , U MD Biotechnology Inst... 23,944 23,425 22,504 24,392 6,110 18, New York Medical College... 19,159 20,436 23,348 24, ,990 10, U PR Med Sci Campus... 19,830 17,114 21,373 23, , U of Maine... 14,276 16,742 18,431 23,912 10,066 11, , Loma Linda University... 12,788 18,818 21,488 23,324 i 0 i 5,922 i 17,402 i 0 i 136 Univ of Montana, The... 13,896 16,707 20,509 23,287 7,776 10,509 3,633 1, Unif Svcs U of Hlth Sci... 20,309 22,898 23,987 23, ,553 15, Brandeis University... 20,304 20,127 20,159 22, , San Diego St University... 19,023 19,928 20,629 22, ,920 9,383 1, University of Delaware... 17,180 17,348 20,227 21,871 17,231 4, Total, 1st 140 institutions... 13,793,660 14,807,532 16,583,913 18,278,503 2,147,045 5,478,385 9,967, ,
232 Table B-58. R&D expenditures in the life sciences at universities and colleges, ranked by fiscal year 2001 R&D expenditures in the life sciences: fiscal years and by subfield for fiscal year 2001 Page 4 of , by subfield Institution and ranking Agri- Biocultural logical Medical Other sciences sciences sciences 141 New Mexico State Univ... 16,330 17,582 19,165 20,202 17,650 2, University of Wyoming... 19,657 21,491 17,512 19,715 11,745 7, Morehouse School of Med... 13,213 13,622 16,889 19, ,261 8, Howard University... 13,119 13,457 16,400 19, ,931 7, Wright State University... 11,943 14,093 17,350 19, ,498 16, U of LA Lafayette... 12,461 14,834 18,167 18, ,503 14, SUNY Upstate Med U... 14,089 15,099 17,095 17, ,457 10, University of Oregon... 14,451 13,986 16,949 17, ,237 9, Creighton University... 14,758 15,725 15,464 17, ,120 13, U of Alaska Fairbanks... 19,562 i 17,234 19,887 16,601 7,814 8, Total, 1st 150 institutions... 13,943,243 14,964,655 16,758,791 18,465,305 2,184,699 5,545,679 10,048, ,619 Total, all other sampled institutions , , , , , , ,420 64,088 KEY: -- = not available e = estimated i = imputed NOTE: Because of rounding, detail may not add to totals. SOURCE: National Science Foundation/Division of Science Resources Statistics, Survey of Research and Development Expenditures at Universities and Colleges, Fiscal Year
233 Table B-59. Federally financed R&D expenditures in the life sciences at universities and colleges, ranked by fiscal year 2001 federally financed R&D expenditures in the life sciences: fiscal years and by subfield for fiscal year 2001 Page 1 of , by subfield Institution and ranking Agri- Biocultural logical Medical Other sciences sciences sciences Total, all institutions... 8,330,565 8,941,216 10,059,092 11,178, ,350 3,872,150 6,248, ,530 1 Johns Hopkins U , , , , , ,267 22,691 2 U of Washington , , , ,001 11,453 78, ,149 3,118 3 U of Pennsylvania , , , , , ,736 6,989 4 U CA San Francisco , , , , , , Washington University , , , , , ,071 4,511 6 University of Pittsburgh , , , , , ,767 5,256 7 Baylor Col of Medicine , , , , ,250 81, Harvard University , , , , , , U CA Los Angeles , , , , , ,134 4, Yale University , , , , , ,922 0 Total, 1st 10 institutions... 1,816,166 2,025,551 2,297,230 2,605,652 13, ,055 1,792,321 47, Stanford University , , , , , , University of Michigan , , , ,732 1,531 65, ,552 28, Columbia U in City of NY , , , , , ,102 1, University of Minnesota , , , ,638 14,696 33, ,966 8, U of Alabama Birmingham , , , , , , U of NC Chapel Hill , , , , ,616 90,714 8, Duke University , , , , , , U CA San Diego , , , , , , Emory University , , , , ,981 87,296 31, U of WI-Madison , , , ,022 12,757 65,058 78,722 1,485 Total, 1st 20 institutions... 3,217,539 3,513,350 3,959,568 4,444,141 42,030 1,264,793 3,009, , University of Colorado , , , , , ,540 2, Cornell University , , , ,510 17,221 34,128 93, Case Western Reserve U , , , , ,596 93, U TX SW Med Ctr at Dallas... 97, , , , ,277 65, U of Iowa... 89,203 96, , , ,580 79,779 14, U of Southern California... 91,664 94, , , , ,489 7, Vanderbilt University... 86,936 91, , , ,147 52,764 7, University of Chicago... 87,762 91,591 97, , ,020 74, University of Cincinnati... 74,095 83,303 94, , ,300 72, Mt Sinai Sch Med... 69,995 84,624 98, , ,307 71,037 0 Total, 1st 30 institutions... 4,136,241 4,504,153 5,066,471 5,704,376 59,255 1,661,739 3,822, , Yeshiva University... 80,000 89, , , ,131 58,794 22, U CA Davis... 88,045 98, , ,675 22,873 40,033 43, Oregon Health & Science U... 78,866 i 91,835 i 104, , ,459 57,842 10, University of Arizona... 75,275 80,174 89, ,356 15,380 39,746 48,748 1, Northwestern University... 78,649 82,942 96, , ,707 55,630 5, University of Rochester... 76,928 75,975 88, , ,525 65,913 3, New York University... 81,747 89,173 93, , ,504 40,319 25, Boston University... 67,475 80,675 88, , ,679 92,068 1, U of MD Baltimore... 78,037 84,516 91,212 99, ,864 79,273 4, U of IL Chicago... 56,850 67,001 76,932 96, ,786 59,277 6,774 Total, 1st 40 institutions... 4,898,113 5,344,908 6,007,800 6,737,785 97,508 1,973,173 4,424, , Ohio State University... 72,194 77,926 79,507 94,278 8,134 31,400 43,684 11, U TX MD Anderson Cncr Ctr.. 60,347 66,016 77,963 88, ,098 48, UT Houston Hlth Sci Ctr... 70,446 71,288 79,665 88, ,243 58,522 1, U Med & Dent of NJ... 59,828 61,730 75,318 86, ,327 45, University of Florida... 63,549 75,556 72,971 85,415 16,777 28,912 37,065 2, Georgetown University... 79,223 76,707 92,084 85, ,830 77, University of Utah... 63,895 68,423 81,091 83, ,220 43,445 13, Indiana University... 64,970 70,151 74,949 82, ,240 51,688 2, U CA Berkeley... 65,728 64,757 76,937 82,235 18,182 44,244 19, University of Virginia... 61,600 67,715 75,640 81, ,493 46, Total, 1st 50 institutions... 5,559,893 6,045,177 6,793,925 7,596, ,657 2,283,180 4,896, ,
234 Table B-59. Federally financed R&D expenditures in the life sciences at universities and colleges, ranked by fiscal year 2001 federally financed R&D expenditures in the life sciences: fiscal years and by subfield for fiscal year 2001 Page 2 of , by subfield Institution and ranking Agri- Biocultural logical Medical Other sciences sciences sciences 51 U of MA Worcester... 53,766 55,516 64,212 79, ,419 35,318 11, Wake Forest University... 56,023 59,351 65,094 76, , U TX Hlth Sci Ctr San Ant... 51,954 56,904 65,251 71, ,678 42, University of Miami... 62,022 63,869 68,262 70, ,816 53, U CA Irvine... 41,652 48,827 61,177 67, ,114 20, Pennsylvania State U... 52,397 56,182 68,343 67,800 14,680 14,688 36,705 1, SUNY at Buffalo... 48,799 57,307 67,966 67, ,661 39,463 4, Thomas Jefferson U... 51,728 56,369 67,448 64, ,280 27,497 1, Wayne State University... 46,472 47,371 52,637 64, ,037 60,743 1, Medical Col of Wisconsin... 43,831 47,087 55,034 64, ,420 37,583 0 Total, 1st 60 institutions... 6,068,537 6,593,960 7,429,349 8,290, ,337 2,511,589 5,327, , U TX Med Br at Galveston... 48,310 54,759 60,749 63, ,234 33, Tufts University... 51,225 53,302 54,306 61, ,948 5, Med U of South Carolina... 36,473 30,997 41,432 60, ,961 28,456 12, University of Kentucky... 41,679 46,622 50,133 60,341 9,160 1,581 49, MA Institute of Tech... 33,826 49,466 55,109 59, ,892 11,080 1, Michigan State University... 45,496 49,996 51,536 59,016 14,722 32,128 10,839 1, University of Kansas... 28,377 38,866 46,879 54, ,021 21,351 6, Rockefeller U, The... 40,347 42,689 42,109 51, ,674 4, SUNY at Stony Brook... 48,990 48,971 51,701 50, ,050 20, Louisiana State U System... 37,833 42,673 47,916 50,635 5,617 33,067 11, Total, 1st 70 institutions... 6,481,093 7,052,301 7,931,219 8,862, ,869 2,834,145 5,524, , University of Georgia... 42,412 42,100 47,290 49,294 14,501 31,617 3, U of Missouri Columbia... 31,875 37,318 45,496 48,950 15,542 15,316 14,967 3, University of Connecticut... 37,120 38,767 46,875 48,914 2,909 23,167 20,916 1, Virginia Commonwealth U... 43,479 42,593 45,047 48, ,107 27,521 1, Colorado State University... 42,266 56,063 62,328 48,151 35,204 7,262 5, Dartmouth College... 34,859 35,707 41,537 47, ,799 44, U of Tennessee System... 37,064 38,605 43,256 44,255 2,248 24,553 16,400 1, University of Vermont... 27,751 31,432 35,632 43,959 2,313 17,865 21,253 2, Tulane University... 44,002 41,482 40,122 41, ,812 10,909 23, Purdue University... 32,707 34,525 35,919 41,501 8,567 24,159 5,809 2,966 Total, 1st 80 institutions... 6,854,628 7,450,893 8,374,721 9,325, ,153 3,007,802 5,695, , University of New Mexico... 26,611 29,014 38,214 41, ,076 14,203 4, Texas A&M University... 43,610 43,653 37,616 40,985 17,270 8,426 15, U of IL Urbana-Champaign... 31,887 33,684 37,004 39,942 11,668 25,722 2, Univ of Hawaii at Manoa... 31,608 36,536 38,123 36,896 5,354 5,698 16,406 9, Rush University... 27,465 30,034 32,178 36, ,067 28,121 1, Oregon State University... 40,011 38,305 35,793 36,364 21,261 11,940 1,758 1, U of South Florida... 14,694 21,731 29,878 35, ,447 33, SUNY at Albany... 23,274 34,434 50,670 35, , NC State University... 23,450 21,277 27,299 34,246 9,968 23, , U of Arkansas Medical Sci... 21,857 26,392 29,962 34, ,690 20,529 0 Total, 1st 90 institutions... 7,139,095 7,765,953 8,731,458 9,697, ,674 3,163,710 5,827, , California Inst of Tech... 31,416 26,077 28,580 31, , Rutgers the State U NJ... 24,892 26,225 28,157 30,684 8,741 14,047 7, Brown University... 19,938 21,568 26,011 29, ,850 20,246 6, Washington State U... 28,160 27,895 29,653 29,223 8,707 17, , University of Oklahoma... 26,845 28,928 25,532 28, ,794 11, U TX at Austin... 18,220 20,222 24,953 27, ,227 7, C R Drew U of Med & Sci... 16,052 22,212 21,969 27, , Saint Louis University... 22,595 23,239 25,809 27, ,347 12,307 4, Iowa State University... 20,402 21,345 22,669 25,448 11,822 11,301 1, Temple University... 21,568 21,570 23,947 25, ,492 11,345 1,296 Total, 1st 100 institutions... 7,369,183 8,005,234 8,988,738 9,979, ,944 3,300,088 5,928, ,
235 Table B-59. Federally financed R&D expenditures in the life sciences at universities and colleges, ranked by fiscal year 2001 federally financed R&D expenditures in the life sciences: fiscal years and by subfield for fiscal year 2001 Page 3 of , by subfield Institution and ranking Agri- Biocultural logical Medical Other sciences sciences sciences 101 George Washington U... 13,989 15,349 14,073 23, , Mississippi State U... 17,370 17,460 21,170 22,869 21, SUNY Hlth Sci Ctr Brklyn... 18,318 21,053 22,860 22,860e 0e 15,089e 7,771e MCP Hahnemann U... 61,102 17,039 27,127 22, ,943 10,139 1, VA Polytech Inst & St U... 18,391 18,472 20,481 22,598 14,207 4,263 1,256 2, U of Nebraska Med Ctr... 15,663 17,167 19,878 22, ,539 6, Loyola U of Chicago... 15,676 15,904 16,720 21, ,371 10, Medical Col of Georgia... 13,127 13,991 15,210 21, ,137 7, U of Nebraska at Lincoln... 22,279 i 14,120 14,269 20,905 10,472 9, University of Louisville... 11,308 11,227 13,668 19, ,108 11,684 1,196 Total, 1st 110 institutions... 7,576,406 8,167,016 9,174,194 10,199, ,251 3,388,331 6,007, , U PR Med Sci Campus... 11,843 13,971 16,657 19, , New York Medical College... 13,639 14,029 17,975 18, ,666 6, TX A&M U Sys Hlth Sci Ctr ,314 18, , Howard University... 12,066 12,248 15,284 18, ,205 7, Morehouse School of Med... 12,060 12,948 15,419 18, ,110 8, Princeton University... 11,424 13,148 15,571 17, , Loma Linda University... 7,834 12,217 15,930 17,367 i 0 i 4,662 i 12,705 i Brandeis University... 14,762 14,534 14,241 17, , U of Nevada Reno... 12,327 12,467 13,435 16,950 1,728 11,329 3, Kansas State University... 13,771 14,633 15,941 16,563 8,562 7, Total, 1st 120 institutions... 7,686,132 8,287,211 9,328,961 10,377, ,541 3,480,338 6,083, , U of MD at College Park... 11,181 12,280 11,573 16,447 6,657 6, , Montana St U Bozeman... 12,094 12,751 14,484 16,155 9,538 6, University of Oregon... 11,903 12,169 15,174 16, ,911 9, Clemson University... 14,996 14,718 17,023 15,698 11,174 4, West Virginia University... 10,774 10,603 13,420 15,671 2,329 4,122 9, Auburn University... 11,062 9,971 12,106 15,444 8,791 3,162 1,233 2, Utah State University... 13,189 14,747 16,066 14,796 9,168 2,489 3, U of MA Amherst... 10,256 10,892 12,934 14,740 3,988 9, U of Alaska Fairbanks... 4,841 i 6,254 8,412 14,575 7,283 6, Univ of Montana, The... 9,047 11,368 13,772 14,417 4,180 6,580 2, Total, 1st 130 institutions... 7,795,475 8,402,964 9,463,925 10,531, ,649 3,537,388 6,108, , University of Idaho... 13,446 16,173 12,180 14,206 10,733 3, U of South Carolina... 8,925 12,433 14,074 14, ,726 9, Florida A&M University... 8,888 11,778 9,364 13,759 5,605 6, , U CA Riverside... 9,242 7,511 7,696 12,700 3,470 7,732 1, San Diego St University... 11,024 10,643 10,332 11, ,249 4, Oklahoma State University... 9,232 9,637 11,709 11,395 4,412 5, Eastern VA Med School... 9,449 11,354 12,114 11, ,819 7, Med Col of Ohio... 8,107 9,219 9,944 11, ,495 2, SUNY Upstate Med U... 6,487 7,889 8,461 10, ,257 4, U of Arkansas Main... 8,196 8,939 10,059 10,704 9, Total, 1st 140 institutions... 7,888,471 8,508,540 9,569,858 10,653, ,167 3,589,794 6,140, ,
236 Table B-59. Federally financed R&D expenditures in the life sciences at universities and colleges, ranked by fiscal year 2001 federally financed R&D expenditures in the life sciences: fiscal years and by subfield for fiscal year 2001 Page 4 of , by subfield Institution and ranking Agri- Biocultural logical Medical Other sciences sciences sciences 141 Wright State University... 7,081 8,241 8,064 10, , Unif Svcs U of Hlth Sci... 7,547 9,696 11,023 10, ,284 6, Meharry Medical College... 10,331e 8,865 8,865e 9,660 i 0 i 4,993 i 4,361 i University of Wyoming... 8,552 10,042 7,787 8,870 4,713 3, Texas Tech University... 5,207 5,595 6,837 8,865 1,749 6, Albany Medical College... 6,545 7,437 7,691 8, , Arizona State University... 6,371 7,285 7,705 8, , , U Mississippi, All Camp... 10,825 2,926 13,333 8, , U of LA Lafayette... 2,571 2,840 8,190 8, ,115 6, Carnegie Mellon U... 6,926 6,249 7,760 8, , ,482 Total, 1st 150 institutions... 7,960,427 8,577,716 9,657,113 10,743, ,406 3,630,998 6,176, ,676 Total, all other sampled institutions , , , ,234 91, ,152 72,284 29,854 1 Johns Hopkins University includes the Applied Physics Laboratory. KEY: -- = not available e = estimated i = imputed NOTE: Because of rounding, detail may not add to totals. SOURCE: National Science Foundation/Division of Science Resources Statistics, Survey of Research and Development Expenditures at Universities and Colleges, Fiscal Year
237 Table B-60. Total and federally financed R&D expenditures in the agricultural sciences at universities and colleges, ranked by fiscal year 2001 total R&D expenditures in the agricultural sciences: fiscal years Page 1 of 3 Total Federally financed Institution and ranking Total, all institutions... 1,995,484 2,035,149 2,175,269 2,318, , , , ,350 1 U CA Davis , , , ,152 28,416 28,573 34,870 22,873 2 University of Florida... 72,476 87,218 87, ,287 11,111 12,776 12,857 16,777 3 University of Georgia... 73,069 75,994 87,415 89,594 12,355 12,238 14,600 14,501 4 NC State University... 60,168 72,724 70,131 73,787 8,259 8,152 10,169 9,968 5 Mississippi State U... 55,294 57,964 68,358 72,172 16,127 16,490 20,283 21,628 6 Pennsylvania State U... 23,151 23,190 63,436 70,405 5,494 6,099 14,236 14,680 7 Texas A&M University... 59,860 57,792 66,793 69,231 15,812 14,068 14,226 17,270 8 Michigan State University... 54,954 58,591 61,454 68,798 11,320 12,697 12,575 14,722 9 VA Polytech Inst & St U... 54,399 59,805 63,870 68,669 14,582 14,411 14,440 14, University of Minnesota... 55,693 58,619 60,482 68,399 10,424 10,790 13,217 14,696 Total, 1st 10 institutions , , , , , , , , U CA Berkeley... 53,831 26,553 27,948 68,053 13,167 2,822 2,957 18, Cornell University... 45,628 48,153 52,517 64,188 12,154 12,719 13,758 17, Colorado State University... 42,874 56,396 57,129 63,426 23,151 32,246 38,093 35, University of Kentucky... 50,143 52,996 56,606 56,652 4,472 8,197 8,506 9, Oregon State University... 57,866 55,105 52,052 56,223 27,826 25,608 21,950 21, Louisiana State U System... 52,166 52,601 54,345 55,497 1,954 4,476 4,268 5, U of Missouri Columbia... 43,951 48,200 48,455 52,127 11,304 13,752 17,318 15, U of IL Urbana-Champaign... 40,450 45,334 48,239 50,984 8,790 9,814 11,049 11, University of Arizona... 46,049 45,495 46,745 49,212 13,850 14,366 13,887 15, U of Arkansas Main... 45,060 42,254 45,525 48,697 7,862 8,347 8,968 9,170 Total, 1st 20 institutions... 1,093,628 1,129,279 1,246,950 1,353, , , , , Iowa State University... 38,808 40,154 42,644 48,689 9,615 9,416 10,250 11, U of Nebraska at Lincoln... 54,227 i 40,257 40,692 46,128 16,974 i 8,323 8,368 10, North Dakota State U... 30,113 31,589 33,003 45,518 4,062 3,592 4,556 4, Purdue University... 35,625 38,538 42,348 43,419 7,821 9,052 9,863 8, Kansas State University... 38,347 41,091 43,595 43,352 6,562 7,505 8,558 8, U of WI-Madison... 28,767 33,223 38,597 40,912 8,301 8,305 10,572 12, Ohio State University... 51,776 45,548 44,558 40,794 10,281 13,773 6,821 8, Auburn University... 36,228 37,693 40,941 38,916 7,367 6,111 7,952 8, Clemson University... 25,778 23,451 27,124 37,620 8,063 6,389 7,389 11, Rutgers the State U NJ... 30,425 32,266 34,199 37,103 5,300 6,243 6,934 8,741 Total, 1st 30 institutions... 1,463,722 1,493,089 1,634,651 1,776, , , , , University of Idaho... 33,782 33,437 31,765 33,879 9,843 12,234 9,111 10, Montana St U Bozeman... 23,132 24,454 29,341 31,020 5,855 6,994 8,375 9, U of MD at College Park... 27,036 25,565 18,670 29,836 6,068 5,088 2,766 6, Oklahoma State University... 26,528 26,327 26,625 27,169 4,567 4,316 4,509 4, Washington State U... 24,214 22,959 25,070 26,130 7,925 7,292 7,785 8, U of Tennessee System... 28,216 30,481 28,762 24,050 4,786 5,443 5,684 2, U CA Riverside... 23,552 21,974 24,419 23,315 2,241 2,209 2,334 3, Utah State University... 21,294 22,692 22,774 21,080 8,531 9,487 10,641 9, U of Washington... 16,167 16,516 17,003 19,562 11,160 10,939 10,619 11, New Mexico State Univ... 13,880 15,672 17,331 17,650 5,071 5,456 6,167 6,423 Total, 1st 40 institutions... 1,701,523 1,733,166 1,876,411 2,029, , , , , University of Delaware... 14,927 14,657 16,566 17,231 2,367 2,335 3,125 4, Univ of Hawaii at Manoa... 18,099 19,409 18,585 13,441 6,737 8,322 8,284 5, University of Wyoming... 11,805 11,822 13,590 11,745 5,427 6,570 4,903 4, Texas Tech University... 9,030 10,365 11,153 11,705 1,472 1,392 1,400 1, South Dakota State U... 10,361 10,436 10,857 11,635 3,621 3,419 3,948 3, U of Nevada Reno... 6,788 5,149 10,296 11,564 2,036 2,077 1,352 1, U of MA Amherst... 16,364 16,051 13,932 11,275 4,859 5,184 3,603 3, U of Maine... 5,556 6,550 7,297 10,066 1,823 2,262 2,896 2, West Virginia University... 6,222 7,195 7,566 8,860 1,382 1,510 2,113 2, S Illinois U Carbondale... 5,817 6,116 9,120 8, ,827 1,737 Total, 1st 50 institutions... 1,806,492 1,840,916 1,995,373 2,146, , , , ,
238 Table B-60. Total and federally financed R&D expenditures in the agricultural sciences at universities and colleges, ranked by fiscal year 2001 total R&D expenditures in the agricultural sciences: fiscal years Page 2 of 3 Total Federally financed Institution and ranking University of Connecticut... 7,331 7,933 9,953 7,881 1,171 1,384 1,723 2, U of Alaska Fairbanks... 9,136 i 7,374 8,509 7,814 1,668 i 2,465 3,315 7, Univ of Montana, The... 5,623 6,135 8,012 7,776 3,118 3,470 4,898 4, U CA Los Angeles , Prairie View A&M U... 3,357 4,209 4,339 6,561 3,230 3,058 2,938 2, U MD Biotechnology Inst... 5,723 5,599 5,379 6,110 1,997 2,356 2,004 1, U of New Hampshire... 4,918 4,845 4,818 5,689 1,089 1,224 1,186 1, University of Vermont... 5,681 5,436 5,203 5,641 2,400 2,500 2,230 2, Florida A&M University... 4,737 5,094 4,887 5,605 3,506 4,647 4,335 5, U of Rhode Island... 4,781 5,648 7,592 5,260 4,219 4,854 6,176 5,115 Total, 1st 60 institutions... 1,857,779 1,893,189 2,054,065 2,211, , , , , Alcorn State University... 3,913 3,863 5,903 4,735 3,913 3,863 5,903 4, NC A&T State University... 2,879 3,314 3,362 4,544 2,396 2,503 2,574 2, Texas A&M Univ Kingsville... 4,002 3,651 4,252 4, University of Michigan... 2,592 2,167 4,114 4,313 1, ,562 1, SUNY Col Env Sci & Frstry... 3,293 i 3,887 4,086e 4,228e 359 i e 588e 66 Northern Arizona U... 2,059 1,987 2,609 4, , Tennessee State U... 3,462 3,821 3,817 3,822 2,314 2,548 2,469 2, Michigan Tech University... 3,146 3,479 3,076 3,800 2,309 2,683 2,454 2, Alabama A&M University... 4,734 4,476 3,179 3,466 i 3,421 3,505 2,676 2,943 i 70 Kentucky State University e 1,934 i 3, e 1,768 i 3,014 Total, 1st 70 institutions... 1,888,373 1,924,348 2,090,397 2,252, , , , , CA St U Fresno... 5,810 i 6,524 i 4,314 3, i 287 i Virginia State University... 1,597 2,297 3,125 3,125 1,051 1,747 2,305 2, U Arkansas Pine Bluff... 3,077 3,077e 3,077 i 3,077 i 2,225 2,225e 2,225 i 2,225 i 74 Langston University... 2,031 2,340 2,553 2,863 2,031 2,340 2,553 2, Southern U A&M All Camp... 2,639 2,627 2,552 2,783 i 1,946 1,821 2,044 2,248 i 76 Humboldt State University... 2,249 2,448 2,448e 2,767 i 1,455 1,580 1,580e 1,769 i 77 Tarleton State University , , Fort Valley State U... 2,696 2,674 2,520 2,520e 2,281 2,268 2,373 2,373e 79 Stephen F Austin St U... 2,420 3,477 3,927 2, Cal Poly St U ,197 2,921 2, , Total, 1st 80 institutions... 1,911,763 1,952,010 2,117,844 2,280, , , , , U of MD Eastern Shore... 1,200 1,683 1,319 2,292 1,200 1,683 1,319 2, Lincoln University... 3,031 i 2,405 2,207 2,236 2,381 i 2,405 2,207 2, University of Guam... 1,223 1,212 1,957 2,199 1,206 1,201e 1,957 2, Tuskegee University... 15,305 2,121 2,044 2,176 10,906 1,975 1,905 2, U CA Santa Cruz... 1,276 1,488 1,911 2, Harvey Mudd College... 0 i 1,452 i 1,452 i 1,641 i 0 i 277 i 277 i 310 i 87 Yale University... 1,529 1,548 1,278 1, U of the Virgin Islands... 1,821e 1,466e 1,466e 1,466 i 1,818e 1,466e 1,466e 1,466 i 89 Delaware State University... 1,964 1,509 2,075 1,383 1,839 1,143 1,954 1, Arizona State University ,183 1, Total, 1st 90 institutions... 1,939,818 1,967,587 2,134,736 2,298, , , , ,
239 Table B-60. Total and federally financed R&D expenditures in the agricultural sciences at universities and colleges, ranked by fiscal year 2001 total R&D expenditures in the agricultural sciences: fiscal years Page 3 of 3 Total Federally financed Institution and ranking West Texas A&M U... 2,130 1,946 1,393 1, U of Northern Iowa , Brigham Young University ,366 1, University of DC , Illinois State University e i e 0 0 i 0 96 Western Illinois U... 1,613 1,093 1, , U of WI-Stevens Point , U of Pennsylvania U of NC Wilmington San Francisco State U... 0 i 717 i 724 i 724 i 0 i 486 i 611 i 611 i Total, 1st 100 institutions... 1,945,965 1,975,780 2,143,649 2,308, , , , ,581 Total, all other sampled institutions... 49,519 59,369 31,620 9,452 19,328 23,123 11,303 3,769 KEY: e = estimated i = imputed NOTE: Because of rounding, detail may not add to totals. SOURCE: National Science Foundation/Division of Science Resources Statistics, Survey of Research and Development Expenditures at Universities and Colleges, Fiscal Year
240 Table B-61. Total and federally financed R&D expenditures in the biological sciences at universities and colleges, ranked by fiscal year 2001 total R&D expenditures in the biological sciences: fiscal years Page 1 of 3 Total Federally financed Institution and ranking Total, all institutions... 4,580,830 5,029,285 5,613,179 5,943,596 2,935,562 3,214,280 3,649,980 3,872,150 1 Baylor Col of Medicine , , , ,458 66,773 85, , ,250 2 Washington University... 95, , , ,778 72,471 93, , ,763 3 U of Pennsylvania... 98, , , ,556 74,506 89, , ,144 4 Rockefeller U, The , , , ,770 36,524 37,924 37,997 46,674 5 U of WI-Madison... 86, , , ,460 45,740 54,115 61,131 65,058 6 U CA Davis... 45,546 62,830 84, ,269 16,220 25,046 35,990 40,033 7 Johns Hopkins U... 79,603 i 89,017 98, ,540 61,961 i 69,030 78,137 89,607 8 U of Washington... 83,666 98, , ,824 69,824 75,050 77,047 78,281 9 U TX SW Med Ctr at Dallas... 70,310 73,654 87, ,724 48,414 48,467 54,978 65, U of NC Chapel Hill... 77,094 80,602 87,196 96,387 59,372 60,698 66,577 73,616 Total, 1st 10 institutions , ,914 1,149,351 1,310, , , , , Harvard University... 98, ,751 90,740 92,150 87,418 95,605 77,164 77, Yale University... 73,251 78,469 86,408 90,292 61,187 65,121 72,024 74, University of Michigan... 81,606 77,403 83,497 90,204 55,139 57,611 60,459 65, U TX MD Anderson Cncr Ctr.. 61,342 67,760 76,021 84,749 27,871 32,330 37,732 40, Columbia U in City of NY... 67,051 75,186 78,329 84,359 59,234 64,933 71,417 77, Tufts University... 65,091 71,567 73,036 73,730 46,613 48,542 49,247 54, University of Georgia... 57,443 64,073 68,244 73,668 27,760 27,675 29,784 31, Duke University... 52,402 62,002 66,887 73,228 44,178 51,986 54,605 60, Michigan State University... 51,575 55,665 64,601 71,116 26,600 28,137 28,080 32, NC State University... 59,658 58,039 63,084 69,462 14,900 12,774 16,409 23,184 Total, 1st 20 institutions... 1,513,309 1,715,829 1,900,198 2,113,724 1,002,705 1,123,152 1,244,855 1,391, Vanderbilt University... 55,890 57,323 69,404 68,259 48,206 47,819 56,644 57, University of Arizona... 51,099 50,545 57,167 66,847 27,714 27,421 32,101 39, U CA Irvine... 46,390 48,952 57,143 66,508 28,833 33,036 39,950 47, Mt Sinai Sch Med... 39,868 49,611 58,576 66,120 30,207 38,074 43,900 38, U of Alabama Birmingham... 59,679 62,859 66,291 65,554 45,928 49,015 51,231 55, Cornell University... 52,606 49,823 52,559 64,047 29,908 28,645 29,243 34, Northwestern University... 53,124 51,343 57,705 62,340 35,196 37,665 41,056 43, Louisiana State U System... 42,916 50,931 56,366 62,038 25,422 29,572 32,581 33, U CA Berkeley... 57,018 84, ,170 59,752 38,030 48,568 59,746 44, U Med & Dent of NJ... 45,160 50,211 55,491 59,076 27,962 32,100 37,135 40,327 Total, 1st 30 institutions... 2,017,059 2,271,915 2,536,070 2,754,265 1,340,111 1,495,067 1,668,442 1,825, MA Institute of Tech... 42,744 52,411 57,181 58,635 33,826 40,848 44,122 46, Ohio State University... 43,622 46,073 52,365 58,416 24,693 24,205 28,026 31, University of Colorado... 41,438 40,601 48,258 55,001 32,731 34,279 41,457 46, University of Minnesota... 50,431 53,502 54,228 54,865 33,549 35,396 33,317 33, SUNY at Stony Brook... 42,708 44,046 49,072 54,662 28,204 28,424 30,859 30, Purdue University... 43,305 44,636 46,279 52,406 17,283 17,221 18,839 24, Emory University... 37,531 40,742 44,884 51,160 31,097 33,978 37,809 42, University of Cincinnati... 45,159 42,373 45,463 50,764 29,132 30,223 34,337 39, U of Iowa... 34,996 37,860 44,149 50,154 21,700 23,798 27,879 31, University of Kansas... 37,581 41,879 47,159 49,805 20,141 19,769 22,870 27,021 Total, 1st 40 institutions... 2,436,574 2,716,038 3,025,108 3,290,133 1,612,467 1,783,208 1,987,957 2,179, University of Chicago... 33,593 35,140 38,325 49,696 28,013 30,216 30,813 41, Case Western Reserve U... 42,420 45,270 50,163 49,514 31,789 34,726 39,255 39, U TX Med Br at Galveston ,909 41,471 49, ,303 27,499 30, U of IL Chicago... 27,997 32,830 39,590 49,407 16,080 19,257 23,236 30, University of Florida... 45,592 51,030 34,476 48,437 23,676 29,159 18,674 28, U of IL Urbana-Champaign... 34,894 35,384 41,353 48,419 21,253 22,213 24,162 25, New York University... 41,339 43,356 44,200 46,407 33,767 33,815 34,497 35, Thomas Jefferson U... 37,076 39,632 42,590 45,390 30,322 29,724 34,650 36, Indiana University... 34,999 38,367 40,531 44,528 22,259 24,406 25,511 28, Rutgers the State U NJ... 40,216 39,776 42,223 41,922 11,162 11,494 13,960 14,047 Total, 1st 50 institutions... 2,774,700 3,120,732 3,440,030 3,763,300 1,830,788 2,045,521 2,260,214 2,489,
241 Table B-61. Total and federally financed R&D expenditures in the biological sciences at universities and colleges, ranked by fiscal year 2001 total R&D expenditures in the biological sciences: fiscal years Page 2 of 3 Total Federally financed Institution and ranking University of Rochester... 32,171 30,292 37,694 41,874 26,412 24,938 31,985 34, University of Virginia... 28,444 31,679 36,926 41,679 22,523 25,914 30,570 34, Oregon Health & Science U... 28,179 i 31,026 i 51,801 41,636 24,220 i 28,203 i 45,755 38, SUNY at Albany... 28,221 38,486 55,159 41,335 23,274 34,434 50,670 35, U TX Hlth Sci Ctr San Ant... 30,312 31,316 34,974 40,249 22,118 23,446 25,949 28, University of Connecticut... 26,519 28,864 35,293 39,168 14,489 15,804 19,300 23, Washington State U... 35,230 36,994 38,726 38,620 18,043 18,217 19,328 17, UT Houston Hlth Sci Ctr... 23,716 24,590 33,997 38,043 16,123 17,247 25,855 28, U CA San Diego... 21,625 35,619 40,608 37,957 15,227 26,043 30,260 26, SUNY at Buffalo... 43,013 47,346 52,362 36,465 27,738 29,596 33,921 23,661 Total, 1st 60 institutions... 3,072,130 3,456,944 3,857,570 4,160,326 2,040,955 2,289,363 2,573,807 2,780, University of Utah... 30,992 26,549 34,153 36,329 24,931 23,490 27,856 26, Yeshiva University... 24,000 27,093 33,843 35,931 18,400 21,738 24,635 26, U of MD Baltimore... 21,498 21,135 33,652 35,851 11,706 12,677 13,682 14, U of MA Worcester... 29,038 30,079 32,296 35,724 26,023 26,301 28,016 32, U CA Riverside... 25,184 22,588 20,527 34,875 6,541 4,731 4,198 7, Medical Col of Wisconsin... 20,448 22,674 28,980 34,617 15,998 17,375 22,597 26, U of Nebraska Med Ctr... 29,850 34,363 31,245 34,607 10,148 12,732 14,558 15, U of Missouri Columbia... 28,980 29,330 30,760 33,827 11,328 11,459 13,250 15, California Inst of Tech... 32,425 26,791 31,931 33,779 31,416 26,077 28,580 31, Iowa State University... 31,045 32,699 32,227 33,480 9,505 10,270 10,819 11,301 Total, 1st 70 institutions... 3,345,590 3,730,245 4,167,184 4,509,346 2,206,951 2,456,213 2,761,998 2,987, Texas A&M University... 88,641 87,757 33,216 32,798 20,423 18,399 10,146 8, U of Tennessee System... 23,363 22,621 27,690 31,864 16,148 15,550 19,293 24, University of New Mexico... 20,134 19,727 25,465 31,014 15,085 15,098 21,075 23, U of Nebraska at Lincoln... 12,986 i 20,762 21,964 30,927 3,929 i 5,550 5,649 9, Med U of South Carolina... 13,848 i 17,804e 19,688 30,502 8,130 11,056 13,017 19, Medical Col of Georgia... 20,246 21,783 27,765 30,271 7,561 8,825 10,294 13, U TX at Austin... 16,100 21,507 26,891 29,195 12,589 14,733 18,409 20, University of Oklahoma... 23,860 26,202 26,916 28,644 13,559 14,314 13,005 15, Virginia Commonwealth U... 23,729 24,843 26,825 28,591 17,491 18,163 18,574 20, Oregon State University... 21,883 25,311 26,003 28,355 10,497 10,745 11,155 11,940 Total, 1st 80 institutions... 3,610,380 4,018,562 4,429,607 4,811,507 2,332,363 2,588,646 2,902,615 3,154, Pennsylvania State U... 46,249 53,873 56,446 27,305 20,790 32,794 35,919 14, Princeton University... 17,843 19,429 23,185 26,431 11,424 13,148 15,571 17, University of Vermont... 17,619 20,324 21,253 23,789 12,569 15,413 16,863 17, Brandeis University... 20,304 20,127 20,159 22,902 14,762 14,534 14,241 17, U CA San Francisco ,650 22, ,399 16, University of Miami... 18,103 18,474 20,681 21,616 14,783 15,210 16,444 16, University of Louisville... 9,221 15,049 16,841 19,270 4,580 4,761 5,624 7, U CA Los Angeles... 50,563 47,043 51,743 18,799 36,659 31,370 33,860 10, SUNY Hlth Sci Ctr Brklyn... 7,633 17,322 18,509 18,509e 4,604 14,272 15,089 15,089e 90 Colorado State University... 23,940 30,081 31,277 18,474 13,233 17,158 18,694 7,262 Total, 1st 90 institutions... 3,821,855 4,260,284 4,749,351 5,031,480 2,465,767 2,747,306 3,120,319 3,295,
242 Table B-61. Total and federally financed R&D expenditures in the biological sciences at universities and colleges, ranked by fiscal year 2001 total R&D expenditures in the biological sciences: fiscal years Page 3 of 3 Total Federally financed Institution and ranking Oklahoma State University... 10,421 14,784 17,554 18,430 4,404 5,028 6,459 5, U MD Biotechnology Inst... 18,024 17,633 16,940 18,007 4,765 5,623 6,311 6, U of Arkansas Medical Sci... 7,112 12,489 11,461 17,946 6,661 8,786 9,959 13, Temple University... 19,655 21,905 15,256 16,645 12,220 13,509 12,044 12, Kansas State University... 15,689 15,511 15,881 16,575 7,206 7,099 7,346 7, U of MA Amherst... 7,256 7,831 15,612 15,453 4,363 4,730 8,478 9, U of Nevada Reno... 11,015 10,416 11,815 15,016 7,777 7,934 9,016 11, Stanford University... 10,837 13,799 15,361 14,984 8,712 11,594 12,315 11, Loyola U of Chicago... 13,570 12,443 11,203 14,616 9,131 8,485 7,944 11, New York Medical College... 10,916 11,656 11,800 13,990 8,374 9,086 9,505 11,666 Total, 1st 100 institutions... 3,946,350 4,398,751 4,892,234 5,193,142 2,539,380 2,829,180 3,209,696 3,396,401 Total, all other sampled institutions , , , , , , , ,749 KEY: e = estimated i = imputed NOTE: Because of rounding, detail may not add to totals. SOURCE: National Science Foundation/Division of Science Resources Statistics, Survey of Research and Development Expenditures at Universities and Colleges, Fiscal Year
243 Table B-62. Total and federally financed R&D expenditures in the medical sciences at universities and colleges, ranked by fiscal year 2001 total R&D expenditures in the medical sciences: fiscal years Page 1 of 3 Total Federally financed Institution and ranking Total, all institutions... 7,471,677 7,993,971 8,986,177 10,176,728 4,559,251 4,861,041 5,441,759 6,248,659 1 U CA San Francisco , , , , , , , ,791 2 U CA Los Angeles , , , , , , , ,134 3 Johns Hopkins U ,317 i 242, , , ,533 i 190, , ,267 4 University of Pittsburgh , , , , , , , ,767 5 U of Washington , , , , , , , ,149 6 Stanford University , , , , , , , ,098 7 Duke University , , , ,127 88,740 90, , ,770 8 U CA San Diego , , , , , , , ,598 9 U of Pennsylvania , , , , , , , , University of Minnesota , , , ,593 97,374 97, , ,966 Total, 1st 10 institutions... 2,073,110 2,286,871 2,477,664 2,971,939 1,357,878 1,471,032 1,589,790 1,878, U of WI-Madison , , , ,242 71,332 70,011 74,842 78, U of MD Baltimore , , , ,206 62,430 67,613 72,969 79, Yale University , , , , , , , , Harvard University... 96, , , ,454 76,573 87, , , University of Michigan , , , , , , , , Washington University , , , ,732 86,250 94, , , Baylor Col of Medicine , , , ,003 43,837 55,973 77,279 81, U of Southern California , , , ,220 81,569 84,793 91, , Cornell University , , , ,146 68,326 74,618 82,343 93, Columbia U in City of NY , , , ,959 85,197 88, , ,102 Total, 1st 20 institutions... 3,348,949 3,650,052 4,100,229 4,762,897 2,150,884 2,313,338 2,581,844 2,987, U of Alabama Birmingham , , , , , , , , Wayne State University... 99, , , ,074 43,857 44,983 50,451 60, U of Iowa , , , ,647 67,335 72,901 84,526 79, Emory University... 98, , , ,895 61,269 68,489 74,023 87, University of Colorado... 97, , , ,409 70,452 80,370 93, , U TX SW Med Ctr at Dallas... 83,166 91, , ,045 48,602 53,209 53,847 65, U of NC Chapel Hill... 85,172 90,829 99, ,484 67,008 71,610 76,970 90, U TX MD Anderson Cncr Ctr.. 73,758 80,063 97, ,247 32,476 33,686 40,231 48, U of South Florida... 61,344 80,608 91, ,226 14,157 21,188 28,399 33, U of IL Chicago... 76,133 86,864 94, ,543 37,183 42,909 48,167 59,277 Total, 1st 30 institutions... 4,285,010 4,670,786 5,213,238 6,006,258 2,701,946 2,906,358 3,243,114 3,740, Mt Sinai Sch Med... 69,580 78,154 91, ,826 39,788 46,550 54,288 71, Boston University... 76,460 86,658 95, ,662 61,463 73,418 81,463 92, University of Rochester... 74,785 75,767 81, ,323 47,813 48,650 53,561 65, Case Western Reserve U... 90,884 97, , ,459 74,591 79,194 86,372 93, U Med & Dent of NJ... 69,331 76,066 85, ,341 31,866 29,630 38,183 45, Indiana University... 70,782 75,755 87,059 99,307 39,839 43,415 46,910 51, University of Cincinnati... 84,419 71,409 84,952 98,809 44,963 52,887 60,122 72, University of Chicago... 69,343 72,861 82,954 97,357 59,667 61,186 66,148 74, Northwestern University... 73,987 88,008 87,605 96,134 38,843 40,965 50,440 55, Wake Forest University... 75,480 80,678 85,083 95,714 55,568 58,868 64,663 76,655 Total, 1st 40 institutions... 5,040,061 5,473,282 6,098,494 7,028,190 3,196,347 3,441,121 3,845,264 4,439, University of Florida... 58,587 68,348 95,009 94,164 28,364 32,326 38,784 37, U CA Davis... 80,792 81,734 79,361 92,150 43,409 45,165 39,118 43, University of Kentucky... 62,164 67,909 82,698 91,612 35,993 37,086 40,070 49, University of Miami... 74,257 79,299 82,709 86,099 47,239 48,646 51,783 53, University of Arizona... 53,700 60,917 74,590 85,213 31,479 36,930 42,825 48, SUNY at Buffalo... 43,556 51,472 63,675 83,824 16,871 23,637 28,453 39, Georgetown University... 92,522 85,697e 107,609 81,472 68,439 66,170 82,703 77, Ohio State University... 57,282 66,430 80,300 81,376 31,983 34,223 37,533 43, Yeshiva University... 54,000 60,965 76,148 80,845 44,000 48,914 55,430 58, UT Houston Hlth Sci Ctr... 67,368 69,756 68,805 80,144 47,636 46,343 44,657 58,522 Total, 1st 50 institutions... 5,684,289 6,165,809 6,909,398 7,885,089 3,591,760 3,860,561 4,306,620 4,949,
244 Table B-62. Total and federally financed R&D expenditures in the medical sciences at universities and colleges, ranked by fiscal year 2001 total R&D expenditures in the medical sciences: fiscal years Page 2 of 3 Total Federally financed Institution and ranking Oregon Health & Science U... 73,212 i 80,613 i 65,485 78,024 50,788 i 59,138 i 50,027 57, U TX Hlth Sci Ctr San Ant... 52,045 56,488 68,850 74,905 29,836 33,458 39,302 42, New York University... 47,809 54,225 64,090 74,482 27,970 31,967 34,990 40, Vanderbilt University... 45,505 52,456 59,285 73,053 31,623 36,745 39,046 52, Dartmouth College... 47,545 51,140 56,534 70,666 33,129 33,898 39,111 44, University of Utah... 38,269 66,691 52,488 58,897 30,127 42,186 41,447 43, Med U of South Carolina... 29,028 i 28,395e 31,648 58,654 16,107 15,457 19,236 28, University of Virginia... 56,724 48,544 52,593 56,158 36,432 39,540 43,464 46, Virginia Commonwealth U... 45,006 42,880 46,724 54,798 25,062 23,477 25,707 27, Rush University... 40,024 44,802 52,830 53,634 19,531 21,752 25,223 28,121 Total, 1st 60 institutions... 6,159,456 6,692,043 7,459,925 8,538,360 3,892,365 4,198,179 4,664,173 5,361, U TX Med Br at Galveston... 85,150 48,263 54,655 51,430 48,310 27,456 33,022 33, Texas A&M University... 10,592 19,097 46,591 51,233 7,375 11,186 13,244 15, U CA Irvine... 38,868 45,305 49,477 51,110 12,378 15,406 20,830 20, University of Connecticut... 43,083 42,471 50,379 50,147 19,884 20,281 24,380 20, Medical Col of Wisconsin... 35,573 38,772 41,601 49,240 27,833 29,712 32,437 37, Pennsylvania State U... 26,030 21,693 23,825 48,279 24,068 15,691 16,194 36, U of MA Worcester... 29,843 31,531 40,328 44,349 26,152 26,260 31,972 35, Louisiana State U System... 19,686 26,301 35,966 42,844 8,459 8,549 10,672 11, Thomas Jefferson U... 31,765 38,053 45,792 42,211 20,905 25,985 31,671 27, University of Kansas... 13,755 23,220 26,894 42,092 3,762 10,765 14,025 21,351 Total, 1st 70 institutions... 6,493,801 7,026,749 7,875,433 9,011,295 4,091,491 4,389,470 4,892,620 5,622, TX A&M U Sys Hlth Sci Ctr ,048 40, ,411 18, SUNY at Stony Brook... 35,060 34,518 39,652 40,313 20,786 20,160 20,445 20, U CA Berkeley... 63,545 62,167 86,010 37,720 14,531 13,367 14,234 19, C R Drew U of Med & Sci... 17,205e 24,484 31,045 36,717 16,052e 22,212 21,969 27, University of Oklahoma... 28,875 31,709 35,404 35,612 12,987 14,234 11,774 11, George Washington U... 26,576 22,905 22,814 35,326 13,740 14,985 13,607 22, U of Arkansas Medical Sci... 32,375 31,577 37,613 33,975 15,196 17,606 20,003 20, U of Missouri Columbia... 24,529 26,870 31,259 33,376 9,114 11,886 13,997 14, U of Tennessee System... 30,813 36,393 37,253 33,114 14,057 15,093 17,236 16, University of Vermont... 24,124 25,662 25,677 31,810 11,216 11,468 14,701 21,253 Total, 1st 80 institutions... 6,776,903 7,323,034 8,246,208 9,369,650 4,219,170 4,530,481 5,053,997 5,814, University of Louisville... 20,056 25,256 28,675 30,579 5,952 6,084 7,396 11, Tulane University... 26,425 28,675 27,513 30,315 10,415 11,043 10,352 10, Brown University... 23,617 26,100 28,495 29,146 15,621 16,459 19,609 20, U of Nebraska Med Ctr... 20,603 19,842 20,212 25,913 5,515 4,435 5,320 6, West Virginia University... 18,671 17,038 18,527 25,171 5,430 4,825 7,701 9, University of Georgia... 18,324 20,872 24,527 25,078 2,182 2,187 2,906 3, U PR Med Sci Campus... 19,830 17,114 21,373 23,913 11,843 13,971 16,657 19, Medical Col of Georgia... 19,434 19,217 17,754 21,841 5,566 5,166 4,916 7, Univ of Hawaii at Manoa... 16,630 17,716 20,433 21,053 11,987 13,016 15,094 16, Michigan State University... 12,554 13,505 18,467 20,705 6,381 7,985 9,782 10,839 Total, 1st 90 institutions... 6,973,047 7,528,369 8,472,184 9,623,364 4,300,062 4,615,652 5,153,730 5,931,
245 Table B-62. Total and federally financed R&D expenditures in the medical sciences at universities and colleges, ranked by fiscal year 2001 total R&D expenditures in the medical sciences: fiscal years Page 3 of 3 Total Federally financed Institution and ranking Rutgers the State U NJ... 16,364 20,506 17,518 20,121 8,356 8,322 7,128 7, University of New Mexico... 11,136 11,274 14,349 19,147 7,652 9,293 11,906 14, U of South Carolina... 13,375 18,609 18,022 19,033 6,377 9,472 10,584 9, Temple University... 24,852 17,425 14,383 17,843 8,402 7,770 11,040 11, Loma Linda University... 7,532 12,072 16,032 17,402 i 4,202 6,914 11,654 12,705 i 96 MA Institute of Tech ,541 14,553 17, ,697 9,592 11, MCP Hahnemann U... 65,697 15,329 20,573 17,001 37,048 6,641 9,688 10, Wright State University... 10,043 11,787 14,599 16,767 6,355 7,386 6,982 9, Eastern VA Med School... 15,247 15,687 13,820 16,654 6,868 8,392 8,396 7, Unif Svcs U of Hlth Sci... 10,995 13,350 15,656 15,694 4,086 5,653 7,194 6,821 Total, 1st 100 institutions... 7,148,288 7,677,949 8,631,689 9,800,154 4,389,408 4,693,192 5,247,894 6,032,208 Total, all other sampled institutions , , , , , , , ,451 KEY: -- = not available e = estimated i = imputed NOTE: Because of rounding, detail may not add to totals. SOURCE: National Science Foundation/Division of Science Resources Statistics, Survey of Research and Development Expenditures at Universities and Colleges, Fiscal Year
246 Table B-63. Total and federally financed R&D expenditures in psychology at universities and colleges, ranked by fiscal year 2001 total R&D expenditures in psychology: fiscal years Page 1 of 3 Total Federally financed Institution and ranking Total, all institutions , , , , , , , ,103 1 U of WI-Madison... 17,973 20,009 23,237 22,838 14,027 15,437 17,657 16,715 2 Pennsylvania State U... 8,864 10,774 11,227 12,530 5,676 6,621 6,049 6,864 3 University of Oklahoma... 7,845 11,778 13,927 11,937 3,006 3,231 4,632 4,426 4 Temple University... 5,829 4,262 4,360 11,604 3,151 2,229 2,962 7,230 5 New York University... 5,455 4,944 9,909 11,233 4,251 3,907 7,874 9,219 6 University of Michigan... 10,712 8,285 9,076 11,049 5,412 4,367 4,337 5,701 7 U CA Los Angeles... 7,374 8,623 9,012 10,688 5,074 5,680 6,501 7,251 8 University of Rochester... 6,649 6,276 7,975 10,161 3,323 4,036 4,761 6,508 9 U of South Florida... 7,004 6,636 7,542 10,092 3,259 2,908 2,875 3, Univ of Memphis, The... 6,405 7,355 9,375 9,788 2,711 3,229 5,143 4,537 Total, 1st 10 institutions... 84,110 88, , ,920 49,890 51,645 62,791 72, Indiana University... 7,210 8,552 9,073 9,652 5,460 6,281 6,090 6, University of Colorado... 7,348 7,453 7,840 9,635 4,099 4,350 6,339 8, U of IL Urbana-Champaign... 6,881 7,385 8,872 9,320 4,332 4,765 5,512 5, U of Washington... 9,911 9,228 9,493 9,316 8,925 8,432 8,716 7, University of Georgia... 6,025 6,979 7,632 8,421 2,221 2,516 2,771 3, Rutgers the State U NJ... 7,153 8,155 7,758 8,420 3,087 3,440 3,262 3, U CA Berkeley... 7,449 7,080 7,218 8,244 4,500 4,696 4,459 4, University of Minnesota... 6,930 7,095 8,218 8,201 5,471 5,068 5,175 5, University of Miami... 5,276 5,914 6,893 7,749 5,055 5,829 6,725 7, University of New Mexico... 3,950 4,492 5,872 7,168 2,663 3,119 4,232 5,050 Total, 1st 20 institutions , , , ,046 95, , , , San Diego St University... 4,650 4,436 6,160 6,714 2,761 2,391 4,137 3, University of Connecticut... 5,189 5,488 7,876 6,608 2,545 2,406 4,219 3, Georgia State University... 7,412 7,604 7,182 6,586 3,030 2,694 3,204 3, Carnegie Mellon U... 6,382 6,300 5,880 6,460 4,134 4,026 4,095 4, Cornell University... 5,642 6,372 6,077 6,425 2,103 2,327 2,083 1, Arizona State University... 5,960 5,616 5,438 6,399 4,426 4,115 3,678 4, University of Florida... 3,472 4,478 5,122 6,320 2,289 3,127 3,591 4, Florida State University... 4,027 4,589 4,234 5,922 2,728 3,030 2,877 3, U CA Santa Barbara... 1,420 1,777 2,222 5,912 1,240 1,426 1,830 4, U of IL Chicago... 3,445 4,388 4,155 5,832 2,298 2,607 2,567 3,475 Total, 1st 30 institutions , , , , , , , , U CA San Diego... 3,552 5,012 5,364 5,831 2,480 3,491 4,370 4, U of Nebraska at Lincoln... 1,177 i 1,536 1,901 5, i , Ohio State University... 3,830 3,664 4,480 5,719 2,716 2,890 3,422 4, San Jose State University... 2,938e 2,938e 2,938e 5,714 2,698e 2,698e 2,698e 5, Oregon Health & Science U... 3,639 i 4,007 i 5,041 5,495 3,280 i 3,820 i 4,980 5, U of Alabama Birmingham... 5,403 5,117 6,233 5,495 4,989 4,423 5,763 5, Michigan State University... 2,205 2,526 3,698 5,401 1,256 1,645 2,514 3, U of MA Amherst... 4,135 4,071 4,788 5,360 3,009 2,932 3,449 3, U of Missouri Columbia... 3,474 4,235 4,515 5,274 2,426 2,964 2,863 3, U of Southern California... 3,483 3,987 3,965 5,013 3,140 3,705 3,394 3,895 Total, 1st 40 institutions , , , , , , , , Stanford University... 3,834 4,103 4,616 4,906 3,418 3,420 3,830 3, Boston University... 2,271 2,465 3,349 4,879 1,800 2,364 3,295 4, University of Pittsburgh... 4,293 4,455 4,546 4,791 4,037 4,172 3,865 4, Yale University... 3,089 3,625 4,162 4,720 2,401 2,450 2,698 3, Dartmouth College... 1,132 1,216 3,100 4, ,431 3, U of Rhode Island... 4,855 4,365 3,434 4,408 4,490 3,951 3,250 3, University of Oregon... 2,036 2,103 2,525 4,373 1,552 1,819 2,333 4, U TX at Austin... 3,072 2,798 3,423 4,336 2,584 2,227 2,980 3, U of NC Chapel Hill... 3,149 3,070 3,710 4,282 2,979 2,747 3,370 3, U of Iowa... 2,689 2,788 3,180 4,201 2,269 2,060 2,252 3,423 Total, 1st 50 institutions , , , , , , , ,
247 Table B-63. Total and federally financed R&D expenditures in psychology at universities and colleges, ranked by fiscal year 2001 total R&D expenditures in psychology: fiscal years Page 2 of 3 Total Federally financed Institution and ranking Georgia Institute of Tech... 2,920 3,457 4,358 4,128 1,280 1,480 1,806 1, Purdue University... 2,497 2,727 2,965 4,010 1,771 1,653 1,634 2, Harvard University... 3,854 4,548 4,387 3,964 3,422 3,953 4,059 3, Johns Hopkins U... 3,484 3,383 3,636 3,940 3,371 3,237 3,453 3, Princeton University... 5,978 5,246 5,259 3,892 5,086 4,080 3,743 2, U of MD at College Park... 1,530 1,913 3,233 3,873 1,156 1,536 2,394 2, Duke University... 4,472 4,276 3,645 3,862 4,031 3,836 3,089 3, U CA Irvine... 2,658 2,057 3,313 3,768 2,313 1,561 2,358 3, Vanderbilt University... 2,011 2,262 2,674 3,601 1,644 1,774 2,264 2, U of South Carolina... 3,231 3,925 4,013 3,596 2,470 2,933 2,890 2,416 Total, 1st 60 institutions , , , , , , , , U of Pennsylvania... 3,111 3,470 2,903 3,483 2,937 3,380 2,564 3, Columbia U in City of NY... 2,932 2,735 3,066 3,469 2,818 2,488 2,865 3, SUNY at Stony Brook... 2,705 3,024 4,057 3,464 2,077 2,196 2,394 2, University of Houston... 3,002 3,024 2,954 3,445 2,090 1,951 1,715 1, University of Arizona... 2,205 2, , , , SUNY at Buffalo... 5,590 5,391 4,990 3,360 4,223 3,954 3,514 1, Tufts University... 2,168 2,753 2,933 3,357 1,300 1,488 1,312 1, Virginia Commonwealth U... 2,864 1,928 2,081 3,096 1,007 1,129 1,417 2, Teachers Col, Columbia U... 2,145 2,250 2,992 3,085 1,490 1,504 2,471 2, Colorado State University... 3,916 3,252 2,679 3,004 3,044 2,764 2,530 2,839 Total, 1st 70 institutions , , , , , , , , University of Virginia... 3,115 2,984 2,775 3,001 2,657 2,679 2,550 2, University of Denver... 1,699 1,743 1,916 2,904 1,627 1,660 1,907 2, CUNY Hunter College... 1,913 1,644 2,143 2,899 1, ,578 2, Texas A&M University... 2,236 2,859 2,752 2,898 1,402 1,721 1,583 1, Northwestern University... 1,962 1,911 2,952 2,894 1,522 1,595 1,836 2, Wayne State University... 2,980 2,775 3,096 2,749 2,035 1,793 1,915 1, Brown University... 2,514 2,236 2,143 2,666 1,600 1,396 1,400 1, University of Chicago... 1,887 2,393 2,306 2,620 1,225 1,289 1,383 2, SUNY at Binghamton... 3,171 3,368 2,991 2,482 1,230 1,480 1,773 1, Texas Christian U... 2,225 2,794 2,043 2,397 2,221 2,790 2,037 2,382 Total, 1st 80 institutions , , , , , , , , University of Utah... 1,043 1,627 1,836 2, ,298 1,637 1, Washington University ,692 1,663 2, ,439 1,469 1, SUNY at Albany... 2,416 3,054 2,489 2,213 1,975 2,228 1,767 1, University of Louisville ,220 1,819 2, , , VA Polytech Inst & St U... 2,971 2,613 2,142 2,015 2,046 1,777 1,057 1, University of Alabama, The ,346 1, ,258 1, George Mason University... 1,954 2,165 1,903 1,871 1,787 1,877 1,766 1, U of Missouri St Louis... 2,000 1,514 1,549 1, Utah State University ,067 1, , CUNY Brooklyn College e 917 1,441 1, e 619 1,035 1,271 Total, 1st 90 institutions , , , , , , , ,
248 Table B-63. Total and federally financed R&D expenditures in psychology at universities and colleges, ranked by fiscal year 2001 total R&D expenditures in psychology: fiscal years Page 3 of 3 Total Federally financed Institution and ranking U CA Riverside... 2,364 1,986 1,867 1,742 2,209 1,985 1,652 1, University of Notre Dame ,355 1, ,084 1, Howard University , , Jackson State University , , Brandeis University... 1,483 1,372 1,712 1,621 1,272 1,301 1,641 1, Loyola U of Chicago ,227 1, ,142 1, Florida Atlantic U... 1,342 1,494 1,636 1,591 1,205 1,334 1,414 1, Northeastern University ,368 1,281 1, , , Northern Illinois U ,348 1, Ohio University , , Total, 1st 100 institutions , , , , , , , ,287 Total, all other sampled institutions... 70,629 66,601 77,736 74,450 40,968 39,882 49,609 48,816 KEY: e = estimated i = imputed NOTE: Because of rounding, detail may not add to totals. SOURCE: National Science Foundation/Division of Science Resources Statistics, Survey of Research and Development Expenditures at Universities and Colleges, Fiscal Year
249 Table B-64. R&D expenditures in the social sciences at universities and colleges, ranked by fiscal year 2001 R&D expenditures in the social sciences: fiscal years and by subfield for fiscal year 2001 Page 1 of , by subfield Institution and ranking Eco- Political Socinomics science ology Other Total, all institutions... 1,131,139 1,251,376 1,297,243 1,435, , , , ,178 1 University of Michigan... 48,299 56,723 56,840 75,406 10,733 6,504 12,753 45,416 2 U of MD at College Park... 41,544 58,148 54,827 61,208 6,936 12,443 8,310 33,519 3 U CA Berkeley... 35,559 38,531 41,708 44,406 13,691 10,638 6,129 13,948 4 U of WI-Madison... 28,827 28,154 31,083 35,284 9,958 3,216 9,676 12,434 5 U CA Los Angeles... 25,580 28,802 32,915 35, ,888 23,410 6 University of Georgia... 27,512 31,228 31,287 34,768 12,907 3,060 1,882 16,919 7 Indiana University... 15,629 21,829 29,271 34,401 2,837 14,215 6,684 10,665 8 U of Pennsylvania... 17,289 25,405 30,842 31,948 2,714 11,637 8,342 9,255 9 Harvard University... 39,501 33,073 31,473 31,132 8,345 18,649 1,018 3, Ohio State University... 18,786 21,809 20,035 30,546 3,630 2,517 2,957 21,442 Total, 1st 10 institutions , , , ,234 72,709 83,758 67, , Rutgers the State U NJ... 17,698 20,219 22,708 27,826 1,173 8,604 7,193 10, U of NC Chapel Hill... 24,649 22,556 22,325 25, ,827 14, U of IL Urbana-Champaign... 19,426 21,908 24,868 23,922 8,940 2,444 5,184 7, Michigan State University... 15,681 18,731 19,130 21,461 8,752 3,059 1,613 8, Brandeis University... 17,329 21,682 19,575 21, ,435 2, Pennsylvania State U... 44,048 45,289 16,529 19,577 2,103 2,220 14, Princeton University... 13,156 14,709 16,544 19,003 2,765 14, Florida State University... 6,097 9,213 13,065 18, ,909 7,654 7, Purdue University... 15,046 17,707 18,050 18,864 6, ,843 9, University of Arizona... 13,208 14,184 15,044 16,149 5, ,012 2,366 Total, 1st 20 institutions , , , , , , , , Duke University... 10,407 11,580 14,656 14,794 1,819 4,102 6,074 2, University of Minnesota... 14,113 14,008 14,567 14,792 8,043 2,286 1,458 3, Cornell University... 11,066 12,750 12,963 14,737 4, ,670 8, Iowa State University... 12,943 15,369 15,842 14,125 4, , U of Missouri Columbia... 10,719 11,424 12,393 14,072 6,933 2,787 1,784 2, U TX at Austin... 7,195 9,295 9,617 13, ,285 10, U CA Davis... 3,276 3,106 3,649 13,247 5,946 2, , U of South Carolina... 7,679 9,442 9,540 12, , , University of Florida... 8,682 10,217 9,525 11,975 7, , U of IL Chicago... 5,080 8,321 9,439 10, ,629 6,971 Total, 1st 30 institutions , , , , , , , , U CA San Diego... 9,302 10,084 9,668 10, ,950 4,965 3, University of Pittsburgh... 4,142 6,166 7,750 10, , Washington State U... 9,834 9,259 9,450 10,535 5, , U CA Santa Barbara... 7,451 8,037 8,974 10, , Georgia State University... 8,868 15,192 14,748 10,186 8, , Arizona State University... 8,564 9,248 9,591 10,114 2,379 1, , VA Polytech Inst & St U... 5,273 5,271 7,419 10, , , University of Oklahoma... 10,061 8,970 9,896 10,020 1,182 1, , U of Washington... 11,805 15,415 8,029 10, , , Johns Hopkins U... 3,688 7,760 10,588 9, ,114 5,274 Total, 1st 40 institutions , , , , , , , , U of Nebraska at Lincoln... 5,041 i 10,380 10,505 9,662 3, ,831 3, Northwestern University... 5,993 6,569 8,260 9, , University of Colorado... 3,375 5,921 7,176 9, ,378 3, NC State University... 4,866 5,504 6,918 8,968 4, ,633 1, Stanford University... 5,715 6,603 6,363 8, , Carnegie Mellon U... 8,416 9,101 9,193 8,827 1,909 4, , Clemson University... 4,014 3,906 4,518 8,718 2,771 1,123 1,101 3, Oklahoma State University... 5,205 8,861 7,796 8,630 4, , Portland State University... 4,996 7,069 9,095 8, , U CA Irvine... 4,457 5,766 5,494 8, , ,156 Total, 1st 50 institutions , , , , , , , ,
250 Table B-64. R&D expenditures in the social sciences at universities and colleges, ranked by fiscal year 2001 R&D expenditures in the social sciences: fiscal years and by subfield for fiscal year 2001 Page 2 of , by subfield Institution and ranking Eco- Political Socinomics science ology Other 51 SUNY at Albany... 6,882 7,542 7,389 8, ,356 3,504 2, University of Connecticut... 7,772 6,409 8,552 8,382 1, ,583 4, Florida International U... 2,758 5,770 3,864 8, , George Mason University... 6,312 6,907 7,219 7,977 1,052 6, U of Southern California... 6,404 6,437 7,640 7, ,687 2,529 2, Texas A&M University... 19,593 16,784 7,227 7,543 1,947 1,900 1,319 2, Louisiana State U System... 8,223 9,325 8,331 7,443 2, ,234 2, U of Iowa... 7,851 7,854 7,970 7, ,606 1,676 3, U of MA Boston... 6,311 6,776 6,664 7, , New York University... 5,798 5,979 5,566 7,022 1,002 3,540 1,030 1,450 Total, 1st 60 institutions , , ,163 1,031, , , , , George Washington U... 7,303 6,461 8,827 6, ,860 2, Vanderbilt University... 4,379 4,118 5,291 6, , Tufts University... 5,697 4,096 5,606 6, , University of New Mexico... 5,446 6,671 6,574 6, , MA Institute of Tech... 11,627 8,908 8,293 6,152 1,868 2, , Cleveland State U... 5,425e 5,939 i 4,775 5, , U of Central Florida... 4,641 3,813 5,204 5, ,446 4, U CA Riverside... 2,122 2,567 3,337 5, , U of Tennessee System... 4,720 4,920 5,221 5,834 4, U of New Hampshire... 4,381 4,629 4,781 5, ,886 2,505 Total, 1st 70 institutions , , ,072 1,091, , , , , University of Kansas... 3,776 3,426 5,711 5, ,668 3, Columbia U in City of NY... 5,882 4,899 5,413 5, , Naval Postgrad School... 4,647 i 4,647 i 5,108 i 5,561 i 1,701 i 1,090 i 2,475 i 295 i 74 Univ of Memphis, The... 4,138 5,034 4,748 5,551 3, , North Dakota State U... 1,113 3,558 4,769 5,549 1, , Georgia Institute of Tech... 2,595 3,026 4,594 5,512 2, , Syracuse University... 2,613 2,796 4,383 5, , , U of WI-Milwaukee... 5,075 5,885 5,042 5, , University of Akron ,962 3,721 5, , Wayne State University... 6,373 5,276 5,358 5,375 1, , Total, 1st 80 institutions , ,908 1,008,919 1,147, , , , , San Diego St University... 3,736 2,728 5,893 5, ,304 2, SUNY at Buffalo... 5,710 5,317 6,301 5, ,480 3, New School University... 3,287 4,363 4,447 5, , Teachers Col, Columbia U... 3,910 4,235 4,492 5,004 1, , Case Western Reserve U... 4,708 5,060 5,773 4, ,802 2, Mississippi State U... 3,506 3,829 4,349 4, , Brown University... 4,894 4,724 4,613 4,912 1, , University of Delaware... 4,749 4,961 4,918 4, , Washington University... 2,545 2,877 4,217 4, , Univ of Hawaii at Manoa... 4,002 3,409 3,611 4, ,268 Total, 1st 90 institutions ,452 1,035,411 1,057,533 1,196, , , , ,
251 Table B-64. R&D expenditures in the social sciences at universities and colleges, ranked by fiscal year 2001 R&D expenditures in the social sciences: fiscal years and by subfield for fiscal year 2001 Page 3 of , by subfield Institution and ranking Eco- Political Socinomics science ology Other 91 Emory University ,073 3,292 4,373 2, , Boston College... 2,111 2,637 4,204 4,266 2, , Univ of Montana, The... 1,386 1,980 2,586 4,242 2, , U of South Florida... 2,134 2,456 3,090 4, ,001 2, Tulane University ,777 2,097 3, , University of Louisville... 2,353 2,790 2,724 3,945 1, , University of Denver... 2,059 2, , , U TX at San Antonio... 2,272 2,841 3,348 3, , SUNY at Stony Brook... 2,320 2,463 3,159 3, , University of Kentucky... 3,371 3,222 3,174 3, ,769 1,219 Total, 1st 100 institutions ,136 1,058,868 1,085,638 1,236, , , , ,400 Total, all other sampled institutions , , , ,537 36,843 29,036 54,880 78,778 KEY: e = estimated i = imputed NOTE: Because of rounding, detail may not add to totals. SOURCE: National Science Foundation/Division of Science Resources Statistics, Survey of Research and Development Expenditures at Universities and Colleges, Fiscal Year
252 Table B-65. Federally financed R&D expenditures in the social sciences at universities and colleges, ranked by fiscal year 2001 federally financed R&D expenditures in the social sciences: fiscal years and by subfield for fiscal year 2001 Page 1 of , by subfield Institution and ranking Eco- Political Socinomics science ology Other Total, all institutions , , , ,467 89,941 71, , ,393 1 University of Michigan... 26,179 37,293 42,739 53,209 8,300 5,093 8,055 31,761 2 U of MD at College Park... 26,692 35,385 30,484 33,164 4,106 3,796 2,977 22,285 3 U of NC Chapel Hill... 17,005 15,750 14,633 18, ,272 8,725 4 U of WI-Madison... 12,377 12,995 14,113 15,094 5, ,275 5,691 5 Ohio State University... 9,265 12,504 7,992 14,489 1,482 1, ,834 6 Harvard University... 21,225 13,426 14,119 13,050 4,045 6, ,513 7 Duke University... 6,831 7,563 10,924 11,045 1,151 2,426 5,489 1,979 8 Michigan State University... 7,457 9,516 9,070 9,979 5, ,878 9 U of Pennsylvania... 5,971 5,942 8,585 8,997 1,238 2,122 3,249 2, University of Arizona... 4,955 5,841 5,979 7,509 2, , Total, 1st 10 institutions , , , ,605 33,179 22,122 39,537 89, Iowa State University... 6,961 8,754 9,414 7,415 1, , University of Colorado... 2,403 4,178 5,432 7, ,253 2, Carnegie Mellon U... 5,698 6,464 6,750 6,779 1,209 3, , U TX at Austin... 2,088 2,273 4,416 6, ,218 4, Florida State University... 2,143 2,711 5,143 6, ,024 2, Johns Hopkins U... 1,924 5,355 8,019 6, ,123 3, Pennsylvania State U... 11,806 12,362 5,221 6, , Brandeis University... 7,475 9,587 5,585 5, , Indiana University... 4,710 4,919 4,821 5, ,465 3, Portland State University... 3,558 5,388 6,451 5, ,618 Total, 1st 20 institutions , , , ,666 37,684 28,153 72, , U CA Berkeley... 4,123 5,430 5,613 5,706 2,194 1,000 1,101 1, U CA Santa Barbara... 3,491 4,121 4,984 5, , Naval Postgrad School... 4,564 i 4,564 i 5,000 i 5,497 i 1,701 i 1,033 i 2,468 i 295 i 24 University of Pittsburgh... 2,637 4,340 4,800 5, , George Mason University... 3,852 3,763 3,791 4, , Florida International U... 2, ,264 4, , Vanderbilt University... 3,247 3,165 3,879 4, , U CA Los Angeles... 2,753 3,119 2,796 4, ,641 2, U of Missouri Columbia... 3,718 3,693 4,703 4,324 1,955 1, Columbia U in City of NY... 4,648 3,747 3,216 4, ,723 0 Total, 1st 30 institutions , , , ,457 44,341 40,906 82, , SUNY at Albany... 3,502 4,156 4,239 4, ,652 2, Rutgers the State U NJ... 5,011 4,294 4,687 4, ,399 2, U of IL Urbana-Champaign... 4,057 3,688 3,858 4,127 1, , U of South Carolina... 2,398 2,359 2,779 4, , Cornell University... 2,849 4,107 3,858 3,894 1, , U CA San Diego... 4,759 4,630 4,327 3, , New York University... 1,738 3,334 2,013 3, , Washington University... 2,092 2,232 2,904 3, , University of Delaware... 2,890 2,312 2,567 3, , Purdue University... 2,647 2,730 2,993 3,439 2, Total, 1st 40 institutions , , , ,796 50,787 45,167 97, , Syracuse University... 1,994 2,120 1,749 3, , , Northwestern University... 2,699 1,915 2,725 3, , North Dakota State U ,286 3,105 3, , Tulane University ,306 1,656 3, , Univ of Hawaii at Manoa... 1,081 1,186 1,700 3, , University of Minnesota... 2,117 2,127 2,891 3,031 1, U of Southern California... 3,042 2,927 3,009 2, , Clemson University... 1,255 1,064 1,231 2, , University of Chicago... 2,296 3,443 2,117 2, , U CA Irvine... 1,648 2,158 1,746 2, , Total, 1st 50 institutions , , , ,042 54,210 54, , ,
253 Table B-65. Federally financed R&D expenditures in the social sciences at universities and colleges, ranked by fiscal year 2001 federally financed R&D expenditures in the social sciences: fiscal years and by subfield for fiscal year 2001 Page 2 of , by subfield Institution and ranking Eco- Political Socinomics science ology Other 51 University of Denver... 2,012 2, , , Univ of Montana, The ,821 2,742 1, , Princeton University... 2,446 2,560 3,545 2, , Boston College ,041 2,729 1, Univ of Memphis, The ,524 2,708 1, U of Central Florida... 1,499 1,326 1,321 2, ,058 1, U of IL Chicago... 1,350 1,368 2,503 2, , U of WI-Milwaukee... 1,905 2,165 2,025 2, , University of Georgia... 2,123 1,873 2,658 2, , Georgetown University... 1,837 2,372 2,440 2, , Total, 1st 60 institutions , , , ,095 60,886 56, , , U of New Hampshire... 1,777 1,614 1,933 2, , University of Oklahoma... 3,571 2,175 2,354 2, , U of LA at Monroe, The... 1,190 2,353 2,353e 2,588 i 1,977 i 0 i 611 i 0 i 64 Georgia Institute of Tech... 1,137 1,295 1,905 2,587 1, U CA Davis ,539 1, University of Miami... 3,511 3,389 3,051 2, , Stanford University ,638 1,623 2, , Mississippi State U... 1,858 1,818 1,357 2, , Washington State U... 3,153 2,981 2,461 2,425 1, University of Akron ,198 2,113 2, , Total, 1st 70 institutions , , , ,251 67,848 58, , , George Washington U... 1,600 1,498 2,403 2, , NC State University ,275 2, Oklahoma State University... 1,508 2,840 1,965 2, , Case Western Reserve U... 1,175 1,511 2,031 2, , SUNY at Buffalo ,238 1,826 2, , University of Connecticut... 1,903 1, , University of New Mexico... 1,890 2,498 2,382 1, University of Kansas ,983 1, , U Mississippi, All Camp ,861 1, MA Institute of Tech... 5,922 2,328 1,954 1, Total, 1st 80 institutions , , , ,381 72,608 60, , , Arizona State University... 1,351 1,472 1,847 1, , U TX at Arlington , , Utah State University... 1, , , University of Florida... 1,674 1,978 1,197 1, Georgia State University... 2,777 6,579 2,806 1, Colorado State University ,140 1,558 1, , U of Iowa... 2,299 2,146 1,991 1, Teachers Col, Columbia U... 1,213 1,992 2,224 1, U of Washington... 6,317 8,236 1,222 1, U of Nebraska at Lincoln... 1,497 i 3,311 3,324 1, Total, 1st 90 institutions , , , ,635 76,222 61, , ,
254 Table B-65. Federally financed R&D expenditures in the social sciences at universities and colleges, ranked by fiscal year 2001 federally financed R&D expenditures in the social sciences: fiscal years and by subfield for fiscal year 2001 Page 3 of , by subfield Institution and ranking Eco- Political Socinomics science ology Other 91 Boston University ,118 1,231 1, U CA Riverside , , University of Cincinnati... 1,440 1,336 1,675 1, , Gallaudet University... 1,281 1,339 1,333 1, Tuskegee University... 1,110 1,197 1,154 1, , Texas A&M University... 4,833 3,880 1,685 1, Louisiana State U System... 1,148 1,523 1,753 1, Wayne State University... 1, , U of MD Baltimore County ,528 1,433 1, U TX at San Antonio... 1,270 1,395 1,306 1, ,280 Total, 1st 100 institutions , , , ,362 78,150 62, , ,423 Total, all other sampled institutions... 70,715 69,535 84,730 72,105 11,791 9,114 21,230 29,970 KEY: e = estimated i = imputed NOTE: Because of rounding, detail may not add to totals. SOURCE: National Science Foundation/Division of Science Resources Statistics, Survey of Research and Development Expenditures at Universities and Colleges, Fiscal Year
255 Table B-66. Current fund expenditures for research equipment at universities and colleges, by science and engineering field and source of funds: fiscal years 1994, 2000, and 2001 Field Total Federal Non-Federal Total... 1,106,784 1,420,700 1,490, , , , , , ,068 Engineering , , , , , ,973 98, , ,718 Aeronautical and astronautical... 18,874 20,280 23,811 14,518 12,990 17,069 4,356 7,290 6,742 Bioengineering/biomedical ,569 14, ,864 7, ,705 7,877 Chemical... 18,774 26,057 30,934 10,882 13,629 15,988 7,892 12,428 14,946 Civil... 18,798 28,520 32,200 8,376 10,056 12,634 10,422 18,464 19,566 Electrical... 65,705 71,560 79,164 43,912 44,173 46,485 21,793 27,387 32,679 Mechanical... 37,467 54,767 48,790 24,637 35,573 28,962 12,830 19,194 19,828 Metallurgical and materials... 24,947 30,125 49,090 12,117 18,354 22,201 12,830 11,771 26,889 Other, n.e.c ,024 61,186 54,719 37,495 28,315 28,528 28,529 32,871 26,191 All sciences ,195 1,114,636 1,156, , , , , , ,350 Physical sciences , , , , , ,829 56,346 74,469 79,125 Astronomy... 20,083 24,661 14,563 12,832 20,617 12,169 7,251 4,044 2,394 Chemistry... 78, ,766 99,956 53,429 63,201 57,733 24,614 39,565 42,223 Physics... 89, , ,674 70,767 84,202 81,191 18,805 25,347 31,483 Other, n.e.c ,420 12,412 12,761 13,744 6,899 9,736 5,676 5,513 3,025 Environmental sciences... 83, ,236 88,713 60,822 64,399 54,992 22,585 35,837 33,721 Atmospheric... 11,589 12,651 13,248 9,462 10,161 10,098 2,127 2,490 3,150 Earth sciences... 29,858 37,191 29,353 19,969 18,904 16,256 9,889 18,287 13,097 Oceanography... 27,140 33,851 34,797 21,794 25,233 22,209 5,346 8,618 12,588 Other, n.e.c ,820 16,543 11,315 9,597 10,101 6,429 5,223 6,442 4,886 Mathematical sciences... 14,911 10,073 11,799 10,960 6,807 6,223 3,951 3,266 5,576 Computer sciences... 59,059 56,410 65,129 40,703 34,204 41,916 18,356 22,206 23,213 Life sciences , , , , , , , , ,824 Agricultural sciences... 67,857 76,470 81,149 23,928 21,215 22,494 43,929 55,255 58,655 Biological sciences , , , , , ,834 68, , ,618 Medical sciences , , ,213 89, , ,868 83, , ,345 Other, n.e.c ,024 21,127 20,204 7,475 9,331 9,998 10,549 11,796 10,206 Psychology... 12,582 14,230 14,122 7,541 9,150 9,023 5,041 5,080 5,099 Social sciences... 21,351 19,420 16,946 8,871 6,449 6,469 12,480 12,971 10,477 Economics... 5,504 3,119 2,370 2,393 1, ,111 1,411 1,400 Political science... 2,945 1,673 2,008 1, ,503 1,021 1,224 Sociology... 3,802 3,317 3,072 1,750 1,530 1,171 2,052 1,787 1,901 Other, n.e.c.... 9,100 11,311 9,496 3,286 2,559 3,544 5,814 8,752 5,952 Other sciences, n.e.c ,363 50,831 55,045 10,654 13,026 21,730 12,709 37,805 33,315 KEY: -- = not available n.e.c. = not elsewhere classified NOTE: Because of rounding, detail may not add to totals. SOURCE: National Science Foundation/Division of Science Resources Statistics, Survey of Research and Development Expenditures at Universities and Colleges, Fiscal Year
256 Table B-67. Current fund expenditures for research equipment at doctorate-granting institutions, by science and engineering field and source of funds: fiscal years 1994, 2000, and 2001 Field Total Federal Non-Federal Total... 1,074,649 1,380,835 1,450, , , , , , ,471 Engineering , , , , , ,031 96, , ,354 Aeronautical and astronautical... 18,423 19,943 22,687 14,099 12,680 15,965 4,324 7,263 6,722 Bioengineering/biomedical ,404 14, ,785 7, ,619 7,704 Chemical... 18,643 25,738 30,538 10,779 13,571 15,877 7,864 12,167 14,661 Civil... 18,088 27,637 31,643 8,014 9,978 12,534 10,074 17,659 19,109 Electrical... 64,564 70,443 78,180 43,208 43,895 46,240 21,356 26,548 31,940 Mechanical... 36,893 52,676 47,200 24,271 34,882 28,135 12,622 17,794 19,065 Metallurgical and materials... 24,855 30,000 48,974 12,075 18,254 22,123 12,780 11,746 26,851 Other, n.e.c ,913 59,075 53,360 36,913 27,994 28,058 27,000 31,081 25,302 All sciences ,270 1,081,919 1,123, , , , , , ,117 Physical sciences , , , , , ,277 52,880 70,375 75,491 Astronomy... 19,938 24,415 14,301 12,733 20,423 12,071 7,205 3,992 2,230 Chemistry... 72,063 96,245 93,588 49,497 59,432 53,737 22,566 36,813 39,851 Physics... 86, , ,223 68,497 81,648 78,764 17,561 24,189 30,459 Other, n.e.c ,187 12,194 12,656 13,639 6,813 9,705 5,548 5,381 2,951 Environmental sciences... 79,757 95,726 84,591 58,582 62,248 52,540 21,175 33,478 32,051 Atmospheric... 11,445 12,395 12,689 9,445 10,023 9,548 2,000 2,372 3,141 Earth sciences... 28,271 35,593 27,288 19,215 18,458 15,144 9,056 17,135 12,144 Oceanography... 25,871 31,664 33,676 20,739 23,872 21,478 5,132 7,792 12,198 Other, n.e.c ,170 16,074 10,938 9,183 9,895 6,370 4,987 6,179 4,568 Mathematical sciences... 13,844 9,435 11,349 10,292 6,395 6,028 3,552 3,040 5,321 Computer sciences... 57,859 53,211 62,263 39,966 32,165 39,825 17,893 21,046 22,438 Life sciences , , , , , , , , ,640 Agricultural sciences... 65,441 73,761 77,545 21,733 19,544 19,515 43,708 54,217 58,030 Biological sciences , , , , , ,316 66, , ,836 Medical sciences , , ,574 89, , ,911 83, , ,663 Other, n.e.c ,913 20,615 19,862 7,437 8,935 9,751 10,476 11,680 10,111 Psychology... 12,058 13,477 13,483 7,196 8,726 8,611 4,862 4,751 4,872 Social sciences... 20,246 18,764 16,140 8,015 6,216 6,162 12,231 12,548 9,978 Economics... 5,037 2,893 2,168 1,991 1, ,046 1,251 1,276 Political science... 2,850 1,648 1,960 1, ,477 1,002 1,193 Sociology... 3,563 3,122 2,898 1,609 1,467 1,136 1,954 1,655 1,762 Other, n.e.c.... 8,796 11,101 9,114 3,042 2,461 3,367 5,754 8,640 5,747 Other sciences, n.e.c ,902 49,745 53,484 9,692 12,525 21,158 12,210 37,220 32,326 KEY: -- = not available n.e.c. = not elsewhere classified NOTE: Because of rounding, detail may not add to totals. SOURCE: National Science Foundation/Division of Science Resources Statistics, Survey of Research and Development Expenditures at Universities and Colleges, Fiscal Year
257 Table B-68. Current fund expenditures for research equipment at universities and colleges, by science and engineering field, source of funds, and type of control: fiscal year 2001 Field Total Federal Non-Federal Total Public Private Total Public Private Total Public Private Total... 1,490,417 1,036, , , , , , , ,829 Engineering , ,774 85, , ,666 59, , ,108 26,610 Aeronautical and astronautical... 23,811 17,565 6,246 17,069 12,953 4,116 6,742 4,612 2,130 Bioengineering/biomedical... 14,983 10,848 4,135 7,106 4,565 2,541 7,877 6,283 1,594 Chemical... 30,934 22,821 8,113 15,988 11,334 4,654 14,946 11,487 3,459 Civil... 32,200 28,490 3,710 12,634 10,386 2,248 19,566 18,104 1,462 Electrical... 79,164 59,849 19,315 46,485 32,461 14,024 32,679 27,388 5,291 Mechanical... 48,790 31,588 17,202 28,962 16,474 12,488 19,828 15,114 4,714 Metallurgical and materials... 49,090 38,783 10,307 22,201 14,499 7,702 26,889 24,284 2,605 Other, n.e.c ,719 37,830 16,889 28,528 16,994 11,534 26,191 20,836 5,355 All sciences... 1,156, , , , , , , , ,219 Physical sciences , ,829 80, ,829 94,437 66,392 79,125 65,392 13,733 Astronomy... 14,563 7,705 6,858 12,169 5,668 6,501 2,394 2, Chemistry... 99,956 73,105 26,851 57,733 39,019 18,714 42,223 34,086 8,137 Physics ,674 73,301 39,373 81,191 45,990 35,201 31,483 27,311 4,172 Other, n.e.c ,761 5,718 7,043 9,736 3,760 5,976 3,025 1,958 1,067 Environmental sciences... 88,713 72,356 16,357 54,992 41,770 13,222 33,721 30,586 3,135 Atmospheric... 13,248 11,269 1,979 10,098 8,227 1,871 3,150 3, Earth sciences... 29,353 23,283 6,070 16,256 11,971 4,285 13,097 11,312 1,785 Oceanography... 34,797 29,985 4,812 22,209 17,744 4,465 12,588 12, Other, n.e.c ,315 7,819 3,496 6,429 3,828 2,601 4,886 3, Mathematical sciences... 11,799 8,171 3,628 6,223 3,228 2,995 5,576 4, Computer sciences... 65,129 40,915 24,214 41,916 22,864 19,052 23,213 18,051 5,162 Life sciences , , , , , , , ,713 72,111 Agricultural sciences... 81,149 78,330 2,819 22,494 21,367 1,127 58,655 56,963 1,692 Biological sciences , , , ,834 95,970 69, ,618 82,706 33,912 Medical sciences , ,069 98, ,868 81,737 63, , ,332 35,013 Other, n.e.c ,204 13,065 7,139 9,998 4,353 5,645 10,206 8,712 1,494 Psychology... 14,122 9,318 4,804 9,023 5,194 3,829 5,099 4, Social sciences... 16,946 14,703 2,243 6,469 5,335 1,134 10,477 9,368 1,109 Economics... 2,370 1, ,400 1, Political science... 2,008 1, , Sociology... 3,072 2, , ,901 1, Other, n.e.c.... 9,496 8, ,544 2, ,952 5, Other sciences, n.e.c ,045 30,181 24,864 21,730 19,227 2,503 33,315 10,954 22,361 KEY: n.e.c. = not elsewhere classified NOTE: Because of rounding, detail may not add to totals. SOURCE: National Science Foundation/Division of Science Resources Statistics, Survey of Research and Development Expenditures at Universities and Colleges, Fiscal Year
258 Table B-69. Total and federally financed current fund expenditures for research equipment at universities and colleges, ranked by fiscal year 2001 total current fund expenditures for research equipment: fiscal years Page 1 of 3 Total Federally financed Institution and ranking Total, all institutions... 1,293,942 1,317,700 1,420,700 1,490, , , , ,349 1 Johns Hopkins U ,117 35,278 40,204 39,332 20,195 16,231 15,391 16,542 2 MA Institute of Tech... 31,276 26,250 37,195 35,776 22,214 20,601 30,256 25,295 3 U of WI-Madison... 23,212 23,859 33,102 30,338 12,914 12,938 18,010 16,381 4 Georgia Institute of Tech... 22,388 24,331 26,819 25,493 9,815 10,414 11,111 11,962 5 Baylor Col of Medicine... 4,465 13,248 20,939 25,079 2,442 6,780 13,657 9,846 6 U of Washington... 22,543 36,663 28,166 25,053 14,997 22,514 22,332 19,615 7 U of IL Urbana-Champaign... 25,576 27,524 25,609 24,678 19,518 22,903 19,129 16,614 8 Ohio State University... 15,930 16,971 21,601 22,754 3,955 4,304 4,218 6,149 9 University of Georgia... 17,187 18,292 25,887 22,731 3,132 2,442 2,982 3, Stanford University... 26,271 25,401 20,775 22,197 23,290 21,920 17,220 19,046 Total, 1st 10 institutions , , , , , , , , University of New Mexico... 13,019 6,475 13,869 20,123 10,548 4,292 10,617 17, Pennsylvania State U... 15,829 16,476 18,799 19,500 5,803 8,334 9,128 9, U CA Davis... 13,778 14,571 14,346 18,784 7,338 7,471 6,123 8, U PR Mayaguez Campus... 3,069 3,158 4,167 18,627 1,923 1,613 1,598 1, Cornell University... 25,050 27,301 24,166 18,297 14,371 14,554 12,589 12, U of Central Florida... 1,580 3,430 3,318 18, , , Washington University... 13,365 17,863 19,804 18,224 9,525 14,955 16,983 14, University of Arizona... 14,447 14,566 16,722 17,692 10,197 10,068 10,756 12, University of Florida... 12,756 26,494 12,994 17,592 5,222 16,226 5,401 5, Louisiana State U System... 13,298 16,230 13,525 17,054 2,693 3,797 5,481 4,239 Total, 1st 20 institutions , , , , , , , , University of Kentucky... 6,047 7,062 19,486 15,816 3,819 3,827 3,584 4, University of Michigan... 14,354 17,565 18,247 15,591 9,767 11,511 11,498 10, U TX at Austin... 11,448 14,813 15,558 15,146 8,423 8,593 8,494 7, University of Minnesota... 13,827 14,014 16,727 14,823 8,784 8,498 9,232 8, U CA Los Angeles... 12,731 15,013 14,335 14,659 7,114 8,174 8,417 6, University of Rochester... 15,396 14,523 17,317 14,552 13,363 12,717 15,615 12, Purdue University... 14,171 16,527 14,239 13,887 8,321 9,789 7,406 6, Indiana University... 8,486 7,712 8,825 13,753 3,217 3,836 4,207 4, U CA San Diego... 13,923 15,648 13,870 13,323 8,114 7,710 8,624 7, Yale University... 7,817 9,774 10,655 12,980 6,941 8,610 8,577 10,947 Total, 1st 30 institutions , , , , , , , , Columbia U in City of NY... 16,866 14,172 10,060 12,929 12,618 12,463 8,549 11, Carnegie Mellon U... 10,241 8,215 8,748 12,875 6,926 5,892 4,485 9, Texas A&M University... 18,513 22,401 18,340 12,630 6,932 11,111 8,865 3, Michigan State University... 9,744 7,930 11,489 12,475 5,357 4,534 6,805 6, U CA San Francisco... 9,740 9,131 12,088 12,434 5,575 4,489 6,604 6, NC State University... 19,152 12,802 9,834 12,194 7,089 5,247 4,519 3, U of IL Chicago... 8,334 8,421 8,482 11,894 3,750 3,096 3,770 5, University of Chicago... 13,037 12,704 11,695 11,589 11,015 11,628 10,344 9, Naval Postgrad School... 10,418 i 10,418 i 10,418 i 11,539 i 10,316 i 10,316 i 10,316 i 11,347 i 40 U TX MD Anderson Cncr Ctr.. 1,888 5,710 8,419 11, ,718 1,348 Total, 1st 40 institutions , , , , , , , , U of Southern California... 9,667 8,148 8,856 11,232 6,061 5,590 6,273 9, U of MD at College Park... 13,045 12,226 7,890 10,993 9,078 8,965 5,011 8, U of Alaska Fairbanks... 6,101 i 6,786 4,938 10,939 3,572 i 1,845 1,343 2, U of South Florida... 7,226 8,201 12,333 10,783 3,682 2,285 3,566 3, University of Colorado... 10,747 6,853 9,852 10,531 9,186 5,886 9,077 9, Wayne State University... 5,706 6,851 5,714 10,500 1,628 1,756 1,961 1, U CA Berkeley... 8,950 9,854 12,730 10,424 5,780 6,295 7,670 6, Rutgers the State U NJ... 9,248 9,544 9,371 10,381 3,267 3,880 4,572 3, U TX SW Med Ctr at Dallas... 6,659 7,282 7,911 10,268 2,825 3,150 3,094 3, University of Utah... 6,900 9,240 10,281 10,004 5,856 6,319 6,909 5,038 Total, 1st 50 institutions , , , , , , , ,
259 Table B-69. Total and federally financed current fund expenditures for research equipment at universities and colleges, ranked by fiscal year 2001 total current fund expenditures for research equipment: fiscal years Page 2 of 3 Total Federally financed Institution and ranking Harvard University... 12,057 11,533 11,712 9,957 10,186 9,418 9,552 8, U of Iowa... 9,568 8,237 8,147 9,862 4,714 4,562 4,916 5, U of Pennsylvania... 10,699 11,617 12,065 9,747 8,820 8,597 9,708 7, SUNY at Stony Brook... 7,106 5,697 8,392 9,349 4,946 3,664 3,255 4, Florida State University... 7,012 7,736 6,559 9,255 5,272 5,751 4,807 3, Northwestern University... 9,850 6,875 10,306 9,244 5,074 4,321 6,262 5, Univ of Hawaii at Manoa... 8,733 10,920 7,160 9,005 5,858 6,673 4,869 6, California Inst of Tech... 29,467 27,234 27,093 8,923 28,136 20,788 16,057 8, New York University... 6,045 5,898 6,740 8,671 4,109 3,256 3,637 5, University of Miami... 8,574 8,801 8,064 8,637 6,573 6,565 5,927 5,944 Total, 1st 60 institutions , , , , , , , , Emory University... 5,744 5,124 7,817 8,497 2,950 2,875 4,327 4, VA Polytech Inst & St U... 6,724 7,609 8,429 8,457 2,688 3,218 2,208 1, University of Oklahoma... 6,222 8,041 10,189 8,283 2,748 2,879 4,436 3, University of Pittsburgh... 4,415 5,582 8,076 8,162 3,453 4,052 6,006 6, Case Western Reserve U... 8,625 8,524 6,074 8,037 4,325 5,381 3,382 5, U of Alabama Birmingham... 12,156 6,934 8,017 8,008 9,581 3,603 4,779 6, Mississippi State U... 5,833 5,680 3,650 7,837 3,559 4,777 2,594 5, Princeton University... 8,963 8,020 6,378 7,767 7,465 7,130 4,797 6, Arizona State University... 5,791 7,025 6,176 7,740 2,893 2,990 2,092 3, U TX Hlth Sci Ctr San Ant... 3,002 2,901 4,098 7,534 1,860 1,236 2,238 3,273 Total, 1st 70 institutions , , ,857 1,003, , , , , University of Notre Dame... 5,394 4,050 4,753 7,386 2,932 2,108 3,592 3, Yeshiva University... 4,350 7,836 5,998 7,331 3,530 2,891 2,702 5, University of Delaware... 6,529 6,330 4,624 7,245 2,346 2,798 2,414 3, U Mississippi, All Camp... 2,378 1,207 5,484 7,141 1, ,301 5, Duke University... 13,602 11,385 6,987 7,039 8,307 7,441 5,016 5, Kansas State University... 6,819 8,846 8,479 6,857 3,674 3,683 3,763 3, U CA Irvine... 5,716 6,643 7,487 6,830 2,900 4,051 4,702 4, U of South Carolina... 3,659 6,404 6,749 6,821 3,045 3,845 4,837 3, U of MA Amherst... 6,704 5,915 6,207 6,747 4,154 3,403 4,223 3, University of Connecticut... 6,331 5,063 6,858 6,673 1,191 1,734 2,081 3,748 Total, 1st 80 institutions , ,588 1,009,483 1,073, , , , , U of Arkansas Main... 4,112 3,281 5,927 6,503 1,548 1,064 2,107 2, Brown University... 3,772 2,787 3,940 6,302 2,675 2,397 2,941 4, U of NC Chapel Hill... 8,341 5,105 5,372 6,299 3,966 2,422 3,537 3, U of Nebraska at Lincoln... 6,547e 3,584 3,639 6,272 2,339e , University of Virginia... 7,049 7,201 6,440 6,198 5,194 6,061 4,934 5, SUNY at Albany... 1,454 2,808 5,776 6, ,368 2,391 2, Rockefeller U, The... 3,965 3,444 3,338 6,080 1,381 1,376 1,359 3, Clemson University... 7,597 6,051 5,084 6,051 2,760 1,479 1,830 2, U Med & Dent of NJ... 2,594 1,898 3,066 5,935 1, ,683 3, U of New Hampshire... 3,784 5,553 6,778 5,914 2,563 4,428 4,324 3,861 Total, 1st 90 institutions , ,300 1,058,843 1,134, , , , ,
260 Table B-69. Total and federally financed current fund expenditures for research equipment at universities and colleges, ranked by fiscal year 2001 total current fund expenditures for research equipment: fiscal years Page 3 of 3 Total Federally financed Institution and ranking Iowa State University... 6,201 5,414 4,763 5,837 1,977 1,566 1,401 1, Oklahoma State University... 4,718 5,894 6,884 5,823 1,316 1,475 1,388 1, U CA Santa Barbara... 5,092 6,862 7,649 5,679 4,134 5,604 5,670 4, Colorado State University... 8,405 7,653 7,078 5,602 4,634 4,513 4,228 3, Auburn University... 3,349 3,062 4,334 5,398 1,419 1,382 1,388 2, Texas Tech University... 4,462 3,958 6,528 5,396 1,939 1,554 2,461 1, Vanderbilt University... 5,008 7,450 5,021 5,303 3,932 6,672 3,801 4, U TX Med Br at Galveston... 3,067 2,999 3,494 5,163 1,839 1,541 2,061 2, U of Missouri Columbia... 5,590 6,348 6,537 4,919 1,665 2,488 2,514 2, University of Cincinnati... 6,001 2,474 5,498 4,828 1, ,864 1,539 Total, 1st 100 institutions... 1,011,714 1,051,414 1,116,629 1,188, , , , ,273 Total, all other sampled institutions , , , , , , , ,076 1 Johns Hopkins University includes the Applied Physics Laboratory. KEY: e = estimated i = imputed NOTE: Because of rounding, detail may not add to totals. SOURCE: National Science Foundation/Division of Science Resources Statistics, Survey of Research and Development Expenditures at Universities and Colleges, Fiscal Year
261 Table B-70. R&D expenditures at university-administered federally funded research and development centers, by character of work: fiscal years [Dollars in millions] Character of work Basic research Applied research Fiscal year Total and development Amount Percent of Amount Percent of total total , , , ,935 1, ,246 1, , ,486 1, , ,479 1, , ,737 1, , ,150 1, , ,523 1, , ,895 1, , ,206 2, , ,531 2, , ,730 2, , ,832 2, , ,076 2, , ,245 2, , ,290 2, , ,271 2, , ,363 2, , ,380 2, , ,440 2, , ,531 2, , ,644 2, , ,675 2, , ,912 2, , Separate data for basic research and applied research and development were not collected for fiscal year KEY: -- = not available NOTE: Because of rounding, detail may not add to totals. SOURCE: National Science Foundation/Division of Science Resources Statistics, Survey of Research and Development Expenditures at Universities and Colleges, Fiscal Year
262 Table B-71. R&D expenditures at university-administered federally funded research and development centers, by science and engineering field: fiscal years Field Total... 5,270,884 5,363,351 5,380,278 5,440,490 5,531,324 5,643,676 5,675,275 5,912,251 Engineering... 1,786,215 1,939,425 1,869,832 2,041,582 2,196,497 2,168,580 2,169,524 1,673,272 Aeronautical and astronautical , , , , , , , ,816 Bioengineering/biomedical ,515 46,169 53,023 46,998 46,818 Chemical... 78,613 68,742 68,650 63,124 60,804 63,364 63,963 63,954 Civil... 30,703 31,354 29,427 36,073 41,129 45, , ,831 Electrical , , , , , , , ,140 Mechanical , , , , , , , ,580 Metallurgical and materials... 64,274 65,889 62,109 63,378 62,442 63,881 70,031 46,892 Other, n.e.c , , , , , , , ,241 All sciences... 3,484,669 3,423,926 3,510,446 3,398,908 3,334,827 3,475,096 3,505,751 4,238,979 Physical sciences... 2,155,549 2,182,412 2,163,671 2,103,076 1,974,459 2,073,687 1,934,516 2,878,502 Astronomy , , , , , , ,164 1,009,591 Chemistry , , , , , , , ,273 Physics... 1,630,359 1,688,458 1,625,074 1,439,675 1,327,239 1,381,658 1,381,320 1,436,551 Other, n.e.c , , , , , , , ,087 Environmental sciences , , , , , , , ,909 Atmospheric , , , , , , , ,952 Earth sciences... 59,455 50,864 63, , , , , ,631 Oceanography... 13,406 11,997 12,489 2, ,331 Other, n.e.c , , , , ,453 91,527 86,719 88,995 Mathematical sciences ,971 83,330 98,501 29,504 29,747 46, , ,958 Computer sciences , , , , , , , ,254 Life sciences , , , , , , , ,780 Agricultural sciences... 1,216 1,067 1,286 1, Biological sciences... 99,479 90, , , , , , ,479 Medical sciences... 13,059 20,875 13,663 19,448 18,832 29,557 11,348 12,627 Other, n.e.c.... 8,557 8,442 6,179 12,110 9,566 14,296 12,674 12,674 Psychology Social sciences... 10,594 9,047 7, ,610 Economics Political science Sociology Other, n.e.c ,054 8,709 7, ,395 Other sciences, n.e.c ,553 87,924 86,942 16,107 12,253 19,634 18,381 15,966 KEY: -- = not available n.e.c. = not elsewhere classified NOTE: Because of rounding, detail may not add to totals. SOURCE: National Science Foundation/Division of Science Resources Statistics, Survey of Research and Development Expenditures at Universities and Colleges, Fiscal Year
263 Table B-72. Federally financed R&D expenditures at university-administered federally funded research and development centers, by science and engineering field: fiscal years Field Total... 5,202,526 5,272,548 5,299,366 5,321,913 5,404,630 5,484,686 5,517,119 5,742,594 Engineering... 1,769,468 1,914,876 1,849,464 2,005,888 2,156,261 2,127,385 2,132,074 1,637,377 Aeronautical and astronautical , , , , , , , ,250 Bioengineering/biomedical ,913 45,386 52,097 46,250 46,086 Chemical... 77,714 67,841 67,713 61,745 59,482 62,079 62,909 62,861 Civil... 30,275 30,960 29,067 35,511 40,425 44, , ,814 Electrical , , , , , , , ,397 Mechanical , , , , , , , ,605 Metallurgical and materials... 63,828 65,464 61,715 62,874 61,881 63,255 69,361 46,222 Other, n.e.c , , , , , , , ,142 All sciences... 3,433,058 3,357,672 3,449,902 3,316,025 3,248,369 3,357,301 3,385,045 4,105,217 Physical sciences... 2,132,477 2,147,101 2,138,207 2,065,092 1,927,157 2,015,409 1,883,008 2,818,171 Astronomy , , , , , , ,821 1,009,419 Chemistry , , , , , , , ,513 Physics... 1,617,090 1,662,116 1,606,907 1,414,325 1,300,773 1,353,689 1,357,436 1,408,189 Other, n.e.c ,719 95, , , , , , ,050 Environmental sciences , , , , , , , ,407 Atmospheric , , , , , , , ,885 Earth sciences... 58,355 49,644 62, , , , , ,978 Oceanography... 13,406 11,997 12,489 2, ,331 Other, n.e.c , , , ,089 98,310 88,673 84,610 85,213 Mathematical sciences ,468 81,796 96,973 28,694 28,890 45, , ,858 Computer sciences , , , , , , , ,030 Life sciences , , , , , , , ,044 Agricultural sciences... 1,216 1,067 1,286 1, Biological sciences... 95,702 84,366 96,070 88, , , , ,723 Medical sciences... 12,784 19,277 11,960 17,881 15,561 26,414 8,152 8,847 Other, n.e.c.... 8,480 8,382 6,130 11,997 9,444 14,113 12,474 12,474 Psychology Social sciences... 10,465 8,945 7, ,610 Economics Political science Sociology Other, n.e.c.... 9,925 8,607 7, ,395 Other sciences, n.e.c ,119 86,365 84,899 12,602 9,161 15,709 15,953 13,097 KEY: -- = not available n.e.c. = not elsewhere classified NOTE: Because of rounding, detail may not add to totals. SOURCE: National Science Foundation/Division of Science Resources Statistics, Survey of Research and Development Expenditures at Universities and Colleges, Fiscal Year
264 Table B-73. R&D expenditures at university-administered federally funded research and development centers, by science and engineering field: fiscal year 2001 Engi- Physical Environ- Math & Life Psy- Social Other Institution and ranking Total neering sciences mental computer sciences chology sciences sciences sciences sciences Total, all institutions... 5,912,251 1,673,272 2,878, , , , ,610 15,966 1 Jet Propulsion Laboratory... 1,355, , , ,933 58,913 11, , Los Alamos National Lab... 1,333,194e 759,755e 419,803e 0e 143,191e 10,445e 0e 0e 0e 3 Lawrence Livermore Lab... 1,090, , , , ,110 40, Argonne Natl Laboratory , , ,353 89,918 18,871 37, Lawrence Berkeley Lab ,487 10,387e 192,135e 26,065e 72,628e 97,368e 0e 0e 9,904e 6 MIT Lincoln Laboratory ,339e 201,026e 78,620e 0e 60,402e 2,229e 0e 0e 6,062e 7 Fermi Natl Accel Lab , , Stanford Linear Accel Ctr , , Natl Ctr Atmospheric Res , , T J Natl Accel Facility , , Total, 1st 10 institutions... 5,693,704 1,667,980 2,705, , , , ,610 15, Plasma Physics Lab... 76, ,395 1, Natl Optical Astro Obs... 37, , Software Engineering Inst... 37, , AUI-Natl Radio Astr Obs... 34, , Ames Laboratory... 22,916 5,292 17, Natl Astron & Ionos Ctr... 10, ,501 1, Total, 1st 16 institutions... 5,912,251 1,673,272 2,878, , , , ,610 15,966 KEY: e = estimated NOTE: Because of rounding, detail may not add to totals. SOURCE: National Science Foundation/Division of Science Resources Statistics, Survey of Research and Development Expenditures at Universities and Colleges, Fiscal Year
265 Table B-74. Total and federally financed R&D expenditures at university-administered federally funded research and development centers, ranked by fiscal year 2001 total R&D expenditures: fiscal years Total Federally financed Institution and ranking Total, all institutions... 5,531,324 5,643,676 5,675,275 5,912,251 5,404,630 5,484,686 5,517,119 5,742,594 1 Jet Propulsion Laboratory... 1,232,170 1,232,170e 1,254,349e 1,355,463 1,232,170 1,232,170e 1,254,349e 1,355,463 2 Los Alamos National Lab... 1,187,000 1,278,901 1,333,194 1,333,194e 1,168,302 1,258,082 1,312,974 1,312,974e 3 Lawrence Livermore Lab... 1,076,800 1,075,536 1,041,234 1,090,875 1,032,192 1,028, ,962 1,049,675 4 Argonne Natl Laboratory , , , , , , , ,860 5 Lawrence Berkeley Lab , , , , , , , ,757 6 MIT Lincoln Laboratory , , , ,339e 356, , , ,809e 7 Fermi Natl Accel Lab , , , , , , , ,928 8 Stanford Linear Accel Ctr , , , , , , , ,979 9 Natl Ctr Atmospheric Res , , , , , , , , T J Natl Accel Facility... 75,963 74,604 79, ,202 74,963 73,920 78, ,855 Total, 1st 10 institutions... 5,288,743 5,395,361 5,447,521 5,693,704 5,165,523 5,238,456 5,290,337 5,524, Plasma Physics Lab... 53,005 53,693 65,305 76,021 49,699 52,027 64,738 75, Natl Optical Astro Obs... 38,283 37,308 36,409 37,364 38,283 37,308 36,409 37, Software Engineering Inst... 30,113 31,821 55,955 37,052 30,113 31,821 55,955 37, AUI-Natl Radio Astr Obs... 34,708 37,162 35,536 34,208 34,540 36,771 35,313 34, Ames Laboratory... 24,637 25,438 23,281 22,916 24,637 25,438 23,281 22, Natl Astron & Ionos Ctr... 11,085 10,950 11,268 10,986 11,085 10,922 11,086 10, Oak Ridge Associated Univ.. 50,750 51, ,750 51, Total, 1st 17 institutions... 5,531,324 5,643,676 5,675,275 5,912,251 5,404,630 5,484,686 5,517,119 5,742,594 KEY: -- = not available e = estimated NOTE: Because of rounding, detail may not add to totals. SOURCE: National Science Foundation/Division of Science Resources Statistics, Survey of Research and Development Expenditures at Universities and Colleges, Fiscal Year
266 SECTION C. UNIVERSITY-ADMINISTERED FEDERALLY FUNDED RESEARCH AND DEVELOPMENT CENTERS: FY 2001
267
268 DEPARTMENT OF DEFENSE Lincoln Laboratory (Massachusetts Institute of Technology) Software Engineering Institute (Carnegie Mellon University) DEPARTMENT OF ENERGY Ames Laboratory (Iowa State University of Science and Technology) Argonne National Laboratory (University of Chicago and Argonne Universities Association) Continuous Electron Beam Accelerator Facility (Southeastern Universities Research Association) E.O. Lawrence Berkeley Laboratory (University of California) E.O. Lawrence Livermore Laboratory (University of California) Fermi National Accelerator Laboratory (Universities Research Association) Los Alamos National Laboratory (University of California) Plasma Physics Laboratory (Princeton University) Stanford Linear Accelerator Center (Stanford University) NATIONAL AERONAUTICS AND SPACE ADMINISTRATION Jet Propulsion Laboratory (California Institute of Technology) NATIONAL SCIENCE FOUNDATION National Astronomy and Ionosphere Center (Cornell University) National Center for Atmospheric Research (University Corporation for Atmospheric Research) National Optical Astronomy Observatory (Association of Universities for Research in Astronomy, Inc.) National Radio Astronomy Observatory (Associated Universities, Inc.) NOTE: Information enclosed in the parentheses is the administering entity for Federally Funded Research and Development Centers. 259
269
270 SECTION D. SURVEY INSTRUMENTS
271
272 CONTENTS Item Page Survey form and crosswalk Optional survey forms
273

274 265
275 266
276 267
277 268
278 269
279 270

280 271

281 272

282 273
283
284
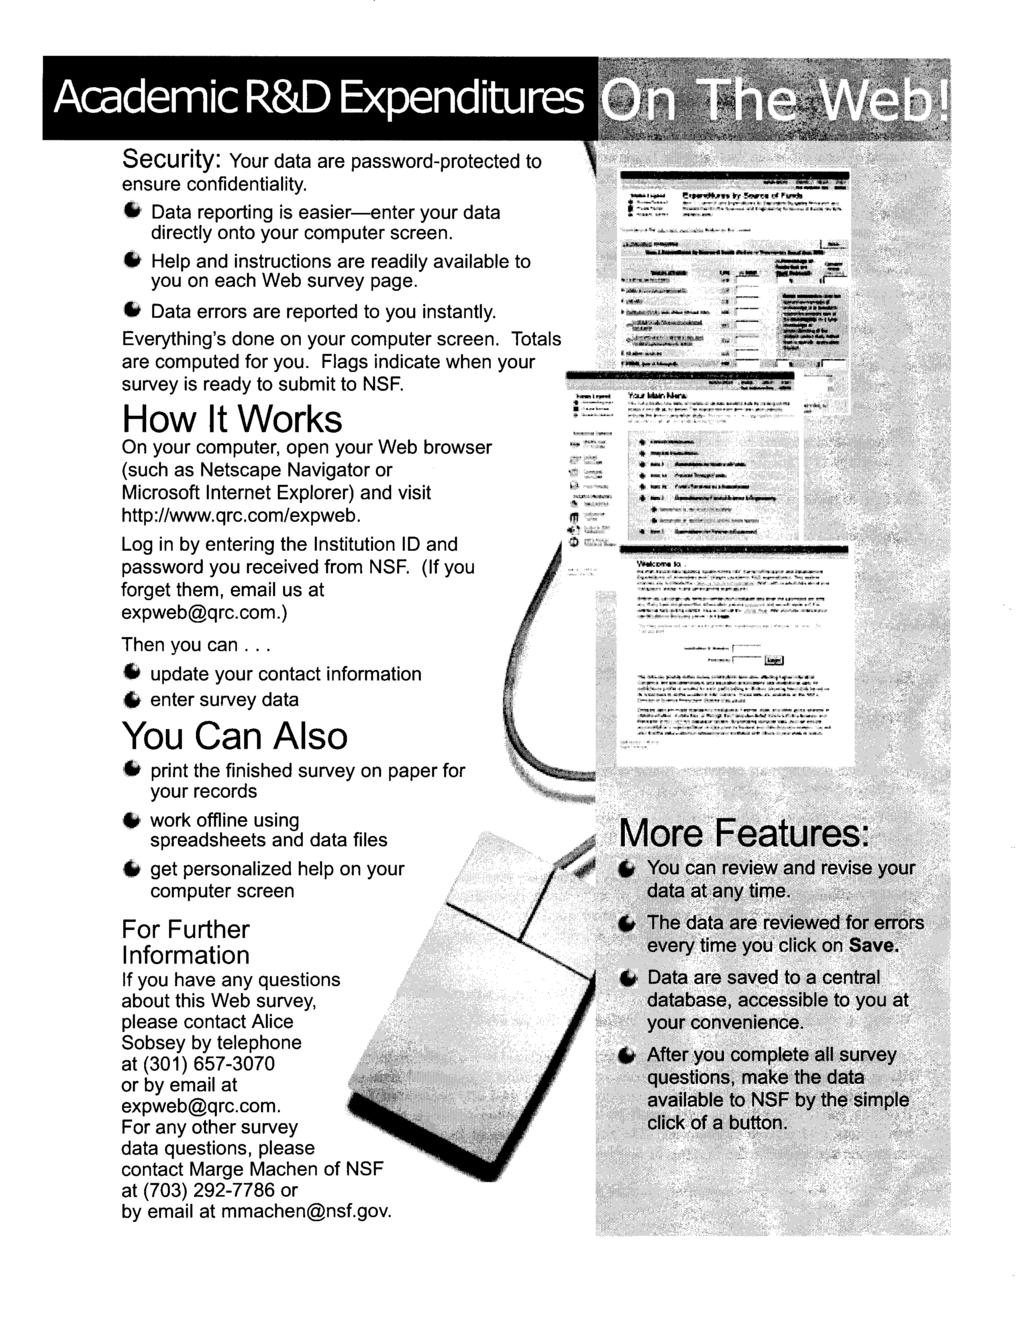
285
DOCTORAL/RESEARCH INSTITUTIONS RECEIVING FULBRIGHT AWARDS FOR
 DOCTORAL/RESEARCH INSTITUTIONS RECEIVING FULBRIGHT AWARDS FOR 2015-2016 Those institutions highlighted in blue are listed in the Chronicle of Higher Education Institution State Grants Applications Harvard
Table 2 Overall Heterodox-Adjusted Rankings for Ph.D.-Granting Institutions in Economics
 ing Economics Departments in a Contested Discipline 23 Heterodox-Adjusted ings for Ph.D.-Granting Institutions in Economics ) ) Harvard U 43 1 (1) 5.47 1 (1) UC Berkeley 56 2 (2) 4.08 4 (4) Princeton U
U.S. Psychology. Departments
 Table of Contents Department Ratings Links Home U.S. Psychology Distinguished Strong Good Departments This page ranks United States doctoral programs in psychology based on the 1995 study conducted by
US News and World Report Rankings Graduate Economics Programs Ranked in 2001
 The following list reports the rankings done in 1995 by William H. Kaempfer and Chao Jing of the University of Colorado at Boulder. Their list compiles six earlier studies into an aggregate ranking. Rankings
U.S. Patents Awarded in 2005 Top 20 Universities
 U.S. Awarded in 2005 1 California Institute of Technology 172 2 Massachusetts Institute of Technology 133 3 U. of Wisconsin at Madison 89 4 Johns Hopkins U. 81 5 U. of Michigan at Ann Arbor 80 6 U. of
Engineering bachelor s degrees recovered in 2008
 6 5 4 3 2 1 Engineering by the Numbers By Michael T. Gibbons Engineering bachelor s degrees recovered in 28 from a slight dip in 27, reaching 74,17 for a 1.2 percent gain. Excluding computer science, the
TROJAN SEXUAL HEALTH REPORT CARD. The Annual Rankings of Sexual Health Resources at American Colleges and Universities. TrojanBrands.
 TROJAN SEXUAL HEALTH The Annual Rankings of Sexual Health Resources at American Colleges and Universities PRESENTED BY TOP 10 1 UNIVERSITY OF GEORGIA 2 OREGON STATE UNIVERSITY 3 UNIVERSITY OF MICHIGAN
College Profiles - Navy/Marine ROTC
 Page 1 of 6 The U.S. Navy and Marine Corps are a team that provides for our national defense. The men and women who serve are called on to provide support at sea, in the air and on land. The Navy-Marine
By Brian L. Yoder, Ph.D.
 Engineering by the Numbers By Brian L. Yoder, Ph.D. A Note on Data in the 216 Profiles: In a change from previous issues of Profiles, ASEE has decided to omit data from schools that have not participated
ARL SUPPLEMENTARY STATISTICS A COMPILATION OF STATISTICS FROM THE MEMBERS OF THE ASSOCIATION OF RESEARCH LIBRARIES
 ARL SUPPLEMENTARY STATISTICS 1997-98 A COMPILATION OF STATISTICS FROM THE MEMBERS OF THE ASSOCIATION OF RESEARCH LIBRARIES TABLE OF CONTENTS Table 1. Summary Statistics for University Libraries...4 Table
By Brian L. Yoder, Ph.D.
 Engineering by the Numbers By Brian L. Yoder, Ph.D. Bachelor s Degrees and Enrollment Engineering bachelor s degrees grew by 6 percent during the past year, reaching a total of 93,36 for 213. This continues
Ethnic Studies Asst 55, ,755-2, ,111 4,111
 A&S Prof 99,202 163 112,307-13,105-11.67 2,136,071 2,210,459 Asso 69,100 115 74,200-5,101-6.87 586,572 648,916 Asst 60,014 78 62,194-2,181-3.51 170,088 256,767 Total 80,892 356 89,017-8,126-9.13 2,892,731
Ethnic Studies Asst 54, ,315-3, ,229 6,229. Gen Honors/UC Asso 64, ,402-4, ,430 24,430
 A&S Prof 99,280 157 110,954-11,674-10.52 1,832,807 2,010,866 Asso 70,144 112 73,921-3,777-5.11 422,998 603,376 Asst 60,165 82 62,465-2,300-3.68 188,570 269,597 Total 80,845 351 87,809-6,964-7.93 2,444,375
Sears Directors' Cup Final Standings
 1 Stanford 662.5 5 59.5 2 63.0 4 61.0 3 61.5 1 64.0 57 0.0 54 0.0 971.5 2 North Carolina 565.0 53.0 17 44.5 19 46.0 8 57.0 41 17.5 16 0.0 7 58.0 9 54.5 789.5 3 UCLA 485.5 118.0 7 58.0 1 64.0 5 58.5 3 61.5
FDP Expanded Clearinghouse Participants (as of February 8, 2018)
") Arizona State University Augusta University Research Institute, Inc. Ball State University Beckman Research Institute of the City of Hope Boston College Boston University (Charles River Campus) Boston
Arizona State University Augusta University Research Institute, Inc. Ball State University Beckman Research Institute of the City of Hope Boston College Boston University (Charles River Campus) Boston
U.S. Track & Field and Cross Country Coaches Association
 Men Arizona State University Belmont University Binghamton University Boston University Bradley University Brigham Young University Brown University Bucknell University Central Michigan University Colgate
Appalachian State University L500030AppStUBlkVinyl. University of Alabama L500030AlabmaBlkVinyl. Arizona State University L500030ArizStBlkVinyl
 University of Alabama at Birmingham L500030AlaBirBlkVinyl University of Alabama L500030AlabmaBlkVinyl Appalachian State University L500030AppStUBlkVinyl Arizona State University L500030ArizStBlkVinyl University
Initial (one-time) Membership Fee 10,000 Renewal Fee (every 8 years) $3500
 Membership Fee 10,000 Renewal Fee (every 8 years) $3500") November 25, 2013 UCAR Membership Fees Process and Schedule Fee assessment process: 1. UCAR Members vote at the Annual Meeting to approve new or renewing applications for UCAR membership. 2. After the
November 25, 2013 UCAR Membership Fees Process and Schedule Fee assessment process: 1. UCAR Members vote at the Annual Meeting to approve new or renewing applications for UCAR membership. 2. After the
ARL ACADEMIC HEALTH SCIENCES LIBRARY STATISTICS
 ASSOCIATION OF RESEARCH LIBRARIES WASHINGTON, D.C. 2006 ARL ACADEMIC HEALTH SCIENCES LIBRARY STATISTICS 2004-05 Compiled and Edited by MARK YOUNG MARTHA KYRILLIDOU Downloaded from publications.arl.org
ARL ACADEMIC LAW LIBRARY STATISTICS
 ASSOCIATION OF RESEARCH LIBRARIES WASHINGTON, D.C. 2006 ARL ACADEMIC LAW LIBRARY STATISTICS 2004-05 Compiled and Edited by MARK YOUNG MARTHA KYRILLIDOU Downloaded from publications.arl.org ARL Academic
Name. Class. Year. trojan sexual health report card edition THE ANNUAL RANKING OF SEXUAL HEALTH RESOURCES AT AMERICAN COLLEGES & UNIVERSITIES
 Name Class Year trojan sexual health report card 2010 edition THE ANNUAL RANKING OF SEXUAL HEALTH RESOURCES AT AMERICAN COLLEGES & UNIVERSITIES important use no.1 condom Trojan Brand condoms trusted for
2013 Sexual Health. Report Card. The Annual Rankings of Sexual Health Resources at American Colleges and Universities BRAND CONDOMS
 BRAND CONDOMS Report Card The Annual Rankings of Resources at American Colleges and Universities TOP 10 Report Card 1 2 3 4 5 6 7 8 9 10 Princeton University Columbia University University of Arizona University
University of Maryland-Baltimore County
 Selected Comparison Groups August 2008 Reviewing Your NSSE 2008 Selected Comparison Groups Report NSSE participants are able to customize their Institutional Reports by tailoring up to three comparison
CILogon & InCommon & Federated Identity. Jim Basney
 CILogon & InCommon & Federated Identity Jim Basney Federated Identity Federated Identity for R&E geni.net opensciencedatacloud.org Federated Identity for R&E dmptool.org Federated
Digitization and Aggregation Enabling a Print Network
 HATHITRUST DIGITAL LIBRARY Digitization and Aggregation Enabling a Print Network Mike Furlough Executive Director, HathiTrust 15 August 2016 2016 IFLA World Library and Information Congress Columbus, OH
Yes, institutions can nominate a person who was previously nominated, provided they still meet the eligibility requirements of the program.
 Frequently Asked Questions As an institution eligible to participate in the Moore Inventor Fellows program, is there a specific process for internal solicitation and selection we should follow? There is
April 17, 2017 Howard Hughes Medical Institute Page 1 of General Investigator Competition List of Eligible Institutions
 April 17, 2017 Howard Hughes Medical Institute Page 1 of 6 Aaron Diamond AIDS Research Center Albany Medical College Albert Einstein College of Medicine Arizona State University Baylor College of Medicine
NSTC COMPETITIVE AREA DEFINITIONS. UIC Naval Service Training Command (NSTC), Great Lakes, IL
, Great Lakes, IL") NSTC COMPETITIVE AREA DEFINITIONS UIC 00210 Naval Service Training Command (NSTC), Great Lakes, IL UIC 00210 NSTC, N8, Pensacola, FL UIC 0763A Recruit Training Command, Great Lakes, IL NSTC Pensacola Programs,
NSTC COMPETITIVE AREA DEFINITIONS UIC 00210 Naval Service Training Command (NSTC), Great Lakes, IL UIC 00210 NSTC, N8, Pensacola, FL UIC 0763A Recruit Training Command, Great Lakes, IL NSTC Pensacola Programs,
Rutgers Revenue Sources
 Rutgers Revenue Sources 31.2% Tuition and Fees 27.3% State Appropriations with Fringes 1.0% Endowment and Investments.5% Federal Appropriations 17.8% Federal, State, and Municipal Grants and Contracts
Scoring Algorithm by Schiller Industries
 As of June 28, 2017 MEN'S CUP STANDINGS Points WOMEN'S CUP STANDINGS Points 1. Ohio State 111 1. Stanford 175.5 2. Florida 105 2. USC 129 3. North Carolina 100 3. Florida 87 4. Stanford 94.5 4. Oregon
CAIR Conference Anaheim, CA, Nov. 6-9, 2012
 CAIR 2012 Best Presentation CAIR Conference Anaheim, CA, Nov. 6-9, 2012 John Stanley Institutional Analyst University of Hawaii at Mānoa jstanley@hawaii.edu Presentation Outline What are peers and why
Decline Admission to Boston College Law School Fall 2018
 Decline Admission to Boston College Law School Fall 2018 We are sorry to hear that you will not be attending Boston College Law School. Please complete and submit this form to formally decline your admission
2009 Marketing Academia Labor Market Survey May 20, 2009
 2009 Labor Market Report / 1 2009 Marketing Academia Labor Market Survey May 20, 2009 Chris Janiszewski, Warrington School of Business, University of Florida Geeta Menon, The Wharton School, University
Colleges/Universities with Exercise Science/Kinesiology-related Graduate Programs
 Colleges/Universities with Exercise Science/Kinesiology-related Graduate Programs (If you know of a college/university not on this list, please contact the CSCCa National Office to have it added.) ALABAMA
President Dennis Assanis
 President Dennis Assanis Strategic Planning Where are we now? Where do we want to go? Identify peer institutions for comparison current and aspirational Articulate shared vision and identify cross-cutting
The Top American Research Universities
 The Top American Universities Elizabeth D. Capaldi Phillips John V. Lombardi Craig W. Abbey Diane D. Craig The Top American Universities What s in a Name? The Classification of Universities Over the years
List of Association of American Universities (AAU) Member Institutions
 Member Institutions") List of Association of American Universities (AAU) Member Institutions 1997/98 PUBLIC University of Arizona - Tucson University of California - System Administration University of California - Berkeley
List of Association of American Universities (AAU) Member Institutions 1997/98 PUBLIC University of Arizona - Tucson University of California - System Administration University of California - Berkeley
Higher Education. Educational Matching Gift Programs
 Educational Matching Gift Programs ExxonMobil Educational Matching Gift Program: Abilene Christian University 104,625 Auburn University Foundation 389,381 Baylor University 340,575 Boston College 101,325
CSCAA NCAA Division I Scholar All-America Teams
 College Swimming Coaches Association of America- For Immediate Release March 5, 2014 Contact: Joel Shinofield, Executive Director (540) 460-6563; joel@cscaa.org CSCAA NCAA Division I Scholar All-America
REPORT ON THE STATUS OF FACULTY SALARIES AT KANSAS STATE UNIVERSITY
 Attachment 1 REPORT ON THE STATUS OF FACULTY SALARIES AT KANSAS STATE UNIVERSITY Prepared by the Office of Planning & Analysis June 2009 Staff: Kelli Cox, Director Nancy Baker, Computer Information Specialist
Rankings of the States 2017 and Estimates of School Statistics 2018
 Rankings of the States 2017 and Estimates of School Statistics 2018 NEA RESEARCH April 2018 Reproduction: No part of this report may be reproduced in any form without permission from NEA Research, except
AMERICAN ASSOCIATION FOR AGRICULTURAL EDUCATION FACULTY SALARIES
 AMERICAN ASSOCIATION FOR AGRICULTURAL EDUCATION 1999-2000 FACULTY SALARIES Contents Page Summary Data for 1999-2000 Faculty FTEs by Region Nine-month appointments (Table 1)...2 Twelve-month appointments
FEDERAL R&D FUNDING BY STATE
 SOCIAL & BEHAVIORAL SCIENCE FEDERAL R&D FUNDING BY STATE 2017 /resources/state-fact-sheets TABLE OF CONTENTS State Total Social Science R&D Page Why Social Science? 3 Alabama $13.5 million 4 Alaska $2.4
Drink Mats Grill Mats
 Alabama A&M Alabama State Alabama-ALogo 14000 12115 15500 Alabama at Birmingham Alabama at Huntsville Alabama-Elephant Logo 9064 Appalachian State Arizona 10328 Arizona State 10329 Arkansas 14015 12116
U.S. News 2004 The Professional Schools
 U.S. News 2004 The Professional Schools THE TOP 25 THE TOP 25 1 Yale Clinical Training: 1 Harvard 1. Georgetown 2 Harvard 2. American 2 Washington Univ. 3. New York In St. Louis 3 Stanford 4. Washington
Adlai E. Stevenson High School December 15, 2017
 Adlai E. Stevenson High School December 15, 2017 Student Outcome Statistics Detail Settings: Start Class Year/Grade: class of 2017; End Class Year/Grade: class of 2017 Total White Black Asian Hispanic
Introduction. Current Law Distribution of Funds. MEMORANDUM May 8, Subject:
 MEMORANDUM May 8, 2018 Subject: TANF Family Assistance Grant Allocations Under the Ways and Means Committee (Majority) Proposal From: Gene Falk, Specialist in Social Policy, gfalk@crs.loc.gov, 7-7344 Jameson
IU Bloomington Peer Retention & Graduation Rate Comparisons
 IU Bloomington Peer Retention & Graduation Rate Comparisons Northwestern U. 98% 97% 97% U. of Michigan Ann Arbor 97% 97% 97% U. of California Berkeley 96% 96% 96% U. of Wisconsin Madison 95% 95% 96% The
Graduate Schools Class of 2015 Air Force Insitute of Technology Arizona State University Arrhythmia Technologies Institute ATI, Greenville, South
 Graduate Schools Class of 2015 Air Force Insitute of Technology Arizona State University Arrhythmia Technologies Institute ATI, Greenville, South Carolina Auburn Ball State Boston University Boston University
Institutions Ineligible for AREA Grants April 2016 March 2017
 Institutions Ineligible for AREA Grants April 2016 March 2017 See AREA Program Ineligible Institutions website and Part 2, Section III of the Funding Opportunity Announcement for more information about
Mike DeSimone's 2006 College Football Division I-A Top 119 Ratings Bowl Schedule
 2006/2007 College Football Games Page 1 of 8 Mike DeSimone's 2006 College Football Division I-A Top 119 Ratings Schedule Predictions Last Modified: Tuesday, 12, 2006 Record: 0 Correct 0 Incorrect (%) Download
Use of Medicaid MCO Capitation by State Projections for 2016
 Use of Medicaid MCO Capitation by State Projections for 5 Slide Series September, 2015 Summary of Findings This edition projects Medicaid spending in each state and the percentage of spending paid via
Dashboard. Campaign for Action. Welcome to the Future of Nursing:
 Welcome to the Future of Nursing: Campaign for Action Dashboard About This Dashboard: These graphs and charts show goals by which the Campaign evaluates its efforts to implement recommendations in the
CONNECTICUT: ECONOMIC FUTURE WITH EDUCATIONAL REFORM
 CONNECTICUT: ECONOMIC FUTURE WITH EDUCATIONAL REFORM This file contains detailed projections and information from the article: Eric A. Hanushek, Jens Ruhose, and Ludger Woessmann, It pays to improve school
2014 Salary and Benefits Report
 University Senate Faculty Compensation and Benefits Committee 115 Independence Hall 1923 Neil Ave. Columbus, OH 43210 614-292-2423 Phone 2014 Salary and Benefits Report senate.osu.edu University Senate
Employment Outcomes, New York / Metro NYC Law Schools
 State and % employed Univ of Pennsylvania (PA 18%) Employment Outcomes, New York / Metro NYC Law Schools NYU (NY 68%) Duke (NC 11%) Columbia (NY 61%) Cornell (NY 54%) Univ of Virginia (VA 12%) Harvard
TABLE 3c: Congressional Districts with Number and Percent of Hispanics* Living in Hard-to-Count (HTC) Census Tracts**
 Census Tracts**") living Alaska 00 47,808 21,213 44.4 Alabama 01 20,661 3,288 15.9 Alabama 02 23,949 6,614 27.6 Alabama 03 20,225 3,247 16.1 Alabama 04 41,412 7,933 19.2 Alabama 05 34,388 11,863 34.5 Alabama 06 34,849 4,074
living Alaska 00 47,808 21,213 44.4 Alabama 01 20,661 3,288 15.9 Alabama 02 23,949 6,614 27.6 Alabama 03 20,225 3,247 16.1 Alabama 04 41,412 7,933 19.2 Alabama 05 34,388 11,863 34.5 Alabama 06 34,849 4,074
Public Accounting Report
 Public Accounting Report THE INDEPENDENT NEWSLETTER OF THE ACCOUNTING PROFESSION SINCE 1978 AUGUST 2018 VOLUME XLII, NO. 8 IN THIS ISSUE 2 2018 Top 50 Undergraduate Accounting Programs 3 Top 25 Undergraduate
Registration Priority for Athletes -- Survey of Universities Updated February 2007 Alice Poehls, UNC Chapel Hill
 Registration Priority for -- Survey of Universities Updated February 2007 Alice Poehls, UNC Chapel Hill Questions were originally asked by Bruce Cunningham, Duke University, to the AAU group in 2000 and
41/95/2 Student Affairs ATO Chapters Chapter Composites File,
 41/95/2 Student Affairs ATO Chapters Chapter Composites File, 1867-2015 Note: Due to preservation considerations, pre-1950 and modern composites have been separated. Please be aware that older composites
2013 U. of Iowa 86% 85% 87% 2014 U. of Colorado Boulder 84% 86% 86% U. of Nebraska Lincoln 84% 83% 82%
 IU Bloomington Peer Retention & Graduation Rate Comparisons Northwestern U. 97% 97% 98% U. of Michigan Ann Arbor 97% 97% 97% U. of California Berkeley 96% 96% 97% University of Maryland College Park 96%
 3+ 3+ N = 155, 442 3+ R 2 =.32 < < < 3+ N = 149, 685 3+ R 2 =.27 < < < 3+ N = 99, 752 3+ R 2 =.4 < < < 3+ N = 98, 887 3+ R 2 =.6 < < < 3+ N = 52, 624 3+ R 2 =.28 < < < 3+ N = 36, 281 3+ R 2 =.5 < < < 7+
TABLE 3b: Congressional Districts Ranked by Percent of Hispanics* Living in Hard-to- Count (HTC) Census Tracts**
 Census Tracts**") Rank State District Count (HTC) 1 New York 05 150,499 141,567 94.1 2 New York 08 133,453 109,629 82.1 3 Massachusetts 07 158,518 120,827 76.2 4 Michigan 13 47,921 36,145 75.4 5 Illinois 04 508,677 379,527
Rank State District Count (HTC) 1 New York 05 150,499 141,567 94.1 2 New York 08 133,453 109,629 82.1 3 Massachusetts 07 158,518 120,827 76.2 4 Michigan 13 47,921 36,145 75.4 5 Illinois 04 508,677 379,527
2010 College Football
 2010 College Football Thursday, September 2, 2010 Southern Miss. v. South Carolina 6:30 PM 9:30 PM ESPN Thursday, September 2, 2010 USC at Hawaii 10:00 PM 1:00 AM ESPN Friday, September 3, 2010 Arizona
DoD-Navy FWA Addendums
 DoD-Navy FWA s 361 Interactive, LLC DoD-N-A3161* 12-Mar-12 FWA00014199 12-Mar-12 Academic Consortium for Global Education Inc. (ACGE) DoD-N-A3065* 02-Oct-10 FWA00012146 02-Oct-10 Advanced Brain Monitoring
Illinois Higher Education Executive Compensation Analysis
 Illinois Higher Education Executive Analysis July 2015 Illinois Board of Higher Education Notes on sources and methods: The peer information used in this analysis was obtained from the Chronicle of Higher
2016 INCOME EARNED BY STATE INFORMATION
 BY STATE INFORMATION This information is being provided to assist in your 2016 tax preparations. The information is also mailed to applicable Columbia fund non-corporate shareholders with their year-end
The American Legion NATIONAL MEMBERSHIP RECORD
 The American Legion NATIONAL MEMBERSHIP RECORD www.legion.org 2016 The American Legion NATIONAL MEMBERSHIP RECORD 1920-1929 Department 1920 1921 1922 1923 1924 1925 1926 1927 1928 1929 Alabama 4,474 3,246
Fiscal Year Tuition and Fee Comparisons for UNC Peer Institutions
 Fee Comparisons and 1 California State University at Fresno $2,933 $13,103 2 California State University at Chico $3,370 $13,540 3 Appalachian State University $3,436 $13,178 4 Georgia Southern University
NATIONAL DEBATE TOURNAMENT
 NATIONAL DEBATE TOURNAMENT Spring 2017 Report Spring 2017 Report PREPARED BY Dr. Jim Hanson Climb the Mountain Speech & Debate Foundation Email: jim@climbthemountain.us Based on the tabroom.com Results
1. The University of Alabama 2. Alvernia University 3. American University 4. Appalachian State University 5. Arcadia University 6.
 1. The University of Alabama 2. Alvernia University 3. American University 4. Appalachian State University 5. Arcadia University 6. Arizona State University 7. The University of Arizona 8. Auburn University
Current Medicare Advantage Enrollment Penetration: State and County-Level Tabulations
 Current Advantage Enrollment : State and County-Level Tabulations 5 Slide Series, Volume 40 September 2016 Summary of Tabulations and Findings As of September 2016, 17.9 million of the nation s 56.1 million
Index of religiosity, by state
 Index of religiosity, by state Low Medium High Total United States 19 26 55=100 Alabama 7 16 77 Alaska 28 27 45 Arizona 21 26 53 Arkansas 12 19 70 California 24 27 49 Colorado 24 29 47 Connecticut 25 32
Fiscal Research Center
 January 2016 Georgia s Rankings Among the States: Budget, Taxes and Other Indicators ABOUT THE FISCAL RESEARCH CENTER Established in 1995, the (FRC) provides nonpartisan research, technical assistance
FBI Field Offices. Louisville Division Room Martin Luther King Jr. Place Louisville, Kentucky (502)
") FBI Field Offices Alabama Kentucky North Dakota Birmingham Division Room 1400 2121 8 th Ave. North Birmingham, Alabama 35203-2396 (205) 326-6166 Mobile Division One St. Louis Street, 3 rd Floor Mobile,
FBI Field Offices Alabama Kentucky North Dakota Birmingham Division Room 1400 2121 8 th Ave. North Birmingham, Alabama 35203-2396 (205) 326-6166 Mobile Division One St. Louis Street, 3 rd Floor Mobile,
NATIONAL DEBATE TOURNAMENT
 NATIONAL DEBATE TOURNAMENT Spring 2016 Report Spring 2016 Report PREPARED BY Dr. Jim Hanson Climb the Mountain Speech & Debate Foundation Email: jim@climbthemountain.us Based on the tabroom.com Results
PFU DRAFT TIPS Draft Kit. Tip 1: Avoid drafting too many teams from the same conference
 2016 Draft Kit PFU DRAFT TIPS Here are a few insider tips that will give you the upper hand in your draft this year. Feel free to heed the advice or just follow your own instincts. Either way, have a blast
Unemployment Rate (%) Rank State. Unemployment
 Rank State. Unemployment") States Ranked by February 2018 Unemployment Rate Seasonally Adjusted Unemployment Unemployment Unemployment 1 Hawaii 2.1 19 Alabama 3.7 33 Ohio 4.5 2 New Hampshire 2.6 19 Missouri 3.7 33 Rhode Island 4.5
States Ranked by February 2018 Unemployment Rate Seasonally Adjusted Unemployment Unemployment Unemployment 1 Hawaii 2.1 19 Alabama 3.7 33 Ohio 4.5 2 New Hampshire 2.6 19 Missouri 3.7 33 Rhode Island 4.5
Unemployment Rate (%) Rank State. Unemployment
 Rank State. Unemployment") States Ranked by November 2015 Unemployment Rate Seasonally Adjusted Unemployment Unemployment Unemployment 1 North Dakota 2.7 19 Indiana 4.4 37 Georgia 5.6 2 Nebraska 2.9 20 Ohio 4.5 37 Tennessee 5.6
States Ranked by November 2015 Unemployment Rate Seasonally Adjusted Unemployment Unemployment Unemployment 1 North Dakota 2.7 19 Indiana 4.4 37 Georgia 5.6 2 Nebraska 2.9 20 Ohio 4.5 37 Tennessee 5.6
Unemployment Rate (%) Rank State. Unemployment
 Rank State. Unemployment") States Ranked by April 2017 Unemployment Rate Seasonally Adjusted Unemployment Unemployment Unemployment 1 Colorado 2.3 17 Virginia 3.8 37 California 4.8 2 Hawaii 2.7 20 Massachusetts 3.9 37 West Virginia
States Ranked by April 2017 Unemployment Rate Seasonally Adjusted Unemployment Unemployment Unemployment 1 Colorado 2.3 17 Virginia 3.8 37 California 4.8 2 Hawaii 2.7 20 Massachusetts 3.9 37 West Virginia
Unemployment Rate (%) Rank State. Unemployment
 Rank State. Unemployment") States Ranked by August 2017 Unemployment Rate Seasonally Adjusted Unemployment Unemployment Unemployment 1 North Dakota 2.3 18 Maryland 3.9 36 New York 4.8 2 Colorado 2.4 18 Michigan 3.9 38 Delaware 4.9
States Ranked by August 2017 Unemployment Rate Seasonally Adjusted Unemployment Unemployment Unemployment 1 North Dakota 2.3 18 Maryland 3.9 36 New York 4.8 2 Colorado 2.4 18 Michigan 3.9 38 Delaware 4.9
Unemployment Rate (%) Rank State. Unemployment
 Rank State. Unemployment") States Ranked by March 2016 Unemployment Rate Seasonally Adjusted Unemployment Unemployment Unemployment 1 South Dakota 2.5 19 Delaware 4.4 37 Georgia 5.5 2 New Hampshire 2.6 19 Massachusetts 4.4 37 North
States Ranked by March 2016 Unemployment Rate Seasonally Adjusted Unemployment Unemployment Unemployment 1 South Dakota 2.5 19 Delaware 4.4 37 Georgia 5.5 2 New Hampshire 2.6 19 Massachusetts 4.4 37 North
Unemployment Rate (%) Rank State. Unemployment
 Rank State. Unemployment") States Ranked by September 2017 Unemployment Rate Seasonally Adjusted Unemployment Unemployment Unemployment 1 North Dakota 2.4 17 Indiana 3.8 36 New Jersey 4.7 2 Colorado 2.5 17 Kansas 3.8 38 Pennsylvania
States Ranked by September 2017 Unemployment Rate Seasonally Adjusted Unemployment Unemployment Unemployment 1 North Dakota 2.4 17 Indiana 3.8 36 New Jersey 4.7 2 Colorado 2.5 17 Kansas 3.8 38 Pennsylvania
Unemployment Rate (%) Rank State. Unemployment
 Rank State. Unemployment") States Ranked by December 2017 Unemployment Rate Seasonally Adjusted Unemployment Unemployment Unemployment 1 Hawaii 2.0 16 South Dakota 3.5 37 Connecticut 4.6 2 New Hampshire 2.6 20 Arkansas 3.7 37 Delaware
States Ranked by December 2017 Unemployment Rate Seasonally Adjusted Unemployment Unemployment Unemployment 1 Hawaii 2.0 16 South Dakota 3.5 37 Connecticut 4.6 2 New Hampshire 2.6 20 Arkansas 3.7 37 Delaware
Unemployment Rate (%) Rank State. Unemployment
 Rank State. Unemployment") States Ranked by September 2015 Unemployment Rate Seasonally Adjusted Unemployment Unemployment Unemployment 1 North Dakota 2.8 17 Oklahoma 4.4 37 South Carolina 5.7 2 Nebraska 2.9 20 Indiana 4.5 37 Tennessee
States Ranked by September 2015 Unemployment Rate Seasonally Adjusted Unemployment Unemployment Unemployment 1 North Dakota 2.8 17 Oklahoma 4.4 37 South Carolina 5.7 2 Nebraska 2.9 20 Indiana 4.5 37 Tennessee
Unemployment Rate (%) Rank State. Unemployment
 Rank State. Unemployment") States Ranked by November 2014 Unemployment Rate Seasonally Adjusted Unemployment Unemployment Unemployment 1 North Dakota 2.7 19 Pennsylvania 5.1 35 New Mexico 6.4 2 Nebraska 3.1 20 Wisconsin 5.2 38 Connecticut
States Ranked by November 2014 Unemployment Rate Seasonally Adjusted Unemployment Unemployment Unemployment 1 North Dakota 2.7 19 Pennsylvania 5.1 35 New Mexico 6.4 2 Nebraska 3.1 20 Wisconsin 5.2 38 Connecticut
Unemployment Rate (%) Rank State. Unemployment
 Rank State. Unemployment") States Ranked by July 2018 Unemployment Rate Seasonally Adjusted Unemployment Unemployment Unemployment 1 Hawaii 2.1 19 Massachusetts 3.6 37 Kentucky 4.3 2 Iowa 2.6 19 South Carolina 3.6 37 Maryland 4.3
States Ranked by July 2018 Unemployment Rate Seasonally Adjusted Unemployment Unemployment Unemployment 1 Hawaii 2.1 19 Massachusetts 3.6 37 Kentucky 4.3 2 Iowa 2.6 19 South Carolina 3.6 37 Maryland 4.3
Online Job Demand Up 255,000 in December, The Conference Board Reports
 News Release For further information: Frank Tortorici (212) 339-0231 Gad Levanon (212) 339-0317 June Shelp (212) 339-0369 For Immediate Release 10:00 AM ET, Wednesday, January 6, 2010 Release #5397 Online
NSSE 2017 Selected Comparison Groups Ohio University
 NSSE 2017 Selected Groups IPEDS: 204857 About This Report Groups The NSSE Institutional Report displays core survey results for your students alongside those of three s. In May, your institution was invited
All-Time College Football. Attendance. All-Time NCAA Attendance. Annual Football Bowl Subdivision (FBS) Attendance. Annual Total NCAA Attendance
 Attendance. Annual Total NCAA Attendance") Attendance Records All-Time College Football Attendance... 2 All-Time NCAA Attendance... 2 Annual Conference Attendance Leaders... 3 Largest Regular-Season Crowds... 10 2012 Attendance... 11 Annual Team
Attendance Records All-Time College Football Attendance... 2 All-Time NCAA Attendance... 2 Annual Conference Attendance Leaders... 3 Largest Regular-Season Crowds... 10 2012 Attendance... 11 Annual Team
Estimated Economic Impacts of the Small Business Jobs and Tax Relief Act National Report
 Regional Economic Models, Inc. Estimated Economic Impacts of the Small Business Jobs and Tax Relief Act National Report Prepared by Frederick Treyz, CEO June 2012 The following is a summary of the Estimated
Fiscal Research Center
 January 2018 Georgia s Rankings Among the States: Budget, Taxes and Other Indicators ABOUT THE FISCAL RESEARCH CENTER Established in 1995, the (FRC) provides nonpartisan research, technical assistance
NATIONAL DEBATE TOURNAMENT
 NATIONAL DEBATE TOURNAMENT Fall 2017 Report Fall 2017 Report PREPARED BY Dr. Jim Hanson Climb the Mountain Speech & Debate Foundation Email: jim@climbthemountain.us Based on the tabroom.com Results Page
Transfers to Private and Out of State 4yr Colleges
 Date: Wed, 24 Jan 2007 10:07:24-0800 Subject: From: To: 2004-05 Transfers to Private and Out of State 4yr Colleges Adrew LaManque Brian Murphy, Judy Miner, Robert Griffin, Renee Augenstein Hi all, the
national assembly of state arts agencies
 STATE ARTS AGENCY GRANT MAKING AND FUNDING Each of America's 50 states and six jurisdictions has a government that works to make the cultural, civic, economic and educational benefits of the available
2016 NCSEA Structural Engineering Curriculum Survey
 2016 NCSEA Structural Engineering Curriculum Survey By Brent Perkins, P.E., S.E., NCSEA Basic Education Committee Chair The National Council of Structural Engineers Associations (NCSEA) is pleased to present
Online Job Demand Up 169,000 in August, The Conference Board Reports
 News Release For further information: Frank Tortorici (212) 339-0231 Gad Levanon (212) 339-0317 June Shelp (212) 339-0369 For Immediate Release 10:00 AM ET, Monday, August 31, 2009 Release #5362 Online
TENNESSEE TEXAS UTAH VERMONT VIRGINIA WASHINGTON WEST VIRGINIA WISCONSIN WYOMING ALABAMA ALASKA ARIZONA ARKANSAS
 ALABAMA ALASKA ARIZONA ARKANSAS CALIFORNIA COLORADO CONNECTICUT DELAWARE DISTRICT OF COLUMBIA FLORIDA GEORGIA GUAM MISSOURI MONTANA NEBRASKA NEVADA NEW HAMPSHIRE NEW JERSEY NEW MEXICO NEW YORK NORTH CAROLINA
Figure 10: Total State Spending Growth, ,
 26 Reason Foundation Part 3 Spending As with state revenue, there are various ways to look at state spending. Total state expenditures, obviously, encompass every dollar spent by state government, irrespective
Fiscal Research Center
 January 2017 Georgia s Rankings Among the States: Budget, Taxes and Other Indicators ABOUT THE FISCAL RESEARCH CENTER Established in 1995, the (FRC) provides nonpartisan research, technical assistance