Navigating the Facilities Woods- Peer Insights on Creating a Knowledge Base Map of Strategic Facilities Information
|
|
|
- Iris Phyllis Craig
- 5 years ago
- Views:
Transcription


 University of Southern Maine University of Toledo University of Vermont Upper Iowa University Utica College Vassar")
1 Navigating the Facilities Woods- Peer Insights on Creating a Knowledge Base Map of Strategic Facilities Information Illinois Community College Chief Financial Officers Fall 2011 Conference Date: August 18, 2011 Presented by: Thomas Huberty, Regional Account Executive University of Illinois at Urbana Champaign The University of Maine University of Maine at Augusta University of Maine at Farmington University of Maine at Machias University of Maine at Presque Isle University of Maine at Fort Kent University of Maryland University of Massachusetts Amherst University of Massachusetts Boston University of Massachusetts Dartmouth University of Massachusetts Lowell University of Michigan University of Minnesota University of Missouri University of Missouri - Kansas City University of Missouri - St. Louis University of New Hampshire University of New Haven University of Notre Dame University of Oregon University of Pennsylvania University of Portland University of Redlands The University of Rhode Island, Narragansett Bay The University of Rhode Island, Feinstein Providence The University of Rhode Island, Kingston University of Rochester University of San Diego University of San Francisco University of St. Thomas (TX) University of Southern Maine University of Toledo University of Vermont Upper Iowa University Utica College Vassar College Virginia Commonwealth University Virginia Department of General Services Wagner College Wellesley College Wesleyan University West Chester University of Pennsylvania West Virginia University Western Oregon University

2 Sightlines Profile Over 60 professionals in 6 offices serving institutions nationwide Descriptive text goes here Represents State System Represents Flagship Institutions* 10 year old company based in Guilford, CT Common vocabulary and consistent methodology 95% Annual retention rate Tracking $5.9 billion in operations budgets and $4.2 billion in capital projects Database of 23,500 buildings and 825 million GSF * Per U.S. Dept. of Education 2

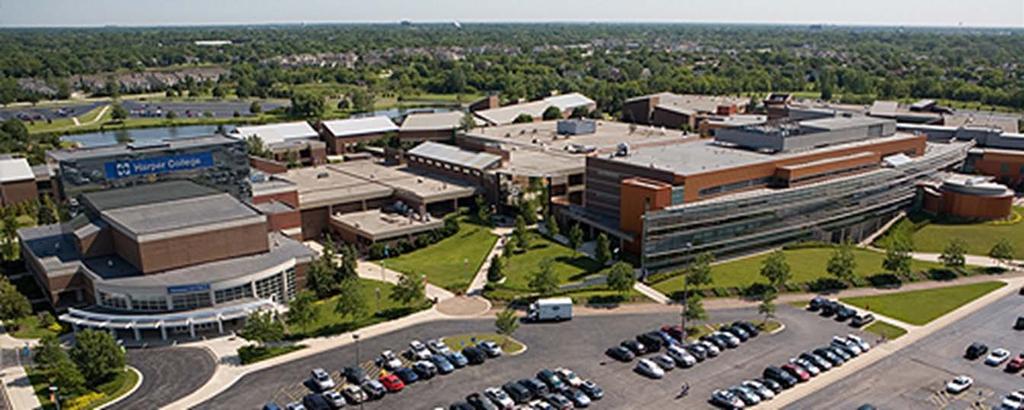
3 William Rainey Harper College Campus Profile Established: 1965 Opened: 1967 Location: Palatine, Illinois Named for Dr. William Rainey Harper, pioneer in the junior college movement and the first president of the University of Chicago. Enrollment: For Credit 26,441; Non-Credit 7,554 Campus employees: 1,260+ Campus facilities: 1.31M GSF; 24 buildings Acreage: 188 3

4 more bad news today
5 The facts of (facilities) life today Institutional operating budget are being cut Capital budgets have greater funding limitations Fewer gifts Challenged endowments Cuts to State funding Limited bonding capacity Mandates deeply challenge our decision making The big picture is globally true, but may be locally inaccurate
6 It s so tiring
7 Start with the data CFO s need to know Age profile of my buildings what s coming due, when? Factors that drive need past capital investment, program goals, space utilization Keep up need, annual stewardship investment Catch-up need, asset reinvestment/capital renewal How to use data to set targets to improve processes that result in effective campus facility operations and satisfied campus customers Using best practices to identify opportunities for savings, e.g. energy

8 Data is not enough you need policies and a plan Protecting physical assets involves setting policy for capital renewal. Strategic investment of capital will reduce backlog and make operations more proactive. Understand your capital financing options using portfolios of projects You will never get enough money to fix everything but all buildings do not need equal investment


9 Sightlines core objectives Identify ways to use capital more strategically and identify opportunities to improve operational effectiveness. Descriptive text goes here Separate fact from fiction on key issues operational performance, annual funding needs, and project backlogs. Educate campus to understand the implications and impacts of today s decisions on tomorrow s results. Documents trends, provide consistent measurement, and comparable benchmarking.
10 Protect the REAL prize The average endowment The average building replacement value
11 ROPA sm - A Strategic Planning Tool Return On Physical Assets Model Management Information for Impact Policy and Planning Value Creation Facilities Data Campus Profile Operational Data Operating Resources Capital Resources Service Profile Interrelationship between Capital and Operations Trends & Benchmarking Understanding: Risk Investment Balance Diversifying Resources Tying Output Expectations to Effectiveness Share Best Practices Opportunities for Resource Reallocation Performance Validation Planning & Modeling Make the Business Case for Resources Track Impact of Decisions and Changes
12 12

13 William Rainey Harper College History and Current Situation Lots of data, limited information and knowledge Historically minimal capital funding Current and future capital investments intended to renovate aging space and replacement of building systems Developed capital plan to manage assets through Achieved high customer satisfaction scores through operational efforts. 13


14 Comparison Institutions Institution Descriptive text goes here Bristol Community College Bunker Hill Community College Cincinnati State Technical and Community College Columbus State Community College Cuyahoga Community College - 3 Campuses Holyoke Community College Lakeland Community College Lorain County Community College Owens State Community College Quinsigamond Community College Sinclair Community College Location Fall River, MA Charlestown, MA Cincinnati, OH Columbus, OH Cuyahoga County, OH Holyoke, MA Kirtland, OH Elyria, OH Toledo, OH Worcester, MA Dayton, OH Comparative Considerations Size, Technical complexity, Density factor. 14


15 A vocabulary for measurement We Use Terms That Engage People Asset Value Change Operations Success The annual investment needed to ensure buildings will properly perform and reach their useful life. Keep-Up Costs Annual Stewardship The effectiveness of the facilities operating budget, staffing, supervision, and energy management The accumulated backlog of repair and modernization needs and the definition of resource capacity to correct them. Catch-Up Costs Asset Reinvestment The measure of service process, the maintenance quality of space and systems, and the customers opinion of service delivery Asset Reinvestment ROPA Radar Chart Annual Stewardship Service p Optimal Target Actual Operating Effectiveness Operations Effectiveness Service
16 KEY PHYSICAL PROFILE ATTRIBUTES 16
17 Campus Profile 24 Buildings 1.3M GSF 3.57 technical complexity Construction vs. Renovation Age 70% Descriptive text goes here 60% 63% % of Total Space 50% 55% 53% 40% 30% 30% 30% 29% 29% 29% 20% 19% 19% 10% 16% 13% 8% 9% 0% Less than to to 50 Over 50 Construction Age Renovation Age Peer Average Renovation Age Harper's Campus Age FY20 Stewardship Reinvestment 17


18 Density Factor Highly elevated totals create extreme demands on campus * Descriptive text goes here Community Colleges Urban Institutions Comprehensive Public Universities 250 or less Typical Private Liberal Arts Institutions Density Factor Affects: Wear & tear on buildings Daily cleaning demands within building Life cycles of building components *Density factor calculation does not include uses of space for community and auxiliary purposes. 18


19 Campus Technical Complexity Half of Harper s space has a technical rating of 4 or 5 % of Total Space 70% 60% 50% 40% 30% 20% 10% 0% Low Technical Complexity by % of Space Harper College Peer Institutions 38% 11% High
20 OPERATIONAL REVIEW 20


21 Facilities Operating Budget Above average operating budget driven by daily service needs The total day-to-day cost of running facilities The preventative work to protect facilities Summary: Slightly higher daily service costs vs. peers Utility costs are decreasing Opportunity to increase planned maintenance
22 Operations Overview Sufficient resources aid in effective operations Maintenance Maintenance HC FY10 Peers Staffing (GSF/FTE): 62,195 79,536 Supervision (FTE/Super): Materials ($/FTE): 22,628 10,218 General Repair (1-5): Underperforming In line Outperforming Custodial HC FY10 Peers In line Custodial Staffing (GSF/FTE): 19,916 29,377 Supervision (FTE/Super): Materials ($/FTE): 3,758 4,637 Cleanliness (1-5): Underperforming Outperforming Grounds HC FY10 Peers In line Grounds Staffing (Acres/FTE): Supervision (FTE/Super): Materials ($/FTE): 17,070 10,091 Grounds (1-5): Underperforming Outperforming


23 Excellent Service Process Results in Customer Satisfaction 94% of customers expectations are met My General Satisfaction With Physical Plant 6% 17% 42% 94% 35% Far Exceeds Expectations Exceeds Expectations Meets Expectations Is Below Expectations
24 CAPITAL INVESTMENT SUMMARY 24

25 Total Project Spending vs. Peers Historically, peers spend more than Harper; investment ramps up in 2010 Funding difference equivalent to: $1.8 Million per year


26 Total Project Spending Strong spending profile; recent emphasis on building systems Harper 5 Year Composite Spending Descriptive text goes here 11% 29% 25% 11% 24% Peer Avg. 5 Year Composite Spending 12% 17% 34% 29% 8% 26

27 AR Project Backlog Compared to Peers Harper s backlog comparable to peers; below CC database average Descriptive text goes here Community College Average Total Backlog $/GSF $ 119 Database Average $ 75 27
28 FUTURE INVESTMENT GOALS 28


29 Defining the Stewardship Investment Target Setting goals to arrest the rate of facility depreciation Industry Standard $16 FY 2010 Annual Stewardship Target Annual Stewardship Target Projections $14 $12 Target = 75% Envelope/Mechanical + 35% Space/Programming $ in Millions $10 $8 $15.1 $8.7 $4.5 $5.0 $6 $3.0 $4 $6.2 $5.9 $2 $4.6 $7.6 $- $14.9M 3% Replacement Value Life Cycle Need Annual Stewardship Target $7.6M $10.4M $12.6M FY 2015 Target FY 2020 Target Lifecycle 33.3 Years 34.5 Years 66.6 Years % of Replacement 3% 2.9% 1.5%

 Asset Reinvestment (Master planning renovation schedules) *Does not include $54M in pending state funding.")
30 10-Year Capital Investment Plan Strong five year investment plan; backlog is expected to grow in out years $ in Millions $44.0 $42.0 $40.0 $38.0 $36.0 $34.0 $32.0 $30.0 $28.0 $26.0 $24.0 $22.0 $20.0 $18.0 $16.0 $14.0 $12.0 $10.0 $8.0 $6.0 $4.0 $2.0 $0.0 Total investment plan: $ Increasing Asset Value Stabilizing Asset Value Declining Asset Value FY2006 FY2007 FY2008 FY2009 FY2010 FY2011 FY2012 FY2013 FY2014 FY2015 FY2016 FY2017 FY2018 FY2019 FY2020 Annual Stewardship (Annual Maintenance) Asset Reinvestment (Master planning renovation schedules) *Does not include $54M in pending state funding. *Does not include master planning projects in the "Other Priority Work category. *Does not include investments into new space and building additions.
31 10-Year Capital Investment Plan w/ State Support Plan consistently funds in or above target zone; long-term backlog stabilized $ in Millions $44.0 $42.0 $40.0 $38.0 $36.0 $34.0 $32.0 $30.0 $28.0 $26.0 $24.0 $22.0 $20.0 $18.0 $16.0 $14.0 $12.0 $10.0 $8.0 $6.0 $4.0 $2.0 $0.0 Total investment plan: $ Increasing Asset Value Stabilizing Asset Value Declining Asset Value FY2006 FY2007 FY2008 FY2009 FY2010 FY2011 FY2012 FY2013 FY2014 FY2015 FY2016 FY2017 FY2018 FY2019 FY2020 Annual Stewardship (Annual Maintenance) Asset Reinvestment (Master planning renovation schedules) State Support *Includes approx. $54M in pending state funding. *Does not include master planning projects in the "Other Priority Work category. *Does not include investments into new space and building additions.

32 Where have we been, where are we going? Historical lack of capital investment disabled keep up of needs as they came due. Recognized the increase in demand for space improvements. Formalized backlog study to make project selection and strategic planning more efficient. Promoted a culture of Measure, Manage, Maximize. Maintained a high level of operational performance through increasing daily service costs. 34
33 The facts of (facilities) life today Institutional operating budget are being cut Capital budgets have greater funding limitations Fewer gifts Challenged endowments Cuts to State funding Limited bonding capacity Mandates deeply challenge our decision making The big picture is globally true, but may be locally inaccurate

34 Don t look now
35 #1 Campuses are getting older 40% (%) Square Footage over 50 years old 35% 30% 25% 20%

36 Observations on Community Colleges Campus Age Community Colleges have older campuses than 4 year institutions 38
37 #2 New buildings are more complex Technical Complexity Under to to 50 Over 50 Age Category

38 #3 Staff has not adjusted with campus buildings

39 #4 Campuses are getting busier

40 Observations on Community Colleges Density Factor Community colleges are more than 3 times busier than 4 year institutions 42

41 #5 Backlog of needs are increasing Total Backlog $/GSF

42 Observations on community colleges Deferred Maintenance Backlog Community colleges have more deferred maintenance than 4 year institutions 44

43 #6 Capital investment reduced in FY10 Reduction after 4 years of increases reflects economic downturn Capital Investment in Existing Space - $/GSF

44 What to Do? You can wait until

45 the roof caves in

46 Or you can build a bridge and get over it

47 It s so tiring
 682-4981 Additional Learning and Networking Events Top 4 takeaways from the Campus Champion Tour: Five invisible factors impacting")

48 Questions & Discussion Thomas Huberty Regional Account Executive (203) Additional Learning and Networking Events Top 4 takeaways from the Campus Champion Tour: Five invisible factors impacting your budget and how to use them to fight back Proven methods for managing your backlog, including project selection and management strategies Best practices for reducing utility budget risk Concrete strategies and tactics for doing more with less Upcoming Event Dates Minneapolis, MN Oct 25 th Chicago, IL Oct 27 th 50
Sightlines LLC FY11 Facilities MB&A Presentation New Mexico State University. Date: May 11, 2012 Presented by: Peter Reeves and Sheena Salsberry
 Sightlines LLC FY11 Facilities MB&A Presentation New Mexico State University Date: May 11, 2012 Presented by: Peter Reeves and Sheena Salsberry University of Illinois at Urbana-Champaign The University
Sightlines LLC FY10 Facilities MB&A Presentation Wesleyan University
 Sightlines LLC FY10 Facilities MB&A Presentation ti Wesleyan University Date : April 13, 2011 Presented by: Peter Reeves University of Illinois at Urbana Champaign The University of Maine University of
Sightlines LLC FY11 Final Presentation Champlain College
 Sightlines LLC FY11 Final Presentation Champlain College Date: February 14, 2012 Presented by: Jeff Murphy and Josh Vidro University of Hartford University of Idaho University of Illinois at Chicago University
Oregon State University E&G. Presenters: Peter Reeves & Chad Hancock June 2017
 Oregon State University E&G Presenters: Peter Reeves & Chad Hancock June 2017 University of Nebraska Medical Center University of Nebraska Omaha University of New Brunswick University of New Hampshire
ROPA+ Presentation. State University System of Florida. October 2017 Presenters: Kevan Will & Mike Sabol
 State University System of Florida ROPA+ Presentation October 2017 Presenters: Kevan Will & Mike Sabol University of Southern University of Southern Maine University of St. Thomas University of Tennessee,
Washington Public Universities
 Washington Public Universities FY17 Facilities Benchmarking and Analysis May 2018 Gabby Rosas, Michael Kvalvik, Tony Cesano University of Southern University of Southern Maine University of St. Thomas
University of Tennessee
 15 May 2013 Virginia State University Wagner College Washburn University Wellesley College Wesleyan University West Chester University of Pennsylvania West Virginia Health Sciences Center West Virginia
Worcester State University
 Worcester State University FY17 Building Portfolios Results Presented by: Jordan Morris September 2018 University of Southern University of Southern Maine University of St. Thomas University of Tennessee,
The University of Toledo Campus Presentation June, 2010
 The University of Toledo Campus Presentation June, 2010 Commissioned by The Ohio Board of Regents Technical Complexity Age of Space Peer Review Project Spending Deferred Maintenance Opera'ng Budget Impression
Travel Impact Report
 Travel Impact Report FALL 216 216 FALL TRAVEL GOALS For the Fall 216 recruitment season, Admission team members committed to: Expand Miami s reach in primary, secondary, tertiary, and emerging markets
DOCTORAL/RESEARCH INSTITUTIONS RECEIVING FULBRIGHT AWARDS FOR
 DOCTORAL/RESEARCH INSTITUTIONS RECEIVING FULBRIGHT AWARDS FOR 2015-2016 Those institutions highlighted in blue are listed in the Chronicle of Higher Education Institution State Grants Applications Harvard
Universities That Accept ASL In Fulfillment Of Foreign Language Requirements
 Universities That Accept ASL In Fulfillment Of Foreign Language Requirements List maintained by Sherman Wilcox, Ph.D. University of New Mexico PLEASE NOTE: This list is for colleges and universities that
for new england residents
 new england board of higher education s for new england residents Annual report on the benefit of the Regional Student Program (RSP) to the participating residents and state colleges and universities in
Working with Gift Funds
 Working with Gift Funds Robert W. Groves Vice President Sarah Blanck Director, Finance & Endowments Slide 1 University Advancement Bob Groves Vice President University Advancement Scott Westerman Assoc.
U.S. Psychology. Departments
 Table of Contents Department Ratings Links Home U.S. Psychology Distinguished Strong Good Departments This page ranks United States doctoral programs in psychology based on the 1995 study conducted by
NSSE 2017 Selected Comparison Groups Ohio University
 NSSE 2017 Selected Groups IPEDS: 204857 About This Report Groups The NSSE Institutional Report displays core survey results for your students alongside those of three s. In May, your institution was invited
College Profiles - Navy/Marine ROTC
 Page 1 of 6 The U.S. Navy and Marine Corps are a team that provides for our national defense. The men and women who serve are called on to provide support at sea, in the air and on land. The Navy-Marine
Illinois Higher Education Executive Compensation Analysis
 Illinois Higher Education Executive Analysis July 2015 Illinois Board of Higher Education Notes on sources and methods: The peer information used in this analysis was obtained from the Chronicle of Higher
UNIVERSITY OF MASSACHUSETTS Amherst Boston Dartmouth Lowell Medical School. Fiscal Year 2017 to 2021 Five-Year Capital Plan September 2016
 UNIVERSITY OF MASSACHUSETTS Amherst Boston Dartmouth Lowell Medical School Fiscal Year 2017 to 2021 Five-Year Capital Plan TABLE OF CONTENTS I. Introduction II. III. IV. Brief History of Capital Investments
Table 2 Overall Heterodox-Adjusted Rankings for Ph.D.-Granting Institutions in Economics
 ing Economics Departments in a Contested Discipline 23 Heterodox-Adjusted ings for Ph.D.-Granting Institutions in Economics ) ) Harvard U 43 1 (1) 5.47 1 (1) UC Berkeley 56 2 (2) 4.08 4 (4) Princeton U
Sears Directors' Cup Final Standings
 1 Stanford 662.5 5 59.5 2 63.0 4 61.0 3 61.5 1 64.0 57 0.0 54 0.0 971.5 2 North Carolina 565.0 53.0 17 44.5 19 46.0 8 57.0 41 17.5 16 0.0 7 58.0 9 54.5 789.5 3 UCLA 485.5 118.0 7 58.0 1 64.0 5 58.5 3 61.5
President Dennis Assanis
 President Dennis Assanis Strategic Planning Where are we now? Where do we want to go? Identify peer institutions for comparison current and aspirational Articulate shared vision and identify cross-cutting
Domestic Student Recruiting Strategies
 Domestic Student Recruiting Strategies Jim Sherwood Associate Dean for Graduate Studies University of Massachusetts Lowell The Chicago Conference for Associate Deans of Research at Small and Mid-Sized
2017 invitation to participate. register by july 14, 2017 at snaap.indiana.edu. Final Year of current 3-year survey cycle*
 Final Year of current 3-year survey cycle* 2017 invitation to participate register by july 14, 2017 at snaap.indiana.edu *See page 5 for more information About SNAAP What is the value of an arts degree?
TROJAN SEXUAL HEALTH REPORT CARD. The Annual Rankings of Sexual Health Resources at American Colleges and Universities. TrojanBrands.
 TROJAN SEXUAL HEALTH The Annual Rankings of Sexual Health Resources at American Colleges and Universities PRESENTED BY TOP 10 1 UNIVERSITY OF GEORGIA 2 OREGON STATE UNIVERSITY 3 UNIVERSITY OF MICHIGAN
The Conference Board Reports Online Job Demand Drops 507,000 in December
 News Release For further information: Frank Tortorici (212) 339-0231 Gad Levanon (212) 339-0317 June Shelp (212) 339-0369 For Immediate Release 10:00 AM ET, Wednesday, January 7, 2009 The Conference Board
Figure 10: Total State Spending Growth, ,
 26 Reason Foundation Part 3 Spending As with state revenue, there are various ways to look at state spending. Total state expenditures, obviously, encompass every dollar spent by state government, irrespective
Tuition, Fees, and Room & Board Rates Academic Year
 Tuition, Fees, and Room & Board Rates Academic Year 2018-2019 Presentation to the Board of Trustees January 18, 2018 TUITION GOAL: Protect access and affordability, while sustaining academic quality and
Colorado River Basin. Source: U.S. Department of the Interior, Bureau of Reclamation
 The Colorado River supports a quarter million jobs and produces $26 billion in economic output from recreational activities alone, drawing revenue from the 5.36 million adults who use the Colorado River
TENNESSEE TEXAS UTAH VERMONT VIRGINIA WASHINGTON WEST VIRGINIA WISCONSIN WYOMING ALABAMA ALASKA ARIZONA ARKANSAS
 ALABAMA ALASKA ARIZONA ARKANSAS CALIFORNIA COLORADO CONNECTICUT DELAWARE DISTRICT OF COLUMBIA FLORIDA GEORGIA GUAM MISSOURI MONTANA NEBRASKA NEVADA NEW HAMPSHIRE NEW JERSEY NEW MEXICO NEW YORK NORTH CAROLINA
US News and World Report Rankings Graduate Economics Programs Ranked in 2001
 The following list reports the rankings done in 1995 by William H. Kaempfer and Chao Jing of the University of Colorado at Boulder. Their list compiles six earlier studies into an aggregate ranking. Rankings
Tax Year 2017 CCH e-file QuickLook
 Federal 1040, 1040NR 1065, 1065-B 1120 (1), 1120-F 1120S 1041 Federal Amended Federal Consolidated 990, 990-EZ, 990-PF, 990-N Federal Estimated Taxes 990-PF Federal Extension 990, 990-EZ, 990-PF (2), 990-T
University of Maryland-Baltimore County
 Selected Comparison Groups August 2008 Reviewing Your NSSE 2008 Selected Comparison Groups Report NSSE participants are able to customize their Institutional Reports by tailoring up to three comparison
PLTW Professional Development. Getting Ready for the Core Training Season
 PLTW Professional Development Getting Ready for the 2018-19 Core Training Season At Project Lead The Way (PLTW), our mission empowering students to thrive in an evolving world drives our actions. One of
DataArts and the New CDP
 DataArts and the New CDP October 26, 2016 PRESENTED BY Mary Garcia Charumilind Senior Business Development Associate Overview Agenda Agenda 1 2 3 4 5 About DataArts The DataArts Platform The New Cultural
Rutgers Revenue Sources
 Rutgers Revenue Sources 31.2% Tuition and Fees 27.3% State Appropriations with Fringes 1.0% Endowment and Investments.5% Federal Appropriations 17.8% Federal, State, and Municipal Grants and Contracts
Presenters: Dan Willman and Josh Vidro November 2016
 Champlain College Presenters: Dan Willman and Josh Vidro November 216 University of St. Thomas University of Tennessee Health Science Center University of Tennessee, Knoxville University of Texas at Dallas
Online Job Demand Up 255,000 in December, The Conference Board Reports
 News Release For further information: Frank Tortorici (212) 339-0231 Gad Levanon (212) 339-0317 June Shelp (212) 339-0369 For Immediate Release 10:00 AM ET, Wednesday, January 6, 2010 Release #5397 Online
Online Job Demand Up 169,000 in August, The Conference Board Reports
 News Release For further information: Frank Tortorici (212) 339-0231 Gad Levanon (212) 339-0317 June Shelp (212) 339-0369 For Immediate Release 10:00 AM ET, Monday, August 31, 2009 Release #5362 Online
Fiscal Year Tuition and Fee Comparisons for UNC Peer Institutions
 Fee Comparisons and 1 California State University at Fresno $2,933 $13,103 2 California State University at Chico $3,370 $13,540 3 Appalachian State University $3,436 $13,178 4 Georgia Southern University
NSTC COMPETITIVE AREA DEFINITIONS. UIC Naval Service Training Command (NSTC), Great Lakes, IL
, Great Lakes, IL") NSTC COMPETITIVE AREA DEFINITIONS UIC 00210 Naval Service Training Command (NSTC), Great Lakes, IL UIC 00210 NSTC, N8, Pensacola, FL UIC 0763A Recruit Training Command, Great Lakes, IL NSTC Pensacola Programs,
NSTC COMPETITIVE AREA DEFINITIONS UIC 00210 Naval Service Training Command (NSTC), Great Lakes, IL UIC 00210 NSTC, N8, Pensacola, FL UIC 0763A Recruit Training Command, Great Lakes, IL NSTC Pensacola Programs,
Online Job Demand Down 83,200 in October, The Conference Board Reports
 News Release For further information: Frank Tortorici (212) 339-0231 Gad Levanon (212) 339-0317 June Shelp (212) 339-0369 For Immediate Release 10:00 AM ET, Monday, November 2, 2009 Release #5378 Online
National Bureau for Academic Accreditation And Education Quality Assurance ACTUARIAL SCIENCE
 1 ABILENE CHRISTIAN ABILENE TX B 2 APPALACHIAN STATE BOONE NC B 3 ARIZONA STATE - TEMPE TEMPE AZ B 4 BAYLOR WACO TX B 5 BENTLEY ^ WALTHAM MA B 6 BOSTON ^ BOSTON MA M 7 BOWLING GREEN STATE BOWLING GREEN
The following Final Actions were taken by the CCNE Board of Commissioners at its meeting on April 28-30, 2015.
 The following Final Actions were taken by the CCNE Board of Commissioners at its meeting on April 28-30, 2015. UPDATED - June 11, 2015 Initial Accreditation Accredited Program(s) Abilene Christian University
UNH NEACAC CF American College Dublin American International College American University Anna Maria College Assumption College Bard College Bay Path
 UNH NEACAC CF American College Dublin American International College American University Anna Maria College Assumption College Bard College Bay Path University Becker College Bennington College Bishop's
REPORT ON THE STATUS OF FACULTY SALARIES AT KANSAS STATE UNIVERSITY
 Attachment 1 REPORT ON THE STATUS OF FACULTY SALARIES AT KANSAS STATE UNIVERSITY Prepared by the Office of Planning & Analysis June 2009 Staff: Kelli Cox, Director Nancy Baker, Computer Information Specialist
Online Job Demand Up 106,500 in November, The Conference Board Reports
 News Release For further information: Frank Tortorici (212) 339-0231 Gad Levanon (212) 339-0317 June Shelp (212) 339-0369 For Immediate Release 10:00 AM ET, Wednesday, December 2, 2009 Release #5390 Online
Use of Medicaid MCO Capitation by State Projections for 2016
 Use of Medicaid MCO Capitation by State Projections for 5 Slide Series September, 2015 Summary of Findings This edition projects Medicaid spending in each state and the percentage of spending paid via
CILogon & InCommon & Federated Identity. Jim Basney
 CILogon & InCommon & Federated Identity Jim Basney Federated Identity Federated Identity for R&E geni.net opensciencedatacloud.org Federated Identity for R&E dmptool.org Federated
STATE ENTREPRENEURSHIP INDEX
 University of Nebraska - Lincoln DigitalCommons@University of Nebraska - Lincoln Business in Nebraska Bureau of Business Research 12-2013 STATE ENTREPRENEURSHIP INDEX Eric Thompson University of Nebraska-Lincoln,
Digitization and Aggregation Enabling a Print Network
 HATHITRUST DIGITAL LIBRARY Digitization and Aggregation Enabling a Print Network Mike Furlough Executive Director, HathiTrust 15 August 2016 2016 IFLA World Library and Information Congress Columbus, OH
For further information: Carol Courter / Release #5985. Online Job Ads Increased 137,100 in November
 News Release Follow The Conference Board For further information: Carol Courter 212-339-0232 / courter@conference-board.org Release #5985 For Immediate Release 10:00 AM ET, Wednesday, December 6, 2017
For further information: Carol Courter / Release #5990. Online Job Ads Increased 229,700 in December
 News Release Follow The Conference Board For further information: Carol Courter 212-339-0232 / courter@conference-board.org Release #5990 For Immediate Release 10:00 AM ET, Wednesday, January 3, 2018 Online
WHERE THE CLASS OF 2014 ATTENDS COLLEGE
 WHERE THE CLASS OF 2014 ATTENDS COLLEGE Albany College of Pharmacy (1) Albright College (1) American University (6) Arizona State University (1) Auburn University (2) Bard College (1) Bentley University
Dashboard. Campaign for Action. Welcome to the Future of Nursing:
 Welcome to the Future of Nursing: Campaign for Action Dashboard About This Dashboard: These graphs and charts show goals by which the Campaign evaluates its efforts to implement recommendations in the
The Regional Economic Outlook
 The Regional Economic Outlook Presented by: Mark McMullen, Director of Government Svcs Prepared for: FTA Revenue Estimating Conference September 15, 2008 Recent Economic Performance 2 1 The Job Market
Rankings of the States 2017 and Estimates of School Statistics 2018
 Rankings of the States 2017 and Estimates of School Statistics 2018 NEA RESEARCH April 2018 Reproduction: No part of this report may be reproduced in any form without permission from NEA Research, except
 3+ 3+ N = 155, 442 3+ R 2 =.32 < < < 3+ N = 149, 685 3+ R 2 =.27 < < < 3+ N = 99, 752 3+ R 2 =.4 < < < 3+ N = 98, 887 3+ R 2 =.6 < < < 3+ N = 52, 624 3+ R 2 =.28 < < < 3+ N = 36, 281 3+ R 2 =.5 < < < 7+
HOME HEALTH AIDE TRAINING REQUIREMENTS, DECEMBER 2016
 BACKGROUND HOME HEALTH AIDE TRAINING REQUIREMENTS, DECEMBER 2016 Federal legislation (42 CFR 484.36) requires that Medicare-certified home health agencies employ home health aides who are trained and evaluated
FEDERAL R&D FUNDING BY STATE
 SOCIAL & BEHAVIORAL SCIENCE FEDERAL R&D FUNDING BY STATE 2017 /resources/state-fact-sheets TABLE OF CONTENTS State Total Social Science R&D Page Why Social Science? 3 Alabama $13.5 million 4 Alaska $2.4
Saudi Government Scholarship Program - USA. Statistical Presentation For Student Enrollment in US Universities As of February 2007
 Saudi Government Scholarship Program - USA Statistical Presentation For Student Enrollment in US Universities As of February 2007 Distribution of Saudi Students by Region & Institution Number of Saudi
FDP Expanded Clearinghouse Participants (as of February 8, 2018)
") Arizona State University Augusta University Research Institute, Inc. Ball State University Beckman Research Institute of the City of Hope Boston College Boston University (Charles River Campus) Boston
Arizona State University Augusta University Research Institute, Inc. Ball State University Beckman Research Institute of the City of Hope Boston College Boston University (Charles River Campus) Boston
DASHBOARD INDICATORS UNIVERSITY OF ILLINOIS URBANA-CHAMPAIGN CHICAGO SPRINGFIELD
 DASHBOARD INDICATORS UNIVERSITY OF ILLINOIS URBANA-CHAMPAIGN CHICAGO SPRINGFIELD Presentation to BOARD OF TRUSTEES January 18, 2012 Strategic Priorities Student Access and Enrollment Student Outcomes Tuition
THE COLLEGE OF WILLIAM & MARY
 THE COLLEGE OF WILLIAM & MARY Presentation Material Committee on Financial Affairs Board of Visitors November 19, 2008 Commonwealth of Virginia Budget Reduction Actions General fund appropriations placed
CONNECTICUT: ECONOMIC FUTURE WITH EDUCATIONAL REFORM
 CONNECTICUT: ECONOMIC FUTURE WITH EDUCATIONAL REFORM This file contains detailed projections and information from the article: Eric A. Hanushek, Jens Ruhose, and Ludger Woessmann, It pays to improve school
FY 2014 Per Capita Federal Spending on Major Grant Programs Curtis Smith, Nick Jacobs, and Trinity Tomsic
 Special Analysis 15-03, June 18, 2015 FY 2014 Per Capita Federal Spending on Major Grant Programs Curtis Smith, Nick Jacobs, and Trinity Tomsic 202-624-8577 ttomsic@ffis.org Summary Per capita federal
For further information: Carol Courter / Release #5952. Online Job Ads Increased 195,600 in May
 News Release Follow The Conference Board For further information: Carol Courter 212-339-0232 / courter@conference-board.org Release #5952 For Immediate Release 10:00 AM ET, Wednesday, May 31, 2017 Online
Initial (one-time) Membership Fee 10,000 Renewal Fee (every 8 years) $3500
 Membership Fee 10,000 Renewal Fee (every 8 years) $3500") November 25, 2013 UCAR Membership Fees Process and Schedule Fee assessment process: 1. UCAR Members vote at the Annual Meeting to approve new or renewing applications for UCAR membership. 2. After the
November 25, 2013 UCAR Membership Fees Process and Schedule Fee assessment process: 1. UCAR Members vote at the Annual Meeting to approve new or renewing applications for UCAR membership. 2. After the
Arizona State Funding Project: Addressing the Teacher Labor Market Challenge Executive Summary. Research conducted by Education Resource Strategies
 Arizona State Funding Project: Addressing the Teacher Labor Market Challenge Executive Summary Research conducted by Education Resource Strategies Key findings 1. Student outcomes in Arizona lag behind
For further information: Carol Courter / Release #5996. Online Job Ads Increased 1,200 in January
 News Release Follow The Conference Board For further information: Carol Courter 212-339-0232 / courter@conference-board.org Release #5996 For Immediate Release 10:00 AM ET, Wednesday, January 31, 2018
For further information: Carol Courter / Release #5980. Online Job Ads Increased 81,500 in October
 News Release Follow The Conference Board For further information: Carol Courter 212-339-0232 / courter@conference-board.org Release #5980 For Immediate Release 10:00 AM ET, Wednesday, November 1, 2017
Revenues, Expenses, and Operating Profits of U. S. Lotteries, FY 2002
 Revenues, Expenses, and Operating Profits of U. S. Lotteries, APPENDIX A Table A.1: Lottery Sales Excluding Sales From Video Lottery Terminals, Table A.2: Sales from Video Lottery Terminals Table A.3:
ARL SUPPLEMENTARY STATISTICS A COMPILATION OF STATISTICS FROM THE MEMBERS OF THE ASSOCIATION OF RESEARCH LIBRARIES
 ARL SUPPLEMENTARY STATISTICS 1997-98 A COMPILATION OF STATISTICS FROM THE MEMBERS OF THE ASSOCIATION OF RESEARCH LIBRARIES TABLE OF CONTENTS Table 1. Summary Statistics for University Libraries...4 Table
COLLEGE ACCEPTANCES: CLASSES
 COLLEGE ACCEPTANCES: CLASSES 2012 2017 In the past six years, graduates of Boston University Academy have been accepted to the following colleges and universities. The number of BUA students from these
For further information: Carol Courter / Release #5967. Online Job Ads Decreased 125,900 in August
 News Release Follow The Conference Board For further information: Carol Courter 212-339-0232 / courter@conference-board.org Release #5967 For Immediate Release 10:00 AM ET, Wednesday, August 30, 2017 Online
For further information: Carol Courter / Release #6029. Online Job Ads Increased 170,800 in July
 News Release Follow The Conference Board For further information: Carol Courter 212-339-0232 / courter@conference-board.org Release #6029 For Immediate Release 10:00 AM ET, Wednesday, August 1, 2018 Online
For further information: Carol Courter / Release #5963. Online Job Ads Decreased 157,700 in July
 News Release Follow The Conference Board For further information: Carol Courter 212-339-0232 / courter@conference-board.org Release #5963 For Immediate Release 10:00 AM ET, Wednesday, August 2, 2017 Online
HathiTrust Shared Print Program Report to PAN Meeting 6/23/2017. Lizanne Payne Shared Print Program Officer
 HathiTrust Shared Print Program Report to PAN Meeting 6/23/2017 Lizanne Payne Shared Print Program Officer elpayne@hathitrust.org Key Attributes of the HathiTrust Shared Print Program Secure retention
CHAPTER CHAPTER DUES CANDIDATE & NEW REGULAR RETIRED DESIGNEE DUES
 Listed below are the chapter dues associated with each member type. Chapter dues pricing is set by each chapter and is subject to change. CHAPTER CHAPTER DUES CANDIDATE & NEW REGULAR RETIRED Alabama Central
For further information: Carol Courter / Release #5486
 News Release Follow The Conference Board For further information: Carol Courter 212 339-0232 / courter@conference-board.org Release #5486 For Immediate Release 10:00 AM ET, Monday January 31, 2011 Online
Colleges/Universities with Exercise Science/Kinesiology-related Graduate Programs
 Colleges/Universities with Exercise Science/Kinesiology-related Graduate Programs (If you know of a college/university not on this list, please contact the CSCCa National Office to have it added.) ALABAMA
National Student Exchange
 National Student Exchange About This Summary Advising Summary For 2012-2013 Placements The following information should be helpful as you assist your students to make appropriate campus choices for exchange
For further information: Carol Courter / Release #5916
 News Release Follow The Conference Board For further information: Carol Courter 212-339-0232 / courter@conference-board.org Release #5916 For Immediate Release 2:00 PM ET, Monday, November 7, 2016 Online
KEY FACTS ON COMMUNITY FOUNDATIONS
 May 2009 KEY FACTS ON COMMUNITY FOUNDATIONS Outlook for Foundation Giving foundations account for 1 percent of all U.S. grantmaking foundations but about 10 percent of giving. Despite the worsening economic
APPROVED NURSING RESEARCH COURSES FOR APRN PROGRAM
 APPROVED NURSING RESEARCH COURSES FOR APRN PROGRAM Institution Course Andrews University NRSG 445 Arizona State University NUR 315 Augusta University NURS 3807 Azusa Pacific University UNRS 425 or UNRS
Washburn University. Faculty Salary Analysis
 Washburn University Faculty Salary Analysis 2012-13 Office of Institutional Research Washburn University May 15, 2013 Washburn University Faculty Salary Analysis 2012-13 This report provides an overview
IU Bloomington Peer Retention & Graduation Rate Comparisons
 IU Bloomington Peer Retention & Graduation Rate Comparisons Northwestern U. 98% 97% 97% U. of Michigan Ann Arbor 97% 97% 97% U. of California Berkeley 96% 96% 96% U. of Wisconsin Madison 95% 95% 96% The
Sun Mon Tue Wed Thu Fri Sat Virginia Tech. 13 San Diego State Miami (OH) Indiana University Texas Christian University Penn State
 Indiana University Texas Christian University Penn State") Beacon Hill Staffing Group Campus Calendar 2017 (***For a complete alphabetized list of campus visits, please scroll to the end of the calendar) September * denotes on-campus interviews scheduled for that
Beacon Hill Staffing Group Campus Calendar 2017 (***For a complete alphabetized list of campus visits, please scroll to the end of the calendar) September * denotes on-campus interviews scheduled for that
University Centers for Excellence in Developmental Disabilities. Organizational Charts
 University Centers for Excellence in Developmental Disabilities Organizational Charts November 2011 Centers Attached to University Administrative Offices, such as the President, Vice President, Provost,
Student Tuition & Fees
 2005-06 Student Tuition & Fees UK Achievements Since 2000: Enrollment has increased by 2,693 students (11.3%). First-year student class increased by 1,033 students (35%). Governor s Scholars and Governor
National Bureau for Academic Accreditation And Education Quality Assurance
 1 ARKANSAS STATE UNIVERSITY - JONESBORO STATE UNIV. AR B 2 BALL STATE UNIVERSITY MUNCIE IN BM 3 BOSTON UNIVERSITY ^ BOSTON MA BM 4 BRIGHAM YOUNG UNIVERSITY PROVO UT B 5 CALIFORNIA STATE UNIVERSITY - FULLERTON
For further information: Carol Courter / Release #5942. Online Job Ads Increased 102,000 in March
 News Release Follow The Conference Board For further information: Carol Courter 212-339-0232 / courter@conference-board.org Release #5942 For Immediate Release 10:00 AM ET, Wednesday, April 5, 2017 Online
For further information: Frank Tortorici: / board.org Release #5458
 News Release Follow The Conference Board For further information: Frank Tortorici: 212 339 0231 / f.tortorici@conference board.org Release #5458 For Immediate Release 10:00 AM ET, Wednesday, September
2013 U. of Iowa 86% 85% 87% 2014 U. of Colorado Boulder 84% 86% 86% U. of Nebraska Lincoln 84% 83% 82%
 IU Bloomington Peer Retention & Graduation Rate Comparisons Northwestern U. 97% 97% 98% U. of Michigan Ann Arbor 97% 97% 97% U. of California Berkeley 96% 96% 97% University of Maryland College Park 96%
NSSE 2013 Selected Comparison Groups
 NSSE 2013 Selected Groups IPEDS: 170082 Customized Groups NSSE 2013 Selected Groups Interpreting Your Report The NSSE Institutional Report displays core survey results for your students alongside those
For further information: Carol Courter / Release #6016. Online Job Ads Decreased 69,300 in April
 News Release Follow The Conference Board For further information: Carol Courter 212-339-0232 / courter@conference-board.org Release #6016 For Immediate Release 10:00 AM ET, Wednesday, May 2, 2018 Online
ON THE GLOBAL, REGIONAL & LOCAL ECONOMIC CLIMATE
 ON THE GLOBAL, REGIONAL & LOCAL ECONOMIC CLIMATE ARC Regional Leadership Institute Roger Tutterow, Ph.D. Professor of Economics Mercer University Tutterow_RC@Mercer.edu Saint Simons Island, GA September
Columbus Survey 2010 Results: Guideposts Point to Growth
 SHARING KNOWLEDGE. GROWING IMPACT. MAY 2011 Columbus Survey 2010 Results: Guideposts Point to Growth TRENDS ACROSS THE COMMUNITY FOUNDATION FIELD SNAPSHOT OF 2010 With this report, CF Insights aim is to
Current Medicare Advantage Enrollment Penetration: State and County-Level Tabulations
 Current Advantage Enrollment : State and County-Level Tabulations 5 Slide Series, Volume 40 September 2016 Summary of Tabulations and Findings As of September 2016, 17.9 million of the nation s 56.1 million
Unemployment Rate (%) Rank State. Unemployment
 Rank State. Unemployment") States Ranked by February 2018 Unemployment Rate Seasonally Adjusted Unemployment Unemployment Unemployment 1 Hawaii 2.1 19 Alabama 3.7 33 Ohio 4.5 2 New Hampshire 2.6 19 Missouri 3.7 33 Rhode Island 4.5
States Ranked by February 2018 Unemployment Rate Seasonally Adjusted Unemployment Unemployment Unemployment 1 Hawaii 2.1 19 Alabama 3.7 33 Ohio 4.5 2 New Hampshire 2.6 19 Missouri 3.7 33 Rhode Island 4.5