DEATHS FROM SUICIDE among U.S. Veterans & Armed Forces in 16 States
|
|
|
- Lesley Tyler
- 6 years ago
- Views:
Transcription

1 DEATHS FROM SUICIDE among U.S. Veterans & Armed Forces in 16 States A Special Report with Data from the National Violent Death Reporting System, Alaska Colorado Georgia Kentucky Maryland New Jersey New Mexico North Carolina Ohio Oklahoma Oregon Rhode Island South Carolina Utah Virginia Wisconsin March 2018
2 Established in 1993, the Safe States Alliance is a national non-profit organization and professional association whose mission is to strengthen the practice of injury and violence prevention. Safe States is the only national non-profit organization and professional association that represents the diverse and ever-expanding group of professionals who comprise the field of injury and violence prevention. Safe States Alliance engages in a variety of activities to advance the organization s mission, including: Increasing awareness of injury and violence throughout the lifespan as a public health ; Enhancing the capacity of public health agencies and their partners to ensure effective injury and violence prevention programs by disseminating best practices, setting standards for surveillance, conducting program assessments, and facilitating peer-to-peer technical assistance; Providing educational opportunities, training, and professional development for those within the injury and violence prevention field; Collaborating with other national organizations and federal agencies to achieve shared goals; Advocating for public health policies designed to advance injury and violence prevention; Convening leaders and serving as the voice of injury and violence prevention programs within state health departments; and Representing the diverse professionals making up the injury and violence prevention field. For more information about the Safe States Alliance, contact the national office: Safe States Alliance 2200 Century Parkway, Suite 700 Atlanta, Georgia (770) (Phone) info@safesatates.org ( ) Suggested citation Deaths from Suicide among Veterans and Armed Forces in 16 States. A Special Report with Data from the National Violent Death Reporting System, (2018). Atlanta (GA): Safe States Alliance. The development and publication of this document was made possible through funding from the Centers for Disease Control and Prevention (CDC) under the Cooperative Agreement 5U50CE002380, Building and Supporting Core Public Health Capacities Related to Violence and Injury and Violence Prevention. The findings and conclusions in this report are those of the author(s) and do not necessarily represent the official position of the CDC. 2
3 1. Introduction 4 2. NVDRS Overview 6 3. Key Findings 8 Infographic: Suicide among Veterans and Armed Forces 12 Table 1: Suicide Rates among Veteran and Armed Forces 13 and Non-Veteran Civilians 18 Years and Older in 13 NVDRS States, Table 2: Toxicology Testing and Results for Veteran and Armed 14 Forces Suicide Victims in 16 NVDRS States, State Profiles 15 Alaska 16 Colorado 18 Georgia 20 Kentucky 22 Maryland 24 New Jersey 26 New Mexico 28 North Carolina 30 Ohio 32 Oklahoma 34 Oregon 36 Rhode Island 38 South Carolina 40 Utah 42 Virginia 44 Wisconsin Analysis Considerations Appendix A: Definition of Terms Appendix B: Methods References Acknowledgements 58 3
4 Suicide is a significant public health in the United States. In 2015, there were more than 44,000 deaths from suicide, accounting for two-thirds of the more than 62,000 people who died from acts of violence. 1 In addition: The age-adjusted suicide death rate in the U.S. rose from 10.5 per 100,000 population in 1999 to 13.0 in 2014 a 24% increase. 2 The average annual percent increase was greater from (about 2% per year) than from (about 1% per year). 2 While overall mortality is generally declining, suicide rates are increasing among both males and females and in nearly all age groups. 2 U.S. Department of Veterans Affairs Each year, thousands of veterans and active duty U.S. military personnel die by suicide. Historically, suicide rates in the U.S. military have been lower than in the U.S. population. However, since 2001, suicide rates have steadily increased for both active duty military personnel and veterans (persons who served in the armed forces but are no longer serving). 3,7 From , since the beginning of combat operations in Iraq and Afghanistan, suicide rates among active duty U.S. Army personnel doubled, and in 2008, surpassed the suicide rate for the U.S. population. These higher rates of suicide continue to persist. 4,5,6 Suicide among veterans has also increased, particularly among younger veterans. In 2014, the U.S. Department of Veterans Affairs estimated an average of 20 veterans died by suicide each day, with veterans accounting for 18% of all suicide deaths. 7 Male and female veterans have a higher suicide risk than their U.S. civilian counterparts. 7 Many of these deaths can be prevented. The development of effective prevention strategies relies on complete, accurate and timely information about populations at risk and the circumstances and factors that contribute to deaths from violence. The National Violent Death Reporting System (NVDRS) provides this essential information. The NVDRS is the only national state-based surveillance reporting system that compiles data from multiple sources on all deaths from violence, including veteran/military status data from death certificates (see pages 6-7 for more information on the NVDRS). This report provides a detailed snapshot of veteran and active duty armed forces suicide deaths in 16 states that reported data to the NVDRS. The report examines circumstances surrounding veteran and armed forces suicide deaths among various demographic groups, and draws comparisons between veteran/armed forces and non-veteran civilian suicide deaths. The NVDRS Restricted Access Database (RAD) was used to conduct analysis for 16 NVDRS states that completed data collection during 2010 through These states are Alaska, Colorado, Georgia, Kentucky, Maryland, New Jersey, New Mexico, North Carolina, Ohio, Oklahoma, Oregon, Rhode Island, South Carolina, Utah, Virginia, and Wisconsin. 4
5 The report is a companion piece to Deaths from Suicide: A Look at 18 States, published in Both reports build upon previous NVDRS-based reports with a similar approach and format. A 2008 report addressed the overall picture of violence using data collected from NVDRS-reporting states, and a 2014 report using data from NVDRS-reporting states included a special focus on intimate partner violence. 9,10 This examination of veteran and armed forces suicide deaths includes: An overview of the NVDRS, its data sources, and key variables, including how veteran and armed forces status is captured in the system. Key findings, including demographics and circumstances of veteran and armed forces suicide deaths. An infographic depicting the overall picture of veteran and armed forces suicide deaths in the 16 states combined. An overview (Table 1) of suicide rates among veterans and armed forces, and non-veteran civilians, in the 13 NVDRS states with complete (< missing/unknown) veteran status data collected for all five years ( ).* Occurrent suicide rates for veterans and armed forces, and non-veteran civilians, are provided by sex and age group (for males) for each state. Toxicology testing and results that reflect the involvement of alcohol and drugs in suicide deaths among veterans and armed forces (Table 2). State profiles for the 16 states. A brief description of factors to consider when analyzing NVDRS data particularly when analyzing veteran and armed forces status data to orient readers to some subtleties and complexities of working with NVDRS data and the veteran/military status variable collected in the NVDRS. The results presented on veteran and armed forces suicide deaths in this report may differ from those derived from other sources or analysis methodologies. * Three states with a high degree of missing or unknown veteran status data for certain years were not included in rate calculations. Suicide is not inevitable for anyone. The National Suicide Prevention Lifeline states that we can help prevent suicides and save lives by starting the conversation, providing support, and directing help to those who need it. For both the National Suicide Prevention Lifeline and the Veterans Crisis Line Call and Press 1, chat online, or send a text message to to receive free and confidential support 24 hours a day, 7 days a week, 365 days a year. Support for deaf and hard of hearing individuals is available. The National Suicide Prevention Lifeline provides free and confidential emotional support to people in suicidal crisis or emotional distress through a national network of over 160 local crisis centers, combining custom local care and resources with national standards and best practices. The Veterans Crisis Line connects veterans in crisis and their families and friends with qualified, caring Department of Veterans Affairs responders through a confidential toll-free hotline, online chat, or text (see box above). 5
6 The National Violent Death Reporting System (NVDRS) is the only national state -based surveillance reporting system that compiles data from multiple sources on all deaths from violence including homicides, suicides, and legal intervention deaths. 11,12 (See Appendix A for definitions of these terms.) The Centers for Disease Control and Prevention (CDC) established the NVDRS in NVDRS data collection began in 2003 with just six states. Since then, additional appropriations have increased NVDRS participation to 40 states, the District of Columbia, and Puerto Rico. 13 The goal is to expand NVDRS participation to all 50 states and U.S. territories. Centers for Disease Control and Prevention All NVDRS states use standard coding practices developed by the CDC to collect information about: Homicides Suicides Legal intervention deaths Unintentional firearm deaths Deaths of undetermined intent The primary NVDRS data sources are listed below, as well as additional sources that some states may incorporate. 11,12 All identifying information is removed, the names of individual victims and suspects are not released, and laws protecting other types of health department records, such as communicable disease records, also apply to the NVDRS. Primary sources Death certificates Coroner/medical examiner reports Toxicology reports Law enforcement reports Additional sources Child Fatality Reviews Domestic Violence Fatality Reviews Six categories of information are collected for each type of violent death: Demographics Injury and death information Circumstances Weapon Suspects Toxicology The types of circumstances collected are: Mental health (e.g., current diagnosed mental health, substance abuse, and other addictions) Relationship and life stressors (e.g., intimate partner ) Crime and criminal activity (e.g., the death being precipitated by another crime) Homicide and legal intervention death specific circumstances (e.g., a hate crime) Suicide and undetermined specific circumstances (e.g., history of suicide attempts) Unintentional firearm specific circumstances (e.g., gun defect or malfunction) 6


, the NVDRS is an incident-based system.")


7 The NVDRS collects veteran/military status data from death certificates. The U.S. Standard Certificate of Death form used by most states includes a box Ever a member of U.S. Armed Forces? The box is completed as Yes, No, or Unknown based on information provided by the informant. Ever a member of U.S. Armed Forces includes both veterans and persons actively serving in the U.S. Armed Forces. The U.S. Armed Forces comprises five armed service branches: Air Force, Army, Coast Guard, Marine Corps, and Navy. This data can be used to better understand risk factors related to veteran/armed forces suicide and help guide prevention efforts. The NVDRS links data from multiple sources to provide a more complete picture of violent deaths in the U.S., states and local communities. Unlike other surveillance systems that collect data on individual deaths (e.g., vital statistics), the NVDRS is an incident-based system. The NVDRS collects data on the entire violent incident and links all victims and alleged suspects associated with the incident in one record. 12 For example, the NVDRS can identify and link all victims and suspects in multiple homicide cases, as well as in homicide-suicide cases. the relationship between the victim and suspect, including if they knew each other information about the suspect, including relevant criminal acts circumstances such as a history of depression or other mental health, chronic illness, alcohol or drug use recent with a job, finances or relationships circumstances unique to intimate partner violence, including prior incidents of abuse Select NVDRS data are available on the CDC Web-based Injury Statistics Query and Reporting System (WISQARS). Additionally, the NVDRS Restricted Access Database (RAD) a de-identified, multi-state, case-level micro dataset available from the CDC is available for use by researchers and other investigators who meet certain criteria. (See Appendix A: Definition of Terms) 7
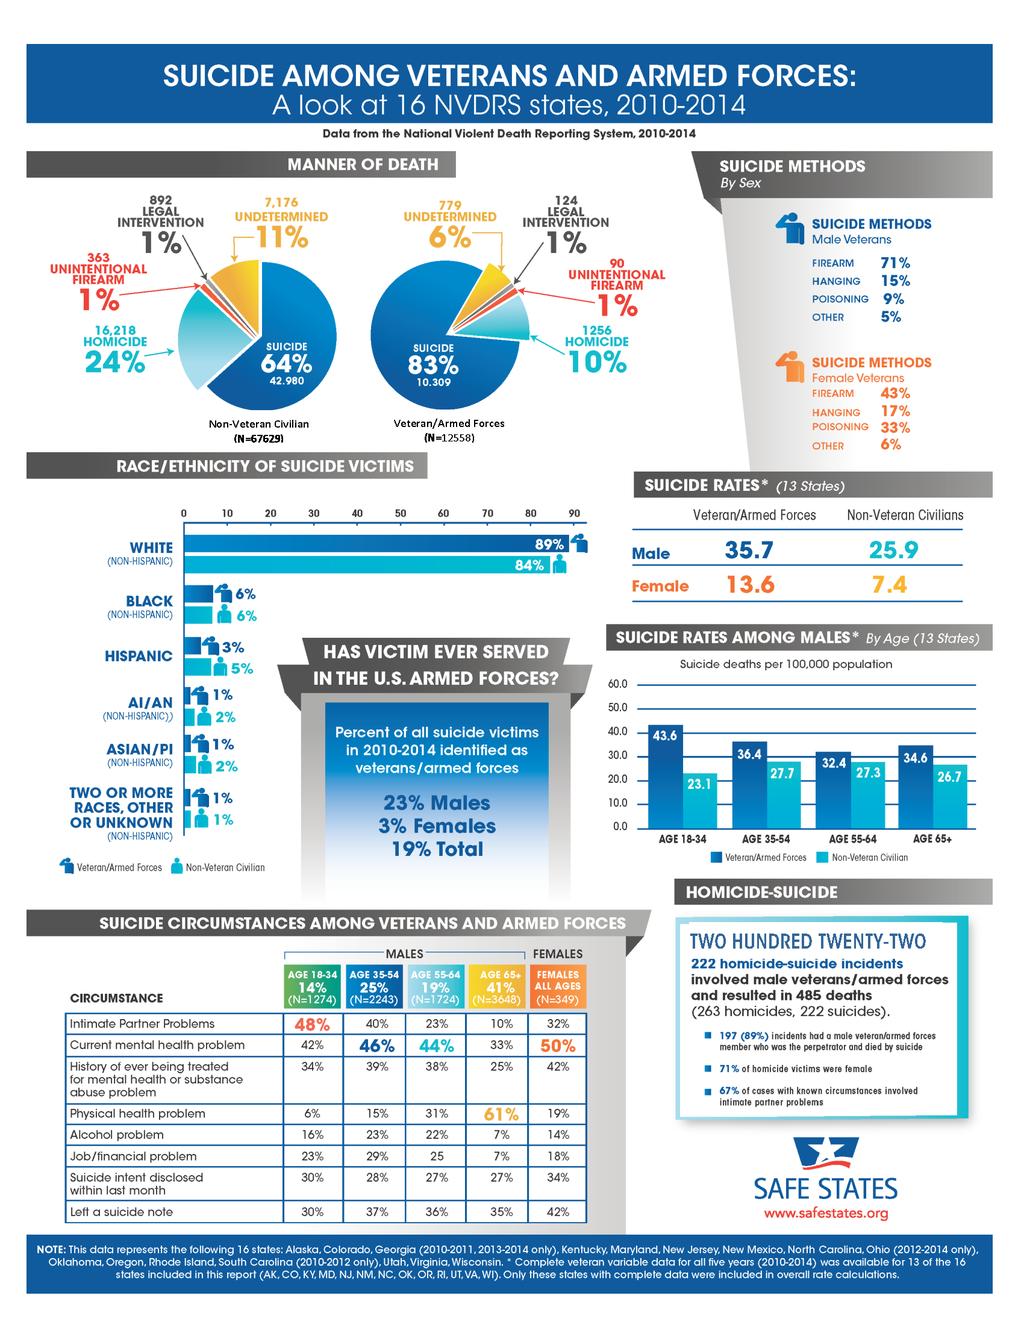
8 VETERAN AND ARMED FORCES STATUS AMONG SUICIDE VICTIMS In the 16 states, 10,039 (19%) of suicide victims were identified as veterans or currently serving in the armed forces. Among male suicide victims, 23% were identified as veterans or currently serving in the armed forces, 74% were non-veteran civilians, and 3% had an unknown or missing veteran/armed forces status. Among female suicide victims, 3% were identified as veterans or currently serving in the armed forces, 95% were non-veteran civilians, and 2% had an unknown or missing veteran/armed forces status. VIOLENT DEATH TYPES AMONG VETERANS AND ARMED FORCES MEMBERS Suicides outnumbered homicides among veterans and armed forces members in all 16 NVDRS states included in this report. Among males, suicides accounted for 83% of all violent deaths, followed by homicides (), deaths of undetermined intent (6%), deaths due to legal intervention (1%), and unintentional firearm deaths (<1%). Among females, suicides accounted for 7 of all violent deaths, followed by homicides (19%), deaths of undetermined intent (11%), deaths due to legal intervention (<1%), and unintentional firearm deaths (<1%). ANALYSIS CONSIDERATIONS In reviewing all findings in this report, please refer to the Analysis Considerations section (pages 48-50) for details on how the data analyses were conducted and for insight into the subtleties and complexities of working with NVDRS data. It is important to understand key factors to consider when analyzing NVDRS data and reasons why the results presented in this report might differ from those derived from other data sources or analysis methodologies. *Occurrent Suicide Rate, for example, is used throughout this report. Occurrence statistics are based on all violent deaths that occur in the geographic area of interest, not just the deaths of residents. Occurrent deaths are those in which the decedent was fatally injured in the reporting state, whether or not the decedent was a resident of the reporting state. This report uses occurrent rates rather than mortality rates based on residency status because occurrent rates provide a more comprehensive description of a state s burden of deaths from violence (see pages for further details). These rates are presented per 100,000 veteran and armed forces residents and per 100,000 nonveteran civilian residents. + Complete (< missing/unknown) veteran variable data was available for 13 of the 16 states included in this report. Only states with complete veteran variable data for all five years ( ) were included in overall rate calculations. Therefore, analyses noted with + include 13 states only (AK, CO, KY, MD, NJ, NM, NC, OK, OR, RI, UT, VA, WI). 8
9 HOMICIDE-SUICIDE INCIDENTS A total of 222 homicide-suicide incidents were identified involving male veterans and armed forces members, totaling 485 deaths. In these incidents, 197 male veterans and armed forces members committed homicide followed by suicide, and 34 were victims of homicide. The 485 total deaths consisted of 263 homicides and 222 suicides. 71% of the homicide victims were female. 67% of these homicide-suicide incidents were related to intimate partner. SUICIDE Occurrent suicide rate* + All rates are presented as either per 100,000 veteran and armed forces residents or per 100,000 non-veteran civilian residents. The overall suicide rate among veterans and armed forces members in the 13 states (33.7 per 100,000 veteran and armed forces residents) was 2.2 times higher than the non-veteran civilian suicide rate (15.5 per 100,000 non-veteran civilian residents). In all of these 13 states, the veteran and armed forces suicide rate was higher than the non-veteran civilian suicide rate. - The difference ranged from 1.5 times higher in Alaska to 2.5 times higher in Oregon. - The lowest veteran and armed forces suicide rate was 22.6/100,000 in New Jersey, while the highest was 54.4/ 100,000 in Utah. - New Jersey also had the lowest nonveteran civilian suicide rate (9.3/ 100,000), while Alaska had the highest non-veteran civilian suicide rate (25.4/ 100,000). Males and females + The overall male veteran and armed forces suicide rate in the 13 states (35.7/100,000) was 2.6 times higher than the female veteran and armed forces suicide rate (13.6/ 100,000). - The male veteran and armed forces suicide rate was higher than the female veteran and armed forces suicide rate in all 13 states, ranging from 1.6 times higher in Kentucky and Rhode Island to 4.1 times higher in Maryland. Among males, the veteran and armed forces suicide rate in the 13 states was 38% higher than the rate among non-veteran civilians (35.7/100,000 and 25.9/100,000, respectively). - The male suicide rate was higher among veterans and armed forces members in all states except for Alaska, where the male non-veteran civilian suicide rate was slightly higher than the veteran and armed forces rate (42.6/100,000 and 41.7/100,000, respectively). - The largest difference was in Oregon, where the male veteran and armed forces suicide rate of 52.0 was 1.6 times higher than the non-veteran civilian suicide rate of 32.4/100, The lowest male veteran and armed forces suicide rate was 23.4/100,000 in New Jersey, while the highest was 55.7/ 100,000 in Utah. In the 13 states, the female suicide rate was higher among veterans and armed forces members than among non-veteran civilians. - The largest difference was in Kentucky, where the female veteran and armed forces suicide rate was 3.4 times higher than the rate for non-veteran civilians. - The smallest difference was in Colorado, where the female veteran and armed forces suicide rate was 1.2 times higher than the rate for non-veteran civilians. - The lowest female veteran and armed forces suicide rate was 6.2/100,000 in Maryland, while the highest was 35.5/ 100,000 in Utah. Among male veterans and armed forces members, the highest suicide rate was among those ages years at 43.6/ 100,000, followed by ages (36.4/ 100,000), ages 65+ (34.6/100,000); the lowest was among ages (32.4/ 100,000). - The states with the highest rates in each age group were Wisconsin for ages (67.5/100,000), Oregon for ages (63.9/100,000), Utah for ages (60.5/100,000), and New Mexico for ages 65+ (56.2/100,000). 9
10 Suicide Methods Firearm Use Firearms were used in the overwhelming majority (7) of veteran and armed forces suicide deaths. Frequency among males Among male veteran and armed forces suicide victims, firearms were the most frequent suicide method used in all states (71% overall). - Alaska had the highest percentage of suicide deaths among males due to firearms (82%), while New Jersey and Rhode Island had the lowest (49%). Firearms accounted for 54% of non-veteran civilian male suicide deaths. Frequency among females Firearms were also the most frequent suicide method (43%) among female veteran and armed forces members, while they were the second most frequent suicide method (33%) of female non-veteran civilians. 100,000), while New Jersey had the lowest firearm suicide rate among this population (11.7/100,000). Other suicide methods Poisoning Among veterans and armed forces members, poisoning accounted for 33% of suicide deaths among females and 9% of suicide deaths among males. Among non-veteran civilians, poisoning accounted for 37% of suicide deaths among females and 11% of suicide deaths among males. Hanging/suffocation Among veterans and armed forces members, hanging/suffocation accounted for 17% of suicide deaths among females and 15% of suicide deaths among males. Among non-veteran civilians, hanging/ suffocation accounted for 22% of suicide deaths among females and 28% of suicide deaths among males. Firearm suicide rate The overall firearm suicide rate among male veterans and armed forces members in the 13 states was higher than male nonveteran civilians (25.3 and 13.8/100,000, respectively). In each of the 13 states, the firearm suicide rate was higher among male veterans and armed forces members than among male non-veteran civilians. - The smallest difference was in Alaska, where the male veteran and armed forces firearm suicide rate was 1.2 times higher than male non-veteran civilians. - The largest difference was in Rhode Island, where the male veteran and armed forces firearm suicide rate was 3.0 times higher than male non-veteran civilians. Among the 13 states, Oregon and Utah had the highest firearm suicide rate among male veteran and armed forces members (39.6/ Toxicology Toxicology test results among veteran and armed forces suicide victims who were tested showed that 32% were positive for alcohol, 24% for antidepressants, and 21% for opiates. (See Table 2 on page 14) Race/Ethnicity Among veteran and armed forces suicide victims, 89% were white (non-hispanic), 6% were black (non-hispanic), 3% were Hispanic, 1% were American Indian/Alaska Native (non-hispanic), 1% were Asian/ Pacific Islander (non-hispanic), 1% were two or more races (non-hispanic), and <1% were other/unknown race. Among non-veteran civilian suicide victims, 84% were white (non-hispanic), 6% were black (non-hispanic), 5% were Hispanic, 1% were American Indian/Alaska Native (non-hispanic), 2% were Asian/Pacific Island -er (non-hispanic), 2% were two or more races (non-hispanic), and <1% had other or unknown race. 10
11 Marital status Males Among male veteran and armed forces suicide victims, 45% were married, 15% were never married, 24% were divorced, 12% were widowed, 2% were married but separated, 1% were single, not otherwise specified, and 1% had an unknown or missing marital status. Among male non-veteran civilian suicide victims, 33% were married, 38% were never married, 2 were divorced, 4% were widowed, 3% were married but separated, 2% were single, not otherwise specified, and 1% had an unknown or missing marital status. Females Among female veteran and armed forces suicide victims, 39% were married, 21% were never married, 31% were divorced, 4% were widowed, 2% were married but separated, 1% were single, not otherwise specified, and 1% had an unknown or missing marital status. Among female non-veteran civilian suicide victims, 36% were married, 24% were never married, 29% were divorced, 8% were widowed, 2% were married but separated, 1% were single, not otherwise specified, and 1% had an unknown or missing marital status. Homelessness Of the 10,309 veteran and armed forces suicide victims in the analysis, 0.6% (61) were identified as homeless, which was less than the 0.9% of non-veteran civilian suicide victims identified as homeless. Mental Health Problems Among veteran and armed forces suicide victims with known circumstances, more than half (58%) of females and 39% of males were identified as currently having a mental health. Among veteran and armed forces suicide victims identified as currently having a mental health, 73% had a diagnosis of depression/dysthymia, 14% had posttraumatic stress (PTSD), 13% had anxiety, had bipolar, 3% had schizophrenia, and 16% had other or unknown diagnoses. Among non-veteran civilian suicide victims identified as currently having a mental health, 76% had a diagnosis of depression/dysthymia, 2% had PTSD, 15% had anxiety, 16% had bipolar, 6% had schizophrenia, and 17% had other or unknown diagnoses. Education* Among veteran and armed forces suicide victims, 8% had less than a high school degree, 42% were a high school or GED graduate, 44% had some college credit or a college degree, and 6% had an unknown education level. Among non-veteran civilian suicide victims, 14% had less than a high school degree, 39% were a high school or GED graduate, 4 had some college credit or a college degree, and 6% had an unknown education level. * Data excludes Rhode Island, where 95% of suicide victims had an unknown or missing education level. 11
12 12
13 TABLE 1. SUICIDE RATES AMONG VETERAN/ARMED FORCES AND NON-VETERAN CIVILIANS AGE 18 AND OLDER IN 13 NVDRS STATES, Table 1 provides a quick look at the magnitude of suicide deaths among veterans and armed forces compared to non-veteran civilians in 13 states that collected NVDRS data and had complete (< missing/unknown) veteran status data for all five years necessary for the calculations presented below. Suicide death measures shown are: (1) the total number of suicide deaths that occurred in each state over the five-year period , (2) the annual occurrent suicide rate per 100,000 residents population, (3) the percent of occurrent suicide deaths among males and state residents, (4) the annual occurrent suicide rate among males by age group, and females (all ages). Agespecific rates were not possible for females due to small numbers in some states. All rates are five-year average rates. # of occurrent suicides Occurrent suicide rate % males % residents Males Age-specific occurrent suicide death rates Females Occurrent suicide rate (All ages) State All ages Alaska Veteran/AF % 96% ** Non-Veteran Civilian % 98% Colorado Veteran/AF % 97% Non-Veteran Civilian % 97% Kentucky Veteran/AF % 98% Non-Veteran Civilian % 97% Maryland Veteran/AF % 96% ** Non-Veteran Civilian % 95% New Jersey Veteran/AF % 96% ** Non-Veteran Civilian % 96% New Mexico Veteran/AF % 96% Non-Veteran Civilian % North Carolina Veteran/AF % 98% Non-Veteran Civilian % 98% Oklahoma Veteran/AF % 99% Non-Veteran Civilian % 98% Oregon Veteran/AF % 99% Non-Veteran Civilian % 95% Rhode Island Veteran/AF % 97% 26.0** ** * Non-Veteran Civilian % 94% Utah Veteran/AF % 96% ** Non-Veteran Civilian % 98% Virginia Veteran/AF % 98% Non-Veteran Civilian % 98% Wisconsin Veteran/AF % 99% Non-Veteran Civilian % 98% FOOTNOTES Definitions of terms are found in Appendix A. Methodology is described in Appendix B. Occurrent deaths are those in which the fatal injury occurred in the specified state, regardless of the person s state of residence. *Rates are not calculated for cells containing fewer than five deaths. **Rates based on fewer than 20 deaths may be unstable and should be interpreted with caution. 13
14 TABLE 2. TOXICOLOGY TESTING AND RESULTS AND VETERAN AND ARMED FORCES SUICIDE VICTIMS IN 16 NVDRS STATES, Table 2 presents toxicology testing and results for veteran and armed forces suicide victims. Of those tested, toxicology test results show that 32% were positive for alcohol, 24% for antidepressants, and 21% for opiates. SUBSTANCE NAME TOXICOLOGY TESTING & RESULTS (Total number of veteran and armed forces suicide victims: N=10,309) # Tested # of Tests with Positive Result % Positive (of those tested) Alcohol % Amphetamines % Antidepressants % Cocaine % Marijuana % Opiates % TOTAL # or AVERAGE % % 14
15 15

 9% Homicide (20 deaths) 4% Unintentional firearm (9 deaths) 1% Legal intervention (2 deaths) 9% Undetermined (20 deaths) 50")
16 Alaska Violent Death Reporting System (AKVDRS) Joined the NVDRS: 2002 First year of data collection: 2003 Alaska is the largest state in the U.S. in land area, covering 570,000 square miles. It is the 48th most populated state. Population estimates for Alaska 1 (Average annual estimate, ) Veteran (Age 18+) 70,370 Armed Forces (Age 16+) 16,776 Non-Veteran/Civilian (Age 18+) 453,064 Homeless Veterans 2 (estimated) Veteran Health Administration facilities in Alaska 3 Suicide (170 deaths) 9% Homicide (20 deaths) 4% Unintentional firearm (9 deaths) 1% Legal intervention (2 deaths) 9% Undetermined (20 deaths) SUICIDE was the most common type of violent death among veterans and armed forces in Alaska, occurring more than eight times as often as homicide during Percent of all suicide victims in Alaska in identified as veterans or armed forces Suicide rates among veterans and armed forces were slightly lower for males and higher for females in Alaska in % Males 7% Females 22% Total Veterans/ Non-Veteran Armed Forces Civilians Males Females 20.1*** 10.9 Total *** Rate based on <20 deaths % 3% Firearm Hanging Poisoning Other ** 8% American Indian/Alaska Native, non-hispanic 6% Black, non-hispanic 5% Hispanic 2% Two or more races, other, or unknown race Asian/Pacific Islander, non-hispanic 29% Never married 2 Divorced 6% Widowed 1% Other/unknown status ** includes civil unions and domestic partnerships 32% Some college credit or college degree 4% Less than a high school education 22% Unknown or missing education level Percents may not equal 10 due to rounding. *All rates are occurrent ratios based on the number of resident and non-resident deaths that occurred in the state per 100,000 resident population. Statistical testing was not conducted. Differences between veterans/armed forces and non-veteran civilians may not be statistically significant. Sources: 1 U.S. Census Bureau, American Community Survey, ; 2 U.S. Department of Housing and Urban Development, 2014 Annual Homeless Assessment Report (AHAR) to Congress; 3 U.S. Department of Veteran Affairs 16
17 Male veterans/armed forces had: A firearm suicide rate 1.2 times higher compared to non-veteran civilians VETERAN/ ARMED FORCES NON-VETERAN CIVILIAN Firearm suicide rates* in Alaska, Males, All Ages or = 2 deaths per 100,000 residents In 96% of Alaska s suicide deaths among male veterans and armed forces, circumstances were documented in the records (N=152). More than one circumstance may have been noted in the record. The five most frequent circumstances by age group, as well as information about suicide intent, and a suicide note, are shown below. Circumstances by age group were not calculated for females due to small numbers. AGE AGE AGE AGE % 27% 13% 22% (N=59) (N=41) (N=19) (N=33) 59% Intimate partner 37% Job/financial 34% Current mental health 34% Ever treated for mental abuse 39% Current mental health 37% Job/financial 34% Intimate partner 34% Ever treated for mental abuse 32% Recent/imminent crisis 24% Physical health 42% Physical health 37% Job/financial 37% Current mental health 26% Ever treated for mental abuse 79% Physical health 48% Recent/imminent crisis 3 Ever treated for mental abuse 27% Current mental health Not calculated, n<5 21% Other death of friend or family member 56% Suicide intent disclosed 39% Suicide intent disclosed 37% Suicide intent disclosed 3 Suicide intent disclosed 37% Left a suicide note 34% Left a suicide note 47% Left a suicide note 52% Left a suicide note % 71% Depression/ dysthymia Depression/dysthymia was similar among veteran/armed forces and non-veteran civilian suicide victims 22% Post-traumatic stress was higher among veteran/armed forces suicide victims compared to non-veteran civilians 3% Post-traumatic stress 12% 8% Schizophrenia 17% 15% 15% 7% Anxiety Percentages will not add up to 10 as individuals may have had more than one diagnosis = Veteran/Armed Forces (N=59) = Non-Veteran Civilians (N=184) Bipolar 24% 36% Other/ Unknown 17
 Veteran (Age 18+) 395,007 Armed Forces (Age 16+) 31,757 Non-Veteran/Civilian (Age 18+) 3,536,136 Homeless Veterans 2")
18 Colorado Violent Death Reporting System (COVDRS) Joined the NVDRS: 2003 First year of data collection: 2004 Colorado has 64 counties covering 103,000 square miles. It is the 22nd most populated state. Population estimates for Colorado 1 (Average annual estimate, ) Veteran (Age 18+) 395,007 Armed Forces (Age 16+) 31,757 Non-Veteran/Civilian (Age 18+) 3,536,136 Homeless Veterans 2 (estimated) Veteran Health Administration facilities in Colorado 3 Suicide (910 deaths) 8% Homicide (88 deaths) 1% Unintentional firearm (9 deaths) 1% Legal intervention (12 deaths) 4% Undetermined (45 deaths) Percent of all suicide victims in Colorado in identified as veterans or armed forces SUICIDE was the most common type of violent death among veterans and armed forces in Colorado, occurring more than ten times as often as homicide during % Males 3% Females 19% Total % 4 3 Suicide rates were higher among veterans and armed forces in Colorado in Veterans/ Non-Veteran Armed Forces Civilians Males Females Total % 15% 4% Firearm Hanging Poisoning Other ** 6% Hispanic 2% Black, non-hispanic 1% Two or more races, other, or unknown race <1% American Indian/Alaska Native, non-hispanic <1% Asian/Pacific Islander, non-hispanic 25% Divorced 16% Never married Widowed 1% Other/unknown status ** includes civil unions and domestic partnerships 38% High school or GED graduate 4% Less than a high school education 1% Unknown or missing education level Percents may not equal 10 due to rounding. *All rates are occurrent ratios based on the number of resident and non-resident deaths that occurred in the state per 100,000 resident population. Statistical testing was not conducted. Differences between veterans/armed forces and non-veteran civilians may not be statistically significant. Sources: 1 U.S. Census Bureau, American Community Survey, ; 2 U.S. Department of Housing and Urban Development, 2014 Annual Homeless Assessment Report (AHAR) to Congress; 3 U.S. Department of Veteran Affairs 18
19 Male veterans/armed forces had: The highest firearm suicide rate A firearm suicide rate 1.8 times higher compared to non-veteran civilians VETERAN/ ARMED FORCES NON-VETERAN CIVILIAN Firearm suicide rates* in Colorado, Males age Males age or = 2 deaths per 100,000 residents In 91% of Colorado s suicide deaths among male veterans and armed forces, circumstances were documented in the records (N=801). More than one circumstance may have been noted in the record. The five most frequent circumstances by age group, as well as information about suicide intent, and a suicide note, are shown below. Circumstances by age group were not calculated for females due to small numbers. AGE AGE AGE AGE % 28% 21% 37% (N=112) (N=222) (N=169) (N=298) 55% Intimate partner 44% Current mental health 42% Current mental health 39% Ever treated for mental abuse 38% Argument or conflict 36% Intimate partner 37% Ever treated for mental abuse 29% History of attempting suicide 35% Job/financial 32% Alcohol 47% Physical health 41% Current mental health 39% Job/financial 34% Ever treated for mental abuse 31% Intimate partner 76% Physical health 3 Current mental health 25% Ever treated for mental abuse 22% Recent/imminent crisis 13% Intimate partner 36% Suicide intent disclosed 34% Suicide intent disclosed 34% Suicide intent disclosed 28% Suicide intent disclosed 29% Left a suicide note 39% Left a suicide note 33% Left a suicide note 38% Left a suicide note % Depression/ dysthymia 77% Depression/dysthymia was similar among veteran/armed forces and non-veteran civilian suicide victims 19% Post-traumatic stress was higher among veteran/armed forces suicide victims compared to non-veteran civilians 2% Post-traumatic stress 4% 6% Schizophrenia 18% 18% Anxiety = Veteran/Armed Forces (N=314) = Non-Veteran Civilians (N=1692) 21% Bipolar Percentages will not add up to 10 as individuals may have had more than one diagnosis 15% Other/ Unknown 19

 Veteran Health Administration facilities in Georgia 3 Suicide (786 deaths) 18% Homicide (177 deaths) 1% Unintentional firearm (8 deaths) 1% Legal")


20 Georgia Violent Death Reporting System (GVDRS) Joined the NVDRS: 2003 First year of data collection: 2004 Georgia has 159 counties covering 57,000 square miles. It is the 8th most populated state. Population estimates for Georgia (Average annual estimate, , ) Veteran (Age 18+) 670,135 Armed Forces (Age 16+) 47,427 Non-Veteran/Civilian (Age 18+) 6,695,741 Homeless Veterans 2 (estimated) Veteran Health Administration facilities in Georgia 3 Suicide (786 deaths) 18% Homicide (177 deaths) 1% Unintentional firearm (8 deaths) 1% Legal intervention (11 deaths) 2% Undetermined (21 deaths) SUICIDE was the most common type of violent death among veterans and armed forces in Georgia, occurring more than four times as often as homicide during the combined years and Percent of all suicide victims in Georgia in identified as veterans or armed forces 2 Males 4% Females 17% Total % 5 4 Suicide rates were higher among veterans and armed forces in Georgia in , Veterans/ Non-Veteran Armed Forces Civilians Males Females Total % 8% 5% Firearm Hanging Poisoning Other ** 12% Black, non-hispanic 3% Two or more races, other, or unknown race 1% Hispanic 1% Asian/Pacific Islander, non-hispanic <1% American Indian/Alaska Native, non-hispanic 21% Divorced 15% Never married 11% Widowed 7% Other/unknown status ** includes civil unions and domestic partnerships 31% High school or GED graduate 5% Less than a high school education 28% Unknown or missing education level Percents may not equal 10 due to rounding. *All rates are occurrent ratios based on the number of resident and non-resident deaths that occurred in the state per 100,000 resident population. Statistical testing was not conducted. Differences between veterans/armed forces and non-veteran civilians may not be statistically significant. Sources: 1 U.S. Census Bureau, American Community Survey, ; 2 U.S. Department of Housing and Urban Development, 2014 Annual Homeless Assessment Report (AHAR) to Congress; 3 U.S. Department of Veteran Affairs 20
21 Male veterans/armed forces had: The highest firearm suicide rate A firearm suicide rate 1.6 times higher compared to non-veteran civilians VETERAN/ ARMED FORCES NON-VETERAN CIVILIAN Firearm suicide rates* in Georgia, Males age Males age In 79% of Georgia s suicide deaths among male veterans and armed forces, circumstances were documented in the records (N=586). More than one circumstance may have been noted in the record. The five most frequent circumstances by age group, as well as information about suicide intent, and a suicide note, are shown below. Circumstances by age group were not calculated for females due to small numbers % 72% Depression/dysthymia was similar among veteran/armed forces and non-veteran civilian suicide victims 19% Post-traumatic stress was higher among veteran/armed forces suicide victims compared to non-veteran civilians 1% 3% 6% or = 2 deaths per 100,000 residents AGE AGE AGE AGE % 26% 21% 35% (N=109) (N=152) (N=121) (N=204) 5 Intimate partner 31% Current mental health 34% Current mental health 3 Intimate partner 24% Recent/imminent crisis 27% Ever treated for mental abuse 21% Ever treated for mental abuse 17% Criminal legal 38% Physical health 3 Current mental health 26% Ever treated for mental abuse 19% Recent/imminent crisis 21% Intimate partner 18% Job/financial 17% Recent/imminent crisis 6% 9% 67% Physical health = Veteran/Armed Forces (N=173) = Non-Veteran Civilians (N=895) 17% 18% 17% 12% 24% Recent/imminent crisis 19% Current mental health 13% Ever treated for mental abuse Other death of friend or family member Intimate partner 2 Suicide intent disclosed 24% Suicide intent disclosed 18% Suicide intent disclosed 25% Suicide intent disclosed 2 Left a suicide note 34% Left a suicide note 26% Left a suicide note 25% Left a suicide note Depression/ dysthymia Post-traumatic stress Schizophrenia Anxiety Bipolar Percentages will not add up to 10 as individuals may have had more than one diagnosis Other/ Unknown 21
 Veteran (Age 18+) 303,167 Armed Forces (Age 16+) 15,502 Non-Veteran/Civilian (Age 18+) 3,046,346 Homeless Veterans 2")
22 Kentucky Violent Death Reporting System (KVDRS) Joined the NVDRS: 2004 First year of data collection: 2005 Kentucky has 120 counties covering 39,000 square miles. It is the 26 th most populated state. Population estimates for Kentucky 1 (Average annual estimate, ) Veteran (Age 18+) 303,167 Armed Forces (Age 16+) 15,502 Non-Veteran/Civilian (Age 18+) 3,046,346 Homeless Veterans 2 (estimated) Veteran Health Administration facilities in Kentucky 3 Suicide (552 deaths) 9% Homicide (64 deaths) 2% Unintentional firearm (13 deaths) 1% Legal intervention (6 deaths) 6% Undetermined (39 deaths) SUICIDE was the most common type of violent death among veterans and armed forces in Kentucky, occurring more than eight times as often as homicide during Percent of all suicide victims in Kentucky in identified as veterans or armed forces 21% Males 4% Females 17% Total % Suicide rates were higher among veterans and armed forces in Kentucky in Veterans/ Non-Veteran Armed Forces Civilians Males Females Total % 8% 3% Firearm Hanging Poisoning Other ** 4% Black, non-hispanic 1% Hispanic 1% Two or more races, other, or unknown race <1% Asian/Pacific Islander, non-hispanic American Indian/Alaska Native, non-hispanic 27% Divorced 13% Widowed 11% Never married 5% Other/unknown status ** includes civil unions and domestic partnerships 36% Some college credit or college degree 14% Less than a high school education 1% Unknown or missing education level Percents may not equal 10 due to rounding. *All rates are occurrent ratios based on the number of resident and non-resident deaths that occurred in the state per 100,000 resident population. Statistical testing was not conducted. Differences between veterans/armed forces and non-veteran civilians may not be statistically significant. Sources: 1 U.S. Census Bureau, American Community Survey, ; 2 U.S. Department of Housing and Urban Development, 2014 Annual Homeless Assessment Report (AHAR) to Congress; 3 U.S. Department of Veteran Affairs 22
23 Male veterans/armed forces had: The highest firearm suicide rate A firearm suicide rate 1.5 times higher compared to non-veteran civilians VETERAN/ ARMED FORCES NON-VETERAN CIVILIAN Firearm suicide rates* in Kentucky, Males age Males age or = 2 deaths per 100,000 residents In 68% of Kentucky s suicide deaths among male veterans and armed forces, circumstances were documented in the records (N=357). More than one circumstance may have been noted in the record. The five most frequent circumstances by age group, as well as information about suicide intent, and a suicide note, are shown below. Circumstances by age group were not calculated for females due to small numbers. AGE AGE AGE AGE % 25% 17% 43% (N=53) (N=90) (N=62) (N=152) 32% Intimate partner 28% Current mental health 33% Intimate partner 19% Job/financial 21% Recent/imminent crisis 19% Current mental health 21% Non-alcohol substance abuse 17% Job/financial 18% Alcohol 4 Physical health 24% Non-alcohol substance abuse 21% Intimate partner 21% Current mental health 16% Recent/imminent crisis 19% Job/financial 49% Physical health 23% Current mental health 16% Recent/imminent crisis 13% Ever treated for mental abuse Other death of friend or family member 17% Suicide intent disclosed 17% Suicide intent disclosed 18% Suicide intent disclosed 17% Suicide intent disclosed 13% Left a suicide note 16% Left a suicide note 21% Left a suicide note 16% Left a suicide note % 63% Depression/dysthymia was similar among veteran/armed forces and non-veteran civilian suicide victims = Veteran/Armed Forces (N=87) = Non-Veteran Civilians (N=492) Post-traumatic stress was higher among veteran/armed forces suicide victims compared to non-veteran civilians 25% 25% 2 Depression/ dysthymia 16% 1% Post-traumatic stress 2% Schizophrenia 7% 6% 7% Anxiety 9% 17% Bipolar Percentages will not add up to 10 as individuals may have had more than one diagnosis Other/ Unknown 23
 Veteran (Age 18+) 416,027 Armed Forces (Age 16+) 26,322 Non-Veteran/Civilian (Age 18+) 4,096,486 Homeless Veterans 2")
24 Maryland Violent Death Reporting System (MVDRS) Joined the NVDRS: 2002 First year of data collection: 2003 Maryland has 24 counties covering 9,700 square miles. It is the 19th most populated state. Population estimates for Maryland 1 (Average annual estimate, ) Veteran (Age 18+) 416,027 Armed Forces (Age 16+) 26,322 Non-Veteran/Civilian (Age 18+) 4,096,486 Homeless Veterans 2 (estimated) Veteran Health Administration facilities in Maryland 3 Suicide (513 deaths) 9% Homicide (82 deaths) Unintentional firearm (0 deaths) 1% Legal intervention (7 deaths) 3 Undetermined (263 deaths) SUICIDE was the most common type of violent death among veterans and armed forces in Maryland, occurring more than six times as often as homicide during Percent of all suicide victims in Maryland in identified as veterans or armed forces 17% Males 1% Females 14% Total % Suicide rates were higher among veterans and armed forces in Maryland in Veterans/ Non-Veteran Armed Forces Civilians Males Females 6.2*** 4.5 Total *** Rate based on <20 deaths % 8% 8% Firearm Hanging Poisoning Other ** 15% Black, non-hispanic 2% Two or more races, other, or unknown race 1% Hispanic 1% Asian/Pacific Islander, non-hispanic <1% American Indian/Alaska Native, non-hispanic 19% Divorced 16% Never married 12% Widowed 2% Other/unknown status ** includes civil unions and domestic partnerships 44% High school or GED graduate 9% Less than a high school education 1% Unknown or missing education level Percents may not equal 10 due to rounding. *All rates are occurrent ratios based on the number of resident and non-resident deaths that occurred in the state per 100,000 resident population. Statistical testing was not conducted. Differences between veterans/armed forces and non-veteran civilians may not be statistically significant. Sources: 1 U.S. Census Bureau, American Community Survey, ; 2 U.S. Department of Housing and Urban Development, 2014 Annual Homeless Assessment Report (AHAR) to Congress; 3 U.S. Department of Veteran Affairs 24
25 Male veterans/armed forces had: The highest firearm suicide rate A firearm suicide rate 2 times higher compared to non-veteran civilians VETERAN/ ARMED FORCES NON-VETERAN CIVILIAN Firearm suicide rates* in Maryland, Males age Males age or = 2 deaths per 100,000 residents In 91% of Maryland s suicide deaths among male veterans and armed forces, circumstances were documented in the records (N=452). More than one circumstance may have been noted in the record. The five most frequent circumstances by age group, as well as information about suicide intent, and a suicide note, are shown below. Circumstances by age group were not calculated for females due to small numbers. AGE AGE AGE AGE % 26% 18% 44% (N=54) (N=118) (N=80) (N=200) 39% Current mental health 37% Intimate partner 3 Ever treated for mental abuse 2 History of attempting suicide 17% Job/financial 38% Current mental health 34% Intimate partner 3 Ever treated for mental abuse 27% Job/financial 19% Alcohol 44% Current mental health 34% Job/financial 3 Physical health 3 Ever treated for mental abuse 2 Intimate partner 5 Physical health 35% Current mental health 22% Ever treated for mental abuse 17% Recent/imminent crisis 12% Intimate partner 17% Recent/imminent crisis 12% Other death of friend or family member 26% Suicide intent disclosed 33% Suicide intent disclosed 33% Suicide intent disclosed 31% Suicide intent disclosed 41% Left a suicide note 38% Left a suicide note 35% Left a suicide note 36% Left a suicide note % 77% Depression/dysthymia was similar among veteran/armed forces and non-veteran civilian suicide victims = Veteran/Armed Forces (N=183) = Non-Veteran Civilians (N=946) Depression/ dysthymia 11% Post-traumatic stress was higher among veteran/armed forces suicide victims compared to non-veteran civilians 1% Post-traumatic stress 2% 7% Schizophrenia 13% Anxiety 7% 18% Bipolar Percentages will not add up to 10 as individuals may have had more than one diagnosis 2 12% Other/ Unknown 25

 Veteran Health Administration facilities in New Jersey 3 Suicide (478 deaths) Homicide (57 deaths) Unintentional firearm (0 deaths) <1% Legal intervention (1 death) 3% Undetermined (15")

26 New Jersey Violent Death Reporting System (NJVDRS) Joined the NVDRS: 2002 First year of data collection: 2003 New Jersey has 21 counties covering 7,300 square miles. It is the 11th most populated state. Population estimates for New Jersey 1 (Average annual estimate, ) Veteran (Age 18+) 416,037 Armed Forces (Age 16+) 6,970 Non-Veteran/Civilian (Age 18+) 6,415,283 Homeless Veterans 2 (estimated) Veteran Health Administration facilities in New Jersey 3 Suicide (478 deaths) Homicide (57 deaths) Unintentional firearm (0 deaths) <1% Legal intervention (1 death) 3% Undetermined (15 deaths) SUICIDE was the most common type of violent death among veterans and armed forces in New Jersey, occurring more than eight times as often as homicide during Percent of all suicide victims in New Jersey in identified as veterans or armed forces 17% Males 1% Females 14% Total % 3 Suicide rates were higher among veterans and armed forces in New Jersey in Veterans/ Non-Veteran Armed Forces Civilians Males Females 8.5*** 4.4 Total *** Rate based on <20 deaths 2 9% 12% Firearm Hanging Poisoning Other ** 7% Black, non-hispanic 2% Hispanic 2% Two or more races, other, or unknown race American Indian/Alaska Native, non-hispanic Asian/Pacific Islander, non-hispanic 21% Divorced 18% Never married 14% Widowed 1% Other/unknown status ** includes civil unions and domestic partnerships 4 Some college credit or college degree 8% Less than a high school education 1% Unknown or missing education level Percents may not equal 10 due to rounding. *All rates are occurrent ratios based on the number of resident and non-resident deaths that occurred in the state per 100,000 resident population. Statistical testing was not conducted. Differences between veterans/armed forces and non-veteran civilians may not be statistically significant. Sources: 1 U.S. Census Bureau, American Community Survey, ; 2 U.S. Department of Housing and Urban Development, 2014 Annual Homeless Assessment Report (AHAR) to Congress; 3 U.S. Department of Veteran Affairs 26
27 Male veterans/armed forces had: The highest firearm suicide rate A firearm suicide rate >3 times higher compared to non-veteran civilians VETERAN/ ARMED FORCES NON-VETERAN CIVILIAN Firearm suicide rates* in New Jersey, Males age Males age or = 2 deaths per 100,000 residents In 89% of New Jersey s suicide deaths among male veterans and armed forces, circumstances were documented in the records (N=417). More than one circumstance may have been noted in the record. The five most frequent circumstances by age group, as well as information about suicide intent, and a suicide note, are shown below. Circumstances by age group were not calculated for females due to small numbers. AGE AGE AGE AGE 65+ 8% 23% 19% 5 (N=34) (N=94) (N=81) (N=208) 53% Current mental health 5 Ever treated for mental abuse 38% Intimate partner 32% Non-alcohol substance abuse 44% Current mental health 44% Ever treated for mental abuse 3 Intimate partner 28% Job/financial 37% Current mental health 35% Ever treated for mental abuse 22% Job/financial 29% Recent/imminent crisis 23% Recent/imminent crisis 19% History of attempting suicide 48% Physical health 37% Current mental health 34% Ever treated for mental abuse 2 Recent/imminent crisis 24% Recent/imminent crisis Other death of friend or family member 16% Suicide intent disclosed 15% Suicide intent disclosed 16% Suicide intent disclosed Suicide intent disclosed 32% Left a suicide note 32% Left a suicide note 42% Left a suicide note 35% Left a suicide note % 75% Depression/ dysthymia Depression/dysthymia was similar among veteran/armed forces and non-veteran civilian suicide victims 13% Post-traumatic stress was higher among veteran/armed forces suicide victims compared to non-veteran civilians Post-traumatic stress 5% 5% Schizophrenia = Veteran/Armed Forces (N=169) = Non-Veteran Civilians (N=1244) 9% 11% 11% Anxiety Bipolar Percentages will not add up to 10 as individuals may have had more than one diagnosis 15% 21% Other/ Unknown 27
28 New Mexico Violent Death Reporting System (NMVDRS) Joined the NVDRS: 2004 First year of data collection: 2005 New Mexico has 33 counties covering 121,000 square miles. It is the 36 th most populous state. Population estimates for New Mexico 1 (Average annual estimate, ) Veteran (Age 18+) 170,321 Armed Forces (Age 16+) 8,526 Non-Veteran/Civilian (Age 18+) 1,390,361 Homeless Veterans 2 (estimated) Veteran Health Administration facilities in New Mexico Suicide (446 deaths) Homicide (52 deaths) <1% Unintentional firearm (1 death) 2% Legal intervention (11 deaths) 5% Undetermined (25 deaths) SUICIDE was the most common type of violent death among veterans and armed forces in New Mexico, occurring more than eight times as often as homicide during Percent of all suicide victims in New Mexico in identified as veterans or armed forces 27% Males 5% Females 21% Total % 4 3 Suicide rates were higher among veterans and armed forces in New Mexico in Veterans/ Non-Veteran Armed Forces Civilians Males Females Total % 14% 5% Firearm Hanging Poisoning Other ** 19% Hispanic 2% American Indian/Alaska Native, non-hispanic 2% Two or more races, other, or unknown race 1% Black, non-hispanic <1% Asian/Pacific Islander, non-hispanic 28% Divorced 18% Never married Widowed 2% Other/unknown status ** includes civil unions and domestic partnerships 31% High school or GED graduate 5% Less than a high school education 3% Unknown or missing education level Percents may not equal 10 due to rounding. *All rates are occurrent ratios based on the number of resident and non-resident deaths that occurred in the state per 100,000 resident population. Statistical testing was not conducted. Differences between veterans/armed forces and non-veteran civilians may not be statistically significant. Sources: 1 U.S. Census Bureau, American Community Survey, ; 2 U.S. Department of Housing and Urban Development, 2014 Annual Homeless Assessment Report (AHAR) to Congress; 3 U.S. Department of Veteran Affairs 28
29 Male veterans/armed forces had: The highest firearm suicide rate A firearm suicide rate 1.6 times higher compared to non-veteran civilians VETERAN/ ARMED FORCES NON-VETERAN CIVILIAN Firearm suicide rates* in New Mexico, Males age Males age or = 2 deaths per 100,000 residents In 91% of New Mexico s suicide deaths among male veterans and armed forces, circumstances were documented in the records (N=385). More than one circumstance may have been noted in the record. The five most frequent circumstances by age group, as well as information about suicide intent, and a suicide note, are shown below. Circumstances by age group were not calculated for females due to small numbers. AGE AGE AGE AGE % 24% 17% 46% (N=48) (N=94) (N=67) (N=176) 4 Intimate partner 53% Current mental health 4 Recent/imminent crisis 51% Ever treated for mental abuse 38% Current mental health 33% Ever treated for mental abuse 29% History of attempting suicide 33% Intimate partner 33% Job/financial 31% History of attempting suicide 4 Physical health 39% Current mental health 39% Ever treated for mental abuse 34% Intimate partner 3 Alcohol 61% Physical health 27% Recent/imminent crisis 27% Current mental health 22% Ever treated for mental abuse 14% Alcohol 54% Suicide intent disclosed 38% Suicide intent disclosed 39% Suicide intent disclosed 33% Suicide intent disclosed 25% Left a suicide note 41% Left a suicide note 37% Left a suicide note 41% Left a suicide note % 75% Depression/ dysthymia Depression/dysthymia was similar among veteran/armed forces and non-veteran civilian suicide victims 22% Post-traumatic stress was higher among veteran/armed forces suicide victims compared to non-veteran civilians 4% Post-traumatic stress 4% Schizophrenia 16% 18% Anxiety = Veteran/Armed Forces (N=154) = Non-Veteran Civilians (N=631) 21% 11% Bipolar Percentages will not add up to 10 as individuals may have had more than one diagnosis 11% Other/ Unknown 29
30 North Carolina Violent Death Reporting System (NCVDRS) Joined the NVDRS: 2003 First year of data collection: 2004 North Carolina has 100 counties covering 48,000 square miles. It is the 9 th most populous state. Population estimates for North Carolina 1 (Average annual estimate, ) Veteran (Age 18+) 709,471 Armed Forces (Age 16+) 85,760 Non-Veteran/Civilian (Age 18+) 6,670,975 Homeless Veterans 2 (estimated) Veteran Health Administration facilities in North Carolina Suicide (1,109 deaths) 14% Homicide (186 deaths) 1% Unintentional firearm (7 deaths) 1% Legal intervention (15 deaths) 3% Undetermined (36 deaths) SUICIDE was the most common type of violent death among veterans and armed forces in North Carolina, occurring more than five times as often as homicide during Percent of all suicide victims in North Carolina in identified as veterans or armed forces 23% Males 3% Females 18% Total % 5 4 Suicide rates were higher among veterans and armed forces in North Carolina in Veterans/ Non-Veteran Armed Forces Civilians Males Females Total % 3% Firearm Hanging Poisoning Other ** 8% Black, non-hispanic 1% Hispanic 1% Two or more races, other, or unknown race <1% American Indian/Alaska Native, non-hispanic <1% Asian/Pacific Islander, non-hispanic 23% Divorced 15% Never married Widowed 3% Other/unknown status ** includes civil unions and domestic partnerships 34% High school or GED graduate 6% Less than a high school education 23% Unknown or missing education level Percents may not equal 10 due to rounding. *All rates are occurrent ratios based on the number of resident and non-resident deaths that occurred in the state per 100,000 resident population. Statistical testing was not conducted. Differences between veterans/armed forces and non-veteran civilians may not be statistically significant. Sources: 1 U.S. Census Bureau, American Community Survey, ; 2 U.S. Department of Housing and Urban Development, 2014 Annual Homeless Assessment Report (AHAR) to Congress; 3 U.S. Department of Veteran Affairs 30
31 Male veterans/armed forces had: A firearm suicide rate similar to non-veteran civilians A firearm suicide rate 1.6 times higher compared to non-veteran civilians VETERAN/ ARMED FORCES NON-VETERAN CIVILIAN Firearm suicide rates* in North Carolina, Males age Males age or = 2 deaths per 100,000 residents In 92% of North Carolina s suicide deaths among male veterans and armed forces, circumstances were documented in the records (N=981). More than one circumstance may have been noted in the record. The five most frequent circumstances by age group, as well as information about suicide intent, and a suicide note, are shown below. Circumstances by age group were not calculated for females due to small numbers. AGE AGE AGE AGE % 16% 39% (N=192) (N=247) (N=161) (N=381) 44% Recent/imminent crisis 49% Current mental health 42% Intimate partner 39% Current mental health 38% Ever treated for mental abuse 2 Job/financial 22% Suicide intent disclosed 48% Ever treated for mental abuse 57% Current mental health 57% Ever treated for mental abuse 39% Recent/imminent crisis 29% Physical health 38% Intimate partner 19% Alcohol 25% Suicide intent disclosed 57% Physical health 39% Current mental health 38% Ever treated for mental abuse 29% Recent/imminent crisis 26% Recent/imminent crisis 22% Intimate partner 33% Suicide intent disclosed 11% Intimate partner 32% Suicide intent disclosed 28% Left a suicide note 37% Left a suicide note 31% Left a suicide note 3 Left a suicide note % 86% Depression/ dysthymia Depression/dysthymia was similar among veteran/armed forces and non-veteran civilian suicide victims 17% Post-traumatic stress was higher among veteran/armed forces suicide victims compared to non-veteran civilians 1% Post-traumatic stress 1% 4% Schizophrenia = Veteran/Armed Forces (N=459) = Non-Veteran Civilians (N=2356) 14% 8% 9% 11% Anxiety Bipolar Percentages will not add up to 10 as individuals may have had more than one diagnosis 9% Other/ Unknown 31

 Percent of all suicide victims in Ohio in 2010-2014 identified as veterans or armed forces Suicide rates were higher among")
32 Ohio Violent Death Reporting System (OHVDRS) Joined the NVDRS: 2009 First year of data collection: 2010 (66% of deaths) Ohio has 88 counties covering 40,800 square miles. It is the 7 th most populous state. Population estimates for Ohio 1 (Average annual estimate, ) Veteran (Age 18+) 819,311 Armed Forces (Age 16+) 8,415 Non-Veteran/Civilian (Age 18+) 8,076,630 Homeless Veterans 2 (estimated) Veteran Health Administration facilities in Ohio 3 Suicide (1,095 deaths) Percent of all suicide victims in Ohio in identified as veterans or armed forces Suicide rates were higher among veterans and armed forces in Ohio in Homicide (128 deaths) >1% Unintentional firearm (6 deaths) 1% Legal intervention (7 deaths) 4% Undetermined (55 deaths) SUICIDE was the most common type of violent death among veterans and armed forces in Ohio, occurring more than eight times as often as homicide during % Males 2% Females 18% Total Veterans/ Non-Veteran Armed Forces Civilians Males Females Total % 5% Firearm Hanging Poisoning Other ** 4% Black, non-hispanic 1% Hispanic 1% Asian/Pacific Islander, non-hispanic <1% Two or more races, other, or unknown race American Indian/Alaska Native, non-hispanic 25% Divorced 15% Widowed 13% Never married 3% Other/unknown status ** includes civil unions and domestic partnerships 32% Some college credit or college degree 9% Less than a high school education 1% Unknown or missing education level Percents may not equal 10 due to rounding. *All rates are occurrent ratios based on the number of resident and non-resident deaths that occurred in the state per 100,000 resident population. Statistical testing was not conducted. Differences between veterans/armed forces and non-veteran civilians may not be statistically significant. Sources: 1 U.S. Census Bureau, American Community Survey, ; 2 U.S. Department of Housing and Urban Development, 2014 Annual Homeless Assessment Report (AHAR) to Congress; 3 U.S. Department of Veteran Affairs 32
33 Male veterans/armed forces had: The highest firearm suicide rate A firearm suicide rate 1.5 times higher compared to non-veteran civilians VETERAN/ ARMED FORCES NON-VETERAN CIVILIAN Firearm suicide rates* in Ohio, Males age Males age or = 2 deaths per 100,000 residents In 87% of Ohio s suicide deaths among male veterans and armed forces, circumstances were documented in the records (N=933). More than one circumstance may have been noted in the record. The five most frequent circumstances by age group, as well as information about suicide intent, and a suicide note, are shown below. Circumstances by age group were not calculated for females due to small numbers. AGE AGE AGE AGE % 21% 46% (N=93) (N=215) (N=193) (N=432) 57% Current mental health 48% Intimate partner 4 Ever treated for mental abuse 46% Current mental health 41% Intimate partner 36% Ever treated for mental abuse 55% Current mental health 44% Ever treated for mental abuse 39% Recent/imminent crisis 35% Recent/imminent crisis 24% Physical health 26% Argument or conflict 3 Job/financial 53% Physical health 42% Current mental health 33% Recent/imminent crisis 25% Recent/imminent crisis 2 Job/financial 2 Suicide intent disclosed 24% Ever treated for mental abuse 13% Other death of friend or family member 24% Suicide intent disclosed 27% Suicide intent disclosed 26% Suicide intent disclosed 35% Left a suicide note 4 Left a suicide note 39% Left a suicide note 33% Left a suicide note % 72% Depression/ dysthymia Depression/dysthymia was similar among veteran/armed forces and non-veteran civilian suicide victims 7% Post-traumatic stress was higher among veteran/armed forces suicide victims compared to non-veteran civilians 1% Post-traumatic stress 5% 5% Schizophrenia = Veteran/Armed Forces (N=455) = Non-Veteran Civilians (N=2233) 11% 13% 14% 9% Anxiety Bipolar Percentages will not add up to 10 as individuals may have had more than one diagnosis 2 23% Other/ Unknown 33
34 Oklahoma Violent Death Reporting System (OKVDRS) Joined the NVDRS: 2003 First year of data collection: 2004 Oklahoma has 77 counties covering 68,000 square miles. It is the 28 th most populous state. Population estimates for Oklahoma 1 (Average annual estimate, ) Veteran (Age 18+) 304,035 Armed Forces (Age 16+) 18,726 Non-Veteran/Civilian (Age 18+) 2,554,819 Homeless Veterans 2 (estimated) Veteran Health Administration facilities in Oklahoma 3 Suicide (703 deaths) Homicide (81 deaths) 1% Unintentional firearm (8 deaths) 1% Legal intervention (7 deaths) 5% Undetermined (38 deaths) SUICIDE was the most common type of violent death among veterans and armed forces in Oklahoma, occurring more than eight times as often as homicide during Percent of all suicide victims in Oklahoma in identified as veterans or armed forces Suicide rates were higher among veterans and armed forces in Oklahoma in % Males 3% Females 21% Total Veterans/ Non-Veteran Armed Forces Civilians Males Females Total % 15% 9% 4% Firearm Hanging Poisoning Other ** 4% Black, non-hispanic 5% Two or more races, other, or unknown race 3% American Indian/Alaska Native, non-hispanic 2% Hispanic <1% Asian/Pacific Islander, non-hispanic 27% Divorced 13% Widowed 7% Never married 8% Other/unknown status ** includes civil unions and domestic partnerships 43% High school or GED graduate Less than a high school education 1% Unknown or missing education level Percents may not equal 10 due to rounding. *All rates are occurrent ratios based on the number of resident and non-resident deaths that occurred in the state per 100,000 resident population. Statistical testing was not conducted. Differences between veterans/armed forces and non-veteran civilians may not be statistically significant. Sources: 1 U.S. Census Bureau, American Community Survey, ; 2 U.S. Department of Housing and Urban Development, 2014 Annual Homeless Assessment Report (AHAR) to Congress; 3 U.S. Department of Veteran Affairs 34
35 Male veterans/armed forces had: The highest firearm suicide rate A firearm suicide rate 1.5 times higher compared to non-veteran civilians VETERAN/ ARMED FORCES NON-VETERAN CIVILIAN Firearm suicide rates* in Oklahoma, Males age Males age or = 2 deaths per 100,000 residents In 96% of Oklahoma s suicide deaths among male veterans and armed forces, circumstances were documented in the records (N=656). More than one circumstance may have been noted in the record. The five most frequent circumstances by age group, as well as information about suicide intent, and a suicide note, are shown below. Circumstances by age group were not calculated for females due to small numbers. AGE AGE AGE AGE % 26% 2 38% (N=100) (N=170) (N=134) (N=252) 53% Intimate partner 45% Current mental health 51% Current mental health 47% Intimate partner 41% Recent/imminent crisis 33% Ever treated for mental abuse 31% Job/financial 29% Ever treated for mental abuse 21% Suicide intent disclosed 37% Current mental health 35% Physical health 27% Intimate partner 7 Physical health 34% Current mental health 19% Recent/imminent crisis 33% Recent/imminent crisis 27% Recent/imminent crisis 12% Other death of friend or family member 29% Job/financial 24% Alcohol 12% Ever treated for mental abuse 28% Suicide intent disclosed 35% Suicide intent disclosed 24% Suicide intent disclosed 37% Left a suicide note 41% Left a suicide note 31% Left a suicide note 35% Left a suicide note % Depression/ dysthymia Depression/dysthymia was similar among veteran/armed forces and non-veteran civilian suicide victims 16% Post-traumatic stress was higher among veteran/armed forces suicide victims compared to non-veteran civilians 2% Post-traumatic stress 2% 7% Schizophrenia = Veteran/Armed Forces (N=278) = Non-Veteran Civilians (N=1091) 17% 11% 6% 7% Anxiety Bipolar Percentages will not add up to 10 as individuals may have had more than one diagnosis 11% 12% Other/ Unknown 35
36 Oregon Violent Death Reporting System (OVDRS) Joined the NVDRS: 2002 First year of data collection: 2003 Oregon has 36 counties covering 96,000 square miles. It is the 27 th most populous state. Population estimates for Oregon 1 (Average annual estimate, ) Veteran (Age 18+) 313,261 Armed Forces (Age 16+) 2,739 Non-Veteran/Civilian (Age 18+) 2,724,254 Homeless Veterans 2 (estimated) Veteran Health Administration facilities in Oregon 3 Suicide (790 deaths) 5% Homicide (47 deaths) <1% Unintentional firearm (4 deaths) 2% Legal intervention (19 deaths) 6% Undetermined (59 deaths) SUICIDE was the most common type of violent death among veterans and armed forces in Oregon, occurring more than 16 times as often as homicide during Percent of all suicide victims in Oregon in identified as veterans or armed forces 28% Males 4% Females 23% Total % 5 4 Suicide rates were higher among veterans and armed forces in Oregon in Veterans/ Non-Veteran Armed Forces Civilians Males Females Total % 11% 4% Firearm Hanging Poisoning Other ** 2% Hispanic 1% Black, non-hispanic 1% Two or more races, other, or unknown race 1% American Indian/Alaska Native, non-hispanic <1% Asian/Pacific Islander, non-hispanic 3 Divorced 15% Never married 13% Widowed 1% Other/unknown status ** includes civil unions and domestic partnerships 41% High school or GED graduate 9% Less than a high school education 2% Unknown or missing education level Percents may not equal 10 due to rounding. *All rates are occurrent ratios based on the number of resident and non-resident deaths that occurred in the state per 100,000 resident population. Statistical testing was not conducted. Differences between veterans/armed forces and non-veteran civilians may not be statistically significant. Sources: 1 U.S. Census Bureau, American Community Survey, ; 2 U.S. Department of Housing and Urban Development, 2014 Annual Homeless Assessment Report (AHAR) to Congress; 3 U.S. Department of Veteran Affairs 36
37 Male veterans/armed forces had: The highest firearm suicide rate A firearm suicide rate 2.6 times higher compared to non-veteran civilians VETERAN/ ARMED FORCES NON-VETERAN CIVILIAN Firearm suicide rates* in Oregon, Males age Males age In 92% of Oregon s suicide deaths among male veterans and armed forces, circumstances were documented in the records (N=702). More than one circumstance may have been noted in the record. The five most frequent circumstances by age group, as well as information about suicide intent, and a suicide note, are shown below. Circumstances by age group were not calculated for females due to small numbers. 10 or = 2 deaths per 100,000 residents AGE AGE AGE AGE 65+ 8% 25% 21% 46% (N=58) (N=176) (N=145) (N=323) 43% Intimate partner 43% Current mental health 49% Current mental health 46% Ever treated for mental abuse 36% Recent/imminent crisis 4 Intimate partner 24% Ever treated for mental abuse 24% Non-alcohol substance abuse 36% Suicide intent disclosed 41% Current mental health 38% Ever treated for mental 36% Recent/imminent crisis 31% Alcohol 31% Job/financial 36% Suicide intent disclosed 65% Physical health 41% Recent/imminent crisis abuse 34% Recent/imminent crisis 22% Current mental health 3 Job/financial 32% Suicide intent disclosed 2 Ever treated for mental abuse 14% Other death of friend or family member 36% Suicide intent disclosed 17% Left a suicide note 35% Left a suicide note 39% Left a suicide note 42% Left a suicide note % 76% Depression/dysthymia was similar among veteran/armed forces and non-veteran civilian suicide victims = Veteran/Armed Forces (N=260) = Non-Veteran Civilians (N=1201) Depression/ dysthymia Post-traumatic stress was higher among veteran/armed forces suicide victims compared to non-veteran civilians 14% 3% Post-traumatic stress 5% 7% Schizophrenia 19% 19% Anxiety 16% 16% Bipolar Percentages will not add up to 10 as individuals may have had more than one diagnosis 9% 13% Other/ Unknown 37
38 Rhode Island Violent Death Reporting System (RIVDRS) Joined the NVDRS: 2003 First year of data collection: 2004 Rhode Island has 5 counties covering 1,000 square miles. It is the 43 rd most populous state. Population estimates for Rhode Island 1 (Average annual estimate, ) Veteran (Age 18+) 68,506 Armed Forces (Age 16+) 3,316 Non-Veteran/Civilian (Age 18+) 764,004 Homeless Veterans 2 (estimated) Veteran Health Administration facilities in Rhode Island 3 30 Suicide (88 deaths) 6% Homicide (6 deaths) Unintentional firearm (0 deaths) Legal intervention (0 deaths) Undetermined (10 deaths) SUICIDE was the most common type of violent death among veterans and armed forces in Rhode Island, occurring more than 14 times as often as homicide during Percent of all suicide victims in Rhode Island in identified as veterans or armed forces Suicide rates were higher among veterans and armed forces in Rhode Island in % Males 2% Females 15% Total Veterans/ Non-Veteran Armed Forces Civilians Males Females *** 5.5 Total *** Rate not calculated, cell < % 31% 11% 9% Firearm Hanging Poisoning Other ** 3% Hispanic 1% Black, non-hispanic 1% Two or more races, other, or unknown race American Indian/Alaska Native, non-hispanic Asian/Pacific Islander, non-hispanic 22% Divorced 17% Never married Widowed 2% Other/unknown status ** includes civil unions and domestic partnerships 1% Some college credit or college degree 1% Less than a high school education High school or GED graduate Percents may not equal 10 due to rounding. Rhode Island is unable to confirm the number of accidental firearm deaths due to a limitation in its data system. *All rates are occurrent ratios based on the number of resident and non-resident deaths that occurred in the state per 100,000 resident population. Statistical testing was not conducted. Differences between veterans/armed forces and non-veteran civilians may not be statistically significant. Sources: 1 U.S. Census Bureau, American Community Survey, ; 2 U.S. Department of Housing and Urban Development, 2014 Annual Homeless Assessment Report (AHAR) to Congress; 3 U.S. Department of Veteran Affairs 38
39 Male veterans/armed forces had: A firearm suicide rate 3 times higher compared to non-veteran civilians VETERAN/ ARMED FORCES NON-VETERAN CIVILIAN Firearm suicide rates* in Rhode Island, Males, All Ages or = 2 deaths per 100,000 residents In 95% of Rhode Island s suicide deaths among male veterans and armed forces, circumstances were documented in the records (N=81). More than one circumstance may have been noted in the record. The five most frequent circumstances by age group, as well as information about suicide intent, and a suicide note, are shown below. Circumstances by age group were not calculated for females due to small numbers. AGE AGE AGE AGE 65+ 9% 31% 21% 4 (N=7) (N=25) (N=17) (N=32) Not calculated, n<5 68% Current mental health Not calculated, n<5 64% Ever treated for mental abuse Not calculated, n<5 48% Job/financial 47% Intimate partner 29% Physical health 29% Current mental health Not calculated, n<5 36% Alcohol 29% Ever treated for mental abuse Not calculated, n<5 32% Recent/imminent crisis 29% Recent/imminent crisis 16% 47% Physical health 38% Ever treated for mental abuse 31% Current mental health 22% Recent/imminent crisis 16% Intimate partner History of attempting suicide Suicide intent disclosed Suicide intent disclosed 32% Suicide intent disclosed Suicide intent disclosed n<5 n<5 n<5 Left a suicide note 32% Left a suicide note 47% Left a suicide note 31% Left a suicide note % 76% Depression/dysthymia was higher among veteran/armed forces suicide victims compared to nonveteran civilian suicide victims = Veteran/Armed Forces (N=35) = Non-Veteran Civilians (N=242) Depression/ dysthymia 17% Post-traumatic stress was higher among veteran/armed forces suicide victims compared to non-veteran civilians 21% 4% Post-traumatic stress 3% Schizophrenia 11% Anxiety Percentages will not add up to 10 as individuals may have had more than one diagnosis 9% 18% 2 14% Bipolar Other/ Unknown 39
40 South Carolina Violent Death Reporting System (SCVDRS) Joined the NVDRS: 2002 First year of data collection: 2003 South Carolina has 46 counties covering 30,000 square miles. It is the 23 rd most populous state. Population estimates for South Carolina 1 (Average annual estimate, ) Veteran (Age 18+) 399,931 Armed Forces (Age 16+) 34,066 Non-Veteran/Civilian (Age 18+) 3,165,466 Homeless Veterans 2 (estimated) Veteran Health Administration facilities in South Carolina 3 Suicide (427 deaths) 15% Homicide (80 deaths) 2% Unintentional firearm (8 deaths) <1% Legal intervention (1 death) 1% Undetermined (5 deaths) SUICIDE was the most common type of violent death among veterans and armed forces in South Carolina, occurring more than five times as often as homicide during Percent of all suicide victims in South Carolina in identified as veterans or armed forces 28% Males 3% Females 22% Total % 5 4 Suicide rates were higher among veterans and armed forces in South Carolina in Veterans/ Non-Veteran Armed Forces Civilians Males Females 9.9*** 7.9 Total *** Rate based on <20 deaths % 4% Firearm Hanging Poisoning Other ** 8% Black, non-hispanic 2% Two or more races, other, or unknown race <1% Hispanic <1% American Indian/Alaska Native, non-hispanic Asian/Pacific Islander, non-hispanic 16% Divorced 13% Widowed 13% Never married Other/unknown status ** includes civil unions and domestic partnerships 43% High school or GED graduate 8% Less than a high school education 1% Unknown or missing education level Percents may not equal 10 due to rounding. *All rates are occurrent ratios based on the number of resident and non-resident deaths that occurred in the state per 100,000 resident population. Statistical testing was not conducted. Differences between veterans/armed forces and non-veteran civilians may not be statistically significant. Sources: 1 U.S. Census Bureau, American Community Survey, ; 2 U.S. Department of Housing and Urban Development, 2014 Annual Homeless Assessment Report (AHAR) to Congress; 3 U.S. Department of Veteran Affairs 40
41 Male veterans/armed forces had: The highest firearm suicide rate A firearm suicide rate 1.3 times higher compared to non-veteran civilians VETERAN/ ARMED FORCES NON-VETERAN CIVILIAN Firearm suicide rates* in South Carolina, Males age Males age or = 2 deaths per 100,000 residents In 79% of South Carolina s suicide deaths among male veterans and armed forces, circumstances were documented in the records (N=328). More than one circumstance may have been noted in the record. The five most frequent circumstances by age group, as well as information about suicide intent, and a suicide note, are shown below. Circumstances by age group were not calculated for females due to small numbers. AGE AGE AGE AGE % 24% 21% 43% (N=41) (N=78) (N=69) (N=140) 37% Intimate partner 24% Job/financial 22% Current mental health 12% Ever treated for mental abuse 12% History of attempting suicide 41% Current mental health 37% Intimate partner 26% Job/financial 21% Ever treated for mental abuse 21% History of attempting suicide 3 Physical health 26% Current mental health 25% Job/financial 16% History of attempting suicide 14% Alcohol 61% Physical health 18% Current mental health 11% Intimate partner 11% Ever treated for mental abuse 8% Alcohol 29% Suicide intent disclosed 26% Suicide intent disclosed 2 Suicide intent disclosed 28% Suicide intent disclosed 27% Left a suicide note 26% Left a suicide note 3 Left a suicide note 3 Left a suicide note % 72% Depression/ dysthymia Depression/dysthymia was similar among veteran/armed forces and non-veteran civilian suicide victims 1% Post-traumatic stress Post-traumatic stress was higher among veteran/armed forces suicide victims compared to non-veteran civilians 4% 6% 6% 5% Schizophrenia Anxiety = Veteran/Armed Forces (N=89) = Non-Veteran Civilians (N=369) 17% 11% Bipolar Percentages will not add up to 10 as individuals may have had more than one diagnosis 18% 21% Other/ Unknown 41
 Veteran (Age 18+) 140,942 Armed Forces (Age 16+) 4,396 Non-Veteran/Civilian (Age 18+) 1,823,842 Homeless Veterans 2 (estimated)")
42 Utah Violent Death Reporting System (UTVDRS) Joined the NVDRS: 2004 First year of data collection: 2005 Utah has 29 counties covering 82,000 square miles. It is the 31 st most populous state. Population estimates for Utah 1 (Average annual estimate, ) Veteran (Age 18+) 140,942 Armed Forces (Age 16+) 4,396 Non-Veteran/Civilian (Age 18+) 1,823,842 Homeless Veterans 2 (estimated) Veteran Health Administration facilities in Utah 3 Suicide (395 deaths) 3% Homicide (14 deaths) >1% Unintentional firearm (2 deaths) 1% Legal intervention (7 deaths) 16% Undetermined (78 deaths) SUICIDE was the most common type of violent death among veterans and armed forces in Utah, occurring more than 28 times as often as homicide during Percent of all suicide victims in Utah in identified as veterans or armed forces 19% Males 3% Females 15% Total Suicide rates were higher among veterans and armed forces in Utah in Veterans/ Non-Veteran Armed Forces Civilians Males Females 35.5*** 10.7 Total *** Rate based on <20 deaths. 2 13% 14% 3% Firearm Hanging Poisoning Other ** 2% Hispanic 1% Black, non-hispanic 1% American Indian/Alaska Native, non-hispanic 1% Asian/Pacific Islander, non-hispanic 1% Two or more races, other, or unknown race 28% Divorced 16% Never married 7% Widowed 4% Other/unknown status ** includes civil unions and domestic partnerships 32% High school or GED graduate 6% Less than a high school education 2% Unknown or missing education level Percents may not equal 10 due to rounding. *All rates are occurrent ratios based on the number of resident and non-resident deaths that occurred in the state per 100,000 resident population. Statistical testing was not conducted. Differences between veterans/armed forces and non-veteran civilians may not be statistically significant. Sources: 1 U.S. Census Bureau, American Community Survey, ; 2 U.S. Department of Housing and Urban Development, 2014 Annual Homeless Assessment Report (AHAR) to Congress; 3 U.S. Department of Veteran Affairs 42
43 Male veterans/armed forces had: The highest firearm suicide rate A firearm suicide rate 2.2 times higher compared to non-veteran civilians VETERAN/ ARMED FORCES NON-VETERAN CIVILIAN Firearm suicide rates* in Utah, Males age Males age or = 2 deaths per 100,000 residents In 98% of Utah s suicide deaths among male veterans and armed forces, circumstances were documented in the records (N=370). More than one circumstance may have been noted in the record. The five most frequent circumstances by age group, as well as information about suicide intent, and a suicide note, are shown below. Circumstances by age group were not calculated for females due to small numbers. AGE AGE AGE AGE % 25% 23% 39% (N=47) (N=93) (N=84) (N=146) 57% Recent/imminent crisis 67% Recent/imminent crisis 48% Recent/imminent crisis 68% Physical health 55% Current mental health 51% Ever treated for mental abuse 49% Intimate partner 28% Job/financial 56% Intimate partner 48% Current mental health 48% Ever treated for mental abuse 34% Job/financial 46% Current mental health 46% Ever treated for mental abuse 44% Physical health 27% Job/financial 66% Recent/imminent crisis 4 Current mental health 39% Ever treated for mental abuse 17% Intimate partner 45% Suicide intent disclosed 39% Suicide intent disclosed 29% Suicide intent disclosed 38% Suicide intent disclosed 34% Left a suicide note 45% Left a suicide note 38% Left a suicide note 39% Left a suicide note % 74% Depression/ dysthymia Depression/dysthymia was higher among non-veteran civilian suicide victims compared to veteran/ armed forces suicide victims 1% Post-traumatic stress Post-traumatic stress was higher among veteran/armed forces suicide victims compared to non-veteran civilians 2% 5% Schizophrenia 16% 12% 12% Anxiety = Veteran/Armed Forces (N=179) = Non-Veteran Civilians (N=1056) Bipolar Percentages will not add up to 10 as individuals may have had more than one diagnosis 27% 19% Other/ Unknown 43
44 Virginia Violent Death Reporting System (VVDRS) Joined the NVDRS: 2002 First year of data collection: 2003 Virginia has 95 counties and 38 independent cities covering 39,000 square miles. It is the 12 th most populous state. Population estimates for Virginia 1 (Average annual estimate, ) Veteran (Age 18+) 718,034 Armed Forces (Age 16+) 108,658 Non-Veteran/Civilian (Age 18+) 5,496,232 Homeless Veterans 2 (estimated) Veteran Health Administration facilities in Virginia 3 Suicide (1,150 deaths) Homicide (130 deaths) 1% Unintentional firearm (10 deaths) 1% Legal intervention (10 deaths) 3% Undetermined (45 deaths) SUICIDE was the most common type of violent death among veterans and armed forces in Virginia, occurring more than eight times as often as homicide during Percent of all suicide victims in Virginia in identified as veterans or armed forces 27% Males 4% Females 22% Total % 4 Suicide rates were higher among veterans and armed forces in Virginia in Veterans/ Non-Veteran Armed Forces Civilians Males Females Total % 9% 5% Firearm Hanging Poisoning Other ** 9% Black, non-hispanic 2% Hispanic 1% Asian/Pacific Islander, non-hispanic <1% Two or more races, other, or unknown race American Indian/Alaska Native, non-hispanic 2 Divorced 17% Never married 12% Widowed 11% Other/unknown status ** includes civil unions and domestic partnerships 41% High school or GED graduate 11% Less than a high school education 1% Unknown or missing education level Percents may not equal 10 due to rounding. *All rates are occurrent ratios based on the number of resident and non-resident deaths that occurred in the state per 100,000 resident population. Statistical testing was not conducted. Differences between veterans/armed forces and non-veteran civilians may not be statistically significant. Sources: 1 U.S. Census Bureau, American Community Survey, ; 2 U.S. Department of Housing and Urban Development, 2014 Annual Homeless Assessment Report (AHAR) to Congress; 3 U.S. Department of Veteran Affairs 44
45 Firearm suicide rates* in Virginia, Male veterans/armed forces had: The highest firearm suicide rate A firearm suicide rate 1.4 times higher compared to non-veteran civilians VETERAN/ ARMED FORCES NON-VETERAN CIVILIAN Males age Males age or = 2 deaths per 100,000 residents In 96% of Virginia s suicide deaths among male veterans and armed forces, circumstances were documented in the records (N=1060). More than one circumstance may have been noted in the record. The five most frequent circumstances by age group, as well as information about suicide intent, and a suicide note, are shown below. Circumstances by age group were not calculated for females due to small numbers. AGE AGE AGE AGE % 25% 17% 4 (N=189) (N=270) (N=181) (N=420) 49% Intimate partner 52% Current mental health 55% Current mental health 47% Recent/imminent crisis 49% Recent/imminent crisis 46% Ever treated for mental abuse 47% Current mental health 39% Ever treated for mental abuse 27% Job/financial 48% Intimate partner 42% Ever treated for mental abuse 3 Job/financial 36% Job/financial 57% Physical health 41% Current mental health 3 Ever treated for mental abuse 35% Recent/imminent crisis 28% Recent/imminent crisis 26% Alcohol Intimate partner 31% Suicide intent disclosed 22% Suicide intent disclosed 23% Suicide intent disclosed 24% Suicide intent disclosed 39% Left a suicide note 43% Left a suicide note 45% Left a suicide note 35% Left a suicide note % 76% Depression/dysthymia was similar among veteran/armed forces and non-veteran civilian suicide victims = Veteran/Armed Forces (N=535) = Non-Veteran Civilians (N=2310) Depression/ dysthymia Post-traumatic stress was higher among veteran/armed forces suicide victims compared to non-veteran civilians 11% 2% Post-traumatic stress 2% 4% Schizophrenia 27% 21% Anxiety 9% 16% Bipolar Percentages will not add up to 10 as individuals may have had more than one diagnosis 22% 25% Other/ Unknown 45
 Veteran (Age 18+) 395,931 Armed Forces (Age 16+) 2,631 Non-Veteran/Civilian (Age 18+) 4,009,469 Homeless Veterans 2")
 200 150 100 50 171 124 128 139 135 SUICIDE was the most common type of violent death among veterans and armed forces in Wisconsin, occurring more than 15 times as often as homicide during")

46 Wisconsin Violent Death Reporting System (WIVDRS) Joined the NVDRS: 2003 First year of data collection: 2004 Wisconsin has 72 counties and 54,000 square miles. It is the 20 th most populous state. Population estimates for Wisconsin 1 (Average annual estimate, ) Veteran (Age 18+) 395,931 Armed Forces (Age 16+) 2,631 Non-Veteran/Civilian (Age 18+) 4,009,469 Homeless Veterans 2 (estimated) Veteran Health Administration facilities in Wisconsin 3 Suicide (697 deaths) 6% Homicide (44 deaths) 1% Unintentional firearm (5 deaths) 1% Legal intervention (8 deaths) 3% Undetermined (25 deaths) SUICIDE was the most common type of violent death among veterans and armed forces in Wisconsin, occurring more than 15 times as often as homicide during Percent of all suicide victims in Wisconsin in identified as veterans or armed forces 23% Males 3% Females 19% Total % 4 Suicide rates were higher among veterans and armed forces in Wisconsin in Veterans/ Non-Veteran Armed Forces Civilians Males Females Total % 13% 5% Firearm Hanging Poisoning Other ** 2% Black, non-hispanic 1% Hispanic 1% American Indian/Alaska Native, non-hispanic 1% Two or more races, other, or unknown race Asian/Pacific Islander, non-hispanic 25% Divorced 18% Never married 11% Widowed 1% Other/unknown status ** includes civil unions and domestic partnerships 43% Some college credit or college degree Less than a high school education <1% Unknown or missing education level Percents may not equal 10 due to rounding. *All rates are occurrent ratios based on the number of resident and non-resident deaths that occurred in the state per 100,000 resident population. Statistical testing was not conducted. Differences between veterans/armed forces and non-veteran civilians may not be statistically significant. Sources: 1 U.S. Census Bureau, American Community Survey, ; 2 U.S. Department of Housing and Urban Development, 2014 Annual Homeless Assessment Report (AHAR) to Congress; 3 U.S. Department of Veteran Affairs 46
Suicide Among Veterans and Other Americans Office of Suicide Prevention
 Suicide Among Veterans and Other Americans 21 214 Office of Suicide Prevention 3 August 216 Contents I. Introduction... 3 II. Executive Summary... 4 III. Background... 5 IV. Methodology... 5 V. Results
Public health surveillance for suicide-related data
 Public health surveillance for suicide-related data Alex E. Crosby Garrett L Smith Memorial Act Grantees seminar May 2014 National Center for Injury Prevention and Control Centers for Disease Control and
PROFILE OF THE MILITARY COMMUNITY
 2004 DEMOGRAPHICS PROFILE OF THE MILITARY COMMUNITY Acknowledgements ACKNOWLEDGEMENTS This report is published by the Office of the Deputy Under Secretary of Defense (Military Community and Family Policy),
Demographic Profile of the Active-Duty Warrant Officer Corps September 2008 Snapshot
 Issue Paper #44 Implementation & Accountability MLDC Research Areas Definition of Diversity Legal Implications Outreach & Recruiting Leadership & Training Branching & Assignments Promotion Retention Implementation
Dashboard. Campaign for Action. Welcome to the Future of Nursing:
 Welcome to the Future of Nursing: Campaign for Action Dashboard About This Dashboard: These graphs and charts show goals by which the Campaign evaluates its efforts to implement recommendations in the
In , an estimated 181,500 veterans (8% of
 U.S. Department of Justice Office of Justice Programs Bureau of Justice Statistics Special Report DECEMBER 2015 NCJ 249144 Veterans in and, 2011 12 Jennifer Bronson, Ph.D., E. Ann Carson, Ph.D., and Margaret
Students Experiencing Homelessness in Washington s K-12 Public Schools Trends, Characteristics and Academic Outcomes.
 Students Experiencing Homelessness in Washington s K-12 Public Schools 2016-17 Trends, Characteristics and Academic Outcomes October 2018 Building Changes thanks the Washington State Office of Superintendent
2012 Client-Level Data Analysis Webinar
 2012 Client-Level Data Analysis Webinar Ted Lutterman Data Analysis by Craig Colton, Neal DeVorsey, Glorimar Ortiz Special Thanks to Azeb Berhane September 24, 2013 Agenda Process & Methods Data Sets Overview
VOCA Assistance for Crime Victims
 VOCA Assistance for Crime Victims What is VOCA? Enacted in 1984, the Victims of Crime Act (VOCA) is the central source of federal financial support for direct services to victims of crime. VOCA is administered
Demographic Profile of the Officer, Enlisted, and Warrant Officer Populations of the National Guard September 2008 Snapshot
 Issue Paper #55 National Guard & Reserve MLDC Research Areas Definition of Diversity Legal Implications Outreach & Recruiting Leadership & Training Branching & Assignments Promotion Retention Implementation
TABLE 3c: Congressional Districts with Number and Percent of Hispanics* Living in Hard-to-Count (HTC) Census Tracts**
 Census Tracts**") living Alaska 00 47,808 21,213 44.4 Alabama 01 20,661 3,288 15.9 Alabama 02 23,949 6,614 27.6 Alabama 03 20,225 3,247 16.1 Alabama 04 41,412 7,933 19.2 Alabama 05 34,388 11,863 34.5 Alabama 06 34,849 4,074
living Alaska 00 47,808 21,213 44.4 Alabama 01 20,661 3,288 15.9 Alabama 02 23,949 6,614 27.6 Alabama 03 20,225 3,247 16.1 Alabama 04 41,412 7,933 19.2 Alabama 05 34,388 11,863 34.5 Alabama 06 34,849 4,074
Percentage of Enrolled Students by Program Type, 2016
 Percentage of Enrolled Students by Program Type, 2016 Doctorate 4% PN/VN 3% MSN 15% ADN 28% BSRN 22% Diploma 2% BSN 26% n = 279,770 Percentage of Graduations by Program Type, 2016 MSN 12% Doctorate 1%
Unemployment Rate (%) Rank State. Unemployment
 Rank State. Unemployment") States Ranked by February 2018 Unemployment Rate Seasonally Adjusted Unemployment Unemployment Unemployment 1 Hawaii 2.1 19 Alabama 3.7 33 Ohio 4.5 2 New Hampshire 2.6 19 Missouri 3.7 33 Rhode Island 4.5
States Ranked by February 2018 Unemployment Rate Seasonally Adjusted Unemployment Unemployment Unemployment 1 Hawaii 2.1 19 Alabama 3.7 33 Ohio 4.5 2 New Hampshire 2.6 19 Missouri 3.7 33 Rhode Island 4.5
Unemployment Rate (%) Rank State. Unemployment
 Rank State. Unemployment") States Ranked by November 2015 Unemployment Rate Seasonally Adjusted Unemployment Unemployment Unemployment 1 North Dakota 2.7 19 Indiana 4.4 37 Georgia 5.6 2 Nebraska 2.9 20 Ohio 4.5 37 Tennessee 5.6
States Ranked by November 2015 Unemployment Rate Seasonally Adjusted Unemployment Unemployment Unemployment 1 North Dakota 2.7 19 Indiana 4.4 37 Georgia 5.6 2 Nebraska 2.9 20 Ohio 4.5 37 Tennessee 5.6
Unemployment Rate (%) Rank State. Unemployment
 Rank State. Unemployment") States Ranked by April 2017 Unemployment Rate Seasonally Adjusted Unemployment Unemployment Unemployment 1 Colorado 2.3 17 Virginia 3.8 37 California 4.8 2 Hawaii 2.7 20 Massachusetts 3.9 37 West Virginia
States Ranked by April 2017 Unemployment Rate Seasonally Adjusted Unemployment Unemployment Unemployment 1 Colorado 2.3 17 Virginia 3.8 37 California 4.8 2 Hawaii 2.7 20 Massachusetts 3.9 37 West Virginia
Unemployment Rate (%) Rank State. Unemployment
 Rank State. Unemployment") States Ranked by August 2017 Unemployment Rate Seasonally Adjusted Unemployment Unemployment Unemployment 1 North Dakota 2.3 18 Maryland 3.9 36 New York 4.8 2 Colorado 2.4 18 Michigan 3.9 38 Delaware 4.9
States Ranked by August 2017 Unemployment Rate Seasonally Adjusted Unemployment Unemployment Unemployment 1 North Dakota 2.3 18 Maryland 3.9 36 New York 4.8 2 Colorado 2.4 18 Michigan 3.9 38 Delaware 4.9
Unemployment Rate (%) Rank State. Unemployment
 Rank State. Unemployment") States Ranked by March 2016 Unemployment Rate Seasonally Adjusted Unemployment Unemployment Unemployment 1 South Dakota 2.5 19 Delaware 4.4 37 Georgia 5.5 2 New Hampshire 2.6 19 Massachusetts 4.4 37 North
States Ranked by March 2016 Unemployment Rate Seasonally Adjusted Unemployment Unemployment Unemployment 1 South Dakota 2.5 19 Delaware 4.4 37 Georgia 5.5 2 New Hampshire 2.6 19 Massachusetts 4.4 37 North
Unemployment Rate (%) Rank State. Unemployment
 Rank State. Unemployment") States Ranked by September 2017 Unemployment Rate Seasonally Adjusted Unemployment Unemployment Unemployment 1 North Dakota 2.4 17 Indiana 3.8 36 New Jersey 4.7 2 Colorado 2.5 17 Kansas 3.8 38 Pennsylvania
States Ranked by September 2017 Unemployment Rate Seasonally Adjusted Unemployment Unemployment Unemployment 1 North Dakota 2.4 17 Indiana 3.8 36 New Jersey 4.7 2 Colorado 2.5 17 Kansas 3.8 38 Pennsylvania
Unemployment Rate (%) Rank State. Unemployment
 Rank State. Unemployment") States Ranked by December 2017 Unemployment Rate Seasonally Adjusted Unemployment Unemployment Unemployment 1 Hawaii 2.0 16 South Dakota 3.5 37 Connecticut 4.6 2 New Hampshire 2.6 20 Arkansas 3.7 37 Delaware
States Ranked by December 2017 Unemployment Rate Seasonally Adjusted Unemployment Unemployment Unemployment 1 Hawaii 2.0 16 South Dakota 3.5 37 Connecticut 4.6 2 New Hampshire 2.6 20 Arkansas 3.7 37 Delaware
Unemployment Rate (%) Rank State. Unemployment
 Rank State. Unemployment") States Ranked by September 2015 Unemployment Rate Seasonally Adjusted Unemployment Unemployment Unemployment 1 North Dakota 2.8 17 Oklahoma 4.4 37 South Carolina 5.7 2 Nebraska 2.9 20 Indiana 4.5 37 Tennessee
States Ranked by September 2015 Unemployment Rate Seasonally Adjusted Unemployment Unemployment Unemployment 1 North Dakota 2.8 17 Oklahoma 4.4 37 South Carolina 5.7 2 Nebraska 2.9 20 Indiana 4.5 37 Tennessee
Unemployment Rate (%) Rank State. Unemployment
 Rank State. Unemployment") States Ranked by November 2014 Unemployment Rate Seasonally Adjusted Unemployment Unemployment Unemployment 1 North Dakota 2.7 19 Pennsylvania 5.1 35 New Mexico 6.4 2 Nebraska 3.1 20 Wisconsin 5.2 38 Connecticut
States Ranked by November 2014 Unemployment Rate Seasonally Adjusted Unemployment Unemployment Unemployment 1 North Dakota 2.7 19 Pennsylvania 5.1 35 New Mexico 6.4 2 Nebraska 3.1 20 Wisconsin 5.2 38 Connecticut
Unemployment Rate (%) Rank State. Unemployment
 Rank State. Unemployment") States Ranked by July 2018 Unemployment Rate Seasonally Adjusted Unemployment Unemployment Unemployment 1 Hawaii 2.1 19 Massachusetts 3.6 37 Kentucky 4.3 2 Iowa 2.6 19 South Carolina 3.6 37 Maryland 4.3
States Ranked by July 2018 Unemployment Rate Seasonally Adjusted Unemployment Unemployment Unemployment 1 Hawaii 2.1 19 Massachusetts 3.6 37 Kentucky 4.3 2 Iowa 2.6 19 South Carolina 3.6 37 Maryland 4.3
YOUTH MENTAL HEALTH IS WORSENING AND ACCESS TO CARE IS LIMITED THERE IS A SHORTAGE OF PROVIDERS HEALTHCARE REFORM IS HELPING
 2 3 4 MENTAL HEALTH AND SUBSTANCE USE CONDITIONS ARE COMMON MOST AMERICANS LACK ACCESS TO CARE OF AMERICAN ADULTS WITH A MENTAL ILLNESS DID NOT RECEIVE TREATMENT ONE IN FIVE REPORT AN UNMET NEED NEARLY
Suicide Among Oregon Veterans
 Suicide Among Oregon Veterans 2008-2012 Oregon Violent Death Reporting System, Oregon Health Authority, Public Health Division 5/12/2014 Acknowledgements We deeply appreciate the contributions of Oregon
Annex A: State Level Analysis: Selection of Indicators, Frontier Estimation, Setting of Xmin, Xp, and Yp Values, and Data Sources
 Annex A: State Level Analysis: Selection of Indicators, Frontier Estimation, Setting of Xmin, Xp, and Yp Values, and Data Sources Right to Food: Whereas in the international assessment the percentage of
Radiation Therapy Id Project. Data Access Manual. May 2016
 Radiation Therapy Id Project Data Access Manual May 2016 ACKNOWLEDGEMENTS The Florida Cancer Data System gratefully acknowledges the following sources for their contribution to this manual: Centers for
CALENDAR YEAR 2013 ANNUAL REPORT
 CALENDAR YEAR 2013 ANNUAL REPORT National Center for Telehealth & Technology (T2) Defense Centers of Excellence for Psychological Health & Traumatic Brain Injury (DCoE) t2.health.mil The estimated cost
TABLE 3b: Congressional Districts Ranked by Percent of Hispanics* Living in Hard-to- Count (HTC) Census Tracts**
 Census Tracts**") Rank State District Count (HTC) 1 New York 05 150,499 141,567 94.1 2 New York 08 133,453 109,629 82.1 3 Massachusetts 07 158,518 120,827 76.2 4 Michigan 13 47,921 36,145 75.4 5 Illinois 04 508,677 379,527
Rank State District Count (HTC) 1 New York 05 150,499 141,567 94.1 2 New York 08 133,453 109,629 82.1 3 Massachusetts 07 158,518 120,827 76.2 4 Michigan 13 47,921 36,145 75.4 5 Illinois 04 508,677 379,527
Salary and Demographic Survey Results
 Salary and Demographic Survey Results Executive Summary In July of 2010, Grant Professionals Association (GPA formerly AAGP) conducted a salary and demographic survey of grant professionals. The survey
ACEP EMERGENCY DEPARTMENT VIOLENCE POLL RESEARCH RESULTS
 ACEP EMERGENCY DEPARTMENT VIOLENCE POLL RESEARCH RESULTS Prepared For: American College of Emergency Physicians September 2018 2018 Marketing General Incorporated 625 North Washington Street, Suite 450
2014 ACEP URGENT CARE POLL RESULTS
 2014 ACEP URGENT CARE POLL RESULTS PREPARED FOR: PREPARED BY: 2014 Marketing General Incorporated 625 North Washington Street, Suite 450 Alexandria, VA 22314 800.644.6646 toll free 703.739.1000 telephone
The Job Market Experiences of Gulf War II Era Veterans
 The Job Market Experiences of Gulf War II Era Veterans Paul E. Harrington Center for Labor Markets and Policy Drexel University Jan 2001 May 2001 Sep 2001 Jan 2002 May 2002 Sep 2002 Jan 2003 May 2003 Sep
FY 2014 Per Capita Federal Spending on Major Grant Programs Curtis Smith, Nick Jacobs, and Trinity Tomsic
 Special Analysis 15-03, June 18, 2015 FY 2014 Per Capita Federal Spending on Major Grant Programs Curtis Smith, Nick Jacobs, and Trinity Tomsic 202-624-8577 ttomsic@ffis.org Summary Per capita federal
REGIONAL AND STATE EMPLOYMENT AND UNEMPLOYMENT JUNE 2010
 For release 10:00 a.m. (EDT) Tuesday, July 20, USDL-10-0992 Technical information: Employment: Unemployment: Media contact: (202) 691-6559 sminfo@bls.gov www.bls.gov/sae (202) 691-6392 lausinfo@bls.gov
Nielsen ICD-9. Healthcare Data
 Nielsen ICD-9 Healthcare Data Healthcare Utilization Model The Nielsen healthcare utilization model has three primary components: demographic cohort population counts, cohort-specific healthcare utilization
The Prior Service Recruiting Pool for National Guard and Reserve Selected Reserve (SelRes) Enlisted Personnel
 Enlisted Personnel") Issue Paper #61 National Guard & Reserve MLDC Research Areas The Prior Service Recruiting Pool for National Guard and Reserve Selected Reserve (SelRes) Enlisted Personnel Definition of Diversity Legal
Issue Paper #61 National Guard & Reserve MLDC Research Areas The Prior Service Recruiting Pool for National Guard and Reserve Selected Reserve (SelRes) Enlisted Personnel Definition of Diversity Legal
Analysis of VA Health Care Utilization among Operation Enduring Freedom (OEF), Operation Iraqi Freedom (OIF), and Operation New Dawn (OND) Veterans
, Operation Iraqi Freedom (OIF), and Operation New Dawn (OND) Veterans") Analysis of VA Health Care Utilization among Operation Enduring Freedom (OEF), Operation Iraqi Freedom (OIF), and Operation New Dawn (OND) Veterans Cumulative from 1 st Qtr FY 2002 through 1 st Qtr FY
Analysis of VA Health Care Utilization among Operation Enduring Freedom (OEF), Operation Iraqi Freedom (OIF), and Operation New Dawn (OND) Veterans Cumulative from 1 st Qtr FY 2002 through 1 st Qtr FY
Reenlistment Rates Across the Services by Gender and Race/Ethnicity
 Issue Paper #31 Retention Reenlistment Rates Across the Services by Gender and Race/Ethnicity MLDC Research Areas Definition of Diversity Legal Implications Outreach & Recruiting Leadership & Training
REGIONAL AND STATE EMPLOYMENT AND UNEMPLOYMENT MAY 2013
 For release 10:00 a.m. (EDT) Friday, June 21, USDL-13-1180 Technical information: Employment: Unemployment: Media contact: (202) 691-6559 sminfo@bls.gov www.bls.gov/sae (202) 691-6392 lausinfo@bls.gov
Reading the Stars: Nursing Home Quality Star Ratings, Nationally and by State
 Reading the Stars: Nursing Home Quality Star Ratings, Nationally and by State Cristina Boccuti, Giselle Casillas, Tricia Neuman About 1.3 million people receive care each day in over 15,500 nursing homes
Percent of Population Under Age 65 Uninsured, 2013, 2014, and 2015
 Exhiit 1 Percent of Population Under Age 65 Uninsured, 13, 14, and 15 13 14 15
2015 State Hospice Report 2013 Medicare Information 1/1/15
 2015 State Hospice Report 2013 Medicare Information 1/1/15 www.hospiceanalytics.com 2 2013 Demographics & Hospice Utilization National Population 316,022,508 Total Deaths 2,529,792 Medicare Beneficiaries
FACT SHEET. The Nation s Most Punitive States. for Women. July Research from the National Council on Crime and Delinquency. Christopher Hartney
 FACT SHEET The Nation s Most Punitive States for Women Christopher Hartney Rates, as opposed to prison and jail population numbers, allow for comparisons across time and across states with different total
131,,000 homeless veterans on any given night 300,000 homeless veterans during the year 23% of the total number of homeless people are veterans
 131,,000 homeless veterans on any given night 300,000 homeless veterans during the year 23% of the total number of homeless people are veterans Vietnam era--97% are men 3% are women OEF/OIF 89% are men
 Page 1 of 11 NOAA Technical Memorandum NWS SR-193, Section 4 Section 4 Table of Contents: 4. Variations by State Weighted by Population A. Death and Injury (Casualty) Rate per Population B. Death Rate
Current Medicare Advantage Enrollment Penetration: State and County-Level Tabulations
 Current Advantage Enrollment : State and County-Level Tabulations 5 Slide Series, Volume 40 September 2016 Summary of Tabulations and Findings As of September 2016, 17.9 million of the nation s 56.1 million
Veterans Court. 2 nd Judicial District Court Reno, Nevada Legislative Committee on Senior Citizens, Veterans, and Adults with Special Needs May, 2012
 Veterans Court 2 nd Judicial District Court Reno, Nevada Legislative Committee on Senior Citizens, Veterans, and Adults with Special Needs May, 2012 Veterans Court in NV Statute approved by 2009 Legislature
INFOBRIEF SRS TOP R&D-PERFORMING STATES DISPLAY DIVERSE R&D PATTERNS IN 2000
 INFOBRIEF SRS Science Resources Statistics National Science Foundation NSF 03-303 Directorate for Social, Behavioral, and Economic Sciences November 2002 TOP R&D-PERFORMING STATES DISPLAY DIVERSE R&D PATTERNS
PERSONAL INFORMATION Male Female
 Please check the appropriate box to indicate which Drug Court Program applies to you. Adult Felony Post Plea Drug Court First time offenders (Do not check this box if you have more than one felony charge).
Summary of the State Elder Abuse. Questionnaire for Florida
 1 Summary of the State Elder Abuse Questionnaire for Florida A Final Report to: Department of Children & Families Adult Protective Services February 2002 Prepared by Researchers at The University of Iowa
Figure 10: Total State Spending Growth, ,
 26 Reason Foundation Part 3 Spending As with state revenue, there are various ways to look at state spending. Total state expenditures, obviously, encompass every dollar spent by state government, irrespective
STATE ENTREPRENEURSHIP INDEX
 University of Nebraska - Lincoln DigitalCommons@University of Nebraska - Lincoln Business in Nebraska Bureau of Business Research 12-2013 STATE ENTREPRENEURSHIP INDEX Eric Thompson University of Nebraska-Lincoln,
Home Health Chartbook 2018: Prepared for the Alliance for Home Health Quality and Innovation
 Home Health Chartbook 2018: Prepared for the Alliance for Home Health Quality and Innovation Avalere Health An Inovalon Company September 2018 Table of Contents 2018 Chartbook 1. Demographics of Home Health
Benefits by Service: Outpatient Hospital Services (October 2006)
") Page 1 of 8 Benefits by Service: Outpatient Hospital Services (October 2006) Definition/Notes Note: Totals include 50 states and D.C. "Benefits Covered" Totals "Benefits Not Covered" Totals Is the benefit
Page 1 of 8 Benefits by Service: Outpatient Hospital Services (October 2006) Definition/Notes Note: Totals include 50 states and D.C. "Benefits Covered" Totals "Benefits Not Covered" Totals Is the benefit
 3+ 3+ N = 155, 442 3+ R 2 =.32 < < < 3+ N = 149, 685 3+ R 2 =.27 < < < 3+ N = 99, 752 3+ R 2 =.4 < < < 3+ N = 98, 887 3+ R 2 =.6 < < < 3+ N = 52, 624 3+ R 2 =.28 < < < 3+ N = 36, 281 3+ R 2 =.5 < < < 7+
Population Representation in the Military Services
 Population Representation in the Military Services Fiscal Year 2008 Report Summary Prepared by CNA for OUSD (Accession Policy) Population Representation in the Military Services Fiscal Year 2008 Report
1998 AAPA Census Report
 Section I. General Information about Respondents Table 1. Distribution of Respondents by Sex Respondents... 15716 100.0% Male... 7413 47.2% Female... 8303 52.8% Table 2. Distribution of Respondents by
ETHNIC/RACIAL PROFILE OF STUDENT POPULATION IN SCHOOLS WITH
 Assembly on School-Based NASBHCNational Health Care Bringing Health Care to Schools for Student Success School-Based Health Centers National Census School Year 2004-05 PURPOSE A. Hanson 2007 The National
Tracking Non-Fatal Self-Harm Injuries with State-Level Data
 Tracking Non-Fatal Self-Harm Injuries with State-Level Data Anne Zehner, MPH Epidemiologist, Division of Policy and Evaluation Virginia Department of Health Overview Virginia s sources of state-level self-harm
Fleet and Marine Corps Health Risk Assessment, 02 January December 31, 2015
 Fleet and Marine Corps Health Risk Assessment, 02 January December 31, 2015 Executive Summary The Fleet and Marine Corps Health Risk Appraisal is a 22-question anonymous self-assessment of the most common
Its Effect on Public Entities. Disaster Aid Resources for Public Entities
 State-by-state listing of Disaster Aid Resources for Public Entities AL Alabama Agency http://ema.alabama.gov/ Alabama Portal http://www.alabamapa.org/ AK AZ AR CA CO CT DE DC FL Alaska Division of Homeland
Female Veterans in New Jersey: A Legal Needs Assessment
 Female Veterans in New Jersey: A Legal Needs Assessment [Pick the date ] This report funded by JUNE 2016 INTRODUCTION According to the U.S. Department of Veterans Affairs, 2 million of the country s 21
Certified Community Behavioral Health Clinic (CCHBC) 101
 101") Certified Community Behavioral Health Clinic (CCHBC) 101 On April 1, 2014, the President signed the Protecting Access to Medicare Act (PAMA) into law, which included a provision authorizing a two part
Certified Community Behavioral Health Clinic (CCHBC) 101 On April 1, 2014, the President signed the Protecting Access to Medicare Act (PAMA) into law, which included a provision authorizing a two part
Capital Punishment, 2011 Statistical Tables
 U.S. Department of Justice Office of Justice Programs Bureau of Justice Statistics Capital Punishment, 2011 Statistical Tables Tracy L. Snell, BJS Statistician At yearend 2011, 35 states and the Federal
Table 4.2c: Hours Worked per Week for Primary Clinical Employer by Respondents Who Worked at Least
 CONTENTS INTRODUCTION HIGHLIGHTS OF NATIONAL STATISTICS SECTION 1: CHARACTERISTICS OF 2009 AAPA CENSUS RESPONDENTS Table 1.1: Number and Percent Distribution of Census Respondents by State Where Employed...
Alaska (AK) Arizona (AZ) Arkansas (AR) California-RN (CA-RN) Colorado (CO)
 Arizona (AZ) Arkansas (AR) California-RN (CA-RN) Colorado (CO)") Beth Radtke 49 Included in the report: 7/22/2015 11:17:54 AM Alaska (AK) Arizona (AZ) Arkansas (AR) California-RN (CA-RN) Colorado (CO) Connecticut (CT) Delaware (DE) District Columbia (DC) Florida (FL)
Beth Radtke 49 Included in the report: 7/22/2015 11:17:54 AM Alaska (AK) Arizona (AZ) Arkansas (AR) California-RN (CA-RN) Colorado (CO) Connecticut (CT) Delaware (DE) District Columbia (DC) Florida (FL)
FIELD BY FIELD INSTRUCTIONS
 TRANSPORTATION EMEDNY 000201 CLAIM FORM INSTRUCTIONS The following guide gives instructions for proper claim form completion when submitting claims for Transportation Services using the emedny 000201 claim
MapInfo Routing J Server. United States Data Information
 MapInfo Routing J Server United States Data Information Information in this document is subject to change without notice and does not represent a commitment on the part of MapInfo or its representatives.
2001 AAPA Physician Assistant Census Report 1. Respondents % Male % Female %
 1 Section I. Personal Characteristics of Respondents* Table 1. Distribution of Respondents by Sex Respondents... 19786 100.0% Male... 8603 43.5% Female... 11183 56.5% Table 2. Distribution of Respondents
THE STATE OF GRANTSEEKING FACT SHEET
 1 THE STATE OF GRANTSEEKING FACT SHEET ORG ANIZATIONAL COMPARISO N BY C ENSUS DIV ISION S PRING 2013 The State of Grantseeking Spring 2013 is the sixth semi-annual informal survey of nonprofits conducted
METHODOLOGY FOR INDICATOR SELECTION AND EVALUATION
 CHAPTER VIII METHODOLOGY FOR INDICATOR SELECTION AND EVALUATION The Report Card is designed to present an accurate, broad assessment of women s health and the challenges that the country must meet to improve
Initials of State and Out of State DL # Complete as Applicable
 Bridgeway Center Inc. Community & Court Education Services Enrollment Form Have you ever attended any classes at Bridgeway Center, Inc.? Yes No Today s Date First Name Middle Name Last Name / / Address
CONNECTICUT: ECONOMIC FUTURE WITH EDUCATIONAL REFORM
 CONNECTICUT: ECONOMIC FUTURE WITH EDUCATIONAL REFORM This file contains detailed projections and information from the article: Eric A. Hanushek, Jens Ruhose, and Ludger Woessmann, It pays to improve school
Arizona State Funding Project: Addressing the Teacher Labor Market Challenge Executive Summary. Research conducted by Education Resource Strategies
 Arizona State Funding Project: Addressing the Teacher Labor Market Challenge Executive Summary Research conducted by Education Resource Strategies Key findings 1. Student outcomes in Arizona lag behind
Rankings of the States 2017 and Estimates of School Statistics 2018
 Rankings of the States 2017 and Estimates of School Statistics 2018 NEA RESEARCH April 2018 Reproduction: No part of this report may be reproduced in any form without permission from NEA Research, except
Salary and Demographic Survey Results
 Salary and Demographic Survey Results Executive Summary In April of 2013, GPA conducted a salary and demographic survey of grant professionals. The survey was distributed to all active GPA members and
Introduction. Current Law Distribution of Funds. MEMORANDUM May 8, Subject:
 MEMORANDUM May 8, 2018 Subject: TANF Family Assistance Grant Allocations Under the Ways and Means Committee (Majority) Proposal From: Gene Falk, Specialist in Social Policy, gfalk@crs.loc.gov, 7-7344 Jameson
DoDEA Seniors Postsecondary Plans and Scholarships SY
 DoDEA Seniors Postsecondary Plans and Scholarships SY 2011 12 Department of Defense Education Activity (DoDEA) Research and Evaluation Branch Ashley Griffin, PhD D e p a r t m e n t o f D e f e n s e E
Interstate Pay Differential
 Interstate Pay Differential APPENDIX IV Adjustments for differences in interstate pay in various locations are computed using the state average weekly pay. This appendix provides a table for the second
NAFCC Accreditation Annual Update
 NAFCC Accreditation Annual Update 1st year 2nd year First MI Last Co-provider (if applicable) Address on License, Registration or Certificate Phone Fax Mailing Address Email City State Zip County Country
Navy and Marine Corps Public Health Center. Fleet and Marine Corps Health Risk Assessment 2013 Prepared 2014
 Navy and Marine Corps Public Health Center Fleet and Marine Corps Health Risk Assessment 2013 Prepared 2014 The enclosed report discusses and analyzes the data from almost 200,000 health risk assessments
Background Memo. FROM: Erica Haft DATE: September 16, 2011
 Background Memo FROM: Erica Haft DATE: September 16, 2011 SUBJECT: RedEye Homicide Tracker, Police Beats & Illinois Violent Death Reporting System (IVDRS) I. How RedEye identifies cases RedEye s Tracking
On December 31, 2010, state and
 U.S. Department of Justice Bureau of Justice Statistics Prisoners in 2010 Paul Guerino, Paige M. Harrison, and William J. Sabol, BJS Statisticians On December 31, 2010, state and federal correctional authorities
MEDICARE COVERAGE SUMMARY: OUTPATIENT PSYCHIATRIC AND PSYCHOLOGICAL SERVICES
 OPTUM MEDICARE COVERAGE SUMMARY: OUTPATIENT PSYCHIATRIC AND PSYCHOLOGICAL SERVICES MEDICARE COVERAGE SUMMARY: OUTPATIENT PSYCHIATRIC AND PSYCHOLOGICAL SERVICES Guideline Number: Effective Date: April,
The American Legion NATIONAL MEMBERSHIP RECORD
 The American Legion NATIONAL MEMBERSHIP RECORD www.legion.org 2016 The American Legion NATIONAL MEMBERSHIP RECORD 1920-1929 Department 1920 1921 1922 1923 1924 1925 1926 1927 1928 1929 Alabama 4,474 3,246
MARINE AND FAMILY MEMBER SNAPSHOT 3 ACTIVE DUTY MARINE AND FAMILY STATUS 4 AGE 11 SERVICE TRENDS 12 SEPARATIONS 15 GENDER/ETHNICITY/EDUCATION 17
 1 Table of Contents MARINE AND FAMILY MEMBER SNAPSHOT 3 ACTIVE DUTY MARINE AND FAMILY STATUS 4 AGE 11 SERVICE TRENDS 12 SEPARATIONS 15 GENDER/ETHNICITY/EDUCATION 17 MARINE CORPS RESERVE DEMOGRAPHICS 19
Development of Houston Veterans Court
 Development of Houston Veterans Court Incarcerated Veterans Suicide Rates in Returning Veterans PTSD in Returning Veterans Why we need Veterans Courts Importance of Community Partnerships Unique Features
Fiscal Research Center
 January 2016 Georgia s Rankings Among the States: Budget, Taxes and Other Indicators ABOUT THE FISCAL RESEARCH CENTER Established in 1995, the (FRC) provides nonpartisan research, technical assistance
Characteristics of Adults on Probation, 1995
 U.S. Department of Justice Office of Justice Programs Bureau of Justice Statistics Special Report December 1997, NCJ-164267 Characteristics of Adults on Probation, 1995 By Thomas P. Bonczar BJS Statistician
Rutgers Revenue Sources
 Rutgers Revenue Sources 31.2% Tuition and Fees 27.3% State Appropriations with Fringes 1.0% Endowment and Investments.5% Federal Appropriations 17.8% Federal, State, and Municipal Grants and Contracts
2009 AAPA Physician Assistant Census National Report
 Report # CENS2009-01 January 2010 2009 AAPA Physician Assistant Census National Report Introduction The American Academy of Physician Assistants (AAPA) was founded in 1968 and is the only national organization
Grants 101: An Introduction to Federal Grants for State and Local Governments
 Grants 101: An Introduction to Federal Grants for State and Local Governments Introduction FFIS has been in the federal grant reporting business for a long time about 30 years. The main thing we ve learned
Use of Medicaid MCO Capitation by State Projections for 2016
 Use of Medicaid MCO Capitation by State Projections for 5 Slide Series September, 2015 Summary of Findings This edition projects Medicaid spending in each state and the percentage of spending paid via
The number of masters degrees awarded for all program areas at Land-grant institutions rose by 11,318 degrees (18%).
.") In This Edition >>> Graduate degrees awarded within agriculture. Graduate degrees awarded by the largest programs. Graduate degrees awarded by gender. Graduate degrees awarded by ethnicity. Summer 214
In This Edition >>> Graduate degrees awarded within agriculture. Graduate degrees awarded by the largest programs. Graduate degrees awarded by gender. Graduate degrees awarded by ethnicity. Summer 214
Listed below are the states in which GIFT has registered to solicit charitable donations and includes the registration number assigned by each state.
 Listed below are the states in which GIFT has registered to solicit charitable donations and includes the registration number assigned by each state. Alabama: AL16-188 Consumer Protection 501 Washington
Deputy Sheriff Trainee (Sponsorship)
") Deputy Sheriff Trainee (Sponsorship) Position Sought: Applicant Name: Last First Middle Applicant Address: House Number Street Name City State Zip Code Applicant Phone Number: ( ) Applicant Email Address:
Deputy Sheriff Trainee (Sponsorship) Position Sought: Applicant Name: Last First Middle Applicant Address: House Number Street Name City State Zip Code Applicant Phone Number: ( ) Applicant Email Address:
50 STATE COMPARISONS
 50 STATE COMPARISONS 2014 Edition DEMOGRAPHICS TAXES & REVENUES GAMING ECONOMIC DATA BUSINESS HOUSING HEALTH & WELFARE EDUCATION NATURAL RESOURCES TRANSPORTATION STATE ELECTION DATA Published by: The Taxpayers
I m confident that each person who has been executed in our state was guilty of the crime committed.
 I m confident that each person who has been executed in our state was guilty of the crime committed. Governor George W. Bush Texas politicians many of whom take great pride in being tough on crime spent
Sentinel Event Data. General Information Copyright, The Joint Commission
 Sentinel Event Data General Information 1995 2015 Data Limitations The reporting of most sentinel events to The Joint Commission is voluntary and represents only a small proportion of actual events. Therefore,
Centerstone Military Services for service members, veterans and their loved ones
 Centerstone Military Services for service members, veterans and their loved ones Centerstone s noble purpose our mission is delivering care that changes people s lives. About Centerstone Military Services