To: Mayor Pat Humphrey and the Clare City Commission From: Ken Hibl, City Manager Date: January 2, 2015 Regarding: City Manager's Report
|
|
|
- Cleopatra Banks
- 5 years ago
- Views:
Transcription
1 AGENDA REPORT To: Mayor Pat Humphrey and the Clare City Commission From: Ken Hibl, City Manager Date: January 2, 2015 Regarding: City Manager's Report For the Agenda of January 5, 2015 Update New IP Project. Project work essentially halted during the holiday period. Dependent upon weather conditions, Dunigan Brothers are tentatively scheduled to recommence work on Monday, January 5 th and will continue work on the gravity portion of the gravity sewer system until such time that environmental conditions preclude comfortably doing so. Freezing conditions have stabilized conditions on Colonville Road; we will continue to monitor the roadway throughout the winter and into spring until such time that the contractor can return to lay the final course of asphalt. Other utilities (Consumers Energy, DTE, AT&T, and Charter) continue working to upgrade/install park infrastructure; they will all make their own independent decisions on when to cease work until spring. Michigan Council for Advancement of Arts & Culture Grant. As reflected in the attached to Mayor Humphrey, the City is the recipient of an MCACA capital grant; these grant funds, coupled with a recent $20K grant from the Strosacker Foundation and the current fund balance (approx. $75K) of the Depot Committee will enable continued rehabilitation work on the depot commencing in the spring. Once the grant documents are received (anticipate mid-january), we will ask the City Commission for approval to accept the grant. The complete list of all capital grants awarded is also attached; as reflected, we were up against some significant competition most of whom are solely in the arts and culture business and have repetitively been grant recipients in the past. Consumers Energy Tree Grant. The City applied to Consumers Energy for reimbursement of our costs to plant new trees at Cherry Grove Cemetery. As reflected in the attached correspondence between Cathy Davis and Michelle Bott, we received $1,580. Prosperity Region-5 Strategic Plan. I previously mentioned to the Commission that I was invited to participate as a committee member to develop a strategic plan for Prosperity Region Five (eight county area of Arenac, Bay, Clare, Gladwin, Gratiot, Isabella, Midland, and Saginaw Counties). The prosperity regions (10 of them) were designated by Governor Snyder in 2012 to promote regional economic development in Michigan. Our region, which is managed by EMCOG (East Michigan Council of Governments an economic development organization funded and managed in part by EDA, the same federal agency that provided us the $2.6M grant to develop our new industrial park). As reflected in the att d RPI-5 Progress Report, our region applied for and received a grant to hire a consultant to assist in developing a strategic economic plan for our prosperity region. The approved strategic plan (copy att d) was publicly presented at SVSU on December 17 th. The plan is lengthy (120 pages), but approx. 75% (the last 90 pages) of the document is dedicated to statistical data much of quite interesting and some of it surprising. Cops & Doughnuts is highlighted on p. 117 of the plan as a stand-out example of entrepreneurship. Another Clare highlight is found on p. 22 of the report stating that the Northern Dry Bulk/Great Lakes Central Railroad transload terminal in Clare is the, premier 1
2 transload facility in the northern half of Michigan s Lower Peninsula. We are hosting the EMCOG Director, her assistant, and the EMCOG transportation coordinator in Clare on Wednesday, Jan 7 th at 10am for an orientation of the transload operations, which will be presented by Mr. Tom Kunse, the owner of Northern Dry Bulk, and Mr. Chris Bagwell, the COO of GLCRR. We welcome and encourage the City Commission to attend if you have interest and are available. Walgreen Tax Tribunal. We ve received notice (copy att d) of a tentative date for our Tax Tribunal for Walgreen s. Note that Walgreen s is contesting the assessments of a significant number of their stores in Michigan, to include Mt. Pleasant, Greenville, Muskegon, Grandville, etc. so we are in apparent good company. Absence. I will be on vacation out of the state for the period Jan 9-16; Steve will serve as the Acting CM during my absence. Attachments. 1. MCACA MCACA Capital Grants List. 3. Tree Grant s. 4. RPI-5 Progress Report. 5. RPI-5 Strategic Plan. 6. Tax Tribunal Notice. 2
3 State of Michigan file:///p:/common/city%20commission%20meeting%20packets/2015/010515/citymanage... Page 1 of 1 1/2/2015 From: Sent: To: Subject: Sue Carlson [carlsons@michigan.org] Friday, December 26, :35 AM Ken Hibl FY 2015 MCACA Capital Improvement Grant Award December 26, 2014 Pat Humphrey, Mayor City of Clare 202 W. Fifth Street Clare, MI Dear Mr.Humphrey: The Michigan Council for Arts and Cultural Affairs recently took action on grant requests for fiscal year I am pleased to inform you that your application was included among those recommended to receive support. On behalf of the Council, I congratulate you on your grant award, as referenced below: 15CI0015ZZ $51,874 Clare County Arts Council Activity Center Governor Rick Snyder and the Michigan Legislature appropriated approximately $9.7 million to MCACA for arts and cultural grants. These grants benefit the citizens of our state by supporting arts and culture as a catalyst for community revitalization and economic development, quality of life and by supporting arts education. You will receive your grant contract in a separate (early to mid-january). It is important that you carefully read the material and follow instructions to affirm your acceptance of the grant and to expedite the contracting process. Please note, in addition to acknowledging the MCACA grant in your promotional materials etc., if there are federal dollars from the National Endowment for the Arts (NEA) included as part of your grant award, proper acknowledgement of the NEA is required. To find out if you are receiving NEA funds look in Section 3 of your grant agreement. Before we are able to pay out any grant monies, you are required to return your signed grant agreement and a copy of the letter (or etc.) you used to notify the Governor and your local legislators that you have received this award. In addition, any fiscal year 2014 grants received by your organization need to be closed out prior to receiving funding for 2015 grants. If you have questions, please feel free to contact me or at 517/ or our staff at 517/ It is very gratifying to the Council to make these awards. Together we will continue to work to assist your organizations in providing access for all the citizens of Michigan to your excellent services, programs, projects. Again, I congratulate you on your award and thank you for continuing your important work in making quality arts and cultural offerings available to our many citizens and visitors. Sincerely, John Bracey, Executive Director Michigan Council for Arts and Cultural Affairs 300 N. Washington Square Lansing, MI BraceyJ@Michigan.org Facebook
4
5

6 file:///p:/common/city%20commission%20meeting%20packets/2015/010515/citymanage... Page 1 of 1 1/2/2015 From: Sent: To: Subject: Cathy Davis Friday, December 19, :02 PM Diane Lyon; Ken Hibl FW: 2014 Tree Planting Grant Was just this week on Tuesday. Cathy From: Michelle Bott Sent: Tuesday, December 16, :25 PM To: Cathy Davis Subject: 2014 Tree Planting Grant Cathy, The check from Consumers in the amount of $1, for the cemetery tree planting grant came today. J Michelle Bott, MiCPT Deputy Treasurer City of Clare ext 115

7 East Central MI Prosperity Region 5 Economic Strategy Plan Status Report: December 17, 2014 The 8-County East Central Michigan Regional Prosperity Strategy, which is being developed with the assistance of TIP Strategies Inc., is on track, on budget, and on schedule to be completed before December 30, The project commenced upon receipt of State funding on April 1, Through the RFP process TIP Strategies, Inc. was selected to develop a strategic plan. This project commenced in June 2014 and is being completed in 3 phases: Discovery (phase 1), Opportunity (phase 2), and Implementation (phase 3). The Discovery phase and the Opportunity phase are complete, and the Implementation phase is well underway. This work is being led by a 3- tiered process management structure: Tier 1) EMCOG; Tier 2) a Strategic Management Team (i.e., the RPI-5 collaborative group); and Tier 3) a Strategic Plan Advisory Team. The Strategic Management Team is made up of 28 community and business leaders from all 8 counties. Roles and responsibilities of the Strategic Management Team include: Monthly meetings with the consultants Review draft documents and provide feedback Identify and engage key stakeholders in the 8-county region Provide strategic direction for the content of the Regional Prosperity Strategy Approve and prioritize draft strategies Communicate with the Strategic Plan Advisory Team throughout the project The Strategic Plan Advisory Group includes a much broader cross-section of stakeholders from across the region. Roles and responsibilities of the Strategic Plan Advisory Group include: Meet in person 2 times during the strategic planning process (June through December) Provide feedback and guidance on potential strategies Communicate with other leaders and stakeholders across the 8-county region The Discovery Phase (phase 1) has been completed and included several components: A review of background materials (over 80 reports, planning documents, and other materials from the region) A regional tour of all 8 counties One-on-one interviews with 38 individuals (key stakeholders from the public and private sectors from across the region) 5 roundtable discussions with 45 participants centered on the topics of: transportation & infrastructure; workforce & education; economic development & marketing; entrepreneurship, innovation & capital attraction; development services & construction business: July 9-10, 2014 A meeting of the EMCOG Regional Economic Development team with 50 representatives of local governments, economic development organizations, and workforce organizations from across the region: July 11, 2014
8 Outreach to over 300 individuals through interviews, phone calls and group meetings from July through November. The initial meeting of the Strategic Management Team: August 14, 2014 Completion of an Economic Assessment & SWOT Analysis which includes wide range of qualitative and quantitative findings (economic and demographic trends, workforce analysis, and a statistical benchmarking that compares PR #5 to other Prosperity Regions and similar regions outside of Michigan in the Midwestern U.S.) The Opportunity Phase (phase 2) is completed and includes the following components: Completed: o Development of Draft strategies within the following categories: Economic Development & Marketing, Entrepreneurship & Innovation, Talent & Workforce Development, Transportation & Infrastructure, Place-Making & Talent Attraction o Opportunity Workshop with Strategic Plan Advisory Group: September 18, 2014 o 2 meetings of Strategic Management Team: September 10 th and October 7 th, 2014 o Initial identification of target industry clusters. o Identification of best practice examples (projects and programs) from within the region and from other communities across the U.S. The Implementation Phase (phase 3) is well underway and will include the following components: In Progress: o Development of the Regional Prosperity Strategy (the 5-year economic development blueprint) o Development of the Performance Dashboard with key indicators of economic health to be updated on a continual basis (at least monthly) o Organizational gap analysis (a matrix of the region s economic and community development organizations and their roles and responsibilities) o Implementation matrix which includes a list of actions, priorities, and metrics along with a timeline for implementation o 2 meetings of Strategic Management Team: November 5 th, 2014 and December 16 th 2014 o 1 meeting of Strategic Plan Advisory Group and Other Stakeholders (the roll-out of the plan): December 17 th, To Be Completed: o Strategic Management Team prioritization of Strategy Tasks (to be ranked and finalized in January, For further information contact Jane Fitzpatrick of East Michigan Council of Governments at or jfitzpatrick@emcog.org


9 REGIONAL PROSPERITY STRATEGY A 5-YEAR STRATEGIC PLAN FOR EAST CENTRAL MICHIGAN DECEMBER 2014
10
11 ACKNOWLEDGEMENTS TIP Strategies would like to thank the many individuals who participated in the creation of this Regional Prosperity Strategy. We are especially grateful to the Strategic Management Team who generously gave their time and input. Their expertise contributed immensely to our understanding of East Central Michigan and our recommendations for the 8-county region. We would also like to thank the leadership and staff of the East Michigan Council of Governments (EMCOG) for their critical guidance, support, and feedback throughout the development of this plan. STRATEGIC MANAGEMENT TEAM Jane Fitzpatrick, Project Manager EMCOG Janet Bloomfield Central Area Michigan Works! JoAnn Crary Saginaw Future Sue Fortune EMCOG Mike Hanley Saginaw County Commission Brad Kaye City of Midland Dave Munson Arenac County Commission Don Schurr Greater Gratiot Development, Inc. Jeff McNeal ETC-Adult Education, Midland/Saginaw Erin O Brien CMU Research Corporation Karre Ballard ETC-Adult Education, Clare/Gladwin Frank Cloutier Saginaw Chippewa Indian Tribe Dave Engelhardt EMCOG-Rural Task Force Garrett Geer AKT Peerless Bill Henderson Aircraft Precision Products Lyn Knapp ETC-Adult Education Ed Oberski Great Lakes Bay Michigan Works! Jay Anderson Bay City Area Transportation Study Jennifer Carroll Delta College Dan Petersen Central Area Michigan Works! Doug Bell Saginaw County MPO Mark Craft Gratiot County Road Commission Natasha Allen Michigan Works!, Region 7B Scott Govitz Mid Michigan Community College Ken Hibl City of Clare Harry Leaver SVSU Center for Business & Economic Dev. Bill Rhode Chair of EMCOG Council Maja Bolanowska Midland Area Transportation Study Matthew Felan Great Lakes Bay Regional Alliance STATE OF MICHIGAN DEPARTMENTAL REPRESENTATIVES Rex Anslie Dept. of Natural Resources James Espinoza MI State Housing Development Authority Scott Corrin Dept. of Ag. and Rural Development Chris Hare Dept. of Environmental Quality Jay Reithel Dept. of Transportation TIP STRATEGIES CONSULTING TEAM Jon Roberts Managing Principal Jeff Marcell Senior Partner John Karras Project Manager Image credits: Front Cover (left to right, top to bottom) Bay City by Ian Freimuth via Flickr (CC BY-NC-ND 2.0); Under Tridge by Aberro Creative via Flickr (CC BY 2.0); Autumn's Glory by Rachel Kramer via Flickr (CC BY 2.0); Fishing - Wildlife - Outdoors - Saginaw, MI, USA by Saginaw Future Inc via Flickr (CC BA 2.0); Alma College in the fall by SG_Design via Flickr (CC BY 2.0); City Hall (Bay City, Michigan) by cmh2315fl via Flickr (CC BY-NC 2.0); Morley Plaza in Downtown Saginaw by Saginaw Future Inc via Flickr (CC BY 2.0); Bridge in Alma, Michigan by Drew Jacksich via Flickr (CC BY-SA 2.0)
12
13 CONTENTS Acknowledgements...i Contents... iii Executive Summary... 1 Introduction... 1 Assets & Opportunities... 1 Challenges & Risks... 2 The Response... 2 SWOT Analysis... 3 About This Report... 9 Strategic Plan Vision Goals Goal 1. Economic Development & Marketing Goal 2. Entrepreneurship & Innovation Goal 3. Talent & Workforce Development Goal 4. Transportation & Infrastructure Goal 5. Place-Making & Talent Attraction Implementation Appendix A: Target Industry Analysis Introduction Target Industry Recommendations Appendix B: Economic Assessment About the Data Economy Workforce Statistical Benchmarking Appendix C: Economic Dashboard Appendix D: Best Practice Examples Appendix E: Table of Figures
14
15 EXECUTIVE SUMMARY INTRODUCTION In 2012, Michigan s Governor created the Regional Prosperity Initiative (RPI) and established 10 Prosperity Regions covering the entire State. The 8-county East Central Michigan Prosperity Region (PR-5) includes the counties of: Arenac, Bay, Clare, Gladwin, Gratiot, Isabella, Midland, and Saginaw. The PR-5 boundaries are based on the Region 5 Collaborative Development Council s boundaries that were established by the Michigan Economic Development Corporation (MEDC) in The 8-county region is also within the East Michigan Council of Governments (EMCOG) 14-county Economic Development District, created in 1968 by the US Department of Commerce. The primary goal of the RPI is the development of a five-year Regional Prosperity Strategy that brings together the 8 counties around a shared vision to set the stage for sustained regional economic growth. From June to December 2014, leaders from East Central Michigan worked in collaboration with TIP Strategies, an Austin-based economic development consulting firm, to create a Regional Prosperity Strategy designed to accelerate the region s economic success and maximize its potential. A cross-section of leaders (stakeholders representing economic development, workforce development, transportation, higher education, adult education, the private sector, and local governments) from each of the region s 8 counties was involved in the creation of this strategy. The resulting document includes the Regional Prosperity Strategy and goals, strategies, and specific actions to move the regional economy forward. The report also contains an Economic Assessment, SWOT Analysis, and a Target Industry Analysis. ASSETS & OPPORTUNITIES The assets and opportunities in East Central Michigan far outweigh the challenges and risks. In many ways, the region has an embarrassment of riches. Some of the region s strongest assets include: Higher education institutions Corporate and business leadership Major investments across the region Job growth in several key sectors Natural resources (water, recreation, agriculture) Affordability (land, labor, housing) Diversity across the 8 counties (urban, suburban, rural) Urban revitalization in the region s downtown districts (in large cities and small towns) Strong local organizations Huge potential for collaboration THEORY INTO PRACTICE PAGE 1
16 CHALLENGES & RISKS Despite the region s many strengths, there are some significant challenges and risks that could impact the region s potential for economic development if left unaddressed. Some of the region s most pressing challenges include: Stagnant population growth State and regional economic downturn State and local tax/budgetary climate Access to capital for start-ups and expansions Infrastructure maintenance Negative perceptions (internal and external) Middle-skill workforce gaps Lack of a cohesive regional identity/brand THE RESPONSE The strategic plan is centered on the most promising opportunities for economic prosperity in the 8-county East Central Michigan region. The summary to the right provides an overview of the strategic plan, including the vision and the major goals to support that vision. Within the plan, the strategies and actions to support each goal are explained in detail. This strategic plan will be successful if it helps East Central Michigan accomplish the following objectives: Increase the number and quality of jobs Raise per capita income levels Strengthen the tax base in the region s communities STRATEGIC PLAN SUMMARY VISION: The 8-county East Central Michigan region will become a leading destination in the state for new jobs, investment, and innovation by leveraging its corporate, academic, and community leaders to grow the regional economy and elevate the prosperity of the region s citizens. GOALS: GOAL 1. ECONOMIC DEVELOPMENT & MARKETING. Grow East Central Michigan s economy through economic development activities (business retention, expansion, and recruitment) and marketing efforts that enhance the region s image as a place to do business. GOAL 2. ENTREPRENEURSHIP & INNOVATION. Leverage East Central Michigan s higher education institutions, major corporations, medical complexes, and innovation assets to establish the region as a center for technology-based entrepreneurship and small business growth. GOAL 3. TALENT & WORKFORCE DEVELOPMENT. Build on the collaboration among East Central Michigan s higher education, adult education, secondary education (K- 12), and workforce development organizations to create a strong pipeline of talent to support the region s current and future employers. GOAL 4. TRANSPORTATION & INFRASTRUCTURE. Capitalize on East Central Michigan s existing transportation assets (roads, rail, port facilities, airports) and make strategic investments in regional infrastructure (including broadband) that improve the region s economic competitiveness. GOAL 5. PLACE-MAKING & TALENT ATTRACTION. Embark on local and regional initiatives to strengthen the quality of place in each of East Central Michigan s urban and rural communities to create an attractive environment for existing and future residents. Grow the region s population and housing stock Expand the region s entertainment and recreation offerings Increase the amount of capital investment within the region Improve the region s perception statewide, nationally, internationally, and within the region THEORY INTO PRACTICE PAGE 2
17 SWOT ANALYSIS Beyond our general findings and observations, TIP conducted a more extensive analysis of East Central Michigan s Strengths, Weaknesses, Opportunities, and Threats, which relied heavily on qualitative input and quantitative data analysis. The SWOT Analysis can be defined as follows: STRENGTHS. Advantages that can be built on to grow and strengthen the regional economy. WEAKNESSES. Liabilities and obstacles to economic development that could limit the region s growth potential. OPPORTUNITIES. Assets and positive trends that hold significant potential for increased regional prosperity and the attraction of new businesses, investments, and people. THREATS. Unfavorable external factors and trends that could negatively impact the regional economy. The SWOT Analysis is organized around five major themes: 1. ECONOMIC DEVELOPMENT & MARKETING. This includes traditional economic development (business recruitment, expansion, and retention), regional planning & collaboration, and marketing & regional image. 2. ENTREPRENEURSHIP & INNOVATION. This includes entrepreneurship, innovation, academic research & development, technology-based start-ups, and small business development. 3. TALENT & WORKFORCE DEVELOPMENT. This includes workforce development, adult education, secondary education (K-12), and higher education. 4. TRANSPORTATION & INFRASTRUCTURE. This includes transportation infrastructure (roads/highways, rail, airports, water-based transport), utilities (electric, gas, water, broadband), and public transportation. 5. PLACE-MAKING & TALENT ATTRACTION. This includes downtown revitalization, urban vitality, and recreation/entertainment amenities. THEORY INTO PRACTICE PAGE 3
18 SWOT ANALYSIS: ECONOMIC DEVELOPMENT & MARKETING STRENGTHS WEAKNESSES ê Well-run EDCs that collaborate regularly and focus on business retention, expansion, and recruitment Strong business, planning, and promotion groups (chambers, downtown associations, EMCOG, visitors bureaus, GLBRA) Existing concentrations in automotive, agriculture, food processing, chemicals, materials, thermoforming, health care, tourism, higher education, construction, and energy Several large private employers (Dow Chemical, Dow Corning, Nexteer, Hemlock Semiconductor, Covenant) Major investments/expansions (Nexteer, Suniva, Northern Logistics, Fabiano Brothers, Dow Corning, Morley) Numerous business/industrial parks with available land Employer Resource Network (Nexteer, Morley, Covenant) addressing collective issues: daycare, transit, lending Lansing area Foreign Trade Zone includes Gratiot, Isabella, and Clare Counties Region has many selling points for business recruitment: manufacturing history, workforce strengths, Dow, natural resources, quality of life, low costs, great educational institutions, improving state tax climate, diversity, shovelready sites Most of the region s economic development organizations are not well-funded Regional/state economy has struggled in last years Limited awareness among the private sector of the Prosperity Region Initiative No regional marketing organization (an economic development organization or chamber of commerce) exists Although there is a Great Lakes Bay brand, there is no common vision tied to the regional brand Barriers cited by economic development prospects: workforce availability (esp. in rural areas), lack of incentives, urban blight, perception of heavy unionization, airport access, high energy costs, availability of quality buildings OPPORTUNITIES THREATS State tax structure will likely become more competitive (eliminating personal property tax) Supplier opportunities associated with Dow, Nexteer, and other major private-sector companies in region The timing is right to do things differently and collaborate more regionally Saginaw County has a large ($3 million+) revolving loan fund that can be used throughout the region for economic development Potential target industries include: health care, medical specialties, energy (biomass, solar, wind, battery storage, oil & gas), manufacturing (chemicals, plastics, materials, automotive, semiconductors, medical devices), higher education, robotics, software & app development, foodie businesses (local craft restaurants, breweries, wineries) International investors have made and are seeking opportunities for investment in the region Collaboration between Great Lakes Bay Manufacturers Assoc. and Central Michigan Manufacturers Assoc. Regional marketing by Great Lakes Bay Regional Alliance Consumers Energy is doing $1 billion of in-state bid letting Michigan has highest auto insurance rates in the US because of the unlimited cap on catastrophic coverage The sheer number of townships, municipalities, counties, transit agencies, and other governmental entities makes regional collaboration difficult Saginaw County (and City of Saginaw especially) is viewed in a negative light by many people in the region, despite having many of the region s most important cultural assets Potential for Regional Prosperity Strategy to be viewed as forced collaboration Reliance on a handful of large private-sector employers (Dow Chemical, Dow Corning, Nexteer) THEORY INTO PRACTICE PAGE 4
19 SWOT ANALYSIS: ENTREPRENEURSHIP & INNOVATION STRENGTHS WEAKNESSES ê Numerous spin-outs from Dow Chemical CMU s entrepreneurship program is a major asset CMU New Venture Competition supports entrepreneurship across the region CMU Research Corp. and MidMichigan Innovation Center are nationally recognized resources for entrepreneurs Blue Water Angels Network in Midland is responsible for 1/3 of the state s total angel investments Numerous small business training assets (community colleges, SBDCs) Sprout Lab Ag entrepreneurship partnership between EMCOG, Saginaw Valley State University, and Grand Valley State University Northwood University International Auto Show Some of the region s major employers (Dow Chemical, Dow Corning, Nexteer) have a strong focus on research, development, and innovation High level of enthusiasm for entrepreneurial activities from community leaders Limited access to start-up capital Lack of awareness of entrepreneurial resources and programs in region Many entrepreneurs leave Michigan to take advantage of the entrepreneurial networks of other metropolitan regions (Chicago, West Coast, East Coast, Texas) Overwhelming number of entrepreneurs and start-ups are focused on a single product, rather than disruptive technologies or systems design (software, biotech) The region has the image and reputation as a corporate center rather than a location for start-ups Entrepreneurship is not celebrated enough in the region s communities OPPORTUNITIES THREATS Potential for additional SBIR/STTR funding Build on the software and information technology capabilities hidden in some of the region s large employers (Dow, Morley, Nexteer) Leverage Michigan State University s new Midland Research Institute for Value Chain Creation Attract programs and research to the region from other top schools (Michigan State University and University of Michigan in particular) Potential for additional R&D in the region: biotech, chemicals, electronics, advanced materials, plastics, automotive, battery technology, alternative energy Expand on the tech transfer at CMU and SVSU Potential linkages between chemical industry, precision manufacturing, plastics, and health care Potential for additional incubators in the region Place more emphasis on agriculture-related entrepreneurship opportunities through kitchen incubators, farmers markets, and other efforts Expose more students to corporate R&D Leverage SVSU Independent Testing Lab Continued loss of entrepreneurs to other areas Limited access to capital could prevent growth of start-up companies or expansion of existing businesses Some engineering functions in automotive sector may need to take place elsewhere to access the necessary talent (Silicon Valley, Chicago, Boston, Seattle, Austin, and other high-tech regions) The MidMichigan Innovation Center relies heavily on funding from Dow Chemical THEORY INTO PRACTICE PAGE 5
20 SWOT ANALYSIS: TALENT & WORKFORCE DEVELOPMENT STRENGTHS WEAKNESSES ê Outstanding higher education institutions in the region: CMU, SVSU, Alma College, Northwood University, Delta College, Mid Michigan Community College (MMCC), Davenport University Dow Foundation donation of $5 million to SVSU, $5 million to Alma College, and $4 million to Delta College for STEM education Bay Area Chamber partnership with Bay-Arenac ISD for co-op and internship programs The region s workforce boards are employer-driven Increasing collaboration among region s workforce boards Adult education funding at state level allows for re-training Workforce strengths: skilled trades, manufacturing, health care, chemical industry (many PhD-level scientists), Midwest work ethic Strong partnerships between major employers and community colleges (Delta and MMCC) Merrill Institute offers a welding training program Fast-Start (Delta) and Rapid Response (MMCC) programs Bay-Arenac ISD Career Center and Saginaw Career Complex CTE millage in Gratiot-Isabella RESD Many of the region s school districts struggle to sustain themselves Many segments of the workforce are lacking in soft skills, especially manufacturing and low-skill positions Specific workforce shortages in several occupational categories High percentage of adults without a high school diploma in some portions of the region Low K-12 math scores Large population of unserved adults in need of adult education Loose alumni ties at area universities (still function like a commuter school for alumni) OPPORTUNITIES THREATS Community Ventures program Many jobs currently going unfilled High demand for STEM jobs (at Dow Chemical and Dow Corning especially) Potential for a career & tech training center (K-12) that serves multiple counties Potential for much more collaboration among region s colleges and universities Region s rural counties could play a more active role in filling the workforce needs of Dow Chemical and other large employers Fast Start (Delta) and Rapid Response (MMCC) programs are replicable models that could apply to many industries Increase the amount of internships and work co-op programs throughout the region Tap into the region s seasoned workforce (age 50+), especially early retirees, for start-ups, retraining, and mentoring of younger workers and business owners Continue improving the region s educational attainment Middle-skills workforce gaps, especially in skilled trades (electricians, journeymen, systems engineers, HVAC) Low levels of interest from younger generations in skilled trades and manufacturing Large group of Baby Boomers soon entering retirement age Continued loss of young adults, especially college graduates THEORY INTO PRACTICE PAGE 6
21 SWOT ANALYSIS: TRANSPORTATION & INFRASTRUCTURE STRENGTHS WEAKNESSES ê No traffic congestion issues MBS airport (new terminal) is a major asset for the region Numerous general aviation airports that are key assets for some companies I-75 expansion/reconstruction Region s strategic location offers easy access to Detroit metro area and northern Michigan Major wind energy production in Gratiot County Lake Huron, Saginaw Bay, and the Saginaw River are major assets Port of Bay City is second largest port in Michigan by tonnage Bay City is third largest municipal utility in Michigan No Class 1 railroads in region (nearest Class 1 railroads are to the south in Flint and Lansing) Rails-to-trails program has reduced freight rail capacity Highway 127 has a missing section of 4-lane freeway in Gratiot County No expressways in Gladwin County Prices are generally higher at MBS International Airport than in Flint (Bishop International Airport) Bishop Airport has much more freight cargo than MBS Roads leading to MBS are inadequate Region s peninsular geography makes it less supportive of a major logistics & distribution industry Inadequate broadband infrastructure in some rural areas Michigan s relatively high electric utility rates (compared to other Midwestern states) OPPORTUNITIES THREATS MBS has spare capacity Significant unused capacity in region s ports Better utilization of existing railroads Potential for additional direct flights from MBS: Denver, Houston, New York, DC Complete section of US Highway 127 north of Lansing, between St. Johns and Ithaca (northern Clinton County and southern Gratiot County) Dow Chemical would like to use more rail to ship products/materials Potential for an inter-modal (truck to rail) facility in region Potential for additional freight rail in region Expansion of region s freight rail infrastructure would spur additional growth in agriculture industry RACER site in Buena Vista Township could be a place for an inter-modal facility Expand public transportation hours to include evenings to support adult education Combine individual transit agencies to pool resources and provide improved service Increase collaboration among the private port operators in Saginaw Bay and Saginaw River Standish grain elevator creates new transport options for agriculture industry State policy banning ballast from being dumped into the Great Lakes puts water-based transport at a disadvantage (compared to surrounding states) Public transportation does not adequately serve the region s workforce and adult education needs Transportation (to/from work & school) is also a big challenge for high school students Roads are generally in poor condition in the region (and in Michigan as a whole) and the current/expected funding for maintenance is far less than what is needed THEORY INTO PRACTICE PAGE 7
22 SWOT ANALYSIS: PLACE-MAKING & TALENT ATTRACTION STRENGTHS WEAKNESSES ê Low cost of living throughout region Strong downtown districts throughout region Urban revitalization yielding positive results across region Good place to raise a family Diversity of living options (urban, suburban, rural) Wide range of options for outdoor recreation Major companies support community development Uptown Bay City is a major asset for downtown Bay City Lots of second homes in northern tier of region (Clare, Gladwin, and Arenac counties) Major companies (Dow Chemical, Nexteer) and chambers of commerce have young professionals groups Hausbeck Pickle Company s employee home-ownership program Alma College s involvement in downtown revitalization Wide range of community events in cities and towns Saginaw Chippewa Tribe Casinos in Arenac and Isabella Counties serve as amenities and resources for local governments Relatively large population (570,000) in the region, despite not having a major metro area Difficult to recruit talent for professional jobs, especially from outside of the Midwest The region does not have any major metro areas Limited amount of jobs to attract/retain young adults from larger cities Stagnant population growth or population decline in most of the region s counties High levels of poverty in some of the region s urban areas and rural areas Depressed home values and home sales in parts of region OPPORTUNITIES THREATS Positive momentum and major assets in Saginaw County: CMU College of Medicine, Delta College (new downtown campus), Dow Events Center, Children s Zoo, VA Hospital, new downtown housing, Frankenmuth tourism Capitalize on the growing community of retirees and second home-owners in northern part of region (especially in Gladwin County) Conduct a survey of the region s young adults to identify strengths and gaps in the region s quality-of-life amenities Continue downtown revitalization across region Downtown Saginaw opportunities: student housing to serve Delta College and CMU College of Medicine, new space for farmers market, water taxi connecting downtown and Old Town, market properties to investors Expand young professionals groups into the rural portions of the region Align arts/culture efforts with economic development Creation of convention center space in region Limited amount of professional staff dedicated to urban planning, zoning, and community development throughout the region s local governments makes place-making more difficult Perception/reality of high crime rates in Saginaw Loss of young adults to larger metro areas (Chicago, Detroit, New York, others) Depressed home values in parts of the region make home sales and residential mobility difficult THEORY INTO PRACTICE PAGE 8
23 ABOUT THIS REPORT This report contains the strategic plan, a target industry analysis, an economic assessment, an economic dashboard, and best practice examples. The strategic plan establishes a vision and goals for the 8-county East Central Michigan Prosperity Region s economic development program. It outlines strategies and specific actions for each goal. Within the strategic plan, there are several descriptions of projects and programs that could address a challenge or opportunity for East Central Michigan. These include examples from outside of the region, as well as local best practices that should be expanded and further supported. The target industry analysis provides detailed profiles on the target industry sectors and recommended niches. The economic assessment also presents key economic and workforce data for East Central Michigan, including a statistical comparison with other Midwest regions. The economic assessment includes an analysis of the region s strengths, weaknesses, opportunities, and threats. This report contains the following sections: STRATEGIC PLAN. The strategic plan establishes a vision and goals for the 8-county East Central Michigan Prosperity Region s economic development program. It outlines strategies and specific actions for each goal. All of the strategies should be viewed and approached with an eye on leveraging and growing the industry clusters identified in Appendix A. TARGET INDUSTRY ANALYSIS (APPENDIX A). This section provides detailed profiles on the target industry sectors and recommended niches for East Central Michigan. The TIP team employed a threepronged approach quantitative, qualitative, and strategic to identify the region s best prospects for economic growth through a focus on specific industries. This task matched local assets with national and international trends to identify the industries that represent the highest potential for relocation or expansion. Several potential target industries were presented to the Strategic Management Team. The following five industries were selected: Higher Education & Research Professional Services Health Care Advanced Manufacturing Value-Added Agriculture & Food Processing ECONOMIC ASSESSMENT (APPENDIX B). The economic assessment presents key economic and workforce data for East Central Michigan, including statistical comparisons with other regions in the Midwestern US. The purpose is to understand the region s relative economic position and highlight its competitive advantages and disadvantages in the context of the larger economy. ECONOMIC DASHBOARD (APPENDIX C). The dashboard is a tool that provides an at-a-glance view of economic conditions in East Central Michigan. The dashboard will be available online and updated quarterly by EMCOG. THEORY INTO PRACTICE PAGE 9
24 BEST PRACTICE EXAMPLES (APPENDIX D). Through the stakeholder engagement process (roundtable discussions, workshops, and interviews) that involved nearly 300 individuals, it became apparent that the region has a poor self-image, despite the wide range of assets and positive attributes that exist in each corner of the 8-county region. This section exists to highlight and celebrate some of the programs and organizations within the region that are accomplishing great things. We have also highlighted a few successful programs from other parts of the US that can be used as models. THEORY INTO PRACTICE PAGE 10
25 STRATEGIC PLAN This strategic plan will guide the economic development efforts for the 8-county East Central Michigan Prosperity Region over the next five years. This plan presents a shared regional vision, a set of goals, and specific strategies to accelerate the region s economic success. This document provides a roadmap for East Central Michigan s economic development program, but the ultimate success of the recommendations will depend on the level of commitment from the region s business and community leaders in executing the strategies laid out in this plan. The plan is structured around a single vision and five goals. This framework is presented below: VISION The 8-county East Central Michigan region will become a leading destination in the state for new jobs, investment, and innovation by leveraging its corporate, academic, and community leaders to grow the regional economy and elevate the prosperity of the region s citizens. GOALS The following five goals support the vision statement and form the framework for the strategic plan. GOAL 1. ECONOMIC DEVELOPMENT & MARKETING: Grow East Central Michigan s economy through economic development activities (business retention, expansion, and recruitment) and marketing efforts that enhance the region s image as a place to do business. GOAL 2. ENTREPRENEURSHIP & INNOVATION: Leverage East Central Michigan s higher education institutions, major corporations, medical complexes, and innovation assets to establish the region as a center for technology-based entrepreneurship and small business growth. GOAL 3. TALENT & WORKFORCE DEVELOPMENT: Build on the collaboration among East Central Michigan s higher education, adult education, secondary education (K-12), and workforce development organizations to create a strong pipeline of talent to support the region s current and future employers. GOAL 4. TRANSPORTATION & INFRASTRUCTURE: Capitalize on East Central Michigan s existing transportation assets (roads, rail, port facilities, airports) and make strategic investments in regional infrastructure (including broadband) that improve the region s economic competitiveness. GOAL 5. PLACE-MAKING & TALENT ATTRACTION: Embark on local and regional initiatives to strengthen the quality of place in each of East Central Michigan s urban and rural communities to create an attractive environment for existing and future residents. The goals, strategies, and actions in the section that follows are not listed in order of priority. THEORY INTO PRACTICE PAGE 11
26 GOAL 1. ECONOMIC DEVELOPMENT & MARKETING Grow East Central Michigan s economy through economic development activities (business retention, expansion, and recruitment) and marketing efforts that enhance the region s image as a place to do business. The region s economic development organizations, led by the MEDC (Michigan Economic Development Corporation) Collaborative Development Council, have done a good job of growing the East Central Michigan economy in recent years. After multiple decades of job losses in the region and in Michigan as a whole, largely driven by the decline in automotive manufacturing, the region and state have turned the corner since the end of the Great Recession. The region s economic development organizations have played an important role in facilitating the region s recent job growth through the core economic development activities of business retention, expansion, and recruitment. These activities must continue and accelerate over the next five years to build on recent successes and to continue the growth in jobs, wages, and capital investment in the regional economy. New programs and efforts will also be needed to accelerate the region s economic success. Some of the biggest opportunities for economic development will come from both internal efforts (internal marketing efforts to promote collaboration within the region and the inclusion of more groups in economic development) and external efforts (marketing the 8-county region on the national stage and developing formal efforts to develop international business opportunities). STRATEGIES & ACTIONS 1. Expand international relationships & foreign investment in the 8-county region by establishing a formal effort to target and develop international business opportunities. a. Bring an 8-county regional delegation (made up of public, private, educational, and civic leaders) to China to meet with the company that purchased Nexteer Automotive. While there, set up multiple meetings with business, educational, and political leaders to establish relationships and look for business development opportunities for the region. b. Utilize the strength of the region s higher education institutions and workforce training efforts as a resource to build international relationships. Utilize and expand international programs and campuses that serve international students, like the Saginaw Valley State University sister school partnership with Ming Chuan University from Taiwan. c. Leverage the existing concentration of international students at regional higher education institutions. Evaluate where students are coming from and establish a relationship with those regions. Build a database of international alumni and communicate with them regularly so they stay connected to the region after they return to their home country. Utilize international students as interns to assist in the development of these efforts. THEORY INTO PRACTICE PAGE 12
27 d. Market and promote the services of the region s workforce training expertise in specific industry clusters to educational institutions in other countries. e. Assist large corporations in the region with the creation of a welcome program for international employees. This program could include: receptions and networking opportunities for international employees, community information and marketing material in foreign languages, and other transitional resources and support. f. Build on the region s relationships with businesses in Canada that might have an interest in expanding into Michigan. Also, continue to look for ways that companies in the region can develop focused marketing efforts to promote their products/services to Canadian customers. 2. Provide for greater efficiencies and collaboration in economic development efforts across the region by establishing a regional research and data resource for economic development organizations, workforce development groups, and local governments. a. Have EMCOG serve as a research resource for the 8-county region s economic development efforts [cities and economic development organizations (EDOs)]. The council can prepare regularly updated economic and demographic data sets for economic development efforts across the region thereby freeing up resources of each EDO/city so they can focus more on executing on business recruitment and retention/expansion activities. (See a description of EMCOG s regional collaboration efforts on page 109.) b. EMCOG should provide a questionnaire concerning the type of research utilized by EDOs and cities to identify common areas where it could provide support with a dedicated research analyst and online resources. 3. Initiate a major regional internal marketing campaign promoting East Central Michigan as a unified region. a. Promote shared threads among the region s 8 counties, highlighting data that demonstrate their connectedness (e.g., commuting patterns, retail spending, higher education facilities, and entertainment and recreation). b. Encourage community leaders to talk about the region as a whole. Consider using public service announcements to highlight regional activities and information. c. Communicate the economic development goals of the 8-county region and encourage every citizen to participate and support growing the local economy. d. As part of internal marketing efforts, engage the region s service industry especially restaurant and hotel staff and partner with the region s chambers of commerce to develop training sessions for service industry workers so that they can become better salespeople for East Central Michigan, projecting a positive image of the region to residents and visitors alike. 4. Market and promote the 8-county region as a great place to do business on the national stage. a. Expand existing marketing and business promotion efforts taking place in individual counties within the region to include references of the 8-county region as a whole. THEORY INTO PRACTICE PAGE 13
28 b. Identify and develop relationships with key decision makers (business executives, site consultants, and commercial real estate brokers) to promote the region as a place for business recruitment/expansion. c. Market to the identified industry cluster audiences by utilizing specific media channels that serve those industries at national and international conferences and by directly contacting decision makers and thought leaders in those industries. d. The East Central Michigan Prosperity Region should continue working closely with the MEDC Collaborative and state-level economic development officials to pursue new economic development opportunities for the region. 5. Engage a broad cross-section of organizations in the region s economic development & marketing efforts. Every organization in the region, whether non-profit, public, or private, should be aware of the overall economic development goals in the region and consider how they might contribute to their community s economic success. a. The Prosperity Region 5 Collaborative for the 8-county region could lead this effort. b. Set up regular meetings between the region s economic development organizations and other groups to enhance shared awareness of economic development activities and to get on the same page with regional marketing efforts. In addition to the region s economic development organizations, other groups that should be engaged include: utility providers, railroad companies, community foundations, chambers of commerce, and convention & visitors bureaus. c. Encourage as much collaboration across the region as possible between organizations that have similar missions, including mergers or joint meetings, if appropriate. For example, consider building a stronger alliance between the Great Lakes Bay Manufacturers Association and the Central Michigan Manufacturers Association. 6. Increase the level of funding for economic development activities across the 8-county region. a. Explore ways to establish a pool of grant funds that economic development organizations within the region could apply for to advance economic development initiatives. This would not be a redistribution of existing funding for economic development organizations and programs in the region; instead, it would be aimed at increasing the overall resources for economic development initiatives in the 8-county region. b. Catalog existing efforts that are not adequately funded, as well as new initiatives that should be funded. c. Launch a formal fundraising campaign to build this pool of resources from the public sector, private sector, and foundations. Consider hiring a fundraising consultant to execute the campaign. THEORY INTO PRACTICE PAGE 14
29 GOAL 2. ENTREPRENEURSHIP & INNOVATION Leverage East Central Michigan s higher education institutions, major corporations, medical complexes, and innovation assets to establish the region as a center for technology-based entrepreneurship and small business growth. The development of a strong entrepreneurial environment is critical for the long-term success of East Central Michigan s economy. Although not well known nationally or even locally, many of the assets needed to create a robust culture of entrepreneurship are already in place: a network of top-notch higher education institutions, several major corporations that conduct in-house R&D, and several unique entrepreneurship and small business support assets (CMU Research Corporation, the MidMichigan Innovation Center, the region s SBDCs, and the Blue Water Angels). Michigan also has two global research universities (Michigan State University and the University of Michigan) with high levels of R&D investment. In fact, the University of Michigan ranked second in the US with more than $1.3 billion in academic R&D expenditures in There is an opportunity to connect the research and innovation taking place in these two institutions with R&D activities being pursued by companies in East Central Michigan. STRATEGIES & ACTIONS 1. Create a regional entrepreneurship and start-up eco-system map indicating the various programs, initiatives, and assets that are in place to drive forward new business activity. a. Create an online map to help the entrepreneurs, start-ups, and investors to navigate the region s existing entrepreneurship and innovation resources and network. (See the Startup Seattle example on page 111.) b. The eco-system map can serve as a tool to improve awareness of the region to outsiders sending the message that East Central Michigan is a great place to launch a new enterprise or invest in a new venture. c. The map can also be used to educate the local community about the spirit of entrepreneurship that exists and the start-up activity that is taking place. Because so many people within the region are unaware of existing entrepreneurship and innovation assets, the map can serve as a promotion piece to get the community thinking of itself as a hotbed for entrepreneurs. 2. Improve access to start-up capital for local entrepreneurs by fully utilizing existing investment sources within the region and developing stronger ties to angel and venture capital investors outside of the region. a. Bring in venture capital and angel investors from major markets along the East Coast (Boston, New York, DC) and the Midwest (Chicago, Detroit, Minneapolis) to showcase the region s potential as a hub for startups and entrepreneurs. Partner with local businesses (law firms, accounting firms, and other professional services businesses) to sponsor and fund this effort. (See the Venture Investment & Partnering [VIP] Forum example from the Washington Biotechnology & Biomedical Association on page 111.) THEORY INTO PRACTICE PAGE 15
30 b. Work with the region s SBDCs (Small Business Development Centers) housed at Delta College and Mid Michigan Community College to assist local entrepreneurs with tapping into federal funding sources by applying for Small Business Innovation Research (SBIR) grants, the Small Business Technology Transfer program (STTR), and other programs available to entrepreneurs. c. Leverage the alumni networks at CMU, SVSU, Alma College, Northwood University, and Davenport University to communicate with successful alumni who are entrepreneurs, looking to invest in or return to the region. 3. Work with CMU and SVSU to support more R&D at each institution, especially research that benefits or leverages the region s existing companies (Dow Chemical and others). a. Leverage CMU s Institute for Great Lakes Research to attract additional R&D into the region associated with wetlands, fisheries, water ecology, GIS (Geographic Information Systems), and related fields. Explore the potential to collaborate with the private sector to fund this type of research. b. Support CMU s plans to grow the university s R&D budget from $11 million in 2012 to $25 million by c. Consider establishing shared space for additional 3-D printers and other physical and chemical testing equipment within SVSU s Center for Business and Economic Development. This could be a regional asset that supports the R&D and prototyping needs of local companies in the 8-county region. (See a description of SVSU s Center for Business and Economic Development on page 109.) 4. Work with the region s major employers and medical complexes to attract R&D spending from other Michigan universities. a. Build on the relationships between major corporations in East Central Michigan (Dow Chemical, Dow Corning, Nexteer, and others) and Michigan s two major research institutions (Michigan State University and the University of Michigan) to attract additional R&D investments into the region. b. Leverage the new Midland Research Institute for Value Chain Creation to expand the amount of R&D taking place in Midland and the surrounding area. Support the ongoing development of closer ties between MSU and Dow Chemical and Dow Corning. c. Host key researchers and leadership from the University of Michigan to showcase some of the potential collaborative research opportunities with the region s major corporations. Use regional businesses to sponsor/fund this event. d. Leverage the new CMU School of Medicine to expand opportunities for life sciences R&D associated with the region s large medical complexes. 5. Build on the region s entrepreneurship & innovation assets to support business growth across the region. THEORY INTO PRACTICE PAGE 16
31 a. Market and promote CMU s New Venture Competition, which is a major asset for the region and the state of Michigan as a whole. Utilize the competition s success to elevate the region s image as a great place for start-ups and entrepreneurs. (See a description of CMU s New Venture Competition on page 112.) b. The CMU Research Corporation s crowdsourcing funding model is a great way to support early-stage companies and could be replicated in other programs across the region. c. Building on CMU s success, encourage all of the region s higher education institutions to expand their focus on entrepreneurship as a way to retain graduates in the region. d. Work with the MidMichigan Innovation Center to explore the potential for spin-off companies and technologies from Dow Chemical and other major corporations in the region. (See a description of the MidMichigan Innovation Center on page 111.) e. Work with the region s chambers of commerce and business associations to enhance networking opportunities available for entrepreneurs, investors, and small business owners. THEORY INTO PRACTICE PAGE 17
32 GOAL 3. TALENT & WORKFORCE DEVELOPMENT Build on the collaboration among East Central Michigan s higher education, adult education, secondary education (K-12), and workforce development organizations to create a strong pipeline of talent to support the region s current and future employers. Access to a skilled workforce is the most important factor affecting the success of businesses in today s economy. Demographic trends at the national level will lead to a shrinking in the working-age population over the next couple decades. If economic and job growth continue, even at a minimal rate, employers will continue to have difficulties in finding skilled workers. Thus, one of the most urgent priorities for communities is to develop a pipeline of talent to support the growth of existing and future employers. Communities with an educated and skilled population have a big advantage in the competitive landscape of economic development, because employers are increasingly drawn to metro areas with concentrations of skilled workers. East Central Michigan s workforce has a mixture of strengths (a concentration of workers in manufacturing and health care and a major presence of scientists and engineers thanks to Dow Chemical and Dow Corning) and weaknesses (fewer college graduates than the national average and a low presence of professional services workers). However, the region has a major competitive advantage due to the numerous top-notch colleges and universities that, altogether, contain about 60,000 students. One of the most important outcomes of this strategic plan will be a greater emphasis on leveraging the region s higher education institutions for economic development. STRATEGIES & ACTIONS 1. Build on the success of Delta College s Fast Start program and Mid Michigan Community College s Rapid Response and Plastics Technology programs to support just in time workforce training for the region s employers. (See a description of the Fast Start program on page 114 and the Plastics Technology program on page 116.) a. Promote and market these workforce training programs as models of effective workforce training, to both employers and students. b. Work with the region s employers, economic development organizations, chambers of commerce, and industry associations to identify other industries that could be served by this program. c. As a secondary priority, consider expanding workforce training services to companies outside of the region. This would help create a pipeline of talent to feed into the 8-county region s higher education institutions and would also help support programs within the region s colleges and universities through larger class sizes. 2. Support the STEM-focused initiatives led by the Great Lakes Bay Regional Alliance. (See a description of this initiative on page 114.) THEORY INTO PRACTICE PAGE 18
33 a. Work with the 8-county region s employers, educational providers, and other organizations (EDOs, chambers, industry associations) to promote STEM learning and career pathways for K-12 students and adult education students wherever possible (through newsletters, at business events, on websites, and through social media). b. Meet regularly with the Great Lakes Bay Regional Alliance to explore ways for the Prosperity Region to improve STEM education outcomes in the short-term and long-term. 3. Improve the workforce readiness of the region s K-12 students and adult population by increasing the number of internships, work co-op programs, and other initiatives. a. Expand the amount of internships and work co-op programs for high school and college students to expose the region s young talent to employment opportunities in the region s businesses, government entities, and non-profit organizations. Utilize Alma College s leading internship programs as a model. b. Work with MiCAMP (Michigan Communities Association of Mapping Professionals) to expand educational opportunities associated with GIS (Geographic Information Systems) throughout the region. Leverage the GRACE (GIS Resources and Applications for Career Education) Project, a four-year project sponsored by the National Science Foundation and developed by Eastern Michigan University, for this purpose. (See a description of the GRACE Project on page 116.) c. Develop short-term and long-term training programs, internships, apprenticeships, and work co-op programs for adult students, ensuring that these programs are designed to lead to employment opportunities. 4. Encourage collaboration among the region s civic leadership programs to bring the region s young leaders together to discuss regional issues and challenges. a. Tap into Alma College s Responsible Leadership Institute to serve as a convening organization to bring together civic leadership efforts across the region. (See a description of Alma College s Responsible Leadership Institute on page 113.) 5. Find ways to align veterans with regional employers. a. Utilize the region s veterans as a pool of talent for employers, capitalizing on the tendency of veterans to prefer working alongside other veterans. 6. Establish a new career and technical training center in the region s rural counties. This could serve multiple counties and school districts. a. Identify a site for a shared career and technical training center to serve K-12 and adult education students in one of the region s northern counties (Clare, Gladwin, or Arenac). b. Consider partnering with the Associated Builders and Contractors construction training program (for electricians, welders, pipe fitters, etc.) for this effort. THEORY INTO PRACTICE PAGE 19
34 7. Conduct a feasibility study to explore the potential for a center of excellence that leverages the unique capabilities of higher education institutions and major corporations in the region to pursue new initiatives that do not currently exist in Michigan and have the potential to transform the region s economy over the long-term. EMCOG will convene and lead a coalition of partners to conduct a feasibility analysis and evaluation of the planning requirements for a potential Center of Excellence including: a. Identify key stakeholders and regional organizations that should be involved in this effort. These organizations should include, but may not be limited to, area colleges and universities, community and technical colleges, workforce development organizations, corporate research and development programs, as well as organizations and initiatives focused on transportation and economic development. b. Potential areas of collaboration including R&D, academic training, workforce training, events, etc. 8. Establish an EMCOG-led education committee made up of council members and representatives from higher education institutions to discuss potential areas of collaboration among the region s colleges and universities. (See an example of a similar committee from the Toledo Metropolitan Area Council of Governments on page 115.) a. Set up regular meetings that bring together this committee with major employers to connect the region s workforce training to the marketplace. b. Convene a higher education summit to discuss potential opportunities for collaboration including: i. Developing a healthcare pool for employees across institutions to save on insurance costs. ii. Advocating for dedicated state funding for training in the region s target industries and/or an increase in the share of the University of Michigan system s R&D spending. iii. Creating a combined alumni outreach and education program between the higher educational institutions as a tool to market the region and entice alumni to consider coming back to the region to live and work. Establish a regional jobs board for these alumni and local employers. iv. Encourage the region s higher education institutions to provide financial incentives for students that graduate on time. (See the Grand Valley State University on-time graduation incentive program on page 114.) THEORY INTO PRACTICE PAGE 20
35 GOAL 4. TRANSPORTATION & INFRASTRUCTURE Capitalize on East Central Michigan s existing transportation assets (roads, rail, port facilities, airports) and make strategic investments in regional infrastructure (including broadband) that improve the region s economic competitiveness. Well-functioning transportation networks and other key infrastructure components (like utilities and broadband) are essential for the long-term success of regional economies. East Central Michigan is fortunate to have a robust transportation network of highways, rail, water-based transport, and airports. It will be important to maintain and fully capitalize on the region s existing infrastructure, but there are also opportunities to make strategic investments in transportation and broadband infrastructure that will enhance the region s economic potential. One of the region s biggest advantages is the significant amount of underutilized capacity across all modes (roads, rail, water, air). MBS International Airport, in particular, is a major asset for the entire 8-county region (and beyond) that can be leveraged for economic development. The region s rail network and the water-based transport facilities along the Saginaw River and Saginaw Bay can also be further capitalized on to support the growth of freightintensive industries like agriculture, construction, and manufacturing. Many of the region s major manufacturing and agriculture companies, Dow Chemical in particular, have expressed a desire to increase their use of rail and waterbased transport. STRATEGIES & ACTIONS 1. Convene a freight mobility roundtable that meets quarterly to share information on regional transportation issues. a. EMCOG can serve as the convening body for this group. b. The roundtable can serve as a regular forum to bring together public and private sector leaders involved in transportation and freight mobility to discuss transportation issues affecting the region, hear presentations from local/state/federal transportation planners, and learn about major transportation policy or funding efforts. 2. Fill key gaps in the regional highway system to support the growth of existing businesses and the attraction of new companies. a. Study the Highway 127 gap in Gratiot County (the section of highway that is not a limited-access roadway, and has lower speed limits) to estimate its impact on existing businesses and on the recruitment of economic development prospects. Site consultants and corporations sometimes rule out locations in Gratiot, Isabella, and Clare Counties for business relocations/expansions because of the lack of highway access connecting the region to the south. Additional transportation costs for existing businesses also result from this gap. The MDOT Economic Development Fund could be a funding source to address this problem. THEORY INTO PRACTICE PAGE 21
36 b. Prioritize improvements to the roadways leading to/from MBS International Airport; the existing routes are essentially rural roads. Expanding and improving some of the main roadways that connect to MBS (Garfield Road, Freeland Road, and other roadways) is one way to improve the competitiveness of the airport in the struggle to attract passengers that might otherwise fly out of Bishop International Airport in Flint. Identification of these improvements should be a collaborative process involving MBS, MDOT, MPOs (metropolitan planning organizations), local road commissions, and other key stakeholders. 3. Leverage and make strategic investments in the region s existing rail infrastructure to support the growth of key industries, particularly the agriculture sector. a. Prioritize rail-related investments based on the recommendations from MDOT s recent report titled The role of rail infrastructure in the economic development of Michigan s Northern Lower Peninsula. b. Explore the potential to enhance rail infrastructure connecting the region to Canada through Port Huron. c. Build on the existing Great Lakes Central Rail/Northern Dry Bulk transload terminal in Clare, which is the premier transload facility in the northern half of Michigan s Lower Peninsula region. d. Consider investing in re-configurations and/or expansions of the rail yards in Saginaw and Bay City to make rail transport more efficient for the region s rail-dependent businesses. e. Build on the success of the Standish Grain Elevator by exploring opportunities to develop additional connections, capacity, and rail-related infrastructure (inter-modal facilities, trans-load facilities, grain elevators, etc.) to support existing companies and make the region more competitive in attracting new businesses. 4. Explore ways to make better use of water-based transport for goods movement, especially for the agriculture, construction, and utilities sectors. a. Support and leverage the US Army Corps of Engineers study to widen and deepen the Saginaw River shipping channel as a way to encourage the continued and expanded use of the river for goods movement. b. Conduct an economic impact analysis of the water-based transport facilities in the Saginaw River and Saginaw Bay to demonstrate the number of jobs and amount of tax revenue that these transportation facilities provide to the region and the state, along with historical fluctuations of this impact. c. Explore the possibility of expanding water-based transport to Canada. d. Support greater collaboration among the region s private port operators and industries that depend on water-based transport (agriculture and construction, in particular). 5. Leverage and support MBS International Airport to more fully capitalize on its potential for economic development. THEORY INTO PRACTICE PAGE 22
37 a. Work with MBS and major employers (Dow Chemical, Dow Corning, and Nexteer) and other large institutions (Central Michigan University and Saginaw Valley State University) to identify and aggressively pursue additional direct flights to major airports. b. Potential destinations for new direct flights from MBS include: Atlanta (expand from once/week to daily), Houston, Denver, New York, and DC. c. Explore the potential to increase the amount of air cargo to/from MBS. d. Work with MBS, local economic development corporations, and the region s real estate community to identify opportunities to capitalize on the large amount of land and under-utilized buildings on the airport property, particularly the old airport terminal facilities. 6. Support efforts to maintain and improve the region s highways and local roadways. a. Continue working with EMCOG, the Michigan Transportation Asset Management Council, and regional civil engineers to re-evaluate current road maintenance standards to make the most efficient use of financial resources devoted to the repair and maintenance of local roadways. b. Support the efforts led by EMCOG and the region s MPOs, local governments, and transportation planners to prioritize road improvements where they are needed most to improve the safety and connectivity of the region s roadway infrastructure. 7. Continue to expand and improve broadband internet access throughout the region, especially in rural areas. a. Focus on expanding broadband service in areas where it is not currently available (mostly in the region s rural areas). b. Support Gladwin County s efforts to survey residents about the demand for broadband service. Utilize the results of this survey to market the county to internet providers. If successful, consider using a similar approach to increase broadband access in other parts of the region. 8. Provide more comprehensive and more efficient transit service to support the region s workforce, employers, and educational providers. a. Work with MDOT and EMCOG to support and leverage the Governor s Regional Transit Mobility Study as a way to document the region s public transportation needs, with the goal of improving transit access for the region s workforce and employers. b. Encourage the region s public transportation agencies to meet regularly and work together to serve the region more efficiently through inter-agency agreements or other cooperative efforts. THEORY INTO PRACTICE PAGE 23
38 c. Work with the region s higher education institutions, adult education providers, major employers, and other key constituents to identify ways to expand transit options to better serve the region s workforce. This may include extending public transportation into the evening hours in some cases. d. Ensure that key regional destinations (MBS International Airport, colleges and universities, and major employers) are served by public transportation. e. Over the long-term, consider combining some or all of the region s separate public transportation agencies to into a single, region-wide transit agency. THEORY INTO PRACTICE PAGE 24
39 GOAL 5. PLACE-MAKING & TALENT ATTRACTION Embark on local and regional initiatives to strengthen the quality of place in each of East Central Michigan s urban and rural communities to create an attractive environment for existing and future residents. Today s generation of young adults, much more than previous generations, favors urban living and everything that comes with it (riding transit, walking, biking, patronizing locally owned shops and restaurants instead of national chains, etc.). Providing an attractive environment which appeals to young professionals is critical for economic development because the number one issue for companies (and by extension, for communities) is access to qualified workers. And this is not limited to large cities. A growing amount of small cities and towns offer walkable neighborhoods and downtown districts that attract young people. Ultimately, the communities that can attract and retain skilled workers (whether they are large cities or small towns) have a major competitive advantage in today s economy. East Central Michigan has struggled to retain and attract talented workers, especially young professionals, in recent decades. This struggle is not unique to the region in fact, it s a national issue. However, the problem is often more challenging in small and mid-size metro areas that have fewer amenities than large metro areas. Nonetheless, East Central Michigan is well positioned to emerge as a leading destination for talent. The region has a variety of attractive downtown districts in some of the region s smallest communities and largest cities, many of which are experiencing an uptick in investment and development from both public and private sectors. And the region has many companies (large and small) that are committed to enhancing their communities as a way to retain and attract skilled workers. STRATEGIES & ACTIONS 1. Tell the stories of successful downtown revitalization efforts across region. a. Begin by highlighting the massive transformation of downtown Bay City from an area filled with boardedup, vacant buildings in the 1980s to a vibrant mixed-use district today. Use Bay City as the regional model for downtown revitalization. (See a description of Bay City s successful downtown revitalization efforts on page 117.) b. Also, highlight the progress being made toward increased urban vitality in Saginaw, Midland, Mount Pleasant, and many of the region s smaller downtowns (Alma, Ithaca, Clare, Harrison, and Frankenmuth, among others). 2. Package the region s downtowns as investment opportunities. a. Conduct an inventory of available properties in each downtown. THEORY INTO PRACTICE PAGE 25
40 b. Highlight unique assets in each area and use targeted marketing to pitch the downtown as an investment opportunity to investors that are interested in urban revitalization, focusing on people with some ties to East Central Michigan. c. Consider establishing a fund to stimulate redevelopment in the region s downtowns. Explore options to utilize the region s land banks as a vehicle to fund this initiative. 3. Support the City of Saginaw in its development of catalyst projects to revitalize its downtown district. a. Leverage the CMU College of Medicine and upcoming downtown Saginaw Delta College campus as catalysts to spur additional revitalization in downtown Saginaw. b. Identify ways to capitalize on the existing entertainment venues (Dow Event Center, Temple Theater) and major events (music festivals, 4 th of July celebration, etc.) to further stimulate interest and investment in downtown Saginaw. c. Launch a marketing initiative to educate people within the region about the improved level of safety in Saginaw. Include updates on recent successes, citing the major decline in the city s rate of violent crime. 4. Establish place-making and good urban planning as a regional priority. a. Engage the Urban Land Institute (ULI) to conduct a regional downtown revitalization study. This study could focus on a single downtown or the multiple downtowns serving the region and culminate in a ULI conference to attract real estate development leaders from across the country. b. Consider establishing a community and regional planning organization for the 8-county region that assists local governments with land use planning. EMCOG could potentially fill this role by serving as a resource to local governments that cannot afford to maintain a full-time staff of professional urban planners, zoning administrators, and downtown development specialists. c. Hold a regional place-making summit that brings together government entities, the real estate community, and major employers from across the region to share best practices and discuss the challenges/opportunities associated with improving the quality of place in each community in East Central Michigan. 5. Create a regional approach to develop and promote local farmers markets. a. Work with the region s agricultural sector and existing farmers markets to establish a collaborative effort to promote the ongoing success and growth of locally grown agriculture products. b. Identify gaps in the region s farmers markets that can be filled by the establishment of new, larger, or more permanent farmers markets. Consider using public-private partnerships for this purpose. c. Utilize farmers markets as tools to promote place-making and downtown revitalization to retain people in and attract people to the region. THEORY INTO PRACTICE PAGE 26
41 6. Model the success of the Hausbeck Pickle Company s employee home purchase program in Saginaw to include other major employers and other communities in the region. (See a description of the program on page 118.) a. Work with major employers across the region to link them more directly with the revitalization of communities and urban neighborhoods, beyond simply providing a job and an income for their employees. b. Identify neighborhoods in need of revitalization and encourage collaboration between the public sector and major employers (large corporations, hospitals, educational institutions, etc.) to implement employee home purchase programs that target these neighborhoods. 7. Expand and promote the region s recreation and entertainment opportunities as a way to retain and attract talent within the region. a. Explore ways to expand the region s recreational infrastructure (hike & bike trails, boat access, parks, ball fields, beach and shoreline improvements, etc.). Identify potential funding sources for this. (See a description of a successful funding model from the Allegheny Regional Asset District on page 117.) b. Launch a regional entertainment promotion effort in partnership with the Great Lakes Bay Convention & Visitors Bureau, the Great Lakes Bay Arts & Entertainment Council, and other local organizations to support the growth of existing festivals/events and to pursue additional events to attract visitors into the region. c. Bring civic leadership development groups together to create a promotional strategy to attract young people to, and retain them in, the 8-county region. Find messages and connection points (including social media) to engage the 60,000 students living in the region. This effort could be led by Alma College s Responsible Leadership Institute. 8. Create an 8-county talent attraction package that highlights the region s many quality of life assets to assist employers with the recruitment and retention of new hires. a. Work with the region s economic development corporations, chambers of commerce, major employers, and other local organizations to put together a set of marketing materials that highlights the region s key quality of life assets (schools, arts and culture amenities, outdoor recreation, downtown districts, etc.). This talent attraction package would be utilized by the region s major employers as a key component of their hiring process, particularly when recruiting for highly skilled professionals (e.g., physicians, engineers, IT professionals, etc.) from outside of the region. b. Ensure that the talent attraction package showcases key assets located in the 8-county region s urban and rural communities. THEORY INTO PRACTICE PAGE 27

42 IMPLEMENTATION A strong implementation strategy can be the key to bringing a plan to fruition. Identifying opportunities and the steps needed to make them reality is not enough. Setting priorities is perhaps the most important role that a solid implementation strategy should fulfill. Having clearly established priorities is essential for effective use of public resources. A sample of the implementation matrix is provided below. A complete implementation matrix that combines all the strategies and actions is provided as an editable Excel document separate from this report. The implementation matrix provides a graphic representation of when the actions should realistically be implemented and the most appropriate organizations to carry them out. SAMPLE IMPLEMENTATION MATRIX THEORY INTO PRACTICE PAGE 28
43 APPENDIX A: TARGET INDUSTRY ANALYSIS INTRODUCTION The selection of target industries is traditionally based on a limited set of quantitative factors such as workforce access, available industrial sites, and incentives. Our target industry recommendations for East Central Michigan are not based solely on these factors, but also take into account qualitative factors (such as conversations with local/regional business leaders and consulting experience gained from prior work) and strategic issues (including state and national economic trends and planned infrastructure investments). A quantitative analysis was conducted to help identify potential target industries. This analysis included the following: Qualitative Interviews Site Visits Labor Market/ Occupational Structure Quantitative Employment concentration (LQs) Occupational concentration Trends (historic & projected growth) Strategic Local/regional assets State initiatives National/global trends Labor shed/commute shed analysis: We mapped East Central Michigan s labor shed (where the region s workers live) and commute shed (where the region s employed residents work) using data from the US Census Bureau s LEHD (Longitudinal Employer Household Dynamics) database. Economic trends analysis: We analyzed the trends affecting economic development in East Central Michigan and the state as a whole to provide a foundational understanding of the issues and opportunities facing business recruitment and retention/expansion in the region. Location quotients: A location quotient (LQ) is calculated as a local industry s share of total local employment divided by the same industry s share of employment at the national level. LQs were used to identify the industries in which the area s employment is most concentrated relative to the national average, which suggests a competitive advantage. Also, industries with low LQs can sometimes represent untapped opportunities for growth by filling an existing gap in the local marketplace. We also conducted a qualitative analysis that included roundtable discussions and one-on-one interviews with major employers to document the region s strengths and barriers from the perspective of local businesses. This helped us better understand the opportunities for retention/expansion of existing companies and for attraction of new businesses. Using a strategic lens, we compiled a list of potential target sectors that take into account East Central Michigan s economic trends and also capitalize on the region s unique strengths and assets. THEORY INTO PRACTICE PAGE 29
44 TARGET INDUSTRY RECOMMENDATIONS TIP recommends that East Central Michigan focus its economic development efforts on five target industries: 1. HIGHER EDUCATION & RESEARCH includes colleges, universities, and private sector research and development activities. 2. PROFESSIONAL SERVICES includes information technology, finance & insurance, real estate, legal services, accounting, architecture & engineering, advertising, and other business services. 3. HEALTH CARE includes ambulatory health care services (offices of physicians and other health practitioners, outpatient care centers, medical and diagnostic laboratories, and other health services), public and private hospitals, and nursing and residential care facilities. 4. ADVANCED MANUFACTURING includes automotive manufacturing, advanced materials, chemicals, plastics, machinery, and other advanced manufacturing sectors. 5. VALUE-ADDED AGRICULTURE & FOOD PROCESSING includes crop production, animal production, food manufacturing, breweries, wineries, distilleries, farmers markets, and related wholesalers and distributors. These five target industries are a diverse set of sectors, by design. Some of the industries (like Higher Education & Research and Professional Services) have high education and training requirements, and pay high wages. Other sectors (like Advanced Manufacturing and Value-Added Agriculture & Food Processing) have lower education requirements and lower wages. The target industries recommended in this report build on some of East Central Michigan s strongest assets: Several top-notch colleges and universities Corporate headquarters of Dow Chemical and Dow Corning Major health care organizations that serve a large geographic area in East Central Michigan and beyond Natural resources, including abundant water and highly productive agricultural lands Under-utilized transportation infrastructure (roads, rail, water, airports) In the following section, each target industry is profiled and specific niches are noted in the list of representative NAICS codes provided in each profile. These industries and niches offer East Central Michigan the greatest potential for economic growth. THEORY INTO PRACTICE PAGE 30
45 HIGHER EDUCATION & RESEARCH INDUSTRY OVERVIEW The higher education & research industry includes colleges, universities, and private sector research and development activities. The industry, as defined, employs roughly 9,300 workers at 42 establishments in the 8-county region. Regional employment in higher education & research is on par with national levels, while the Michigan s employment in this sector is relatively higher, with an LQ of SECTOR COMPONENTS NAICS CODE DESCRIPTION 5417 Scientific Research and Development Services 6112 Junior Colleges (Private) 6113 Colleges, Universities, and Professional Schools (Private) WHY EAST CENTRAL MICHIGAN? 6114 Business Schools and Computer and Management Training (Private) The region s two strongest assets for economic development are its higher education institutions and its major private sector employers. There are numerous top-notch colleges and universities in the region, each with its own unique specialties and focus areas, with a combined student enrollment of about 60,000 annually. The region is home to major corporate headquarters (Dow Chemical, Dow Corning, and Nexteer) which employ a wide range of engineers and research scientists. In recent years, these institutions have forged new partnerships with the region s major employers. Yet, there is much greater potential for collaboration among the region s colleges and universities themselves. East Central Michigan also has some unique innovation assets including the MidMichigan Innovation Center, the BlueWater Angels network, the CMU Research Corporation, and CMU s New Venture Competition within the Department of Entrepreneurship. Lastly, there is a largely untapped opportunity to better connect East Central Michigan s companies and higher education institutions to Michigan s global research universities (Michigan State University and the University of Michigan) Technical and Trade Schools Colleges, Universities, and Professional Schools (State Government) Colleges, Universities, and Professional Schools (Local Government) SECTOR SNAPSHOT (2014) US Total Employment: 6,059,268 Total Establishments: 61,002 Michigan Total Employment: 199,898 LQ: 1.13 Total Establishments: 1,383 East Central Michigan (PR-5) Total Employment: 9,362 LQ: 1.01 Total Establishments: 42 Source: EMSI Complete Employment TARGET NICHES Entrepreneurship Academic R&D Corporate R&D THEORY INTO PRACTICE PAGE 31
46 HIGHER EDUCATION & RESEARCH EMPLOYMENT TRENDS 11,000 East Central Michigan Employment 10,000 9,000 8,000 7, ,000 Michigan Employment 200, , , , , ,500,000 U.S. Employment 6,000,000 5,500,000 5,000,000 4,500, Source (all figures): EMSI Complete Employment Vertical axes adjusted to show trend detail. THEORY INTO PRACTICE PAGE 32
47 SECTOR COMPONENT EMPLOYMENT TRENDS State colleges and universities (NAICS ) comprise the largest share of employment in the higher education & research sector in East Central Michigan, accounting for more than 6,200 jobs. The region also has an aboveaverage concentration of employment in NAICS , with an LQ of However, employment at stateoperated schools in the region has dropped since This is in contrast with the industry s performance at the state and national level during the same period. A look at key occupations (next page) points to a handful of clerical and support positions with median wage rates well below the US. While this can be an advantage in attracting business investment to the region, it can represent a challenge to the attraction of talent. This is particularly true of occupations requiring some level of postsecondary training for entry. A look at estimated annual openings demand due to projected new growth and anticipated replacement needs of current employers suggests relatively modest demand for these same occupations. By contrast, strong demand is anticipated for office clerks and janitorial staff, with each projected to have more than 150 opening in the region annually. This may be one factor causing wage rates to more closely align with national averages. Ranked by East Central Michigan employment in 2014 NAICS Sector Colleges, Universities, and Professional Schools (State Govt.) Jobs (2014) US % Chg. ( ) Jobs (2014) Michigan % Chg. ( ) LQ (2014) Jobs (2014) East Central Michigan % Chg. ( ) LQ (2014) 2,515, % 114, % , % Colleges, Universities, and Professional Schools Colleges, Universities, and Professional Schools (Local Govt.) Scientific Research and Development Services 1,881, % 32, % , % , % 21, % , % , % 23, % % Junior Colleges (private) 80, % 2, % % Technical and Trade Schools (private) Business Schools and Computer and Mgmt. Training (private) 125, % 3, % % , % 2, % 1.04 <10 Source: EMSI Complete Employment Location Quotients (LQs) are calculated by comparing a sector s share of total local employment to the sector s national share. An LQ of 1.00 indicates that the sector commands an average (expected) share of the local economy. LQs above 1.25 indicate a strong local sector, while those less than 0.75 indicate a weak local sector. THEORY INTO PRACTICE PAGE 33
48 LEADING OCCUPATIONS OVERVIEW TOP 20 OCCUPATIONS IN HIGHER EDUCATION & RESEARCH, EAST CENTRAL MICHIGAN (2014) Based on share of total employment in the target SOC CODE DESCRIPTION OCCUPATION S SHARE OF TOTAL EMPLOYMENT IN TARGET REGIONAL EMPLOYMENT 2014 Est. Annual Openings MEDIAN HOURLY WAGE East Central MI Relative to US (US=1.00) TYPICAL ENTRY- LEVEL EDUCATION Office Clerks, General 12.5% 6, $ HS diploma/ged Postsecondary Teachers 11.0% 1, $ Doctoral/prof. degree Secretaries/ Admin. Asst., Except Legal, Medical, and Executive Janitors and Cleaners, Except Maids and Housekeepers 7.1% 3, $ HS diploma/ged 6.2% 5, $ Less than high school Teacher Assistants 5.7% 2, $ Some college/no degree Education Admin., Postsecondary 3.0% $ Master's degree Office and Administrative Support Workers, All Other Educational, Guidance, School, and Vocational Counselors Maintenance and Repair, General 2.2% $ HS diploma/ged 1.9% $ Master's degree 2.0% 2, $ HS diploma/ged Coaches and Scouts 1.7% $ Bachelor's degree Bookkeeping, Accounting, and Auditing Clerks Computer User Support Specialists Business Operations Specialists, All Other 1.7% 2, $ HS diploma/ged 1.5% $ Some college/no degree 1.3% 1, $ HS diploma/ged Landscaping/Groundskeeping 1.1% 2, $ Less than high school Library Assistants, Clerical 1.1% $ HS diploma/ged Security Guards 1.1% $ HS diploma/ged Library Technicians 0.9% $ Non-degree award Life, Physical, and Social Science Technicians, All Other Executive Secretaries/Executive Administrative Assistants 0.9% $ Associate's degree 0.9% $ HS diploma/ged Receptionists and Info. Clerks 0.9% 1, $ HS diploma/ged Source: EMSI Complete Employment / Indicates regional wage rates less than 80% / greater than 110% of US median. Estimated annual openings represent projected new demand and anticipated replacement needed yearly through THEORY INTO PRACTICE PAGE 34
49 PROFESSIONAL SERVICES INDUSTRY OVERVIEW The professional services industry includes information technology, finance & insurance, real estate, legal services, accounting, architecture & engineering, advertising, and other business services. The industry as defined employs slightly less than 20,000 workers at roughly 17,000 establishments in the region. Professional services employment is much less concentrated in East Central Michigan than the US, as evidenced by its 0.67 LQ. WHY EAST CENTRAL MICHIGAN? East Central Michigan s strongest asset for growing the professional services sector is the existing base of major companies that employ a wide range of professional employees (Dow Chemical, Dow Corning, Nexteer, and Frankenmuth Insurance). The existence and success of these firms demonstrates that the region can support large companies that employ highly skilled professionals. The region s proximity to the Detroit metro area is another asset that can be leveraged to attract growth in this area. In fact, the region s commuting patterns provide evidence of the potential to foster growth in this industry. The most recent data shows a net out-commuting of more than 1,000 professional services workers each day. Thus, East Central Michigan currently has more professionals than its existing companies can employ. The region is exporting a large chunk of its professional talent. And because professional services jobs pay much higher wages than jobs in most other sectors, it will be critical to grow this industry to retain workers in and attract talent to East Central Michigan. TARGET NICHES Software & Information Technology SECTOR COMPONENTS NAICS CODE DESCRIPTION 52 Finance and Insurance 531 Real Estate 5411 Legal Services Accounting, Tax Preparation, Bookkeeping, and Payroll Services Architectural, Engineering, and Related Services 5414 Specialized Design Services Computer Systems Design and Related Services Management, Scientific, and Technical Consulting Services Advertising, Public Relations, and Related Services 5419 Other Prof., Scientific, and Technical Services 55 Management of Companies and Enterprises SECTOR SNAPSHOT (2014) US Total Employment: 19,183,757 Total Establishments: 1,884,576 Michigan Total Employment: 536,793 LQ: 0.96 Total Establishments: 44,073 East Central Michigan (PR-5) Total Employment: 19,717 LQ: 0.67 Total Establishments: 1,699 Source: EMSI Complete Employment Finance & Insurance Architecture & Engineering THEORY INTO PRACTICE PAGE 35
50 PROFESSIONAL SERVICES EMPLOYMENT TRENDS 26,000 East Central Michigan Employment 24,000 22,000 20,000 18,000 16, ,000 Michigan Employment 540, , , , , ,000,000 U.S. Employment 19,000,000 18,000,000 17,000,000 16,000, Source (all figures): EMSI Complete Employment Vertical axes adjusted to show trend detail. THEORY INTO PRACTICE PAGE 36
51 SECTOR COMPONENT EMPLOYMENT TRENDS Employment in management of companies and enterprises (NAICS 55) has led the sector in terms of employment growth in the region, adding nearly 1,000 jobs since 2010 (an increase of more than 30 percent). With an LQ of 1.27 in 2014, employment in this industry sector (which includes corporate headquarters, regional offices, and holding companies), is also more concentrated in East Central Michigan than would be expected based on national patterns. By contrast, the region s share of employment in NAICS 5414 (which encompasses a range of services, including interior design, graphic design, and industrial design) falls well short of expected norms, with an LQ of just The industry has also shed nearly one-third (30 percent) of its employment since Wage rates for many of the occupations that support the professional services sector fall below US averages (next page). Customer service representatives are the largest occupation in the sector in terms of their share of total employment. Wage rates for this occupation are generally in line with national averages, suggesting an advantage in the attraction of firms that rely on these skills. However, customer service representatives are among the highest in terms of projected annual demand (openings), suggesting that additional growth could be a challenge. Ranked by East Central Michigan employment in 2014 US Michigan East Central Michigan NAICS Sector Jobs (2014) % Chg. ( ) Jobs (2014) % Chg. ( ) LQ (2014) Jobs (2014) % Chg. ( ) LQ (2014) 52 Finance and Insurance 6,163, % 150, % , % Management of Companies and Enterprises Computer Systems Design and Related Services 2,131, % 59, % , % ,915, % 49, % , % Real Estate 1,952, % 48, % , % Accounting, Tax Preparation, Bookkeeping, & Payroll Services 1,114, % 33, % , % Legal Services 1,360, % 32, % % Architectural, Engineering, and Related Services Other Professional, Scientific, and Technical Services Management, Scientific, and Technical Consulting Services 1,487, % 79, % % , % 23, % % ,512, % 34, % % Specialized Design Services 256, % 9, % % Advertising, Public Relations, and Related Services 529, % 16, % % 0.19 Source: EMSI Complete Employment Location Quotients (LQs) are calculated by comparing a sector s share of total local employment to the sector s national share. An LQ of 1.00 indicates that the sector commands an average (expected) share of the local economy. LQs above 1.25 indicate a strong local sector, while those less than 0.75 indicate a weak local sector. THEORY INTO PRACTICE PAGE 37
52 LEADING OCCUPATIONS OVERVIEW TOP 20 OCCUPATIONS IN PROFESSIONAL SERVICES, EAST CENTRAL MICHIGAN (2014) Based on share of total employment in the target SOC CODE DESCRIPTION OCCUPATION S SHARE OF TOTAL EMPLOYMENT IN TARGET REGIONAL EMPLOYMENT 2014 Est. Annual Openings MEDIAN HOURLY WAGE East Central MI Relative to US (US=1.00) TYPICAL ENTRY- LEVEL EDUCATION Customer Service Representatives 5.3% 3, $ HS diploma/ged Tellers 4.8% $ HS diploma/ged Insurance Sales Agents 5.0% $ HS diploma/ged Office Clerks, General 4.7% 6, $ HS diploma/ged Accountants and Auditors 3.5% 1, $ Bachelor's degree Bookkeeping, Accounting, and Auditing Clerks Secretaries/Admin. Asst., Except Legal, Medical, and Executive First-Line Supervisors of Office and Administrative Support Workers General and Operations Managers 3.5% 2, $ HS diploma/ged 2.9% 3, $ HS diploma/ged 2.5% 1, $ HS diploma/ged 2.5% 2, $ Bachelor's degree Lawyers 2.2% $ Doctoral/prof. degree Real Estate Sales Agents 2.0% $ HS diploma/ged Loan Officers 1.8% $ Bachelor's degree Financial Managers 1.7% $ Bachelor's degree Business Operations Specialists, All Other Maintenance and Repair Workers, General 1.6% 1, $ HS diploma/ged 1.5% 2, $ HS diploma/ged Management Analysts 1.5% $ Bachelor's degree Receptionists and Info. Clerks 1.4% 1, $ HS diploma/ged Securities, Commodities, and Financial Services Sales Agents 1.3% $ Bachelor's degree Tax Preparers 1.3% $ HS diploma/ged Managers, All Other 1.2% $ HS diploma/ged Source: EMSI Complete Employment / Indicates regional wage rates less than 80% / greater than 110% of US median. Estimated annual openings represent projected new demand and anticipated replacement needed yearly through THEORY INTO PRACTICE PAGE 38
53 HEALTH CARE INDUSTRY OVERVIEW The health care industry includes ambulatory health care services (offices of physicians and other health practitioners, outpatient care centers, medical and diagnostic laboratories, and other health services), public and private hospitals, and nursing and residential care facilities. The industry as defined employs more than 32,600 workers at approximately 1,130 establishments in the 8-county region. LQs for both East Central Michigan and the state as a whole suggest an above-average concentration of health care employment relative to the US. WHY EAST CENTRAL MICHIGAN? The health care sector is one of the most important segments of the East Central Michigan economy. The region is fortunate to have several major health care organizations (Covenant, McLaren, St. Mary s, and MidMichigan Health) each of which has its own set of specialties and strengths. And the region s health care industry serves a market area that extends far beyond the 8-county region, including counties in the Thumb area and several counties north of the region. The new CMU College of Medicine is a unique asset that will drive growth and new opportunities for economic development in the region s health care sector for years to come. SECTOR COMPONENTS NAICS CODE DESCRIPTION 621 Ambulatory Health Services 622 Hospitals (Private) 623 Nursing and Residential Care Facilities Fitness and Recreational Sports Centers Hospitals (State Government) Hospitals (Local Government) SECTOR SNAPSHOT (2014) US Total Employment: 16,625,897 Total Establishments: 679,854 Michigan Total Employment: 548,987 LQ: 1.13 Total Establishments: 19,606 East Central Michigan (PR-5) Total Employment: 32,613 LQ: 1.29 Total Establishments: 1,131 Source: EMSI Complete Employment TARGET NICHES Medical Specialties Health & Wellness Life Sciences R&D THEORY INTO PRACTICE PAGE 39
54 HEALTH CARE EMPLOYMENT TRENDS 34,000 East Central Michigan Employment 32,000 30,000 28,000 26, ,000 Michigan Employment 540, , , , , , ,000,000 U.S. Employment 17,000,000 16,000,000 15,000,000 14,000,000 13,000,000 12,000, Source (all figures): EMSI Complete Employment Vertical axes adjusted to show trend detail. THEORY INTO PRACTICE PAGE 40
55 SECTOR COMPONENT EMPLOYMENT TRENDS Like the nation as a whole, East Central Michigan has seen steady growth in health care-related employment. Within the sector, however, employment at privately owned hospitals has fallen by nearly 5 percent (a loss of nearly 600 jobs) from 2010 to By contrast, employment in NAICS 621 (which includes a range of outpatient services, such as doctor s offices, diagnostic laboratories, and home health care operations) has seen a 12 percent increase during the same period. Employment in both private hospitals and residential (inpatient) facilities is higher than would be expected in a labor market of East Central Michigan s size, as evidenced by LQs of 1.70 and 1.48, respectively. These relatively high employment levels are due to the multiple large hospital campuses in the region (mostly in Saginaw County, and to a lesser extent in Bay and Midland Counties) that serve as the northernmost major hospital facilities in the State of Michigan. Many patients from areas farther north must travel to the region for specialized medical care. Nursing-related occupations top the list of the sector s most common occupations in terms of their share of overall employment (next page). These occupations are also projected to be in strong demand in the next several years. For example, openings for registered nurses (due to both new growth and replacement needs of existing employers) are anticipated to be nearly 200 annually. Regional wage rates in the health care sector are generally on par with national rates, with few exceptions. Most notably, the median hourly wage rate for internists in East Central Michigan is less than one-half the national average. However, this discrepancy may not necessarily be a reflection of a structural issue in the regional market. Lower relative wage rates may result from the wide variation in subspecialties encompassed by the occupation (such as cardiology, gastroenterology, and rheumatology) and the high prices that can be commanded by practitioners in the nation s largest cities. Ranked by East Central Michigan employment in 2014 US Michigan East Central Michigan NAICS Sector Jobs (2014) % Chg. ( ) Jobs (2014) % Chg. ( ) LQ (2014) Jobs (2014) % Chg. ( ) LQ (2014) 622 Hospitals (private) 4,749, % 192, % , % Ambulatory Health Care Services 7,036, % 206, % , % Nursing and Residential Care Facilities 3,263, % 104, % , % Hospitals (Local Government) 654, % 13, % % Fitness and Recreational Sports Centers 578, % 12, % % Hospitals (State Government) 343, % 19, % 1.96 Source: EMSI Complete Employment Location Quotients (LQs) are calculated by comparing a sector s share of total local employment to the sector s national share. An LQ of 1.00 indicates that the sector commands an average (expected) share of the local economy. LQs above 1.25 indicate a strong local sector, while those less than 0.75 indicate a weak local sector. THEORY INTO PRACTICE PAGE 41
56 LEADING OCCUPATIONS OVERVIEW TOP 20 OCCUPATIONS IN HEALTHCARE, EAST CENTRAL MICHIGAN (2014) Based on share of total employment in the target SOC CODE DESCRIPTION OCCUPATION S SHARE OF TOTAL EMPLOYMENT IN TARGET REGIONAL EMPLOYMENT 2014 Est. Annual Openings MEDIAN HOURLY WAGE East Central MI Relative to US (US=1.00) TYPICAL ENTRY- LEVEL EDUCATION Registered Nurses 14.0% 5, $ Associate's degree Nursing Assistants 11.9% 4, $ Non-degree award Home Health Aides 6.6% 2, $ Less than high school Licensed Practical/Voc. Nurses 3.6% 1, $ Non-degree award Medical Assistants 3.5% 1, $ Non-degree award Personal Care Aides 3.1% 2, $ Less than high school Medical Secretaries 2.4% $ HS diploma/ged Receptionists and Info. Clerks 2.4% 1, $ HS diploma/ged Office Clerks, General 2.1% 6, $ HS diploma/ged Medical/Health Services Managers 1.9% $ Bachelor's degree Physical Therapists 1.8% $ Doctoral/prof. degree Dental Hygienists 1.5% $ Associate's degree Dental Assistants 1.4% $ Non-degree award Maids and Housekeepers 1.4% 3, $ Less than high school EMTs and Paramedics 1.3% $ Non-degree award Radiologic Technologists 1.2% $ Associate's degree Healthcare Social Workers 1.1% $ Master's degree Cooks, Institution and Cafeteria 1.1% $ Less than high school Internists, General 1.0% $ Doctoral/prof. degree Billing and Posting Clerks 1.0% $ HS diploma/ged Source: EMSI Complete Employment / Indicates regional wage rates less than 80% / greater than 110% of US median. Estimated annual openings represent projected new demand and anticipated replacement needed yearly through THEORY INTO PRACTICE PAGE 42
57 ADVANCED MANUFACTURING INDUSTRY OVERVIEW The advanced manufacturing industry includes automotive manufacturing, advanced materials, chemicals, plastics, machinery, other advanced manufacturing sectors, and related wholesalers. The industry as defined employs nearly 26,500 workers at more than 400 establishments in the 8- county region. Employment in advanced manufacturing exceeds the national average for both the 8-county region and the state, as evidenced by LQs of 2.00 and 1.91, respectively. WHY EAST CENTRAL MICHIGAN? The region, just like the State of Michigan, has a strong history of manufacturing. Today, East Central Michigan continues to have a high concentration of manufacturing activity, particularly in the chemicals, plastics, and automotive sectors. In fact, seven of the region s 8 counties have a higher percentage of manufacturing jobs than the US average. And the region is fortunate to have some major companies (Dow Chemical, Dow Corning, and Nexteer) involved in advanced manufacturing. TARGET NICHES Chemicals Advanced Materials Plastics Automotive Energy Efficiency & Clean-Tech SECTOR COMPONENTS NAICS CODE DESCRIPTION 325 Chemical Manufacturing 326 Plastics and Rubber Products Manufacturing 327 Nonmetallic Mineral Product Manufacturing 331 Primary Metal Manufacturing 332 Fabricated Metal Product Manufacturing 333 Machinery Manufacturing 334 Computer and Electronic Product Mfg. 335 Electrical Equipment, Appliance, and Component Manufacturing 336 Transportation Equipment Manufacturing 3391 Medical Equipment and Supplies Mfg Industrial Machinery & Equip. Wholesalers Industrial Supplies Merchant Wholesalers 4246 Chemical and Allied Products Wholesalers SECTOR SNAPSHOT (2014) US Total Employment: 8,684,168 Total Establishments: 244,660 Michigan Total Employment: 482,631 LQ: 1.91 Total Establishments: 11,844 East Central Michigan (PR-5) Total Employment: 26,460 LQ: 2.00 Total Establishments: 444 Source: EMSI Complete Employment THEORY INTO PRACTICE PAGE 43
58 ADVANCED MANUFACTURING EMPLOYMENT TRENDS 32,000 East Central Michigan Employment 30,000 28,000 26,000 24,000 22,000 20, ,000 Michigan Employment 600, , , , ,000,000 U.S. Employment 11,000,000 10,000,000 9,000,000 8,000, Source (all figures): EMSI Complete Employment Vertical axes adjusted to show trend detail. THEORY INTO PRACTICE PAGE 44
59 SECTOR COMPONENT EMPLOYMENT TRENDS Within advanced manufacturing, three industries comprise roughly two-thirds of the region s total employment in the sector as defined: transportation equipment (NAICS 336), chemicals (NAICS 325), and machinery (NAICS 333). Not surprisingly, East Central Michigan s employment in these industries is well above the level that would be expected based on national patterns. The region has a particularly high concentration of employment in chemical manufacturing, with an LQ of The industry s role in the region can also be seen in the relatively high wage rates and strong demand for chemists and chemical equipment operators (next page). Wage rates for sales representatives a key occupation that cuts across a wide range of manufacturing industries are low relative to the US. Ranked by East Central Michigan employment in 2014 NAICS 336 Sector Transportation Equipment Manufacturing Jobs (2014) US % Chg. ( ) Jobs (2014) Michigan % Chg. ( ) LQ (2014) Jobs (2014) East Central Michigan % Chg. ( ) LQ (2014) 1,550, % 171, % , % Chemical Manufacturing 805, % 29, % , % Machinery Manufacturing 1,122, % 69, % , % Fabricated Metal Product Manufacturing Plastics and Rubber Products Manufacturing Nonmetallic Mineral Product Manufacturing Medical Equipment and Supplies Manufacturing 1,460, % 81, % , % , % 38, % , % , % 9, % , % , % 11, % % Primary Metal Manufacturing 397, % 21, % % Industrial Machinery and Equipment Merchant Wholesalers Computer and Electronic Product Manufacturing Electrical Equipment, Appliance, and Component Manufacturing Chemical and Allied Products Merchant Wholesalers Industrial Supplies Merchant Wholesalers 319, % 13, % % ,055, % 18, % % , % 10, % % , % 3, % % , % 2, % % 0.53 Source: EMSI Complete Employment Location Quotients (LQs) are calculated by comparing a sector s share of total local employment to the sector s national share. An LQ of 1.00 indicates that the sector commands an average (expected) share of the local economy. LQs above 1.25 indicate a strong local sector, while those less than 0.75 indicate a weak local sector. THEORY INTO PRACTICE PAGE 45
60 LEADING OCCUPATIONS OVERVIEW TOP 20 OCCUPATIONS IN ADVANCED MANUFACTURING, EAST CENTRAL MICHIGAN (2014) Based on share of total employment in the target SOC CODE DESCRIPTION OCCUPATION S SHARE OF TOTAL EMPLOYMENT IN TARGET REGIONAL EMPLOYMENT 2014 Est. Annual Openings MEDIAN HOURLY WAGE East Central MI Relative to US (US=1.00) TYPICAL ENTRY- LEVEL EDUCATION Team Assemblers 6.8% 2, $ HS diploma/ged Industrial Engineers 5.5% 1, $ Bachelor's degree Machinists 4.8% 1, $ HS diploma/ged First-Line Supervisors of Production and Operating Workers Sales Reps., Wholesale and Mfg., Except Tech./Scientific Products Molding/Coremaking/Casting Machine Workers, Metal & Plastic 3.4% 1, $ Non-degree award 2.7% 1, $ HS diploma/ged 2.4% $ HS diploma/ged Welders/Cutters/Solderers/Brazers 2.3% $ HS diploma/ged Inspectors, Testers, Sorters, Samplers, and Weighers 2.2% $ HS diploma/ged Tool and Die Makers 2.1% $ HS diploma/ged Industrial Production Managers 2.0% $ Bachelor's degree Cutting, Punching, and Press Machine Workers, Metal & Plastic 1.9% $ HS diploma/ged Mechanical Engineers 1.9% $ Bachelor's degree Office Clerks, General 1.8% 6, $ HS diploma/ged Maint. & Repair Workers, General 1.8% 2, $ HS diploma/ged Computer-Controlled Machine Tool Operators, Metal and Plastic 1.8% $ HS diploma/ged General and Operations Mgrs. 1.8% 2, $ Bachelor's degree Industrial Machinery Mechanics 1.8% $ HS diploma/ged Laborers and Freight, Stock, and Material Movers, Hand 1.7% 2, $ Less than high school Chemists 1.5% $ Bachelor's degree Chemical Equip. Ops./Tenders 1.5% $ HS diploma/ged Source: EMSI Complete Employment / Indicates regional wage rates less than 80% / greater than 110% of US median. Estimated annual openings represent projected new demand and anticipated replacement needed yearly through THEORY INTO PRACTICE PAGE 46
61 VALUE-ADDED AGRICULTURE & FOOD PROCESSING INDUSTRY OVERVIEW The value-added agriculture & food processing industry includes crop production, animal production, food manufacturing, breweries, wineries, distilleries, farmers markets, and related wholesalers and distributors. The industry as defined employs roughly 5,600 workers across nearly 350 establishments in the 8-county region. Employment in value-added agriculture in East Central Michigan and the state as a whole is less concentrated than the US, with LQs well below 1.00 for both areas (0.69 and 0.81, respectively). WHY EAST CENTRAL MICHIGAN? East Central Michigan is fortunate to have some strong natural assets, the most important of which are its access to water (Lake Huron, Saginaw Bay, and Saginaw River) and possession of some of the most highly productive agricultural lands in the US. Ag-related businesses represent a major growth opportunity thanks to the growing demand for specialty foods in the national and international markets. And the value-added agriculture sector offers many opportunities for entrepreneurship and small business growth. Lastly, East Central Michigan has the potential to support a thriving locally sourced food scene through additional organic farms, farmers markets, breweries, craft food restaurants, and related businesses. TARGET NICHES Organic Farms High-Value Crops & Livestock Farmers Markets Breweries, Wineries, Distilleries Local Craft Food Restaurants SECTOR COMPONENTS NAICS CODE DESCRIPTION 111 Crop Production 112 Animal Production and Aquaculture 113 Forestry and Logging 1151 Support Activities for Crop Production 1152 Support Activities for Animal Production 1153 Support Activities for Forestry 311 Food Manufacturing Soft Drink and Ice Manufacturing Breweries Wineries Distilleries 321 Wood Product Manufacturing Farm/Garden Machinery & Equip. Wholesalers 4244 Grocery and Related Product Wholesalers 4245 Farm Product Raw Material Wholesalers 4248 Beer/Wine/Distilled Alcoholic Bev. Whlslrs Farm Supplies Merchant Wholesalers Nursery, Garden, and Farm Supply Stores SECTOR SNAPSHOT (2014) US Total Employment: 5,290,954 Total Establishments: 227,740 Michigan Total Employment: 124,386 LQ: 0.81 Total Establishments: 5,767 East Central Michigan (PR-5) Total Employment: 5,601 LQ: 0.69 Total Establishments: 348 Source: EMSI Complete Employment THEORY INTO PRACTICE PAGE 47
62 VALUE-ADDED AGRICULTURE & FOOD PROCESSING EMPLOYMENT TRENDS 5,800 East Central Michigan Employment 5,600 5,400 5,200 5,000 4, , Michigan Employment 124, , , , ,000 5,600, U.S. Employment 5,400,000 5,200,000 5,000,000 4,800,000 4,600, Source (all figures): EMSI Complete Employment Vertical axes adjusted to show trend detail. THEORY INTO PRACTICE PAGE 48
63 SECTOR COMPONENT EMPLOYMENT TRENDS Food processing and animal production activities account for 44 percent of the sector s total employment as defined. The region is highly specialized in a number of component industries, with above-average LQs in production-based industries, like animal production (NAICS 112) and logging (NAICS 113), as well as in ag-related retail stores (NAICS 44422) and wholesale trade of agricultural products (NAICS 4245). The relatively high wage rates for farmworkers and agricultural equipment operators (next page) suggest the importance of these workers to the sector. Ranked by East Central Michigan employment in 2014 NAICS Sector Jobs (2014) US % Chg. ( ) Jobs (2014) Michigan % Chg. ( ) LQ (2014) Jobs (2014) East Central Michigan % Chg. ( ) LQ (2014) 311 Food Manufacturing 1,498, % 34, % , % Animal Production & Aquaculture 419, % 11, % , % Crop Production 818, % 23, % % Wood Product Manufacturing 387, % 9, % % Grocery and Related Product Merchant Wholesalers Support Activities for Crop Production Nursery, Garden Center, and Farm Supply Stores Farm and Garden Machinery and Equipment Merchant Wholesalers 764, % 16, % % , % 5, % % , % 5, % % , % 2, % % Forestry and Logging 82, % 2, % % Farm Product Raw Material Merchant Wholesalers 76, % 1, % % Soft Drink and Ice Manufacturing 95, % 3, % % Farm Supplies Merchant Wholesalers Support Activities for Animal Production 115, % 1, % % , % % % Breweries 36, % 1, % Support Activities for Forestry 17, % % 0.46 < Wineries 53, % % 0.43 < Beer, Wine, & Distilled Alcoholic Beverage Merchant Wholesalers 188, % 3, % 0.66 < Distilleries 9, % % 0.25 Source: EMSI Complete Employment Location Quotients (LQs) are calculated by comparing a sector s share of total local employment to the sector s national share. An LQ of 1.00 indicates that the sector commands an average (expected) share of the local economy. LQs above 1.25 indicate a strong local sector, while those less than 0.75 indicate a weak local sector. THEORY INTO PRACTICE PAGE 49
64 LEADING OCCUPATIONS OVERVIEW TOP 20 OCCUPATIONS IN VALUE-ADDED AGRICULTURE & FOOD PROCESSING, EAST CENTRAL MICHIGAN (2014) Based on share of total employment in the target SOC CODE DESCRIPTION Farmworkers and Laborers, Crop, Nursery, and Greenhouse Farmers, Ranchers, and Other Agricultural Managers Laborers and Freight, Stock, and Material Movers, Hand Sales Reps., Wholesale and Mfg., Except Tech./Scientific Products OCCUPATION S SHARE OF TOTAL EMPLOYMENT IN TARGET Retail Salespersons 3.6% REGIONAL EMPLOYMENT 2014 Est. Annual Openings MEDIAN HOURLY WAGE East Central MI Relative to US (US=1.00) TYPICAL ENTRY- LEVEL EDUCATION 14.0% $ Less than high school 11.6% $ HS diploma/ged 3.9% 2, $ Less than high school 3.7% 1, $ HS diploma/ged 10, $ Less than high school Heavy/Tractor-Trailer Truck Drivers 3.0% 2, $ Non-degree award Packaging and Filling Machine Operators and Tenders 2.3% $ HS diploma/ged Packers and Packagers, Hand 2.2% $ Less than high school Logging Equipment Operators 2.0% $ HS diploma/ged Office Clerks, General 1.9% 6, $ HS diploma/ged Farmworkers, Farm, Ranch, and Aquacultural Animals 1.7% $ Less than high school Agricultural Equipment Operators 1.6% 94 7 $ Less than high school Farm Equipment Mechanics and Service Technicians 1.5% $ HS diploma/ged Cashiers 1.4% 6, $ Less than high school Light Truck/Delivery Drivers 1.4% 1, $ HS diploma/ged Stock Clerks and Order Fillers 1.4% 2, $ Less than high school Maintenance and Repair Workers, General First-Line Supervisors of Production and Operating Workers 1.3% 2, $ HS diploma/ged 1.3% 1, $ Non-degree award Industrial Machinery Mechanics 1.1% $ HS diploma/ged General and Operations Mgrs. 1.1% 2, $ Bachelor's degree Source: EMSI Complete Employment / Indicates regional wage rates less than 80% / greater than 110% of US median. Estimated annual openings represent projected new demand and anticipate replacement needed yearly through THEORY INTO PRACTICE PAGE 50
65 APPENDIX B: ECONOMIC ASSESSMENT To provide a common framework for the Regional Prosperity Strategy, TIP began by compiling demographic and economic data on East Central Michigan. This analysis focused on the 8-county region (Arenac, Bay, Clare, Gladwin, Gratiot, Isabella, Midland, and Saginaw counties) in the context of the state and US (where appropriate), and compared to other peer regions in the Midwestern US. The purpose is to understand the region s relative economic position and highlight its competitive advantages and disadvantages. ABOUT THE DATA We based our findings on: 1) A review of relevant studies, plans, and other material provided by the East Michigan Council of Governments and others; and 2) A review of economic and demographic data from primary and secondary sources, including the US Census Bureau, the Internal Revenue Service, the US Bureau of Labor Statistics, Economic Modeling Specialists Inc. (EMSI), the National Center for Education Statistics, the National Science Foundation, and other sources. The data and analysis is organized within three categories: 1. ECONOMY. This section analyzes the overall economic conditions in each of the 8 counties and in the region as a whole compared to Michigan and the US. Data in this section includes: population growth, job growth, industry strengths, and housing market activity. 2. WORKFORCE. This section analyzes the region s workforce compared to Michigan and the US. Data in this section includes: commuting patterns, occupational strengths, wage rates, educational attainment, and unemployment rates. 3. STATISTICAL BENCHMARKING. This section compares the region s economy and workforce to a set of benchmark regions (5 in-state Prosperity Regions and 4 out-of-state regions). Data in this section includes: population growth, job growth, industry trends, migration patterns, industry strengths, air travel trends, educational attainment, academic R&D, income levels, and other data points. THEORY INTO PRACTICE PAGE 51
66 THEORY INTO PRACTICE PAGE 52
67 ECONOMY ECONOMY THEORY INTO PRACTICE PAGE 53
68 THEORY INTO PRACTICE PAGE 54
69 TOTAL POPULATION TOTAL ANNUAL POPULATION IN EAST CENTRAL MICHIGAN, East Central Michigan has seen little variation in its population over the last decade. The region s population in 2000 was 583,324 and is estimated at 571,219 in 2014, a decline of 2%. Saginaw County Midland County Bay County Remainder of Region (5 counties) 600, , , , , , Source: EMSI Complete Employment , US Census Bureau TOTAL EMPLOYMENT TOTAL ANNUAL EMPLOYMENT IN EAST CENTRAL MICHIGAN, Total employment in the area has declined since 2001, but from the lowest point (2010), the region added nearly 9,000 jobs, a change of 3.9%. 250, , , , , , , , , , , , , , , , , , , , Source: EMSI Complete Employment THEORY INTO PRACTICE PAGE 55
70 NET JOB CHANGE BY COUNTY (PRE-RECESSION & POST-RECESSION) PERCENT CHANGE IN EMPLOYMENT BY COUNTY ( ; ) East Central Michigan was hit hard by the Great Recession, including the years leading up to the recession. The region as a whole has experienced strong job growth since 2009, but this growth has been uneven across the region. The region s rural northern counties (Clare, Gladwin, and Arenac) are the only counties that experienced a net decline of jobs from and from At the other end of the spectrum, Isabella County is the only county in the region that gained jobs during both time periods, thanks to the relatively recession-proof job base provided by Central Michigan University. Saginaw County has seen a major turnaround in job creation in recent years. From 2001 to 2009, Saginaw County lost 15% of its jobs, but its employment grew by 5% from 2009 to 2013, thanks in large part to the recent resurgence in the automotive manufacturing sector % 8% 5% 5% 5% 1% 2% 2% 0% -1% -5% -5% -3% -4% -10% -8% -11% -15% -14% -12% -13% -15% -20% Arenac County Bay County Clare County Gladwin County Gratiot County Isabella County Midland County Saginaw County Source: EMSI Complete Employment THEORY INTO PRACTICE PAGE 56
71 GEOGRAPHIC DISTRIBUTION OF JOBS GEOGRAPHIC DISTRIBUTION OF JOBS IN EAST CENTRAL MICHIGAN, 2014 East Central Michigan s urban core (Saginaw, Midland, and Bay Counties) account for the majority of the region s jobs in over 80% (19 of 23) of industry sectors. The urban core is home to 81% of the region s professional services jobs, 78% of the region s health care jobs, and 77% of the region s manufacturing jobs. The remainder of the region (Arenac, Clare, Gladwin, Gratiot, and Isabella Counties) account for the majority of the region s jobs in oil, gas, & mining (79%), agriculture (66%), state government (53%), and local government (53%). Saginaw County Midland County Bay County Remainder of Region (5 Counties) Corporate & regional HQs Information & media Federal government (civilian) Administrative services Professional services Personal & other services Healthcare Manufacturing Retail trade Arts & entertainment Property sales & leasing Wholesale trade Finance & insurance Restaurants, bars, & hotels Utilities Federal government (military) Construction Transportation & warehousing Education Local government State government Agriculture Oil, gas, & mining 10% 48% 54% 36% 37% 45% 41% 43% 33% 43% 40% 46% 38% 41% 33% 28% 40% 30% 21% 9% 32% 17% 5% 12% 14% 76% 14% 20% 17% 15% 73% 22% 16% 30% 24% 19% 15% 19% 22% 14% 14% 19% 31% 12% 14% 18% 8% 27% 13% 16% 12% 22% 13% 16% 14% 21% 23% 14% 7% 17% 12% 15% 17% 12% 66% 79% 8% 15% 7% 17% 19% 20% 22% 23% 24% 24% 25% 25% 26% 29% 30% 32% 35% 37% 43% 53% 53% Source: EMSI Complete Employment *Note: Percentages have been rounded. 0% 20% 40% 60% 80% 100% THEORY INTO PRACTICE PAGE 57
72 INDUSTRY SECTOR STRENGTHS RELATIVE TO US. LOCATION QUOTIENTS OF MAJOR SECTORS BY COUNTY, 2014 Location quotients (LQs) are a simple measure used to gain an understanding of the relative concentration of an industry in a given geography. LQs are calculated by comparing an industry s percentage of total local employment to the industry s percentage of national employment. An LQ of 1.0 indicates that an industry commands an average (expected) share of the local economy. An LQ of 1.25 or higher generally indicates a strong local sector, whereas an LQ of 0.75 or lower indicates a weak local industry. East Central Michigan s strongest industries are manufacturing (1.55), local government (1.45), and corporate & regional HQs (1.29). Industries that are not strong in the region include professional services (0.52), transportation & warehousing (0.57), property sales & leasing (0.65), and finance & insurance (0.68). Manufacturing is the region s strongest industry cluster (just like Michigan as a whole), but each county has its own set of unique industry strengths. Seven of the 8 counties (not including Isabella County) have a high concentration of jobs in manufacturing. Midland County is the region s corporate center thanks to Dow Chemical, with an LQ of 5.73 in corporate & regional HQs. Agriculture is particularly strong in Arenac (2.15), Gladwin (2.51), and Gratiot (4.17) counties. Saginaw County serves as the region s most important center for goods and services, which is reflected in the county s high LQs in healthcare (1.37), retail trade (1.32), and administrative services (1.56). Health care is also concentrated in Arenac (1.73) and Bay (1.31) counties. Retail trade is also concentrated in Bay (1.32), Clare (1.31), and Gladwin (1.55) counties. And Midland County has a high concentration of jobs in administrative services (1.48). Arenac County Bay County Clare County Gladwin County Gratiot County Isabella County Midland County Saginaw County East Central MI (PR-5) Michigan Manufacturing Local govt Corporate & regional HQs Healthcare Retail trade Utilities Administrative services Personal & other services Restaurants, bars, & hotels Education Construction Agriculture State govt Arts & entertainment Finance & insurance Property sales & leasing Information & media Wholesale trade Trans. & warehousing Professional services Federal govt. (civilian) Oil, gas, & mining Federal govt. (military) Location quotient descriptions: extremely high (> 2.00) above average (>1.25) average (between 0.75 and 1.25) below average (<0.75) Source: EMSI Complete Employment THEORY INTO PRACTICE PAGE 58
73 HOUSING PERMITS BY COUNTY (PRE-RECESSION & POST-RECESSION) TOTAL NUMBER OF HOUSING UNITS PERMITTED BY COUNTY ( ; ) The quantity of new housing being built and planned in the region is far lower than before the Great Recession, but is rising quickly. Saginaw, Midland, and Isabella counties account for 75% of the region s housing permits since (through June 2014) 4,640 4, , ,666 1, , Arenac County Bay County Clare County Gladwin County Gratiot County Isabella County Midland County Saginaw County Source: US Department of Housing & Urban Development, Building Permits Database ANNUAL HOUSING PERMITS BY TYPE TOTAL NUMBER OF HOUSING UNITS PERMITTED IN 8-COUNTY REGION BY TYPE ( ) The number of housing units permitted has risen each year from 2009 to 2013, a promising indicator of the growing strength of the region s economy. There were 528 multi-family permits issued in the region in 2013, the highest amount of any of the last 13 years. Single-Family Multi-Family ,895 1,957 2,093 2,214 1,821 1, Source: US Department of Housing & Urban Development, Building Permits Database THEORY INTO PRACTICE PAGE 59
74 JOB CHANGE BY SECTOR ANNUAL JOB CHANGE IN EAST CENTRAL MICHIGAN BY SECTOR ( ) The rebound in manufacturing has driven the region s economic growth since the end of the Great Recession. Only two industries manufacturing and administrative services have experienced job growth in each of the five years since At the other extreme, construction and education are the only two industries that lost jobs each year since The agriculture, professional services, and health care sectors have seen limited job growth since Manufacturing Administrative services Restaurants, bars, & hotels Corporate & regional HQs Personal & other services Transportation & warehousing Agriculture Professional services Healthcare Arts & entertainment Wholesale trade Oil, gas, & mining Local government Finance & insurance Federal government (civilian) Federal government (military) Information & media Retail trade Property sales & leasing Utilities State government Construction Education -3,000-2,000-1, ,000 2,000 3,000 4,000 5,000 Source: EMSI Complete Employment THEORY INTO PRACTICE PAGE 60
75 FARM EMPLOYMENT TRENDS ANNUAL FARM EMPLOYMENT PER 1,000 RESIDENTS ( ) Farm employment in the region has been relatively stable and is much more concentrated than Michigan and the US. East Central Michigan has 11.5 farm jobs per 1,000 residents, compared to 8.3 in the US And the region s farm employment per capita only declined by 6% from 2001 to 2012, compared to a US decline of 23%. 14 East Central Michigan Michigan U.S Source: US Bureau of Economic Analysis CASH RECEIPTS FROM CROPS & LIVESTOCK PER CAPITA CASH RECEIPTS FROM CROPS AND LIVESTOCK PER CAPITA (2012) Crop and livestock production play an important role in the region s economy, especially in Gratiot County where the amount of cash receipts per capita from crops and livestock was more than five times the US rate in Crops Livestock $4,645 $3,396 $2,552 $632 $706 $336 $543 $528 $1,360 $108 $1,201 $429 $582 $661 $1,200 $279 $726 $699 $287 $103 $1,371 $1,042 Arenac County Bay County Clare County Gladwin County Gratiot County Isabella County Midland County Saginaw County East Central Michigan Michigan U.S. Source: US Bureau of Economic Analysis THEORY INTO PRACTICE PAGE 61
76 THEORY INTO PRACTICE PAGE 62
77 WORKFORCE WORKFORCE THEORY INTO PRACTICE PAGE 63
78 THEORY INTO PRACTICE PAGE 64
79 NET DAILY COMMUTER TRAFFIC FOR EAST CENTRAL MICHIGAN INBOUND, OUTBOUND, AND INTERNAL COMMUTERS IN EAST CENTRAL MICHIGAN, East Central Michigan is self-sufficient in terms of commuting patterns. The majority (73%) of the region s workforce lives in the 8 counties. There are roughly equal numbers of inbound commuters (57,400) and outbound commuters (58,000) as of The ratio of inbound and outbound commuters has remained relatively unchanged since Each of these findings points to a region that truly functions as a region, at least in the flow of commuter traffic. This common regional thread is important to keep in mind, because the ultimate success of the Regional Prosperity Strategy will depend heavily on an elevated level of regional collaboration. Inbound Outbound Live and work in East Central Michigan 170, , , ,000 90,000 70,000 50, Source: US Census Bureau, Local Employment Dynamics (LED) Database THEORY INTO PRACTICE PAGE 65
80 EAST CENTRAL MICHIGAN S LABOR SHED PERCENTAGE OF WORKFORCE IN EACH COUNTY THAT LIVES IN EAST CENTRAL MICHIGAN, 2011 Each of East Central Michigan s 8 counties draws at least 2/3 of its workforce from within the region. There is a clear dividing line between the 8-county region and the surrounding counties. Of the 12 surrounding counties, only Ogemaw and Tuscola counties draw more than 10% of their workforce from East Central Michigan. The Regional Prosperity Initiative has combined together counties that have had a minimal amount of regional collaboration across all 8 counties, but the region s workforce is undeniably a shared regional asset. Source: US Census Bureau, Local Employment Dynamics (LED) Database THEORY INTO PRACTICE PAGE 66

81 EAST CENTRAL MICHIGAN S COMMUTE SHED PERCENTAGE OF EMPLOYED RESIDENTS IN EACH COUNTY THAT WORK IN EAST CENTRAL MICHIGAN, 2011 More than 50% of employed residents in each of the East Central Michigan s 8 counties stay in the region for their jobs. Similar to the region s labor shed, the commute shed also shows a clear dividing line that separates East Central Michigan from the surrounding 12 counties. Source: US Census Bureau, Local Employment Dynamics (LED) Database THEORY INTO PRACTICE PAGE 67

82 EAST CENTRAL MICHIGAN MAJOR EMPLOYERS LABOR SHED NUMBER OF EMPLOYEES BY ZIP CODE THAT WORK FOR MAJOR EMPLOYERS IN EAST CENTRAL MICHIGAN, 2014 Over 90% of the workforce for the region s largest employers lives within the 8-county region. This information further underscores the importance of regional collaboration. The region s largest employers most of which are located in Midland, Bay, and Saginaw Counties employ a high number of residents from each of the 8 counties. And these residents, whether they live in the urban core or outside of it, support the businesses and local economy in their home communities. Thus, the region s major employers benefit the entire region, beyond the counties in which they are based. And likewise, these large employers benefit from the entire region by drawing on a regional workforce that is much larger than what exists in close proximity to their facilities. Source: HR Departments of major regional employers THEORY INTO PRACTICE PAGE 68
83 EAST CENTRAL MICHIGAN COMMUTING PATTERNS BY SECTOR NET INFLOW/OUTFLOW OF WORKERS BY ECONOMIC SECTORS, 2011 East Central Michigan draws in workers for retail, restaurants, and manufacturing. These are industries in which the region has a high concentration, drawing in workers from surrounding counties (especially from the Thumb area and from counties just north of the region). Commuters leave the region to work in professional services and administrative services, largely because of the relatively low amount of professional jobs (legal, architecture, engineering, accounting, IT, advertising, marketing, and consulting) available in the region. However, this is in some ways, an untapped opportunity. East Central Michigan is currently exporting professional workers. Many of these professional workers might prefer to work closer to home instead of in the Detroit metro, Lansing, or Grand Rapids. The region s professional talent could be better leveraged by the attraction or expansion of companies that rely on this talent. Net Inbound (net commuting into region) Net Outbound (net commuting out from region) Restaurants, bars, & hotels Retail trade Manufacturing Education Information & media Construction Arts & entertainment Oil, gas, & mining Agriculture Utilities Corporate & regional HQs Personal & other services Property sales & leasing Finance & insurance Government Health care Wholesale trade Transportation & warehousing Administrative services Professional services Source: US Census Bureau, Local Employment Dynamics (LED) database THEORY INTO PRACTICE PAGE 69

84 MEDIAN HOURLY WAGE RATE BY OCCUPATIONAL GROUP LOCAL MEDIAN WAGES PRESENTED IN THE CONTEXT OF THE NATIONAL WAGE RANGE, 2014 East Central Michigan s wages are generally lower than those of Michigan as a whole. This is a double-edged sword. Lower wages are an important aspect of a strong business climate, helping employers to operate efficiently from a cost perspective. However, low wages can also make it more difficult for a community to attract and retain workers. The region s production occupations pay the same wage as Michigan. The region s only occupation with significantly higher wages than Michigan is life, physical, & social science. This is likely due to the high numbers of scientists working for Dow Chemical and Dow Corning. The region s wages are significantly lower than Michigan for the following occupations: business & finance, computer & math science, legal, and management. National Range East Central Michigan Michigan Note: Circle represents the regional median wage; horizontal bar represents the state median wage; vertical line represents the national wage range between the 10th and 90th percentiles. Source: EMSI Complete Employment THEORY INTO PRACTICE PAGE 70
85 OCCUPATIONAL GROUP CONCENTRATIONS RELATIVE TO THE US LOCATION QUOTIENT ANALYSIS, 2014 East Central Michigan has a significant concentration of workers in the following occupational groups: healthcaresupport (1.57); architecture & engineering (1.36); production (1.28); and healthcare-technical (1.20). The region has a relatively low percentage of workers in these occupations: military (0.35); computer & math science (0.45); legal (0.53); arts, design, & media (0.63); and business & finance (0.68). US average for each industry = 1.00 Regional strength > 1.25 Regional weakness < 0.75 Michigan East Central Michigan Architecture & engineering Production Healthcare (support) Healthcare (technical) Food preparation & serving Sales Installation, maint., & repair Management Office & administrative support Property maintenance Community & social services Education, training, & library Computer & math science Transportation & material moving Business & financial operations Personal care & services Arts, design, & media Life, physical, & social science Construction & extraction Protective services Farming, fishing, & forestry Legal Military Source: EMSI Complete Employment THEORY INTO PRACTICE PAGE 71
86 EAST CENTRAL MICHIGAN OCCUPATIONS BY AGE OCCUPATIONAL CATEGORY BREAKDOWN BY AGE, 2014 Differences exist in the age of workers across occupational groups in East Central Michigan. Some of this is to be expected. Food preparation and serving, for example, is an entryway into the workforce for many younger workers. It makes sense that as workers age they move into other occupations. Conversely, there is a small share of managerial workers under age 35. This makes also makes sense, as these jobs tend to be filled by more experienced candidates. The managerial category also includes self-employed farmers/ranchers who are typically a more mature group. Other occupational categories that employ a high proportion of younger workers include: military; personal care & services; sales; farming, fishing, & forestry; and healthcare (support). Under Over 55 Food preparation & serving Military Personal care & services Sales Farming, fishing, & forestry Healthcare (support) Arts, design, & media Construction & extraction 48% 45% 43% 42% 41% 38% 36% 67% 39% 35% 37% 37% 43% 42% 51% 25% 8% 13% 20% 20% 21% 16% 19% 13% REGIONAL AVERAGE 36% 45% 19% Property maintenance Office & administrative support Computer & mathematical science Transportation & material moving Production Installation, maintenance, & repair Healthcare (technical) Business & financial operations Protective services Community & social services Life, physical, & social science Architecture & engineering Education, training, & library Legal Management 35% 32% 31% 30% 29% 29% 28% 27% 27% 26% 26% 25% 24% 22% 20% 44% 46% 55% 49% 54% 52% 51% 52% 48% 46% 53% 56% 50% 52% 58% 21% 23% 14% 22% 17% 19% 21% 21% 26% 28% 21% 19% 26% 26% 22% 0% 25% 50% 75% 100% Source: EMSI Complete Employment THEORY INTO PRACTICE PAGE 72
87 EAST CENTRAL MICHIGAN OCCUPATIONS BY GENDER OCCUPATIONAL CATEGORY BREAKDOWN BY GENDER, 2014 The region has a wide occupational divide by gender. Female workers are much more likely to be employed in the following occupations: healthcare (support & technical); personal care & services; office & administrative support; community & social services; and education, training, & library. Male workers cluster heavily in these occupations: construction & extraction; installation, maintenance, & repair; architecture & engineering; transportation & material moving; farming, fishing, & forestry; production; computer & math science; management; and military. These patterns matter at the household level. Economic recessions can hit certain types of occupations disproportionately. Local policymakers must consider these issues carefully when structuring economic development strategies and workforce training programs to best match local needs. Male Female Healthcare (support) Healthcare (technical) Personal care & services Office & administrative support Community & social services Education, training, & library Food preparation & serving Legal Sales Business & financial operations 11% 21% 23% 27% 34% 36% 40% 43% 45% 46% 89% 79% 77% 73% 66% 64% 60% 57% 55% 54% REGIONAL AVERAGE 48% 52% Protective services Arts, design, & media Life, physical, & social science Property maintenance Military Management Computer & mathematical science Production Farming, fishing, & forestry Transportation & material moving Architecture & engineering Installation, maintenance, & repair Construction & extraction 48% 51% 52% 53% 61% 63% 70% 75% 78% 82% 83% 91% 92% 52% 49% 48% 47% 39% 37% 30% 25% 22% 18% 17% 9% 8% 0% 25% 50% 75% 100% Source: EMSI Complete Employment THEORY INTO PRACTICE PAGE 73
88 JOB CHANGE BY OCCUPATION ANNUAL JOB CHANGE IN EAST CENTRAL MICHIGAN BY OCCUPATION ( ) Three occupational groups production, architecture & engineering, and healthcare (support) experienced job growth in each of the five years since The only occupational category that lost jobs each year since 2010 is education, training, & library. The construction & extraction group also lost a significant number of jobs in four of the five years, but experienced a negligible gain in Production Property maintenance Food preparation & serving Architecture & engineering Healthcare (support) Sales Transportation & material moving Management Installation, maint., & repair Personal care & services Business & financial operations Office & administrative support Farming, fishing, & forestry Life, physical, & social science Computer & math science Healthcare (technical) Arts, design, & media Protective services Legal Military Community & social services Construction & extraction Education, training, & library -1,500-1, ,000 1,500 2,000 2,500 Source: EMSI Complete Employment THEORY INTO PRACTICE PAGE 74
89 CURRENT SCHOOL ENROLLMENT CURRENT ENROLLMENT STATUS OF POPULATION AGE 3 AND OLDER, 2012* 27.7% of East Central Michigan s residents are currently enrolled students. This percentage is slightly higher than Michigan (27.5%) and the US (26.6%). However, this figure is skewed by Isabella County s extremely high percentage of college students (30.1% of the county s total population). The percentage of enrolled students in Midland County and Saginaw County is almost exactly the same as Michigan, but rate of enrolled students is much lower in the other five counties (Gladwin, Arenac, Clare, Bay, and Gratiot). The region s northern counties in particular (Gladwin, Arenac, and Clare), have a low percentage of students thanks to the higher proportion of retirees residing in this part of the region. Preschool & Kindergarten Elementary school (grades 1-8) High school (grades 9-12) College or graduate school Gladwin County 2.2% 8.8% 5.0% 3.5% Arenac County 2.4% 8.6% 5.3% 3.6% Clare County 2.3% 8.9% 5.4% 4.9% Bay County 2.8% 9.7% 5.6% 6.0% Gratiot County 2.7% 9.6% 5.0% 7.9% Saginaw County 3.0% 10.6% 6.1% 7.6% Midland County 3.2% 10.6% 5.9% 7.7% Isabella County 2.1% 7.9% 3.7% 30.1% East Central Michigan 2.7% 9.8% 5.5% 9.7% Michigan 2.8% 10.6% 5.9% 8.2% United States 3.0% 10.6% 5.6% 7.5% 0% 15% 30% 45% Source: US Census Bureau *Data are 5-year averages for from the American Community Survey THEORY INTO PRACTICE PAGE 75
90 EDUCATIONAL ATTAINMENT HIGHEST LEVEL OF EDUCATION ACHIEVED BY POPULATION AGE 25 AND OLDER, 2012* East Central Michigan s percentage of adult residents (age 25 and older) without a high school education is only 12%, which compares favorably to the national average of 14.3%. However, the region has relatively low levels of residents with a college education. Only 19.9% of the region s population has a bachelor s degree or higher, compared with 25.5% in Michigan and 28.5% in the US. Educational attainment levels differ greatly within the region. Midland County has, by far, the most educated population, with 32% of residents holding a bachelor s degree and only 7.6% of residents lacking a high school education. The region s northern counties (Arenac, Clare, and Gladwin) have much lower levels of educational attainment, each with about 11% of residents holding a bachelor s degree, and at least 15% of residents lacking a high school diploma. No High School High School Graduate Some College Associate Degree Bachelor's Degree or Higher Arenac County 17.0% 42.4% 21.9% 7.7% 11.0% Clare County 15.9% 39.8% 25.9% 7.2% 11.1% Gladwin County 15.0% 40.3% 25.0% 8.0% 11.6% Gratiot County 12.6% 41.2% 24.9% 7.9% 13.4% Bay County 11.4% 35.2% 24.1% 10.6% 18.6% Saginaw County 13.2% 35.0% 24.1% 8.9% 18.8% Isabella County 10.1% 33.6% 23.4% 7.7% 25.2% Midland County 7.6% 28.7% 21.7% 10.0% 32.0% East Central Michigan 12.0% 35.2% 23.8% 9.0% 19.9% Michigan 11.3% 30.7% 24.0% 8.4% 25.5% United States 14.3% 28.2% 21.3% 7.7% 28.5% 0% 20% 40% 60% 80% 100% Source: US Census Bureau *Data are 5-year averages for from the American Community Survey THEORY INTO PRACTICE PAGE 76
91 POPULATION WITH NO HIGH SCHOOL EDUCATION PERCENT OF ADULT POPULATION (AGE 25 AND OLDER) WITH NO HIGH SCHOOL DIPLOMA, 2000 & 2012* East Central Michigan has seen a major improvement to its educational attainment levels in recent years. Since 2000, each of the region s counties saw a significant decline in its population without a high school diploma % 7.6% 13.9% 10.1% 17.6% 11.4% 16.5% 12.6% 18.4% 13.2% 21.7% 15.0% 23.9% 15.9% 23.2% 17.0% 17.3% 12.0% 16.6% 11.3% 19.6% 14.3% Midland County Isabella County Bay County Gratiot County Saginaw County Gladwin County Clare County Arenac County East Central Michigan Michigan United States Source: US Census Bureau *2012 data are 5-year averages for from the American Community Survey IMPROVEMENT IN POPULATION WITH NO HIGH SCHOOL DIPLOMA PERCENTAGE DECLINE IN ADULT POPULATION WITHOUT A HIGH SCHOOL DIPLOMA FROM 2000 TO 2012 The decline in East Central Michigan s adult population without a high school education has outpaced the nation as a whole. The proportion of the region s residents without a high school diploma dropped by 30.4% compared to a decline of 27.1% in the US. The improvements have been particularly strong in Bay County (a 35.1% decline) and Clare County (33.3% decline). 24% 27% 28% 29% 31% 31% 33% 35% 30% 32% 27% Gratiot County and Arenac County are the only two counties that improved at a rate slightly less than the US average. Nonetheless, the improvements being made in each county s level of educational attainment are a positive sign for the future of the region s economy. Gratiot County Arenac County Isabella County Saginaw County Midland County Source: US Census Bureau Gladwin County Clare County Bay County East Central MI Michigan United States THEORY INTO PRACTICE PAGE 77
92 POPULATION WITH BACHELOR S DEGREE OR HIGHER PERCENT OF ADULT POPULATION (AGE 25 AND UP) WITH A BACHELOR S DEGREE, 2000 & 2012* East Central Michigan s population has also improved its level of educational attainment at the upper end of the spectrum. Since 2000, each of the region s counties experienced a rise in the percent of college-educated residents % 11.0% 8.8% 11.1% 9.2% 11.6% 12.9% 13.4% 14.2% 18.6% 15.9% 18.8% 23.9% 25.2% 29.3% 32.0% 17.0% 19.9% 21.8% 25.5% 24.4% 28.5% Arenac County Clare County Gladwin County Gratiot County Bay County Saginaw County Isabella County Midland County East Central Michigan Michigan United States Source: US Census Bureau *2012 data are 5-year averages for from the American Community Survey IMPROVEMENT IN POPULATION WITH BACHELOR S DEGREE PERCENT GROWTH IN ADULT POPULATION WITH A BACHELOR S DEGREE OR HIGHER FROM 2000 TO 2012 The growth of East Central Michigan s collegeeducated population has mirrored the improvements in the US as a whole, with an improvement of 16.9% in the region compared to a 16.7% gain in the US. Five of the region s counties enjoyed a higher increase in the percentage of residents with a bachelor s degree than the US. Bay County, in particular, has significantly improved its level of educational attainment. The county s growth rate in its college-educated population since 2000 was 31.5%, nearly double the US rate. The improvements have been less pronounced in Gratiot, Isabella, and Midland counties, although Midland County s educational attainment levels are already higher than the US, so there is less room for improvement. 4% 5% 9% 18% Gratiot County Isabella County Midland County Saginaw County Source: US Census Bureau 21% Arenac County 26% Clare County 27% Gladwin County 31% Bay County 17% East Central MI 17% Michigan 17% United States THEORY INTO PRACTICE PAGE 78
, but slightly lower than Michigan (8.6%).")
93 UNEMPLOYMENT RATES CURRENT UNEMPLOYMENT RATE (JULY 2014) SET AGAINST HISTORICAL RANGE, The July 2014 unemployment rate of 8.4% in East Central Michigan remains significantly higher than the US (6.5%), but slightly lower than Michigan (8.6%). The region s northern counties (Arenac, Gladwin, and Clare) each have an unemployment rate of more than 10%. These three counties have historically suffered from higher rates of unemployment than the rest of the region. In fact, Arenac County s unemployment rate nearly reached 20% at the peak of the Great Recession. On the other hand, both Isabella County and Midland County have much lower unemployment rates (7.1% and 7%, respectively), and their historical range is significantly lower than the rest of the region. These two counties have experienced less volatility in their unemployment rate thanks to the benefits provided by each county s large, relatively stable employers (CMU in Isabella County and Dow Chemical and Dow Corning in Midland County). Current Unemployment Rate (July 2014) Unemployment Rate Range Since Jan % 15% 10.9% 11.2% 10% 10.1% 8.3% 8.7% 9.1% % 7.1% 5% 0% Midland County Isabella County Bay County Saginaw County Gratiot County Arenac County Gladwin County Clare County East Central Michigan Source: US Bureau of Labor Statistics THEORY INTO PRACTICE PAGE 79
94 THEORY INTO PRACTICE PAGE 80
95 STATISTICAL BENCHMARKING STATISTICAL BENCHMARKING THEORY INTO PRACTICE PAGE 81
96 THEORY INTO PRACTICE PAGE 82
97 TIP worked with the Strategic Management Team to identify benchmark regions that could be used in a comparison of East Central Michigan s economy with peer regions. The four key similarities among these regions are: 1. Location in Midwestern US BENCHMARK REGIONS & COMPONENTS 2. Roughly comparable size of population Region Counties Arenac, Bay, Clare, Gladwin, East Central MI (PR-5) Gratiot, Isabella, Midland, 3. Strong manufacturing sector (LQ of 1.0 or higher) Saginaw Allegan, Barry, Ionia, Kent, 4. An urban core with surrounding rural counties West MI (PR-4b) Montcalm, Muskegon, Ottawa Genesee, Huron, Lapeer, St. Clair, East MI (PR-6) Within the state of Michigan, five other Prosperity Sanilac, Shiawassee, Tuscola South Central MI (PR-7) Clinton, Eaton, Ingham Regions with comparable population sizes and Berrien, Branch, Calhoun, Cass, similar economic make-ups were selected. The Detroit Southwest MI (PR-8) Kalamazoo, St. Joseph, Van Buren metro area region (PR-10) and the regions in Hillsdale, Jackson, Lenawee, Southeast MI (PR-9) northern Michigan (PR-1, PR-2, and PR-3) were Livingston, Monroe, Washtenaw IA: Clinton, Muscatine, Scott excluded from the statistical benchmarking because Quad Cities, IA-IL IL: Henry, Mercer, Rock Island their population size and economies are not similar Adams, Allen, DeKalb, Huntington, Fort Wayne, IN to East Central Michigan. Noble, Steuben, Wells, Whitley Boone, Ogle, Stephenson, Rockford, IL Winnebago Outside of Michigan, four consolidated statistical Toledo, OH Fulton, Lucas, Ottawa, Wood areas (CSAs) were selected. For the out-of-state regions, the CSAs were used instead of metropolitan statistical areas (MSAs) because they include more surrounding rural counties that are loosely tied to the urban core. This approach allowed for more of an apples-toapples comparison between the Prosperity Regions and the out-of-state regions. East Central MI (PR-5) West MI (PR-4b) East MI (PR-6) Sources: US Census Bureau, US Bureau of Labor Statistics South Central MI (PR-7) Southwest MI (PR-8) Southeast MI (PR-9) Fort Wayne, IN Quad Cities, IA-IL Rockford, IL Toledo, OH Population (2013) 571,246 1,364, , , , , , , , ,298 Population Growth ( ) -2.1% 7.6% -4.2% 4.3% 0.6% 7.0% 6.5% 1.5% 5.6% -1.5% Unemployment Rate (July 2014) 8.4% 6.8% 9.3% 7.6% 7.5% 7.4% 5.9% 6.2% 9.1% 6.3% Labor Force Growth ( ) -6.3% -2.1% -12.8% -5.3% -9.6% -5.4% -4.2% 0.1% -4.9% -5.4% Per Capita Income (2012) $19,125 $20,493 $20,438 $21,653 $19,859 $24,201 $20,475 $20,030 $20,988 $20,652 Business Establishment Growth ( ) -12.1% -6.3% -17.8% -13.0% -8.7% -5.9% 4.8% 4.0% 9.0% -6.0% Percent With Bachelor's Degree 19.9% 25.4% 16.8% 31.7% 23.6% 31.5% 21.8% 23.4% 20.3% 23.5% (2012) Percent in Age Group (2014) THEORY INTO PRACTICE PAGE 83
98 POPULATION GROWTH (PRE-RECESSION & POST-RECESSION) PERCENT CHANGE IN POPULATION ( ; ) East Central Michigan s total population has not grown in recent years. The region s population declined by 1.1% from 2000 to 2010, and by another 1% from 2010 to Compared to the nine other benchmark regions, East Central Michigan only fared better than East Michigan from 2000 to 2010 and better than East Michigan and Rockford, IL from 2010 to The lack of population growth is one of the biggest challenges facing East Central Michigan. None of the benchmark regions have grown as quickly as the US as a whole. However, recent population growth in South Central Michigan, West Michigan, and Southeast Michigan bodes well for the state of Michigan. 10% % Change % Change 9.7% 8% 7.2% 6% 5.1% 5.4% 5.9% 4% 2% 0% 0.5% 0.1% 0.8% 0.7% 3.6% 0.7% 1.3% 2.1% 1.0% 0.1% 2.4% -2% -4% -2.1% -2.1% -1.2% -0.3% -1.1% -1.0% -1.5% East MI (PR-6) Toledo, OH -0.6% East Central MI (PR-5) Southwest MI (PR-8) Quad Cities, IA-IL South Central MI (PR-7) Fort Wayne, IN West MI (PR-4b) Southeast MI (PR-9) Rockford, IL Michigan U.S. Source: US Census Bureau THEORY INTO PRACTICE PAGE 84
99 NET MIGRATION CUMULATIVE NET MIGRATION, East Central Michigan lost over 18,000 residents from due to migration. This averages out to a net loss of just over 2,600 residents on an annual basis. Only two benchmark regions-rockford, IL and the Quad Cities, IA- IL gained residents due to migration from 2004 to , ,573 5,124-10,000-20,000-30,000-40,000-33,565-31,379 East MI (PR-6) West MI (PR-4b) -26,006-21,749-19,208-18,619-18,385 Toledo, OH South Southwest Southeast Central MI (PR-7) MI (PR-8) MI (PR-9) East Central MI (PR-5) -9,448 Fort Wayne, IN Rockford, IL Quad Cities, IA- IL Source: US Internal Revenue Service NET MIGRATION PER CAPITA CUMULATIVE NET MIGRATION PER CAPITA, On a per capita basis, East Central Michigan lost more residents from 2004 to 2011 due to migration than each of the benchmark regions except for South Central Michigan, Toledo, OH, and East Michigan South Central MI (PR-7) Toledo, OH East MI (PR-6) East Southwest Central MI MI (PR-8) (PR-5) West MI (PR-4b) Southeast MI (PR-9) Fort Wayne, IN Rockford, IL Quad Cities, IA- IL Source: US Internal Revenue Service THEORY INTO PRACTICE PAGE 85
100 FOREIGN-BORN RESIDENTS FOREIGN-BORN RESIDENTS AS A PERCENTAGE OF TOTAL POPULATION, 2000 & 2012* One of the factors that mitigates out-migration from East Central Michigan is the growing number of foreign-born residents. In 2000, 1.9% of the region s population was born outside the US. This percentage increased to 2.2% of the region s population in The percentage of foreign-born residents has increased in each of the benchmark regions from 2000 to However, East Central Michigan has the lowest percentage of foreign-born residents. This represents a potentially untapped opportunity to attract a higher number of international migrants, especially given the region s higher education institutions and global corporations East Central MI (PR-5) East MI (PR-6) Toledo, OH Fort Wayne, IN Southwest MI (PR-8) Quad Cities, IA-IL 12.9% West MI (PR-4b) 1.9% 2.2% 2.0% 2.2% 2.8% 3.2% 3.0% 4.3% 3.6% 4.4% 3.4% 4.5% 4.6% 5.1% 4.9% 5.4% 4.6% 6.4% 5.5% 7.0% 5.3% 6.0% 11.1% Southeast MI (PR-9) South Central MI (PR-7) Rockford, IL Michigan United States Source: US Census Bureau *2012 data are 5-year averages for from the American Community Survey THEORY INTO PRACTICE PAGE 86
101 HOUSING PERMITS (PRE-RECESSION & POST-RECESSION) ANNUAL HOUSING PERMITS PER 1,000 RESIDENTS, & The number of new housing units permitted in the years leading up to the Great Recession ( ) was much higher than in the years since the economic downturn ( ). However, the decline in housing permit activity in East Central Michigan was less severe than it was in many of the benchmark regions, East Michigan and Rockford, IL in particular Fort Wayne, IN Quad Cities, IA-IL West MI (PR-4b) South Central MI (PR-7) Toledo, OH Southeast MI (PR-9) East Central MI (PR-5) Southwest MI (PR-8) Rockford, IL East MI (PR-6) Source: US Department of Housing & Urban Development, Building Permits Database THEORY INTO PRACTICE PAGE 87
102 PER CAPITA INCOME PER CAPITA INCOME, 2000 & 2012* East Central Michigan s per capita income of $22,611 is the lowest among the benchmark regions and is substantially lower than Michigan ($25,547) and the US ($28,051). The region s per capita income levels grew by 18.2% from 2000 to 2012, which is better than Michigan s growth rate of 15.2%, but much lower than the US growth rate of 29.9%. $19,125 $22,611 $20,438 $22,734 $19,859 $23,692 $20,475 $24,012 $20, East Central MI (PR-5) $24,105 $20,652 $24,687 $20,988 $24,817 $21,653 East MI (PR-6) $20,030 Southwest MI (PR-8) $24,201 Fort Wayne, IN $22,168 West MI (PR-4b) $21,587 Toledo, OH Rockford, IL $25,519 $26,893 $28,253 $25,547 $28,051 South Central MI (PR-7) Quad Cities, IA-IL Southeast MI (PR-9) Michigan United States Source: US Census Bureau *2012 data are 5-year averages for from the American Community Survey THEORY INTO PRACTICE PAGE 88
 and the US (14.9%). The growth in the region s poverty rate from 2000 to 2012 is a worrisome trend.")
103 POVERTY RATE PERCENTAGE OF POPULATION WHOSE INCOME IN PAST YEAR IS BELOW THE POVERTY LEVEL, 2000 & 2012* East Central Michigan s poverty rate of 18.8% is the highest among the benchmark regions, and much higher than Michigan (16.3%) and the US (14.9%). The growth in the region s poverty rate from 2000 to 2012 is a worrisome trend. During this period, the region s poverty rate rose by 51.5%, somewhat lower than Michigan s rise of 58.6%, but more than double the US increase of 23.7%. Source: US Census Bureau *2012 data are 5-year averages for from the American Community Survey THEORY INTO PRACTICE PAGE 89
 and East Michigan (9.3%). It is slightly less than Michigan s rate (8.6%).")
104 UNEMPLOYMENT RATES CURRENT UNEMPLOYMENT RATE (JULY 2014) SET AGAINST HISTORICAL RANGE, East Central Michigan s latest (July 2014) unemployment rate of 8.4% is higher than each of the benchmark regions rates, except for those of Rockford, IL (9.1%) and East Michigan (9.3%). It is slightly less than Michigan s rate (8.6%). The region s historical range of unemployment rates from 2000 to 2014 is roughly comparable to each of the benchmark regions except Quad Cities, IA-IL, which was not hit as hard by the Great Recession. Current Unemployment Rate (July 2014) Unemployment Rate Range Since Jan % 15% 10% 5% 5.9% 6.2% 6.3% 6.8% 7.4% 7.5% 7.6% 8.4% 9.1% 9.3% 8.6% 6.5% 0% Fort Wayne, IN Quad Cities, IA-IL Toledo, OH West MI (PR-4b) Southeast MI (PR-9) Southwest MI (PR-8) South Central MI (PR-7) East Central MI (PR-5) Rockford, IL East MI (PR-6) Michigan U.S. Source: US Bureau of Labor Statistics THEORY INTO PRACTICE PAGE 90

105 LABOR FORCE CHANGE (PRE-RECESSION & POST-RECESSION) PERCENT CHANGE IN LABOR FORCE, & East Central Michigan s labor force declined by 0.6% from 2000 to 2008 and by 5.7% from 2008 to The ability to attract, retain, and develop a labor force is one of the region s most significant challenges. This challenge is not unique to East Central Michigan. The region s labor force decline is comparable to most of the benchmark regions, and the region fared much better than Michigan as a whole from 2000 to 2008 when the state lost 3.6% of its labor force. Source: US Bureau of Labor Statistics THEORY INTO PRACTICE PAGE 91
. From 2008 to 2013, the region lost 3.")

106 PRIVATE BUSINESS ESTABLISHMENT CHANGE (PRE-RECESSION & POST-RECESSION) PERCENT CHANGE IN PRIVATE BUSINESS ESTABLISHMENTS, & The number of private business establishments in East Central Michigan declined by 9.2% from 2000 to 2008, a loss greater than each of the benchmark regions except for East Michigan (-10.4%). From 2008 to 2013, the region lost 3.1% of its private business establishments, which was comparable to many of the benchmark regions and far less severe than Michigan s decline of 8.4% during the same period. Nonetheless, the creation of new businesses in East Central Michigan remains a significant challenge, especially given the growth in business establishments that continues in the US economy as a whole. Source: US Bureau of Labor Statistics THEORY INTO PRACTICE PAGE 92
107 JOB LOSSES, (PRE-RECESSION) PERCENT CHANGE IN TOTAL EMPLOYMENT, East Central Michigan, like most of the Midwest, was hit hard by the Great Recession. The region lost 9.9% of its total jobs from 2001 to 2010, less than Michigan s 14.3% decline, but worse than the 0.4% decline in the US. East MI (PR-6) Toledo, OH Southwest MI (PR-8) East Central MI (PR-5) South Central MI (PR-7) Rockford, IL West MI (PR-4b) Southeast MI (PR-9) Fort Wayne, IN Quad Cities, IA-IL Michigan U.S. -1.4% -0.4% -16.6% -13.1% -10.8% -9.9% -9.5% -9.4% -9.3% -9.0% -8.6% -14.3% Source: EMSI Complete Employment JOB GAINS, (POST-RECESSION) PERCENT CHANGE IN TOTAL EMPLOYMENT, Since 2010, East Central Michigan has grown its employment by 3.9%. This is comparable to most of the benchmark regions but less than the growth rates in Michigan (6.8%) and the US (5.5%). 13.0% 9.0% 1.0% 2.2% 3.6% 3.7% 3.9% 4.4% 4.5% 6.3% 6.8% 5.5% Rockford, IL Quad Cities, IA-IL Southwest MI (PR-8) South Central MI (PR-7) East Central MI (PR-5) East MI (PR-6) Toledo, OH Fort Wayne, IN Southeast MI (PR-9) West MI (PR-4b) Michigan U.S. Source: EMSI Complete Employment THEORY INTO PRACTICE PAGE 93
108 INDUSTRY STRENGTHS LOCATION QUOTIENTS OF MAJOR SECTORS, 2014 East Central Michigan enjoys industry strengths in manufacturing (LQ of 1.55), local government (1.45), and corporate & regional HQs (1.29). Compared to the benchmark regions, East Central Michigan also has a relatively high proportion of jobs in the following sectors: administrative services (1.12); health care (1.18); restaurants, bars, & hotels (1.09); agriculture (0.83); and state government (0.78). Relative to the benchmark regions, East Central Michigan has a low percentage of jobs in: professional services (0.52); wholesale trade (0.59); finance & insurance (0.68); and transportation & warehousing (0.57). West MI (PR-4b) East Central MI Source: EMSI Complete Employment East MI (PR-6) South Central MI Southwest MI (PR-8) Southeast MI (PR-9) Quad Fort Cities, IA-IL Wayne, IN Rockford, IL Toledo, OH Michigan Manufacturing Utilities Administrative services Professional services Healthcare Retail trade Personal & other services Restaurants, bars, & hotels Wholesale trade Corporate & regional HQs Education Local government Finance & insurance Property sales & leasing Transportation & warehousing Agriculture Construction Information & media Arts & entertainment State government Federal government (civilian) Federal government (military) Oil, gas, & mining Location quotient descriptions: extremely high (> 2.00) above average (>1.25) average (between 0.75 and 1.25) below average (<0.75) THEORY INTO PRACTICE PAGE 94
109 MANUFACTURING JOB LOSSES, (PRE-RECESSION) PERCENT CHANGE IN MANUFACTURING EMPLOYMENT, East Central Michigan lost 29.4% of its manufacturing jobs from 2001 to 2010, nearly the same decline as the US (29.7%), but not as severe as Michigan s decline (41.8%) and less severe than most of the benchmark regions. East MI (PR-6) Southeast MI (PR-9) Toledo, OH West MI (PR-4b) Southwest MI (PR-8) Rockford, IL South Central MI (PR-7) East Central MI (PR-5) Fort Wayne, IN Quad Cities, IA-IL Michigan U.S % -52.6% -44.5% -35.9% -34.0% -33.9% -33.8% -31.3% -29.4% -28.3% -41.8% -29.7% Source: EMSI Complete Employment MANUFACTURING JOB GAINS, (POST-RECESSION) PERCENT CHANGE IN MANUFACTURING EMPLOYMENT, East Central Michigan s manufacturing sector has bounced back strongly from the Great Recession, with a 13.9% job growth rate from 2010 to 2014, about three times higher than the US growth rate of 4.7%. 10.0% 12.6% 12.8% 13.1% 13.9% 17.3% 18.0% 21.6% 23.8% 19.4% 4.6% 4.7% Quad Cities, IA-IL Southwest MI (PR-8) South Central MI (PR-7) Fort Wayne, IN Rockford, IL East Central MI (PR-5) Southeast MI (PR-9) Toledo, OH West MI (PR-4b) East MI (PR-6) Michigan U.S. Source: EMSI Complete Employment THEORY INTO PRACTICE PAGE 95
110 PROF. SERVICES JOB CHANGE, (PRE-RECESSION) PERCENT CHANGE IN PROFESSIONAL SERVICES EMPLOYMENT, Total employment in East Central Michigan s professional services industry declined by 10.1% from 2001 to During the same period, the professional services sector grew by 8.8% in the US. 30% 20% 10% 0% -10% -20% -30% -40% -36.2% -20.1% -10.4% -10.1% -10.0% -2.0% -2.0% -1.7% 1.7% 23.5% -14.7% 8.8% East MI (PR-6) South Central MI (PR-7) Southeast MI (PR-9) East Central MI (PR-5) Toledo, OH Rockford, IL Fort Wayne, IN West MI (PR-4b) Southwest MI (PR-8) Quad Cities, IA-IL Michigan U.S. Source: EMSI Complete Employment PROF. SERVICES JOB CHANGE, (POST-RECESSION) PERCENT CHANGE IN PROFESSIONAL SERVICES EMPLOYMENT, From 2010 to 2014, employment in the professional services sector has grown by 6.4% in East Central Michigan, a higher rate than most of the benchmarks but significantly lower than Michigan s growth rate of 20.5%. 25% 20% 15% 10% 5% 0% -5% -10% -8.0% -3.4% 2.0% 4.7% 5.0% 6.2% 6.4% 11.1% 14.4% 19.3% 20.5% 9.8% Rockford, IL Fort Wayne, IN South Central MI (PR- 7) East MI (PR-6) Quad Cities, IA-IL Toledo, OH East Central MI (PR-5) Southwest MI (PR-8) West MI (PR-4b) Southeast MI (PR-9) Michigan U.S. Source: EMSI Complete Employment THEORY INTO PRACTICE PAGE 96
111 HEALTH CARE JOB CHANGE, (PRE-RECESSION) PERCENT CHANGE IN HEALTH CARE EMPLOYMENT, East Central Michigan s health care sector grew by 9.8% from 2001 to However, the gain was less than all benchmarks except for East Michigan (9.1%) and much less than Michigan (15.8%) and the US (23.5%). 30% 20% 10% 9.1% 9.8% 12.5% 16.0% 16.4% 16.5% 17.2% 20.5% 25.4% 26.2% 15.8% 23.5% 0% East MI (PR-6) East Central MI (PR-5) Toledo, OH Southwest MI (PR-8) Fort Wayne, IN Quad Cities, IA- IL Rockford, IL Southeast MI (PR-9) West MI (PR-4b) South Central MI (PR-7) Michigan U.S. Source: EMSI Complete Employment HEALTH CARE JOB CHANGE, (POST-RECESSION) PERCENT CHANGE IN HEALTH CARE EMPLOYMENT, From 2010 to 2014, employment in East Central Michigan s health care industry grew by 1.9%, a rate better than five of the benchmark regions but significantly less than Michigan (3.6%) and the US (8.1%). 15% 10% 5% 0% -5% -2.3% -1.2% 0.7% 1.7% 1.9% 1.9% 2.0% 6.3% 7.5% 11.5% 3.6% 8.1% South Central MI (PR-7) East MI (PR-6) Southwest MI (PR-8) Rockford, IL Toledo, OH East Central MI (PR-5) Quad Cities, IA-IL Southeast MI (PR-9) Fort Wayne, IN West MI (PR-4b) Michigan U.S. Source: EMSI Complete Employment THEORY INTO PRACTICE PAGE 97
112 ANNUAL AIR TRAVEL PASSENGERS ANNUAL AIR TRAVEL PASSENGERS AT COMMERCIAL AIRPORTS, The number of annual air travel passengers at MBS International Airport has declined from 185,052 in 2002 to 119,749 in 2013, a drop of 35.3%. Compared to the primary commercial airports in each benchmark region, the decline in passengers at MBS from 2002 to 2013 has been more than every airport except for Toledo Express, which experienced a 73% drop in its annual passengers during the same period. Grand Rapids (Gerald Ford) Flint (Bishop) Lansing (Capital Region) Kalamazoo-Battle Creek Quad City Fort Wayne Rockford (Chicago-Rockford) Toledo Express MBS 1,200,000 1,000, , , , , Source: US Department of Transportation, Bureau of Transportation Statistics THEORY INTO PRACTICE PAGE 98
113 AIR TRAVEL PASSENGERS PER CAPITA AIR TRAVEL PASSENGERS PER CAPITA, 2013 On a per capita basis, East Central Michigan has fewer air travel passengers than each of the benchmark regions except for Southwest Michigan, Toledo, OH, and Southeast Michigan. It is worth noting that although Southeast Michigan does not have any commercial airports, it is in close proximity to Detroit-Wayne County International Airport Southeast, MI (PR-9) Toledo, OH Southwest MI (PR-8) East Central MI (PR-5) Rockford, IL South Central MI (PR-7) East MI (PR-6) Fort Wayne, IN Quad Cities, IA- IL West MI (PR-4b) Source: US Department of Transportation, Bureau of Transportation Statistics THEORY INTO PRACTICE PAGE 99
114 CURRENT SCHOOL ENROLLMENT CURRENT ENROLLMENT STATUS OF POPULATION AGE 3 AND OLDER, 2012* Compared to the benchmark regions, East Central Michigan has a relatively low percentage of K-12 students and a high percentage of college and graduate students. East Central Michigan has a lower percentage of preschool & kindergarten students (2.7%) than each of the benchmark regions except for South Central Michigan (2.6%). The region has the lowest percentage of elementary school students (9.8%) among the benchmarks. East Central Michigan has a lower percentage of high school students (5.5%) than each of the benchmarks except for South Central Michigan (5.3%). Preschool & Kindergarten Elementary school (grades 1-8) High school (grades 9-12) College or graduate school Quad Cities, IA-IL 3.0% 10.4% 5.6% 6.1% Rockford, IL 3.1% 11.2% 6.0% 5.4% East MI (PR-6) 2.7% 11.0% 6.2% 6.4% Fort Wayne, IN 3.1% 11.9% 5.9% 6.4% Southwest MI (PR-8) 2.8% 10.6% 5.7% 8.5% East Central MI (PR-5) 2.7% 9.8% 5.5% 9.7% West MI (PR-4b) 3.2% 11.5% 6.0% 7.3% Toledo, OH 2.8% 10.3% 5.6% 9.8% Southeast MI (PR-9) 2.8% 10.4% 5.6% 10.9% South Central MI (PR-7) 2.6% 9.8% 5.3% 15.4% Michigan 2.8% 10.6% 5.9% 8.2% United States 3.0% 10.6% 5.6% 7.5% 0% 5% 10% 15% 20% 25% 30% 35% Source: US Census Bureau *Data are 5-year averages for from the American Community Survey THEORY INTO PRACTICE PAGE 100
115 EDUCATIONAL ATTAINMENT HIGHEST LEVEL OF EDUCATION ACHIEVED BY POPULATION AGE 25 AND OLDER, 2012* Educational attainment levels in East Central Michigan are generally lower than most of the benchmark regions. Only Rockford, IL has a higher percentage of adult residents without a high school education. And only East Michigan has a lower percentage of residents with a bachelor s degree or higher. No High School High School Graduate Some College Associate Degree Bachelor's Degree or Higher East MI (PR-6) 11.5% 36.5% 25.9% 9.2% 16.8% East Central MI (PR-5) 12.0% 35.2% 23.8% 9.0% 19.9% Rockford, IL 13.7% 34.9% 23.3% 7.8% 20.3% Fort Wayne, IN 11.6% 35.3% 22.2% 9.0% 21.8% Quad Cities, IA-IL 10.8% 31.8% 23.9% 10.1% 23.4% Toledo, OH 11.0% 33.7% 22.9% 8.9% 23.5% Southwest MI (PR-8) 11.4% 31.9% 24.5% 8.5% 23.6% West MI (PR-4b) 10.9% 31.5% 23.5% 8.7% 25.4% Southeast MI (PR-9) 8.6% 28.0% 23.8% 8.1% 31.5% South Central MI (PR-7) 8.0% 25.3% 25.6% 9.4% 31.7% Michigan 11.3% 30.7% 24.0% 8.4% 25.5% United States 14.3% 28.2% 21.3% 7.7% 28.5% 0% 20% 40% 60% 80% 100% Source: US Census Bureau *Data are 5-year averages for from the American Community Survey THEORY INTO PRACTICE PAGE 101
116 POPULATION WITH NO HIGH SCHOOL EDUCATION PERCENTAGE OF POPULATION WITHOUT A HIGH SCHOOL DIPLOMA (OR EQUIVALENT), 2000 & 2012* The percentage of residents in East Central Michigan without a high school education declined from 17.3% of the adult population (age 25 and older) in 2000 to only 12% of the population in % 8.0% 12.4% 8.6% 15.8% 10.8% 15.6% 10.9% 15.9% 11.0% 16.6% 11.4% 17.2% 11.5% 15.4% 11.6% 17.3% 12.0% 18.1% 13.7% 16.6% 11.3% 19.6% 14.3% South Central MI (PR-7) Southeast MI (PR-9) Quad Cities, IA- IL West MI (PR-4b) Toledo, OH Southwest MI (PR-8) East MI (PR-6) Fort Wayne, IN East Central MI (PR-5) Rockford, IL Michigan United States Source: US Census Bureau *2012 data are 5-year averages for from the American Community Survey POPULATION WITH BACHELOR S DEGREES OR HIGHER PERCENTAGE OF POPULATION WITH A BACHELOR S DEGREE OR HIGHER, 2000 & 2012* The percentage of adult residents in East Central Michigan with a bachelor s degree or higher grew from 17% of the population in 2000 to 19.9% of the population in % 16.8% 17.0% 19.9% 18.2% 20.3% 18.5% 21.8% 19.1% 23.4% % 23.5% 20.2% 23.6% 21.3% 25.4% 28.4% 31.5% 28.4% 31.7% 21.8% 25.5% 24.4% 28.5% East MI (PR-6) East Central MI (PR-5) Rockford, IL Fort Wayne, IN Quad Cities, IA- IL Toledo, OH Southwest MI (PR-8) West MI (PR-4b) Southeast MI (PR-9) South Central MI (PR-7) Michigan United States Source: US Census Bureau *2012 data are 5-year averages for from the American Community Survey THEORY INTO PRACTICE PAGE 102
117 HIGHER EDUCATION ENROLLMENT TOTAL ENROLLED COLLEGE & UNIVERSITY STUDENTS, 2013 In fall 2013, East Central Michigan had nearly 57,000 students enrolled in the region s colleges and universities. This is one of the region s strongest assets for economic development. 100,773 38,661 43,054 55,471 56,635 60,377 71,681 75,332 23,768 11,702 Rockford, IL Quad Cities, IA-IL East MI (PR-6) Fort Southwest Wayne, IN MI (PR-8) East Central MI (PR-5) Toledo, OH South Central MI (PR-7) West MI (PR-4b) Southeast MI (PR-9) Source: National Center for Education Statistics HIGHER EDUCATION ENROLLMENT PER CAPITA TOTAL ENROLLED COLLEGE & UNIVERSITY STUDENTS PER CAPITA, 2013 On a per capita basis, East Central Michigan has more college and university students than all of the benchmark regions except for Southeast Michigan (home of the University of Michigan) and South Central Michigan (home of Michigan State University) Rockford, IL East MI (PR-6) Quad Cities, IA-IL West MI (PR-4b) Fort Southwest Wayne, IN MI (PR-8) Toledo, OH East Central MI (PR-5) Southeast MI (PR-9) South Central MI (PR-7) Source: National Center for Education Statistics THEORY INTO PRACTICE PAGE 103
118 HIGHER EDUCATION R&D INVESTMENTS TOTAL R&D EXPENDITURES AT UNIVERSITIES, 2012 East Central Michigan universities invested just $12 million in academic R&D in The majority of the region s R&D expenditures, $10.9 million, took place at Central Michigan University. The region s R&D spending is roughly comparable to most of the benchmark regions, with the notable exceptions of South Central Michigan ($507 million) and Southeast Michigan (more than $1.3 billion). Millions $1,250 $1,000 $1,335,148,000 $750 $500 $250 $0 $0 $0 $4,059,000 Quad Cities, IA-IL Rockford, IL East MI (PR-6) West MI (PR-4b) Fort Wayne, IN East Central MI (PR-5) Southwest MI (PR-8) Toledo, OH South Central MI (PR-7) Southeast MI (PR-9) $8,432,000 $8,570,000 $12,001,000 $21,073,000 $76,794,000 $507,061,000 Source: National Science Foundation THEORY INTO PRACTICE PAGE 104
119 HIGHER EDUCATION R&D INVESTMENTS PER CAPITA TOTAL R&D EXPENDITURES AT UNIVERSITIES PER CAPITA, 2012 On a per capita basis, East Central Michigan s R&D investments at higher education institutions are comparable to most of the benchmark regions, again with the notable exceptions of South Central Michigan and Southeast Michigan. In 2012, these two regions received more than 50 times the amount of R&D investments than those in East Central Michigan. $1,500 $1,342 $1,250 $1,085 $1,000 $750 $500 $250 $118 $0 $0 $0 $5 $6 $14 $21 $27 Quad Cities, IA-IL Rockford, IL East MI (PR-6) West MI (PR-4b) Fort Wayne, IN East Central MI (PR-5) Southwest MI (PR-8) Toledo, OH South Central MI (PR-7) Southeast MI (PR-9) Source: National Science Foundation THEORY INTO PRACTICE PAGE 105
120 TOP 10 STATES: HIGHER EDUCATION R&D INVESTMENTS TOTAL UNIVERSITY R&D EXPENDITURES IN TOP 10 STATES, 2012 Michigan received more than $2.2 billion in academic R&D investments in 2012, making it the 9th ranked state in the US for R&D spending. Michigan is the 9th most populated state, so these figures are in line with expectations. $10 $8 $6 $4 $2 $2 $2 $2 $3 $3 $3 $3 $5 $5 $8 $0 Florida Michigan Illinois North Carolina Massachusetts Billions Pennsylvania Maryland Texas New York California Source: National Science Foundation TOP 10 STATES: HIGHER EDUCATION R&D PER CAPITA TOTAL UNIVERSITY R&D EXPENDITURES PER CAPITA IN TOP 10 STATES, 2012 On a per capita basis, Michigan universities received more R&D investments in 2012 than California, Illinois, Texas, and Florida. $600 $480 $568 $400 $200 $112 $176 $183 $219 $226 $253 $272 $273 $0 Florida Texas Illinois California Michigan Pennsylvania North Carolina New York Massachusetts Maryland Source: National Science Foundation THEORY INTO PRACTICE PAGE 106
121 CONCENTRATION OF HIGHER EDUCATION R&D IN EACH STATE S TWO LARGEST RESEARCH UNIVERSITIES SHARE OF STATE S TOTAL UNIVERSITY R&D INVESTMENTS IN TWO LARGEST RESEARCH UNIVERSITIES, % of Michigan s R&D investments are concentrated in the state s top two universities, the University of Michigan and Michigan State University. This makes the state of Michigan unique among the 10 states with the highest amount of R&D investments. No other state has a similar concentration of R&D spending. Every other state in the top 10 does a better job of spreading the wealth of R&D investments to a larger number of higher education institutions. This information speaks highly of the University of Michigan and Michigan State University. Both of these schools are world-class research universities. In fact, the University of Michigan ranks #2 among all US universities, public and private, in total R&D spending. Michigan State University ranks #36 nationally. But more importantly, this represents a huge untapped opportunity for the many other universities in Michigan, including those in East Central Michigan (especially Central Michigan University). Another big opportunity for East Central Michigan is the attraction of R&D investments from the University of Michigan and Michigan State University into the region, tied perhaps to some of the region s major employers (Dow Chemical, Dow Corning, and Nexteer). 70.6% 77.5% 81.8% 50.5% 51.4% 52.2% 53.0% 25.1% 29.7% 31.6% California Texas New York Massachusetts Illinois Florida Pennsylvania North Carolina Maryland Michigan Source: National Science Foundation THEORY INTO PRACTICE PAGE 107

122 APPENDIX C: ECONOMIC DASHBOARD THEORY INTO PRACTICE PAGE 108
.")
123 APPENDIX D: BEST PRACTICE EXAMPLES ECONOMIC DEVELOPMENT & MARKETING REGIONAL COLLABORATION: (EMCOG) The East Central Michigan Planning & Development Regional Commission (ECMPDRC) was originally created in 1968 by the U. S. Department of Commerce, Economic Development Administration as a federal Economic Development District (EDD). In 2009, the ECMPDRC reorganized and became the East Michigan Council of Governments (EMCOG). EMCOG covers over 337 member governments including 14 counties, numerous cities, school districts, and special districts. The 8-county Prosperity Region 5 is also within EMCOG s region. EMCOG serves as the principal organization responsible for managing and implementing the Regional Prosperity Strategy for East Central Michigan, in partnership with stakeholders from the 8-county region representing economic development, workforce development, transportation, higher education, and adult education. For more information, visit: CENTER FOR BUSINESS AND ECONOMIC DEVELOPMENT: SAGINAW VALLEY STATE UNIVERSITY The Center for Business and Economic Development (CBED), housed within Saginaw Valley State University (SVSU), plays an important role in supporting the economic growth of East Central Michigan. The CBED s mission is to enhance the economic vitality of the region by providing technical support for existing businesses; personal and professional development opportunities; programs and services for the manufacturing sector; and commercialization of ideas and inventions whether from within SVSU or from business start-ups across the region. The CBED supports the region s businesses through five entities: 1) Michigan Manufacturing Technology Center, Northeast; 2) Office of Continuing Education and Professional Development; 3) Osher Lifelong Learning Institute; 4) Independent Testing Laboratory; 5) Saginaw Valley Research and Development Corporation. The Independent Testing Lab (established in 1982), in particular, plays a key role in supporting the region s manufacturing industry by providing analytical services and technical support with the latest laboratory equipment needed to improve existing products and bring new products to market. For more information, visit: THEORY INTO PRACTICE PAGE 109

124 LOCAL ECONOMIC DEVELOPMENT: MIDLAND TOMORROW Established in 1963, Midland Tomorrow is a private, non-profit economic development corporation serving Midland County and each municipality within the county. Its mission is to enhance the quality of life for Midland County residents through the retention and creation of quality jobs and diversification of the economic base. The organization has developed long-standing relationships in the local business community that have helped grow and strengthen Midland County s economy. In 2012, Midland Tomorrow received two Excellence in Economic Development Awards from the IEDC (International Economic Development Council) for their economic gardening program and for For more information, visit: LOCAL ECONOMIC DEVELOPMENT: SAGINAW FUTURE INC. Established in 1992, Saginaw Future Inc. is a public-private alliance of local businesses, the County of Saginaw, the City of Saginaw, 15 local municipalities and the Saginaw County Chamber of Commerce. Its mission is to foster quality job creation through expansion of local industry and attraction of new business projects to the community. The organization has a strong track record of influencing businesses to expand employment in Saginaw County. In 2009, Saginaw Future and its partners received the Excellence in Economic Development Award for Excellence in Environmental or Energy Economic Development from the US Department of Commerce for their commitment to research based, market driven economic development in the local economy. In 2012, Saginaw Future received a Gold Excellence in Economic Development Award from the IEDC (International Economic Development Council) for the partnerships and incentive package that led to the successful retention and expansion of Nexteer Automotive. For more information, visit: THEORY INTO PRACTICE PAGE 110


125 ENTREPRENEURSHIP & INNOVATION VENTURE INVESTMENT & PARTNERING FORUMS: WASHINGTON BIOTECHNOLOGY & BIOMEDICAL ASSOCIATION The Washington Biotechnology & Biomedical Association (WBBA) works to support the growth of Washington State's life sciences ecosystem through advocacy, enterprise support, and the enhancement of research collaboration. The WBBA created the Venture Investment & Partnering (VIP) Forums to provide an opportunity for local life sciences entrepreneurs, companies, and researchers to meet with prospective investors and potential strategic partners. The VIP Forum brings to Seattle venture capital firms, corporate venture groups, and multinational life sciences companies (VIPs) that could serve as strategic partners for local life sciences firms. The VIP Forum includes two parts: 1) a plenary session during which the VIPs discuss their targets, interests, and investment/partnering strategies, and answer questions from the audience; and 2) a session in which pre-selected organizations present their investment and partnering opportunities to the VIPs in a one-on-one setting. For more information, visit: BUSINESS INCUBATION: MID MICHIGAN INNOVATION CENTER The Mid Michigan Innovation Center (MMIC) is a private, non-profit business incubator located in Midland. The MMIC provides services, flexible facilities, and entrepreneurial training and education for entrepreneurs to develop business ventures. The organization receives funding and support from the Michigan Economic Development Corporation, Dow Chemical, Dow Corning, and Midland Cogeneration Venture. The MMIC currently serves 45 member companies in a broad range of industries, many of which are technology-intensive. Many MMIC member companies have achieved success in recent years. For example, CDI Engineering grew from 4 to 40 employees in one year (2008), and more recently (2013), Advanced Battery Concepts, LLC, reached a total of $4 million in capital raised in 4 years. For more information, visit: ENTREPRENEURSHIP ECO-SYSTEM MAP: STARTUP SEATTLE Startup Seattle is an initiative and website created by the city s Office of Economic Development designed to help entrepreneurs navigate the city s resources and connections. One of the most valuable components of the Startup Seattle website is the entrepreneurship eco-system map, which graphically displays the locations of nearly 2,000 organizations (startups, investors, incubators, and others) in 25 different categories. The Startup Seattle website provides other information for entrepreneurs including: events (free postings for tech startup events); resources (an ever-expanding list of organizations and services for tech-startups); jobs (a curated collection of tech startup career opportunities); blog articles (tips and trends, profiles of startups and community leaders); and a newsletter. For more information, visit: THEORY INTO PRACTICE PAGE 111


126 ANGEL INVESTMENT: BLUEWATER ANGELS Founded in 2008, BlueWater Angels is the largest and fastest-growing group of angel investors in the state of Michigan, representing about one-third of the state s total angel investments on an annual basis. BlueWater Angels is a network of more than 50 high-networth CEOs, entrepreneurs, and professionals focused on investing capital in companies with high growth potential. In addition to providing access to capital, investors share their experience and expertise, collaborate on the due diligence process and provide mentoring guidance to the companies receiving investment capital. The organization s primary goal is to achieve a positive return on investment (ROI) while supporting the entrepreneurial community for the economic benefit of the entire mid-michigan region and the state. As of 2014, BlueWater Angels is responsible for over $8 million in syndicated investments. For more information, visit: NEW VENTURE COMPETITION: CENTRAL MICHIGAN UNIVERSITY Launched in 2001, Central Michigan University s (CMU) New Venture Competition is a successful entrepreneurship development program. The New Venture Competition offers CMU students a supportive environment for creating a new business or accelerating an existing early stage venture. This includes ventures based on technology developed by CMU students, faculty, and researchers. The program provides students with opportunities to earn start-up capital and to connect with experienced entrepreneurs, alumni, business professionals, venture capital experts, angel investors, and community leaders. The competition awards more than $75,000 in start-up capital and in-kind services to student business ventures. Since its inception, over 100 businesses have been launched through the program, 30 of which are currently still operating. In 2013, the competition was named the Educational Program of the Year by Automation Alley, Michigan s largest technology business association. For more information, visit: THEORY INTO PRACTICE PAGE 112

127 TALENT & WORKFORCE DEVELOPMENT K-12 STUDENT MOTIVATION: TEXAS SCHOLAR AWARD Launched in 2007, the Texas Scholar Award program challenges and inspires K-12 students to be better prepared for future academic and professional success. The Texas Scholar Award rewards 50 high school seniors each year who exhibit leadership and good citizenship through excellence in their academics and extracurricular activities. The 2013 Class of Texas Scholars was the most competitive to date, with 1,528 nominations accepted. Among the 50 students selected in 2013, 96% were in the top 5% of their class and 76% held part-time jobs or completed significant part-time volunteer work during the school year. For more information, visit: WORKFORCE DEVELOPMENT COLLABORATION: GREAT LAKES BAY MICHIGAN WORKS! East Central Michigan s three workforce development groups, led by Great Lakes Bay Michigan Works!, are planning to consolidate into a single agency that serves the 8- county region. This unprecedented collaboration is a direct response to the opportunity and need for a more regional approach to workforce development. The new partnership will improve the efficiency and effectiveness of workforce development programs across the region, with the ultimate goal of better serving the needs of the region s employers and workforce. For more information, visit: CENTER FOR STUDENT OPPORTUNITY: ALMA COLLEGE Alma College is committed to the success of its students and of its surrounding community. This commitment can be seen in the college s Center for Student Opportunity (CSO). The CSO provides support services and practical experiences that enhance educational opportunities for students. Based in the CSO, the Responsible Leadership Institute (RLI) provides innovative leadership and service opportunities for all students including leadership speakers, book discussions, seminars, and workshops. Also as part of the CSO, every student receives up to $2,500 for an experiential learning opportunity that meets personal or professional goals. These consist of research fellowships and other approved learning experiences including many valuable internships with non-profit organizations and local government entities in East Central Michigan that could not otherwise afford to pay for interns or part-time staff. Alma College s commitment to its community has been demonstrated by the college s ongoing investments (campus bookstore and student housing) in downtown Alma. For more information, visit: THEORY INTO PRACTICE PAGE 113

128 FINANCIAL INCENTIVES FOR ON-TIME GRADUATION: GRAND VALLEY STATE UNIVERSITY Many of Michigan s public universities struggle with low graduation rates. In fact, only 3 of the state s 15 public universities have graduation rates above the 31% US average. These three institutions include the state s two flagship schools (University of Michigan and Michigan State University) and Grand Valley State University (GVSU). Back in 1990, GVSU also struggled with low graduation rates of about 15%. To address this problem, university leaders implemented a unique program that cut tuition for students that stayed on track to graduate within four years, basically paying seniors to graduate on time. Since 1990, GVSU s graduation rate has more than doubled, thanks in large part to the financial incentives offered to students for ontime graduation. This program could serve as a model for other public universities in Michigan as a way to reduce costs associated with higher education for students, parents, and the economy as a whole. For more information, visit: FAST START PROGRAM: DELTA COLLEGE In 2008, Delta College partnered with regional businesses and Great Lakes Bay Michigan Works! to create the Fast Start training program in response to demand from employers. The program is designed to provide an accelerated learning environment that leads to hirable employees for high-demand occupations. The program won an award from the National Association of Workforce Boards thanks to job placement rates as high as 89 percent. Delta College currently offers four Industrial Fast Start programs (advanced lithium ion battery manufacturing, advanced manufacturing, chemical process operator, and solar manufacturing) and two Non-Industrial Fast Start programs (business process services and customer service representative). For more information, visit: STEM IMPACT INITIATIVE: GREAT LAKES BAY REGIONAL ALLIANCE In November 2014, the Great Lakes Bay Regional Alliance (GLBRA) launched a comprehensive strategy for STEM (Science, Technology, Engineering, and Math) excellence to build a workforce of tomorrow that is aligned with the needs of regional employers. This effort was developed in response to the growing needs of regional employers for STEM-educated workers, especially in the manufacturing and health care sectors. The study included several months of data analysis, stakeholder interviews, and focus groups with community leaders. Although the study focused on five counties (Bay, Gratiot, Isabella, Midland, and Saginaw), the findings and recommendations can be applied to the entire 8-county region. The STEM Impact Initiative identified four requirements for an effective STEM talent pipeline: 1) driven by employer demand; 2) powered by career-ready and college-ready students; 3) strengthening technical skills needed in the economy; 4) sustained by a culture of STEM. For more information, visit: THEORY INTO PRACTICE PAGE 114

129 PROGRAMMING AND EDUCATION COMMITTEE: TOLEDO METROPOLITAN AREA COUNCIL OF GOVERNMENTS The Toledo Metropolitan Area Council of Governments (TMACOG) is a voluntary association of local governments and non-governmental partners in Northwest Ohio and Southeast Michigan. The TMACOG created a Programming and Education Committee to plan, develop, and evaluate the organization s events and programs. The committee plays a lead role in planning and coordinating events such as forums with legislative officials, educational programs, and other events that allow TMACOG members to discuss issues of regional significance. As part of this effort, the committee identifies expert speakers knowledgeable on topics that are of importance to the organization s members. For more information, visit: THEORY INTO PRACTICE PAGE 115
 businesses.")
130 PLASTICS TECHNOLOGY PROGRAM: MID MICHIGAN COMMUNITY COLLEGE Mid Michigan Community College (MMCC) has a specialized program that prepares students for careers in the region s cluster of plastics (forming, fabrication, design) businesses. MMCC offers an associate degree in Plastics Engineering Technology which also transfers to Ferris State University s bachelor s in Plastics Engineering Technology program. In 2012, MMCC received a grant from the National Science Foundation to: 1) formalize an industrial alliance to provide curriculum assistance, career awareness, and workforce experience; 2) develop a non-credit training credential, an academic certificate, and an associate degree with transferability into a bachelor s degree in plastics engineering technology, and 3) recruit students into a laddered program that provides work experience and integrates entrepreneurial instruction into the curriculum. For more information, visit: GRACE PROJECT: EASTERN MICHIGAN UNIVERSITY The GRACE (GIS Resources and Applications for Career Education) Project, is a four-year project sponsored by the National Science Foundation, and developed by Eastern Michigan University to expand technology-based education for STEM careers in K-12, with a focus on GIS/T (Geographic Information Systems and Technology). The ultimate goal of the GRACE Project is to recruit a minimum of 120 teachers and 5,000 students in grades 8-12 to start a three-tiered GIS/T learning process. Tier 1 (the Explorer level) introduces 5,000 students to GIS/T through the ArcGIS Online Portal and through demonstrations designed to build the students basic understanding of GIS/T and to spark student curiosity. Tier 2 (the Investigator level) will prepare 2,500 students to work with GIS/T through a series of lessons focused on science and engineering. Tier 3 (the Intern level) provides of these students with professional GIS/T training and with opportunities to gain work experiences in local organizations as interns. For more information, visit: THEORY INTO PRACTICE PAGE 116
 to administer grants from 50% of the proceeds of a 1% Allegheny County Sales and Use Tax, which is paid by residents and visitors to Allegheny County (the central county of the Pittsburgh metro")


131 PLACE-MAKING & TALENT ATTRACTION INVESTMENTS IN REGIONAL AMENITIES: ALLEGHENY REGIONAL ASSET DISTRICT The Allegheny Regional Asset District was authorized in the Pennsylvania Legislature (Act 77 of 1993) to administer grants from 50% of the proceeds of a 1% Allegheny County Sales and Use Tax, which is paid by residents and visitors to Allegheny County (the central county of the Pittsburgh metro area). Allegheny County receives an additional 25% of the funds, while the remaining 25% goes to other municipal governments. The grants support regional assets throughout the county such as civic, cultural, and recreational entities, libraries, parks and sports facilities. Since 1995, the local 1% sales tax has resulted in a nearly $3 billion investment in the region s public libraries, parks, museums, cultural organizations, major regional facilities, and local municipal services such as the police force and roads. For more information, visit: DOWNTOWN REVITALIZATION: BAY CITY, MI Bay City is the best example of a downtown turnaround in the 8-county region and perhaps the entire State of Michigan. As recently as the 1980s, most of the storefronts in downtown Bay City were vacant and boarded up. Since then, community leaders from the public and private sector worked to attract investments, businesses, and new facilities to re-invigorate the downtown. Today, downtown Bay City is a vibrant, walkable district with an increasing number of residents, businesses, and amenities. Some of the most transformative investments in recent years include the DoubleTree Hotel and events center, the renovated City Hall building, and the Uptown Bay City mixed-use development. Uptown Bay City (which includes new rental and condo housing, new office and medical space, a hotel, restaurants, and shops) is a great example of the type of public-private collaboration needed to achieve success in downtown revitalization. For more information, visit: LOCAL ENTREPRENEURSHIP: COPS & DOUGHNUTS Located in downtown Clare, Cops & Doughnuts is an inspiring example of local entrepreneurship and creativity. The bakery was re-named Cops & Doughnuts in 2009 after the original doughnut shop and bakery (established in 1896) was within weeks of closing and the nine-member Clare Police Department put in $1,500 each to revive the bakery. Since reopening, the bakery and the Cops & Doughnuts brand have gained national media attention thanks to a string of clever marketing moves and product created with self-deprecating humor. Cops & Doughnuts sells merchandise (beyond pastries and food products) in an adjacent store, online, and in substations located in stores across Michigan. For more information, visit: THEORY INTO PRACTICE PAGE 117
 to assist employees with becoming homeowners by matching employees with single-family home properties in Saginaw.")

132 EMPLOYEE HOME PURCHASE PROGRAM: HAUSBECK PICKLE COMPANY Saginaw-based Hausbeck Pickle Company recently launched an innovative pilot program (in partnership with Saginaw Future and the Saginaw County Land Bank) to assist employees with becoming homeowners by matching employees with single-family home properties in Saginaw. The company will make investments to bring the property up to code and will then finance the employee's purchase with a five-to-ten year land contract. The ultimate goal of this initiative is to improve the economic success of employees and enhance the prosperity of Saginaw s neighborhoods. For more information, visit: THEORY INTO PRACTICE PAGE 118
133 APPENDIX E: TABLE OF FIGURES Quantitative, Qualitative, and Strategic Factors Higher Education & Research (Sector Components, Sector Snapshot) Higher Education & Research Employment Trends Higher Education Sector Component Employment Trends Top 20 Occupations in Higher Education & Research Professional Services (Sector Components, Sector Snapshot) Professional Services Employment Trends Professional Services Sector Component Employment Trends Top 20 Occupations in Professional Services Health Care (Sector Components, Sector Snapshot) Healthcare Employment Trends Healthcare Sector Component Employment Trends Top 20 Occupations in Healthcare Advanced Manufacturing (Sector Components, Sector Snapshot) Advanced Manufacturing Employment Trends Advanced Manufacturing Sector Component Employment Trends Top 20 Occupations in Advanced Manufacturing Value-Added Agriculture & Food Processing (Sector Components, Sector Snapshot) Value-Added Agriculture & Food Processing Employment Trends Value-Added Agriculture & Food Processing Sector Component Employment Trends Top 20 Occupations in Value-Added Agriculture & Food Processing Total Annual Population in East Central Michigan, Total Annual Employment in East Central Michigan, Percent Change in Employment by County ( ; ) Geographic Distribution of Jobs in East Central Michigan, Location Quotients of Major Sectors by County, Total Number of Housing Units Permitted by County ( ; ) Total Number of Housing Units Permitted in 8-County Region by Type ( ) Annual Job Change in East Central Michigan by Sector ( ) Annual Farm Employment per 1,000 Residents ( ) Cash Receipts from Crops and Livestock per Capita (2012) Inbound, Outbound, and Internal Commuters in East Central Michigan, Percentage of Workforce in Each County that Lives in East Central Michigan, Percentage of Employed Residents in Each County that Work in East Central Michigan, Number of Employees by Zip Code that Work for Major Employers in East Central Michigan, Net Inflow/Outflow of Workers by Economic Sectors, Local Median Wages Presented in the Context of the National Wage Range, Location Quotient Analysis, Occupational Category Breakdown by Age, Occupational Category Breakdown by Gender, Annual Job Change in East Central Michigan by Occupation ( ) THEORY INTO PRACTICE PAGE 119
134 Current Enrollment Status of Population Age 3 and Older, 2012* Highest Level of Education Achieved by Population Age 25 and Older, 2012* Percent of Adult Population (Age 25 and Older) With No High School Diploma, 2000 & 2012* Percentage Decline in Adult Population without a High School Diploma from 2000 to Percent of Adult Population (Age 25 and Up) With a Bachelor s Degree, 2000 & 2012* Percent Growth in Adult Population with a Bachelor s Degree or Higher from 2000 to Current Unemployment Rate (July 2014) Set Against Historical Range, Percent Change in Population ( ; ) Benchmark Regions & Components Selected Characteristics of Benchmark Regions Cumulative Net Migration, Cumulative Net Migration per Capita, Foreign-Born Residents as a Percentage of Total Population, 2000 & 2012* Annual Housing Permits per 1,000 Residents, & Per Capita Income, 2000 & 2012* Percentage of Population Whose income in Past Year is Below the Poverty Level, 2000 & 2012* Current Unemployment Rate (July 2014) Set Against Historical Range, Percent Change in Labor Force, & Percent Change in Private Business Establishments, & Percent Change in Total Employment, Percent Change in Total Employment, Location Quotients of Major Sectors, Percent Change in Manufacturing Employment, Percent Change in Manufacturing Employment, Percent Change in Professional Services Employment, Percent Change in Professional Services Employment, Percent Change in Health Care Employment, Percent Change in Health Care Employment, Annual Air Travel Passengers at Commercial Airports, Air Travel Passengers per Capita, Current Enrollment Status of Population Age 3 and Older, 2012* Highest Level of Education Achieved by Population Age 25 and Older, 2012* Percentage of Population without a High School Diploma (or Equivalent), 2000 & 2012* Percentage of Population with a Bachelor s Degree or Higher, 2000 & 2012* Total Enrolled College & University Students, Total Enrolled College & University Students per Capita, Total R&D Expenditures at Universities, Total R&D Expenditures at Universities per Capita, Total University R&D Expenditures in Top 10 States, Total University R&D Expenditures per Capita in Top 10 States, Share of State s Total University R&D Investments in Two Largest Research Universities, Economic Dashboard THEORY INTO PRACTICE PAGE 120
135
136
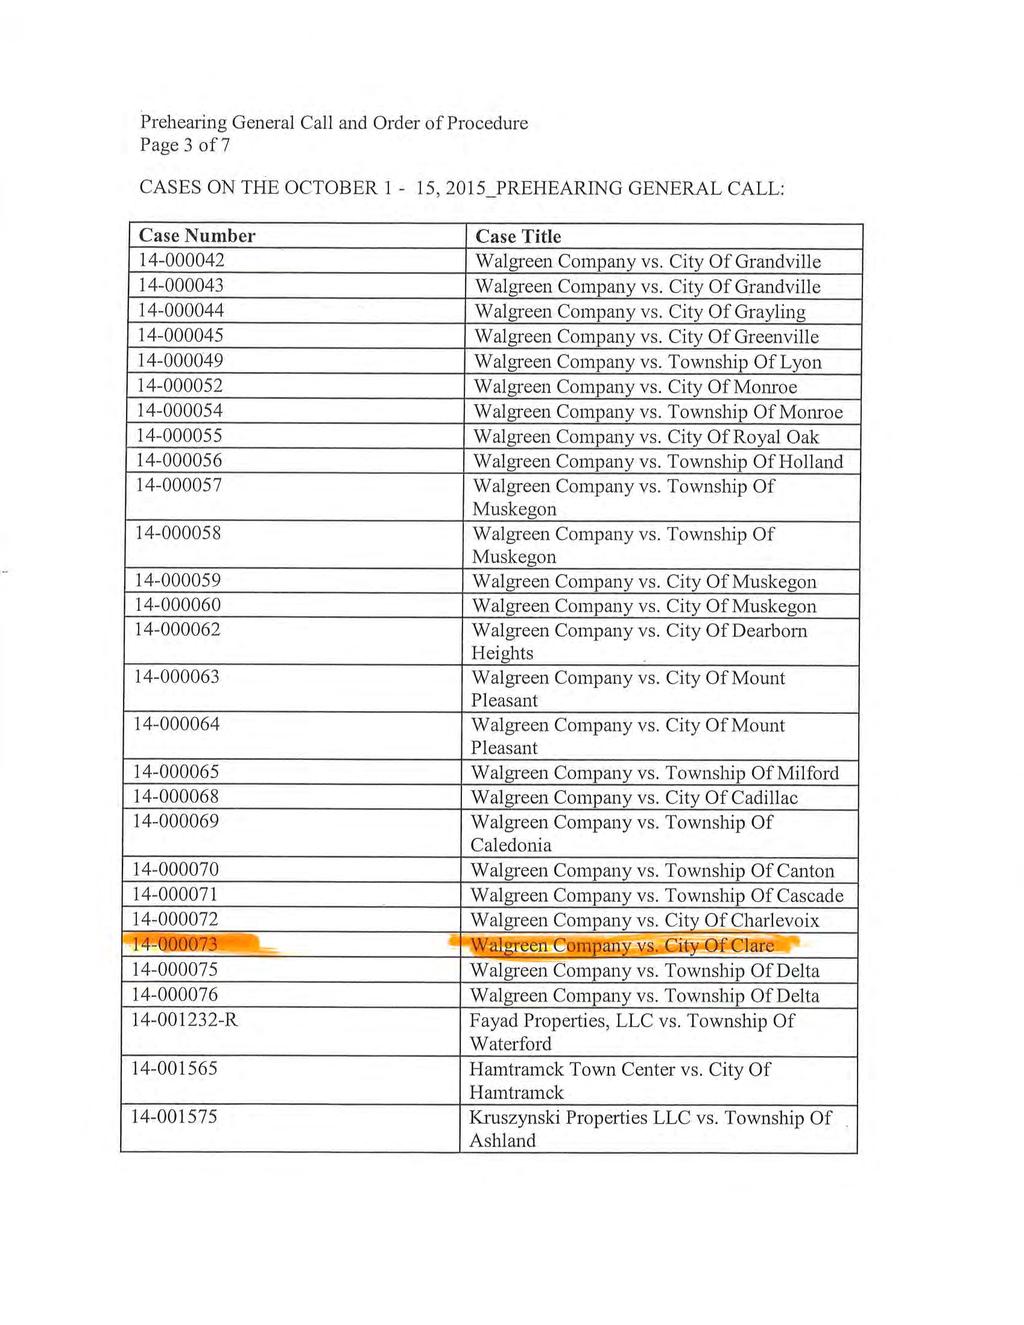
137
Photo Credit: Under Tridge by Aberro Creative via Flickr (CC BY 2.0) REGIONAL PROSPERITY STRATEGY EAST CENTRAL MICHIGAN PROJECT ROLLOUT
 REGIONAL PROSPERITY STRATEGY EAST CENTRAL MICHIGAN PROJECT ROLLOUT") Photo Credit: Under Tridge by Aberro Creative via Flickr (CC BY 2.0) REGIONAL PROSPERITY STRATEGY EAST CENTRAL MICHIGAN PROJECT ROLLOUT TIP STRATEGIES, INC. JEFF MARCELL JOHN KARRAS 17 DECEMBER 2014 AGENDA
Photo Credit: Under Tridge by Aberro Creative via Flickr (CC BY 2.0) REGIONAL PROSPERITY STRATEGY EAST CENTRAL MICHIGAN PROJECT ROLLOUT TIP STRATEGIES, INC. JEFF MARCELL JOHN KARRAS 17 DECEMBER 2014 AGENDA
REGIONAL PROSPERITY STRATEGY A 5-YEAR STRATEGIC PLAN FOR EAST CENTRAL MICHIGAN
 REGIONAL PROSPERITY STRATEGY A 5-YEAR STRATEGIC PLAN FOR EAST CENTRAL MICHIGAN DECEMBER 2014 ACKNOWLEDGEMENTS TIP Strategies would like to thank the many individuals who participated in the creation of
UMBRELLA STRATEGY FOR 2015
 UMBRELLA STRATEGY FOR 2015 Goal 3: Talent and Workforce Development, Strategy 7. Conduct a feasibility study to explore the potential for a center of excellence that leverages the unique capabilities of
East Michigan Council of Governments 3144 Davenport Avenue, Suite 200, Saginaw, MI Phone: , Fax:
 East Michigan Council of Governments 3144 Davenport Avenue, Suite 200, Saginaw, MI. 48602 Phone: 989-797-0800, Fax: 989-797-0896 www.emcog.org Minutes of the ECM PR-5 Strategic Management Team Date, Time
EAST MICHIGAN COUNCIL OF GOVERNMENTS 3144 DAVENPORT AVENUE, SUITE 200, SAGINAW, MI PHONE: , FAX:
 EAST MICHIGAN COUNCIL OF GOVERNMENTS 3144 DAVENPORT AVENUE, SUITE 200, SAGINAW, MI. 48602 PHONE: 989-797-0800, FAX: 989-797-0896 WWW.EMCOG.ORG Minutes of the RPI-5 Strategic Management Team Date, Time
East Michigan Council of Governments 3144 Davenport Avenue, Suite 200, Saginaw, MI Phone: , Fax:
 East Michigan Council of Governments 3144 Davenport Avenue, Suite 200, Saginaw, MI. 48602 Phone: 989-797-0800, Fax: 989-797-0896 www.emcog.org Minutes of the ECM PR-5 Strategic Management Team Date, Time
East Central MI Prosperity Region 5 Vision
 2018 Mini Grant Program ($2,000 - $20,000) The East Central Michigan Prosperity Region 5 Mini-Grant Program for 2018 is being led by the East Michigan Council of Governments (EMCOG). This initiative is
CEDS ADVISORY COMMITTEE SWOT FOUR PRIORITY GOALS WORKFORCE & EDUCATION
 CEDS ADVISORY COMMITTEE SWOT FOUR PRIORITY GOALS WORKFORCE & EDUCATION Large, educated and growing young professional population UNC Charlotte, strong technical institutes and private colleges Strong community
DETAILED STRATEGIC PLAN
 www.dcedc.org DETAILED STRATEGIC PLAN 421 N. California Street Suite 200 Sycamore, IL 60178 [phone] 815.895.2711 [fax] 815.895.8713 MISSION STATEMENT: DCEDC is a public/private partnership working to facilitate
Economic Development Strategic Plan Executive Summary Delta County, CO. Prepared By:
 Economic Development Strategic Plan Executive Summary Delta County, CO Prepared By: 1 Introduction In 2015, Region 10, a 501(c)(3) Economic Development District that services six counties in western Colorado,
Greater Reno-Sparks-Tahoe Economic Development Three-Year Strategic Plan
 Greater Reno-Sparks-Tahoe Economic Development Three-Year Strategic Plan 4.26.12 TABLE OF CONTENTS INTRODUCTION...3 COMMUNITY ASSESSMENT...5 TARGET SECTORS...7 STRATEGIES & METRICS...9 Entrepreneurial
Lakes Region Planning Commission SWOT Analysis & Recommendations
 Lakes Region Planning Commission SWOT Analysis & Recommendations The results of a SWOT survey administered to the CEDS Committee were presented to the Committee in late April, at which time they were discussed
REQUEST FOR PROPOSALS
 REQUEST FOR PROPOSALS This is a Request for Proposals (RFP) from individuals or firms interested in providing professional services on a contract basis for the proposed project described below. Proposals
Economic Development Concept Plan
 Economic Development Concept Plan A. As the lead economic development organization, the Clay County Economic Development Commission (EDC) will enhance Clay County s capacity to engage in economic development
DEKALB COUNTY ECONOMIC DEVELOPMENT VISION FRAMEWORK
 DEKALB COUNTY ECONOMIC DEVELOPMENT VISION FRAMEWORK 2015-2020 August 31, 2016 Diana Robinson 0 INTRODUCTION DeKalb County Thriving! DeKalb County s Economic Development Vision Framework In October 2015,
City of Portsmouth Economic Development Commission 2011 Action Plan
 City of Portsmouth Economic Development Commission 2011 Action Plan Statement of Purpose: The City of Portsmouth Economic Development Commission (EDC) is committed to ensuring continued economic prosperity,
Appendix Tactics and Metrics from State Agencies and Organizations
 Appendix Tactics and Metrics from State Agencies and Organizations Florida s Economic Development Vision: Florida will have the nation s top performing economy and be recognized as the world s best place
The State of Michigan is fast becoming a high-tech. business corridor. We provide premium sites and the
 About the Program The History of Michigan s Certified Business Park Program Economic developers have long recognized the need for uniformity in the use of the term business park. The expression designates
Request for Proposals for Comprehensive Market Analysis & Strategies for Barry County, Michigan
 Request for Proposals for Comprehensive Market Analysis & Strategies for Barry County, Michigan Section One Introduction and Instructions 1.01 Purpose of the RFP This Request for Proposals (RFP) is issued
City of Tacoma Community & Economic Development Department Business Plan: Prosperity on Purpose for the City of Destiny*
 City of Tacoma Community & Economic Development Department Business Plan: Prosperity on Purpose for the City of Destiny* City Vision The City of Tacoma will be recognized as a livable and progressive international
STRATEGIC ACTION PLAN
 EMPOWERED BY THE FUTURE THE CITY OF CEDAR RAPIDS STRATEGIC ACTION PLAN COMPREHENSIVE ECONOMIC DEVELOPMENT STRATEGY PHASE IV AUGUST 4, 2014 Project Scope & History Strategic Recommendations Conclusion Questions
Build New Mexico Four steps to direct and support short-term innovations to build New Mexico s 21st century economy over the next few years
 Build New Mexico Four steps to direct and support short-term innovations to build New Mexico s 21st century economy over the next few years 1. Bring People Together. Provide leadership from day one of
County Commissioners Association of Ohio
 County Commissioners Association of Ohio Lunch and Learn: County Economic Development Essentials February 10, 2015 Mark Barbash Executive Vice President Finance Fund February 10, 2015 Presentation by Mark
May 25, Prosperity and Growth Strategy for Northern Ontario
 May 25, 2017 Prosperity and Growth Strategy for Northern Ontario Content 1. Introduction....3 2. Northern Ontario Overview.... 4 3. Economic Overview..... 5 4. Challenges.....7 5. Opportunities for Growth
Update on HB2 Preparation. Presentation to FAMPO May, 2016
 Update on HB2 Preparation Presentation to FAMPO May, 2016 Preparing for Next Round of HB2 and Next CLRP Positioning GWRC/FAMPO HB2 Projects to maximize project scores Candidate projects need to be in:
GREATER AKRON. bigger. bolder. better Chuck Jones, President, Firstenergy, Chairman of the Board, The Greater Akron Chamber
 Accelerate GREATER Akron. The Greater Akron Chamber, its members, investors and all its strategic partners have accomplished big things. Now we ARE ready to turn the corner with greater energy, into more
Verde Valley Economic Development Strategy. Prepared for VVREO April 6, 2018
 Verde Valley Economic Development Strategy Prepared for VVREO April 6, 2018 How it all came together Working Group Regional Input Market Assessment o o o Questionnaire Stakeholder interviews Economic Development
Where the World is Going
 Where the World is Going Ohio is Smart Vibrant and Growing Ohio offers residents and tourists a low cost of living, four seasons and worldclass educational opportunities, making Ohio your ideal location
Implementation Projects & Initiatives 2013 Strategic Economic Development
 Implementation s & Initiatives 2013 Strategic Economic Development Adopted by the Prince George County Board of Supervisors November 2013 Prepared by Management Analysis, Incorporated BUSINESS ATTRACTION
REGIONAL ECONOMIC DEVELOPMENT FORUMS
 REGIONAL ECONOMIC DEVELOPMENT FORUMS Discussion Summary Central Oregon Region Bend, Oregon Input from economic development organizations, local government, business groups, employers and education leaders
WATERLOO EDC Q1 REPORT
 WATERLOO EDC Q1 REPORT waterlooedc.ca Q1 REPORT SUMMARY Waterloo EDC began 2018 focused on building upon the success and positive momentum of our strong year in 2017 through continuing to focus on bringing
Inventory: Vision and Goal Statements in Existing Statewide Plans 1 Developing Florida s Strategic 5-Year Direction, 29 November 2011
 Inventory: and Goal Statements in Existing Statewide Plans 1 Developing Florida s Strategic 5-Year Direction, 29 November 2011 Florida Department of Economic Opportunity: State of Florida Job Creation
LEVERAGING TRADE AND INVESTMENT TO BUILD A STRONGER ECONOMY
 LEVERAGING TRADE AND INVESTMENT TO BUILD A STRONGER ECONOMY New Mexico must establish itself as a player in the global economy. The current administration s short-sighted approach has put New Mexico far
Business Plan Diversity & Inclusion Forum
 2018 Business Plan 2017 Diversity & Inclusion Forum Action Items and #1 Organizational Value Align operations with member needs 1. Re-evaluate the return on investment computation to quantify and articulate
Economic Development Element
 CHAPTER 6 66.1001(2)(f) Wis. Stat.: Economic Development Element Economic development element: A compilation of objectives, policies, goals, maps and programs to promote the stabilization, retention or
Roanoke Regional Chamber of Commerce 2012 Legislative Policies
 Roanoke Regional Chamber of Commerce 2012 Legislative Policies The Roanoke Regional Chamber works on behalf of its members to create a thriving business climate, strengthen private enterprise, and improve
Dane County Comprehensive Plan Economic Development Goals & Objectives HED Work Group July 7, 2006
 Dane County Comprehensive Plan Economic Development Goals & Objectives HED Work Group July 7, 2006 Section I. Goal 1: Dane County will help to build and promote a robust, sustainable economy that enhances
Economic Development and Employment Element
 Economic Development and Employment Element Element Objectives The policies and actions of the Economic Development and Employment Element are intended to achieve the following nine objectives: 1. Provide
Florida Job Growth Grant Fund Public Infrastructure Grant Proposal
 Florida Job Growth Grant Fund Public Infrastructure Grant Proposal Proposal Instructions: The Florida Job Growth Grant Fund Proposal (this document) must be completed by the governmental entity applying
energy industry chain) CE3 is housed at the
 CE3 is housed at the") ESTABLISHING AN APPALACHIAN REGIONAL ENERGY CLUSTER Dr. Benjamin J. Cross, P.E., Executive in Residence, Ohio University Voinovich School of Leadership and Public Affairs, February 2016 Value Proposition
ESTABLISHING AN APPALACHIAN REGIONAL ENERGY CLUSTER Dr. Benjamin J. Cross, P.E., Executive in Residence, Ohio University Voinovich School of Leadership and Public Affairs, February 2016 Value Proposition
NREL Presentation. Green Talent and Economic Development June 23, 2009
 NREL Presentation Green Talent and Economic Development June 23, 2009 Metro Denver EDC Regional Economic Development Umbrella organization covering 9 county region Driven by a Code of Ethics Research Based
Summary of Focus Groups Lycoming County 2016 Comprehensive Plan Update April May 2016
 Summary of Focus Groups Lycoming County 2016 Comprehensive Plan Update April May 2016 Focus Group Overview As part of the 2016 Comprehensive Plan community outreach strategy, Lycoming County conducted
Chapter 9: Economic Development
 Chapter 9: Economic Development 9.0 Accomplishments Since 2007 As the economic driver for the State, New Castle County continues to review development regulations and offer additional incentives and enhancements
Opportunity Austin 2.0 Midcourse Update Strategy Update Recommendations. J. Mac Holladay, CEO September 13, 2011
 Opportunity Austin 2.0 Midcourse Update Strategy Update Recommendations J. Mac Holladay, CEO September 13, 2011 Current Economic Realities Source: Atlanta Journal Constitution November 4, 2008 Elvis Has
Kenneth E. Poole, PhD. National Conference of State Legislators August 11, 2012
 Kenneth E. Poole, PhD Executive Director President National Conference of State Legislators August 11, 2012 Understanding what makes your economy tick Finding the leverage points with the greatest impact
Michigan s Economic Development Programs
 Michigan s Economic Development Programs Michigan s Economic Development Programs Eric Lupher, President Citizens Research Council of Michigan MAC Regional Summit Battle Creek June 14, 2016 2 Citizens
Ontario s Entrepreneurship Network Strategy Review and Renewal AMO meeting Tuesday, February 19, 2013
 Ontario s Entrepreneurship Network Strategy Review and Renewal AMO meeting Tuesday, February 19, 2013 Context for Action 2 Entrepreneurship and innovation are at the heart of the government s jobs and
The CEDS Action Plan Update for Creek County, Osage County and Tulsa County was adopted by the INCOG EDD Board on February 14, 2008.
 SUMMARY OF UPDATED INCOG EDD ACTION PLAN The CEDS Action Plan Update for Creek County, Osage County and Tulsa County was adopted by the INCOG EDD Board on February 14, 2008. SECTION I - REGIONAL VITALITY
1. INTRODUCTION TO CEDS
 1. INTRODUCTION TO CEDS TABLE OF CONTENTS INTRODUCTION... 1 CEDS STRATEGY COMMITTEE... 2 CEDS COMPONENTS... 2 Community Profiles... 2 Strategic Planning... 2 Bottom up Economic Development Strategies...
First & Main A Blueprint for Prosperity in America s Local Communities
 First & Main A Blueprint for Prosperity in America s Local Communities The corner of First & Main is where everything happens. Whether in a rural area, a tribal community, or a smaller city, First & Main
Final Report - Community Profile & Asset Inventory
 EAST FERRIS Prepared For The Municipality of East Ferris Table of Contents Introduction... 3 Process & Deliverables... 4 Comparative Communities... 5 Thornbury, Ontario...5 Stirling-Rawdon, Ontario...5
Economic Trends and Florida s Competitive Position
 Economic Trends and Florida s Competitive Position presented to Florida Department of Economic Opportunity Small Business Forum presented by John Kaliski Cambridge Systematics, Inc. March 22, 2012 Presentation
Union County Community Improvement Corporation Investment Portfolio
 Union County Community Improvement Corporation Investment Portfolio Our MISSION is to expand the economy of Union County by working together with our local, regional, and state economic development partners
MUNICIPALITY OF TRENT HILLS ECONOMIC DEVELOPMENT STRATEGIC PLAN
 1 MUNICIPALITY OF TRENT HILLS ECONOMIC DEVELOPMENT STRATEGIC PLAN 2010-2013 WWW.TRENTHILLS.CA INTRODUCTION The purpose of this document is to provide a guideline for taking actions that will strengthen
Chisago County, Minnesota
 Chisago County, Minnesota 2 november 2015 Chisago County is home to a population of over 53,000 highly skilled workers, seventy-eight percent of whom travel outside of the county each day for employment.
Presentation to Community Planning and Economic Development Standing Committee July 20th, 2017
 Presentation to Community Planning and Economic Development Standing Committee July 20th, 2017 PROMOTE & MAXIMIZE GROWTH Measurement Baseline 2016/17 Progress Report Grow Halifax's GDP to $22.5 Billion
Stafford County Economic Development FY 2018 Business Plan. February 10, 2017
 Stafford County Economic Development FY 2018 Business Plan February 10, 2017 Recommendations Provided in Stafford County Economic Development Strategic Plan OBJECTIVE DESCRIPTION LEAD TIME FOR IMPLEMENTATION
New Brunswick Information & Communications Technology Sector Strategy
 N E W B R U N S W I C K New Brunswick Information & Communications Technology Sector Strategy alue-added Food 2012-2016 Information and Communications Technology Biosciences Aerospace Biosciences Aerospace
 FLORIDA JOB GROWTH GRANT FUND PINELLAS COUNTY ECONOMIC DEVELOPMENT PROJECT: THE 501 BUILDING RENOVATION LIST OF ATTACHMENTS A. ATTACHMENT A RESPONSES THAT DID NOT FIT IN TEXT BOX B. ATTACHMENT B LETTERS
Innovative and Vital Business City
 Innovative and Vital Business City An Innovative City means promoting Melbourne as a smart, creative and progressive city. Innovation is critical to the continued development and prosperity of the City.
SHASTA EDC BUSINESS PLAN
 SHASTA EDC BUSINESS PLAN 2016-2017 TABLE OF CONTENTS Vision, Mission, Principles & Values 3 Responsibilities & Focus 4 Company Recruitment 5-7 Business Expansion & Retention 8 Entrepreneurial Development
ECONOMIC DIVERSIFICATION HOW COMMUNITY COLLEGES PARTNER WITH ECONOMIC DEVELOPMENT ORGANIZATIONS
 ECONOMIC DIVERSIFICATION HOW COMMUNITY COLLEGES PARTNER WITH ECONOMIC DEVELOPMENT ORGANIZATIONS BY THE INTERNATIONAL ECONOMIC DEVELOPMENT COUNCIL & THE AMERICAN ASSOCIATION OF COMMUNITY COLLEGES November
Horizon Council. Strategic Roadmap
 Horizon Council Strategic Roadmap Horizon Council Strategic Roadmap Table of Contents Executive Summary... 2 Economic Development Overview... 3 Economic Development A Global Economy The Economic Development
City of Ypsilanti Economic Development Action Plan Presented to City Council: June 2014
 City of Ypsilanti Action Plan Presented to City Council: June 2014 The City of Ypsilanti s urban environment, heritage, and culture allow for the unique opportunity to encourage and support sustainable
Prosperity and Growth Strategy for Northern Ontario
 Technology Companies Communities Prosperity and Growth Strategy for Northern Ontario A plan for economic development, inclusiveness and success April 9, 2018 Prosperity and Growth Strategy for Northern
Durham Region Toronto Buffalo. Cleveland Pittsburgh
 HINK IG Québec Ottawa 500 Mile Radius Milwaukee Chicago Detroit Indianapolis Durham Region Toronto Buffalo Cleveland Pittsburgh New York Philadelphia Boston Washington HINK We re growing fast. Come grow
~ Steve Cousins, Refinery Manager, Lion Oil South Arkansas Community College Board Chair
 ~ Steve Cousins, Refinery Manager, Lion Oil Board Chair ~ Dr. Barbara Jones, President Upon completion of the forum, participants will gain an understanding of: o the community college role in business/industry
The ENDOW Regional Assessment. For Business Development and Innovation Zones
 The ENDOW Regional Assessment For Business Development and Innovation Zones 1 Agenda About ENDOW Business development and innovation zones What is the Regional Assessment? How to use the Regional Assessment
BEST PLACE FOR BUSINESS & CAREERS 1. 1st BEST PLACE TO DO BUSINESS 5
 1 CONTENTS Doing Business in Colorado A Diverse Portfolio of Industries Business Funding and Incentives Capital Major Employers, Recent Relocations & Expansions Colorado s Talent & Knowledge Base Life
ECONOMIC DEVELOPMENT STRATEGIC PLAN. Adopted by the Riverbank City Council March 2011
 ECONOMIC DEVELOPMENT STRATEGIC PLAN Adopted by the Riverbank City Council March 2011 INTRODUCTION Economic development is a priority for Riverbank citizens and decision makers alike. The City wishes to
Technical Report 2: Synthesis of Existing Plans
 Technical Report 2: Synthesis of Existing Plans Compiled by the Piedmont Triad Regional Council January, 2013 Triad Tomorrow Figure 1. Piedmont Triad Region CONTEXT The Piedmont Triad region consists of
Case: Building on Economic Assets in Akron, Ohio after the Decline of the Tire Industry 1
 Case: Building on Economic Assets in Akron, Ohio after the Decline of the Tire Industry 1 COMMUNITY PROFILE Once known as the rubber capital of the world, Akron has had to reinvent its economic base and
BUTTE COUNTY REGIONAL ECONOMIC DEVELOPMENT STRATEGY UPDATE
 BUTTE COUNTY REGIONAL ECONOMIC DEVELOPMENT STRATEGY 2017-2020 UPDATE Introduction Local economic development is a process by which public, business, and nongovernmental sector partners work collectively
ECONOMIC DEVELOPMENT STRATEGY
 CITY OF YELLOWKNIFE -2019 ECONOMIC DEVELOPMENT STRATEGY December 2013 Millier Dickinson Blais in association with Impact Economics Photography by Bob Wilson TABLE OF CONTENTS STRATEGY CONTEXT...2 PROJECT
Transforming Brevard County:
 Transforming Brevard County: Our First Year Plan Version 1.00 Brevard County, Florida July 2010 Prepared by Purdue Center for Regional Development. This document Includes content licensed and distributed
The Basics of Economic Development
 The Basics of Economic Development Maury Forman August 19, 2013 Economic Development Activities which promote increased revenues or retain and/or create permanent jobs in the private or public sector within
ANNUAL PERFORMANCE REPORT For the Period April 1st, 2016 March 31st, 2017 PROUDLY SUPPORTED BY
 For the Period April 1 s t, 2016 March 31 s t, 2017 PROUDLY SUPPORTED BY For the Period April 1 st, 2016 to March 31 st, 2017 EXECUTIVE SUMMARY Since 1993, the HBDC (Community Futures Huron) has provided
Economic Development Strategy
 2018-2022 Economic Development Strategy www.oro-medonte.ca/business 2 Fred Hummel - Sculptor Table of Contents Lake Simcoe Regional Airport Executive Summary... Page 5 Economic Development in Oro-Medonte...
South Suburban Economic Growth Initiative Phase 1 Report Executive Summary
 South Suburban Economic Growth Initiative Phase 1 Report Executive Summary June 2017 Cover image source: LB Steel Unless otherwise specified, all photos are by CMAP staff. What and why Neighborhoods do
3/26/2018 ENHANCING THE QUALITY OF LIFE THROUGH NEIGHBORHOOD DEVELOPMENT
 ENHANCING THE QUALITY OF LIFE THROUGH NEIGHBORHOOD DEVELOPMENT VISION Enhance the perception and economic vitality of East Charlotte through sustainable development and public and private collaboration
Weaverville Economic Development Commission
 Weaverville Economic Development Commission Wednesday, 5 December 2012 4.30 p.m. Agenda 1. Call to Order 2. Approval of November 2012 Minutes 3. Welcome & Introductions 4. Certified Entrepreneurial Community
INTERNATIONAL SOFT LANDINGS CENTER AT TECHTOWN
 INTERNATIONAL SOFT LANDINGS CENTER AT TECHTOWN Jan Youtie Summary The International Soft Landings (ISL) Center at TechTown, in partnership with Wayne State University in Detroit, Michigan, provides business
Concept Paper for ANN VISTA Project for FY 2012 Submitted
 Executive Summary Concept Paper for ANN VISTA Project for FY 2012 Submitted 12-11-11 1. Provide a brief description of the proposed project, including the project goal(s) as well as an overview of the
ECONOMIC DEVELOPMENT. Page 2-141
 A ECONOMIC DEVELOPMENT The City of Sacramento recognizes the importance of increasing individual wealth and creating employment opportunities while at the same time generating sufficient revenues for the
ADVANTAGE COASTAL ALABAMA
 ADVANTAGE COASTAL ALABAMA Investing In Our Future Coastal Alabama, blessed with natural beauty and resources that connect the region and the world, must continue to position its strengths, opportunities
South Lake Union Innovation Partnership Zone Strategic Plan
 Attachment E South Lake Union Innovation Partnership Zone Strategic Plan Mission: The South Lake Union Global Health Innovation Partnership Zone works to create economic opportunities by increasing collaboration
LEGISLATIVE AGENDA. North Myrtle Beach Chamber of Commerce State Legislative Agenda PUBLIC POLICY COUNCIL GOAL:
 North Myrtle Beach Chamber of Commerce State Legislative Agenda 2014-2015 LEGISLATIVE AGENDA PUBLIC POLICY COUNCIL GOAL: Our commitment is to be recognized as the business voice in the legislative process,
The Vaughan Advantage
 The Vaughan Advantage An Address by The Hon. Maurizio Bevilacqua, P.C. Mayor, City of Vaughan To the Vaughan Chamber of Commerce February 16, 2011 As I look around the room, I see many of the people who
Get it Done: Rebuild Michigan GRETCHEN WHITMER S PLAN FOR SAFE ROADS, CLEAN WATER, AND A BETTER ECONOMY
 Get it Done: Rebuild Michigan GRETCHEN WHITMER S PLAN FOR SAFE ROADS, CLEAN WATER, AND A BETTER ECONOMY 2 To get ahead, Michiganders need one good job and we need to be able to get to that job. But our
STATEWIDE STRATEGIC PLAN FOR ECONOMIC DEVELOPMENT: RURAL PRIORITY
 STATEWIDE STRATEGIC PLAN FOR ECONOMIC DEVELOPMENT: RURAL PRIORITY 2006 2008 Strategic Plan of Work Enterprise Florida, Inc. 390 North Orange Avenue, Suite 1300 Orlando, Florida 32801 eflorida.com Background
Draft CRA Plan Amendment. Community Redevelopment Agency Advisory Board September 23, CRA Plan Amendment
 Draft Community Redevelopment Agency Advisory Board September 23, 2013 1 Project Scope Feasibility Study Public Workshops/Stakeholder Interviews Market Study 2 Schedule to Date Feasibility Study Community
MEDC Strategic Plan Overview. October 26, 2011
 MEDC Strategic Plan Overview October 26, 2011 Mission The mission of the MEDC is: To market Michigan and provide the tools and environment to drive job creation and investment. 2 Vision The vision of the
Chapter 4: Local Economy and Market Strategies
 Chapter 4: Local Economy and Market Strategies Introduction A strong diversified economy in Midland and the surrounding region is critical to the well being and future success of the city. Midland has
Economic Development Strategy
 2017-2022 Economic Development Strategy Township of Muskoka Lakes Economic Development 1 Bailey Street, Port Carling, Ontario, P0B 1J0 www.muskokalakes.ca economic.development@muskokalakes.ca 705-765-3156
Sublette County Economic Development Master Plan. June 2015
 Sublette County Economic Development Master Plan June 2015 Introduction & Process Sublette County is a great place to live and work Economy boomed with Jonah and Pinedale Anticline oil & gas development
Brampton: Poised for Greatness
 Brampton: Poised for Greatness 2016 Federal Pre-budget Submission The Brampton Board of Trade 36 Queen Street E. Suite #101 Brampton, ON L6V 1A2 905-451-1122 www.bramptonbot.com ABOUT THE BRAMPTON BOARD
Comprehensive Planning Grant. Comprehensive Plan Checklist
 Comprehensive Planning Grant Comprehensive Plan Checklist This form was updated April 2010 Comprehensive Planning Grant Program Department of Administration Division of Intergovernmental Relations 101
Role of Local Government in Economic Development
 Role of Local Government in Economic Development Jonathan Q. Morgan, Ph.D. Joint Select Committee on ED Incentives April 10, 2008 What is the single most important role of local govt.? A. Provide incentives
Economic Prosperity November 19, 2015
 Economic Prosperity November 19, 2015 Welcome Dan Piepszowski Detroit Regional Chamber 2 2 Creating a Talent Ecosystem for Southeast Michigan Lisa Baragar Katz, Executive Director, Workforce Intelligence
Overview of the Community Venue Initiative...1. Vision... 2
 TABLE OF CONTENTS Overview of the Community Venue Initiative...1 Vision... 2 Goal No. 1...3 Assist the development and support of local, small and historically disadvantaged businesses as an important