Economic Development. Community Development. Transportation
|
|
|
- Willis Charles
- 6 years ago
- Views:
Transcription


1 Economic Development Community Development Transportation Southeast Iowa Regional Planning Commission 211 N Gear Avenue, Suite 100 West Burlington, IA 52655


2 Acknowledgements CEDS Steering Committee Dan Wiedemeier, Retired AT&T Melissa Garth, CASE/UAW Don Schmidgall, Hawkeye Group David File, Iowa Wesleyan College Dave George, Two Rivers Bank and Trust Brent Schleisman, City of Mount Pleasant Randy Foor, Louisa Communications Elias Gutierrez, Dona Letty Foods Al Muhlenbruck, Tri Oak Foods Terry Knoke, PSBA Gary Folluo, Lee County Matt Morris, Fort Madison Bank and Trust Sue Frice, Iowa Vocational Rehab Phil Thomas, Southeastern Community College Randy Richards, St. Ambrose University Transportation Subcommittee Jim Davidson, City of Burlington Eric Tysland, City of Burlington Chuck Reighard, New London Schools Rick Mullin, City of Mount Pleasant Bill Richards, PSBA Mike Holtkamp, Holtkamp Farms Bill Small, Wapello State Bank Larry Roehl, Louisa County Engineer Gary Folluo, Lee County Jason Huddle, Iowa DOT District 5 Marc Bechtel, FTA Region VII Tracy Troutner, FHWA IA Division Community Development Subcommittee Brent Schleisman, City of Mount Pleasant Gary Folluo, Lee County Sue Frice, Iowa Vocational Rehab Jim Howell, Howell Farms Justin Bushong, Regional Planner Hans Trousil, City of West Burlington SEIRPC Board of Directors Chris Ball, Louisa County Jim Howel, Louisa County Private Representative Mark Huston, City of Columbus Junction Andy Truitt, City of Wapello Bob Beck, Des Moines County Jim Davidson, City of Burlington Hans Trousil, City of West Burlington Bob Hesler, Des Moines County Private Representative Klay Edwards, Henty County Private Representative Mark Hempen, City of New London Brent Schleisman, City of Mount Pleasant Kent White, Henry County Mike O'Connor, City of Keokuk Byron Smith, City of Fort Madison Gary Folluo, Lee County Steve Bisenius, Lee County Private Representative David File, Iowa Wesleyan College Phil Thomas, Southeastern Community College Sue Frice, Iowa Vocational Rehab Services Economic Development Subcommittee Mike Norris, SEIRPC Executive Director Jason Hutcheson, Greater Burlington Partnership Kiley Miller, Mount Pleasant Area Chamber Alliance Dennis Fraise, Louisa Development Group Dr. Jay Simmons, Iowa Wesleyan College Phil Hecht, Lee County Economic Development Group Beverly Simone and Dr. Michael Ash, Southeastern Community College SEIRPC Staff Mike Norris, Executive Director Jeff Hanan, Assistant Director Zach James, Planning Director Dan Eberhardt, Regional Planner Justin Bushong, Regional Planner Madeline Emmerson, Regional Planner Scott Annis, Planning Intern Ivan Gonzalez, Planning Intern

3 Table of Contents Introduction..1 Understanding Southeast Iowa 3 Grading Southeast Iowa.. 18 Creating our Path. 21 Realizing our Vision Measuring our Progress Funding the Plan 30


4 What is the Great River Region Comprehensive Economic Development Strategies (CEDS)? The Great River Region CEDS is the long range plan for Des Moines, Henry, Lee, and Louisa Counties developed by the Southeast Iowa Regional Planning Commission. It is a regional effort to identify strengths, weaknesses and priorities to move the region forward on shared strategies regarding economic development, community development and transportation. SEIRPC previously maintained a separate regional Comprehensive Economic Development Strategy, Long Range Transportation Plan, Regional Utility Survey, and other work with regional needs. This plan will integrate components from these four areas into one long range plan to meet state and federal requirements (See Appendix A for LRTP and CEDS requirements). While the plan will meet these requirements the plan s purpose and outcomes will go far beyond what is necessary by identifying key strategies to strengthen Southeast Iowa. How YOU created the Great River Region CEDS SEIRPC believes that the key to a successful regional plan is that it must involve input and participation by all of the region s stakeholders including public entities, private companies, citizens, civic and philanthropic organizations, educational institutions, and so on. By reaching out to as many stakeholders as possible, such participation creates a broad sense of ownership in the plan and ongoing devotion to the implementation of the plan. The Great River Region CEDS achieved unprecedented participation through a multipronged outreach approach to garner as much input and consensus as possible. When we say that this plan is your plan and you helped to create it, we mean it literally, as the Great River Region CEDS strategies come directly from our partners planning documents and citizens input. This process started with the formation of the CEDS steering committee that is geographically balanced among the region s four counties and includes participation from the public sector, private sector, education institutions, minority groups, labor groups, and other community leaders. This group helped to set the foundation for the diverse public input process that included public meetings, a region wide online survey, approximately 70 interviews with business and community leaders throughout Southeast Iowa, and the formation of three subcommittees to review and refine the input received. In the end, more stakeholders than ever can say the Great River Region CEDS expresses their thoughts, values, goals, and visions for Southeast Iowa. 1


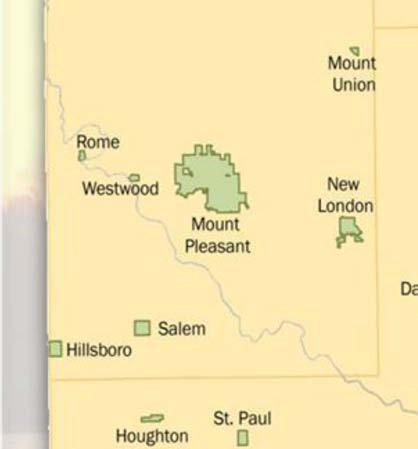
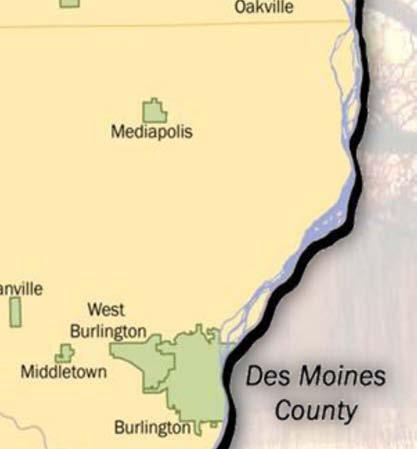
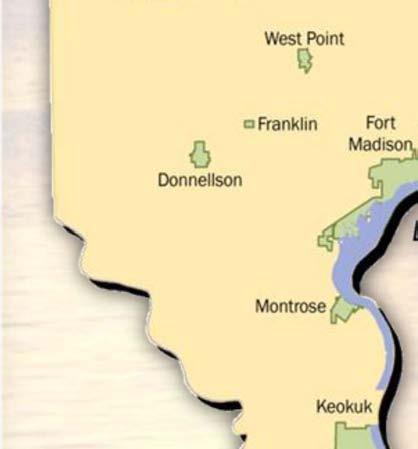


5 The Planning Area 2010 Population - 107,719 Area Source: US Census Bureau 2

6 Understandingding Southeast Iowa Population Trends Key Population Facts Southeast Iowa population has declined 4.6% from 2000 to 2010 The median age of the region is increasing in all counties. Population projections show a loss of population across all counties through % of the region s population is considered urban to 48% of the population that is rural. Density per square mile of population is decreasing throughout the region Regional Populations Des Moines County 42,351 Beaverdale 952 Burlington 25,663 Danville 934 Mediapolis 1,560 Middletown 318 West Burlington 2,968 Henry County 20,336 Hillsboro 180 Mount Pleasant 8,668 Mount Union 107 New London 1,897 Olds 229 Rome 117 Salem 383 Wayland 966 Westwood 112 Winfield 1,134 Lee County 38,052 Denmark 423 Donnellson 912 Fort Madison 11,051 Franklin 143 Houghton 146 Keokuk 10,780 Montrose 898 St. Paul 129 West Point 966 Louisa County 12,183 Columbus City 391 Columbus Junction 1,899 Cotter 48 Fredonia 244 Grandview 556 Letts 384 Morning Sun 836 Oakville 173 Wapello 2,057 Source: US Census Bureau The Southeast Iowa Region population from 2000 to 2010 has declined 4.6% overall. All of the counties experienced a decrease in population since 2000 with Louisa County experiencing the greatest decline at a 6.5%, followed by Lee at 5.8%, Des Moines at 4.8%, and Henry County at 0.9%. The population for Des Moines and Lee County has experienced an overall declining population since 1960, unlike Henry and Louisa County who have both experienced overall growth since Current 2010 populations for all counties and cities in Southeast Iowa can be seen in the chart to the left. Southeast Iowa Population Pyramid 2000 vs Age 85 years and older Age 80 to 84 years Age 75 to 79 years Age 70 to 74 years Age 65 to 69 years Age 60 to 64 years Age 55 to 59 years Age 50 to 54 years Age 45 to 49 years Age 40 to 44 years Age 35 to 39 years Age 30 to 34 years Age 25 to 29 years Age 20 to 24 years Age 15 to 19 years Age 10 to 14 years Age 5 to 9 years Age 0 to 4 years -2,000-1, ,000 2,000 Men 2010 Men 2000 Women 2010 Women 2000 Source: US Census Bureau Looking at the region s population pyramid above, changes by age cohorts can be seen from 2000 to In general, the population has increased in the age groups between 50 and 69 years old, while the population 49 and younger has decreased. This shows an aging population for the Southeast Iowa Region. This is further shown by looking at the regions median age. The region s median age, similar to the state of Iowa, has increased since by nearly six years since Median Age Area Des Moines Henry Lee Louisa Southeast Iowa Region State of Iowa Source: U.S. Census Bureau


7 Percent (%) Percent Urban Population by County Des Moines Lee Henry Louisa Source: US Census Bureau Population per Square Mile Change Des Moines County Henry County Lee County Louisa County Source: U.S. Census Bureau Southeast Iowa region s population is a mix of rural and urban. The U.S. Census defines an urban cluster as a city with over 2,500 population and rural as all cities less than this amount. The region contains five cities that are classified as urban including Keokuk, Fort Madison, Burlington, West Burlington, and Mount Pleasant. These cities represent 52% of the region s population meaning that 48% of the region s population lives in a rural setting. As seen in the chart above left, Des Moines and Lee County are above 50% urban while Henry is below 50%, with Louisa County as a whole considered rural. The decrease in urban population also contributes to the population density per square mile, which is shown decreasing in every county in the region. As seen in the table to the above right, Des Moines and Lee County have seen a decrease in population density of over 4 people per square mile, while Louisa and Henry County have seen a decrease of less than 2 people per square mile. This can be explained with the decreasing population and trend of urban population moving to rural areas. The chart and table show that Des Moines, Lee, and Louisa County are shrinking in urban population while Henry County is staying relatively steady. This shift in where the population lives can have a significant impact on services provided in the region. 50,000 45,000 40,000 35,000 30,000 25,000 20,000 15,000 10,000 5,000 0 County Population Projections Des Moines Lee Henry Louisa Source: US Census Bureau 4 The future of the Southeast Iowa Region will be shaped by the future population of the area. The population projections displayed in chart to the left show a general decline of population for the region. This can be caused by a variety of factors such out migration being greater than regional reproduction rates, or natural decline being greater than in migration and fecundity rates. The downward trend in population will play a role in future economic and community development decisions moving forward.


8 Community Development Trends and Conditions Key Community Development Facts 36% of the regions housing was built before 1939, compared to the 29% for the State of Iowa. Southeast Iowa region s total housing units decreased 1.3% from 2000 to The number of vacant housing units increased 8.4% from 2000 to Lee County is ranked 99 th (last) and Des Moines County is ranked 97 th out of Iowa s counties for health factors. Southeast Iowa Housing % of Housing Stock by Age 1940 to % $1,000,000 or more $500,000 to $999,999 $300,000 to $499,999 $200,000 to $299,999 $150,000 to $199,999 $100,000 to $149,999 $50,000 to $99,999 Less than $50, or earlier 38% 1960 to % Southeast Iowa House Values 2000 or later 4% 1990 to % 1980 to % Source: US Census Bureau The Southeast Iowa region s housing stock is comparatively older than state or national inventories. The age is indicated by the fraction of housing that was built before About 29% of Iowa s and 38% of the Southeast Iowa region s housing stock fit into this category, compared with only 14.5% for the U.S. Another key issue is that Iowa is strongly lagging compared to the nation in the percentages of homes built since the 1980s. Southeast Iowa has only 18% of its housing stock newer than The older housing stock also affects other housing factors such as housing values. The region s housing stock has lower values compared to the State of Iowa as seen in the chart to the left. With older housing units the value will be lower which can explain the large $50,000-$99,999 cohort of housing units. The region s median housing value is $88,275; substantially lower than the state s median house value of $123,400. State 0% 10% 20% 30% 40% Region Percent of Housing Units Source: US Census Bureau County Health Rankings out of Iowa s 99 Counties Des Moines Henry Lee Louisa HEALTH OUTCOMES MORTALITY MORBIDITY HEALTH FACTORS HEALTH BEHAVIORS CLINICAL CARE SOCIAL & ECONOMIC FACTORS PHYSICAL ENVIRONMENT Source: County Health Rankings The health ranking of the Southeast Iowa region fares as some of the worst in the state in health outcomes and health factors. Health outcomes represent how healthy a county is measuring how long people live (mortality) and how healthy people feel while alive (morbidity). Health factors represent what influences the health of a county such as health behaviors, clinical care, social and economic, and physical environment. The table to the left shows that all Southeast Iowa counties are in the bottom half of almost all factors shown. 5


 and two companies (Interstate Power and Light")
9 2010 Housing Occupancy and Vacancy Characteristics Des Moines Henry Lee Louisa Region % Change from 2000 Total Housing Units 18,535 8,280 16,205 5,002 48, % Occupied 17,003 7,666 14,610 4,346 43, % Owner Occupied 12,345 5,645 10,829 3,416 32, % Renter-Occupied 4,658 2,021 3, , % Vacant 1, , , % Homeowner Vacancy Rate 1.9% 1.6% 1.7% 2.0% 1.8% - Rental Vacancy Rate 11.0% 10.1% 11.8% 14.8% 11.5% - Source: U.S. Census Bureau The table above shows housing occupancy and vacancy characteristics from 2010 and the change from 2000 for the entire Southeast Iowa region. The total number of housing units has decreased for the entire region by 1.3% from 2000 to Furthermore, the number of owner occupied homes has decreased while the number of renter-occupied homes has increased. The number of vacant homes and rentals has increased in all the counties except Henry where the number of vacant units actually decreased. These trends are likely caused by the steady decrease in population, the slow housing market towards the end of the decade, and the 2008 flood which removed available units from the region s inventory. Average Electricity Rates Residential: 11.6 cents/kwh Commercial: 9.2 cents/kwh Industrial: 7.6 cents/kwh Source: Public Information Sources Average Tax Levy Rate Des Moines Henry Lee Louisa Region Source: SEIRPC Utility Survey The Southeast Iowa utility and property taxes vary county to county and city to city. The tables above provide a general overview of electricity rates and tax rates in Southeast Iowa. The average tax rate for the region is $ /$1,000, with Des Moines County having the highest property tax rate of $ /$1,000. The regions electricity is provided by four municipal electrical providers (New London, Danville, West Point, and Mount Pleasant) and two companies (Interstate Power and Light Company (Alliant Energy), and REC (Access Energy)). The natural gas for the region is provided by either MidAmerican or Interstate Power and Light Company (Alliant Energy). The average electricity rates vary by use as seen in the table above. Overall the state of Iowa s average cost for electricity is 7.67 cents per Kilowatt/Hour compared to 9.47 cents per Kilowatt/Hour in Southeast Iowa. Water and solid waste rates for the region were surveyed in 2010 by SEIRPC. Based on the 26 entities who responded the average monthly water bill was $32.25 and the average monthly solid waste bill was $

 6 4 2 0 Lee Henry Des Moines Louisa Iowa U.S.")


10 Economic Development Trends and Conditions Key Economic Development Facts Manufacturing and Trade are the largest employment sectors in the region. 15,656 people enter the region to work, but do not live in the region while 14,416 people live in the region, but work outside the area. 33,436 people live and work in the region. Overall the educational attainment in region has improved from 2000 to 2010, but is still lower than the state average. Tourism expenditures in the region have increased from 2009 to 2010 from $ to $ million. 10 Annual Unemployment Rate 8 Rate ( percent) Lee Henry Des Moines Louisa Iowa U.S. Source: US Census Bureau The annual unemployment shown in the chart above highlights the large unemployment increase seen across the U.S. and in the region between and the recovery since this time. This graph shows how historically the region tends to have a higher unemployment rate compared to the state average. As seen in the chart on the bottom left, the region has generally seen decreasing employment growth since the 1980 s, a trend that is concerning as the state employment overall is growing. The chart on the bottom rights highlights specific jobs lost and gained since Jobs gained tends to fluctuate from year to year, however there is a positive trend of jobs lost decreased nearly every year through Southeast Iowa Region Labor Market Changes 20% Employment Growth % 0% % 0 Jobs Gained Jobs Lost Source: US Census Bureau -20% Des Moines County Henry County Lee County Louisa County SEI Average State of Iowa February 2011 Source: US Census Bureau 7


11 The Southeast Iowa region s employment by sector for 2010 is broken down in chart above. This shows that in 2010 the largest employment industry in the region was manufacturing, followed by trade, government, and education/ health services. Business County Employees Great River Medical Center Des Moines Great River Medical Klein Center Des Moines Henniges Automotive Lee Tyson Foods Inc Louisa American Ordnance LLC Des Moines CNH America Des Moines GE Company Des Moines Lance Private Brands Des Moines West Liberty Foods LLC Henry Walmart Distribution Ctr Henry Metro Group Marketing Henry Pinnacle Foods Group Lee Roquette America Inc Lee Source: Iowa Workforce Development Listed to the left are the region s top employers and their locations in With Des Moines County having the largest population they also have the highest concentration of large employers. Tourism to Southeast Iowa has increased from 2009 to 2010 to $ million dollars in expenditures creating a positive economic impact on the area. The region s travel-generated payroll is defined as the wage and salary income paid to employees directly serving the traveler within the industry sectors from which these travelers purchase goods and services. This figure has also increased to $32.18 million in 2010 from Of all the counties in the region Des Moines County has the largest travel expenditures and is ranked 13 th out of the state s 99 counties. Lee County is the second largest expenditures in the region and is ranked 21 st out of the 99 counties. Expenditures (in $ millions) Payroll (in $ millions) Des Moines Henry Lee Louisa Region State 6, , , , Source: State of Iowa Tourism Office 8


12 The map on this page shows the inflow and outflow of workers of the region. U.S. Census estimates 15,656 people enter the region to work each day, but do not live in the region, while 14,416 people live in the region, but work outside the area. 33,436 people live and work in the region. This shows the pull of the region for workers and how it attracts more workers than those who leave the area each day to work. Source: US Census Bureau 9


13 95.0% 90.0% 85.0% 80.0% 75.0% 70.0% Percent High School Graduate or Higher Des Moines County Henry County Lee County Louisa County Soutehast Iowa State of Iowa Source: US Census Bureau The educational attainment of Southeast Iowa region as previously mentioned in the health statistics section is lower than many areas in Iowa. As seen in the chart to the left, the percent of high school graduate or lower is much less than the state average. This number has improved since 2000 in all the counties except Louisa County, but the region still lags behind the rest of the State. 30.0% 25.0% 20.0% 15.0% 10.0% 5.0% 0.0% Des Moines County Percent Bachelor's Degree or Higher Henry County Lee County Louisa County Soutehast Iowa State of Iowa Source: US Census Bureau The percent of bachelor degrees or higher for citizens in Southeast Iowa is shown in the chart to the left. This presents a much greater gap from the state average than those who have graduated high school only. Many people graduate high school in the region, but do not go on to receive a bachelor s degree. Per Capita Income (Dollars) 30,000 25,000 20,000 15,000 10,000 5,000 0 Des Moines County Henry County Lee County Louisa County Soutehast Iowa State of Iowa Source: US Census Bureau The region s average weekly pay is $610 and the mean annual 2010 wage is $34,319. As seen in per capita income chart to the left the region s pay did not increase at the same rate as the state as a whole, but is relatively similar to the state averages. 10


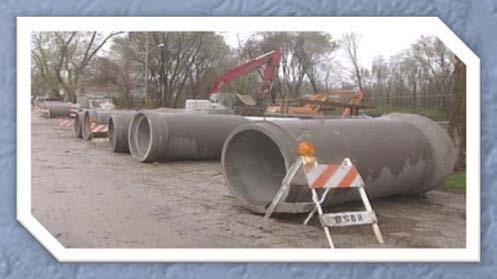
14 Transportation Trends and Conditions Key Transportation Facts The average travel time to work is 18.4 minutes. The Southeast Iowa region has 78.2% of workers driving to work alone 5,061 occupied housing units (12,297 people) in the region have no vehicle access. Amtrak, regional public transit, and commercial air service have seen general increases over the past 5 years. Source: Iowa Department of Transportation Source: Iowa Department of Transportation Source: Iowa Department of Transportation The regional transportation system is made of a series of highways, local roads, airports, barge terminals, railroads, public transit, and trails. The map to the rights highlights the key components of the Southeast Iowa Transportation System. The 3 charts above provide data specific data regarding the size, condition, and safety of the regions roads, bridges, and highways. The entire road network for Southeast Iowa includes just over 4,000 miles of pavement. This system of roadways includes 709 bridges of which over 22% are defective. There have been 8,277 crashes on these roadways between 2007 and 2011 with 74 fatalities. 11
 on roads classified")


15 The map of this page highlights the Average Annual Daily Traffic (AADT) on roads classified as collectors and arterials. The map also highlights where traffic has truck AADT of 25% or greater. As seen by this map, the higher traffic roads are the state and federal highways or major roads in the urban areas. Several of the rural roads have low traffic numbers, but also have greater than 25% truck traffic. This can mostly be attributed to farm operations moving products from the rural areas of the region. Average Annual Daily Traffic Map Source: Iowa Department of Transportation 12


16 Pavement Condition Rating Map The map on this page shows the condition of pavement on all federally classified roads in Southeast Iowa. As seen on the map, the majority of the longer regional routes are in good or excellent condition, with only a few areas that considered average or poor. While the regional routes are in fairly good condition, the routes in the cities tend to be in poor or average condition. The pictures below provide examples of poor, average, good, and excellent pavement condition. Excellent Good Average Source: Center for Transportation Research and Education 13 Poor


17 Environmentally Sensitive Areas The map on this pages highlights areas in Southeast Iowa that are environmentally sensitive, have had environmental review, or archaeological review. Data provided includes locations of known threatened or endangered species, wetlands, and locations of found archaeological sites. These are areas in the region where transportation improvements should receive special consideration and go through careful planning to avoid adverse impacts to sensitive areas and to expedite the environmental review process. Source: Iowa State Archaeologist Office and Iowa Department of Natural Resources 14


18 80.0% 70.0% 60.0% 50.0% 40.0% 30.0% 20.0% 10.0% 0.0% Drove alone, 78.2% Southeast Iowa Means of Travel to Work Carpooled, 12.9% Public transportation, 0.2% Walked, 3.6% Mode Bicycle, 0.4% Taxicab, motorcycle, or other means, 1.0% Worked at home, 3.7% Source: US Census Bureau The chart to the left shows how residents in Southeast Iowa traveled to work. Over 90% traveled by car, with 78% of those trips driving alone. Walking and working at home make up the highest portion of the remainder trips, with each just under 4%. 25.0% 20.0% 15.0% 10.0% 5.0% 0.0% Southeast Iowa Average Travel time to Work The chart to the left shows the average travel time to work. This shows nearly 70% of all travel to work takes approximately 24 minutes or less. This can be accountable to the ease of driving in the region due to an extensive roadway network. 60.0% 50.0% 40.0% 30.0% 20.0% 10.0% 0.0% Southeast Iowa Vehicles Per Housing Unit Occupied housing units Owner-occupied housing units Renter-occupied housing units No vehicle available 1 vehicle available 2 vehicles available 3 or more vehicles available Source: US Census Bureau 15 Source: US Census Bureau The chart to the left shows the number of vehicles owned per housing unit by housing type. This shows that the majority of household have 1 or 2 vehicles per housing unit. Owner occupied housing tends to have 2 or 3 vehicles, while renter occupied units tend to only have 1 vehicle. There is also just over 10% of all housing units that own no vehicle at all.


19 Nationwide Amtrak has seen significant increases in ridership over the pas 10 years. While nationally ridership has increased so much, it has been relatively stable in Southeast Iowa. Ridership with all three stations remaining relatively stable. Commercial air service at the Southeast Iowa Regional Airports has changed significantly since 2000, with several changes in air carriers and destinations. A new carrier started in 2010 that provides flights to Chicago and St. Louis, providing nearly double the ridership as the previous 5 years. Public transit ridership has seen significant increases in ridership. SEIBUS has experienced nearly five times the ridership since BUS has been relatively stable, but has experienced a significant increase e the past few years due to some new opportunities in the community. The chart to the right shows total vehicle miles traveled by county. All counties have decreased besides Henry County, which has steadily increased over time. This shift could be due to decreases in population or people choosing other modes to travel. Miles 20,000 15,000 10,000 5, ,000 15,000 10,000 5, , , ,000 50, , , , , ,000 90,000 Amtrak Ridership Burlington Mount Pleasant Fort Madison Source: Amtrak Commercial Air Service Ridership at Southeast Iowa Regional Airport Southeast Iowa Public Transit Ridership Burlington Urban Service (BUS) Vehicle Miles Traveled Source: Iowa Department of Transportation Southeast Iowa Bus (SEIBUS) Source: Iowa Department of Transportation Lee, 314,788 Des Moines, 309,568 Henry, 228,057 Louisa, 97,865 Source: Iowa Department of Transportation


20 Impact of Trends on Southeast Iowa After analyzing data and associated trends for Southeast Iowa, valuable trends have been identified that will help shape economic development, the transportation system and community development. Selected trends and accompanying analysis include: The elderly population is growing in Southeast Iowa, as the average age has increased from 35 to 41 since The share of residents above 60 years of age is also increasing. This increase in older cohorts will impact the region. The shift will likely create greater needs for community and medical services, affect transportation safety, create needs for alternative transportation, and create new opportunities for economic development. The rural population of most counties is increasing, while urban population is decreasing. Overall, the region is becoming less densely populated. Less density signifies overall population loss. Some impacts may be felt as the population spreads out, such as traveling more on rural highways and accessing retail, medical, work and entertainment facilities differently. Increasing rural population also signifies increased need for basic services like water and sewer. The population of the region is decreasing and is projected to continue along this trend. Policy makers, from local government, to schools, to business leaders should understand this trend and how it affects their organization. Population increases can be sustained, but it will take a combination of in-migration and natural increase. The housing stock in Southeast Iowa is disproportionately older than state or national ages. Aging housing can cause problems for communities including safety, declining values and property tax revenues, and blight. Efforts to encourage reinvestment in older stock will bring the greatest potential returns in property tax increases. Older housing beyond repair should be taken out of the inventory and redeveloped. The Southeast Iowa region holds some of the lowest health ratings in Iowa. It is in the region s best interests to encourage residents and employees to become healthier. The overall workforce, social fabric and culture will all benefit from health improvements. Tourism in Southeast Iowa has increased significantly over the past 5 years. Efforts should continue to attract outside visitors to the area. Tourism facilities also help improve the area s quality of life and keeps the region competitive in attracting residents and businesses to live and work in the area. Revenue is also generated for local government through tourism expenditures, easing the burden on local property taxes. Southeast Iowa has sustained increases in the number of workers with high school diplomas and bachelor s degrees. The region is still well behind the state and U.S. in educational attainment. Producing and retaining more educated workers will benefit the region and make it more competitive. 17


21 Transportation infrastructure is one of the best assets in Southeast Iowa. It allows the unencumbered movement of goods and people throughout the region. Deferred investment into maintenance and replacement will make future work more expensive. The region needs to develop new revenue sources and advocate for new revenues from federal and state levels to address the current and future need. Public transit, Amtrak, and commercial air service usage have gradually increased in the recent past. A diverse transportation system is critical to keeping the region competitive and maintaining its quality of life. Alternative transportation services will need to be robust to deal with the future influx of demand from an aging population. Commercial air service is a boon to Southeast Iowa and keeps its residents and businesses connected with points beyond; all efforts need to be made to keep the service. Overall, Southeast Iowa has opportunities and threats from the analyzed data. The largest threats are an aging population and overall population loss. An aging population and population loss will find its way into the primary planning categories and must be understood for the region to realize its impact on services, business retention and attraction, education, transportation and community development. 17


22 Grading Southeast Iowa Through analysis of data, survey results, interviews, and other public comment we have graded the current conditions of Southeast Iowa by identifying strengths, weaknesses, and priorities. The following pages provide this information for each of the categories of community development, economic development, and transportation. This information was used to identify the key strategies and action items in the next section of the plan. The Strengths Community Development Infrastructure water, sewer, telecommunications/internet Fiber optic starting to become available in SE Iowa Broadband access in rural communities Reliable utilities Excellent water treatment facilities with excess capacity Housing programs available Availability and cost of housing Parks and Recreation, very well kept and many options with a variety of amenities available Mississippi & Iowa Rivers Health Related initiatives (Healthy Henry County, Des Moines County Living Well, etc) Social service agencies such as Hope Haven, Des Moines County Special needs Association, Community Action Land Use planning Elderly services, quality medical care, housing options Youth services, schools Hazard mitigation and disaster recovery, good emergency planning Strong agricultural and natural resources Strong agricultural communities Small town atmosphere and sense of security and community felt throughout all towns Economic Development New jobs are being added Many small businesses in the area The economy of Iowa has been impacted less than other states and larger metropolitan areas Construction and industry are booming Regional draw for retail shopping Businesses incentives available for new industry Regional collaboration with regional partnership Relatively low cost to do business Economic Development departments in the region are actively working towards retaining and attracting businesses and jobs Good loan availability Many available sites Available workforce Educated workforce Opportunities for workforce training at local community colleges Access to good medical facilities 18 Transportation Highways are in good condition Bypass around Fort Madison Four lane highway to Des Moines and Iowa City Cities in the region are well connected via highway Minimal congestion Highway locations of 34 and 218 make it easy to transport and ship goods and products into and out of the region Sidewalk construction Growing trails network Amtrak services Great River Bridge SEIBUS & Burlington Urban Service providing transit needs especially for patients to the hospitals Burlington Trailways Taxi service Mississippi River is a major asset Multiple barge facilities, lock and dam system Rail Transportation main line and short line rail roads Short line spurs to local businesses Regional air service that is affordable Commercial and general aviation availability All forms of transportation are available


 Social services for disabled and veteran assistance programs")


 Lack of intermodal")
23 The Weaknesses Community Development Cost of sewer separation, sewer costs Condition and age of water and sewer systems Lack of internet options, restricts opportunities for work at home employees Broadband capability and availability in rural areas Condition of housing and costs associated with rehabilitation Rental housing condition, affordable quality rental housing needed Lack of low income housing Need more diversity in the housing stock Lack of water recreation amenities, camping, trails and maintain existing areas and include necessary upgrades (restrooms) Social services for disabled and veteran assistance programs Lack of diverse shopping, entertainment, restaurants and social activities Severe lack of land use planning and lack of will to address planning issues and implement sensible solutions. Lack of coordination with neighboring entities and cooperative comprehensive and land use planning Lack of zoning in county areas Lack of zoning enforcement Lack of youth services Economic Development Retention and creation of jobs Quality, high paying jobs are lacking Support for existing businesses Young professionals from the area have to go elsewhere to seek employment Positions requiring skilled workers are unable to find workforce in the region Need to diversify the economy less reliance on manufacturing Retail and manufacturing expansion Relationship of the cities with the developers/code enforcements No continuity or collaboration between the many different economic development groups within the region High cost of taxes, especially commercial taxes Site availability Workforce training Hard to recruit businesses and employees to the area Hard to retain young qualified workers Aging population No regional marketing plan every city and county do their own thing Lack of diversity in the economy 19 Transportation Local road conditions Rural gravel roads Highway 34 east to Illinois not completed as four-lane Highway 61 North to Muscatine not completed as four-lane Farm to market roads and bridges need better maintenance Lack of complete streets Insufficient bike and hiking trails No hiking and walking paths Cascade Bridge Antiquated bridge in Fort Madison No bridge access across the river between Burlington and Muscatine Antiquated lock and dam system Little recreational access and amenities on the river No Amtrak agent in Burlington station Run down train depots with minimal service Reliability and infrastructure for Amtrak services (depots are not staffed) Lack of intermodal transportation Minimal air services provided Bus services not on weekends and no regular schedule


24 The Priorities Community Development Economic Development Improve communications Job creation and retention infrastructure with broadband/fiber, Maintain, support and develop cellular 3g/4g capabilities, and resources needed to keep wireless hot spots present firms and businesses Plan for future water and sewer Aggressively attract new maintenance, replacement, businesses improvement increasing capacities Attracting sustainable to handle future growth businesses Continue affordable housing Encouraging all types of programs, incent new construction businesses including and rehabilitate older homes commercial, office, Improve housing quality manufacturing, technology, Enforce rental ordinances, nuisance etc. regulations to improve the condition Market the region as a whole of rental housing available. to attract businesses Create more downtown, upper story Attract high tech firms such as rental units server farms, IT Communities, Connect the recreation and computer industry, back office communities through biking and tech jobs walking trails Reduce tax rates Improve access and amenities on the Develop regional economic rivers incentives and revenue sharing Create region wide pride in the area Emphasize career and college and communities, establish prep courses in the schools character and foster a hometown Train workforce to fill current feel openings and improve skills Regularly update and follow a region Recruit young college wide comprehensive plan graduates from the region to Encourage infill development return back to the region Foster good communication and Advertising and branding of coordination between entities that the entire area have similar goals and objectives Focus on infill development Broaden activities available for all where infrastructure is in place ages Adequately prepare students Certification and maintenance of all for the workforce and prepare levy s in the region students for jobs in our region. Better watershed management to Create incentives to keep prevent flooding and improve water young people in the area quality Create regional investment Promote agriculture and community fund gardens 20 Transportation Four Lane roads Highway 61 north and Highway 34 east Highway and local road maintenance Highway 92 widening Preserving Highway 61 through Burlington as a high speed corridor Bridges Lock and dam improvements Port authority Utilize the river for commercial and recreational services Boat ramps Levees and flood protection Expanding on air transportation Increasing ridership of public transit to provide additional services in all communities in the region Passenger rail and train depot revitalization Maintain Amtrak services Completion of the Flint River Trail and other trails throughout the region Recreational short and long distance trails Pedestrian and bicycle facilities Complete Streets Promote intermodal transport Aggressively pursue new services for those in need Develop a transportation hub to combine all modes


25 Creating our Path Comments received on each of these three key areas of the plan community development, economic development, and transportation all related back to one theme that represents the vision for the future of the Great River Region. Below is your vision for the future, including key strategies from each of the three elements that will work to achieve this vision. Your Regional Vision "To have the highest Quality of Life in Iowa" Community Development Infrastructure Sustainability Housing Amenities Planning Economic Development Workforce Education Marketing Cooperation Investment Transportation Preservation Livability Mode Choice Safety Freight movement Financial opportunity 21


26 Realizing our Vision Key strategies and action items have been identified for each of the focus areas to help us fulfill the regions vision for the future. These strategies and action items were determined based on the regional trends as shown by data in this plan and from public comments listed in the strengths, weaknesses, and priorities. Action items are color coded to identify projects to begin implementation WITHIN 5 YEARS and those to begin implementation 6 YEARS OR LATER. Economic Development Key Strategies and Action Items Increase regional cooperation in economic development through mutual marketing, fundraising and policy efforts. Create sustainable regional incentive fund of at least $5 million for use in attraction, retention and expansion projects. Improve regional marketing efforts through social media, web, print and trade show formats. Coordinate annual regional public policy priorities through the regional economic development group, the Great River Region Partnership. Develop regional best practices for marketing development sites and encourage shovel ready or certified sites. Improve regional workforce skills and employment through education, training and communication. Identify and enhance existing or develop new communication models among regional businesses, governments and educational institutions. Identify, develop and communicate employment training needs and opportunities. Collaborate with public and private entities in joint workforce planning and development ventures. Increase educational attainment of all residents and workers for high school, baccalaureate and post graduate levels. Grow the regional economy through attraction, retention and entrepreneurial development activities. Increase service capacity of small business and entrepreneurial support assistance, such as Small Business Development Center (SBDC). Develop a venture capital solution for startup and expanding businesses. Maintain and expand available regional loan funds. Pursue regional cluster development opportunities. Pursue funding to improve regional infrastructure, including transportation, sewer, water and broadband. 22


27 Community Development Key Strategies and Action Items Improve the region s quality of life to attract and retain residents and business. Develop new amenities in the region, such as trails, parks, water recreation areas, and natural areas. Improve existing amenities in the region, such as trails, parks, water recreation areas and natural areas. Identify and secure funding for regional recreation and tourism needs Improve regional sewer, water and broadband infrastructure for current and future needs. Secure funding and planning resources for water and sewer projects, including sewer separation. Identify needs for broadband service in the region. Identify broadband resources and partnerships to enable regional broadband access. Biannually update and distribute regional utility analysis. Complete GIS mapping of all regional utilities Work with Iowa Economic Development Authority to create a regional allocation process for Community Development Block Grants (CDBG). Provide quality housing for all income levels. Secure funding and planning resources to improve housing for low to moderate income residents. Work with Great River Housing, Inc. to secure resources and identify needs for low to moderate income housing development, rehabilitation and down payment assistance. Work with Southeast Iowa Housing, Inc., to secure resources and identify needs for low to moderate income housing development and rehabilitation. Work with developers and local governments to provide incentives and structure for new housing development and rehabilitation for all income levels. Improve communication and coordination of plans in the region. Focus on comprehensive planning throughout the region. Provide resources for regional members on land use and zoning policies. Identify planning needs and encourage planning for local governments. Create regional clearinghouse for planning documents accessible to the general public. 23


 and Southeast Iowa Bus (SEIBUS) Develop annual Passenger Transportation Plan to identify regional transit needs and opportunities for")


28 Transportation Key Strategies and Action Items To make Southeast Iowa a better place to travel, live, work, and operate business by offering multiple transportation choices that are safe, accessible, and convenient. Completion of the Flint River Trail Complete study and work on construction of regional trail hub at Lake Geode State Park extending to communities and parks throughout the region Complete designation and construction of Mississippi River Trail through the entire region Work with regional partners to create and implement local trails plans Work to keep and expand commercial air service at Southeast Iowa Regional Airport Work closely with regional airports to assist in implementing master plans Educate regional partners on transportation characteristics of livable communities such as Complete Streets and land use patterns Evaluate the potential for merger of transit systems Burlington Urban Service (BUS) and Southeast Iowa Bus (SEIBUS) Develop annual Passenger Transportation Plan to identify regional transit needs and opportunities for collaboration/efficiency Work with state and federal legislators to keep and expand Amtrak services in Southeast Iowa Work with local entities to create plans for and renovate historic rail depots, specifically Burlington, Fort Madison, Keokuk, and Mount Pleasant Improve regional transportation system to make it a safe place to travel for all users Create a regional traffic safety study Education regional partners on current best practices for transportation safety Work with regional partners and Iowa DOT to implement safety improvements in locations where improvements are most needed Identify and secure funding sources to implement needed safety improvements 24
 that are needed to assist existing businesses and support future businesses")


29 Transportation Key Strategies and Action Items Preserve, improve, and expand the regional transportation system for the efficient movement of goods and services. Create a regional freight study to identify specific transportation improvements (rail, barge, and roadway, intermodal) that are needed to assist existing businesses and support future businesses Work closely with Iowa DOT and the Highway 61 Coalition to complete Coalition priorities Work closely with Highway 34 Coalition and Illinois DOT to upgrade US Highway 34 to four lanes from Burlington to Monmouth Work with the Southeast Iowa Regional Economic Development and Port Authority to develop a port site and foreign trade zone Work with the City of Fort Madison and the City of Keokuk to identify ways to upgrade, improve, or replace rail bridges over Mississippi river Meet with state legislators, federal legislators, Army Corps of Engineers, etc. to discuss how to improve the lock and dam system, dredging the Mississippi River, and upgrading the levy system where needed Evaluate regional airports and businesses to identify opportunities for improved air freight traffic. Preserve existing transportation infrastructure and maintain the system Educate regional partners on current best practices for transportation preservation Create a plan for replacement of bridges that are functionally obsolete or structurally deficient Work with local communities to develop capital improvement plans to help maximize minimal transportation dollars Work with regional communities to develop a process for considering all components of transportation projects such as: pedestrian and bicycle improvements, storm water improvements, replacement of curb and gutter, reducing roadway width, options for restriping, lighting, landscaping Identify and secure funding sources to implement preservation projects Encourage regional partners to focus on preserving, replacing, or upgrading existing infrastructure before building completely new transportation infrastructure Maximize the use of available financial resources and identify new opportunities for funding transportation improvements. SEIRPC will work with local governments and agencies to pursue eligible federal, state, and local funding sources as well as new funding sources that arise Work with state and federal legislators to increase existing or establish alternative funding mechanisms for all transportation infrastructure and services Work with state and federal legislators to pass a stable, long range transportation bill that will provide adequate programs and funding for rural areas Educate regional agencies on all transportation funding opportunities that are currently available 25


30 5 Year Regional Transportation Plan The Southeast Iowa Regional Planning Commission annually prepares the Region 16 Transportation Improvement Program (TIP). The TIP has been developed by incorporating all city, county, and state transportation projects of regional significance expected to receive federal-aid funding. As part of the TIP development process, SEIRPC receives an annual allocation of federal Surface Transportation Program (STP) and Transportation Alternative Program (TAP) funding to be distributed to counties and communities in the Region 16 planning area. The Region 16 Technical Advisory Committee (TAC) reviews, prioritizes, and recommends projects for STP and TAP funding to the SEIRPC Board of Directors. Final approval of projects for inclusion into the TIP is the sole responsibility of the SEIRPC Board of Directors. The TIP is fiscally constrained by adjusting the region s recommended projects to match best the estimated target of available federal STP and TAP funds. Below is a detailed list of expected projects to be completed over the next 5 years utilizing regional STP and TAP funding. Regional STP Funding Sponsor Project Description Local Funding Federal Aid Total Cost Des Moines County 210th Street Reconstruction from US Highway 61 to Iowa City $ Road 428,000 $ 1,200,000 $ 1,628,000 Fort Madison Avenue E Reconstruction from 15th Street to 18th Street $ 149,000 $ 597,000 $ 746,000 Mount Pleasant Grand Avenue Rehabilitation from James Avenue to BNSF Rail $ Bridge 2,022,000 $ 608,000 $ 2,630,000 Lee County County Road J-38 Resurfacing from Highway 218 to Highway 16 $ 290,000 $ 500,000 $ 790,000 Lee County County Road J72 Resurfacing from Highway 218 to 180th Ave $ 315,000 $ 600,000 $ 915,000 Mount Pleasant Iris Street Reconstruction from Washington St to Winfield Ave $ 251,000 $ 1,003,000 $ 1,254,000 Burlington Division Street Resurfacing from Central Avenue to S 6th Street $ and Leebrick Street to Marshall Street 99,000 $ 396,000 $ 495,000 Des Moines County Mediapolis Road and County Highway 99 Resurfacing from $ Mediapolis ECL to Meekers Landing Road 2,432,000 $ 1,768,000 $ 4,200,000 Fort Madison Avenue E Reconstruction from 22nd to 24th $ 103,000 $ 411,000 $ 514,000 West Point Avenue D Reconstruction from 4th Street to 7th Street $ 212,000 $ 475,000 $ 687,000 Fort Madison Avenue E Reconstruction from 18th to 20th $ 86,000 $ 345,000 $ 431,000 Henry County H38 Avenue Resurfacing From Grand Ave to Racine Ave $ 1,526,000 $ 1,400,000 $ 2,926,000 Lee County 243rd Avenue Resurfacing from US61/218 S 4.3 MI $ 315,000 $ 1,120,000 $ 1,435,000 Mount Pleasant Regional TAP Funding Maple Leaf Drive Reconstruction from Lincoln Street to Iris $ Street 341,000 $ 994,000 $ 1,335,000 5 Year Project Totals $ 8,569,000 $ 11,417,000 $ 19,986,000 Estimated STP Funding next 5 Years $ 10,145,989 Current Regional STP Funding Balance $ 3,073,357 Anticipated Regional STP Balance after 5 Years $ 1,802,346 Sponsor Project Description Local Funding Federal Aid Total Cost Burlington Flint River Trail City Phase III $ 24,000 $ 99,000 $ 123,000 Des Moines County Flint River Trail County Phases II & III $ 67,000 $ 268,000 $ 335,000 Des Moines County Flint River Trail County Phase I $ 145,000 $ 591,000 $ 736,000 Burlington Flint River Trail City Phase I $ 75,000 $ 303,000 $ 378,000 5 Year Project Totals $ 311,000 $ 1,261,000 $ 1,572,000 Estimated TAP Funding next 5 Years $ 1,057,691 Current Regional TAP Funding Balance $ 368,700 Anticipated Regional TAP Balance after 5 Years $ 165,391 26


31 Measuring our Progress To gauge how successful we are in reaching the vision, performance measures have been identified to determine the impact of implemented key strategies and action items. This will be done by conducting an annual review with our CEDS committee to review progress. This review will include an annual report that will have information from an annual survey completed by our regional partners and collecting specific data. Below is a list of specific performance measures that will be completed as part of the annual report process. The data collected in the first year will be used as a baseline to review progress in the following years. Economic Development Performance Measures Improve regional workforce skills and employment through education, training and communication. Number of communicaitons with employers about events, trainings, etc. Number of job trainings held Educational attainment levels Economic Development subcommittee will submit a letter grade with accompanying detail Grow the regional economy through attraction, retention and entrepreneurial development activities. Track SBDC budget level and businesses helped annually. Track RLF loans made and available capital base annually. Number of jobs created and retained in the region Number and types of investments undertaken in the region Amount of private sector investment in region Economic Development subcommittee will submit a letter grade with accompanying detail. Increase regional cooperation in economic development through mutual marketing, fundraising and policy efforts. Number of policy efforts attempted and implemented Amount of funding spent and shared on regional marketing Number of marketing efforts Number of fundraisers held Amount of fundraising secured Economic Development subcommittee will submit a letter grade with accompanying detail. 27


32 Community Development Performance Measures Improve regional sewer, water and broadband infrastructure for current and future needs. Amount of broadband available in the region Status of regional CDBG funding Number and types of investments undertaken in the region for sewer, water, and broadband Completion of Regional Utility Analysis Status of utility mapping Improve the region s quality of life to attract and retain residents and business. Funding secured for recreational needs Number of improvements to existing parks, trails, and natural areas Number of new parks, trails, and recreation areas Amount of tourism expenditures County health rankings Provide quality housing for all income levels. Improve communication and coordination of plans in the region. Number of new housing units for low to moderate income residents Number of new housing starts Number of improvements funded by Great River Housing, Inc. Amount of funding secuted for housing improvements Number and types of investments undertaken in the region for housing Number of Comprehensive Plans in place Number of comprehensive plan updates completed Number of education efforts on planning related topics Number of planning documents available in regional clearinghouse 28


33 Transportation Performance Measures Preserve the existing transportation infrastructure to maintain system. Completion of bridge replacement plan Number of functionally obsolete or structurally deficient bridges Completion of local capital improvement plans Amount of funding secured Amount of new infrastructure built vs. preservation of existing Number of education efforts on best practices and new techniques To make Southeast Iowa a better place to travel, live, work, and operate business by offering multiple transportation choices that are safe, accessible, and convenient. Miles of off road trails/sidewalks and on road bicycle facilities Amount of funding secured for trails, transit, depots, airports, and rail Number of education efforts Number of studies completed Number of improvements for trails, transit, depots, airports, and rail Preserve, improve, and expand the regional transportation system for the efficient movement of goods and services. Amount of funding secured for freight related projects Completion of regional freight study Number of freight movements by mode Number of freight improvements completed by mode Number of locations of traffic congestion Improve regional transportation system to make it a safe place to travel for all users. Completion of safety study Number of education efforts Crash rates, including fatalities per VMT and serious injuries per VMT Number of serious injuries and fatalities Amount of funding secured for safety improvements Number of safety projects implemented Maximize the use of available financial resources and identify new opportunities for funding transportation improvements. Amount of grant funding secured for the region Number of meetings with state and federal legislators Number of education efforts attempted 29


 Vision Iowa Neighborhood Stabilization Program (NSP) HOME Funds State Revolving Fund (SRF) Resource Enhancement and Protection (REAP) Iowa")
 Private Foundations Local Option Sales Tax (LOST) Property Tax Other Local Sources Economic Development Revolving")
 Local Option Sales Tax (LOST) Tax Increment Financing Tax Abatement or Exemption Enterprise Zones Property Tax Other Local")

 County and City Bridge Fund Revitalize Iowa Sound Economy (RISE) Rail Revolving Loan and Grant Program State and Federal Air")
34 Funding the Plan A key component in the implementation of this plan is making sure funding is in place to support community development, economic development, and transportation projects. To fund these efforts a variety of local, state, and federal funding will be critical. Below is a list of the most notable current funding resources available related to community development, economic development, and transportation projects. Community Development Community Development Block Grant Program Community Attraction and Tourism (CAT) Great River Housing Trust Fund Federal Home Loan Bank (FHLB) Vision Iowa Neighborhood Stabilization Program (NSP) HOME Funds State Revolving Fund (SRF) Resource Enhancement and Protection (REAP) Iowa Brownfields Program (Tax Credits) Iowa Grayfields Program (Tax Credits) Watershed Planning and Implementation Grants Land Water and Conservation Fund Solid Waste Alternatives Program (SWAP) Private Foundations Local Option Sales Tax (LOST) Property Tax Other Local Sources Economic Development Revolving Loan Funds EDA Public Works and Economic Adjustment Assistance Program EDA Planning and Technical Assistance Program SBA Loans USDA Rural Business Opportunity Grant (RBOG) Local Option Sales Tax (LOST) Tax Increment Financing Tax Abatement or Exemption Enterprise Zones Property Tax Other Local Resources Iowa Small Business Loan Transportation Surface Transportation Program National Highway Performance Program Transportation Alternatives Highway Safety Improvement Program Congestion Mitigation and Air Quality Projects of National and Regional Significance Federal Transit Administration , and 5311 Job Access Reverse Commute (JARC) Transportation Safety Improvement Program (TSIP) Small Town Sign Replacement Program Traffic Engineering Assistance Program (TEAP) County and City Bridge Fund Revitalize Iowa Sound Economy (RISE) Rail Revolving Loan and Grant Program State and Federal Air Improvement Program Airport Vertical Infrastructure Program Iowa DOT/DNR Fund Living Roadway Trust Fund Iowa Road Use Tax Fund (RUTF) Local Option Sales Tax (LOST) Property Tax Other Local Resources 30

 and Transportation Enhancement funding distributed through SEIRPC Local,")


35 Transportation Funding Outlook While difficult to predict future revenues and expenditures in all of these areas, some general forecasting can be made for transportation funding due to past history of funding and annual funding allocation provided to the region. This will provide some clarity on the proposed projects and strategies and their feasibility over the next 20 to 30 years. The financial outlook used a simple process of evaluating current and past federal aid and non federal aid for transportation funding in Southeast Iowa including: State Road Use tax revenues to cities and counties Farm to Market and Secondary Road Fund revenues to counties Federal Surface Transportation Program (STP) and Transportation Enhancement funding distributed through SEIRPC Local, State, and Federal transit revenues for SEIBUS and BUS Estimated grant program funding A base year was used for 2012, with a three percent annual average increase applied to each of the different elements listed above. The chart below summarizes the forecast from As seen in the tables, there is an expected deficit of just under $40,000,000, showing the need for additional transportation revenue in the future. Transportation Revenues FY2013 to FY2040 City Road Use Tax Fund Forecasted Revenues $ 328,557,901 County Farm to Market and Secondary Road Fund Forecasted Revenues $ 773,987,855 Transportation Enhancement (TE) Forecasted Revenues $ 10,024,634 Surface Transportation Program (STP) Forecasted Revenues $ 121,378,710 SEIBUS and BUS Forecasted Revenues $ 78,183,880 Total Forecasted Transportation Revenues FY2013 FY2040 $ 1,312,132,980 Transportation Expenditures FY2013 to FY2040 City Forecasted Operations and Maintenance Expenditures $ 356,100,932 County Forecasted Operations and Maintenance Expenditures $ 780,793,335 Transportation Enhancement (TE) Forecasted Expenditures $ 10,024,634 Surface Transportation Program (STP) Forecasted Expenditures $ 121,378,710 SEIBUS and BUS Forecasted Expenditures $ 82,099,950 Total Forecasted Transportation Expenditures FY2013 FY2040 $ 1,350,397,561 Transportation Fiscal Outlook FY2013 to FY2040 City Forecasted Operations and Maintenance Deficit $ (27,543,030) County Forecasted Operations and Maintenance Deficit $ (6,805,480) Transportation Enhancement (TE) Forecasted Deficit $ - Surface Transportation Program (STP) Forecasted Deficit $ - SEIBUS and BUS Forecasted Deficit $ (3,916,071) Total Forecasted Transportation Funding Deficit FY2013 FY2040 $ (38,264,581) 31
Economic Development. Community Development. Transportation
 Economic Development Community Development Transportation Southeast Iowa Regional Planning Commission 211 N Gear Avenue, Suite 100 West Burlington, IA 52655 Table of Contents Introduction..1 Understanding
Final Draft Region 16 Transportation Planning Work Program Current Update: May 15 th, 2014 Last Updated: May 23 rd, 2013
 Final Draft Region 16 Transportation Planning Work Program Current Update: May 15 th, 2014 Last Updated: May 23 rd, 2013 Prepared By: Southeast Iowa Regional Planning Commission 211 N Gear Avenue, Suite
Southeast Iowa Regional Planning Commission FY2011 Annual Report
 Southeast Iowa Regional Planning Commission FY2011 Annual Report Dear Citizens of the Southeast Iowa Region, The Southeast Iowa Regional Planning Commission recently completed its 38 th year of service
Flint River Trail Receives $423,000 from Federal Recreational Trails Program
 Flint River Trail Receives $423,000 from Federal Recreational Trails Program The Flint River Trail, a cooperative effort between the City of Burlington and Des Moines County, has received $423,000 from
Summary of Focus Groups Lycoming County 2016 Comprehensive Plan Update April May 2016
 Summary of Focus Groups Lycoming County 2016 Comprehensive Plan Update April May 2016 Focus Group Overview As part of the 2016 Comprehensive Plan community outreach strategy, Lycoming County conducted
Economic Development Strategic Plan Executive Summary Delta County, CO. Prepared By:
 Economic Development Strategic Plan Executive Summary Delta County, CO Prepared By: 1 Introduction In 2015, Region 10, a 501(c)(3) Economic Development District that services six counties in western Colorado,
Comprehensive Planning Grant. Comprehensive Plan Checklist
 Comprehensive Planning Grant Comprehensive Plan Checklist This form was updated April 2010 Comprehensive Planning Grant Program Department of Administration Division of Intergovernmental Relations 101
Economic Development Element
 CHAPTER 6 66.1001(2)(f) Wis. Stat.: Economic Development Element Economic development element: A compilation of objectives, policies, goals, maps and programs to promote the stabilization, retention or
Technical Report 2: Synthesis of Existing Plans
 Technical Report 2: Synthesis of Existing Plans Compiled by the Piedmont Triad Regional Council January, 2013 Triad Tomorrow Figure 1. Piedmont Triad Region CONTEXT The Piedmont Triad region consists of
Chapter 9: Economic Development
 Chapter 9: Economic Development 9.0 Accomplishments Since 2007 As the economic driver for the State, New Castle County continues to review development regulations and offer additional incentives and enhancements
Economic Development and Employment Element
 Economic Development and Employment Element Element Objectives The policies and actions of the Economic Development and Employment Element are intended to achieve the following nine objectives: 1. Provide
Appendix 5 Freight Funding Programs
 5. Chapter Heading Appendix 5 Freight Programs Table of Contents 4.1 Surface Transportation Block Grant (STBG);... 5-1 4.2 Transportation Investment Generating Economic Recovery Discretionary Grant Program
Chapter 5 Planning for a Diversified Economy 5 1
 Chapter 5 Planning for a Diversified Economy Introduction The Planning for a Diversified Economy chapter will identify existing job opportunities in Prescott, strengths for attracting or retaining businesses
The Loop Media Hub. Gigabit Economic Development Impact Statement. Prepared for: The Loop Media Hub Feasability Study. June 27, 2012.
 Sandel & Associates The Loop Media Hub Gigabit Economic Development Impact Statement Prepared for: The Loop Media Hub Feasability Study June 27, 2012 Prepared by: Special Advisor Pat McKeehan 6900 Delmar
NC General Statutes - Chapter 136 Article 19 1
 Article 19. Congestion Relief and Intermodal 21 st Century Transportation Fund. 136-250. Congestion Relief and Intermodal Transportation 21 st Century Fund. There is established in the State treasury the
Distinctly Boerne! Boerne Master Plan ( ) JOINT MEETING OVERVIEW & PRIORITIZATION
 JOINT MEETING OVERVIEW & PRIORITIZATION") Distinctly Boerne! Boerne Master Plan (2018-2028) JOINT MEETING OVERVIEW & PRIORITIZATION Halff Staff Matt Bucchin, AICP, LEED-GA Director of Planning Josh Donaldson, AICP Planner / Landscape Designer
Distinctly Boerne! Boerne Master Plan (2018-2028) JOINT MEETING OVERVIEW & PRIORITIZATION Halff Staff Matt Bucchin, AICP, LEED-GA Director of Planning Josh Donaldson, AICP Planner / Landscape Designer
STATE AND REGIONAL DEVELOPMENT STRATEGY East Central Region BACKGROUND THE REGION
 BACKGROUND STATE AND REGIONAL DEVELOPMENT STRATEGY East Central Region Since 1999, the Illinois Department of Commerce and Economic Opportunity (formerly The Illinois Department of Commerce and Community
Funding the plan. STBG - This program is designed to address specific issues
 Iowa DNR Solid Waste Alternatives Program USDA Rural Development Solid Waste Grants Hazard Mitigation Grant Program (HMGP) Pre-Disaster Mitigation (PDM) Flood Mitigation Assistance (FMA) Water Quality
2018 Regional Project Evaluation Criteria For PSRC s FHWA Funds
 2018 Regional Project Evaluation Criteria For PSRC s FHWA Funds INTRODUCTION As described in the adopted 2018 Policy Framework for PSRC s Federal Funds, the policy focus for the 2018 project selection
Update on HB2 Preparation. Presentation to FAMPO May, 2016
 Update on HB2 Preparation Presentation to FAMPO May, 2016 Preparing for Next Round of HB2 and Next CLRP Positioning GWRC/FAMPO HB2 Projects to maximize project scores Candidate projects need to be in:
+! % / 0/ 1 2, 2 2, 3 1 ",, 4 +! % # ! 2, $
 Lakeland Vision is an independent, non-profit organization. It was formed in 1998 with the goal of creating and implementing a comprehensive, action-oriented vision for the future of the greater Lakeland
FUNDING SOURCES. Appendix I. Funding Sources
 Appendix I. Funding Sources FUNDING SOURCES planning and related efforts can be funded through a variety of local, state, and federal sources. However, these revenues have many guidelines in terms of how
Building our future, together. Steering Committee Presentation for the Comprehensive Plan Update November 12, 2013
 Building our future, together Steering Committee Presentation for the Comprehensive Plan Update November 12, 2013 Introduction Welcome: Mayor Barbara Bass Prayer Business and Economy Update Susan Guthrie,
CEDS ADVISORY COMMITTEE SWOT FOUR PRIORITY GOALS WORKFORCE & EDUCATION
 CEDS ADVISORY COMMITTEE SWOT FOUR PRIORITY GOALS WORKFORCE & EDUCATION Large, educated and growing young professional population UNC Charlotte, strong technical institutes and private colleges Strong community
City of Nampa Strategic Plan. Adopted December 19, 2011
 City of Nampa Strategic Plan Adopted December 19, 2011 Content City leadership used a planning tool known as a Strengths Weaknesses Opportunities & Threats (SWOT) Analysis to assess City Government conditions,
Appendix E Federal and State Funding Categories
 Appendix E Federal and State Funding Categories This page left blank intentionally. Federal and State Funding Categories Appendix E E 3 Appendix E Federal and State Funding Categories Highway Programs
County Commissioners Association of Ohio
 County Commissioners Association of Ohio Lunch and Learn: County Economic Development Essentials February 10, 2015 Mark Barbash Executive Vice President Finance Fund February 10, 2015 Presentation by Mark
Title VI: Public Participation Plan
 Whatcom Council of Governments Public Participation Plan Adopted October 14, 2009 Updated November 12, 2014 Whatcom Council of Governments 314 East Champion Street Bellingham, WA 98225 (360) 676 6974 Whatcom
City of Portsmouth Economic Development Commission 2011 Action Plan
 City of Portsmouth Economic Development Commission 2011 Action Plan Statement of Purpose: The City of Portsmouth Economic Development Commission (EDC) is committed to ensuring continued economic prosperity,
Future Trends & Themes Summary. Presented to Executive Steering Committee: April 12, 2017
 Future Trends & Themes Summary Presented to Executive Steering Committee: April 12, 2017 Vision Workshop Regional/Local Themes The region and the Prince William area share the following key themes: Future
KEY TAKEAWAYS THE STIMULUS BREAKDOWN
 S T I M U L U S F O R G R E A T E R P H I L A D E L P H I A : W H A T I T M E A N S F O R T R A N S P O R T A T I O N I N V E S T M E N T I N T H E R E G I O N KEY TAKEAWAYS Greater Philadelphia will likely
Roanoke Regional Chamber of Commerce 2012 Legislative Policies
 Roanoke Regional Chamber of Commerce 2012 Legislative Policies The Roanoke Regional Chamber works on behalf of its members to create a thriving business climate, strengthen private enterprise, and improve
REQUEST FOR PROPOSALS
 REQUEST FOR PROPOSALS Downtown Triangle Redevelopment 1 st Street North, East Jackson Street, and Market Street City of Wisconsin Rapids 444 West Grand Avenue, Wisconsin Rapids, WI 54495 February 2017
Appendix Tactics and Metrics from State Agencies and Organizations
 Appendix Tactics and Metrics from State Agencies and Organizations Florida s Economic Development Vision: Florida will have the nation s top performing economy and be recognized as the world s best place
First & Main A Blueprint for Prosperity in America s Local Communities
 First & Main A Blueprint for Prosperity in America s Local Communities The corner of First & Main is where everything happens. Whether in a rural area, a tribal community, or a smaller city, First & Main
Transportation Demand Management Workshop Region of Peel. Stuart M. Anderson David Ungemah Joddie Gray July 11, 2003
 Transportation Demand Management Workshop Region of Peel Stuart M. Anderson David Ungemah Joddie Gray July 11, 2003 Why Transportation Demand Management (TDM)? Demand management measures support a sustainable
Economic Development Element of the Arroyo Grande General Plan. Prepared by the City of Arroyo Grande Community Development Department
 Economic Development Element of the Arroyo Grande General Plan Prepared by the City of Arroyo Grande Community Development Department Adopted by City Council Resolution No. 4489 on October 9, 2012 Table
Region Receives $190,000 for Affordable Housing
 Region Receives $190,000 for Affordable Housing The Great River Housing Trust Fund (Trust Fund) has received a $190,000 grant from the Federal Home Loan Bank of Des Moines to invest into affordable housing.
VERMONT AGENCY OF TRANSPORTATION. FY2018 Budget. Joe Flynn, Secretary of Transportation House Appropriations Committee February 27, 2017
 VERMONT AGENCY OF TRANSPORTATION FY2018 Budget Joe Flynn, Secretary of Transportation House Appropriations Committee February 27, 2017 Today s Presentation FY2018 Governor s Recommended overview and program
PUBLIC PARTICIPATION PLAN
 0 PUBLIC PARTICIPATION PLAN GENERAL The City of Tyler currently serves as the fiscal agent for the Tyler Area Metropolitan Planning Organization (MPO), which represents the Tyler Metropolitan Study Area.
APPENDIX METROFUTURE OVERVIEW OVERVIEW
 APPENDIX B METROFUTURE OVERVIEW OVERVIEW Land use decisions and many economic development decisions in Massachusetts are controlled directly by local municipalities through zoning. This planning is guided
A newsletter from the Southeast Iowa Regional Planning Commission
 PAGE 1 IN THIS ISSUE: American Planning Association, Iowa Chapter s Annual Conference held in Burlington (page 1) 4 local projects awarded REAP grants (pages 2-3) Tri-State Development Summit to be held
TRANSPORTATION FUNDING PROGRAMS
 APPENDIX A Note: Not yet edited by DCPD. TRANSPORTATION FUNDING PROGRAMS 6 Transportation Funding Programs The following provides a brief description of transportation related funding programs that are
The Basics of Economic Development
 The Basics of Economic Development Maury Forman August 19, 2013 Economic Development Activities which promote increased revenues or retain and/or create permanent jobs in the private or public sector within
Implementation. Implementation through Programs and Services. Capital Improvements within Cambria County
 The transportation system serves Cambria County communities because people make decisions and take action toward the stated goals of the long-range transportation plan. Locally, these people include officials
City of Ypsilanti Economic Development Action Plan Presented to City Council: June 2014
 City of Ypsilanti Action Plan Presented to City Council: June 2014 The City of Ypsilanti s urban environment, heritage, and culture allow for the unique opportunity to encourage and support sustainable
DETAILED STRATEGIC PLAN
 www.dcedc.org DETAILED STRATEGIC PLAN 421 N. California Street Suite 200 Sycamore, IL 60178 [phone] 815.895.2711 [fax] 815.895.8713 MISSION STATEMENT: DCEDC is a public/private partnership working to facilitate
Economic Development Plan For Kent County, Maryland
 Economic Development Plan For Kent County, Maryland October 2013 FINAL Submitted by: Kent County Economic Development Advisory Board File: Economic Development Office: EDAB_Plan_final_2013_10_02.doc Economic
Purpose. Funding. Eligible Projects
 SMART SCALE is a statewide program that distributes funding based on a transparent and objective evaluation of projects that will determine how effectively they help the state achieve its transportation
PLANNING DEPARTMENT ADMINISTRATION
 PLANNING DEPARTMENT ADMINISTRATION Support Division Planning & Community Zoning Administration Review & Compliance Land Use & Design Rezoning & Permitting Plan Review Community LDO Management Zoning &
7/23/2013. Downtown Greenville s Success. Downtown Greenville s Success
 Downtown Greenville s Success What makes Greenville unique and successful? Community development Public space Partnerships Greenville s experience is not just about downtown Jumping off place to surrounding
Draft CRA Plan Amendment. Community Redevelopment Agency Advisory Board September 23, CRA Plan Amendment
 Draft Community Redevelopment Agency Advisory Board September 23, 2013 1 Project Scope Feasibility Study Public Workshops/Stakeholder Interviews Market Study 2 Schedule to Date Feasibility Study Community
Economic Development Concept Plan
 Economic Development Concept Plan A. As the lead economic development organization, the Clay County Economic Development Commission (EDC) will enhance Clay County s capacity to engage in economic development
TRANSPORTATION ALTERNATIVES (TA) SET ASIDE PROGRAM July 2016
 SET ASIDE PROGRAM July 2016") Regional Transportation Commission TRANSPORTATION ALTERNATIVES (TA) SET ASIDE PROGRAM July 2016 Contents 1.0 Purpose and Eligibility... 2 2.0 Process... 5 3.0 Implementation of Funded Projects... 5 Attachment
Regional Transportation Commission TRANSPORTATION ALTERNATIVES (TA) SET ASIDE PROGRAM July 2016 Contents 1.0 Purpose and Eligibility... 2 2.0 Process... 5 3.0 Implementation of Funded Projects... 5 Attachment
Drive America s Economy Forward by Reinvesting in Municipal Infrastructure
 Drive America s Economy Forward by Reinvesting in Municipal Infrastructure WWW.NLC.ORG/INFRASTRUCTURE Drive America s Economy Forward Drive America s Economy Forward by Reinvesting in Municipal Infrastructure
Dane County Comprehensive Plan Economic Development Goals & Objectives HED Work Group July 7, 2006
 Dane County Comprehensive Plan Economic Development Goals & Objectives HED Work Group July 7, 2006 Section I. Goal 1: Dane County will help to build and promote a robust, sustainable economy that enhances
VILLAGE OF FOX CROSSING REQUEST FOR PROPOSAL FOR COMPREHENSIVE PLAN
 VILLAGE OF FOX CROSSING REQUEST FOR PROPOSAL FOR COMPREHENSIVE PLAN Issuing Department: Community Development Department Village of Fox Crossing 2000 Municipal Dr. Project Officer: George L. Dearborn Jr.,
1. INTRODUCTION TO CEDS
 1. INTRODUCTION TO CEDS TABLE OF CONTENTS INTRODUCTION... 1 CEDS STRATEGY COMMITTEE... 2 CEDS COMPONENTS... 2 Community Profiles... 2 Strategic Planning... 2 Bottom up Economic Development Strategies...
Lakes Region Planning Commission SWOT Analysis & Recommendations
 Lakes Region Planning Commission SWOT Analysis & Recommendations The results of a SWOT survey administered to the CEDS Committee were presented to the Committee in late April, at which time they were discussed
SUPPORTING LOCAL BUSINESSES A GUIDE FOR MUNICIPALITIES
 SUPPORTING LOCAL BUSINESSES A GUIDE FOR MUNICIPALITIES Working to Keep the North Country Economy Strong NORTH COUNTRY COUNCIL S RESILIENT ECONOMY PROGRAM Supporting Local Businesses: A Guide for Municipalities
MEMORANDUM AGENDA ITEM #6k
 South Florida Regional Planning Council MEMORANDUM AGENDA ITEM #6k DATE: SEPTEMBER 8, 2008 TO: FROM: SUBJECT: COUNCIL MEMBERS STAFF TOWN OF MEDLEY PROPOSED COMPREHENSIVE PLAN AMENDMENT Introduction On
Appendix 5: Port Annual Economic Development Plan
 Appendix 5: Port Annual Economic Development Plan Appendix 5 Page A5-1 Annual Economic Development Plan PORT OF WALLA WALLA ECONOMIC DEVELOPMENT PLAN FOR WALLA WALLA COUNTY YEAR 2012 Port of Walla Walla
Sources of Funding Through MDOT Office of Economic Development
 Michael B. Kapp, Administrator Sources of Funding Through MDOT Office of Economic Development 2012 County Engineers Workshop February 15, 2012 OED Programs Safe Routes to School (SRTS) Program Transportation
2018 POLICY FRAMEWORK FOR PSRC S FEDERAL FUNDS
 2018 POLICY FRAMEWORK FOR PSRC S FEDERAL FUNDS TABLE OF CONTENTS Section 1: Background... 3 A. Policy Framework... 3 B. Development of the 2019-2022 Regional Transportation Improvement Program (TIP)..
SILVERTHORNE COMPREHENSIVE PLAN APPENDIX A - ECONOMIC DEVELOPMENT ELEMENT
 SILVERTHORNE COMPREHENSIVE PLAN APPENDIX A - ECONOMIC DEVELOPMENT ELEMENT INTRODUCTION The ability to provide quality municipal services and infrastructure to the Silverthorne community is directly related
ECONOMIC DEVELOPMENT STRATEGIC PLAN. Adopted by the Riverbank City Council March 2011
 ECONOMIC DEVELOPMENT STRATEGIC PLAN Adopted by the Riverbank City Council March 2011 INTRODUCTION Economic development is a priority for Riverbank citizens and decision makers alike. The City wishes to
Community Development Needs Assessment
 Community Development Needs Assessment An assessment and inventory of the community development needs for a state as large and diverse as the State of Maine is an exhausting task. With almost 500 cities,
Economic Development Element
 Economic Development A. INTRODUCTION Purpose of the The overall purpose of the is to improve the local economy through diversification and integration with the regional economy. While the State Growth
Economic Trends and Florida s Competitive Position
 Economic Trends and Florida s Competitive Position presented to Florida Department of Economic Opportunity Small Business Forum presented by John Kaliski Cambridge Systematics, Inc. March 22, 2012 Presentation
Objective 1. Research current housing issues in Avon to gain a deeper understanding of the housing market Type: Program Priority: 1 Cost: Medium
 Overall Comprehensive Plan Goals: Encourage growth in more suitable areas within town boundaries. These areas include sites close to existing residential, commercial, or industrial areas that are already
CITY OF SHASTA LAKE GOALS AND OBJECTIVES WORKSHOP FEBRUARY 9, Economic Development and Downtown Revitalization
 CITY OF SHASTA LAKE GOALS AND OBJECTIVES WORKSHOP FEBRUARY 9, 2011 Economic Development and Downtown Revitalization 1. Develop a community character that promotes economic vitality, environmental protection
Downtown Des Moines 2012 Executive Call
 Downtown Des Moines 2012 Executive Call Downtown Community Alliance Joe Sorenson, Executive Call Coordinator Downtown Des Moines 2011 Executive Call Report Executive Call Program Since 2000, the Executive
Union County Community Improvement Corporation Investment Portfolio
 Union County Community Improvement Corporation Investment Portfolio Our MISSION is to expand the economy of Union County by working together with our local, regional, and state economic development partners
Comprehensive Economic Development Strategy
 CENTRAL MISSISSIPPI PLANNING AND DEVELOPMENT DISTRICT S Comprehensive Economic Development Strategy 2013-2018 Submitted September, 2012 Contents Community and Private Sector Participation... 3 Regional
ECONOMIC DEVELOPMENT PURPOSE RELATIONSHIP WITH OTHER ELEMENTS OF THE PLAN ECONOMIC CONDITIONS
 ECONOMIC DEVELOPMENT PURPOSE A strong and diversified economy provides a high quality of life for the citizens of Jefferson County and the region. This in turn generates the resources through which local
REGION _CHAPTER 2: REGIONAL SETTING
 REGION _CHAPTER 2: REGIONAL SETTING goals & objectives COMPREHENSIVE PLAN UPDATE 2006-2026 : A Vision for Kenton County s Future INTRODUCTION While this plan focuses on Kenton County and the cities contained
City Council Goals
 2017-2022 City Council Goals City of Virginia Beach February 2017 Goal 1: Grow the Local Economy Pursue opportunities for Research & Development (R&D) and medical related businesses. Develop Burton Station
Basic Information...Page 2. Voter Information...Page 3. Proposition B: Libraries, Museums, and Cultural Arts Facilities $128 million...
 Table of Contents Basic Information...Page 2 Voter Information...Page 3 Proposition A: Affordable Housing $250 million...page 4 Proposition B: Libraries, Museums, and Cultural Arts Facilities $128 million...page
E c o n o m i c D e v e l o p m e n t P r o b l e m s a n d O p p o r t u n i t i e s
 Economic Development Problems and Opportunities The regional problems and opportunities will drive the strategy for development in the future. This section will identify past, present, and projected future
DOROTHY SAVARESE, Chairman of the Board:
 State of the Cape Address March 15, 2013 @ Community Media Center, Shad Hole Road, Dennisport, MA DOROTHY SAVARESE, Chairman of the Board: Why a State of the Cape Address? Chamber is in a position to know
Case for Support Lee County Economic Development Group. Lee County A Five-Year Strategic Initiative to Spur Economic Growth in Lee County
 Case for Support Lee County Economic Development Group Lee County 2018 A Five-Year Strategic Initiative to Spur Economic Growth in Lee County Our Mission As the first contact and central economic development
Non-Motorized Transportation Funding Options
 Non-Motorized Transportation Funding Options Bicycle and pedestrian projects are broadly eligible for funding from nearly all major federal highway, transit, safety, and other programs. To be eligible
Florida Job Growth Grant Fund Public Infrastructure Grant Proposal
 Florida Job Growth Grant Fund Public Infrastructure Grant Proposal Proposal Instructions: The Florida Job Growth Grant Fund Proposal (this document) must be completed by the governmental entity applying
The Redevelopment Area could benefit from a public plaza, such as this one in southern California. CHAPTER IV: ACTION PLAN
 CHAPTER IV ACTION PLAN CHAPTER IV: ACTION PLAN This Action Plan represents a step in identifying and funding improvements in the Sonoma Valley elopment Project Area community. The Action Plan sets forth
A GROWTH PLAN FOR JENA, LOuISIANA Adopted JAnuAry 26, MAKING IT HAPPEN Making it Happen
 A growth plan for Jena, Louisiana Adopted January 26, 2010 6. MAKING IT HAPPEN 77 6. Making it Happen 78 6. MAKING IT HAPPEN Adopted January 26, 2010 A growth plan for Jena, Louisiana Priority Implementation
Major in FY2013/2014 (By and ing Source) Municipal Building Acquisition and Operations Balance $1,984, Contributions from Real Estate
 Municipal Building Acquisition and Operations Balance $1,984, Contributions from Real Estate") Major in FY2013/2014 (By and ing Source) Environmental Services Solid Waste 4200 4200 06CON 4200 SWM01 Balance $13,753,504.00 Balance $4,631,754.00 Balance $2,738,918.00 ing Source Total: $21,124,176.00
Major in FY2013/2014 (By and ing Source) Environmental Services Solid Waste 4200 4200 06CON 4200 SWM01 Balance $13,753,504.00 Balance $4,631,754.00 Balance $2,738,918.00 ing Source Total: $21,124,176.00
City of Norwich BOA Revitalization Plan
 City of Norwich BOA Revitalization Plan Public Informational Meeting The Firehouse Meeting Room January 10, 2018 Welcome and Introductions Christine A. Carnrike Mayor, City of Norwich Julie Sweet NYSDOS
Appendix E: Grant Funding Sources
 Appendix E: Grant Funding Sources Federal Programs The majority of public funds for bicycle, pedestrian, and trails projects are derived through a core group of federal and state programs. Federal funding
Transportation Funding Terms and Acronyms Unraveling the Jargon
 Funding Terms and Acronyms Unraveling the Jargon Every profession has its own acronyms and jargon. The shorthand wording makes it easier and quicker for professionals in any given field to communicate
Coolidge - Florence Regional Transportation Plan
 Coolidge - Florence Regional Transportation Plan A Partnership Among the City of Coolidge, Town of Florence, and ADOT FINAL REPORT Kimley-Horn Kimley Kimley-Horn and and Associates, Associates, Inc. Inc.
Get it Done: Rebuild Michigan GRETCHEN WHITMER S PLAN FOR SAFE ROADS, CLEAN WATER, AND A BETTER ECONOMY
 Get it Done: Rebuild Michigan GRETCHEN WHITMER S PLAN FOR SAFE ROADS, CLEAN WATER, AND A BETTER ECONOMY 2 To get ahead, Michiganders need one good job and we need to be able to get to that job. But our
NAPA COUNTY GRAND JURY
 NAPA COUNTY GRAND JURY 2016-2017 June 22, 2017 FINAL REPORT NAPA VALLEY TRANSPORTATION AGENCY VISION 2040 PLAN County Traffic Problems Need a Comprehensive Plan with Measurable Results 2 NAPA VALLEY TRANSPORTATION
TRANSPORTATION IMPROVEMENT PROGRAM FY 2013
 Kankakee Metropolitan Planning Organization Policy Committee Paul Schore, Chairman Mayor Village of Bourbonnais Nina Epstein, Vice-Chairman Mayor City of Kankakee Bruce Adams, Mayor Village of Bradley
Funding Principles. Years Passed New Revenue Credit Score Multiplier >3 years 0% % % % After Jan %
 Funding Principles I. Infrastructure Incentives Initiative: encourages state, local and private investment in core infrastructure by providing incentives in the form of grants. Federal incentive funds
Greater Reno-Sparks-Tahoe Economic Development Three-Year Strategic Plan
 Greater Reno-Sparks-Tahoe Economic Development Three-Year Strategic Plan 4.26.12 TABLE OF CONTENTS INTRODUCTION...3 COMMUNITY ASSESSMENT...5 TARGET SECTORS...7 STRATEGIES & METRICS...9 Entrepreneurial
Transportation Alternatives Program (TAP) Recreational Trails Program (RTP)
 Recreational Trails Program (RTP)") Transportation Alternatives Program (TAP) Recreational Trails Program (RTP) www.fhwa.dot.gov/environment/transportation_alternatives/overview/presentation/ 1 Transportation Alternatives Program Authorized
Transportation Alternatives Program (TAP) Recreational Trails Program (RTP) www.fhwa.dot.gov/environment/transportation_alternatives/overview/presentation/ 1 Transportation Alternatives Program Authorized
Association of Metropolitan Planning Organizations Fixing America s Surface Transportation (FAST) Act
 Act") Association of Metropolitan Planning Organizations Fixing America s Surface Transportation (FAST) Act General Overview Total authorizations (Highway Trust Fund, HTF, Contract Authority plus General Funds
Association of Metropolitan Planning Organizations Fixing America s Surface Transportation (FAST) Act General Overview Total authorizations (Highway Trust Fund, HTF, Contract Authority plus General Funds
Ticonderoga, NY - Adirondacks
 Ticonderoga, NY - Adirondacks Ticonderoga is writing its next chapter in a long and rich story. Located on Lake Champlain and Lake George and nestled between the New York s Adirondack Mountains and the
Rural Grants Program (
 Created 2013 Rural Grants Program (http://www.nccommerce.com/rd/rural-grants-programs) Statutory Authority G.S. 143B-472.126 to 472.128 Purpose Seeks to stimulate the creation of new, full-time jobs by
Please complete your phone connection now:
 Today s seminar will begin shortly. Please complete your phone connection now: 1. Dial the toll free number: 1-866-275-3495. 2. Enter the meeting number *4671867* on your phone keypad. Enter the star (*)