UCSB TRANSPORTATION STUDY
|
|
|
- Herbert Sanders
- 6 years ago
- Views:
Transcription

1 ISBER, 2201 North Hall University of California, Santa Barbara Santa Barbara, CA UCSB TRANSPORTATION STUDY SPRING, 2011 Prepared Spring 2011 by the UCSB Social Science Survey Center for the Chancellor s Campus Sustainability Committee, and the UCSB Office of Administrative Services
2 The Social Science Survey Center and Benton Survey Research Laboratory Mission Public opinion polls, and the underlying scientific methods upon which the best polls are based, were first developed in the late 1930 s to find out what ordinary people think. Today, survey research is increasingly used by academic researchers to study theoretical issues in fields as diverse as sociology, economics, psychology, communication and political science; by government agencies to assess such things as unemployment, population demographics, and health care needs; by marketers to test the waters before releasing or even developing new products; and by public officials to determine public support for new or existing policies. Because the science of survey research has advanced considerably over the years, we are more and more capable of inferring what large numbers of people do, feel, or think on the basis of a relatively small number of structured interviews. Public universities have been central to the growth of survey research. Here at UCSB, the recently created Social Science Survey Center (SSSC) was developed to enhance interdisciplinary collaboration on both theoretical and methodological planes. The SSSC has three central goals: (1) assisting faculty with their funded research projects; (2) providing practical experience for graduate and undergraduate in survey research; and (3) creating new knowledge in the area of survey methodology. Faculty Projects A central goal of the SSSC exists to assist faculty (both at UCSB and elsewhere) in the development and execution of their funded survey research projects. As such, it can increase faculty chances of securing funding for survey research projects, as well as provide a local resource for the development of survey instruments and interviewing. The SSSC is currently running 9 computer-aided telephone interviewing stations, although it will ultimately be equipped with a full complement of 20 stations. Education and Training SSSC is also a place for hands on learning for both undergraduate and graduate. In our facility, the Benton Social Research Laboratory, enrolled in research design classes can gain practical experience in research techniques through the use of modern tools such as computer-aided telephone interviewing systems. Graduate student support in the form of research assistantships is also available throughout the center. Graduate research assistants at SSSC learn the day to day operations of a modern survey research organization in addition to being actively engaged in the creation of new knowledge both context specific in terms of specific studies contracted through the SSSC, and also in the development of new methodological innovations. Methodological Innovation In addition to collecting data for individual projects, the SSSC s long term goals include the development of knowledge and innovations to increase the quality of survey research. For example, part of the work of the SSSC is to better understand issues such as: the presence of response effects in surveys, the reasons for and solutions to survey non-response and improving the validity of survey measurement.
3 Summary of Main Findings Methodology The purposes of this report include: characterizing the commuting patterns of UCSB s faculty, staff, and ; helping UCSB estimate Average Vehicle Ridership (AVR) for UCOP reporting purposes; and helping estimate UCSB s scope 3 GHG emissions. This year, we dedicated a module of the survey to investigate practices and opinions about telecommuting and alternative work week schedules. Over time, consistent reporting of this data will be used to assess trends in our campus community s commuting behavior and to determine the effectiveness of programs encouraging the use of alternative transportation. Some of the graphs also utilize historical data sets from previous transportation studies. This report analyzes data collected through a voluntary survey that was mailed to randomly extracted samples of UCSB faculty, staff, and (graduate and undergraduate) in the second and third week of Spring Quarter Respondents were asked to report their daily commuting behavior about the first week of Spring Quarter. Table 1: Survey Response Rates: Faculty 77% 45% Undergraduate 24% Graduate 35% When reporting whole campus statistics, subgroups were weighed to better represent campus population composition. For additional information regarding the methods used to collect the data presented in this report, please contact the UCSB Social Science Survey Center Page 1
4 at or (805) , or UCSB Sustainability Coordinator Jasmine Syed at or (805) Page 2
5 Commuting Mode Split To measure commuting behaviors, we asked UCSB faculty, staff, and to indicate the mode of transportation they used to travel to campus each day from Monday, March 28 th through Friday, April 2 nd. In 2011 we continue to see a decrease in the historical trend of daily use of single-occupancy vehicles in commuting to campus (Figure 1). There appears to be a slight decrease from 2010 in the use of single-occupancy vehicles for both faculty/staff (from 55% in 2010 to 51% in 2011) and (down to 7% from 11% in 2010), with a corresponding slight increase in the use of alternative transportation (32% in 2010 to 34% in 2011 for faculty/staff, and 80% to 85% for ). However, there is one important factor to take into consideration in interpreting these changes: the fielding period of the study changed between 2010 and While the 2010 survey was fielded in Winter Quarter, at the end of a somewhat rainy period, the 2011 survey was administered at the very beginning of Spring Quarter. Therefore, some of the increased use of alternative transportation could just be due to the more favorable weather conditions in Spring Quarter. Disaggregated time series data for the various mode of transportation can be found in Appendix 1. Figure 1: Single Occupancy Vehicle: vs. Students 100% 90% 80% 70% 60% 50% 40% Faculty/ Students 30% 20% 10% 0% Page 3
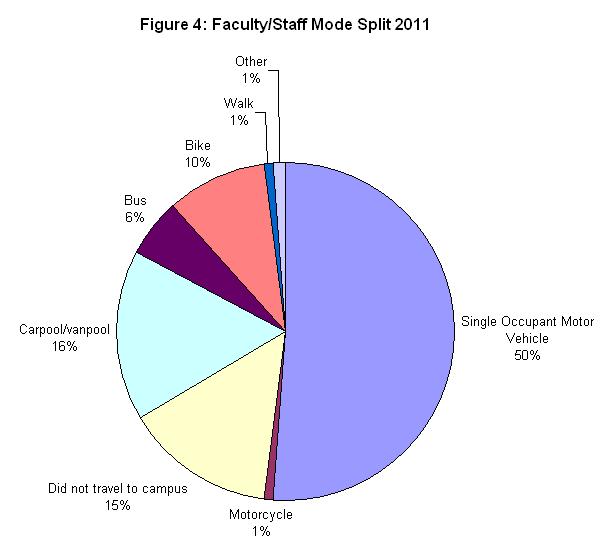
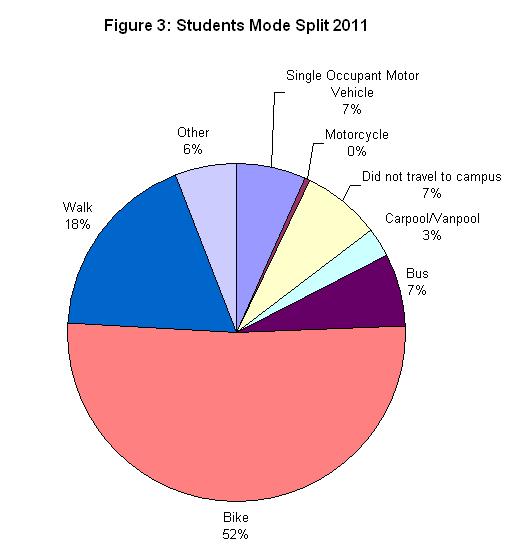
6 To maintain the maximum comparability with past surveys, we define as alternative transportation using the bus, carpooling or using the UCSB Vanpool service, biking, walking and other forms of non-motorized transportation. Figure 2: Alternative Transportation: vs. Students 100% 90% 80% 70% 60% 50% 40% Faculty/ Students 30% 20% 10% 0% Disaggregated commuter mode split data can be seen in Figure 3 and Figure 4. Overall, are much more likely to use alternative transportation, with biking (52%), walking (18%), and the bus (7%) being the most popular alternatives. While about half of faculty and staff commute to campus in a singleoccupancy motor vehicle, there are substantial percentages that also carpool (16%), bike (10%), and take the bus (6%). The Other category, substantially larger in the student group, includes train, skateboard and electric bicycle or Segway. The difference in this category between the various subpopulations is best explained by the number of skateboarding to campus. Page 4
7 Page 5
8 However, when broken down by groups, we can see there are significant differences in commuting patterns between faculty, staff, undergraduates, and graduate. Figure 5: Mode Split by Subgroups Grads Undergrads 0% 7% 3% 16% 6% 5% 6% 2% 1% 20% 6% 15% 36% 8% 14% 55% Faculty 14% 2% 1% 7% 1% 1% 7% 3% 46% 12% 19% 55% 22% 0% 9% 1% When disaggregating graduate from undergraduate, for example, we can see that the two groups, while similar, have some distinct commuting behaviors. While the majority of graduate bike to campus, they are also most likely out of the four groups to take the bus. Graduate also are more likely than undergraduates to take a single-occupancy commuter vehicle to Page 6
9 campus, or not come into campus at all. Undergraduates, on the other hand, overwhelmingly bike and, to a lesser extent, walk to campus, and no other single mode of transportation is used very frequently. Similarly, when faculty and staff are broken apart, there are unique commuting behaviors exhibited by both groups. While staff are the most likely to take a single-occupancy vehicle to campus, they also are the group that carpools to campus most often, as well as the second most frequent bus riders after graduate. Faculty, on the other hand, are less likely to take a singleoccupancy vehicle to campus, but are also more likely to not come into to campus at all. Faculty are also more likely to bike to campus than staff, and they are the second largest group of carpoolers, after staff. In 2011 we computed Average Vehicle Ridership (AVR) following UCLA s methodology, to be able in the future to compare results with other UC campuses. Table 2 presents the results. The AVR column reports the average number of riders per motorized vehicle (excluding motorcycles, vans and buses) commuting to campus. The last column in the table, reports the ratio with actual non-motorized trips at the numerator (total trips to campus over motorized trips). The ratio is particularly high for Undergraduate, who live for the most part within walking or biking distance from UCSB. Table 2: Average Vehicle Ridership vehicles occupants/trips AVR (people/vehicles) trips/ vehicles Faculty Graduate Undergraduate Page 7
10 Commuting Distance Average commuting distance also significantly varies by group (Figure 6). Figure 6: Commute Distance by Subgroup Undergraduate Graduate Faculty Miles commute the longest distance to campus, at 16.2 miles one way on average. This may, in part, explain their heavier reliance on single-occupancy motor vehicles, as it is more difficult to rely upon alternative forms of transportation for such long distances. Faculty, however, are not far behind staff, with an average commute of 13.8 miles one way. Again, this may be reflected in their higher reliance on single-occupancy motor vehicles than student subpopulations. Graduate, on the other hand, only commute on average 8.05 miles to campus, while undergraduates commute about 5.9 miles on average. This slightly longer commute for graduate may partly explain why graduate rely more on the bus, while undergraduates almost always either bike or walk to campus. Page 8
11 Commuting in For the 2011 survey, we were asked to investigate the commuting patterns of the area immediately adjacent to the UCSB campus. Respondents residing in the postal code were asked to point out their area location on a map (Appendix 2). The following analysis focuses on those areas. Table 1 displays the types of transportation residents living within the postal code used to commute to campus. Table 3: Transportation Usage in Postal Code Percent Single-Occupancy Motor Vehicle 15.0% Motorcycle.5% Did not travel to campus 8.7% Carpool/vanpool 5.2% Bus 6.7% Bike 43.2% Walk 14.9% Other 5.6% 100.0% As can be seen in Table 3, the majority of residents within the area code biked to campus, with substantial minorities walking and taking singleoccupancy motor vehicles. The large combined proportion of biking and walking is likely due to the heavy undergraduate student presence in the Isla Vista and Ellwood Beach portions of the area code. These areas are adjacent to UCSB so do not need to travel long distances to get to campus. We broke down commuting behaviors for the different areas of the postal code (please refer to Appendix 2). Table 4 displays the percentage of residents from each area that either drove alone to campus, or relied upon some alternative form of transportation. Page 9
12 Table 4: Transportation Usage by Areas Within Zip Code Mode of Transportation Drove Alone Area 1 Area 1 Area 2-3 Area 4-5 Area 6 Area % 45.3% 14.8% 1.4% 27.6% Alternative Transportatio n % % % % % There are three areas that stand out as having a majority of residents utilizing alternative transportation to get to campus: Isla Vista (Area 6, 98.6%), Southeast and Old Town Goleta (Area 4-5, 85.2%), and Southwest Goleta/Ellwood (72.4%). However, the areas north of the 101 have significantly less residents using alternative transportation to get to campus, with Northwest Goleta (Area 1) having 55.1% relying upon alternative transportation, and North and Northeast Goleta (Area 2-3) having 54.7% do so. However, despite the less relative use of alternative transportation, the majority of residents from both of these areas are using alternative transportation to commute to campus. 1 For the purposes of the analysis, North and Northeast Goleta were collapsed together, as were Southeast and Oldtown Goleta. Northwest Goleta (Area 1) represents the area north of 101, up to Glenn Annie. North Goleta (Area 2) represents the area north of 101, between Glenn Annie and N. Fairview. Northeast Goleta (Area 3) represents the area north of 101 and east of N. Fairview. Southeast Goleta (Area 4) represents the area east of 217/Ward Memorial Drive. Old Town Goleta (Area 5) represents the area south of 101, from Los Carneros to 217. Isla Vista (Area 6) represents the area south of El Colegio, from Campus to the Deveraux area. Finally, Southwest Goleta represents the area south of 101, west of Los Carneros and Isla Vista. Page 10
13 Telecommuting and Compressed Work Week Schedules During the week of March 28th, the vast majority of all staff (95.33%) worked a regular work week, with 1.4% working a compressed work week, and 3.27% telecommuting. However, given that the survey was administered during the first week of the quarter, it is likely that fewer staff members had taken advantage of alternative schedules or telecommuting than might during other times in the school year. Among those staff who worked a regular work week, 57.5% reported that they were aware of the UCSB Flexwork program. 2 However 28.3% of all staff said that, while aware of the program, they were not familiar with the details. When asked about their current work schedule, these respondents reported overwhelmingly (82.8%) that they were still working a regular, 5 day, 40 hour work week. However, approximately 3.5% reported working some sort of compressed work week, 0.5% reported telecommuting, 4.5% reported having flexible time, and 8.6% reported having some other type of work schedule. Figure = 7: Type of Schedule Among All Other, 8% Regular Work Week, 79% Alternative Work Schedule/ Telecommuting, 21% Flexible Time, 4% Telecommuting, 4% Compressed Work Week, 5% 2 Page 11
14 Among the staff currently working a regular work week, 38.7% indicated their job duties would allow for telecommuting, 45.5% indicated their job duties would allow for a compressed work week, and 43.5% indicated that neither of these would possible based upon their job duties Among those whose job duties would allow for telecommuting, 72.8% indicated that they would be interesting in that possibility. Another 12.7% said they were interested, but expressed concerns about having the necessary equipment or expertise. However, when asked how often they would telecommute if given the necessary equipment, 87.4% reported that they would commute at least one day per week on average or more. Only 14.4% indicated that they had no interest in telecommuting. For those who expressed some sort of interest in telecommuting, most (59.5%) said they were either comfortable or very comfortable in talking to their supervisors about telecommuting, with only 21.3% reporting they would be uncomfortable or very uncomfortable. For those who indicated their job duties would be compatible with a compressed work week, 78.6% said they would be interested in working this schedule. Amongst the potential types of compressed work week, a 4 day, 40 hour week was the most popular, with 57.1% indicating this would be their preferred choice. The next most popular choice was a 9 day, 80 hour work week, which 21.3% chose as their preferred schedule. A majority of those interested in working a compressed work week indicated that they would either be comfortable or very comfortable talking to their supervisors about working on this schedule (57.4%), with only 18.4% reporting that they would be either uncomfortable or very uncomfortable. Page 12
15 Figure 8: Supervisor Support for Employee Telecommuting and Alternative Schedules 100% 90% 80% 70% 60% 50% 40% 30% 20% 10% 0% Telecommute Alternative or compressed work schedule Forty-two percent of those who worked a regular work week, reportedly supervised employees. A majority (58.8%) indicated they would allow their employees to telecommute if their job duties allowed it. An even greater share (80.4%) indicated that they were open to allowing their employees work a compressed work week. Page 13
16 UCSB Transportation Study 2011 Questionnaire 1. Are you? 1. Faculty / Academic Post-doctoral 4. Graduate student 5. Undergraduate student 6. Other LIVING. Where do you currently live? 1. On-Campus Resident Halls (Anacapa, San Miguel, San Nicolas, San Rafael, Santa Cruz, Santa Rosa, Manzanita Village, Santa Catalina) 2. University Owned Off- Campus Housing (Family Student Housing, San Clemente, Santa Ynez Apts., El Dorado Apts., Westgate Apts., West Campus Housing) 3. Other LIVING2. Do you currently live in university owned or subsidized housing? 1. Yes 2. No 2. During the week of March 28, 2011 to April 1, 2011, how did you travel to the UCSB campus (or UCSB worksite)? Please choose a mode of travel for each day. If you did not travel to work on a particular day, click on the Did not travel to campus" radio button: 2A1. Monday 1. Drove alone 2. Persons in private vehicle 3. More than 2 persons in private vehicle 4. Bicycle 5. Skate- board 6. Vanpool 7. Long distance bus 8. Electric bicycle or Segway 9. Motorcycle / Moped 10. Local MTD Bus 11. Train 12. Walked or jogged 13. Did not travel to campus/ucsb worksite 2A2. Tuesday 1. Drove alone 2. Persons in private vehicle 3. More than 2 persons in private vehicle 4. Bicycle 5. Skate- board 6. Vanpool 7. Long distance bus 8. Electric bicycle or Segway 9. Motorcycle / Moped 10. Local MTD Bus 11. Train 12. Walked or jogged 13. Did not travel to campus/ucsb worksite 2A3. Wednesday Page 14
17 1. Drove alone 2. Persons in private vehicle 3. More than 2 persons in private vehicle 4. Bicycle 5. Skate- board 6. Vanpool 7. Long distance bus 8. Electric bicycle or Segway 9. Motorcycle / Moped 10. Local MTD Bus 11. Train 12. Walked or jogged 13. Did not travel to campus/ucsb worksite 2A4. Thursday 1. Drove alone 2. Persons in private vehicle 3. More than 2 persons in private vehicle 4. Bicycle 5. Skate- board 6. Vanpool 7. Long distance bus 8. Electric bicycle or Segway 9. Motorcycle / Moped 10. Local MTD Bus 11. Train 12. Walked or jogged 13. Did not travel to campus/ucsb worksite 2A5. Friday 1. Drove alone 2. Persons in private vehicle 3. More than 2 persons in private vehicle 4. Bicycle 5. Skate- board 6. Vanpool 7. Long distance bus 8. Electric bicycle or Segway 9. Motorcycle / Moped 10. Local MTD Bus 11. Train 12. Walked or jogged 13. Did not travel to campus/ucsb worksite 2A6. Saturday 1. Drove alone 2. Persons in private vehicle 3. More than 2 persons in private vehicle 4. Bicycle 5. Skate- board 6. Vanpool 7. Long distance bus 8. Electric bicycle or Segway 9. Motorcycle / Moped 10. Local MTD Bus 11. Train 12. Walked or jogged 13. Did not travel to campus/ucsb worksite 2A7. Sunday 1. Drove alone 2. Persons in private vehicle 3. More than 2 persons in private vehicle 4. Bicycle 5. Skate- board 6. Vanpool 7. Long distance bus 8. Electric bicycle or Segway 9. Motorcycle / Moped 10. Local MTD Bus 11. Train 12. Walked or jogged 13. Did not travel to campus/ucsb worksite Page 15
18 3. If during the week of March 28, 2011 to April 1, 2011, if you DID NOT travel to campus on any particular day, please indicate the reason below. 3A1. Monday 1. Regular Day Off 2. Vacation 3. Furlough 4. Sick 5. Telecommuted (worked at home) 6. Compressed Work Week Day Off 7. Jury Duty 8. Other 3A2. Tuesday 1. Regular Day Off 2. Vacation 3. Furlough 4. Sick 5. Telecommuted (worked at home) 6. Compressed Work Week Day Off 7. Jury Duty 8. Other 3A3. Wednesday 1. Regular Day Off 2. Vacation 3. Furlough 4. Sick 5. Telecommuted (worked at home) 6. Compressed Work Week Day Off 7. Jury Duty 8. Other 3A4. Thursday 1. Regular Day Off 2. Vacation 3. Furlough 4. Sick 5. Telecommuted (worked at home) 6. Compressed Work Week Day Off 7. Jury Duty 8. Other 3A5. Friday 1. Regular Day Off 2. Vacation 3. Furlough 4. Sick 5. Telecommuted (worked at home) 6. Compressed Work Week Day Off 7. Jury Duty 8. Other 3A6. Saturday 1. Regular Day Off 2. Vacation 3. Furlough 4. Sick 5. Telecommuted (worked at home) 6. Compressed Work Week Day Off 7. Jury Duty 8. Other 3A7. Sunday 1. Regular Day Off 2. Vacation 3. Furlough 4. Sick Page 16
19 5. Telecommuted (worked at home) 6. Compressed Work Week Day Off 7. Jury Duty 8. Other 3B. Please indicate type of compressed work schedule: 1. 4/40 (worked 40 hours in 4 days) 2. 3/36 (worked hours in 3 days) 3. 9/80 (worked 80 hours in 9 days) 4. Other TIME. During the week of March 28, 2011 to April 1, 2011, what time did you arrive at and leave from the UCSB Campus (or your UCSB worksite)? TIMEA1. Arrival Time: Monday 1. 12am to 6am 2. 6am to 9am 3. 9am to 12pm noon pm to 5pm 5. 5pm to 12am 6. Did not travel to campus / UCSB Worksite TIMEA2. Arrival Time: Tuesday 1. 12am to 6am 2. 6am to 9am 3. 9am to 12pm noon pm to 5pm 5. 5pm to 12am 6. Did not travel to campus / UCSB Worksite TIMEA3. Arrival Time: Wednesday 1. 12am to 6am 2. 6am to 9am 3. 9am to 12pm noon pm to 5pm 5. 5pm to 12am 6. Did not travel to campus / UCSB Worksite TIMEA4. Arrival Time: Thursday 1. 12am to 6am 2. 6am to 9am 3. 9am to 12pm noon pm to 5pm 5. 5pm to 12am 6. Did not travel to campus / UCSB Worksite TIMEA5. Arrival Time: Friday 1. 12am to 6am 2. 6am to 9am 3. 9am to 12pm noon pm to 5pm 5. 5pm to 12am 6. Did not travel to campus / UCSB Worksite TIMEA6. Arrival Time: Saturday 1. 12am to 6am 2. 6am to 9am 3. 9am to 12pm noon pm to 5pm 5. 5pm to 12am 6. Did not travel to campus / UCSB Worksite ] TIMEA7. Arrival Time: Sunday 1. 12am to 6am 2. 6am to 9am 3. 9am to 12pm noon pm to 5pm 5. 5pm to 12am Page 17
20 6. Did not travel to campus / UCSB Worksite TIMEB1. Departure Time: Monday 1. 12am to 6am 2. 6am to 9am 3. 9am to 12pm noon pm to 5pm 5. 5pm to 12am 6. Did not travel to campus / UCSB Worksite TIMEB2. Departure Time: Tuesday 1. 12am to 6am 2. 6am to 9am 3. 9am to 12pm noon pm to 5pm 5. 5pm to 12am 6. Did not travel to campus / UCSB Worksite TIMEB3. Departure Time: Wednesday 1. 12am to 6am 2. 6am to 9am 3. 9am to 12pm noon pm to 5pm 5. 5pm to 12am 6. Did not travel to campus / UCSB Worksite TIMEB4. Departure Time: Thursday 1. 12am to 6am 2. 6am to 9am 3. 9am to 12pm noon pm to 5pm 5. 5pm to 12am 6. Did not travel to campus / UCSB Worksite TIMEB5. Departure Time: Friday 1. 12am to 6am 2. 6am to 9am 3. 9am to 12pm noon pm to 5pm 5. 5pm to 12am 6. Did not travel to campus / UCSB Worksite TIMEB6. Departure Time: Saturday 1. 12am to 6am 2. 6am to 9am 3. 9am to 12pm noon pm to 5pm 5. 5pm to 12am 6. Did not travel to campus / UCSB Worksite TIMEB7. Departure Time: Sunday 1. 12am to 6am 2. 6am to 9am 3. 9am to 12pm noon pm to 5pm 5. 5pm to 12am 6. Did not travel to campus / UCSB Worksite DRIVER. Did you drive a motor vehicle to commute to the UCSB campus (or your UCSB worksite) during the week of March 28, 2011 to April 1, 2011? 1. Yes 2. No 54. If you are the driver of a motor vehicle used to commute to the UCSB campus (or your Page 18
21 UCSB worksite), please fill out the following information about the vehicle you used for your commute: 54A. Estimated miles per gallon of the motor vehicle you use to travel to campus 54B. What is the year of of the motor vehicle you use to travel to the UCSB campus (or your UCSB worksite)? or before 29. Unsure/Don t Know 54C. What is the make of the motor vehicle you use to travel to the UCSB campus (or your UCSB worksite)? 1. Acura 2. Alfa 3. American Motors 4. Aston Martin 5. Audi 6. BMW 7. Bentley 8. Buick 9. Cadillac 10. Chevrolet 11. Chrysler 12. Daewoo 13. Daihatsu 14. Datsun 15. Delorean 16. Dodge 17. Eagle 18. Ferrari 19. Fiat 20. Fisker 21. Ford 22. Freightliner 23. GMC 24. Geo 25. Honda 26. Hummer 27. Hyundai 28. Infiniti 29. Isuzu 30. Jaguar 31. Jeep 32. Kia 33. Lamborghini 34. Lancia 35. Land Rover 36. Lexus 37. Lincoln 38. Lotus 39. MG 40. Maserati 41. Maybach Page 19
22 42. Mazda 43. Mercedes-Benz 44. Mercury 45. Merkur 46. Mini 47. Mitsubishi 48. Mosler 49. Nissan 50. Noble 51. Oldsmobile 52. Opel 53. Panoz 54. Peugeot 55. Pininfarina 56. Plymouth 57. Pontiac 58. Porsche 59. Renault 60. Rolls Royce 61. Roush 62. Saab 63. Saleen 64. Saturn 65. Scion 66. Shelby 67.Shelby Super Car 68. smart 69. Sterling 70. Subaru 71. Suzuki 72. Tesla 73. Toyota 74. Triumph 75. Volkswagen 76. Volvo 77. Other, not listed 78. Unsure / Don't know 54C2. Please write in the make of the motor vehicle you use to travel to the UCSB campus (or your UCSB worksite) 54D. What is the model of the motor vehicle you use to travel to the UCSB campus (or your UCSB worksite)? 54E. Is the motor vehicle you use to travel to the UCSB campus (or your UCSB worksite) a Hybrid? 1. Hybrid 2. Plug-in Hybrid 3. No 4. Unsure/Don t know 54F. What fuel type does the motor vehicle you use to travel to the UCSB campus (or your UCSB worksite) use? 1. Gasoline 2. Diesel 3. Bio-diesel 4. Ethanol Electricity (not hybrid) 6. CNG 7. Other (specify) 8. Unsure / Don t know COUNTY. In what county do you reside? 1. Santa Barbara County 2. San Luis Obispo County 3. Ventura County 4. Other SBZIP. What is your RESIDENTIAL zip code? Please select from the list below: Page 20
23 MAP. Which area of Goleta do you live in? Please locate the numbered area on this map that includes your home, and select the corresponding number in the list below. If your home is not on this map, please select "Other." 1. Area 1: Northwest Goleta (North of 101, up to Glenn Annie) 2. Area 2: North Goleta (North of 101, between Glenn Annie and N. Fairview) 3. Area 3: North East Goleta (North of 101, East of N. Fairview) 4. Area 4: South East Goleta (East of 217/Ward Memorial Drive) 5. Area 5: Old Town Goleta (South of 101, from Los Carneros to 217) 6. Area 6: Isla Vista (South of El Colegio, from Campus to Deveraux area) 7. Area 7: South West Goleta (South of 101, West of Los Carneros and Isla Vista) 8. Other SLOZIP. What is your RESIDENTIAL zip code? Please select from the list below: Page 21
24 VENTURAZIP. What is your RESIDENTIAL zip code? Please select from the list below OTHERZIP. What is your RESIDENTIAL zip code? MILES. Approximately how many miles do you commute one-way from your residence to the UCSB campus (or your UCSB worksite)? Whole miles only, please round to nearest unit: WL1. Are you aware of the UCSB Flexwork Program? 1. Yes 2. Yes, I heard about it but I m not familiar with the details 3. Yes, I heard about it but I m not familiar with the details Page 22
25 WL2. What is your current work schedule? 1. Regular 5/40 work week (work 40 hours in 5 days) 2. 4/40 (work 40 hours in 4 days) 3. 3/36 (work hours in 3 days) 4. 9/80 (work 80 hours in 9 days) 5. Telecommute from home 1 day/week 6. Telecommute from home 2 days/week 7. Telecommute from home more than 2 days/week 8. Flexible time 9. Other WL3. In your opinion, would your job duties allow for (check all that apply) 1. Telecommuting 2. Compressed work week schedule 3. None of the above TC1. What best describes your situation: 1. I am interested in telecommuting 2. I am interested in telecommuting, but I don t have the necessary equipment or expertise 3. I am not interested in telecommuting TC2. How comfortable would you be talking to your supervisor about telecommuting? 1. Very comfortable 2. Comfortable 3. Neutral 4. Uncomfortable 5. Very uncomfortable TC3. If your supervisor offered you telecommuting equipment, how often do you think you would telecommute on average? 1. Less than one day per week 2. One day per week 3. Two days per week 4. Three days per week 5. Four days per week 6. Everyday CW1. What best describes your situation: 1. I am interested in an alternative work schedule/compressed work week. 2. I am not interested in an alternative work schedule/compressed work week. CW2. If you could choose, what do you think would work best for you and still be compatible with your work duties? 1. Regular 5/40 work week (work 40 hours in 5 days) 2. 4/40 (work 40 hours in 4 days) 3. 3/36 (work hours in 3 days) 4. 9/80 (work 80 hours in 9 days) 5. Other Page 23
26 CW3. How comfortable would you be talking to your supervisor about alternative work schedule/compressed work week? 1. Very comfortable 2. Comfortable 3. Neutral 4. Uncomfortable 5. Very uncomfortable single occupancy vehicle) in your commute to campus or your UCSB worksite? If you already are an alternative transportation user, please tell us how we can improve! SUPER. Do you supervise any employees? 1. Yes 2. No SUPER1A. If your employees job duties permitted it, would you agree to allow them to: Telecommute 1. Yes 2. No SUPER1B. If your employees job duties permitted it, would you agree to allow them to: Choose an alternative or compressed work schedule 1. Yes 2. No COMMENT. We are looking for your input and insight about implementing a programs to make it more convenient to use alternative transportation in your commute to campus (or your UCSB worksite). What are the main challenges that prevent you from using alternative modes of transportation (as opposed to a Page 24
27 Question # 1 Are you? Frequency Percent Faculty/Lecturer Post-doctoral fellow Graduate student Undergraduate student Other: Specify Missing 13 Page 25
28 Question # LIVING "Where do you currently live?" Undergraduate On-Campus Resident Halls 33.4% 33.4% University Owned Off-Campus Housing 6.4% 6.4% Isla Vista 49.5% 49.5% Other 10.8% 10.8% 100.0% 100.0% Page 26
29 Question # LIVING2 "Do you currently live in university owned or subsidized housing? Graduate Undergraduate Faculty Yes 4.4% 1.4% 43.8% 50.0% 18.2% No 95.6% 98.6% 56.2% 50.0% 81.8% 100.0% 100.0% 100.0% 100.0% 100.0% Page 27
30 Question # 2A1 During the week of March 28, 2011 to April 1, 2011, how did you travel to the UCSB campus (or UCSB worksite)? Please choose a mode of travel for each day. If you did not travel to work on a particular day, click on the Did not travel to campus" radio button. Monday, March 28th. Graduate Undergraduate Faculty Drove alone 47.4% 54.7% 13.9% 6.2% 15.6% 2 Persons in private vehicle 10.2% 11.2% 7.7% 1.8% 4.1% More than 2 persons in a private vehicle.7% 1.9%.5%.2%.5% Bicycle 13.9% 6.5% 36.1% 54.5% 44.1% Skateboard.7% 5.2% 3.7% Vanpool.7% 4.7%.5%.6% Long distance bus.7% 1.9%.5%.2%.4% Electric bicycle or Segway.0%.5%.1% Motorcycle / Moped.7%.9% 1.4%.4%.6% Local MTD Bus 3.6% 7.0% 15.4% 5.4% 6.5% Train.7%.5%.4%.4% Walked or jogged.7% 1.4% 7.2% 20.3% 15.3% Did not travel to campus/your 19.7% 9.8% 15.9% 5.4% 8.1% UCSB worksite 100.0% 100.0% 100.0% 100.0% 100.0% Page 28
31 Question # 2A2 During the week of March 28, 2011 to April 1, 2011, how did you travel to the UCSB campus (or UCSB worksite)? Please choose a mode of travel for each day. If you did not travel to work on a particular day, click on the Did not travel to campus" radio button. Tuesday March 29th. Graduate Undergraduate Faculty Drove alone 47.8% 54.9% 17.3% 5.1% 15.3% 2 Persons in private vehicle 10.1% 11.6% 4.8% 1.5% 3.7% More than 2 persons in a private vehicle 1.4% 1.4%.5%.2%.4% Bicycle 13.0% 7.9% 37.5% 56.3% 45.5% Skateboard.7% 1.0% 5.5% 4.0% Vanpool 4.7%.5%.6% Long distance bus 1.4% 1.4%.5%.4%.6% Electric bicycle or Segway.5%.1% Motorcycle / Moped.7%.9% 1.0%.5%.6% Local MTD Bus 2.9% 7.9% 15.4% 5.8% 6.9% Walked or jogged.7%.9% 7.2% 20.8% 15.6% Did not travel to campus/your 21.0% 7.9% 14.4% 3.9% 6.8% UCSB worksite 100.0% 100.0% 100.0% 100.0% 100.0% Page 29
32 Question # 2A3 During the week of March 28, 2011 to April 1, 2011, how did you travel to the UCSB campus (or UCSB worksite)? Please choose a mode of travel for each day. If you did not travel to work on a particular day, click on the Did not travel to campus" radio button. Wednesday, March 30th. Graduate Undergraduate Faculty Drove alone 46.7% 54.9% 16.9% 5.4% 15.3% 2 Persons in private vehicle 8.0% 12.2% 8.2% 1.5% 3.9% More than 2 persons in a private vehicle 1.5% 1.4%.5%.2%.4% Bicycle 14.6% 8.0% 36.7% 56.1% 45.5% Skateboard.7%.5% 5.0% 3.6% Vanpool 4.7%.5%.6% Long distance bus 1.5% 1.9% 1.0%.5%.7% Electric bicycle or Segway.0%.0% Motorcycle / Moped.7%.9% 1.0%.4%.5% Local MTD Bus 4.4% 8.0% 15.5% 6.1% 7.2% Train.7%.5%.1% Walked or jogged.7%.9% 8.2% 20.8% 15.7% Did not travel to campus/your 20.4% 7.0% 10.6% 4.2% 6.4% UCSB worksite 100.0% 100.0% 100.0% 100.0% 100.0% Page 30
33 Question # 2A4 During the week of March 28, 2011 to April 1, 2011, how did you travel to the UCSB campus (or UCSB worksite)? Please choose a mode of travel for each day. If you did not travel to work on a particular day, click on the Did not travel to campus" radio button. Thursday, March 31st. Graduate Undergraduate Faculty Drove alone 45.7% 54.9% 18.2% 5.2% 15.2% 2 Persons in private vehicle 10.1% 12.7% 4.8% 1.0% 3.4% More than 2 persons in a private vehicle 1.4% 1.9% 1.0%.2%.5% Bicycle 13.8% 7.5% 38.3% 56.2% 45.6% Skateboard.7%.0%.5% 5.6% 4.0% Vanpool 4.2%.5%.5% Long distance bus 1.4% 1.4%.5%.5%.6% Electric bicycle or Segway.0%.0% Motorcycle / Moped.7% 1.4% 1.0%.4%.6% Local MTD Bus 2.9% 6.6% 15.3% 6.2% 7.0% Train.5%.1% Walked or jogged 1.4% 1.4% 7.7% 20.9% 15.8% Did not travel to campus/your 21.7% 8.0% 12.0% 3.9% 6.6% UCSB worksite 100.0% 100.0% 100.0% 100.0% 100.0% Page 31
34 Question # 2A5 During the week of March 28, 2011 to April 1, 2011, how did you travel to the UCSB campus (or UCSB worksite)? Please choose a mode of travel for each day. If you did not travel to work on a particular day, click on the Did not travel to campus" radio button. Friday, April 1st. Graduate Undergraduate Faculty Drove alone 41.6% 54.5% 15.9% 4.6% 14.2% 2 Persons in private vehicle 10.2% 8.9% 6.3% 1.3% 3.4% More than 2 persons in a private vehicle.7% 1.4% 1.4%.4%.6% Bicycle 12.4% 7.0% 31.4% 49.0% 39.6% Skateboard.7%.5% 5.2% 3.8% Vanpool.7% 3.8%.5%.5% Long distance bus 1.5% 1.4%.2%.4% Electric bicycle or Segway.5%.1% Motorcycle / Moped.7%.5% 1.9%.4%.6% Local MTD Bus 1.5% 6.6% 12.1% 6.4% 6.7% Train.5%.1% Walked or jogged.7%.9% 6.3% 18.2% 13.6% Did not travel to campus/your 29.2% 14.6% 23.2% 14.2% 16.4% UCSB worksite 100.0% 100.0% 100.0% 100.0% 100.0% Page 32
35 Question # 2A6 During the week of March 28, 2011 to April 1, 2011, how did you travel to the UCSB campus (or UCSB worksite)? Please choose a mode of travel for each day. If you did not travel to work on a particular day, click on the Did not travel to campus" radio button. Saturday, April 2nd. Graduate Undergraduate Faculty Drove alone 12.4% 9.0% 9.7% 2.0% 4.4% 2 Persons in private vehicle 1.5% 1.4% 3.4% 1.5% 1.7% More than 2 persons in a private vehicle.7%.5%.5%.7%.6% Bicycle 2.2%.9% 9.7% 25.0% 18.9% Skateboard 2.9% 2.0% Vanpool.5%.5%.2%.2% Long distance bus.5%.2%.2% Electric bicycle or Segway.5%.1% Motorcycle / Moped.0%.5%.5%.4% Local MTD Bus.7%.5% 3.4% 3.3% 2.8% Train.2%.1% Walked or jogged.7% 4.8% 13.2% 9.9% Did not travel to campus/your 81.8% 86.8% 67.1% 50.5% 58.7% UCSB worksite 100.0% 100.0% 100.0% 100.0% 100.0% Page 33
36 Question # 2A7 During the week of March 28, 2011 to April 1, 2011, how did you travel to the UCSB campus (or UCSB worksite)? Please choose a mode of travel for each day. If you did not travel to work on a particular day, click on the Did not travel to campus" radio button. Sunday, April 3rd. Graduate Undergraduate Faculty Drove alone 11.6% 8.0% 9.2% 2.3% 4.4% Persons in private vehicle.7%.9% 1.0% 1.1% 1.0% More than 2 persons in a private vehicle.0%.5% 1.2%.9% Bicycle 2.9%.9% 9.7% 23.2% 17.7% Skateboard 3.0% 2.1% Vanpool.5%.2%.2% Long distance bus.5%.2%.2% Motorcycle / Moped.4%.3% Local MTD Bus.7%.5% 2.4% 2.3% 2.0% Train.2%.2% Walked or jogged.0% 3.9% 12.9% 9.5% Did not travel to campus/your 84.1% 88.7% 73.3% 53.1% 61.7% UCSB worksite 100.0% 100.0% 100.0% 100.0% 100.0% Page 34
37 Question # 3A1 If during the week of March 28, 2011 to April 1, 2011, if you DID NOT travel to campus on any particular day, please indicate the reason below. Monday, March 28th. Faculty Regular Day Off 14.3% 23.1% 18.5% Vacation 3.6% 46.2% 24.1% Sick 3.8% 1.9% Telecommuted (worked at home) 32.1% 11.5% 22.2% Compressed Work Week Day Off 3.6%.0% 1.9% Jury Duty 3.8% 1.9% Other 46.4% 11.5% 29.6% 100.0% 100.0% 100.0% Page 35
38 Question # 3A2 If during the week of March 28, 2011 to April 1, 2011, if you DID NOT travel to campus on any particular day, please indicate the reason below. Tuesday, March 29th. Faculty Regular Day Off 16.7% 10.5% 14.3% Vacation 3.3% 52.6% 22.4% Sick 3.3% 5.3% 4.1% Telecommuted (worked at home) 33.3% 15.8% 26.5% Compressed Work Week Day Off 3.3% 2.0% Other 40.0% 15.8% 30.6% 100.0% 100.0% 100.0% Page 36
39 Question # 3A3 If during the week of March 28, 2011 to April 1, 2011, if you DID NOT travel to campus on any particular day, please indicate the reason below. Wednesday, March 30th. Faculty Regular Day Off 6.9% 16.7% 10.6% Vacation 3.4% 61.1% 25.5% Sick 3.4% 5.6% 4.3% Telecommuted (worked at home) 31.0% 5.6% 21.3% Compressed Work Week Day Off 3.4% 2.1% Other 51.7% 11.1% 36.2% 100.0% 100.0% 100.0% Page 37
40 Question # 3A4 If during the week of March 28, 2011 to April 1, 2011, if you DID NOT travel to campus on any particular day, please indicate the reason below. Thursday, March 31st. Faculty Regular Day Off 16.7% 13.6% 15.4% Vacation 3.3% 54.5% 25.0% Sick 9.1% 3.8% Telecommuted (worked at home) 30.0% 9.1% 21.2% Compressed Work Week Day Off 3.3% 1.9% Other 46.7% 13.6% 32.7% 100.0% 100.0% 100.0% Page 38
41 Question # 3A5 If during the week of March 28, 2011 to April 1, 2011, if you DID NOT travel to campus on any particular day, please indicate the reason below. Friday, April 1st. Faculty Regular Day Off 17.9% 20.0% 18.9% Vacation 10.3% 45.7% 27.0% Sick 14.3% 6.8% Telecommuted (worked at home) 30.8% 5.7% 18.9% Compressed Work Week Day Off 5.7% 2.7% Other 41.0% 8.6% 25.7% 100.0% 100.0% 100.0% Page 39
42 Question # 3A6 If during the week of March 28, 2011 to April 1, 2011, if you DID NOT travel to campus on any particular day, please indicate the reason below. Saturday, April 2nd. Faculty Regular Day Off 69.0% 93.9% 83.9% Vacation 1.0% 2.0% 1.6% Sick.0%.0% Telecommuted (worked at home) 17.0%.7% 7.3% Compressed Work Week Day Off 1.0%.0%.4% Other 12.0% 3.4% 6.9% 100.0% 100.0% 100.0% Page 40
43 Question # 3A7 If during the week of March 28, 2011 to April 1, 2011, if you DID NOT travel to campus on any particular day, please indicate the reason below. Sunday, April 3rd. Faculty Regular Day Off 70.3% 93.4% 84.2% Vacation 1.0% 2.6% 2.0% Sick.0%.0% Telecommuted (worked at home) 15.8%.0% 6.3% Compressed Work Week Day Off 1.0%.0%.4% Other 11.9% 3.9% 7.1% 100.0% 100.0% 100.0% Page 41
44 Question # 3B Please indicate type of compressed work schedule Faculty 4/40 (worked 40 hours in 4 days) 33.3% 16.7% 9/80 (worked 80 hours in 9 days) 33.3% 33.3% 33.3% Other 66.7% 33.3% 50.0% 100.0% 100.0% 100.0% Page 42
45 Question #TIMEA1 During the week of March 28, 2011 to April 1, 2011, what time did you arrive at the UCSB Campus (or your UCSB worksite)? Monday, March 28th. Graduate Undergraduate Faculty 12am to 6am.9% 1.0%.5% 2.5% 2.0% 6am to 9am 47.0% 82.6% 40.1% 32.9% 40.5% 9am to 12pm noon 38.3% 8.5% 39.6% 43.8% 38.8% 12 pm to 5pm 5.2% 2.0% 7.5% 12.3% 10.1% 5pm to 12am.9%.0%.5% 1.4% 1.1% Did not travel to campus / UCSB 7.8% 6.0% 11.8% 7.1% 7.5% Worksite 100.0% 100.0% 100.0% 100.0% 100.0% Page 43
46 Question #TIMEA2 During the week of March 28, 2011 to April 1, 2011, what time did you arrive at the UCSB Campus (or your UCSB worksite)? Tuesday, March 29th. Graduate Undergraduate Faculty 12am to 6am 2.6% 2.0% 1.1% 2.5% 2.3% 6am to 9am 44.8% 80.7% 36.4% 34.4% 40.8% 9am to 12pm noon 34.5% 10.4% 42.8% 43.1% 38.6% 12 pm to 5pm 5.2% 2.0% 9.1% 12.9% 10.7% 5pm to 12am.9%.5%.5% 1.1%.9% Did not travel to campus / UCSB 12.1% 4.5% 10.2% 5.9% 6.7% Worksite 100.0% 100.0% 100.0% 100.0% 100.0% Page 44
47 Question #TIMEA3 During the week of March 28, 2011 to April 1, 2011, what time did you arrive at the UCSB Campus (or your UCSB worksite)? Wednesday, March 30th. Graduate Undergraduate Faculty 12am to 6am 1.7% 2.5% 1.1% 2.5% 2.3% 6am to 9am 47.8% 81.4% 41.5% 35.2% 42.2% 9am to 12pm noon 34.8% 10.1% 41.0% 42.2% 37.8% 12 pm to 5pm 6.1% 2.0% 10.1% 12.0% 10.2% 5pm to 12am.5%.5% 2.1% 1.6% Did not travel to campus / UCSB 9.6% 3.5% 5.9% 6.0% 5.9% Worksite 100.0% 100.0% 100.0% 100.0% 100.0% Page 45
48 Question #TIMEA4 During the week of March 28, 2011 to April 1, 2011, what time did you arrive at the UCSB Campus (or your UCSB worksite)? Thursday, March 31st. Graduate Undergraduate Faculty 12am to 6am 1.8% 3.0% 1.1% 2.9% 2.7% 6am to 9am 43.9% 78.1% 36.9% 34.3% 40.4% 9am to 12pm noon 39.5% 10.4% 42.2% 43.6% 39.2% 12 pm to 5pm 4.4% 2.5% 11.8% 12.1% 10.4% 5pm to 12am.5%.5%.8%.7% Did not travel to campus / UCSB 10.5% 5.5% 7.5% 6.3% 6.6% Worksite 100.0% 100.0% 100.0% 100.0% 100.0% Page 46
49 Question #TIMEA5 During the week of March 28, 2011 to April 1, 2011, what time did you arrive at the UCSB Campus (or your UCSB worksite)? Friday, April 1st. Graduate Undergraduate Faculty 12am to 6am 1.8% 3.0% 2.2% 2.0% 2.2% 6am to 9am 37.2% 74.6% 33.9% 27.1% 34.1% 9am to 12pm noon 38.9% 10.2% 33.3% 38.5% 34.6% 12 pm to 5pm 3.5% 2.5% 9.3% 11.6% 9.8% 5pm to 12am.0% 2.2% 1.6% 1.4% Did not travel to campus / UCSB 18.6% 9.6% 19.1% 19.1% 18.0% Worksite 100.0% 100.0% 100.0% 100.0% 100.0% Page 47
50 Question #TIMEA6 During the week of March 28, 2011 to April 1, 2011, what time did you arrive at the UCSB Campus (or your UCSB worksite)? Saturday, April 2nd. Graduate Undergraduate Faculty 12am to 6am 1.0%.0%.6% 1.5% 1.2% 6am to 9am 2.0% 6.9% 5.7% 5.1% 5.1% 9am to 12pm noon 7.9% 4.0% 10.9% 12.5% 11.1% 12 pm to 5pm 11.9% 1.7% 14.4% 9.7% 9.5% 5pm to 12am 1.0% 1.2%.6% 3.1% 2.5% Did not travel to campus / UCSB 76.2% 86.1% 67.8% 68.1% 70.6% Worksite 100.0% 100.0% 100.0% 100.0% 100.0% Page 48
51 Question #TIMEA7 During the week of March 28, 2011 to April 1, 2011, what time did you arrive at the UCSB Campus (or your UCSB worksite)? Sunday, April 3rd. Graduate Undergraduate Faculty 12am to 6am.0%.6% 1.5% 1.1% 6am to 9am 3.0% 5.8% 4.7% 5.2% 5.1% 9am to 12pm noon 9.0% 2.3% 6.4% 11.5% 9.8% 12 pm to 5pm 8.0% 2.3% 11.6% 7.2% 7.2% 5pm to 12am 1.0% 1.2% 3.5% 5.5% 4.5% Did not travel to campus / UCSB 79.0% 88.3% 73.3% 69.1% 72.2% Worksite 100.0% 100.0% 100.0% 100.0% 100.0% Page 49
52 Question #TIMEB1 During the week of March 28, 2011 to April 1, 2011, what time did you depart the UCSB Campus (or your UCSB worksite)? Monday, March 28th. Graduate Undergraduate Faculty 12am to 6am.0% 1.7% 1.6% 1.3% 6am to 9am.9% 1.5% 1.1% 2.1% 1.9% 9am to 12pm noon 1.8%.5% 2.8% 10.0% 7.6% 12 pm to 5pm 30.3% 44.3% 26.3% 50.5% 45.8% 5pm to 12am 62.4% 47.9% 58.7% 28.8% 36.4% Did not travel to campus / UCSB 4.6% 5.7% 9.5% 7.0% 6.9% Worksite 100.0% 100.0% 100.0% 100.0% 100.0% Page 50
53 Question #TIMEB2 During the week of March 28, 2011 to April 1, 2011, what time did you depart the UCSB Campus (or your UCSB worksite)? Tuesday, March 29th. Graduate Undergraduate Faculty 12am to 6am.5% 1.1% 1.1% 1.0% 6am to 9am 1.5%.5% 2.1% 1.7% 9am to 12pm noon 1.9% 1.0% 2.7% 7.5% 5.9% 12 pm to 5pm 27.8% 42.6% 27.5% 50.3% 45.4% 5pm to 12am 61.1% 50.3% 59.3% 33.2% 39.9% Did not travel to campus / UCSB 9.3% 4.1% 8.8% 5.8% 6.2% Worksite 100.0% 100.0% 100.0% 100.0% 100.0% Page 51
54 Question #TIMEB3 During the week of March 28, 2011 to April 1, 2011, what time did you depart the UCSB Campus (or your UCSB worksite)? Wednesday, March 30th. Graduate Undergraduate Faculty 12am to 6am.5% 1.1% 1.2% 1.0% 6am to 9am.9% 1.5% 1.1% 1.9% 1.7% 9am to 12pm noon.9% 1.0% 3.8% 8.7% 6.7% 12 pm to 5pm 29.4% 45.2% 32.2% 53.4% 48.5% 5pm to 12am 61.5% 48.2% 56.8% 29.2% 36.6% Did not travel to campus / UCSB 7.3% 3.6% 4.9% 5.6% 5.4% Worksite 100.0% 100.0% 100.0% 100.0% 100.0% Page 52
55 Question #TIMEB4 During the week of March 28, 2011 to April 1, 2011, what time did you depart the UCSB Campus (or your UCSB worksite)? Thursday, March 31st. Graduate Undergraduate Faculty 12am to 6am.5% 1.1% 1.5% 1.2% 6am to 9am.9% 1.5% 1.1% 1.9% 1.7% 9am to 12pm noon 1.8%.5% 2.7% 9.5% 7.2% 12 pm to 5pm 25.7% 44.7% 30.1% 52.8% 47.5% 5pm to 12am 62.4% 47.7% 58.5% 28.4% 36.3% Did not travel to campus / UCSB 9.2% 5.1% 6.6% 5.9% 6.1% Worksite 100.0% 100.0% 100.0% 100.0% 100.0% Page 53
56 Question #TIMEB5 During the week of March 28, 2011 to April 1, 2011, what time did you depart the UCSB Campus (or your UCSB worksite)? Friday, April 1st. Graduate Undergraduate Faculty 12am to 6am.5% 1.1% 1.4% 1.2% 6am to 9am 1.6% 1.1% 1.9% 1.7% 9am to 12pm noon 1.9%.5% 3.4% 16.2% 12.0% 12 pm to 5pm 31.8% 45.6% 26.4% 44.5% 41.8% 5pm to 12am 50.5% 42.5% 50.0% 17.8% 26.5% Did not travel to campus / UCSB 15.9% 9.3% 18.0% 18.2% 16.9% Worksite 100.0% 100.0% 100.0% 100.0% 100.0% Page 54
57 Question #TIMEB6 During the week of March 28, 2011 to April 1, 2011, what time did you depart the UCSB Campus (or your UCSB worksite)? Saturday, April 2nd. Graduate Undergraduate Faculty 12am to 6am 1.8% 1.5% 1.3% 6am to 9am.6%.7%.6% 9am to 12pm noon 3.4% 1.8% 3.0% 3.0% 2.9% 12 pm to 5pm 11.2% 7.1% 14.2% 15.3% 14.1% 5pm to 12am 12.4% 5.3% 14.8% 12.6% 12.0% Did not travel to campus / UCSB 73.0% 85.2% 66.3% 66.8% 69.1% Worksite 100.0% 100.0% 100.0% 100.0% 100.0% Page 55
58 Question #TIMEB7 During the week of March 28, 2011 to April 1, 2011, what time did you depart the UCSB Campus (or your UCSB worksite)? Sunday, April 3rd. Graduate Undergraduate Faculty 12am to 6am 1.2% 1.5% 1.2% 6am to 9am.0%.6%.5%.4% 9am to 12pm noon 2.2% 1.2% 2.4% 1.8% 1.8% 12 pm to 5pm 9.0% 5.9% 9.7% 14.0% 12.3% 5pm to 12am 12.4% 5.3% 13.3% 13.8% 12.7% Did not travel to campus / UCSB 76.4% 87.6% 72.7% 68.4% 71.5% Worksite 100.0% 100.0% 100.0% 100.0% 100.0% Page 56
59 Question #DRIVER Did you drive a motor vehicle to commute to the UCSB campus (or your UCSB worksite) during the week of March 28, 2011 to April 1, 2011? Graduate Undergraduate Faculty Yes 94.5% 93.6% 86.9% 74.9% 86.5% No 5.5% 6.4% 13.1% 25.1% 13.5% 100.0% 100.0% 100.0% 100.0% 100.0% Page 57
60 Question #54A Estimated miles per gallon of the motor vehicle you use to travel to campus N Valid 481 Missing 1436 Mean Median Mode 25 Page 58
61 Question #54B What is the year of of the motor vehicle you use to travel to the UCSB campus (or your UCSB worksite)? N Valid 492 Missing 1425 Mean Median 2003 Mode 2001 Page 59
62 Question #54E Is the motor vehicle you use to travel to the UCSB campus (or your UCSB worksite) a Hybrid? Graduate Undergraduate Faculty Hybrid 9.6% 6.3% 5.5% 2.2% 5.7% No 90.4% 93.1% 94.5% 93.4% 92.9% Unsure / Do not know.6% 4.4% 1.4% 100.0% 100.0% 100.0% 100.0% 100.0% Page 60
63 Question #54F What fuel type does the motor vehicle you use to travel to the UCSB campus (or your UCSB worksite) use? Graduate Undergraduate Faculty Gasoline 98.1% 99.4% 100.0% 98.5% 99.0% Diesel 1.0%.0%.2% Bio-diesel.0%.0% Ethanol-85.0%.0% Other.6%.2% Unsure / Do not know 1.0% 1.5%.6% 100.0% 100.0% 100.0% 100.0% 100.0% Page 61
64 Question #COUNTY In what county do you reside? Graduate Undergraduate Faculty Santa Barbara County 90.8% 93.8% 89.9% 88.0% 89.1% San Luis Obispo County.8%.5% 1.0%.2%.3% Ventura County 5.3% 4.8% 3.5% 2.1% 2.8% Other 3.1% 1.0% 5.6% 9.8% 7.7% 100.0% 100.0% 100.0% 100.0% 100.0% Page 62
65 Question #MAP Which area of Goleta do you live in? Please locate the numbered area on this map that includes your home, and select the corresponding number in the list below. If your home is not on this map, please select "Other. Graduate Undergraduate Faculty Area 1: Northwest Goleta (North of 101, up to Glenn Annie) Area 2: North Goleta (North of 101, between Glenn Annie and N. Fairview) Area 3: North East Goleta (North of 101, East of N. Fairview) Area 4: South East Goleta (East of 217/Ward Memorial Drive) Area 5: Old Town Goleta (South of 101, from Los Carneros to 217) Area 6: Isla Vista (South of El Colegio, from Campus to Deveraux area) Area 7: South West Goleta (South of 101, West of Los Carneros and Isla Vista) 14.6% 24.5% 5.6% 2.2% 4.4% 14.6% 18.9% 3.7% 1.9% 3.6% 12.2% 3.8%.7%.0% 1.9% 1.2% 1.2% 9.8% 9.4% 6.5%.8% 2.4% 14.6% 7.5% 43.9% 84.4% 72.3% 34.1% 35.8% 34.6% 8.7% 14.3% Other.0% 3.7%.8% 1.1% 100.0% 100.0% 100.0% 100.0% % Page 63
66 Question #MILES Approximately how many miles do you commute one-way from your residence to the UCSB campus (or your UCSB worksite)? N Valid 1725 Missing 192 Mean 7.91 Median 1.00 Mode 1 Page 64
67 Question #WL1 Are you aware of the UCSB Flexwork Program? Yes 29.6% 29.6% Yes, I heard about it but I m not familiar with the details 28.6% 28.6% No 41.7% 41.7% 100.0% 100.0% Page 65
68 Question #WL2 What is your current work schedule? Regular 5/40 work week (work 40 hours in 5 days) 82.8% 82.8% 4/40 (work 40 hours in 4 days) 1.5% 1.5% 3/36 (work hours in 3 days).0%.0% 9/80 (work 80 hours in 9 days) 2.0% 2.0% Telecommute from home 1 day/week.5%.5% Telecommute from home more than 2 days/week.0%.0% Flexible time 4.5% 4.5% Other 8.6% 8.6% 100.0% 100.0% Page 66
69 Question #WL3 In your opinion, would your job duties allow for (check all that apply): In your opinion, would your job duties Count allow for Telecommuting % within group 39.0% In your opinion, would your job duties allow for Compressed work week schedule None of the above Count % within group 45.8% Count % within group 43.0% Count Page 67
70 Question #TC1 What best describes your situation: I am interested in telecommuting 74.6% 74.6% I am interested in telecommuting, but I don t have the necessary equipment or expertise 12.7% 12.7% I am not interested in telecommuting 12.7% 12.7% 100.0% 100.0% Page 68
71 Question #TC2 How comfortable would you be talking to your supervisor about telecommuting?: Very comfortable 40.0% 40.0% Comfortable 21.8% 21.8% Neutral 20.0% 20.0% Uncomfortable 14.5% 14.5% Very uncomfortable 3.6% 3.6% 100.0% 100.0% Page 69
72 Question #TC3 If your supervisor offered you telecommuting equipment, how often do you think you would telecommute on average?: Less than one day per week 10.0% 10.0% One day per week 45.0% 45.0% Two days per week 35.0% 35.0% Three days per week 10.0% 10.0% Four days per week.0%.0% Everyday.0%.0% 100.0% 100.0% Page 70
73 Question #CW1 What best describes your situation: I am interested in an alternative work schedule/compressed work week. 80.0% 80.0% I am not interested in an alternative work 20.0% 20.0% schedule/compressed work week % 100.0% Page 71
74 Question #CW2 If you could choose, what do you think would work best for you and still be compatible with your work duties? Regular 5/40 work week (work 40 hours in 5 days) 8.3% 8.3% 4/40 (work 40 hours in 4 days) 58.3% 58.3% 3/36 (work hours in 3 days) 3.3% 3.3% 9/80 (work 80 hours in 9 days) 21.7% 21.7% Other 8.3% 8.3% 100.0% 100.0% Page 72
75 Question #CW3 How comfortable would you be talking to your supervisor about alternative work schedule/compressed work week? Very comfortable 31.7% 31.7% Comfortable 26.7% 26.7% Neutral 25.0% 25.0% Uncomfortable 13.3% 13.3% Very uncomfortable 3.3% 3.3% 100.0% 100.0% Page 73
76 Question #SUPER Do you supervise any employees? Yes 42.4% 42.4% No 57.6% 57.6% 100.0% 100.0% Page 74
77 Question #SUPER 1A1 If your employees job duties permitted it, would you agree to allow them to: Telecommute Yes 60.2% 60.2% No 39.8% 39.8% 100.0% 100.0% Page 75
78 Question #SUPER 1A2 If your employees job duties permitted it, would you agree to allow them to: Choose an alternative or compressed work schedule. Yes 82.4% 82.4% No 17.6% 17.6% 100.0% 100.0% Page 76
79 Appendix 1 UCSB Commuter Mode-Split Data : indicator data Faculty/ (11) (12) Fall 2002 (13) 2006 (14) 2008 (18) 2010 (19) 2011 (20) Single Occupant Motor Vehicle 78% 79% 68% 65% 53% 55% 51% Motorcycle n/a n/a n/a n/a 1% 1% 1% Did not travel to campus n/a n/a n/a n/a 11% 11% 15% Carpool/vanpool 8% 12% 16% 17% 18% 16% 16% Bus 4% 4% 5% 7% 6% 6% 6% Bike 9% 6% 10% 9% 9% 10% 10% Walk 2% 2% 1% 1% 1% 1% 1% Other n/a n/a n/a n/a 3% 0% 1% alt transportation 23% 24% 32% 34% 34% 32% 34% Students (12) Fall 2002 (17) 2010 (19) 2011 (20) Single Occupant Motor Vehicle 22% 4,130 19% 3,906 11% 7% Motorcycle n/a n/a n/a n/a 1% 1% Did not travel to campus n/a n/a n/a n/a 9% 8% Carpool/Vanpool 3% 463 3% 617 4% 3% Bus 5% 944 6% 1,234 10% 7% Bike 53% 9,815 49% 10,074 46% 51% Walk 15% 2,778 23% 4,729 17% 18% Other n/a n/a n/a n/a 4% 6% alt transportation 76% 14,000 81% 16,653 80% 85% 11 "Housing and Transportation Survey: Survey and Cross Tab Data." Santa Barbara, California: University of California, Santa Barbara, Office of Budget and Planning, May "University of California, Santa Barbara, Student, Faculty, and Housing and Transportation Survey." Ira Fink and Associates, Inc. June UCSB Budget and Planning Fall 2002 Housing Survey Results for Primary Commute Mode Faculty and Housing Survey prepared by Institutional Research 15 To and From Campus: Changing Student Transportation Patterns. Prepared by Ira Fink. Berkeley, California: University of California, Office of the President, October 1974, p University of California, Santa Barbara, Student Housing and Transportation Survey, Winter Quarter 1975, Unpublished Data. 17 UCSB Budget and Planning Fall 2002 Survey Results for Primary Commute Mode. 18 UCSB Budget and Planning Fall 2008 Housing Survey Results for Primary Commute Mode. 19 UCSB Social Science Survey Center Winter 2010 UCSB Transportation Study. 20 UCSB Social Science Survey Center Spring 2011 UCSB Transportation Study.

80 Appendix 2: Map of Areas in 93117
Yale University 2017 Transportation Survey Report February 2018
 Walking and riding trollies to Yale Bowl for a football game. Photo courtesy of Yale University. Yale University 2017 Transportation Survey Report February 2018 A campus-wide transportation survey was
RESULTS OF THE CAMPUS TRAVEL SURVEY
 RESULTS OF THE 2016-17 CAMPUS TRAVEL SURVEY Institute of Transportation Studies and Transportation and Parking Services University of California, Davis Prepared by Drew Heckathorn Under the Direction of
Valley Metro TDM Survey Results Spring for
 Valley Metro TDM Survey Results 2017 Spring 2017 for P a g e ii Table of Contents Section: Page #: Executive Summary... iv Conclusions... viii I. Introduction... 1 A. Background and Methodology... 1 B.
ADDENDUM TO THE CAMPUS TRAVEL SURVEY AND THE CAMPUS TRAVEL SURVEY REPORTS
 ADDENDUM TO THE 2015-16 CAMPUS TRAVEL SURVEY AND THE 2016-17 CAMPUS TRAVEL SURVEY REPORTS Institute of Transportation Studies and Transportation and Parking Services University of California, Davis Prepared
Telecommuting Patterns and Trends in the Pioneer Valley
 Telecommuting Patterns and Trends in the Pioneer Valley August 2011 Prepared under the direction of the Pioneer Valley Metropolitan Planning Organization Prepared by: Pioneer Valley Planning Commission
AIG Asia Pacific Insurance Pte. Ltd. List of Approved Reporting Centres
 AUTHORISED WORKSHOPS 1. ComfortDelGro Engineering Pte Ltd 205 Braddell Road Singapore 579701 2. Kan Fook Sing Motor Workshop 61 Defu Lane 12 Singapore 539147 3. Lai Huat (Meng Kee) Motor Pte Ltd 160 Sin
Employee Telecommuting Study
 Employee Telecommuting Study June Prepared For: Valley Metro Valley Metro Employee Telecommuting Study Page i Table of Contents Section: Page #: Executive Summary and Conclusions... iii I. Introduction...
SCSPC STAFF REPORT. Peak Hour Rail Service Update. MEETING DATE: February 14, 2018 AGENDA ITEM: 5 RECOMMENDATION:
 SCSPC STAFF REPORT SUBJECT: Peak Hour Rail Service Update MEETING DATE: February 14, 2018 AGENDA ITEM: 5 STAFF CONTACT: Scott Spaulding RECOMMENDATION: 1. Recommend the board approve a Memorandum of Understanding
AIG ASIA PACIFIC INSURANCE PTE. LTD. List of Approved Reporting Centres AIG 24-HOURS HOTLINE :
 AIG ASIA PACIFIC INSURANCE PTE. LTD. List of Approved Reporting Centres AIG 24-HOURS HOTLINE : 6338-6200 AUTHORISED WORKSHOPS CONTACT NOS. 1. ComfortDelGro Engineering Pte Ltd Tel: 6383-7118 / 6383-7466
Future Trends & Themes Summary. Presented to Executive Steering Committee: April 12, 2017
 Future Trends & Themes Summary Presented to Executive Steering Committee: April 12, 2017 Vision Workshop Regional/Local Themes The region and the Prince William area share the following key themes: Future
Safe Harbor. This presentation may contain forwardlooking statements regarding events or
 2010 Deutsche Bank Small and Mid Cap Conference UNIVERSAL TECHNICAL INSTITUTE February 9, 2010 1 Safe Harbor This presentation may contain forwardlooking statements regarding events or future financial
CASE STUDY: OVERVIEW OF A UNIVERSITY PROGRAM
 CASE STUDY: OVERVIEW OF A UNIVERSITY PROGRAM Example of Option #1: Pre-Tax Benefits Plus Secondary Measures (secondary measures not required with Option #1) San Jose State University (SJSU) is a public
SURVEY REPORT. National Capital Region Transportation Planning Board STATE OF THE COMMUTE. From the Metropolitan Washington DC Region
 2016 STATE OF THE COMMUTE SURVEY REPORT From the Metropolitan Washington DC Region National Capital Region Transportation Planning Board Metropolitan Washington Council of Governments State of the Commute
NEW EMPLOYER CASE STUDIES
 The Commuter Information Source for Maryland, Virginia, and the District of Columbia Issue 4, Volume 18 Fall 2014 WHAT S INSIDE 2 Metro s Silver Line Shines 3 2015 Employer Recognition Awards Call for
EVALUATION OF RIDEFINDERS FY 2012 TRANSPORTATION DEMAND MANAGEMENT (TDM) PROGRAM IMPACT
 PROGRAM IMPACT") EVALUATION OF RIDEFINDERS FY 2012 TRANSPORTATION DEMAND MANAGEMENT (TDM) PROGRAM IMPACT FINAL REPORT (11-5-12) Prepared by: Southeastern Institute of Research, Inc. Richmond, Virginia & LDA Consulting
EVALUATION OF RIDEFINDERS FY 2012 TRANSPORTATION DEMAND MANAGEMENT (TDM) PROGRAM IMPACT FINAL REPORT (11-5-12) Prepared by: Southeastern Institute of Research, Inc. Richmond, Virginia & LDA Consulting
ADJOURNMENT TO THE REGULAR MEETING, 5 P.M., MONDAY, January 23, 2016, in Room 101, Community Services Building, 150 N.
 CITY OF BURBANK AGENDA FOR THE TRANSPORTATION COMMISSION MEETING Monday, December 12, 2016, 5:00 p.m. Community Services Building, Room 101, 150 North Third Street This agenda contains a summary of each
FILE // 2013 CARS MANUAL WIRING DIAGRAM TRANSMISSION
 20 November, 2017 FILE // 2013 CARS MANUAL WIRING DIAGRAM TRANSMISSION Document Filetype: PDF 438.4 KB 0 FILE // 2013 CARS MANUAL WIRING DIAGRAM TRANSMISSION A Transmission On 2003 Honda Civic Hybrid Engine
Mississauga Transportation Survey June 2005 Survey Overview
 Mississauga Transportation Survey June 2005 Survey Overview The on-line Mississauga Transportation Survey link was sent out via postcard and e-mail to the Board of Trade s list of Mississauga employers.
REQUEST FOR PROPOSALS FOR: CITY MANAGER RECRUITMENT SERVICES. City of Walnut Creek 1666 N. Main Street Walnut Creek, CA 94596
 REQUEST FOR PROPOSALS FOR: CITY MANAGER RECRUITMENT SERVICES City of Walnut Creek Attn: Ken Nordhoff, City Manager Nordhoff@walnut-creek.org Release Date: Friday, October 24, 2016 Proposals Due: Friday,
California State University, Northridge Academic Affairs REPORT Ad Hoc Group to Recommend Course Scheduling Alternatives August 24, 2005
 DRAFT FOR DISCUSSION California State University, Northridge Academic Affairs REPORT Ad Hoc Group to Recommend Course Scheduling Alternatives August 24, 2005 Charge: Provost Hellenbrand 1. We've had expressions
American Home Assurance Company, Singapore Branch List of Approved Reporting Centres AHA 24-HOURS HOTLINE :
 American Home Assurance Company, Branch List of Approved Reporting Centres AHA 24-HOURS HOTLINE : 6338-6200 Authorised Workshops Contact Nos. 1. Ban Choon Motor Tel: 6264-1191/ 9204-2006 3 Pioneer Road
STATE ECONOMIC IMPACT STUDY
 STATE ECONOMIC IMPACT STUDY Honda Mercedes-Benz Honda Volkswagen Porsche Hyundai Hyundai Mercedes-Benz Kia 264 GEORGIA INTERNATIONAL AUTOMAKERS IN GEORGIA ALPHARETTA AMERICAN HONDA FINANCE CORPORATION
Catmobile. May 2, Environmental Science II. Investigators: Kvochak, Lewis, McIntyre, Radomile
 Catmobile 1 Catmobile May 2, 2013 Environmental Science II Investigators: Kvochak, Lewis, McIntyre, Radomile Affiliation: Dept. of Geography & the Environment, Villanova University, 800 Lancaster Ave.,
Safety and Risk Management Operations Manual
 Safety and Risk Management Operations Manual Risk management: a process of systematically eliminating or minimizing the adverse impact of all activities and events that may give rise to dangerous situations.
MECKLENBURG COUNTY July 30, 2003
 MECKLENBURG COUNTY July 30, 2003 Commuter Choice Employee Benefits Program Implementation Plan In an effort to attract and retain top quality employees, Mecklenburg County is continuously looking for new
NO X O 3. CH 4 VOCs CO 2
 A T h e o r e t i c a l A n a l y s i s o f The Effectiveness of Transportation Demand Management Strategies In Reducing Greenhouse Gas Emissions N 2 O NO X O 3 CO 2 CH 4 VOCs HFCs August 1, 2010 Dulles
Passenger Car Market. Greece Short Presentation
 Greece Short Presentation March 2017 Contents Executive Summary 3 Macroeconomic Environment 5 Passenger Car Market 9 2017 Deloitte Business Solutions S.A. Passenger Car Market - Greece 2 Executive Summary
AB 2766 DMV Fund Program - Screening Proposals
 Gretchen Bennitt, Executive Director. DISTRICT HEADQUARTERS 200 Litton Drive, Suite 320 Grass Valley, CA 95945 (530) 274-9360 / FAX: (530) 274-7546 www.myairdistrict.com NORTHERN FIELD OFFICE 257 E. Sierra,
UNIVERSITY OF CALIFORNIA, SANTA CRUZ
 UNIVERSITY OF CALIFORNIA, SANTA CRUZ BERKELEY DAVIS IRVINE LOS ANGELES MERCED RIVERSIDE SAN DIEGO SAN FRANCISCO SANTA BARBARA SANTA CRUZ PHYSICAL PLANNING, DEVELOPMENT & OPERATIONS UC SANTA CRUZ, CALIFORNIA
Hit your target audience
 ACCESS CONTROL COMMERCIAL SECURITY Ackerman Security Systems Card Access, Digital/Internet CCTV, Fire/Burg. 770-552-1111 www.ackermansecurity.com COMMERCIAL PLUMBING SERVICES EMC Security Intrusion/Fire
Transportation Demand Management Workshop Region of Peel. Stuart M. Anderson David Ungemah Joddie Gray July 11, 2003
 Transportation Demand Management Workshop Region of Peel Stuart M. Anderson David Ungemah Joddie Gray July 11, 2003 Why Transportation Demand Management (TDM)? Demand management measures support a sustainable
D',,1!lD,Qjrmrzl1ll'l.
 IUI:nne 0 if D',,1!lD,Qjrmrzl1ll'l.,-,.,,,-nJ'EJ"1, p J r ih ssistanc, fro"' SRF _onulting' rollp In. BLUE EARTH SAFETY REST AREA INTERSTATE 90 WESTBOUND 2001 USER SURVEY Prepared for Minnesota Department
AB 2766 DMV Fund Program - Screening Proposals
 Gretchen Bennitt, Executive Director. DISTRICT HEADQUARTERS 200 Litton Drive, Suite 320 Grass Valley, CA 95945 (530) 274-9360 / FAX: (530) 274-7546 www.myairdistrict.com NORTHERN FIELD OFFICE 257 E. Sierra,
CITY OF LOS ANGELES TELECOMMUTING PROJECT
 JALA International, Inc. CITY OF LOS ANGELES TELECOMMUTING PROJECT Final Report Executive Summary March 1993 This report was prepared as a result of work sponsored by the Department of Telecommunications.
Annual residents survey 2016 Council Perceptions Monitor (NZCPM ) Re p o r t J u n e
 Re p o r t J u n e") Annual residents survey 2016 (NZCPM ) Re p o r t J u n e 2 0 1 6 Introduction, Objectives and Methodology Page 2 Introduction: The Community Perceptions Monitor Study measures the perceptions of residents
Annual residents survey 2016 (NZCPM ) Re p o r t J u n e 2 0 1 6 Introduction, Objectives and Methodology Page 2 Introduction: The Community Perceptions Monitor Study measures the perceptions of residents
SMART TRIPS. Marketing Alternative Transportation in the City of Columbus, Ohio. Start Date: January 07, 2015 End Date: April 27, 2015
 SmartTrips Group 1620 North High St. Apt 326 Columbus, Ohio 43201 SMART TRIPS Marketing Alternative Transportation in the City of Columbus, Ohio Start Date: January 07, 2015 End Date: April 27, 2015 Analysis
Transportation & Parking Advisory Committee
 December 6, 2017 Transportation & Parking Advisory Committee Scott Silsdorf, AICP Director of Transportation and Parking Services Agenda Introductions Department Updates Mobile App is live Spring semester
BROWARD COUNTY TRANSIT MAJOR SERVICE CHANGE TO 595 EXPRESS SUNRISE - FORT LAUDERDALE. A Title VI Service Equity Analysis
 BROWARD COUNTY TRANSIT MAJOR SERVICE CHANGE TO 595 EXPRESS SUNRISE - FORT LAUDERDALE A Title VI Service Equity Analysis Prepared September 2015 Submitted for compliance with Title VI of the Civil Rights
2018 Regional Congestion Mitigation Air Quality Improvement Program (CMAQ) Grant Application
 Grant Application") 2018 Regional Congestion Mitigation Air Quality Improvement Program (CMAQ) Grant Application PROJECT TITLE: PROJECT SPONSOR Agency or Organization Contact Person OLYMPIA CAPITOL CAMPUS TAMING THE DRAGONS
2018 Regional Congestion Mitigation Air Quality Improvement Program (CMAQ) Grant Application PROJECT TITLE: PROJECT SPONSOR Agency or Organization Contact Person OLYMPIA CAPITOL CAMPUS TAMING THE DRAGONS
Minnesota s Marriage & Family Therapist (MFT) Workforce, 2015
 Workforce, 2015") OFFICE OF RURAL HEALTH AND PRIMARY CARE Minnesota s Marriage & Family Therapist (MFT) Workforce, 2015 HIGHLIGHTS FROM THE 2015 MFT WORKFORCE SURVEY i Overall According to the Board of Marriage and Family
OFFICE OF RURAL HEALTH AND PRIMARY CARE Minnesota s Marriage & Family Therapist (MFT) Workforce, 2015 HIGHLIGHTS FROM THE 2015 MFT WORKFORCE SURVEY i Overall According to the Board of Marriage and Family
Travel Reduction Program: Transportation Coordinator Training November 2, Leslie Keena Business Outreach Associate
 Travel Reduction Program: Transportation Coordinator Training November 2, 2015 Leslie Keena Business Outreach Associate lkeena@pagregion.com What is PAG? The Pima Association of Governments (PAG) is the
George Washington Region Scenario Planning Study Phase II
 George Washington Region Scenario Planning Study Phase II PhaseIIScenarioSummary This final section of the report presents a comparative summary of the regional and corridor level effects of the three
HEARTLAND RURAL MOBILITY PLAN (HRMP)
") Agenda Item 9 Glades-Hendry LCB 9/5/2012 HEARTLAND RURAL MOBILITY PLAN (HRMP) RECOMMENDED ACTION: At the Board s Discretion. Ms. Sherry Carver of the Central Florida Regional Planning Council will present
Agenda Item 9 Glades-Hendry LCB 9/5/2012 HEARTLAND RURAL MOBILITY PLAN (HRMP) RECOMMENDED ACTION: At the Board s Discretion. Ms. Sherry Carver of the Central Florida Regional Planning Council will present
2015 Emergency Management and Preparedness Final Report
 2015 Emergency Management and Preparedness Final Report May 29, 2015 TABLE OF CONTENTS 1.0 SUMMARY OF FINDINGS 3 2.0 PROJECT BACKGROUND 7 3.0 METHODOLOGY 8 3.1 Project Initiation and Questionnaire Review
UNIVERSITY OF CALIFORNIA, DAVIS AUDIT AND MANAGEMENT ADVISORY SERVICES. Counseling Services Audit & Management Advisory Services Project #17-67
 , DAVIS AUDIT AND MANAGEMENT ADVISORY SERVICES Counseling Services Audit & Management Advisory Services Project #17-67 December 2017 Fieldwork Performed by: Ryan Dickson, Senior Auditor Reviewed by: Tony
Regional Transportation Plan & Sustainable Communities Strategy. Public Participation Plan
 Regional Transportation Plan & Sustainable Communities Strategy Public Participation Plan September 17, 2015 Table of Contents I. Introduction... 1 II. Phases of the Public Participation Process... 2
2018 and 2020 Regional Congestion Mitigation Air Quality Improvement Program (CMAQ) Grant Application
 Grant Application") 2018 and 2020 Regional Congestion Mitigation Air Quality Improvement Program (CMAQ) Grant Application PROJECT TITLE: INTERCITY TRANSIT BUS STOP ENHANCEMENTS TRPC use only GENERAL PROJECT INFORMATION Agency
2018 and 2020 Regional Congestion Mitigation Air Quality Improvement Program (CMAQ) Grant Application PROJECT TITLE: INTERCITY TRANSIT BUS STOP ENHANCEMENTS TRPC use only GENERAL PROJECT INFORMATION Agency
University of California Research Initiatives Letter of Intent Submission Instructions for the President s Research Catalyst Awards
 University of California Research Initiatives Letter of Intent Submission Instructions for the President s Research Catalyst Awards 2016 Awards The University of California Office of the President is pleased
UBER: DRIVING UPSTATE JOBS New York State Economic Impact Report
 UBER: DRIVING UPSTATE JOBS INTRODUCTION From Buffalo to Albany, the Empire State is a state on the move. With economic revitalization in every corner of the State, New York is attracting companies like
STAFF REPORT. MEETING DATE: August 21, 2008 AGENDA ITEM: 9
 STAFF REPORT SUBJECT: Draft Regional Transportation Plan MEETING DATE: August 21, 2008 AGENDA ITEM: 9 STAFF CONTACT: Aubrey Spilde, Michael Powers RECOMMENDATION: Hold public hearing to receive public
APPLICATION FOR EMPLOYMENT
 APPLICATION FOR EMPLOYMENT Applicants for a home care aide position must have a current DC home health aide certification or had at least 125 hours of Home Care Aide training. Applicants for a CNA position
COMMUTER CONNECTIONS TRANSPORTATION DEMAND MANAGEMENT EVALUATION PROJECT
 COMMUTER CONNECTIONS TRANSPORTATION DEMAND MANAGEMENT EVALUATION PROJECT TRANSPORTATION EMISSION REDUCTION MEASURES (TERMS) REVISED EVALUATION FRAMEWORK FY2015 FY2017 Prepared for: National Capital Region
NOMINATION FOR 2008 TAC SUSTAINABLE URBAN TRANSPORTATION AWARD
 ONTARIO MINISTRY OF TRANSPORTATION NOMINATION FOR 2008 TAC SUSTAINABLE URBAN TRANSPORTATION AWARD Ontario Transportation Demand Management Municipal Grant Program Ontario Transportation Demand Management
Smart Commute North Toronto, Vaughan
 Case Studies in Sustainable Transportation GREATER TORONTO AREA AND HAMILTON, ONTARIO CASE STUDY 48 Organization Status Started 2001, ongoing Overview (NTV) is a not-for-profit transportation management
Solano County Transit (SolTrans) Overall Disadvantaged Business Enterprise (DBE) Goal FFY through FFY
 Overall Disadvantaged Business Enterprise (DBE) Goal FFY through FFY") Solano County Transit (SolTrans) Overall Disadvantaged Business Enterprise (DBE) Goal FFY 2016 17 through FFY 2018 19 Summary In accordance with the requirements of 49 C.F.R. Part 26 (Participation by
Solano County Transit (SolTrans) Overall Disadvantaged Business Enterprise (DBE) Goal FFY 2016 17 through FFY 2018 19 Summary In accordance with the requirements of 49 C.F.R. Part 26 (Participation by
Part I. Federal Section 5310 Program
 Part I. Federal Section 5310 Program ENHANCED MOBILITY OF SENIORS AND INDIVIDUALS WITH DISABILITIES FY 2017 Solicitation for Proposals 5 PROGRAM GOALS & FUND AVAILABILITY The goals of the Section 5310
ShareTheRide & Trip Reduction Program. For audio, please call: (312) , access code
 , access code") ShareTheRide & Trip Reduction Program For audio, please call: (312) 878-0218, access code 379-724-837 Objectives The purpose of the Trip Reduction ordinance is to reduce commute impacts on air pollution
ShareTheRide & Trip Reduction Program For audio, please call: (312) 878-0218, access code 379-724-837 Objectives The purpose of the Trip Reduction ordinance is to reduce commute impacts on air pollution
LAVC College Bulletin August 29-September 4, 2010
 LAVC College Bulletin August 29-September 4, 2010 This Issue s News & Events Welcome Back to LAVC! Fall 2010 Semester Starts August 30 The Fall 2010 Semester will begin at LAVC on Monday, August 30. Day
NAPA COUNTY GRAND JURY
 NAPA COUNTY GRAND JURY 2016-2017 June 22, 2017 FINAL REPORT NAPA VALLEY TRANSPORTATION AGENCY VISION 2040 PLAN County Traffic Problems Need a Comprehensive Plan with Measurable Results 2 NAPA VALLEY TRANSPORTATION
GreenCommute. The Nortel Networks Transportation Demand Management (TDM) Program. Presented by: Sharon Lewinson July 11, 2003
 Program. Presented by: Sharon Lewinson July 11, 2003") GreenCommute The Nortel Networks Transportation Demand Management (TDM) Program Presented by: Sharon Lewinson July 11, 2003 What is a TDM program? A TDM, or commuter options program, is any collection
GreenCommute The Nortel Networks Transportation Demand Management (TDM) Program Presented by: Sharon Lewinson July 11, 2003 What is a TDM program? A TDM, or commuter options program, is any collection
UCSF Long Range Development Plan (LRDP)
") UCSF Long Range Development Plan (LRDP) Further information: Lori Yamauchi Assistant Vice Chancellor Campus Planning Commission on Community Investment and Infrastructure August 20, 2013 UCSF Overview
UCSF Long Range Development Plan (LRDP) Further information: Lori Yamauchi Assistant Vice Chancellor Campus Planning Commission on Community Investment and Infrastructure August 20, 2013 UCSF Overview
SOUTH FLORIDA COMMUTER SERVICES CONTRACT SCOPE OF SERVICES
 SOUTH FLORIDA COMMUTER SERVICES CONTRACT SCOPE OF SERVICES 1.1 Purpose The South Florida Commuter Services VENDOR (hereinafter referred to as Vendor) for the Florida Department of Transportation (hereinafter
VMT and Trip Reduction Calculation Packet
 VMT and Trip Reduction Calculation Packet May 2015 ote: It is now optional for applicants to calculate the number of predicted trips and/or VMT reduced in the Project Benefits section of the application.
NEW EMPLOYER CASE STUDIES RELEASED
 Issue 4, Volume 19 Fall 2015 WHAT S INSIDE 3 2016 Employer Recognition Awards - Call for Nominations 3 Fairfax County Program Offers $50 in METRO Fare to Try Transit 4 Electric Car Charging Stations Sparking
NOMINATION FORM. All nomination materials must be submitted to by 4 p.m. on Wednesday, March 7, 2018.
 NOMINATION FORM All nomination materials must be submitted to awards@metrotransit.org by 4 p.m. on Wednesday, March 7, 2018. Directions The 2018 Commuter Choice Awards nominations will only be accepted
For additional information about ACT please contact: ACT National Headquarters phone: PO Box facsimile:
 This publication was made possible through a cooperative agreement between the Association for Commuter Transportation (ACT) and the United States Department of Transportation - Federal Highway Administration.
WAGE & LABOR AVAILABILITY REPORT FOR THE NORTH PLATTE, NEBRASKA STUDY AREA
 WAGE & LABR AVAILABILITY REPRT FR THE NRTH PLATTE, NEBRASKA STUDY AREA Final Report to the North Platte Area Chamber & Development Corporation November 1, 2013 Bree L. Dority, Ph.D. Department of Economics
INTRODUCTION. RTPO Model Program Guide February 27, 2007 Page 1
 TABLE OF CONTENTS INTRODUCTION... 1 HOW TO USE THIS GUIDE... 2 SECTION I: LAND USE AND TRANSPORTATION CONTEXT... 3 SECTION II: MINIMUM CRITERIA FOR GROWTH AND TRANSPORTATION EFFICIENCY CENTERS... 5 SECTION
In developing the program, as directed by the Board (Attachment A), staff used the following framework:
, staff used the following framework:") _... ~ Los Angeles County ~ T~"'-"- Metro One Gateway Plaza Los Angeles, CA 90012-2952 213.922.200C metro. net 15 REVISED PLANNING AND PROGRAMMING COMMITTEE SEPTEMBER 18, 2013 SUBJECT: ACTION: OPEN STREETS
_... ~ Los Angeles County ~ T~"'-"- Metro One Gateway Plaza Los Angeles, CA 90012-2952 213.922.200C metro. net 15 REVISED PLANNING AND PROGRAMMING COMMITTEE SEPTEMBER 18, 2013 SUBJECT: ACTION: OPEN STREETS
16 th Annual National Report Card on Health Care
 16 th Annual National Report Card on Health Care August 18, 2016 2016 National Report Card: Canadian Views on the New Health Accord July 2016 Ipsos Public Affairs 160 Bloor Street East, Suite 300 Toronto
Job Aid. ESS Travel Request by Privately Owned Vehicle (POV)
") ESS Travel Request by Privately Owned Vehicle Table of Contents Overview... 3 Objectives... 3 Enterprise Roles... 3 Create Travel Request by POV... 3 Fill in the General Data Page... 6 Fill in the Additional
ESS Travel Request by Privately Owned Vehicle Table of Contents Overview... 3 Objectives... 3 Enterprise Roles... 3 Create Travel Request by POV... 3 Fill in the General Data Page... 6 Fill in the Additional
PUBLIC TRANSPORTATION & COMMUTER VANPOOL PASSENGER SUBSIDY COMPONENT REMOVE II PROGRAM GUIDELINES, POLICIES, AND PROCEDURES
 PUBLIC TRANSPORTATION & COMMUTER VANPOOL PASSENGER SUBSIDY COMPONENT REMOVE II PROGRAM GUIDELINES, POLICIES, AND PROCEDURES SECTION I INTRODUCTION T he San Joaquin Valley Air Pollution Control District
REMOVE II Public Transportation Subsidy and Park-and-Ride Lot Component GUIDELINES, POLICIES, AND PROCEDURES GUIDELINES, POLICIES, AND PROCEDURES
 REMOVE II Public Transportation Subsidy and Park-and-Ride Lot Component GUIDELINES, POLICIES, AND PROCEDURES GUIDELINES, POLICIES, AND PROCEDURES SECTION I INTRODUCTION The San Joaquin Valley Air Pollution
*********VERY IMPORTANT THAT YOU READ TIL THE END************
 *********VERY IMPORTANT THAT YOU READ TIL THE END************ UCI Cal Teach E-News **Finals Edition** Friday, December 7, 2007 "He who opens a school door, closes a prison. -- Victor Hugo (1802-1885) Many
HIGH SCHOOL STUDENTS VIEWS ON FREE ENTERPRISE AND ENTREPRENEURSHIP. A comparison of Chinese and American students 2014
 HIGH SCHOOL STUDENTS VIEWS ON FREE ENTERPRISE AND ENTREPRENEURSHIP A comparison of Chinese and American students 2014 ACKNOWLEDGEMENTS JA China would like to thank all the schools who participated in
STRATEGIC PLANNING COMMITTEE AGENDA
 Interurban Transit Partnership STRATEGIC PLANNING COMMITTEE MEMBERS Charis Austin Aaron Smith Rosalynn Bliss Paul Troost Jack Hoffman, Chair Michael Verhulst Stephen Kepley STRATEGIC PLANNING COMMITTEE
Chapter 13. Other Travel Mode Alternatives. Ohio Kentucky Indiana Regional Council of Governments Regional Transportation Plan
 Chapter 13 Other Travel Mode Alternatives Ohio Kentucky Indiana Regional Council of Governments CHAPTER 13 OTHER TRAVEL MODE ALTERNATIVES INTRODUCTION It is in the region s public interest to plan for
PUBLIC BENEFIT GRANTS PROGRAM New Alternative Fuel Vehicle Purchase Eligibility Criteria and Application Guidelines
 PUBLIC BENEFIT GRANTS PROGRAM New Alternative Fuel Vehicle Purchase Eligibility Criteria and The San Joaquin Valley Air Pollution Control District (SJVAPCD) is currently accepting applications from public
Gerontology. September 2014 Needs Assessment. Gerontology Needs Assessment Page 1. Prepared by Danielle Pearson Date: September 11, 2014 Gerontology
 Gerontology September 2014 Needs Assessment Prepared by Danielle Pearson Date: September 11, 2014 Gerontology Gerontology Needs Assessment Page 1 Scope Data compiled in this report covers San Bernardino,
Regional Projections to 2040: Methodology and Results. Stephen Levy, CCSCE Presentation to ABAG Regional Planning Committee April 4, 2012
 Regional Projections to 2040: Methodology and Results Stephen Levy, CCSCE Presentation to ABAG Regional Planning Committee April 4, 2012 Overview Best Practice Methodology for Regional Projections Developing
Edith Cowan University
 Edith Cowan University ECU Access and Transport Strategy 2012-2022 1. Introduction Edith Cowan University s (ECU) Metropolitan Campuses have reached a point where low-cost at grade car parking facilities
Promoting Commute Trip Reduction:
 Promoting Commute Trip Reduction: CTR Outreach in Tumwater s City Center Neighborhood Thurston Regional Planning Council 8/31/2011 0 Table of Contents Introduction... 2 Background... 3 Literature Review...
Spain Scholarship Support & Reunion Reminiscing and raising funds to help future UCEAP participants
 UCEAP's bi monthly newsletter highlights student stories, awards and events. It is sent to faculty, staff, alumni and friends. View in a browser Spain 2004-05 Scholarship Support & Reunion Reminiscing
SUBJECT: FIRE DEPARTMENT 48/96 WORK SCHEDULE PILOT PROGRAM QUARTERLY REPORT
 PSFSS COMMITTEE: 10/19/17 ITEM: d (3) CITY OF *3 San Jose CAPITAL OF SILICON VALLEY Memorandum TO: PUBLIC SAFETY, FINANCE, AND STRATEGIC SUPPORT COMMITTEE FROM: Curtis P. Jacobson SUBJECT: SEE BELOW DATE:
Kansas Board of Regents Student Advisory Committee Student Gun Policy Opinion Survey
 Kansas Board of Regents Student Advisory Committee Student Gun Policy Opinion Survey Prepared For The Kansas Board of Regents Student Advisory Committee Prepared By Copyright December 2015 Fort Hays State
NOTICE OF PUBLIC HEARING March 27, PROPOSED AMENDMENT TO LIQUOR LICENCE FOR Russell Avenue (LL ) White Rock Beach Beer Company
 White Rock Beach Beer Company") NOTICE OF PUBLIC HEARING March 27, 2017 PROPOSED AMENDMENT TO LIQUOR LICENCE FOR 15181 Russell Avenue (LL 17 001) White Rock Beach Beer Company Documents: Author Document Item # Acting Director of Planning
NOTICE OF PUBLIC HEARING March 27, 2017 PROPOSED AMENDMENT TO LIQUOR LICENCE FOR 15181 Russell Avenue (LL 17 001) White Rock Beach Beer Company Documents: Author Document Item # Acting Director of Planning
SouthEastern Arizona Governments Organization Cochise County Intercity Bus Feasibility Study. February 3-4, 2017
 SouthEastern Arizona Governments Organization Cochise County Intercity Bus Feasibility Study February 3-4, 2017 Core Objectives Identify and quantify demand for intercity bus service Determine if such
BACKGROUND DOCUMENT N: A LITERATURE REVIEW OF ASPECTS OF TELEWORKING RESEARCH
 BACKGROUND DOCUMENT N: A LITERATURE REVIEW OF ASPECTS OF TELEWORKING RESEARCH Rebecca White, Environmental Change Institute, University of Oxford Teleworking has been defined as working outside the conventional
Commuter Assistance Program Evaluation
 Commuter Assistance Program Evaluation October 2012 PROJECT NO. BDK84 943-34 PREPARED FOR Florida Department of Transportation Commuter Assistance Program Evaluation BDK84 943-34 Prepared for: Florida
EPUB # MAXDA BP WIRING DIAGRAM EBOOK
 02 March, 2018 EPUB # MAXDA BP WIRING DIAGRAM EBOOK Document Filetype: PDF 239.37 KB 0 EPUB # MAXDA BP WIRING DIAGRAM EBOOK Search Local Dealer Inventory & Build Your New Mazda Online.Search Inventory,Special
Safe Staffing in Community Services
 Safe Staffing in Community Services Dr Louise Thomson Laura Dunk Laurie Hare Duke Report presented to Lincolnshire Partnership NHS Foundation Trust October 2014 1. Introduction This report describes a
JTAC STAFF REPORT. Draft RTP/SCS Scenarios. Peter Imhof, Julio Perucho, Bob Leiter
 JTAC STAFF REPORT SUBJECT: Draft RTP/SCS Scenarios MEETING DATE: October 4, 2012 AGENDA ITEM: 4 STAFF CONTACT: Peter Imhof, Julio Perucho, Bob Leiter RECOMMENDATION: Recommend that the Board select Scenario
Get on Board! Maine Medical Center. Transportation Demand Management Program
 Get on Board! Maine Medical Center Transportation Demand Management Program Contents Introduction... 3 Purpose... 3 Maine Medical Center... 3 MMC Facility Planning... 4 Commitment to TDM... 5 Context...
Perspectives on WMATA's ridership
 Perspectives on WMATA's ridership BCG's Presentation to WMATA OCTOBER 12, 2017 Trends in ridership Three focus areas for today's discussion Macro-forces driving ridership Peak over the horizon 1 Our starting
Chapter 8 - Transportation Demand Management
 Chapter 8 - Transportation Demand Management Transportation Demand Management Transportation Demand Management (TDM) is a set of planning processes, strategies, and policy decisions that are aimed at relieving
Minnesota s Physician Assistant Workforce, 2016
 OFFICE OF RURAL HEALTH AND PRIMARY CARE Minnesota s Physician Assistant Workforce, 2016 HIGHLIGHTS FROM THE 2016 PHYSICIAN ASSISTANT SURVEY Table of Contents Minnesota s Physician Assistant Workforce,
Program Manager Transportation Demand Management (TDM) Supplemental Questions required. See at the bottom of announcement.
 Supplemental Questions required. See at the bottom of announcement.") Job Openings Program Manager Transportation Demand Management (TDM) Type: Full Time Salary/Pay Rate: $79,690-$96,863 CalPERS Retirement Posted Date: 8/14/2013 Deadline to Apply: 9/16/2013 Supplemental
Job Openings Program Manager Transportation Demand Management (TDM) Type: Full Time Salary/Pay Rate: $79,690-$96,863 CalPERS Retirement Posted Date: 8/14/2013 Deadline to Apply: 9/16/2013 Supplemental
Request for Proposals (RFP) An Alternative Fuels Assessment & Feasibility Study
 An Alternative Fuels Assessment & Feasibility Study") Request for Proposals (RFP) An Alternative Fuels Assessment & Feasibility Study VTA Project # 2016-01 From: Subject: Angela E. Grant, Administrator Project VTA #2016-01 Request for Proposals An Alternative
Request for Proposals (RFP) An Alternative Fuels Assessment & Feasibility Study VTA Project # 2016-01 From: Subject: Angela E. Grant, Administrator Project VTA #2016-01 Request for Proposals An Alternative
White Plains Loop Academic Year
 White Plains Loop 2017-2018 Academic Year Updated as of 9-8-17 Anderson Hill Rd 1 Metro North White Plains 2 Galleria Mall 3 Mamaroneck Avenue 4 Westchester Mall 5 Residence Halls 6 Alumni Village 7 The
TransLink s TravelSmart Program
 Tools of Change Case Study Series Promoting Best Practices in Social Marketing www.toolsofchange.com TransLink s TravelSmart Program Tools of Change Illustrated Building Motivation Over Time Financial