Telecommuting Patterns and Trends in the Pioneer Valley
|
|
|
- Elisabeth Walton
- 5 years ago
- Views:
Transcription


1 Telecommuting Patterns and Trends in the Pioneer Valley August 2011 Prepared under the direction of the Pioneer Valley Metropolitan Planning Organization Prepared by: Pioneer Valley Planning Commission 60 Congress Street Springfield, MA This report is prepared in cooperation with the Massachuetts Department of Transpotation and the U.S. Department of Transportation Federal Highway Administration. The views and opinions of the authors (or agency) expressed herein do not necessarily state or reflect those of the U.S. Department of Transportation.
2 TABLE OF CONTENTS LIST OF FIGURES... i I. INTRODUCTION... 1 II. DATA COLLECTION... 1 III. DATA ANALYSIS... 2 IV. SUMMARY V. CONCLUSION APPENDIX A: Survey Questionnaire and Results APPENDIX B: Telecommuter vs. Non-telecommuter Responses APPENDIX C: Responses by Gender Figure LIST OF FIGURES Page Figure 1: Employees Who Telecommute When it is Offered as an Option 2 Figure 2: Telecommuter Habits 2 Figure 3: Reasons to Telecommute by Gender 4 Figure 4: Telecommuters and Non-telecommuters by Age 5 Figure 5: Tools and Equipment Used by Telecommuters 6 Figure 6: Telecommuters and Non-telecommuters by Employment Category 7 Figure 7: Trips Taken on Telecommute Day 8 Figure 8: Types of Trips Taken on Telecommute Day 9 Figure 9: Mode of Choice for Trips by Telecommuters on Telecommute Day 9 Figure 10: Average Commute Times for Telecommuters and Non-telecommuters 10 Figure 11: Average Commute Distance Between Home and Work 11 Figure 12: Comparison Between Work Duration on Regular Work Day and Telecommute Day 12 Figure 13: Comparison Between Work Start and End Times for Regular Work Day and Telecommute Day 12 i
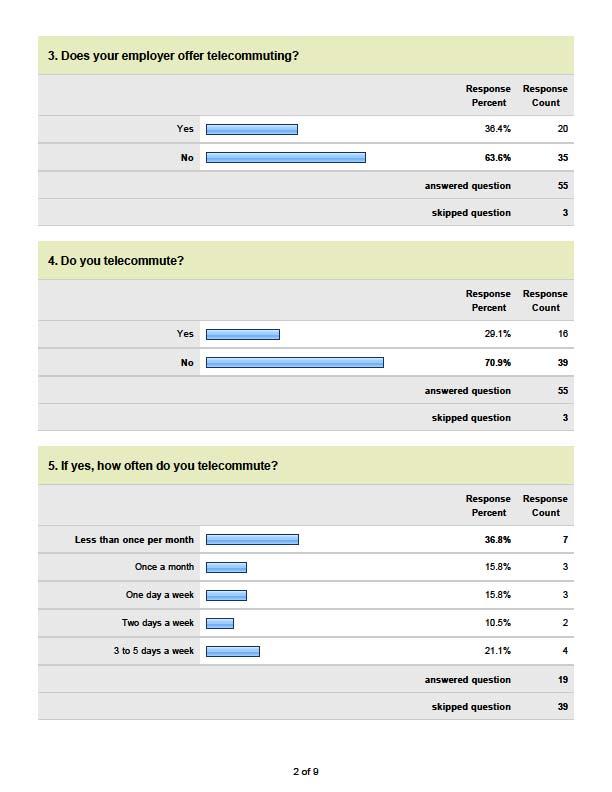
3 I. INTRODUCTION In an online Commuter Survey open to the public from June, 2010 to June, 2011, the Pioneer Valley Planning Commission invited residents and employees of Hampden and Hampshire Counties to answer 20 multiple choice questions regarding their home-to-work/work-to-home commutes. The survey specifically addressed residents and employees who telecommute to work, an option which is expected to become increasingly prevalent as gas prices increase and residents adjust their lifestyles to adapt to the various effects of climate change. Telecommuting is defined as working from a home base and using any mode of telecommunication such as computer, phone, fax, social networking tools, etc. to connect with clients, colleagues, and offices. As such, telecommuting reduces or eliminates the need to travel to a traditional office environment. Data collected from survey responses provides a picture of the telecommuter activity patterns in our region. The survey inquired about trip characteristics as well as demographic information related to the employer. Questions were asked about the average commute duration and distance. Participants were asked whether their employer offered telecommuting and whether it was required. Telecommuters were asked about the main reason they telecommuted. Regarding a telecommute day, telecommuters were asked what tools they used, whether the work duration was similar to a day at the office, and if they had similar start and end times. To further assess travel behaviors of telecommuters, they were asked about the frequency, type, and mode of choice for trips conducted on telecommute day. Demographic data included employment type, marital status, parental status, gender, and age. The survey took approximately five minutes to complete and is referenced in Appendix A. This study is part of the Regional Congestion Management Process, which identifies, evaluates, and implements transportation performance measures that enhance the safety and efficiency of the movement of people, goods, and information. II. DATA COLLECTION In addition to announcing the availability of the survey to the regional media, the survey was posted on the Pioneer Valley Planning Commission s (PVPC) website ( and an invitation was sent to a contact at the MassMutual Center, a major employer in the region, with a request that they inform and encourage employees to participate. Survey responses were collected from June 15, 2010 until June 14, Over the course of a year, a small percentage of employees in the region had taken the survey. Out of these 58 participants, 16 were telecommuters. This survey sample is quite small to draw definitive conclusions, yet collected responses may give an initial indicator to the status of telecommuting in the region. Thus, it would 1
4 be beneficial to obtain a wider pool of participants in the future by sending this survey to more employers in the region and actively encouraging them to distribute it among their employees. III. DATA ANALYSIS According to participants responses, it appears that more than half of the employers did not offer telecommuting as an option to their employees. Over a third of those surveyed had the option to telecommute. Only one respondent was required to telecommute to work by their employer. Most employees will take advantage of a telecommuting option when it is offered (Figure 1). Employees who request to work from home may have to present a proposal to their employers making the case that telecommuting will be beneficial to the company, increase productivity and reduce costs. On the other hand, employers can offer telecommuting as an incentive and component of the employees benefits package. Figure 1: Employees Who Telecommute When it is Offered as an Option 25% n = 58 Yes No 75% Respondents who take advantage of the telecommuting option differ in how often they telecommute. A quarter of participants telecommutes less than once per month, almost a fifth telecommutes once per month, almost a fifth telecommutes once per week, over a tenth telecommutes two days per week, and another quarter telecommutes 3 to 5 days per week (Figure 2). Variability in telecommuting habits indicates the ability of offices to adapt to this work model. 2
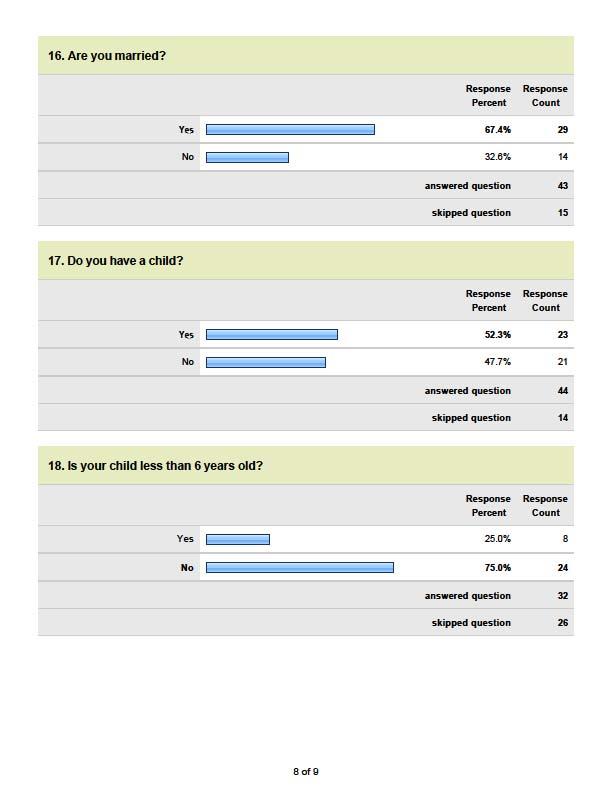
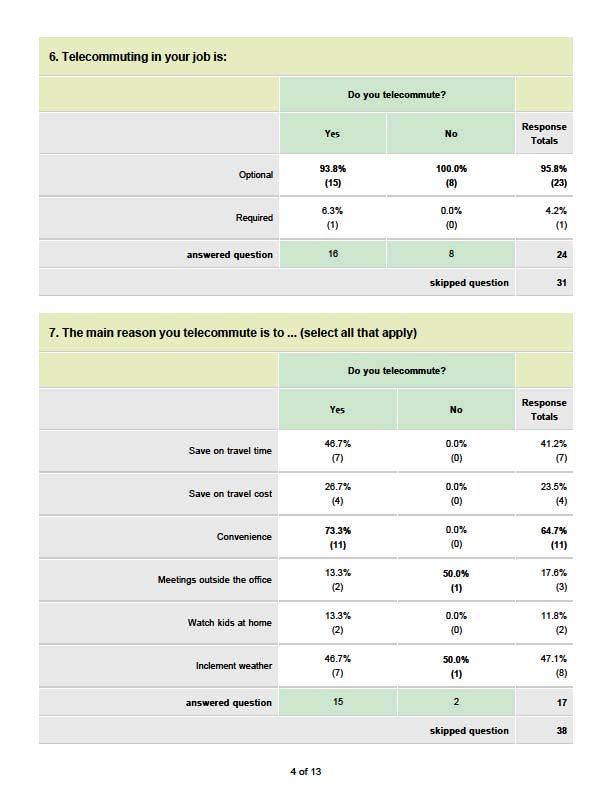
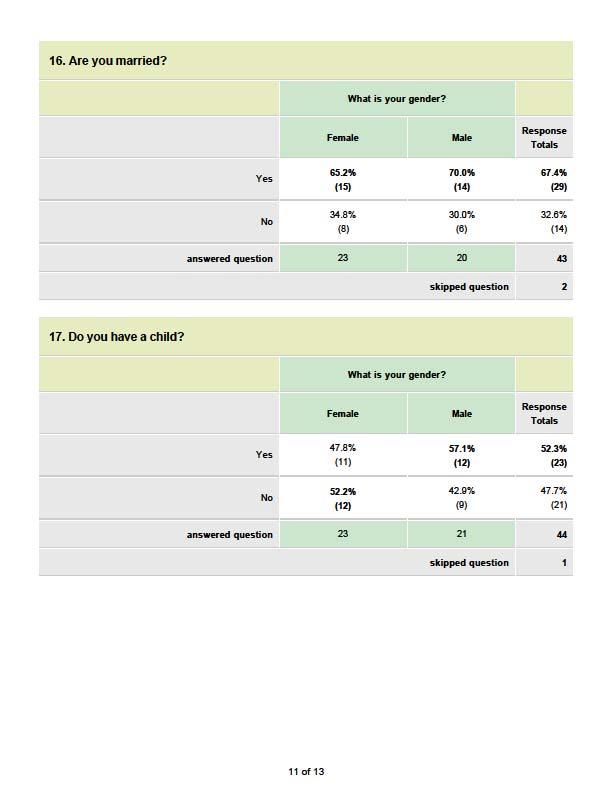
5 How Often Virtual Commuters Telecommute Figure 2: Telecommuter Habits % 25% % 19% 2.5 Number of people 2 13% n = Less than once per month Once per month One day per week Two days per week 3 to 5 days per week According to respondents, the main reasons to opt for telecommuting are, above all, convenience (65%) followed by transportation hazards posed by inclement weather (47%). Only a quarter of participants included savings on travel costs as a reason to telecommute. With gas prices projected to progressively rise, it is possible that savings on travel costs will become increasingly significant as a deciding factor to telecommute. Some participants also responded that they telecommute to meetings outside the office (18%). A small percentage of telecommuters do so to supervise children at home (12%). Some may expect that women, as traditional caregivers/homemakers, would be more likely to telecommute to work in order to help balance roles at home and work. The gender split for telecommuters, however, was fairly even, with a little under half of telecommuters being female and a little over half being male (46.7%, 53.3%). The majority of telecommuters are married (67.4%); a majority also works full-time (80%); and just over half of the respondents have children (52.3%). While it might have been similarly predicted that many of the telecommuters with children would be staying home to supervise younger children, only about a quarter of participants reported having children younger than six. This is consistent with the low percentage of participants who factor supervision of children as a main reason to telecommute. However, those who do factor supervision of children into their decision to telecommute are all women. Figure 3 below breaks down participants reasons to telecommute by gender. More men telecommuted for convenience as well as due to weather conditions than women. Both men and women were equal in the degree to which they factored saving on travel time, and both genders were somewhat similar in their consideration of travel costs (Figure 3). The complete set of responses cross tabulated by gender is available in Appendix C. 3
6 Figure 3: Reasons to Telecommute by Gender 37% Number of people 21% 26% n = 15 21% 21% 21% 14% 11% 14% 7% 5% Save on travel time Save on travel cost Convenience Meetings outside the office Watch kids at home Inclement weather Figure 4 goes on to illustrate a breakdown of telecommuters and non-telecommuters by age. Overall, the 31 to 40 age group had the most telecommuters (40%), followed by the 51 to 64 age group with over a quarter. The 21 to 30 age group totaled a fifth of telecommuters surveyed, while the 41 to 50 and 65 or above age ranges each held the lowest percentage of telecommuters. None of the survey participants were in the 16 to 20 age group. Out of the six age groups, a greater proportion of middle-aged telecommuters responded that convenience was a major reason to work from home. This could be due to family obligations and home responsibilities. Such responsibilities may not be of much concern to younger and older telecommuters. Telecommuters from the younger age groups could perhaps have had greater exposure to technological tools and applications in their education. As a result, they may be more technically savvy, a critical asset for telecommuters. The age group represented most in the survey by telecommuters and non-telecommuters collectively is 21 to 30 (29%), followed by 51 to 64 (27%). 4

7 Figure 4: Number of people 33% 17% 27% n = 45 20% 40% 20% 26.7% 27% 3% 6.7% 6.7% Age Some employees have the ability to telecommute because their type of work can be undertaken independently and does not require access to complex machinery. Working in a team, several telecommuters could still interact with colleagues via the Internet through , voice over the internet, video teleconferencing, etc. It is possible that employees who do not take advantage of virtual commute options may be unfamiliar with certain computer applications that facilitate business work virtually. Some workers may not have the means to supply tools and equipment needed to work from home, if their employer does not provide it. A computer is usually required for telecommuting, and all telecommuters reported using one for their work at home. Almost all participants reported using a high speed Internet connection, as well, and many used a printer and scanner. Some telecommuters needed an additional phone line (Figure 5). With employment opportunities in the manufacturing sector decreasing and emphasis on technology and social networking increasing, the State of Massachusetts has identified broadband network extension as key in progressing economically. In 2010, $45.5 million from the American Recovery and Reinvestment Act was granted to Massachusetts along with $26.2 million matched by the State to lay down public fiber network in offline communities of western and north central Massachusetts. The project is being led by Massachusetts Broadband Initiative, 5

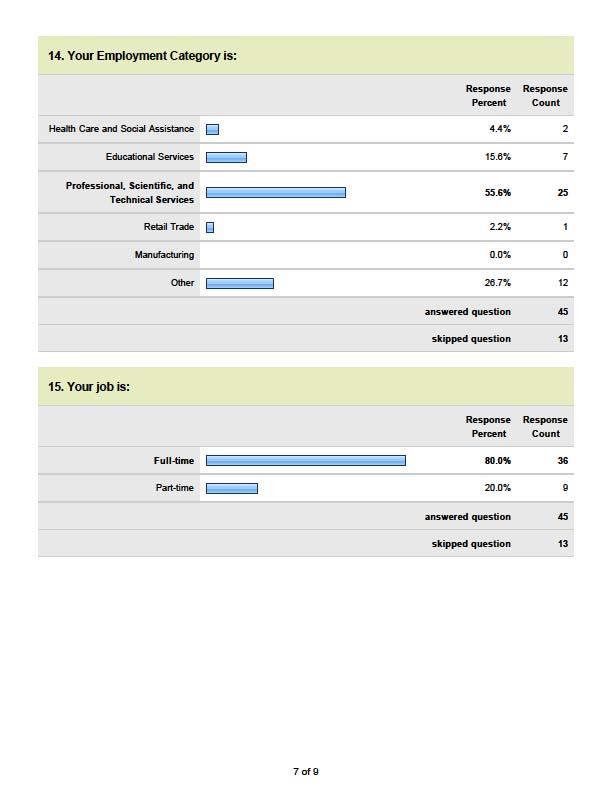
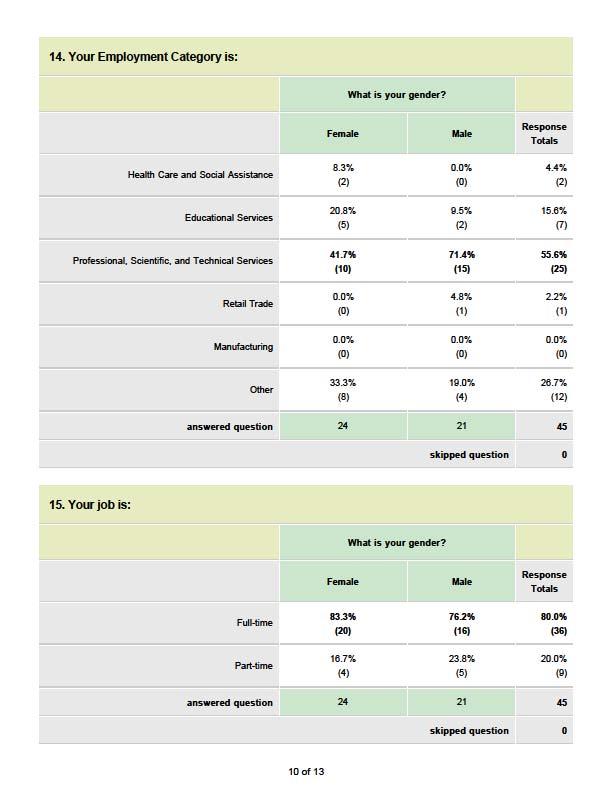
8 and construction began in July of The expansion of broadband possibilities will diminish the digital divide by advancing the efficiency and implementation of telecommuting options for workers and employment offices. Figure 5: Tools and Equipment Used by Telecommuters Number of people n = 18 Laptop/ Desktop PC Printer Fax Scanner Additional High Speed Other Phone Line Internet Connection Of the workers surveyed, the majority identified their employment type as in the category of Professional, Scientific, and Technical Services (Figure 6). A greater proportion of workers in this category are expected to telecommute, as their type of work can be accomplished in a virtual setting. It is interesting to note that even though this employment category had the highest number of telecommuters it also had the highest number of non-telecommuters (47%) compared to the rest of the employment categories. Other employment types such as Retail Trade, Manufacturing, Healthcare, and Social Assistance are often dependent upon spatial proximity between worker and equipment/machinery or between worker and consumer/patient. The initial data confirms this, showing that these employment categories had no telecommuters. With an increasing number of educational institutes starting to offer online classes and distant learning options to non-traditional students in higher education, teachers of such classes have the flexibility to telecommute; it is probable that this applies to the respondents who telecommuted 6
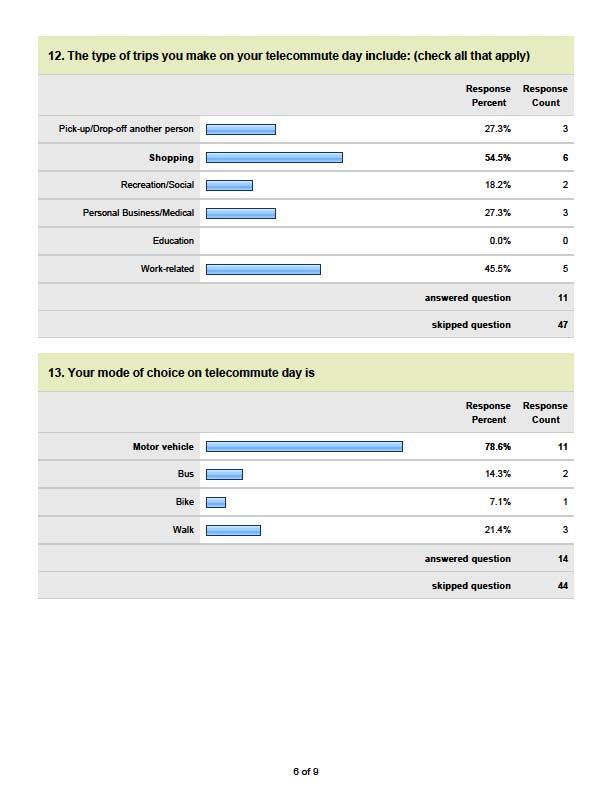
9 from the Education employment category (27%). The survey data shows that more than half (56%) of all respondents, both telecommuting and non-telecommuting, were from the Professional, Scientific, and Technical Services (Appendix B). This indicates the potential for greater telecommuting numbers by this employment sector, which represents a significant portion of jobs in an increasingly digitized, information-based economy. Figure 6: 60% Number of people n = 45 47% 23% 7% 27% 10% 3% 33% Health Education Professional, Scientific, Retail Trade Manufacturing Services and Entertainment and Technical More than half of the telecommuters did not take any trips during their telecommute day, while a little more than a third took one trip and about 12% took two trips (Figure 7). None reported taking more than two trips. On telecommute day, shopping trips constituted the highest number of trips taken (39%). Almost a fourth of trips were work-related, 15% of trips were taken to pick-up/dropoff someone, 15% of trips were for personal business or medical needs, and a small percentage of trips (8%) were taken for recreation and social activities (Figure 8). A major reason telecommuting is encouraged is to reduce the number of single occupancy vehicles (SOV) on the roads and thereby diminish congestion and the region s carbon footprint, for which the transportation sector is a major contributor. Data on mode share from the 2000 Census was cited in the 2007 Update of the Regional Transportation Plan, showing that nearly 7

10 80% of all work trips in the Pioneer Valley were made via single occupancy vehicles; of the remaining 20% of travelers who did not drive alone almost half chose to carpool to work. According to the Regional Transportation Plan, telecommuters consisted of only 2.7% of total commuters, although it was projected that this percentage may increase as the region s telecommunications network expands. The latest Regional Transportation Plan still indicates a heavy regional tilt toward SOVs, citing the American Community Survey (ACS) which provides the most recent information on mode share. The ACS found that 81% of commuters in the Pioneer Valley region drive alone to work, significantly above the statewide average of 73%. Public transportation was significantly underused, with only 1.9% of commuters in the region traveling by transit compared to almost 9% statewide. The percentage of Pioneer Valley workers commuting via private auto has increased since the 2000 Census. One of the emphasis areas in the 2012 Update to the Regional Transportation Plan (RTP) is sustainability. Transportation issues related to sustainability must be actively pursued with the priorities for our regional transportation network defined accordingly. Legislation including the Global Warming Solutions Act, cited in this updated RTP, requires Massachusetts to reduce economy-wide greenhouse gas (GHG) emissions 10% to 25% below 1990 levels by 2020 and 80% below 1990 levels by According to the 2012 RTP, the transportation sector is the largest GHG emitter, producing 31% of 1990 emissions and projected to produce 38% of 2020 emissions. Advancing telecommuting options in the region is one of the strategies identified to accomplish this goal. Figure 7: Trips Taken on Telecommute Day 35% (6) No Trips 1 Trip 2 Trips n = 11 Zero One Two 12% (2) 53% (9) 8
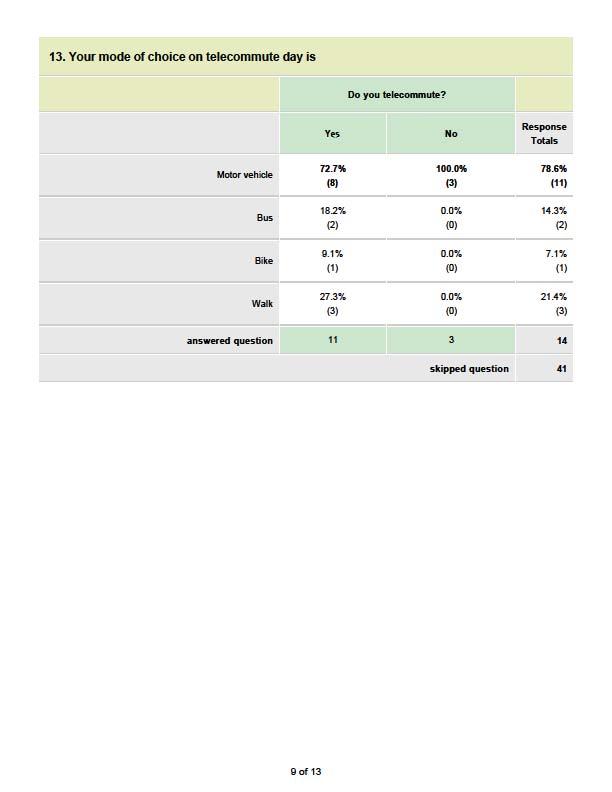
11 Number of people Figure 8: 15% Pick-up/Drop-off another person Types of of Trips Taken on Telecommute During Telecommute Day Day 39% Shopping 8% Recreation/Social 15% Personal Business Medical 23% Work-related n = Series1 11 Figure 9: Telecommuters' Mode of Choice for Trips Mode of Choice for Trips by Telecommuters on Telecommute Day % Number of people % 7% 21% n Series1 = 14 0 Motor vehicle Bus Bike Walk On a telecommute day, the majority of participants took trips using a motor vehicle (78.6%), while only a little over a fifth (21%) walked, 14% took the bus, and 7% biked to their destination (Figure 9). The prevalence of trips taken via motor vehicle is an outcome of traffic networks and policy decisions giving priority to the automobile. Consequently, transit, bicycle and pedestrian options have become secondary, tertiary or barely viable as an option in a number of municipalities. 9

12 Automobile-centered policy decisions and transportation improvements would undercut demand and funding for infrastructure accommodating other modes of travel, creating a perception of inconvenience around alternative modes of travel. Telecommuters may be more likely to take trips using a mode of travel other than the automobile if public transit services and access were expanded. Trips taken by telecommuters with generally flexible work schedules are likely to be shorter and conducted during non-peak traffic hours to local destinations. The overall effect of this change in travel behavior would likely decrease, even by a small percentage, the number of vehicles driving on currently congested roadways during peak hours of traffic. The majority of respondents (63%) had a commute time of less than half an hour between home and work; and 19% reported a 31 to 60 minute journey; and the same percentage reported a commute beyond one hour (Figure 10). Figure 10: Average Commute Times for Telecommuters and Non-telecommuters Number of people 62% n = 16 39% 63% 19% 19% 0-30 minutes minutes minutes All other responses Commute distance varied fairly evenly between trips within the 40 mile range, with the highest number of participants (29%) reporting a 0 to 5 mile commute (Figure 11). A very small percentage of participants (4%) commuted over 40 miles. If the percentage of workers in the Hampden and Hampshire Counties who are able to take advantage of a telecommute option increases, marked savings in fuel costs and fuel consumption would be expected. 10
, and less than a third reported a difference in duration (31%) (Figure12).")
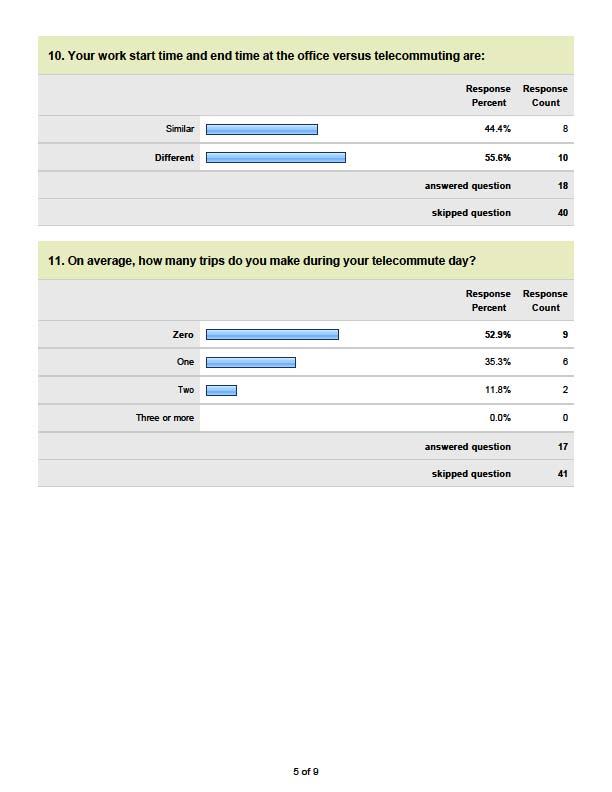
13 Figure 11: Average Commute Distance Between Home and Work 28% 26% 23% 19% n = 57 Number of people 4% 0-5 miles 8-15 miles miles miles miles 61 miles or greater Comparing work duration at the office versus telecommuting, most respondents reported a similarity between the two locations (69%), and less than a third reported a difference in duration (31%) (Figure12). When asked whether there was a difference between start and end times for a regular work day and a telecommute day, telecommuters answers showed a complete split: half reported similar work start and end times, and the other half reported otherwise (Figure 13). Differences in start and end times can be explained by fewer restrictions on employees time and access to work, as the time normally devoted to travel between work and home is taken out of the daily schedule. As a result, telecommuters have more freedom to choose their hours of work, adapting personal needs and family obligations to work responsibilities. 11


14 Figure 12: Comparison between Work Duration on Regular Work Day and Telecommute Day 69% Number of people n = 16 31% Similar Different Figure 13: Comparison between Work Start and End Times for Regular Work Day and Telecommute Day 50% 50% Number of people n = 16 Similar Different 12
15 IV. SUMMARY The following are key observations and recommendations based on the survey results and regional trends. Employees will take advantage of a telecommuting option when companies institute such programs. i. Seventy-five percent of respondents chose to telecommute when it was offered by their employers. Companies that are flexible, creative and embracing of new technologies will be better able to implement telecommuting programs. i. Telecommuting participants used a laptop or desktop PC and high speed Internet connection to telecommute. ii. Inclusion of technical training that enables telecommuters to engage in business work virtually would maximize employee productivity. Telecommuting may allow greater balance and harmonization of work-home obligations and needs. i. The majority of telecommuters said that convenience was their main reason to telecommute. Greater numbers of telecommuters making fewer trips or taking shorter trips during the day could decrease the number of vehicles on the road and improve roadway safety during congested periods or inclement weather and hazardous circumstances. i. Almost half of participants said that avoiding inclement weather was a main reason to telecommute. Telecommuting programs may or may not be sensitive to an employee s ability to afford the tools and equipment necessary to work from home. i. While some employers fund and install the equipment necessary for an employee to telecommute, other businesses may choose not to do so or may not have the capital necessary to do so. Expanded transit services would encourage telecommuters to leave their automobiles home for work-related as well as non work-related trips during telecommute days. i. Mode share data from the 2006 to 2008 American Community Survey shows that 1.9% of Pioneer Valley commuters using public transit to get to work compared to 81.1% using private autos. ii. The percentages of commuters driving alone in the Hampden and Hampshire Counties 83.8% and 73.3% respectively is above the statewide percentage of iii. The percentages of commuters using public transit to travel to work in the Hampden and Hampshire Counties 1.9% and 1.7% respectively are well below the statewide percentage of 8.9%. iv. The 2012 RTP identifies securing adequate funding for a balanced regional transportation system as a goal and states the following: Travel in the Pioneer Valley region is dominated by automobile travel. Work trips are characterized by a high percentage of people that choose to drive alone to work, 13
16 which contributes to both congestion and air quality issues. Lack of sufficient funding for public transit and a viable regional ridesharing program contribute to people choosing to rely on the automobile. Lack of connectivity for bicycles and pedestrians require people to use their car for shorter trips that could otherwise be made by bike or on foot. V. CONCLUSION The benefits of telecommuting are wide-ranging and include: more efficient use of time; increased flexibility in one s personal daily schedule; decreased fuel consumption; and savings on fuel costs. As more employers and employees become aware of the benefits of telecommuting, offices may become more creative in how they offer this as an option for workers. There is a possibility that with advances in healthcare technologies and other employment sectors, telecommuting could become an option to differing degrees for a greater number of people. In an age where the transfer of information and information technology are the basis of creative economies, a telecommuting alternative has the potential to be implemented on a wider scale in the future. In our region the new Massachusetts Broadband Initiative will implement a public fiber optic network in western Massachusetts for communities that have not had access to broadband technology to provide opportunities for economic growth. While the immediate personal and economic conveniences of telecommuting are obvious, it is also important for residents and employees to decrease their fuel consumption and for the green objectives of a telecommuting option to be realized. In order to advance sustainability and energy efficiency initiatives and encourage telecommuting, it is essential for transit and public transportation networks to adequately service residents of a community and for community members to feel comfortable taking advantage of these services. The 2012 RTP Update states that the Pioneer Valley Transportation Authority (PVTA) has considered extending the hours of service on the primary routes, namely in the Cities of Holyoke and Springfield, and seeks to convert to community routes to provide more responsive service as a FlexVan route, which uses smaller transit vehicles that are able to provide more responsive and customer focused service. Such changes will require state and federal funding, which must also go toward bus and facility repairs, investments in a fuel-efficient bus fleet, and improvements to the region s Intelligent Transportation System (ITS), which emphasizes systemic efficiency measures such as real-time travel/schedule information for both drivers and passengers. As the number of telecommuters increases, transit, bike, and pedestrian services and infrastructure will maximize the feasibility and benefits of a work-from-home option. 14

17 Appendix A: Survey Questionnaire and Results 15
18 16
19 17
20 18
21 19
22 20
23 21
24 22
25 23
26 Appendix B: Telecommuter versus Non-telecommuter Responses 24
27 25
28 26
29 27
30 28
31 29
32 30
33 31
34 32
35 33
36 34
37 35
38 36
39 Appendix C: Responses by Gender 37
40 38
41 39
42 40
43 41
44 42
45 43
46 44
47 45
48 46
49 47
50 48
51 49
Yale University 2017 Transportation Survey Report February 2018
 Walking and riding trollies to Yale Bowl for a football game. Photo courtesy of Yale University. Yale University 2017 Transportation Survey Report February 2018 A campus-wide transportation survey was
2018 Regional Project Evaluation Criteria For PSRC s FHWA Funds
 2018 Regional Project Evaluation Criteria For PSRC s FHWA Funds INTRODUCTION As described in the adopted 2018 Policy Framework for PSRC s Federal Funds, the policy focus for the 2018 project selection
Valley Metro TDM Survey Results Spring for
 Valley Metro TDM Survey Results 2017 Spring 2017 for P a g e ii Table of Contents Section: Page #: Executive Summary... iv Conclusions... viii I. Introduction... 1 A. Background and Methodology... 1 B.
Employee Telecommuting Study
 Employee Telecommuting Study June Prepared For: Valley Metro Valley Metro Employee Telecommuting Study Page i Table of Contents Section: Page #: Executive Summary and Conclusions... iii I. Introduction...
BROADBAND TELECOMMUNICATIONS AND URBAN TRAVEL
 BROADBAND & ENVIRONMENT BROADBAND TELECOMMUNICATIONS AND URBAN TRAVEL R J Nairn Energy consumption associated with transport is one of the major contributors to greenhouse gas emissions. As the information
Transportation Demand Management Workshop Region of Peel. Stuart M. Anderson David Ungemah Joddie Gray July 11, 2003
 Transportation Demand Management Workshop Region of Peel Stuart M. Anderson David Ungemah Joddie Gray July 11, 2003 Why Transportation Demand Management (TDM)? Demand management measures support a sustainable
Future Trends & Themes Summary. Presented to Executive Steering Committee: April 12, 2017
 Future Trends & Themes Summary Presented to Executive Steering Committee: April 12, 2017 Vision Workshop Regional/Local Themes The region and the Prince William area share the following key themes: Future
George Washington Region Scenario Planning Study Phase II
 George Washington Region Scenario Planning Study Phase II PhaseIIScenarioSummary This final section of the report presents a comparative summary of the regional and corridor level effects of the three
Nigerian Communication Commission
 submitted to Nigerian Communication Commission FINAL REPORT on Expanded National Demand Study for the Universal Access Project Part 2: Businesses and Institutions survey TABLE OF CONTENTS 1 INTRODUCTION...
FUNDING SOURCES. Appendix I. Funding Sources
 Appendix I. Funding Sources FUNDING SOURCES planning and related efforts can be funded through a variety of local, state, and federal sources. However, these revenues have many guidelines in terms of how
APPENDIX METROFUTURE OVERVIEW OVERVIEW
 APPENDIX B METROFUTURE OVERVIEW OVERVIEW Land use decisions and many economic development decisions in Massachusetts are controlled directly by local municipalities through zoning. This planning is guided
2018 Regional Congestion Mitigation Air Quality Improvement Program (CMAQ) Grant Application
 Grant Application") 2018 Regional Congestion Mitigation Air Quality Improvement Program (CMAQ) Grant Application PROJECT TITLE: PROJECT SPONSOR Agency or Organization Contact Person OLYMPIA CAPITOL CAMPUS TAMING THE DRAGONS
2018 Regional Congestion Mitigation Air Quality Improvement Program (CMAQ) Grant Application PROJECT TITLE: PROJECT SPONSOR Agency or Organization Contact Person OLYMPIA CAPITOL CAMPUS TAMING THE DRAGONS
Mississauga Transportation Survey June 2005 Survey Overview
 Mississauga Transportation Survey June 2005 Survey Overview The on-line Mississauga Transportation Survey link was sent out via postcard and e-mail to the Board of Trade s list of Mississauga employers.
Digital Economy.How Are Developing Countries Performing? The Case of Egypt
 Digital Economy.How Are Developing Countries Performing? The Case of Egypt by Nagwa ElShenawi (PhD) MCIT, Egypt Produced for DIODE Network, 217 Introduction According to the OECD some of the most important
Licensed Nurses in Florida: Trends and Longitudinal Analysis
 Licensed Nurses in Florida: 2007-2009 Trends and Longitudinal Analysis March 2009 Addressing Nurse Workforce Issues for the Health of Florida www.flcenterfornursing.org March 2009 2007-2009 Licensure Trends
Catmobile. May 2, Environmental Science II. Investigators: Kvochak, Lewis, McIntyre, Radomile
 Catmobile 1 Catmobile May 2, 2013 Environmental Science II Investigators: Kvochak, Lewis, McIntyre, Radomile Affiliation: Dept. of Geography & the Environment, Villanova University, 800 Lancaster Ave.,
NOMINATION FOR 2008 TAC SUSTAINABLE URBAN TRANSPORTATION AWARD
 ONTARIO MINISTRY OF TRANSPORTATION NOMINATION FOR 2008 TAC SUSTAINABLE URBAN TRANSPORTATION AWARD Ontario Transportation Demand Management Municipal Grant Program Ontario Transportation Demand Management
Local Economy Directions Paper
 Local Economy Directions Paper Official Community Plan Review - Phase 3 Help us refine our emerging directions! This paper provides a summary of what we have heard so far and a step towards developing
GreenCommute. The Nortel Networks Transportation Demand Management (TDM) Program. Presented by: Sharon Lewinson July 11, 2003
 Program. Presented by: Sharon Lewinson July 11, 2003") GreenCommute The Nortel Networks Transportation Demand Management (TDM) Program Presented by: Sharon Lewinson July 11, 2003 What is a TDM program? A TDM, or commuter options program, is any collection
GreenCommute The Nortel Networks Transportation Demand Management (TDM) Program Presented by: Sharon Lewinson July 11, 2003 What is a TDM program? A TDM, or commuter options program, is any collection
As Minnesota s economy continues to embrace the digital tools that our
 CENTER for RURAL POLICY and DEVELOPMENT July 2002 2002 Rural Minnesota Internet Study How rural Minnesotans are adopting and using communication technology A PDF of this report can be downloaded from the
Summary of Focus Groups Lycoming County 2016 Comprehensive Plan Update April May 2016
 Summary of Focus Groups Lycoming County 2016 Comprehensive Plan Update April May 2016 Focus Group Overview As part of the 2016 Comprehensive Plan community outreach strategy, Lycoming County conducted
Peninsula Corridor Joint Powers Board Legislative Program
 Peninsula Corridor Joint Powers Board 2018 Legislative Program Purpose Legislative and regulatory actions have the potential to significantly benefit Peninsula Corridor Joint Powers Board (JPB) programs
COMMUTER CONNECTIONS TRANSPORTATION DEMAND MANAGEMENT EVALUATION PROJECT
 COMMUTER CONNECTIONS TRANSPORTATION DEMAND MANAGEMENT EVALUATION PROJECT TRANSPORTATION EMISSION REDUCTION MEASURES (TERMS) REVISED EVALUATION FRAMEWORK FY2015 FY2017 Prepared for: National Capital Region
HIGH SCHOOL STUDENTS VIEWS ON FREE ENTERPRISE AND ENTREPRENEURSHIP. A comparison of Chinese and American students 2014
 HIGH SCHOOL STUDENTS VIEWS ON FREE ENTERPRISE AND ENTREPRENEURSHIP A comparison of Chinese and American students 2014 ACKNOWLEDGEMENTS JA China would like to thank all the schools who participated in
NO X O 3. CH 4 VOCs CO 2
 A T h e o r e t i c a l A n a l y s i s o f The Effectiveness of Transportation Demand Management Strategies In Reducing Greenhouse Gas Emissions N 2 O NO X O 3 CO 2 CH 4 VOCs HFCs August 1, 2010 Dulles
Federal Actions to Reduce Energy Use in Transportation
 Federal Actions to Reduce Energy Use in Transportation Table of Contents: Federal Actions to Reduce Energy Use in Transportation Executive Summary I. Introduction: the Potential for Transportation Energy
EVALUATION OF RIDEFINDERS FY 2012 TRANSPORTATION DEMAND MANAGEMENT (TDM) PROGRAM IMPACT
 PROGRAM IMPACT") EVALUATION OF RIDEFINDERS FY 2012 TRANSPORTATION DEMAND MANAGEMENT (TDM) PROGRAM IMPACT FINAL REPORT (11-5-12) Prepared by: Southeastern Institute of Research, Inc. Richmond, Virginia & LDA Consulting
EVALUATION OF RIDEFINDERS FY 2012 TRANSPORTATION DEMAND MANAGEMENT (TDM) PROGRAM IMPACT FINAL REPORT (11-5-12) Prepared by: Southeastern Institute of Research, Inc. Richmond, Virginia & LDA Consulting
For additional information about ACT please contact: ACT National Headquarters phone: PO Box facsimile:
 This publication was made possible through a cooperative agreement between the Association for Commuter Transportation (ACT) and the United States Department of Transportation - Federal Highway Administration.
RESULTS OF THE CAMPUS TRAVEL SURVEY
 RESULTS OF THE 2016-17 CAMPUS TRAVEL SURVEY Institute of Transportation Studies and Transportation and Parking Services University of California, Davis Prepared by Drew Heckathorn Under the Direction of
Results of the Clatsop County Economic Development Survey
 Results of the Clatsop County Economic Development Survey Final Report for: Prepared for: Clatsop County Prepared by: Community Planning Workshop Community Service Center 1209 University of Oregon Eugene,
Research Brief IUPUI Staff Survey. June 2000 Indiana University-Purdue University Indianapolis Vol. 7, No. 1
 Research Brief 1999 IUPUI Staff Survey June 2000 Indiana University-Purdue University Indianapolis Vol. 7, No. 1 Introduction This edition of Research Brief summarizes the results of the second IUPUI Staff
07/01/2010 ACTUAL START
 PAGE, 1/27/21 6:18:42PM Grant Number: SC2224 Activity: Municipal Facility Energy Conservation Program Quarter: 1/1/29-12/31/29 Metric Activity: Building Retrofits Status: Active % of Work Complete: Activity
Broadband. Business. Leveraging Technology in Kansas to Stimulate Economic Growth
 Leveraging Technology in Kansas to Stimulate Economic Growth MAY 2011 is the Engine of Economic Growth in Kansas Increasingly, businesses seeking to open or expand operations look to see not only whether
The C40 Cities Finance Facility Information pack for cities
 The C40 Cities Finance Facility 2018-2020 Information pack for cities 17.01.2018 TABLE OF CONTENTS ABOUT THE C40 CITIES FINANCE FACILITY... 3 About us... 3 Our donors... 3 Implementation... 3 Our objectives...
School Siting and Transportation
 School Siting and Transportation City of Denton and Denton ISD March 5, 2012 North Central Texas Council of Governments Common Goal All schools should provide a safe and healthy learning environment with
BACKGROUND DOCUMENT N: A LITERATURE REVIEW OF ASPECTS OF TELEWORKING RESEARCH
 BACKGROUND DOCUMENT N: A LITERATURE REVIEW OF ASPECTS OF TELEWORKING RESEARCH Rebecca White, Environmental Change Institute, University of Oxford Teleworking has been defined as working outside the conventional
A FLORIDA DEPARTMENT OF TRANSPORTATION DISTRICTS FOUR AND SIX COMMUTER SERVICES SCOPE OF SERVICES
 Exhibit A FLORIDA DEPARTMENT OF TRANSPORTATION DISTRICTS FOUR AND SIX COMMUTER SERVICES SCOPE OF SERVICES 1.0 Purpose The South Florida Commuter services vendor (hereinafter referred to as Vendor ) for
The Future of Broadband Internet Access in Canada
 The Future of Broadband Internet Access in Canada Key Concept The CRTC is seeking responses on the Telecom Notice of Consultation 2013-551 regarding the review of Canada s wholesale services. As Alberta
Telecommuting or doing work
 Brookings Greater Washington Research Program Washington Area Trends While studies have evaluated Effects of Telecommuting on Central City Tax Bases by Philip M. Dearborn, Senior Fellow, The Brookings
TRANSPORTATION ALTERNATIVES (TA) SET ASIDE PROGRAM July 2016
 SET ASIDE PROGRAM July 2016") Regional Transportation Commission TRANSPORTATION ALTERNATIVES (TA) SET ASIDE PROGRAM July 2016 Contents 1.0 Purpose and Eligibility... 2 2.0 Process... 5 3.0 Implementation of Funded Projects... 5 Attachment
Regional Transportation Commission TRANSPORTATION ALTERNATIVES (TA) SET ASIDE PROGRAM July 2016 Contents 1.0 Purpose and Eligibility... 2 2.0 Process... 5 3.0 Implementation of Funded Projects... 5 Attachment
DOES IT PAY TO WORK FROM HOME? EXAMINING THE FACTORS INFLUENCING WORKING FROM HOME IN THE GREATER DUBLIN AREA
 Proceedings ITRN2014 4-5th September, Caulfield: Does it pay to work from home DOES IT PAY TO WORK FROM HOME? EXAMINING THE FACTORS INFLUENCING WORKING FROM HOME IN THE GREATER DUBLIN AREA Brian Caulfield
ADJOURNMENT TO THE REGULAR MEETING, 5 P.M., MONDAY, January 23, 2016, in Room 101, Community Services Building, 150 N.
 CITY OF BURBANK AGENDA FOR THE TRANSPORTATION COMMISSION MEETING Monday, December 12, 2016, 5:00 p.m. Community Services Building, Room 101, 150 North Third Street This agenda contains a summary of each
Staff Report. Allocation of Congestion Management and Air Quality Improvement Program Funding
 ITEM 7B Staff Report Subject: Contact: Allocation of Congestion Management and Air Quality Improvement Program Funding Eric Cowle, Transportation Program Manager (ecowle@cvag.org) Recommendation: Consider
Climate Initiatives Program. Competitive Grants Guidelines METROPOLITAN TRANSPORTATION COMMISSION
 Climate Initiatives Program Competitive Grants Guidelines METROPOLITAN TRANSPORTATION COMMISSION Climate Change: A Serious Issue for the Bay Area Climate change refers to changes in the Earth s weather
CITY OF AUSTIN. Transportation Demand Management Successes and Progress 2017
 CITY OF AUSTIN Transportation Demand Management Successes and Progress 2017 TDM What Does That Stand For? Transportation demand management, or TDM, offers the solution that dozens of major U.S. cities
SURVEY REPORT. National Capital Region Transportation Planning Board STATE OF THE COMMUTE. From the Metropolitan Washington DC Region
 2016 STATE OF THE COMMUTE SURVEY REPORT From the Metropolitan Washington DC Region National Capital Region Transportation Planning Board Metropolitan Washington Council of Governments State of the Commute
This memo provides an analysis of Environment Program grantmaking from 2004 through 2013, with projections for 2014 and 2015, where possible.
 Date: July 1, 2014 To: Hewlett Foundation Board of Directors From: Tom Steinbach Subject: Program Grant Trends Analysis This memo provides an analysis of Program grantmaking from 2004 through 2013, with
Transit Operations Funding Sources
 Chapter 7. Funding Operations Funding Funding has increased about 56% in absolute terms between 1999 and 2008. There have been major variations in individual funding sources over this time, including the
2018 POLICY FRAMEWORK FOR PSRC S FEDERAL FUNDS
 2018 POLICY FRAMEWORK FOR PSRC S FEDERAL FUNDS TABLE OF CONTENTS Section 1: Background... 3 A. Policy Framework... 3 B. Development of the 2019-2022 Regional Transportation Improvement Program (TIP)..
how to reduce carbon emissions and connect people
 Daily Mobility in Medium Density Areas how to reduce carbon emissions and connect people Francisco Luciano & Nicolas Raillard November, 10th 2017 www.theshiftproject.org Transport 126 MtCO 2 /year in mainland
CITY OF LOS ANGELES TELECOMMUTING PROJECT
 JALA International, Inc. CITY OF LOS ANGELES TELECOMMUTING PROJECT Final Report Executive Summary March 1993 This report was prepared as a result of work sponsored by the Department of Telecommunications.
NORTH AYRSHIRE COUNCIL WRITTEN SUBMISSION
 NORTH AYRSHIRE COUNCIL WRITTEN SUBMISSION National Indicator: Reduce Scotland s Carbon Footprint The two national housing policy/standards areas that are directing North Ayrshire Council in assisting with
Fort Meade Regional Growth Management Committee BRAC TDM. Vanpool Boot Camp
 Fort Meade Regional Growth Management Committee BRAC TDM Vanpool Boot Camp November 7, 2011 Contact Contact: Jean Friedberg Regional Transportation Coordinator Fort Meade Regional Growth Management Committee
Appendix - A: Telecommuter Questionnaire
 Appendix - A: Telecommuter Questionnaire Introduction: Dear fellow IT professionals. Thank you for deciding to participate in this questionnaire. The questionnaire collects information about you and your
Contact Center Costs: The Case for Telecommuting Agents
 IP Telephony Contact Centers Mobility Services WHITE PAPER Contact Center Costs: The Case for Telecommuting Agents July 2006 avaya.com Table of Contents Abstract... 1 Section 1: Defining Telecommuting
Appendix E: Grant Funding Sources
 Appendix E: Grant Funding Sources Federal Programs The majority of public funds for bicycle, pedestrian, and trails projects are derived through a core group of federal and state programs. Federal funding
Washington Community Survey and Stakeholder Focus Group
 Washington Community Survey and Stakeholder Focus Group 1 Agenda Themes Survey Methodology and Respondents Profile of Part-Time Residents Comparison of Full-Time Versus Part-Time Residents Demographics
WestminsterResearch
 WestminsterResearch http://www.wmin.ac.uk/westminsterresearch Potential impacts of teleworking on transport systems Peter White 1 Helena Titheridge 2 David Moffat 3 1 School of Architecture and the Built
PUBLIC TRANSPORTATION & COMMUTER VANPOOL PASSENGER SUBSIDY COMPONENT REMOVE II PROGRAM GUIDELINES, POLICIES, AND PROCEDURES
 PUBLIC TRANSPORTATION & COMMUTER VANPOOL PASSENGER SUBSIDY COMPONENT REMOVE II PROGRAM GUIDELINES, POLICIES, AND PROCEDURES SECTION I INTRODUCTION T he San Joaquin Valley Air Pollution Control District
NAPA COUNTY GRAND JURY
 NAPA COUNTY GRAND JURY 2016-2017 June 22, 2017 FINAL REPORT NAPA VALLEY TRANSPORTATION AGENCY VISION 2040 PLAN County Traffic Problems Need a Comprehensive Plan with Measurable Results 2 NAPA VALLEY TRANSPORTATION
South Dakota Smart Transportation: Save Money and Grow the Economy
 South Dakota Smart Transportation: Save Money and Grow the Economy Keep South Dakota Moving in the Right Direction Save Money by Taking Better Care of What You Have 1. Dedicate more to maintain and repair
Drive America s Economy Forward by Reinvesting in Municipal Infrastructure
 Drive America s Economy Forward by Reinvesting in Municipal Infrastructure WWW.NLC.ORG/INFRASTRUCTURE Drive America s Economy Forward Drive America s Economy Forward by Reinvesting in Municipal Infrastructure
Transportation Demand Management (TDM)
") DEVELOPMENT OF A REGIONAL TRANSPORTATION PLAN FOR THE GREATER TORONTO AND HAMILTON AREA Transportation Demand Management (TDM) Presentation to Metrolinx Board February 8, 2008 TDM Primer TDM is the use
DEVELOPMENT OF A REGIONAL TRANSPORTATION PLAN FOR THE GREATER TORONTO AND HAMILTON AREA Transportation Demand Management (TDM) Presentation to Metrolinx Board February 8, 2008 TDM Primer TDM is the use
Chapter 13. Other Travel Mode Alternatives. Ohio Kentucky Indiana Regional Council of Governments Regional Transportation Plan
 Chapter 13 Other Travel Mode Alternatives Ohio Kentucky Indiana Regional Council of Governments CHAPTER 13 OTHER TRAVEL MODE ALTERNATIVES INTRODUCTION It is in the region s public interest to plan for
2007 Annual List of Obligated Projects
 This document is available in accessible formats when requested five days in advance. This document was prepared and published by the Memphis Metropolitan Planning Organization and is prepared in cooperation
Measuring the Cost of Patient Care in a Massachusetts Health Center Environment 2012 Financial Data
 Primary Care Provider Costs Measuring the Cost of Patient Care in a Massachusetts Health Center Environment 0 Financial Data Massachusetts Respondents Alexander, Aronson, Finning & Co., P.C. (AAF) was
Summary of Austin Independent School District Telecommuting Surveys
 January 2018 Publication 17.09i Summary of Austin Independent School District Telecommuting Surveys PICTURE PLACEHOLDER Table of Contents Overview of Telecommuting in AISD... 4 Lessons on Logistics of
2014 VMT REPORT NCDOT PUBLIC TRANSPORTATION DIVISION
 2014 VMT REPORT NCDOT PUBLIC TRANSPORTATION DIVISION Session Law 1999-328, The Ambient Air Quality Improvement Act, established statewide goals for reducing the growth of vehicle miles travelled (VMT)
Economic Development Strategy
 2017-2022 Economic Development Strategy Township of Muskoka Lakes Economic Development 1 Bailey Street, Port Carling, Ontario, P0B 1J0 www.muskokalakes.ca economic.development@muskokalakes.ca 705-765-3156
ADDENDUM TO THE CAMPUS TRAVEL SURVEY AND THE CAMPUS TRAVEL SURVEY REPORTS
 ADDENDUM TO THE 2015-16 CAMPUS TRAVEL SURVEY AND THE 2016-17 CAMPUS TRAVEL SURVEY REPORTS Institute of Transportation Studies and Transportation and Parking Services University of California, Davis Prepared
USING TELECOMMUNICATIONS TO REDUCE YOUR ORGANISATION'S CARBON FOOTPRINT. Dr. Turlough F. Guerin
 USING TELECOMMUNICATIONS TO REDUCE YOUR ORGANISATION'S CARBON FOOTPRINT Dr. Turlough F. Guerin Group Manager Environment, Telstra L33/242 Exhibition St, Melbourne 3001 Email: turlough.guerin@team.telstra.com
Fleet and Marine Corps Health Risk Assessment, 02 January December 31, 2015
 Fleet and Marine Corps Health Risk Assessment, 02 January December 31, 2015 Executive Summary The Fleet and Marine Corps Health Risk Appraisal is a 22-question anonymous self-assessment of the most common
INTRODUCTION. RTPO Model Program Guide February 27, 2007 Page 1
 TABLE OF CONTENTS INTRODUCTION... 1 HOW TO USE THIS GUIDE... 2 SECTION I: LAND USE AND TRANSPORTATION CONTEXT... 3 SECTION II: MINIMUM CRITERIA FOR GROWTH AND TRANSPORTATION EFFICIENCY CENTERS... 5 SECTION
2017 ARIZONA LEADERS IN BUSINESS SURVEY
 2017 ARIZONA LEADERS IN BUSINESS SURVEY KEY FINDINGS Your Business Matters. (602) 389-3500 alliancebankofarizona.com LETTER FROM THE CEO We are pleased to share the results of our second annual Arizona
Transportation Alternatives Program Application For projects in the Tulsa Urbanized Area
 FFY 2015-2016 Transportation Alternatives Program Application For projects in the Tulsa Urbanized Area A Grant Program of Moving Ahead for Progress in the 21st Century (MAP-21) U.S. Department of Transportation
Municipal Stream. Community Transportation Grant Program. Application Guidelines and Requirements Issued: December 2017
 Community Transportation Grant Program Municipal Stream Application Guidelines and Requirements 2017 Issued: December 2017 Ministry of Transportation Municipal Transit Policy Office Transit Policy Branch
REMOVE II Public Transportation Subsidy and Park-and-Ride Lot Component GUIDELINES, POLICIES, AND PROCEDURES GUIDELINES, POLICIES, AND PROCEDURES
 REMOVE II Public Transportation Subsidy and Park-and-Ride Lot Component GUIDELINES, POLICIES, AND PROCEDURES GUIDELINES, POLICIES, AND PROCEDURES SECTION I INTRODUCTION The San Joaquin Valley Air Pollution
THE STATE OF THE DIGITAL NATION
 THE STATE OF THE DIGITAL NATION an myob business monitor Special Report October 2014 Love your work 2 The State of the Digital Nation an MYOB Business Monitor Special Report For a small trading country,
Summary of Findings. Data Memo. John B. Horrigan, Associate Director for Research Aaron Smith, Research Specialist
 Data Memo BY: John B. Horrigan, Associate Director for Research Aaron Smith, Research Specialist RE: HOME BROADBAND ADOPTION 2007 June 2007 Summary of Findings 47% of all adult Americans have a broadband
NC General Statutes - Chapter 136 Article 19 1
 Article 19. Congestion Relief and Intermodal 21 st Century Transportation Fund. 136-250. Congestion Relief and Intermodal Transportation 21 st Century Fund. There is established in the State treasury the
of American Entrepreneurship: A Paychex Small Business Research Report
 2018 Accelerating the Momentum of American Entrepreneurship: A Paychex Small Business Research Report An analysis of American entrepreneurship during the past decade and the state of small business today
Economic Development Element of the Arroyo Grande General Plan. Prepared by the City of Arroyo Grande Community Development Department
 Economic Development Element of the Arroyo Grande General Plan Prepared by the City of Arroyo Grande Community Development Department Adopted by City Council Resolution No. 4489 on October 9, 2012 Table
Workforce intelligence publication Individual employers and personal assistants July 2017
 Workforce intelligence publication Individual employers and personal assistants July 2017 Source: National Minimum Data Set for Social Care (NMDS-SC) and new Skills for Care survey research. This report
SUSTAINABLE TRAVEL GRANT SCHEME GUIDANCE NOTES. For. Matched Funded Grants Maximum 2,000
 SUSTAINABLE TRAVEL GRANT SCHEME GUIDANCE NOTES For Matched Funded Grants Maximum 2,000 2017-2018 Strathclyde Partnership for Transport (SPT) has created a Sustainable Travel Grant Scheme (STGS) which councils,
WHY BROADBAND? By Joe A. Sumners, Ph.D., Director, Economic & Community Development Institute, Auburn University
 WHY BROADBAND? By Joe A. Sumners, Ph.D., Director, Economic & Community Development Institute, Auburn University What is Broadband? Broadband, or highspeed Internet access, is the ability to send and receive
2018 and 2020 Regional Congestion Mitigation Air Quality Improvement Program (CMAQ) Grant Application
 Grant Application") 2018 and 2020 Regional Congestion Mitigation Air Quality Improvement Program (CMAQ) Grant Application PROJECT TITLE: INTERCITY TRANSIT BUS STOP ENHANCEMENTS TRPC use only GENERAL PROJECT INFORMATION Agency
2018 and 2020 Regional Congestion Mitigation Air Quality Improvement Program (CMAQ) Grant Application PROJECT TITLE: INTERCITY TRANSIT BUS STOP ENHANCEMENTS TRPC use only GENERAL PROJECT INFORMATION Agency
PUBLIC TRANSPORTATION
 PUBLIC TRANSPORTATION 2017 Educational Series PUBLIC TRANSPORTATION OVERVIEW Federal and state law both require the Texas Department of Transportation (TxDOT) to support and promote public transportation
Exhibit 1 Racial Profiling Quarterly Report October 1, 2014 thru December 31, 2014
 Exhibit 1 Racial Profiling Quarterly Report October 1, 2014 thru December 31, 2014 Racial Profiling Report for Fourth Quarter 2014 Page 1 Racial Profiling Quarterly Report for the period ending December
2018 State of County Transportation Jim Hartnett, General Manager/CEO
 2018 State of County Transportation Jim Hartnett, General Manager/CEO What a difference a year makes. A year ago my report to the community focused on three themes: 1. The challenges facing San Mateo County
THE WHITESIDE COUNTY, ILLINOIS AREA LABOR AVAILABILITY REPORT
 THE WHITESIDE COUNTY, ILLINOIS AREA LABOR AVAILABILITY REPORT July, 2012 Compiled and Prepared by THE PATHFINDERS www.thepathfindersus.com TABLE OF CONTENTS I. INTRODUCTION...1 II. III. KEY FINDINGS...2
THE CPA AUSTRALIA ASIA-PACIFIC SMALL BUSINESS SURVEY 2016
 THE CPA AUSTRALIA ASIA-PACIFIC SMALL BUSINESS SURVEY GENERAL REPORT FOR AUSTRALIA, CHINA, HONG KONG, INDONESIA, MALAYSIA, NEW ZEALAND, SINGAPORE AND VIETNAM Legal notice CPA Australia Ltd ( CPA Australia
Broadband KY e-strategy Report
 Broadband KY e-strategy Report Utilizations and Impacts of Broadband for Businesses, Organizations and Households This report was prepared by Strategic Networks Group in partnership with. May 24, 2012
Urban Partnership Communications Plan
 Urban Partnership Communications Plan CONTENTS URBAN PARTNERSHIP OVERVIEW 01 COMMUNICATIONS PLAN 02 TOLLING 04 TRANSIT 05 TECHNOLOGY 06 TRANSPORTATION DEMAND MANAGEMENT 07 APPENDICES A: SR 520 Bridge Tolling
TRANSPORTATION AUTHORITY OF MARIN
 2018 Marin County Transportation Sales Tax Renewal Expenditure Plan APRIL 2018 TRANSPORTATION AUTHORITY OF MARIN DRAFT FINAL PLAN TRANSPORTATION AUTHORITY OF MARIN Board of Commissioners Damon Connolly,
2007 CDW Telework Report: Slow and Steady Wins the Race
 2007 CDW Telework Report: Slow and Steady Wins the Race Introduction CDW, Inc. has tracked the adoption of telework within the Federal government since 2005. Its annual Telework Report is the only concurrent
Commuter Assistance Program Evaluation
 Commuter Assistance Program Evaluation October 2012 PROJECT NO. BDK84 943-34 PREPARED FOR Florida Department of Transportation Commuter Assistance Program Evaluation BDK84 943-34 Prepared for: Florida
Toward Development of a Rural Retention Strategy in Lao People s Democratic Republic: Understanding Health Worker Preferences
 Toward Development of a Rural Retention Strategy in Lao People s Democratic Republic: Understanding Health Worker Preferences January 2012 Wanda Jaskiewicz, IntraHealth International Outavong Phathammavong,
The adult social care sector and workforce in. North East
 The adult social care sector and workforce in 2015 Published by Skills for Care, West Gate, 6 Grace Street, Leeds LS1 2RP www.skillsforcare.org.uk Skills for Care 2016 Copies of this work may be made for
Assessing the Effect of Compressed Work Week Strategy on Transportation Network Performance Measures
 JTRF Volume 54 No. 2, Summer 2015 Assessing the Effect of Compressed Work Week Strategy on Transportation Network Performance Measures by Venkata R. Duddu and Srinivas S. Pulugurtha The focus of this paper
NOFA No MBI-01. Massachusetts Technology Collaborative 75 North Drive Westborough, MA
 FLEXIBLE GRANT PROGRAM NOTICE OF FUNDING AVAILABILITY FOR INNOVATIVE APPROACHES TO PROVIDE BROADBAND SERVICE TO UNSERVED TOWNS IN WESTERN MASSACHUSETTS NOFA No. 2018-MBI-01 Massachusetts Technology Collaborative