Chief of Police Charlie Beck
|
|
|
- Susanna Day
- 5 years ago
- Views:
Transcription


1 Chief of Police Charlie Beck

2 LOS ANGELES POLICE DEPARTMENT COMMUNITY ORIENTED. DATA DRIVEN.


3 Table of Contents A Message from Chief Beck: Eight Years in Review. Executive Summary: LAPD 2017 Use of Force Highlights. Statistical Snapshot: A Glance at 2017 City of Los Angeles Statistics. Less-Lethal Deployment: LAPD Tools to De-Escalate Dangerous Encounters. Organizational Developments: LAPD Digital In-Car and Body-Worn Video Programs. Statistical Analysis: An In-Depth Analysis of LAPD s Use of Force Data. 6 Purpose of the Use of Force Year-End Review 8 A Message from the Chief of Police, Charlie Beck 10 Los Angeles Board of Police Commissioners 20 Executive Summary 42 Core Values 44 Department Structure & Resources Statistical Snapshot 64 Agency to Agency Comparison 66 Department Training & Development 76 Less-Lethal Deployment 86 Organizational Developments: LAPD Digital In-Car and Body-Worn Video Programs 94 The Office of Constitutional Policing & Policy 98 Mapping Resources 106 The Use of Force 112 Medical Care of Arrestees 114 The Investigation, Review, & Adjudication Process 128 Personnel Complaints Resulting from Use of Force Incidents 132 Officer Wellness & Suitability to Return to Duty 134 Statistical Analysis 137 Officer Involved Shooting Incidents 166 Officer Involved Shooting Hit Incidents 195 Officer Involved Shooting No Hit Incidents 220 Animal Shooting Incidents 233 Unintentional Discharge Incidents 246 In-Custody Death Incidents 266 Carotid Restraint Control Hold Incidents 276 Law Enforcement Related Injury Incidents 292 Head Strike Incidents 300 Canine (K9) Contact Incidents 310 Warning Shot Incidents 316 Non-Categorical Use of Force Incidents Officer Involved Shooting Synopses & Photographs of Recovered Suspect Weapons 390 Definitions 394 Acronyms 396 Methodology 400 Index EDITORIAL Charlie Beck, Chief of Police Jorge A. Villegas, Assistant Chief Director, Office of Administrative Services John McMahon, Captain III Commanding Officer, Use of Force Review Division Larry Barr, Lieutenant II Officer-in-Charge, Categorical Review Section Keith Gordon, Lieutenant II Officer-in-Charge, Non-Categorical Review Section Use of Force Review Division AUTHORS John McMahon, Captain III Robert von Voigt, Sergeant II Jens Back, Police Officer III Ryan Gonzales, Police Officer III Use of Force Review Division GRAPHIC DESIGN Boris Quintanilla, Police Officer II Use of Force Review Division STATISTICIANS & ANALYSTS Tony Chu, Police Officer III Gregory Hall, Police Officer III Colleen Olmedo, Management Analyst Use of Force Review Division PHOTOGRAPHY Jin Cho, Police Officer II Media Relations Division Justin Sturm, Police Officer II Olympic Division USE OF FORCE YEAR-END REVIEW

4 {PURPOSE} As with past efforts and accomplished solutions, the Los Angeles Police Department continually strives to maintain its global leadership role in transparency, innovation, and service. The Use of Force Year-End Review stands as a symbol of those principles. Following several highly publicized police shootings throughout the United States in 2015, the Los Angeles Board of Police Commissioners (BOPC), executive body of the Los Angeles Police Department (Department), requested the Chief of Police (COP) to provide a comprehensive internal report regarding the Department s use of force (UOF). In response, the Department published the Use of Force Year-End Review (Report), an annual five-year comparison study now released in its third edition. The Report has come to serve as a vital platform of measurability and analysis of the Department s UOF occurrences. In review of the statistics published herein, the Department seeks to identify areas where potentially ineffective or outdated UOF-related policies and training can be enhanced, and new innovative practices can be implemented. A notable change was the 2016 concept of tactical de-escalation; the use of techniques to reduce the intensity of an encounter with a suspect and enable an officer to have additional options to gain voluntary compliance or mitigate the need to use a higher level of force while maintaining control of a situation. The components of tactical de-escalation, as prominent as they were in past Department practices and training, needed to be refined and more thoroughly articulated. As such, the development of tactical de-escalation as a concept, and ultimately a policy change, provided the Department a more effective and functional way of introducing the embodied material to officers. As of April 2017, tactical de-escalation has been featured in the preamble of the Department s UOF policy and has become a crucial element in officers decision-making processes. The Department is also committed to learning from the greater law enforcement community through sharing of knowledge and experiences that have become best practices. Honest self-examination is necessary to shift organizational methods to align with current conditions. As Los Angeles Police Commissioner Matthew Johnson has stated: Any healthy organization must pause every now and again to do some self-examination and make sure that it s using the best and most current methods, giving its employees the best tools, and meeting the public s expectations, as well as its own. This Department must always strive to be the best in the Nation. That means that we must constantly re-evaluate what we are doing and be willing to be self-critical so that we are always moving forward, always improving. The Report serves as a vital instrument in the selfassessment process and is an important medium in sharing of information with the public. As with past efforts and accomplished solutions, the Department continually strives to maintain its global leadership role in transparency, innovation, and service. The Use of Force Year-End Review stands as a symbol of those principles. LOS ANGELES POLICE DEPARTMENT 7

5 {CHIEF S MESSAGE} Serving the citizens of Los Angeles for over 40 years has been the honor of a lifetime. Leading the men and women of the Los Angeles Police Department my family has been a privilege I never thought I d be worthy of. Over the past eight years, the Department has steadily progressed in a direction that was collaboratively charted by a vast group of stakeholders. Coupled with the institutional knowledge and expertise derived from generations of dedicated police officers and civilian employees, the Department is continuing toward a positive future. A significant aspect of that direction is the Department s approach to the use of force. With the publication of the third annual edition of the Use of Force Year-End Review, the Department strives to ensure that the topic of use of force is always at the forefront of discussion at all levels within the Department, as well as within the community. Areas of chief importance that have been instrumental in how use of force is approached are training, accountability, and transparency. Although there have been missed opportunities and instances that have generated criticism, the organization has never been more committed to enhancing use of force-related training, conducting thorough use of force investigations, or improving transparency. Field personnel are the embodiment of the Department s fundamental objective of protecting and serving the residents of the City of Los Angeles. Therefore, it is of utmost importance for the organization to make all resources available to assist them in their efforts. In recognition of current needs, the Department initiated a managed attrition program in 2017, returning officers from administrative assignments to patrol functions. Sworn members of the Department completed training in implicit bias, building of public trust, reverence for human life, de-escalation techniques, and use of force update classes. Tactical de-escalation has been thoroughly defined and incorporated into the Department s use of force policy. All officers assigned to field duties have been equipped with TASERs and a majority of the patrol vehicles have new beanbag shotgun brackets installed inside the cabin to make this less-lethal device readily available as a force option to minimize the use of lethal force. Transformative projects have been undertaken to enhance accountability of Department personnel and the public alike, while also increasing organizational transparency. For example, implementation of a digital in-car video system in patrol vehicles and body-worn video cameras had never been attempted in a city the size of Los Angeles, but such projects are now rapidly approaching successful completion. In addition to technological efforts, significant resources have been invested in the development of new relationships, while maintaining existing ones. Community Relationship Division was established to promote community engagement and foster relationships, the Mental Evaluation Unit more than doubled the number of personnel specifically trained to assist persons experiencing mental health crises, and the Family Liaison Section was created to serve as a single point of contact to effectively communicate with family members of individuals who have died during encounters with Department personnel or while in Department custody. The goal of this relationship-based policing approach is to earn public trust by establishing a common interest in a safe and prosperous city through genuine cooperation and open channels of communication. To promote inclusion of all communities, proactive steps have been taken to address allegations of biased policing through a voluntary mediation program designed to bring Department personnel and complainants together for dialogue. Additionally, the Department s Cadet program serves as an invaluable tool to nurture relationships between the Department and thousands of families throughout the City. Over 2,000 youths are currently participating in the program, which aims to develop fundamental skills needed for life-long success. As the core value of Quality Through Continuous Improvement implies, the Department s pursuit to remain a national leader in law enforcement will never cease. The vision, progress, and resolve that the people of this diverse City exemplify will fuel that mission for decades to come. The leadership needed to guide this great organization into the future is eagerly waiting to continue building on efforts geared toward keeping the residents of the City and the members of the Department safe. LOS ANGELES POLICE DEPARTMENT 9


6 {BOARD OF POLICE COMMISSIONERS} Steve Soboroff, President Commissioner Soboroff was appointed to the BOPC in He served as President from the time of his appointment until 2015, when he assumed the role of Vice President. In September 2017, Commissioner Soboroff was unanimously voted to his second term as President by his fellow Commissioners. Commissioner Soboroff is a prominent business leader and public servant throughout the Los Angeles area. He is a senior fellow at the University of California, Los Angeles School of Public Policy, a member of the Board of Councilors at the University of Southern California s Price School of Public Policy, and the Chairman of the Center for the Study of Los Angeles at Loyola Marymount University. Matthew M. Johnson Vice President Commissioner Johnson was appointed to the BOPC in After serving two years as President, he was unanimously elected Vice President by his fellow Commissioners in September Commissioner Johnson is an entertainment attorney and partner at Ziffren Brittenham LLP. He is a graduate of Rutgers University and New York University School of Law. Sandra Figueroa-Villa Commissioner Commissioner Figueroa-Villa was appointed to the BOPC in She has extensive experience working in the nonprofit sector and substantial involvement in addressing social issues in Los Angeles. Commissioner Figueroa-Villa has been appointed to various commissions and boards in the Los Angeles area and is a graduate of the California State University, Los Angeles. BOARD of POLICE COMMISSIONERS Cynthia McClain-Hill Commissioner Commissioner McClain-Hill was appointed to the BOPC in She is an attorney, co-founder, and Managing Director of the Los Angeles-based Strategic Counsel PLC. Commissioner McClain-Hill received a Bachelor s degree in political science from the University of California, Los Angeles, and later her Juris Doctorate from the University of California, Los Angeles School of Law. Shane Murphy Goldsmith Commissioner Commissioner Goldsmith was appointed to the BOPC in She is the President and CEO of the Liberty Hill Foundation, an institution dedicated to providing funding and leadership training for community-based organizations within Los Angeles County. Commissioner Goldsmith received her Master s Degree in Public Administration from California State University, Long Beach, and is a graduate of Kenyon College USE OF FORCE YEAR-END REVIEW LOS ANGELES POLICE DEPARTMENT 11

7 {BOARD OF POLICE COMMISSIONERS} DEVELOPMENTS INITIATIVES & Relative to Use of Force The Los Angeles Board of Police Commissioners serves as the Department s oversight body, whose members are appointed by the mayor and confirmed by the City Council. The BOPC is responsible for establishing policy, implementing necessary reform measures, improving the Department s service to the community, reducing crime, and enhancing community policing programs. Among other essential functions, the BOPC continually strives to improve the Department s best practices relative to the UOF. Fact: The Board of Police Commissioners adjudicated 73 Categorical Use of Force (CUOF) cases in In 2018, the BOPC approved the Department s recommendation for the release of relevant video imagery that depicts the actions and events leading up to, and including, critical incidents within 45 days of the date of incident. In 2017, the BOPC oversaw the following UOF-related developments and initiatives to aid in the Department s reduction of UOF occurrences, especially those resulting in more critical encounters with members of the public: Tactical De-escalation Consistent with the Department s guiding principle of the Reverence for Human Life, the BOPC worked diligently toward formally establishing tactical de-escalation in the UOF policy framework. With the guidance of the BOPC and other stakeholders, the Department incorporated tactical de-escalation in the preamble of the Department s UOF policy in April Body-Worn Video (BWV) The BOPC continued its oversight role with respect to the continued rollout of BWV among the remaining Areas/ Divisions projected for BWV implementation. As of yearend 2017, 24 of the 25 geographic Areas and traffic Divisions had operational BWV programs. Digital In-Car Video System (DICVS) The BOPC continued its oversight role with respect to the continued rollout of DICVS among the remaining Areas/ Divisions projected for DICVS implementation. As of year-end 2017, 22 of the 25 geographic Areas and traffic Divisions had operational DICVS programs. Release of Department Video Footage In September 2017, the BOPC received feedback from the Policing Project of the New York University School of Law, which was selected to research Department and public opinion regarding the release of video footage of critical incidents, particularly officer involved shooting (OIS) and in-custody death (ICD) occurrences. After careful review of the various technical and legal aspects, and in addition to feedback gathered from the public and other stakeholders, the BOPC approved the Department s proposed video release policy in March Biased Policing and Procedural Justice Between March and October 2017, a vast majority of sworn personnel attended mandated training on implicit bias and community policing, which was facilitated by Dr. Bryan Marks, national expert on implicit bias and professor of psychology at Morehouse College. With the BOPC s continued efforts to improve procedural justice with the City of Los Angeles (City) diverse communities and the Department s continued drive to build public trust, Commissioners adopted numerous recommendations from the Office of the Inspector General (OIG) to improve best practices and organizational reform in May As part of the adopted recommendations, the BOPC supported the motion that the Department continue examining solutions for procedural justice compliance and include procedural justice in existing policies, procedures, and programs. There were seven recommendation categories, containing 25 subsections, detailing procedural justice, biased policing, and accountability recommendations that were adopted. Homelessness Based on recent BOPC efforts, and led by Commissioner Goldsmith, the Department has made numerous organizational changes in support of the City s efforts to address homelessness. In 2017, the Department continued the expansion of its Homeless Outreach and Proactive Engagement (HOPE) teams, which at year-end comprised of 41 personnel serving all four geographic Bureaus. Department HOPE personnel work in partnership with staff from the Los Angeles Homeless Service Authority (LAHSA) and the Los Angeles Department of Public Works, Bureau of Sanitation to assist individuals experiencing homelessness with access to suitable social services, medical treatment, and housing resources. Personnel assigned to HOPE teams contacted 16,312 individuals in 2017 and made 3,134 referrals to available resources. In 2017, the Department standardized data gathering and the formal objectives of the new Resource Enhancement and Services Enforcement Team (RESET), which at yearend comprised of 62 personnel assigned to the 3.4 square mile area in Central Division known as Skid Row. Personnel assigned to RESET are tasked with providing individuals experiencing homelessness in this area with access to various resources and outreach programs, while also taking enforcement action when necessary. In 2017, RESET officers contacted 2,637 individuals and made 482 referrals to available resources. In partnership between Department personnel and employees from LAHSA, 229 homeless individuals were placed in shelters in Additionally, 23 individuals were provided permanent placement, 17 were reunited with family, and 76 were provided alternate placement solutions (transitional housing, rehabilitation, etc.). Mental Health In furtherance of the BOPC s efforts to address mental health, specifically as it relates to UOF incidents, the Department continued its efforts to provide individuals with mental illnesses, or those experiencing mental health crises, with available resources in The following are examples of ongoing efforts: 1 The Department continues to provide new officers, and those working assignments interacting primarily with persons experiencing homelessness, with the 40-hour Mental Health Intervention Training (MHIT) course; 2 Department personnel work along-side professionals from the Department of Mental Health (DMH) and the National Alliance for the Mentally Ill (NAMI) for improved service results; 3 The Mental Evaluation Unit (MEU), which has been an instrumental Department asset in serving individuals with mental illnesses, or those experiencing mental health crises, continues to deploy System-wide Mental Assessment Response Team (SMART) assets to assist field personnel; and, 4 Tactical de-escalation training, newly established Department protocols (including the Office of Operations [OO] Communications Division Divisional Order No. 8, Response Protocol for Calls Involving Knives, Swords, or any Edged Weapon, and No. 9, Response Protocols for Calls Involving Mental Illness), and the deployment of more effective less-lethal devices in recent years, continues to have a positive impact on the disposition of mental health-related calls for service USE OF FORCE YEAR-END REVIEW LOS ANGELES POLICE DEPARTMENT 13

8 2017 OIS INCIDENTS 44 total OIS incidents 72% of OIS suspects were armed with either a firearm or an edged weapon. 10% increase of OIS incidents compared to % above the 2013 through 2016 annual average. 110 officers were involved, an average of 2.5 officers per incident, and a 92% increase compared to the 2016 average of % of OIS incidents involved 1 5 rounds fired by officers. 1 Black 6 White 23% of OIS incidents involved suspects shooting at officers and/or third-parties. Ethnicity of OIS decedents 10 Hispanic 17 TOTAL 4OIS 53% incidents assigned involved 9 or more officers, 1.6 Excluding accounting for 47 of the total 110 officers. DRUGS/ALCOHOL 42% of completed autopsies for deceased suspects indicated the presence of methamphetamine. Officer to incident average 42% of completed autopsies for deceased suspects indicated the presence of alcohol. of those 47 officers were assigned to Metropolitan Division and 47% were to patrol. those four incidents, 2017 had an average of 1.6 officers per incident (63 Department personnel involved in 40 OIS incidents). METROPOLITAN DIVISION 9 44 of the total OIS incidents involved Metropolitan Division. 18 years of service The 34 Metropolitan Division officers involved in OIS incidents had an average of 18 years of service. 100% of OIS incidents involved a suspect armed with a firearm. 44% of OIS incidents involved a suspect actively shooting at officers and/or third-parties METROPOLITAN DIVISION IN PERSPECTIVE 0 TOTAL FIREARMS recovered in 2017 (all activities) NUMBER OF OIS INCIDENTS PER YEAR USE OF FORCE YEAR-END REVIEW LOS ANGELES POLICE DEPARTMENT 15

9 Planning Assessment Time Redeployment and/or Containment Other Resources Lines of Communication Under rapidly evolving circumstances, especially when a suspect poses an imminent threat of death or serious bodily injury, officers may not have sufficent time or reasonable options to resolve the situation without the need to use objectively reasonable force. De-escalation Options Asking open-ended questions Giving clear & direct orders Defusing Verbal warnings Empathy Reasonable appeal Persuasion Personal appeal Redirecting Building rapport Deflection Advisements Distance Cover Time USE OF FORCE YEAR-END REVIEW LOS ANGELES POLICE DEPARTMENT 17
10 2017 NCUOF INCIDENTS NON-CATEGORICAL USE OF FORCE Beanbag use 31% in NCUOF incidents increased by 31% compared to 2016, and also continued in a five-year upward trend, exceeding the 2013 through 2016 aggregate percentage of four percent by one percentage point. Attacks on Officers 741 attacks on LAPD officers in 2017, a 26% increase compared to the annual average of 588 incidents. Firearm Recoveries 26% 19% 15% 6,555 firearm recoveries, an 11% increase from 2016, and a 19% increase compared to aggregate percentage. Field Detentions 15% increase in field detentions from OC use 42% in NCUOF incidents decreased by 42% compared to 2016, and continued in a five-year downward trend. Baton use 41% in NCUOF incidents decreased by 41% compared to 2016, and also continued in a five-year downward trend. Armed with Firearm 55% 14 suspects armed with firearm: a 55% increase compared to 2016 Armed with Impact Device 121% 31 suspects armed with impact device: a 121% increase compared to 2016 Armed with Edged Weapon 20% 61 suspects armed with knife: a 20% increase compared to 2016 Metropolitan Division had 181 NCUOF incidents involving a total of 394 personnel. Transit Services Division Metropolitan NCUOF Incidents vs Officers Average Number of Metropolitan Officers per NCUOF incident 25 NCUOF incidents in 2017 involving a total of 79 personnel. Incidents Officers Five-year average USE OF FORCE YEAR-END REVIEW LOS ANGELES POLICE DEPARTMENT 19
. Officer Involved Shooting incidents are categorized into Hit or No Hit occurrences. For the full OIS section, refer to page 137.")
11 {EXECUTIVE SUMMARY OIS} OFFICER INVOLVED SHOOTING INCIDENTS An incident in which a Department employee intentionally discharges a firearm (excluding Warning Shot, Animal Shooting, and/or Tactical Intentional Discharge incidents). Officer Involved Shooting incidents are categorized into Hit or No Hit occurrences. For the full OIS section, refer to page 137. ANNUAL DEPARTMENT TOTALS DEPT TTL OIS Department Total In 2017, Department personnel were involved in 44 OIS incidents, an increase of four incidents, or 10 percent, compared to CLASSIFICATION EXECUTIVE SUMMARY 2017 USE OF FORCE YEAR-END REVIEW I II III IV V VI VII UNK In 2017, 17 of the 44 total OIS incidents, or 39 percent, were categorized as Classification II shootings. This accounted for an 11 percentage point decrease compared to 50 percent in In 2017, 15 of the 44 total OIS incidents, or 34 percent, were categorized as Classification V shootings. This accounted for a 16.5 percentage point increase compared to 17.5 percent in In 2017, 10 of the 44 total OIS incidents, or 23 percent, were categorized as Classification I shootings. This accounted for a 5.5 percentage point increase compared to 17.5 percent in Classification I II III IV V VI VII Unknown Total Classification I II III IV V VI VII Description Suspect verified with firearm - fired at officer or 3 rd party Suspect verified with firearm - firearm in hand or position to fire (but did not fire) Perception shooting - firearm present but not drawn Perception shooting - no firearm found Suspect armed with weapon other than firearm Suspect not armed, but threat of/causing serious bodily injury or death to others Other USE OF FORCE YEAR-END REVIEW LOS ANGELES POLICE DEPARTMENT 21
12 {EXECUTIVE SUMMARY OIS} SOURCE OF ACTIVITY OFFICER UNIT OF ASSIGNMENT RCALL OBS CZN FD PRE-PLN SCALL AMB OFF DTY OTH Source Radio Call Observation Citizen Flag Down Pre-Planned Station Call Ambush Off-Duty Other Total ADMIN METRO PATROL SPCL INV CSD OTH Unit Administrative Metropolitan Patrol Specialized Investigative Custody Other Total In 2017, 19 of the Department s 44 OIS incidents, or 43 percent, originated from radio calls. This accounted for an 18 percentage point increase compared to 25 percent in In 2017, 12 of the Department s 44 OIS incidents, or 27 percent, originated from field detentions based on officers observations (i.e. pedestrian and traffic stops). This OFFICER - ETHNICITY accounted for a 23 percentage point decrease compared to 50 percent in In 2017, seven of the Department s 44 OIS incidents, or 16 percent, originated from pre-planned activities (i.e. warrant services; parole/probation checks; etc.). This accounted for an 8.5 percentage point increase compared to 7.5 percent in In 2017, 48 personnel assigned to patrol were involved in OIS incidents, which represented 44 percent of the 110 total personnel. This accounted for a three percentage point increase compared to 41 percent in In 2017, 34 personnel assigned to Metropolitan Division were involved in OIS incidents, which represented 31 percent of the 110 total personnel. This accounted for a 19 percentage point increase compared to 12 percent in In 2017, 22 personnel assigned to specialized assignments were involved in OIS incidents, which represented 20 percent of the 110 total personnel. This accounted for a 13 percentage point decrease compared to 33 percent in In 2017, six personnel assigned to investigative assignments were involved in OIS incidents, which represented five percent of the 110 total personnel. This accounted for a nine percentage point decrease compared to 14 percent in AM IND ASN BLK FILIP HISP WHT OTH In 2017, 53 Hispanic officers were involved in OIS incidents, which represented 48 percent of the 110 total employees. This accounted for a 23 percentage point decrease compared to 71 percent in In 2017, 42 White officers were involved in OIS incidents, which represented 38 percent of the 110 total employees. This accounted for an 18 percentage point increase compared to 20 percent in In 2017, five Asian/Pacific Islander officers were involved in OIS incidents, which represented five percent of the 110 total employees. This accounted for a one percentage point increase compared to four percent in Ethnicity American Indian Asian/Pacific Islander Black Filipino Hispanic White Other Total Ethnicity City Population Department Personnel OIS Personnel Asian/Pacific Isl. 12% 8% 5% Black 9% 10% 5% Hispanic 49% 47% 48% White 28% 32% 38% Other 2% 3% 5% Total 100% 100% 100% In 2017, five Black officers were involved in OIS incidents, which represented five percent of the 110 total employees. This accounted for a one percentage point increase compared to four percent in TOTAL NUMBER OF ROUNDS FIRED BY OFFICERS PER YEAR TTL RNDS AVG RNDS ANNUAL AVERAGE OF ROUNDS FIRED PER INCIDENT OIS Total Rounds In 2017, 487 rounds were fired during all 44 OIS incidents. When compared to the 2016 total of 194 rounds fired, 2017 experienced an increase of 293 rounds, or 151 percent. OIS Average Rounds In 2017, an average of 11.1 rounds were fired during OIS incidents. When compared to the 2016 average of 4.9 rounds fired, 2017 experienced an increase of 6.2 rounds, or 127 percent USE OF FORCE YEAR-END REVIEW LOS ANGELES POLICE DEPARTMENT 23
13 {EXECUTIVE SUMMARY OIS} OFFICER HIT RATIO SUSPECT AGE RNDS FRD HITS The 2017 total number of rounds fired compared to the total number of rounds which struck their intended targets resulted in a hit ratio of 18 percent. This accounted for a 24 percentage point decrease compared to 42 percent in SUSPECT ETHNICITY AM IND ASN BLK FILIP HISP WHT OTH UNK HIT RTO OIS Rounds Fired Hits Hit Ratio (%) 20% 34% 38% 42% 18% Ethnicity American Indian Asian/Pacific Islander Black Filipino Hispanic White Other Unknown Total >59 UNK In 2017, most suspects involved in OIS incidents were in the age group. Specifically, 16 of the 46 total suspects, or 35 percent, were included in this category. The age category accounted for a 20 percentage point increase compared to 15 percent in In 2017, the age group represented the second largest age category, with 10 out of the 46 total suspects, or 22 percent. The age category accounted for a 15 percentage point decrease compared to 37 percent in In 2017, the age group represented the third largest age category, with seven out of the 46 total suspects, or SUSPECT PERCEIVED MENTAL ILLNESS Age and Above Unknown Total percent. The age category accounted for a 12 percentage point decrease compared to 27 percent in In 2017, the age group represented the fourth largest age category, with six out of the 46 total suspects, or 13 percent. The age category accounted for a 11 percentage point increase compared to two percent in In 2017, the 0-17 age group included two out of the 46 total OIS suspects, or four percent. The 0-17 age category accounted for an eight percentage point decrease compared to 12 percent in YES In 2017, 26 Hispanic suspects were involved in OIS incidents, which represented 57 percent of the 46 total suspects. This accounted for a one percentage point increase compared to 56 percent in In 2017, 10 White suspects were involved in OIS incidents, which represented 22 percent of the 46 total suspects. This accounted for a 20 percentage point increase compared to two percent in Ethnicity City Population Violent Crime Suspect OIS Suspect Asian/Pacific Isl. 12% (See Other) 0% Black 9% 44% 20% Hispanic 49% 40% 57% White 28% 8% 22% Other 2% 3% 0% NO UNK DNA Per. Mental Illness Yes No Unknown DNA Total In 2017, nine Black suspects were involved in OIS incidents, which represented 20 percent of the 46 total suspects. This accounted for a 12 percentage point decrease compared to 32 percent in Unknown DNA 5% 2% Total 100% 100% 100% In 2017, 13 of the 46 total suspects, or 28 percent, involved in OIS incidents were perceived to suffer from a mental illness and/or a mental health crisis. This accounted for an 18 percentage point increase compared to 10 percent in USE OF FORCE YEAR-END REVIEW LOS ANGELES POLICE DEPARTMENT 25
14 {EXECUTIVE SUMMARY OIS} DECEASED SUSPECT TOXICOLOGY RESULTS SUSPECT HOMELESS 1 YES YES NO UNK Substance Present Yes NO Homeless Yes N/A N/A N/A 2 3 PEND No Unknown/Pending Total UNK No N/A N/A N/A Unknown N/A N/A N/A 2 3 Total Of the 17 decedents involved in 2017 OIS incidents, 12 of whom have completed toxicology examinations by the Los Angeles County Department of Medical Examiner Coroner, 10 individuals, representing 83 percent of those completed cases, had positive results for alcohol and/or a controlled substance(s). Toxicology reports for five decedents, or 29 percent of the 17 total, are pending from the Los Angeles County Department of Medical Examiner Coroner s Office. In 2017, three of the 46 total suspects, or approximately seven percent, involved in OIS incidents were homeless. This accounted for a two percentage point increase compared to five percent in SUSPECT TOXICOLOGY ANALYSIS SUSPECT WEAPON/FORCE ALCOH COCA MARIJ METH OPIATE PCP PSYCH OTH UNK NONE PEND In 2017, five of the 12 OIS decedents with completed toxicology examinations, or 42 percent, had positive results for alcohol. This partial 2017 percentage accounted for a 37 percentage point increase compared to five percent of decedents with positive alcohol results in 2016 OIS incidents. In 2017, five of the 12 OIS decedents with completed toxicology examinations, or 42 percent, had positive results for methamphetamine. This partial 2017 percentage accounted for an 11 percentage point decrease compared to 53 percent of decedents with positive methamphetamine results in 2016 OIS incidents. In 2017, four of the 12 OIS decedents with completed toxicology examinations, or 33 percent, had positive results Substance Alcohol 13% 22% 24% 5% N/A Cocaine 13% 28% 5% 0% N/A Marijuana 40% 33% 43% 47% N/A Methamphetamine 40% 28% 52% 53% N/A Opiates 0% 6% 0% 0% N/A PCP 0% 0% 5% 0% N/A Psychiatric Medication 13% 11% 5% 0% N/A Other 0% 0% 0% 0% N/A Unknown 7% 6% 0% 0% N/A None 27% 28% 24% 11% N/A Substance Alcohol Cocaine Marijuana Methamphetamine Opiates PCP Psychiatric Medication Other Unknown None Pending for marijuana. This partial 2017 percentage accounted for a 14 percentage point decrease compared to 47 percent of decedents with positive marijuana results in 2016 OIS incidents. AUTO EDGED FARM IMPACT PERCP PHYS REPL OTH UNK NONE In 2017, 24 firearms were utilized by suspects during OIS incidents, which represented 52 percent of the 46 total weapon types. This accounted for a nine percentage point decrease compared to 61 percent in In 2017, nine edged weapons were utilized by suspects during OIS incidents, which represented 20 percent of the 46 total weapon types. This accounted for an eight percentage point increase compared to 12 percent in In 2017, four replica/pellet guns were utilized by suspects during OIS incidents, which represented approximately nine percent of the 46 total weapon types. This accounted Weapon Type Automobile Edged Weapon Firearm Impact Device Perception Physical Force Replica/Pellet Other Unknown None Total for a one percentage point decrease compared to 10 percent in In 2017, four impact devices were utilized by suspects during OIS incidents, which represented approximately nine percent of the 46 total weapon types. This accounted for an increase of four impact device units when compared to In 2017, three suspects were perceived to be armed with a weapon (perception-based shooting), which represented approximately seven percent of the 46 total weapon types. This accounted for a two percentage point increase compared to five percent in The Department was directed by the BOPC to track homeless data for suspects involved in CUOF incidents starting in Force Investigation Division has since implemented new procedures to capture this statistic USE OF FORCE YEAR-END REVIEW LOS ANGELES POLICE DEPARTMENT 27
15 {EXECUTIVE SUMMARY OIS} SUSPECT INJURIES DEPARTMENT ADJUDICATION 2 ADJUDICATION IN POLICY INJ DEC UNK Category Injured Deceased Unknown Total TAC D&E N-LETH L-LETH LETH LETH-NO Category Tactics N/A Drawing & Exhibiting N/A Non-Lethal N/A Less Lethal N/A Lethal N/A Lethal-No Findings N/A Total N/A In 2017, 17 suspects died from police gunfire, resulting in a death occurring in 39 percent of the 44 total OIS incidents (none of the 44 incidents had more than one decedent). When compared to the 2016 total of 19 deaths (excluding one suspect who suffered a fatal self-inflicted gunshot wound), the number of deceased suspects decreased by two individuals, or 11 percent, in In 2017, 14 suspects sustained injuries from police gunfire during 13 OIS incidents, resulting in an injury from police gunfire (other than a fatal injury) in 30 percent of the 44 total OIS incidents (one of the 44 incidents included two suspects who both suffered non-fatal injuries from police gunfire). When compared to the 2016 total of nine suspects injured by police gunfire, the number of injured suspects increased by five individuals, or 56 percent, in Also in 2017, six suspects sustained injuries during OIS-No Hit incidents from causes other than police gunfire. One outstanding suspect s injury status remained unknown as of year-end In 2016, 23 out of the 50 total OIS Tactics findings, representing 46 percent, were adjudicated as Tactical Debrief. This accounted for a 24 percentage point decrease compared to 62 percent in When compared to the aggregate percentage of Tactical Debrief Tactics findings from 2013 through 2015 of 80 percent, 2016 experienced a 34 percentage point decrease. In 2016, 50 out of the 50 total OIS Drawing/Exhibiting findings, representing 100 percent, were adjudicated as In Policy (No Further Action). This accounted for a 1.3 percentage point increase compared to 98.7 percent in In 2016, the lethal force in one OIS incident resulted in a No Findings decision by the BOPC. 3 As such, 49 total Lethal force findings were rendered for the year. Of those 49 findings, 43, or 88 percent, were adjudicated as In Policy (No Further Action). This accounted for a two percentage point increase compared to 86 percent in ETHNICITY OF DECEASED SUSPECTS ADJUDICATION OUT OF POLICY AM IND ASN BLK FILIP HISP WHT OTH Of the 17 decedents involved in OIS incidents in 2017, 10 individuals, or 59 percent, were Hispanic. This accounted for a six percentage point decrease compared to 65 percent in Of the 17 decedents involved in OIS incidents in 2017, six individuals, or 35 percent, were White. This accounted for Ethnicity American Indian Asian/Pacific Islander Black Filipino Hispanic White Other Total a 30 percentage point increase compared to five percent in Of the 17 decedents involved in OIS incidents in 2017, one individual, or six percent, was Black. This accounted for a 19 percentage point decrease compared to 25 percent in TAC D&E N-LETH L-LETH LETH In 2016, 27 out of the 50 total OIS Tactics findings, representing 54 percent, were adjudicated as Administrative Disapproval. This accounted for a 16 percentage point increase compared to 38 percent in In 2016, none of the 50 total OIS Drawing/Exhibiting findings were adjudicated as Out of Policy (Administrative Disapproval). Category Tactics N/A Drawing & Exhibiting N/A Non-Lethal N/A Less Lethal N/A Lethal N/A Total N/A In 2016, the lethal force in one OIS incident resulted in a No Findings decision by the BOPC. As such, 49 total Lethal force findings were rendered for the year. Of those 49 findings, six, or 12 percent, were adjudicated as Out of Policy (Administrative Disapproval). This accounted for a two percentage point decrease compared to 14 percent in Adjudication data for 2017 was omitted from this Report since a vast majority of the CUOF incidents will be adjudicated by the BOPC in The Department s statute of limitations for adjudication of a CUOF incident is one year from the date of incident. When the case is heard by the BOPC for adjudication, a quorum of three of the five BOPC members is required for a majority decision of an adjudicative finding. In this instance, the case was heard by the BOPC during two closed session meetings. However, no majority decision was reached, and thus, no adjudicative lethal force finding was rendered USE OF FORCE YEAR-END REVIEW LOS ANGELES POLICE DEPARTMENT 29
16 {EXECUTIVE SUMMARY ICD} IN-CUSTODY DEATH INCIDENTS The death of an arrestee or detainee who is in the custodial care of the Department (2017 LAPD Manual 3/792.05). For the full ICD section, refer to page 246. Note: Per Special Order No.10 (dated May 10, 2011), the Department is authorized to reclassify CUOF ICD investigations to Death Investigations when the Los Angeles County Department of Medical Examiner Coroner s Office determines that the concerned subject s death was caused by natural, accidental, or undetermined means; and when the incident did not involve a UOF or evidence of foul play. 4 ANNUAL DEPARTMENT TOTALS SUSPECT ETHNICITY AM IND ASN BLK FILIP HISP WHT OTH Ethnicity American Indian Asian/Pacific Islander Black Filipino Hispanic White Other Total DEPT TTL In-Custody Death Department Total In 2017, Department had five ICD incidents, an increase of three incidents, or 150 percent, compared to In 2017, three Hispanic suspects were involved in ICD incidents, which represented 60 percent of the five total suspects. This accounted for a 10 percentage point increase compared to 50 percent in In 2017, two White suspects were involved in ICD incidents, which represented 40 percent of the five total suspects. This accounted for a 40 percentage point increase compared to zero percent in Ethnicity City Population Violent Crime Suspect ICD Suspect Asian/Pacific Isl. 12% (See Other) 0% Black 9% 44% 0% Hispanic 49% 40% 60% White 28% 8% 40% Other 2% 3% 0% Unknown DNA 5% 0% Total 100% 100% 100% SOURCE OF ACTIVITY SUSPECT GENDER RCALL OBS CZN FD PRE-PLN SCALL AMB OFF DTY OTH Source Radio Call Observation Citizen Flag Down Pre-Planned Station Call Ambush Off-Duty Other Total w Female Male In 2017, all five suspects involved in ICD incidents throughout the year, or 100 percent, were male. This accounted for a 50 percentage point increase compared to 50 percent in Gender Female Male Total In 2017, three of the Department s five ICD incidents, or 60 percent, had sources of activity designated as other. This accounted for a 10 percentage point increase compared to 50 percent in In 2017, two of the Department s five ICD incidents, or 40 percent, originated from radio calls. This accounted for a 40 percentage point increase compared to zero percent in Cases reclassified from ICD investigations to Death Investigations: F039-16; F048-16; F065-16; F069-16; F075-16; and F USE OF FORCE YEAR-END REVIEW LOS ANGELES POLICE DEPARTMENT 31
17 {EXECUTIVE SUMMARY ICD} SUSPECT AGE SUSPECT TOXICOLOGY ANALYSIS > In 2017, two of the five suspects involved in ICD incidents, or 40 percent, were in the age range. This particular age category accounted for a 10 percentage point decrease compared to 50 percent in Age and Above Total In 2017, two of the five suspects involved in ICD incidents, or 40 percent, were in the age range. This particular age category accounted for a 40 percentage point increase compared to zero percent in ALCOH COCA MARIJ METH OPIATE PCP PSYCH OTH UNK NONE PEND Substance Alcohol Cocaine Marijuana Methamphetamine Opiates PCP Psychiatric Medication Other Unknown None Pending SUSPECT PERCEIVED MENTAL ILLNESS YES NO Per. Mental Illness Yes No Total In 2017, one of the five total suspects, representing 20 percent, involved in an ICD incident was perceived to suffer from a mental illness and/or a mental health crisis. This accounted for a 20 percentage point increase compared to zero percent in In 2017, both of the ICD decedents with completed toxicology examinations, or 100 percent, had positive results for methamphetamine. This partial 2017 percentage accounted for a 50 percentage point increase compared to 50 percent of decedents with positive methamphetamine results in 2016 ICD incidents. In 2017, one of the two ICD decedents with completed toxicology examinations, or 50 percent, had positive results for marijuana. This partial 2017 percentage accounted for a 50 percentage point increase compared to zero percent of decedents with positive marijuana results in 2016 ICD incidents. Substance Alcohol 0% 0% 22% 50% N/A Cocaine 25% 75% 11% 0% N/A Marijuana 50% 25% 22% 0% N/A Methamphetamine 50% 25% 44% 50% N/A Opiates 25% 0% 22% 50% N/A PCP 25% 0% 0% 0% N/A Psychiatric Medication 25% 25% 11% 50% N/A Other 0% 0% 0% 0% N/A Unknown 0% 0% 0% 0% N/A None 0% 0% 33% 0% N/A DECEASED SUSPECT TOXICOLOGY RESULTS SUSPECT HOMELESS 5 YES NO PEND Of the five decedents involved in 2017 ICD incidents, two of which that have completed toxicology examinations by the Los Angeles County Department of Medical Examiner Coroner, both individuals, representing 100 percent of those completed cases, had positive results for alcohol Substance Present Yes No Unknown/Pending Total and/or a controlled substance(s). Toxicology reports for the remaining three decedents, or 60 percent of the five total decedents, are pending from the Los Angeles County Department of Medical Examiner Coroner s Office. YES NO UNK Homeless Yes N/A N/A N/A 0 1 No N/A N/A N/A 2 4 Unknown N/A N/A N/A 0 0 Total In 2017, one of the five total suspects, representing 20 percent, involved in an ICD incident was homeless. This accounted for a 20 percentage point increase compared to zero percent in The Department was directed by the BOPC to track homeless data for suspects involved in CUOF incidents starting in Force Investigation Division has since implemented new procedures to capture this statistic USE OF FORCE YEAR-END REVIEW LOS ANGELES POLICE DEPARTMENT 33
18 {EXECUTIVE SUMMARY NCUOF} SUSPECT MANNER OF DEATH 6 ACC HOM OD SUIC UND PEND Manner Accidental Homicide Overdose Suicide Undetermined Pending Total NON-CATEGORICAL USE OF FORCE An incident in which any on-duty Department employee, or off-duty employee whose occupation as a Department employee is a factor, uses a less-lethal control device or physical force to compel a person to comply with the employee s direction; overcome resistance of a person during an arrest or a detention; or, defend any individual from an aggressive action by another person (2017 LAPD Manual 4/245.05). For the full NCUOF section, refer to page 316. ANNUAL DEPARTMENT TOTALS In 2017, one of the five decedents, representing 20 percent, died from accidental causes. One additional suspect, again representing 20 percent, died from a manner of death indicative of homicide. The three remaining decedents, or 60 percent, currently have pending manner of death classifications, pending completion of their respective investigations by FID. DEPT TTL ,000 1,500 2,000 2,500 NCUOF Department Total 1,801 1,863 1,825 1,925 2,117 In 2017, Department personnel were involved in 2,117 NCUOF incidents, an increase of 192 incidents, or 10 percent, compared to LEVEL TOTALS LVL I LVL II ,000 1,500 2,000 Level Level I Level II 1,633 1,672 1,669 1,773 1,941 Total 1,801 1,863 1,825 1,925 2,117 In 2017, 1,941 NCUOF incidents were Level II occurrences, which represented 92 percent of the 2,117 total incidents. This represented no change when compared to the same percentage in In 2017, 176 NCUOF incidents were Level I occurrences, which represented eight percent of the 2,117 total incidents. This represented a marginal increase when compared to The Los Angeles County Department of Medical Examiner Coroner determines the manner of death. As of year-end 2017, the Department was awaiting the completion of three autopsy reports from the Coroner s office, which include manner of death determinations USE OF FORCE YEAR-END REVIEW LOS ANGELES POLICE DEPARTMENT 35
19 {EXECUTIVE SUMMARY NCUOF} FORCE OPTION TASER INFORMATION 40MM BTN/IMP DEV BB SGUN BDY WGT FGRP/JLCK OC OTH PHY FRCE STRK/KCK/PNCH TDOWN/LSWP TASER ,000 1,500 2,000 Number of NCUOF Incidents Each Force Option was Applied Force Option 40MM Launcher Baton/Impact Device Beanbag Shotgun Body Weight 1,279 1,335 1,301 1,394 1,563 Firm Grip/Joint Lock 1,440 1,539 1,511 1,627 1,825 OC Spray Other Physical Force ,009 1,274 Strike/Kick/Punch Takedown/Leg Sweep TASER DEPT TTL ,200 1,500 ANNUAL EFFECTIVENESS TOTALS & PERCENTAGES TASER Activations Department Total ,137 1,363 1,224 In 2017, Department personnel activated a TASER device 1,224 times during the 578 NCUOF incidents in which TASERs were utilized, resulting in an average of 2.12 activations per incident. This accounted for a 10 percent decrease compared to the 2016 average activations per incident of MM Percentage of NCUOF Incidents Each Force Option was Applied YES BTN/IMP DEV BB SGUN BDY WGT FGRP/JLCK OC OTH PHY FRCE STRK/KCK/PNCH TDOWN/LSWP TASER 0% 20% 40% 60% 80% 100% In 2017, TASERs were utilized in 578, or 27 percent, of the 2,117 NCUOF incidents. This accounted for a three percentage point decrease compared to 30 percent in Force Option 40MM Launcher 0% 0% 0% <1% <1% Baton/Impact Device 3% 3% 3% 2% 1% Beanbag Shotgun 3% 3% 4% 4% 5% Body Weight 71% 72% 71% 72% 74% Firm Grip/Joint Lock 80% 83% 83% 85% 86% OC Spray 6% 5% 5% 3% 2% Other 13% 18% 19% 20% 17% Physical Force 44% 45% 44% 52% 60% Strike/Kick/Punch 23% 19% 16% 10% 10% Takedown/Leg Sweep 44% 42% 40% 40% 37% TASER 22% 22% 29% 30% 27% In 2017, batons were utilized in 23, or one percent, of the 2,117 NCUOF incidents. This accounted for a one percentage point decrease compared to two percent in NO EFCT % 0% 10% 20% 30% 40% 50% 60% 70% 80% TASER Effectiveness Yes No Total ,137 1,363 1,224 TASER Effectiveness Effectiveness Percentage 60% 64% 53% 57% 54% In 2017, TASER activations were effective 663 times during NCUOF incidents, which represented 54 percent of the 1,224 total activations. This accounted for a three percentage point decrease compared to 57 percent in In 2017, beanbag shotguns were utilized in 97, or five percent, of the 2,117 NCUOF incidents. This accounted for a one percentage point increase compared to four percent In 2017, OC spray was utilized in 32, or two percent, of the 2,117 NCUOF incidents. This accounted for a one percentage point decrease compared to three percent in In 2017, Strikes/Kicks/Punches were utilized in 207, or 10 percent, of the 2,117 NCUOF incidents. This represented no change when compared to the same percentage in USE OF FORCE YEAR-END REVIEW LOS ANGELES POLICE DEPARTMENT 37
20 {EXECUTIVE SUMMARY NCUOF} SOURCE OF ACTIVITY OFFICER INJURIES CZN FD OBS RCALL SCALL OTH UNK ,000 1,200 Source Citizen Flag Down Obervation Radio Call ,010 1,070 1,181 Station Call Other Unknown Total 1,801 1,863 1,825 1,925 2,117 YES NO 0 1,000 2,000 3,000 4,000 5,000 6,000 7,000 8,000 Injuries Yes No 4,265 4,595 4,933 5,480 6,416 Total 4,934 5,225 5,588 6,118 7,110 In 2017, 694 officers sustained injuries during the 2,117 NCUOF incidents throughout the year. This accounted for a nine percent increase compared to 638 injured officers in In 2017, 1,181 of the Department s 2,117 NCUOF incidents, or 56 percent, originated from radio calls. This represented no change when compared to the same percentage in OFFICER ETHNICITY AM IND ASN BLK HISP WHT OTH ,000 1,500 2,000 2,500 3,000 3,500 4,000 In 2017, 3,860 Hispanic officers were involved in NCUOF incidents, which represented 54 percent of the 7,110 total employees. This accounted for a one percentage point increase compared to 53 percent in In 2017, 2,057 White officers were involved in NCUOF incidents, which represented 29 percent of the 7,110 total employees. This accounted for a two percentage point decrease compared to 31 percent in In 2017, 639 Asian/Pacific Islander officers were involved in NCUOF incidents, which represented nine percent of the 7,110 total employees. This represented no change when compared to the same percentage of involved Asian/Pacific Islander officers in In 2017, 593 of the Department s 2,117 NCUOF incidents, or 28 percent, originated from field detentions based on officers observations (i.e. pedestrian and traffic stops). This represented no change when compared to the same percentage in Ethnicity American Indian Asian Black Hispanic 2,433 2,632 2,944 3,234 3,860 White 1,625 1,743 1,746 1,889 2,057 Other Total 4,934 5,225 5,588 6,118 7,110 Ethnicity City Population Department Personnel NCUOF Personnel Asian/Pacific Isl. 12% 8% 9% Black 9% 10% 7% Hispanic 49% 47% 54% White 28% 32% 29% Other 2% 3% 1% Total 100% 100% 100% SUSPECT ETHNICITY AM IND ASN BLK HISP WHT OTH UNK ,000 In 2017, 972 Hispanic suspects were involved in NCUOF incidents, which represented 45 percent of the 2,163 total suspects. This represented no change when compared to In 2017, 802 Black suspects were involved in NCUOF incidents, which represented 37 percent of the 2,163 total suspects. This accounted for a one percentage point decrease compared to 38 percent in In 2017, 309 White suspects were involved in NCUOF incidents, which represented 14 percent of the 2,163 total suspects. This represented no change when compared to Ethnicity American Indian Asian Black Hispanic White Other Unknown Total 1,860 1,933 1,896 1,996 2,163 Ethnicity City Population Violent Crime Suspect NCUOF Suspect Asian/Pacific Isl. 12% (See Other) 1% Black 9% 44% 37% Hispanic 49% 40% 45% White 28% 8% 14% Other 2% 3% 2% Unknown DNA 5% 0% Total 100% 100% 100% USE OF FORCE YEAR-END REVIEW LOS ANGELES POLICE DEPARTMENT 39
21 {EXECUTIVE SUMMARY NCUOF} SUSPECT AGE SUSPECT PERCEIVED HOMELESS >57 UNK Age and Above Unknown Total 1,860 1,933 1,896 1,996 2,163 YES NO/UNK ,000 1,500 2,000 In 2017, 607 of the 2,163 total suspects, or 28 percent, involved in NCUOF incidents were perceived to be SUSPECT PERCEIVED MENTAL ILLNESS Homeless Yes No/Unknown 1,556 1,579 1,468 1,493 1,556 Total 1,860 1,933 1,896 1,996 2,163 homeless. This accounted for a three percentage point increase compared to 25 percent in YES In 2017, the age group accounted for 498 of the 2,163 total suspects involved in NCUOF incidents, or 23 percent. This specific age category accounted for a one percentage point increase compared to 22 percent in In 2017, the age group represented the second largest age category, with 367 out of the 2,163 total suspects, or 17 percent. The age category accounted for a two percentage point increase compared to 15 percent in In 2017, the age group represented the third largest age category, with 337 out of the 2,163 total suspects, or 16 percent. The age category accounted for a two percentage point decrease compared to 18 percent in NO UNK ,000 1,500 2,000 Mental Illness Yes No 1,451 1,508 1,413 1,443 1,486 Unknown Total 1,860 1,933 1,896 1,996 2,163 SUSPECT PERCEIVED IMPAIRMENT In 2017, 662 of the 2,163 total suspects, or 31 percent, involved in NCUOF incidents were perceived to suffer from a mental illness and/or a mental health crisis. This accounted for a four percentage point increase compared to 27 percent in ALC DRG & ALC DRG DRG OR ALC NO UNK ,000 1,200 In 2017, 934 of the 2,163 total suspects, or 43 percent, involved in NCUOF incidents were perceived to be impaired by drugs and/or alcohol. This represented no change when Impairment Alcohol Impaired Drug & Alcohol Impaired Drug Impaired Drug or Alcohol Impaired No Impression ,121 Unknown Total 1,860 1,933 1,896 1,996 2,163 compared to the same percentage of impaired suspects in 2016 NCUOF incidents. SUSPECT INJURIES YES NO UNK ,000 1,500 2,000 Injuries Yes 1,616 1,701 1,656 1,726 1,786 No Unknown Total 1,860 1,933 1,896 1,996 2,163 In 2017, 1,786 suspects sustained injuries during the 2,117 NCUOF incidents, which represented 83 percent of the 2,163 total suspects. This represented a three percentage point decrease compared to 86 percent in USE OF FORCE YEAR-END REVIEW LOS ANGELES POLICE DEPARTMENT 41

22 Los Angeles Core Police Department SERVICE TO OUR COMMUNITIES We are dedicated to enhancing public safety and reducing the fear and the incidence of crime. People in our communities are our most important customers. Our motto To Protect and to Serve is not just a slogan - it is our way of life. We will work in partnership with the people in our communities and do our best, within the law, to solve community problems that effect public safety. We value the great diversity of people in both our residential and business communities and serve all with equal dedication. REVERENCE FOR THE LAW We have been given the honor and privilege of enforcing the law. We must always exercise integrity in the use of the power and authority that have been given to us by the people. Our personal and professional behavior should be a model for all to follow. We will obey and support the letter and spirit of the law. INTEGRITY IN ALL WE SAY AND DO Integrity is our standard. We are proud of our profession and will conduct ourselves in a manner that merits the respect of all people. We will demonstrate honest, ethical behavior in all our interactions. Our actions will match our words. We must have the courage to stand up for our beliefs and do what is right. Throughout the ranks, the Los Angeles Police Department has a long history of integrity and freedom from corruption. Upholding this proud tradition is a challenge we must all continue to meet. COMMITMENT TO LEADERSHIP We believe the Los Angeles Police Department should be a leader in law enforcement. We also believe that each individual needs to be a leader in his or her area of responsibility. Making sure that our values become part of our day-to-day work life is our mandate. We must each work to ensure that our co-workers, our professional colleagues, and our communities have the highest respect for the Los Angeles Police Department. RESPECT FOR PEOPLE Working with the Los Angeles Police Department should be challenging and rewarding. Our people are our most important resource. We can best serve the many and varied needs of our communities by empowering our employees to fulfill their responsibilities with knowledge, authority, and appropriate discretion. We encourage our people to submit ideas, we listen to their suggestions, and we help them develop to their maximum potential. We believe in treating all people with respect and dignity. We show concern and empathy for the victims of crime and treat violators of the law with fairness and dignity. By demonstrating respect for others, we will earn respect for the Los Angeles Police Department. QUALITY THROUGH CONTINUOUS IMPROVEMENT We will strive to achieve the highest level of quality in all aspects of our work. We can never be satisfied with the status quo. We must aim for continuous improvement in serving the people in our communities. We value innovation and support creativity. We realize that constant change is a way of life in a dynamic city like Los Angeles, and we dedicate ourselves to proactively seeking new and better ways to serve USE OF FORCE YEAR-END REVIEW

 Van Nuys Area Mission Area North Hollywood Area Foothill Area Devonshire Area West Valley Area Topanga Area Valley")
23 {DEPARTMENT STRUCTURE & RESOURCES} DEPARTMENT STRUCTURE & RESOURCES CHIEF OF STAFF OFFICE OF THE CHIEF OF POLICE CHARLIE BECK Chief of Police PROFESSIONAL STANDARDS BUREAU EMPLOYEE RELATIONS GROUP Photograph provided courtesy of UCLA Blueprint. David Sprague, Photographer Jim Newton, Editor-in-Chief. OPERATIONS CENTRAL BUREAU (OCB) Central Area Rampart Area Hollenbeck Area Northeast Area Newton Area Central Traffic OPERATIONS WEST BUREAU (OWB) Wilshire Area Hollywood Area West LA Area Olympic Area Pacific Area West Traffic LAX Field Services OPERATIONS VALLEY BUREAU (OVB) Van Nuys Area Mission Area North Hollywood Area Foothill Area Devonshire Area West Valley Area Topanga Area Valley Traffic OPERATIONS SOUTH BUREAU (OSB) 77th Street Area Southwest Area Harbor Area Southeast Area South Bureau Homicide Division South Traffic TRANSIT SERVICES BUREAU Transit Services Division OFFICE OF OPERATIONS MICHEL R. MOORE First Assistant Chief, Director The Department s general policing activities are managed through OO, which is responsible for a majority of the Department s sworn personnel. There are five Bureaus within OO, which are further divided into 21 geographic Areas, four traffic Divisions, South Bureau Homicide Division, Transit Services Division, and COMPSTAT Division. The Office of Operations is overseen by First Assistant Chief Michel Moore. COMPSTAT DIVISION USE OF FORCE YEAR-END REVIEW LOS ANGELES POLICE DEPARTMENT 45


24 {DEPARTMENT STRUCTURE & RESOURCES} INFORMATION TECHNOLOGY BUREAU (ITB) Information Technology Division Application Development & Support Division ADMINISTRATIVE SERVICES BUREAU Motor Transport Division Personnel Division Recruitment & Employment Division Communications Division Records & Identification Division Facilities Management Division OFFICE OF SPECIAL OPERATIONS BEATRICE M. GIRMALA Assistant Chief, Director The Office of Special Operations (OSO), overseen by Assistant Chief Beatrice Girmala, is responsible for various specialized uniform and investigative resources within the Department, and is allocated the second most sworn personnel between the four Offices. OFFICE OF ADMINISTRATIVE SERVICES JORGE A. VILLEGAS Assistant Chief, Director The Office of Administrative Services (OAS), overseen by Assistant Chief Jorge Villegas, is responsible for various technical and administrative functions of the Department. Assistant Chief Villegas also serves as the chairman of the Use of Force Review Board (UOFRB). POLICE SCIENCES & TRAINING BUREAU (PSTB) Police Training & Education (PTE) Training Division USE OF FORCE REVIEW DIVISION (UOFRD) BEHAVIORAL SCIENCE SERVICES (BSS) FISCAL OPERATIONS DIVISION EMPLOYEE ASSISTANCE UNIT HYDRA DETECTIVE BUREAU Robbery Homicide Division Juvenile Division Forensic Science Division Technical Investigation Division Gang & Narcotics Division Detective Support & Vice Division Commercial Crimes Division Investigative Analysis Section COUNTER-TERRORISM & SPECIAL OPERATIONS BUREAU Metropolitan Division Air Support Division Emergency Operations Division Major Crimes Division Emergency Services Division OFFICER REPRESENTATION UNIT CUSTODY SERVICES DIVISION REAL-TIME ANALYSIS AND CRITICAL RESPONSE DIVISION SECURITY SERVICES DIVISION PROPERTY DIVISION USE OF FORCE YEAR-END REVIEW LOS ANGELES POLICE DEPARTMENT 47
 promotes the Department s steadfast commitment to building public trust through community partnerships, accountability, and effective")

25 {DEPARTMENT STRUCTURE & RESOURCES} PROFESSIONAL STANDARDS BUREAU DEBRA McCARTHY Deputy Chief, Commanding Officer OFFICE OF CONSTITUTIONAL POLICING & POLICY ARIF ALIKHAN Police Administrator III, Director The Office of Constitutional Policing & Policy (OCPP) promotes the Department s steadfast commitment to building public trust through community partnerships, accountability, and effective policies and procedures that protect and serve the City. Comprised of three groups and six Divisions, OCPP performs essential Department functions including policy development and coordination, strategic planning, risk management, internal audits and compliance, legislative affairs, public communications, coordination of the Department s extensive youth programs, and community engagement efforts that embody the Department s long-standing commitment to community policing. Police Administrator III Arif Alikhan, who holds a civilian rank equivalent to that of a sworn Assistant Chief, oversees OCPP. OFFICE OF CONSTITUTIONAL POLICING & POLICY Government Liaison Section Audit Division COMMUNITY POLICING & POLICY GROUP Community Relationship Division Youth Programs Unit Grants Section RISK MANAGEMENT LEGAL AFFAIRS GROUP Legal Affairs Division Risk Management Division Contracts Section Policies and Procedures Division Strategic Planning Section PUBLIC COMMUNICATIONS GROUP Media Relations Division SPECIAL PROJECTS OMBUDS Section Professional Standards Bureau (PSB) exercises functional command over Force Investigation Division (FID), Special Operations Division, and Internal Affairs Group (IAG). When a personnel complaint is generated as a result of an Administrative Disapproval/Out of Policy finding for a UOF, or for any misconduct discovered during the UOF investigation, IAG assumes investigative responsibility of the complaint. Once the investigative process is complete, the findings are forwarded through the respective chain of command to the COP for final disposition. Additionally, PSB oversees both the administrative and criminal aspects of OIS and other CUOF investigations, and ensures all OIS occurrences are presented to the Los Angeles County District Attorney (LACDA) for evaluation of any criminal allegations pertaining to the involved officer(s). Force Investigation Division has the investigative responsibility for criminal actions taken against and/or by Department personnel during CUOF incidents. Professional Standards Bureau is overseen by Deputy Chief Debra McCarthy. INTERNAL AFFAIRS GROUP Administrative Investigation Division Criminal Investigation Division SPECIAL OPERATIONS DIVISION FORCE INVESTIGATION DIVISION USE OF FORCE YEAR-END REVIEW LOS ANGELES POLICE DEPARTMENT 49
, enhances accountability and transparency, and allows for a more effective utilization of resources.")
26 {2017 STATISTICAL SNAPSHOT} 2017 STATISTICAL SNAPSHOT City of Los Angeles The analysis and application of data-driven strategies within the Department, specifically as it relates to the monitoring of crime levels and significant law enforcement-related occurrences (including UOF incidents), enhances accountability and transparency, and allows for a more effective utilization of resources USE OF FORCE YEAR-END REVIEW LOS ANGELES POLICE DEPARTMENT 51
27 {2017 STATISTICAL SNAPSHOT} POPULATION AND AREA 7 As of year-end 2017, the U.S. Census Bureau estimated the City population to be approximately 3.9 million residents, living within a geographical area encompassing 468 square miles. The City is proudly comprised of a diverse and multiethnic population from a vast cultural spectrum. Based on current estimates of 3.9 million residents, Los Angeles is California s most populous city and the second most populous in the nation after New York City. ASN/PAC BLK HISP WHT OTH 0 500,000 1,000,000 1,500,000 2,000,000 Ethnicity No. of Individuals Percentage Asian/Pacific Islander 451,888 12% Black 341,357 9% Hispanic 1,898,577 49% White 1,107,571 28% Other 101,401 3% Total 3,900, % Based on the U.S. Census Bureau s estimated population figures for the City, approximately 1.9 million of the total 3.9 million residents, or 49 percent, are of Hispanic descent. Approximately 1.1 million, or 28 percent, are White. Asian/Pacific Islanders represent approximately 452,000 residents, or 12 percent. Black residents represent nine percent of the population with approximately 341,000 individuals, and approximately 101,000 residents, or three percent, are designated as Other ethnicities. ECONOMY 8 As a dynamic economic hub with vibrant tourist locations and attractions, Los Angeles boasts a successful economy and greatly contributes to the economic impact of the State of California, which ranked as the world s sixth-largest economy in According to the 2017 Global Cities Index, a distinguished performance indicator that measures a city s ability to attract and retain global capital, people and ideas, as well as sustain that performance in the long term, Los Angeles ranks eighth world-wide and is categorized as one of the Global Elite (slated for continued growth and global influence in the future). 9 Based on 2012 Census figures, the City had 497,999 businesses within its boundaries. In September 2017, Los Angeles was officially selected by the International Olympic Committee as the host city for the 2028 Summer Olympic Games. CITY CRIME STATISTICS Violent Crime 10 In 2017, 29,856 violent crime incidents (consisting of homicides, rapes, robberies, and aggravated assaults) occurred throughout the City. The 2017 total accounted for an increase of 1,255 incidents, or four percent, compared to 28,601 incidents in When compared to the 2012 through 2016 annual average of 22,502 incidents, 2017 was 7,354 incidents, or 33 percent, above the four-year annual average. The City experienced 282 homicides in 2017, which accounted for a decrease of 12 individuals, or four percent, from 294 individuals in When compared to the 2012 through 2016 annual average of 277 decedents resulting from homicide-related occurrences, 2017 was five decedents, or two percent, above the five-year annual average. The data below reflects the ethnic breakdown of suspects involved in violent crime incidents during 2017: 7 United States Census Bureau, Los Angeles City QuickFacts, November 16, Fortune, June 17, 2017: 9 AT Kearney, Global Cities 2017: 10 Violent crime totals are based on the date of occurrence, as opposed to United States Department of Justice data, which uses a reporting standard based on the date the crime is reported to the Department. BLK HISP WHT OTH UNK 0 5,000 10,000 15,000 20,000 Ethnicity No. of Suspects Percentage Black 18,397 44% Hispanic 16,996 40% White 3,191 8% Other 1,355 3% Unknown 2,246 5% Total 42, % In 2017, 18,397 suspects involved in violent crime incidents in the City were of Black descent, which represented 44 percent of all 42,185 suspects involved in violent crime incidents throughout the year. During the same period, 16,996 suspects, or 40 percent, were Hispanic. White suspects accounted for 3,191 individuals, or eight percent. Lastly, 3,601 suspects, or nine percent, were classified with other or unknown ethnic origins. Part I Crime In 2017, 129,587 Part I Crime incidents (consisting of homicides, rapes, robberies, aggravated assaults, burglaries, burglaries/thefts from motor vehicles, personal/ other thefts, and auto thefts) occurred throughout the City. The 2017 total accounted for an increase of 2,209 incidents, or two percent, compared to 127,378 incidents in When compared to the 2012 through 2016 annual LAPD STATISTICS FOR 2017 Department Call for Service Information The Department received 942,320 calls for service in 2017, which accounted for an increase of 5,296 calls, or 0.6 percent, from 937,024 in When compared to the 2012 through 2016 annual average of 870,520 calls for service, 2017 was 71,800 calls, or eight percent, above the five-year annual average. In 2017, 77th Street Division accounted for the most calls for service with 58,435 out of the 942,320 total for the year, which represented approximately six percent of all calls for service generated for each of the Department s 21 geographic Divisions and other non-defined City areas. Southwest Division accounted for 56,632 calls for service, or approximately six percent. Hollywood Division had the third highest radio call count with 47,921 calls, or approximately five percent. Based on Bureau totals in 2017, Valley Bureau accounted for the most calls for service with 270,588 calls, or 29 percent, out of the 942,320 total. West Bureau accounted for the second highest count with 216,471 calls, or 23 percent. Central Bureau had the third highest count with 199,453, or 21 percent. Lastly, South Bureau accounted for the lowest radio call count with 197,534 calls, or approximately 21 percent. The remaining 58,274 calls for service, or six percent, occurred in non-defined City areas. Note: Non-defined City Areas include calls for service handled by the four traffic Divisions. average of 112,198 incidents, 2017 was 17,389 incidents, or 16 percent, above the five-year annual average. Part II Crime In 2017, 95,557 Part II Crime incidents (or less serious offenses including: simple assaults, forgery/counterfeiting, embezzlement/fraud, receiving stolen property, weapon violations, prostitution, sex crimes, crimes against family/ child, narcotic drug laws, liquor laws, drunkenness, disturbing the peace, disorderly conduct, gambling, driving under the influence and moving traffic violations) occurred throughout the City. The 2017 total accounted for a decrease of 440 incidents, or less than one percent, compared to 95,997 incidents in When compared to the 2013 through 2016 annual average of 92,439 incidents, 2017 was 3,118 incidents, or three percent, above the fouryear annual average. 77TH CENT DEV FTHL HARB HOBK HWD MISN NEWT NHWD NOE OLYM PAC RAMP SOE SOW TOP VNYS WLA WVAL WIL ND AREA 0 20,000 40,000 60, USE OF FORCE YEAR-END REVIEW LOS ANGELES POLICE DEPARTMENT 53
28 {2017 STATISTICAL SNAPSHOT} Department Public Contact Information Department personnel contacted 1,661,142 individuals in 2017, which includes those detained during field detentions and calls for service. This figure, however, is only a small fraction of the total number of individuals officers interact with on an annual basis (not accounting for interactions with members of the public other than those detained during field detentions and calls for service). The 2017 total accounted for an increase of 96,441 individuals, or six percent, from 1,564,701 individuals contacted in When compared to the 2012 through 2016 annual average of 1,652,535 individuals contacted, 2017 was 8,607 individuals, or 0.5 percent, above the five-year annual average. Department Field Detention Information Department personnel stopped 718,822 individuals in 2017 during observation-related field detentions (including both vehicle and pedestrian stops). This accounted for an increase of 91,145 individuals, or 15 percent, compared to 627,677 in When compared to the 2012 through 2016 annual average of 782,014 individuals stopped, 2017 was 63,192 individuals, or eight percent, below the five-year annual average. Department Citation Information In 2017, 232,863 traffic citations were issued. Additionally, 29,406 Release from Custody (RFC) arrest reports, which are tendered in lieu of confinement for misdemeanorrelated violations, were issued. Department Arrest Information The Department had 96,944 total arrests in 2017, which accounted for a decrease of 10,256 individuals, or 10 percent, compared to 107,200 arrests in When compared to the 2012 through 2016 annual average of 128,530 arrests, 2017 was 31,586 individuals, or 25 percent, below the five-year annual average. In 2017, 6,108 suspects arrested by Department personnel for violent crime occurrences were of Hispanic descent, which represented 48 percent of all 12,777 individuals arrested for violent crime incidents throughout the year. During the same period, 4,385 arrestees, or 34 percent, were Black. White violent crime arrestees accounted for 1,550 individuals, or 12 percent. The remaining 734 violent crime arrestees, or six percent, were classified with Asian/ Pacific Islander, other, or unknown ethnic designations. Firearms Recovered by the Department In 2017, there were 6,555 firearm recoveries resulting from all Department field operations, which accounted for an increase of 647 recovered firearms, or 11 percent, compared to 5,908 firearms in When compared to the 2012 through 2016 annual average of 5,488 firearms recovered, 2017 was 1,067 firearms, or 19 percent, above the five-year annual average. Note: These figures exclude firearms acquired through the Department s Gun Buyback Program. USE OF FORCE OVERVIEW Department personnel were involved in 78 CUOF incidents and 2,117 NCUOF incidents in The combined total of 2,195 incidents was an increase of 191 incidents, or 10 percent, compared to 2,004 incidents in Categorical Use of Force Incidents The table below depicts the CUOF totals for 2017: OIS - H Source of Activity for CUOF Incidents In 2017, 32 incidents, or 41 percent of the Department s 78 CUOF incidents, originated from radio calls generated by Communications Division. Seventeen incidents, or 22 percent, occurred during field detentions based on officers observations (i.e. pedestrian and traffic stops). Eight incidents originated as pre-planned activities, which represented 10 percent. The following depicts the remaining category totals and their respective percentages: Off-duty: seven incidents, or nine percent; On-Duty, Tactical (Unintentional Discharge [UD] incidents): one incident, or one percent; Other: three incidents, or four percent; Citizen Flag Down: three incidents, or four percent; On-Duty, Non-Tactical (UD incidents): six incidents, or eight percent; and, Station Call: one incident, or one percent. RCALL Of the 718,822 individuals stopped during 2017 observation-related field detentions, 325,690 subjects, or 45 percent, were of Hispanic decent. Black subjects The data below reflects the ethnic breakdown of violent crime arrestees in 2017: OIS - NH OIS - A CRCH OBS CZN FD PRE-PLN HSTRK SCALL BLK HISP WHT OTH 0 100, , , ,000 BLK HISP WHT OTH 0 2,000 4,000 6,000 8,000 ICD K9 LERII UD WRNG SHT AMB OFF DTY OTH ON DTY, TAC ON DTY, NTAC Ethnicity No. of Suspects Percentage Black 202,986 28% Hispanic 325,690 45% White 128,207 18% Other 61,939 9% Total 718, % accounted for 202,986 individuals stopped, representing 28 percent. White subjects accounted for 18 percent with 128,207 individuals. American Indian, Asian/Pacific Islander, and Other ethnicities accounted for 61,939 individuals, or nine percent, cumulatively. Ethnicity No. of Arrestees Percentage Black 4,385 34% Hispanic 6,108 48% White 1,550 12% Other 734 6% Total 12, % Attacks on LAPD Officers There were 741 attacks on LAPD officers in 2017, which accounted for an increase of 76 incidents, or 11 percent, compared to 665 incidents in When compared to the 2012 through 2016 annual average of 588 incidents, 2017 was 153 incidents, or 26 percent, above the five-year annual average. Category 2017 OIS - Hit 30 OIS - No Hit 14 OIS - Animal 10 CRCH 2 Head Strike 1 In-Custody Death 5 K9 Contact 4 LERII 4 UD 7 Warning Shot 1 Total 78 Source 2017 Radio Call 32 Observation 17 Citizen Flag Down 3 Pre-Planned 8 Station Call 1 Ambush 0 Off-Duty 7 Other 3 On-Duty, Tactical 1 On-Duty, Non-Tactical 6 Total USE OF FORCE YEAR-END REVIEW LOS ANGELES POLICE DEPARTMENT 55
29 USE OF FORCE & OFFICER INVOLVED SHOOTINGS in Perspective It is important to note that a vast majority of police interactions with the public do not result in a UOF. In 2017, the Department had 1,661,142 documented public contacts. During those documented public contacts, 718,822 individuals were stopped during observation-related field detentions (including both vehicle and traffic stops), 96,944 arrests were effected, and 2,195 UOF incidents occurred (44 of which were OIS incidents). 44 OCCURRENCES RESULTED IN AN OIS INCIDENT % of public contacts {2017 STATISTICAL SNAPSHOT} 2,195 USE OF FORCE INCIDENTS Only 0.13 percent (2,195) of the Department s 1,661,142 public contacts resulted in a UOF. More notably, of the same number of public contacts, only 44 incidents, or percent, resulted in an OIS. However, the Department recognizes the impact of every UOF and has implemented thorough investigative, review, and adjudicative processes to ensure that Department policies are being adhered to, and most importantly, to safeguard the constitutional rights of the public. 96,944 TOTAL ARRESTS 718,822 OBSERVATION-RELATED FFFIELD DETENTIONS 1,661,142TOTAL PUBLIC CONTACTS USE OF FORCE YEAR-END REVIEW LOS ANGELES POLICE DEPARTMENT 57

30 {2017 STATISTICAL SNAPSHOT} SUSPECT WEAPONS ORACTIONS INVOLVED IN OIS INCIDENTS by Percentage The graph below depicts the 2011 through 2017 annual percentages of seven of the most represented weapon/force types utilized by suspects in OIS incidents. As shown, firearms overwhelmingly accounted for the highest volume of weapons, with a seven-year annual average of 56 percent. During the same period, edged weapons consistently accounted for the second highest volume of weapons with a seven-year annual average of 18 percent. OIS incidents involving other weapons, perception-based shootings, and replica/pellet guns accounted for seven-year annual averages of seven percent, respectively. Impact devices accounted for four percent of weapons, and lastly one percent involved no weapons. NONE 100% OTHER IMPACT DEVICE PERCEPTION EDGED WEAPON REPLICA/PELLET 50% FIREAMS During the seven-year period from 2011 through 2017, firearms were the most utilized weapon by suspects in OIS incidents. 0% None 0% 0% 2% 0% 4% 2% 0% Other 6% 5% 4% 3% 15% 10% 4% Impact device 3% 3% 4% 3% 2% 0% 9% Perception 5% 14% 9% 7% 6% 5% 7% Edged Weapon 18% 16% 13% 27% 21% 12% 20% Replica/Pellet 6% 3% 0% 7% 13% 10% 9% Firearm 61% 59% 67% 53% 40% 61% 52% Total 100% 100% 100% 100% 100% 100% 100% In 2017, more than half of OIS suspect weapons were firearms, which was consistent with the six-year period from 2011 through 2016, where firearms accounted for 57 percent of all suspect weapons USE OF FORCE YEAR-END REVIEW LOS ANGELES POLICE DEPARTMENT 59
31 {2017 STATISTICAL SNAPSHOT} In 2017, the Department had 2,195 UOF incidents, which exceeded the 2013 through 2016 annual average of 1,938 UOF incidents by 13%. Officer Involved Shooting Incidents Of the 78 CUOF incidents in 2017, 44 were OIS occurrences. The 2017 OIS total accounted for an increase of four incidents, or 10 percent, compared to In the fouryear period from 2013 through 2016, there were a total of 164 OIS occurrences, resulting in an annual average of 41 incidents. The 2017 count exceeded the 2013 through 2016 annual average by three incidents, or seven percent. Of the 46 suspects involved in 2017 OIS incidents, 26 individuals, or 57 percent, were of Hispanic descent. White suspects accounted for 10 suspects, or 22 percent. Black suspects accounted for nine suspects, or 20 percent. The one remaining suspect, representing two percent, has an unknown ethnic designation. AM IND ASN/PAC BLK FILIP HISP WHT OTH Non-Categorical Use of Force Incidents In 2017, 2,117 NCUOF incidents occurred in the City. LVL I LVL II ,000 1,500 2,000 Level 2017 Level I 176 Level II 1,941 Total 2,117 Source of Activity for NCUOF Incidents In 2017, 1,181 of the Department s 2,117 NCUOF incidents, or 56 percent, originated from radio calls generated by Communications Division. During the same period, 593 incidents, or 28 percent, occurred during field detentions based on officers observations (i.e. pedestrian and traffic stops). The following depicts the remaining category totals and their respective percentages: Citizen Flag Down: 154 incidents, or seven percent; Other: 167 incidents, or eight percent; Station Call: 18 incidents, or one percent; and, Unknown: four incidents, or less than one percent. CZN FD OBS RCALL SCALL OTH LOS ANGELES POLICE DEPARTMENT PERSONNEL FIGURES As of December 31, 2017, the Department employed 10,060 sworn personnel, making it the third largest police department in the nation behind the New York Police Department (NYPD) and the Chicago Police Department (CPD). Sworn Personnel by Ethnicity Sworn Department personnel of Hispanic descent account for the largest ethnic category of employees in the Department with 4,777 out of the 10,060 total personnel, or 47 percent. The following depicts the remaining Department sworn personnel categories according to ethnicity along with their respective totals and percentage breakdowns: AM IND ASN/PAC BLK FILIP HISP WHT OTH 0 1,000 2,000 3,000 4,000 5,000 Ethnicity No. of Personnel Department American Indian 31 <1% Asian/Pacific Islander 765 8% Black 1,009 10% Filipino 243 2% Hispanic 4,777 47% White 3,201 32% Other 34 <1% Total 10, % Note: On a per capita basis, the Department has officers per 10,000 residents, compared to the CPD and the NYPD averages of and officers per 10,000 residents, respectively. From a geographic perspective, the Department has 21 officers per square mile, compared to the CPD with 53 officers per square mile, and NYPD with 114 officers per square mile. Sworn Personnel by Rank The Department has 6,814 employees that are at the rank of police officer, which represents 68 percent of the 10,060 total Department personnel. The following depicts the remaining Department sworn personnel categories according to rank along with their respective totals and percentage breakdowns: >CAPT CAPT LT SGT DET PO 0 2,000 4,000 6,000 8,000 Rank No. of Personnel Department Commander & Above 35 <1% Captain 78 1% Lieutenant 277 3% Sergeant 1,249 12% Detective 1,607 16% Police Officer 6,814 68% Total 10, % UNK UNK ,000 1,200 Ethnicity 2017 OIS Suspect Violent Crime Suspect City Population Asian/Pacific Islander 0% (See Other) 12% Black 20% 44% 9% Hispanic 57% 40% 49% White 22% 8% 28% Other 0% 3% 2% Unknown 2% 5% DNA Total 100% 100% 100% Source 2017 Citizen Flag Down 154 Observation 593 Radio Call 1,181 Station Call 18 Other 167 Unknown 4 Total 2,117 Sworn Personnel by Gender Males accounted for 8,199 of the 10,060 total Department personnel, or 82 percent, and females the remaining 1,861 employees, or 18 percent. Female Male Gender No. of Personnel Department Female 1,861 18% Male 8,199 82% Total 10, % USE OF FORCE YEAR-END REVIEW LOS ANGELES POLICE DEPARTMENT 61

32 VIOLENT CRIME City of Los Angeles Consistent with the parameters established by the Federal Bureau of Investigation s (FBI) Uniform Crime Reporting (UCR) program, the Department categorizes the following four criminal offenses as violent crimes: criminal homicide, rape, robbery, and aggravated assault Homicide Rape 1,422 1,256 1,382 1,308 1,650 1,918 2,022 1,882 Robbery 10,921 10,055 8,967 7,867 7,940 9,001 10,301 10,813 Agg Assault 10,083 9,601 9,113 8,625 10,652 14,396 15,984 16,879 Total Violent Crime 22,722 21,210 19,760 18,050 20,502 25,596 28,601 29,856 In 2017, there were a total of 29,856 violent crimes that occurred throughout the City, which accounted for an increase of 1,255 violent crime occurrences, or four percent, compared to When compared to the 2010 through 2016 annual average of 22,349 violent crime occurrences, 2017 was 7,507 violent crimes, or 34 percent, above the seven-year annual average. In review of the four violent crime categories, two (robbery and aggravated assault) experienced increases in 2017 when compared to the prior year. Additionally, three of the four violent crime categories (rape, robbery, and aggravated assault) exceeded their respective 2010 through 2016 annual averages. OTHER CITY COMPARISON 12 According to 2017 UCR violent crime data, as published by the FBI, Los Angeles had the highest violent crime totals in the State during the first half of 2017, resulting in a crime rate of 3.6 occurrences per 1,000 individuals. The City of San Francisco had the second highest violent crime totals in the State, resulting in 3.5 violent crime occurrences per 1,000 individuals. When compared on a National level during the same time-period, Los Angeles had the second highest violent crime totals. New York City experienced the highest violent crime totals nationally, but had a violent crime rate of 2.6 occurrences per 1,000 individuals, which was lower than that of Los Angeles. Chicago had the third highest violent crime totals, resulting in a rate of 5.1 violent crime occurrences per 1,000 individuals. Philadelphia had the fourth highest violent crime totals, and a rate of 4.7 violent crime occurrences per 1,000 individuals. 11 Violent crime totals are based on the date of occurrence, as opposed to United States Department of Justice data, which uses a reporting standard based on the date the crime is reported to the Department. 12 Federal Bureau of Investigation. (February 2018). Crime in the United States, 2017: state_by_city_ _and_over_in_population/view USE OF FORCE YEAR-END REVIEW
33 {AGENCY TO AGENCY COMPARISON} Chicago New York Philadelphia AGENCY TO AGENCY COMPARISON Los Angeles Houston Officer Involved Shooting Incidents Deceased Suspects in OIS Incidents LAPD CPD HPD LASD NYPD PPD Department Los Angeles Police Department Chicago Police Department Houston Police Department Los Angeles Sheriff s Department New York Police Department Philadelphia Police Department LAPD CPD HPD LASD NYPD PPD Department Los Angeles Police Department * 17 Chicago Police Department Houston Police Department Los Angeles Sheriff s Department New York Police Department Philadelphia Police Department * One suspect died from a self-inflicted gunshot wound during an OIS-No Hit incident in In 2017, the Department had 44 OIS incidents, which was 31 more than the Philadelphia Police Department (PPD), 28 more than the Houston Police Department Firearm Qualification Comparison (HPD), 22 more than the Los Angeles County Sheriff s Department (LASD), 21 more than the NYPD, and 12 more than the CPD. Firearms qualification is an essential component of law enforcement training and aptitude. An improvement in marksmanship reduces the risk of unnecessarily jeopardizing innocent bystanders, stopping the threat with minimal force, and improves officers ability to protect themselves and the public from harm. In the 44 OIS incidents involving Department personnel in 2017, 17 suspects died from police gunfire, representing 39 percent of all OIS incidents. The following depicts the remaining agencies and their deceased suspect totals and percentages in relation to their respective 2017 OIS incident totals: NYPD: 10 deceased, or 43 percent; LASD: eight deceased, or 36 percent; CPD: eight deceased, or 25 percent; HPD: five deceased, or 31 percent; and, PPD: four deceased, or 31 percent. Of the 208 OIS incidents involving Department personnel from 2013 through 2017, 71 suspects died from police gunfire, representing 34 percent of all OIS incidents. In comparison, the LASD had a higher percentage with 78 suspects who died from deputy gunfire during 164 OIS incidents, or 48 percent. The following depicts the remaining agencies and their five-year decedent totals along with their respective decedent per OIS incident percentages: CPD: 58 deaths, or 23 percent; NYPD: 51 deaths, or 30 percent; HPD: 43 deaths, or 30 percent; and, PPD: 28 deaths, or 22 percent. Los Angeles Police Department Qualify four times per year with handguns; once per year with a shotgun and once per year on a Force Option Simulator (FOS) system. There are years-of-service and rank exemptions. Chicago Police Department Qualify once per year with handguns; unknown with a shotgun and unknown on a FOS system. There are no years-of-service and/or rank exemptions. Houston Police Department Qualify once per year with handguns; once per year with a shotgun and no FOS qualification. There are no yearsof service and/or rank exemptions. Los Angeles County Sheriff s Department Qualify four times per year with handguns; one time every two years with a shotgun and offers qualification on a FOS system (not mandatory). There are no years-of-service and/or rank exemptions. New York Police Department Qualify twice per year with handguns; unknown with a shotgun and unknown on a FOS system. There are no years-of-service and/or rank exemptions. Philadelphia Police Department Qualify once per year with handguns; twice with a shotgun and no qualification required on a FOS system. There are no years ofservice and/or rank exemptions USE OF FORCE YEAR-END REVIEW LOS ANGELES POLICE DEPARTMENT 65
34 {TRAINING & DEVELOPMENT} IN-SERVICE TRAINING DEPARTMENT TRAINING & DEVELOPMENT Between March and October 2017, sworn personnel attended an eighthour training on implicit bias, and officer safety and wellness. It is the goal of the Department to be a leader in law enforcement training and to always strive to provide the most current and relevant training available. Therefore, in 2017, in partnership with the BOPC, the Department focused on the challenge of policing one of the most diverse cities in America and renewed its pledge to enhance its training to better reflect the City s emerging needs and conditions. The Department is committed to delivering the highest quality training with an unwavering resolve to ultimately reshape the national discussion on law enforcement training and development. There are four key training topics that continue to serve as a platform for how the Department designs and implements training: 1) Teaching UOF de-escalation techniques; 2) Building public trust and Reverence for Human Life; 3) Serving the people and systems impacted by mental illness; and, 4) Mastering laws of arrest (such as consensual encounters, reasonable suspicion, and probable cause). Teaching UOF De-Escalation Techniques Guided by the Reverence for Human Life, the Department has consistently upheld the expectation that officers may only use force that is objectively reasonable to effect arrests, prevent the escape of suspects, or overcome their resistance, provided de-escalation attempts were futile or ineffective. For conformity among rank and file and congruity with training efforts, the Department recognized that elements of de-escalation had to be embodied in a comprehensive framework. In April 2017, the Department formally incorporated the concept of deescalation in the preamble to the UOF policy. Since then, training curriculum and other Department reference material have been amended to include deescalation principles. While all officers have been required to review the Tactical Directive through the online training portal, a new UOF course titled, Integrating Communication, Deescalation, and Crowd Control (ICDC), was introduced in the fall of Based on officer evaluations, as well as observations by training staff and personnel from the OIG, the training has been described as highquality material, and the scenarios considered both theoretically and practically relevant. Building Public Trust and Officer Safety & Wellness Between March and October 2017, sworn personnel attended an eight-hour training on implicit bias and reverence for human life. The first segment included a four-hour lecture on implicit bias and community policing, facilitated by Dr. Bryant Marks of Morehouse College. The course was highly interactive, incorporating technology and active participation among students to discuss various social issues, community policing approaches, and community relationship building. Officers were challenged to consider the differing points of view in American policing and were provided recommendations to increase awareness of implicit bias and how it may affect decision-making processes and the general perception of law enforcement in various communities Training Objectives 1 Teaching UOF de-escalation techniques; 2 Building public trust and Reverence for Human Life; 3 Serving the people and systems impacted by mental illness; and, 4 Mastering laws of arrest (such as consensual encounters, reasonable suspicion, and probable cause). ACADEMY TRAINING Recent Academy curriculum was enhanced by incorporating distinct blocks of instruction on procedural justice, mental illness, and de-escalation. The second segment of the training focused on officer safety and wellness. This four-hour training, titled Below 100, was a course built as a national campaign to limit the number of officer deaths across America. Below 100 served as a reminder of the many associative dangers in the law enforcement profession and promoted the engagement of safe and mindful practices in the workplace to mitigate risk. A unique perspective added by the Department was a discussion on suicide prevention, which was an important opportunity to emphasize that No One Stands Alone, an employee wellness initiative that appeals for a healthy workplace and a sound peer support system USE OF FORCE YEAR-END REVIEW LOS ANGELES POLICE DEPARTMENT 67
35 {TRAINING & DEVELOPMENT} A Healthy and Functional Organization A vital component in cultivating healthy work environments and strong relationships with the community is a welltrained and educated body of supervision. Therefore, the Department collaborated with Pepperdine University s Straus Institute for Dispute Resolution for the design and development of two dispute resolution courses for Department leadership. All command staff attended a two-day course and lower-rank supervisors attended a more concentrated four-day version that allowed for additional participation and the refinement of essential skills. Both courses emphasized the importance of understanding and supporting diversity in the workplace and provided practical methods of addressing and preventing conflict. Serving the People and Systems Impacted by Mental Illness For the past two years, the 40-hour MHIT course has been provided to all new police officers prior to completing their probationary year in the field. It has also been a top priority to train officers working in specialized assignments such as MEU, RESET, and HOPE teams that work closest with the homeless population. The Federal Consent Decree that once guided the Department in improving its responsiveness to societal changes considered it a best practice for 10 percent of patrol officers to have such specialized training. Currently, the Department has more than doubled that number, and by providing this as a mandatory curriculum during the probationary year for new sworn personnel, the Department has made a commitment for all patrol officers to eventually be more effective in serving individuals affected by mental illness. In doing so, the hope is that City crime and UOF occurrences can eventually be reduced. By working with partners, including those with DMH, and through increased mental health training, the Department has enhanced the ability of field personnel to recognize symptoms of mental illness and to more accurately triage the growing number of calls for service involving mental health crises. Through further collaboration with community advocate groups, such as NAMI, the Department is working to modify its response to the overall mental health crisis by connecting affected individuals and their families to support services for long-term solutions. Mastering Laws of Arrest During the Academy, recruit officers are exposed to numerous training scenarios where they apply and refine the concepts discussed in classroom settings. Simply having an intellectual understanding of the material is often insufficient once officers are faced with real-life and volatile situations in the field, including UOF incidents. Scenariobased training adds an unparalleled approach for officers to address high-stress incidents while in a managed and controlled setting. Additionally, scenario-based training allows for Academy instructors to better assess recruit officers understanding of the academic curriculum, and ultimately ensures the accurate and successful application of material in practice when personnel transition to field assignments. As recruit officers progress through the Academy, they are exposed to increasingly complex training (both classroom and scenario-based) for continued enrichment in, among other subjects, concepts essential to law and arrests, preservation of life, de-escalation, tactical decisionmaking, and UOF. In 2017, to comply with new California Commission on Peace Officer Standards and Training (POST) benchmarks, Academy curriculum was enhanced with the incorporation of distinct blocks of instruction on procedural justice, mental illness, and de-escalation. To ensure new officers comprehension of Academy training material, the Department has effectuated an unparalleled educational method of checking for understanding. The Police Sciences Leadership (PSL) program returns officers as a cohort at critical developmental milestones in their careers. The first course, PSL I, occurs 11 months after academy graduation, immediately before completion of the probationary period. The second course, PSL II, is designed to return the same cohort two years thereafter for advancedskill training. Police Sciences Leadership II is currently in a pilot test-phase to determine feasibility and is projected to be fully implemented in POLICE ACADEMY TRAINING In 2008, the Department implemented a completely redesigned Academy curriculum, which was geared toward problem-based learning. The Department recognized that the Academy s tradition of strong, tactical skill training must continue, but acknowledged that improvements had to be made to maximize critical thinking and capitalize on initiative and human potential. As such, the enhancement and implementation of the modified curriculum compliments tactical performance with the development of officers who are self-motivated, interdependent, community oriented, critical thinkers and problem solvers. Through the examination of best practices in law enforcement training, three key constructs were identified In adapting to the needs and conditions of the City, the LAPD is committed to enhancing its training and education by complementing its tactical competencies with the development of officers who are self-motivated, interdependent, community oriented, critical thinkers and problem solvers. as a lens for all Department training for recruits, active officers and civilians. These constructs, as discussed by Luann Pannell, Director of PTE, in the article, Changing the Training Paradigm, are as follows: Training the Whole Person - Peak performance is achieved through utilization of all three learning domains: psychomotor domain physical skills and strength; cognitive domain critical thinking and problem solving; and affective domain utilizing emotional intelligence. Preparing people for all facets of their job will develop more resilient individuals, and ultimately, a more resilient workforce. In a Team, By a Team, to be a Team - Public safety requires team effort. All officers must develop individual skills within the framework of a team. Teamwork should facilitate self-assessment, appreciation for the skills of others, and increases the value on collaboration. Teamwork incorporates respect for other teams both inside the Department and within the community. Through an Event, Not to an Event - To be comprehensively effective, training must be conducted within an experiential learning environment that requires critical thinking all the way through an event. Training through an event includes training not only for the skills needed in a crisis, but for the ongoing response once the tactical operation concludes. Leaders must learn to anticipate the ongoing needs of their people, the community, and the necessary resources once the crisis is over. Understanding the context and ensuring follow-through with key stakeholders will improve the Department s response for future incidents. Academy Hours The Department s basic police Academy is currently 912 hours in duration, exceeding the POST requirement of 664 hours of mandated training. Class sizes generally range from 30 to 50 recruits. A new recruit class typically starts every four weeks, and each class is in training for six months. There can be as many as six academy classes operating at any one time. The Department s goal is to exceed all POST minimum training requirements. Academy Testing Recognizing that police officers need to be critical thinkers and excellent problem solvers, POST began a new testing system in This style of integrated testing is consistent with the changes the Department made to the Academy in 2008, emphasizing PBL, critical thinking, and confidence building. Under this new system of testing, recruit officers must pass 26 POST Learning Domain examinations, 14 graded scenarios, two midterm examinations and one final examination. The examinations cover material from the 43 Learning Domains introduced throughout the sixmonths of the Academy program. Questions contained in the written examinations are also integrated in the 14 scenarios, which become increasingly complex as the Academy program progresses. The events depicted in each scenario require recruit officers to utilize the techniques, strategies, and course material from previous instruction to successfully resolve each situation. In addition to the written and scenario-based examinations, recruit officers must pass a series of rigorous physical fitness, self-defense, and firearm proficiency examinations before graduation and their transition to field assignments USE OF FORCE YEAR-END REVIEW LOS ANGELES POLICE DEPARTMENT 69
36 {TRAINING & DEVELOPMENT} IN-SERVICE TRAINING As a result of the Department s comprehensive review of its training curriculum, new courses have been developed and existing material has been updated. UOF Update Class (10-Hour) Since October 2015, Field Operations Training Unit (FOTU) has been teaching the mandated 10-hour UOF Update Class to sworn personnel. The course consists of classroom training and six practical scenarios, four of which are live situations. The scenarios are designed to enhance critical thinking and problem solving by utilizing various communication and de-escalation strategies. The UOF Update Class is critical in addressing contemporary events involving UOF, persons suffering from mental health crises, constitutional policing, Reverence for Human Life, and de-escalation skills. Officers are also afforded the opportunity to re-familiarize themselves with the use of less-lethal force weapons, including the beanbag shotgun, OC spray, and TASER. As of September 2017, FOTU completed instruction of the UOF Update Class with the successful training of 8,870 of 9,237 employees, or 96 percent. Police Sciences Leadership The PSL course utilizes adult-learning concepts and practical applications to teach officers investigative and field operational skills necessary to solve long-term problems in the community, while increasing public trust and police legitimacy. The PSL I class is an 84-hour course that brings an entire academy class back together after 11 months of probationary field training. The course includes the 40-hour MHIT on topics such as crisis communications, suicide by cop, substance abuse, autism, and psychopharmacology. To address the new de-escalation framework, PSL has an added block of discussion on the topic. Furthermore, the concept of guardian versus warrior has taken center stage in many of the discussions regarding the national dialogue on policing. PSL has added a guardian versus warrior component to discuss varying and obsolete policing strategies and methods. Field Training Officers (FTO) Program In October 2015, State Senate Bill 29 was enacted, requiring FTOs to complete a minimum of eight hours of Crisis Intervention Behavioral Health Training. The Mental Evaluation Unit created a 40-hour MHIT course and an eight-hour Crisis Intervention Mental Health Intervention Training Update course. Since its inception, 85 percent (431/506) of the Department s FTOs have completed one of the two MEU Crisis Intervention courses. In June 2016, the Department expanded its FTO Update course from 24 to 32 hours. The course now includes MHIT components, de-escalation, and command and control concepts. Also included are public trust components, such as constitutional policing, fair and impartial policing, and lesbian, gay, bi-sexual, transgender, and/or questioning cultural competency. Since its inception, 86 percent (334/506) of the FTOs have completed the course. Fair and Impartial Policing (FIP) The focus of FIP was on the impact of biased policing, implicit and explicit bias, and identifying ways to respond to the awareness of bias. During the class, facilitators discuss evidence-based solutions in contact theory and exposure to counter-stereotypes. A positive response from command staff, who received training in 2014, resulted in the appointment of subject matter experts to train a cadre of Department facilitators in October In 2016, the Department appointed a nationally renowned subject matter expert on implicit bias to train Department employees. When the training was completed in October 2017, a total of 9,185 employees had received the implicit bias training. POST Perishable Skills The California Commission on Peace Officer Standards and Training requires a minimum of 24-hours of Continuing Professional Training (CPT) every two years for certified peace officers. Fourteen training hours address perishable skills such as arrest and control, tactical communications, driving, and firearms. In 2017, the Department deployed four new POST-certified courses (UOF Update; ICDC; Implicit Bias; and Below 100), which combined totals 20 hours of the 24-hour CPT requirements. The final four hours of CPT training is being met through decentralized perishable skills driving courses, facilitated at the geographical Areas. The Department s goal for the CPT training cycle is 96 percent compliance. The following table depicts the percentages of Department personnel who completed perishable skills training in 2017 based on Department and Bureau totals (information as of September 2017). Note: The training cycle for these subjects continues through the end of Category Department Arrest & Control 18% Communication 39% Driving 10% Firearms 49% Museum of Tolerance (MOT) The Department continues to harness the powerful experiential environment at the MOT to assist officers in understanding complex societal issues, such as unconscious bias, biased policing, and their effects on community trust building. All recruit officers spend a full day at the MOT during their academy experience. The Museum of Tolerance developed an interactive 10-hour course for inservice officers on Building Public Trust, which incorporates training on diversity as well as the State mandated training on racial profiling. Department personnel attended 27 classes in 2017, 27 classes in 2016, and 42 classes in The Museum of Tolerance allocates the number of classes based on availability. Law Enforcement Tactical Application Course (LETAC) The Law Enforcement Tactical Application Course is a 32-hour course that incorporates a high concentration of scenario-based training. Seven different scenarios reinforce and enhance officers basic tactical knowledge and skills. The course includes in-depth discussion on the Department s UOF policy and its guiding principle of the Reverence for Human Life, various force options, command and control concepts, tactical planning, tactical communication, and firearm safety. In 2017, due to the additional needs for instructors for the Recruit Basic Course (RBC), several classes had to be cancelled. The following LETAC courses were scheduled: 22 LETAC classes for officers (25 students each); 2 LETAC classes for supervisors; and, 2 LETAC extensive retraining classes. However, eight courses were cancelled, resulting in 200 fewer officers attending the training. In 2018, there are 22 LETAC classes tentatively scheduled for officers with approximately 25 students per session. In addition, there are two sessions planned for extensive retraining requirements and two for supervisors, for a total of 26 sessions, or approximately two sessions per Deployment Period. In 2016, the Department appointed a nationally renowned subject matter expert on implicit bias to train Department employees. When the training was completed in October 2017, a total of 9,185 employees had received the implicit bias training. De-escalation Tactics In October 2016, the Department approved UOF - Tactics Directive No. 16, Tactical De-escalation Techniques. This document reiterates the Department s guiding principle of Reverence for Human Life, defines de-escalation, and introduces the acronym PATROL for a clearer articulation of the techniques included in the deescalation framework. In November 2016, command staff received a full day of training on deescalation. Sworn personnel began receiving training on this topic in early In September 2017, FOTU was tasked with training officers in ICDC. This course includes a comprehensive block of instruction on de-escalation techniques and active listening skills. Additionally, techniques included in the tactical de-escalation framework and PATROL acronym are woven into the ICDC course, which also includes crowd control, baton, 40mm launcher, and a reality-based training scenario. Other Training The Department relies on additional training platforms to uphold proficiency standards for sworn personnel. Force Option Simulators present situations in a virtual reality/scenario-based environment, which requires officers to rely on their skills, knowledge, and experience in addressing challenging situations that may or may not require the UOF. Following a UOF incident, General Training Updates (GTUs) and tactical debriefs address training needs in a collaborative setting between officers and instructors. Force Option Simulators The newly constructed building at the Elysian Park Police Academy will house a new 300-degree scenario-based training simulator. This simulator will have the state-of-theart technology needed to provide the most advanced and current training available. In 2017, utilizing the FOS system for Department-wide qualification, instructors conducted debriefs after each scenario. All officers were required to utilize sound tactics and techniques in an attempt to de-escalate each incident. The goal is to use techniques involved in tactical deescalation to reduce the intensity of an encounter with a suspect and enable an officer to have additional options USE OF FORCE YEAR-END REVIEW LOS ANGELES POLICE DEPARTMENT 71

37 {TRAINING & DEVELOPMENT} to gain voluntary compliance or mitigate the need to use a higher level of force while maintaining control of the situation. General Training Updates General Training Updates are mandatory training sessions for all substantially involved personnel following a CUOF incident. Personnel are not allowed to return to field duties until the GTUs have been successfully completed. There are six mandatory topics (seven for OIS incidents), in addition to any other concerns addressed by the COP, the concerned Area Commanding Officer (CO), UOFRD, and/ or PSTB: The Department requires its sworn personnel to qualify with their primary duty weapons on a regular basis to ensure shooting proficiencies and the development of sound judgment with the use of lethal force. Command and Control; Equipment Required/Maintained; Tactical Communication; Tactical De-Escalation; Tactical Planning; Use of Force Policy; and, Force Option Simulator (for OIS incidents). In 2017, Training Division (TD) was tasked with the responsibility of conducting GTUs for all CUOF incidents. Prior to TD assuming responsibility of the GTU instruction, Area training coordinators completed the required training. General Training Update sessions are administered by instructors from TD, with assistance of training unit personnel from the concerned Area and Bureau. In addition to facilitating the actual training, TD is responsible for documentation and tracking of employees who did not attend the training due to valid temporary exemptions (e.g. on-leave due to injury, scheduled vacation, etc.). Tactical Debriefs All substantially involved officers in a CUOF incident are required to participate in a Tactical Debrief upon adjudication of the concerned case. The Tactical Debrief affords all involved personnel an opportunity to participate in collaborative training to enhance their performance, identify lessons learned, and recognize the outcomes of a CUOF incident. The Tactical Debrief serves as the final training after the adjudication of a CUOF incident, administered by a TD supervisor familiar with the incident and who served as a resource in the UOFRB process. FIREARMS Qualification Requirements The Department requires its sworn personnel to qualify with their primary duty weapons on a regular basis to ensure shooting proficiencies and the development of sound judgment with the use of lethal force. A qualification schedule has been created, which includes a combination of handgun, shotgun, and FOS tests. Employees are required to qualify once within a twomonth cycle (not including the one-month shotgun cycle). There are a total of six qualification cycles in a calendar year. Sworn employees (lieutenants and below), reserve officers, and security officers with less than 20 years of service qualify as follows: Cycle Month Required Qualification 1 Jan Shotgun 2 Feb/Mar Handgun Duty Ammunition 3 Apr/May Handgun Practice Ammunition 4 Jun/Jul Force Option Simulator 5 Sept/Oct Handgun Practice Ammunition 6 Nov/Dec Handgun Practice Ammunition Sworn employees (lieutenants and below), reserve officers, and security officers with 20 to 29 years of service qualify as follows: Cycle Month Required Qualification 1 Jan Shotgun 2 Feb/Mar Handgun Duty Ammunition 3 Sept/Oct Handgun Practice Ammunition Captains and above with less than 30 years of service qualify as follows: Cycle Month Required Qualification 1 Feb/Mar Handgun Duty Ammunition 2 Sept/Oct Handgun Practice Ammunition All sworn employees (regardless of rank), reserve officers, and security officers with 30 years or more of service are required to qualify one time per calendar year at their convenience during Cycles 2, 3, 5, or 6. This requirement shall be met with their primary duty handgun and duty ammunition. To qualify on the handgun combat course, sworn employees, reserve officers, and security officers shall meet the minimum qualification requirements. Personnel who fail to achieve a qualifying score shall repeat the course until the minimum score for each target is attained in one relay. The maximum score is 300 points. When sufficient daylight exists, the minimum passing score is 210 points, with a minimum of 105 points on each target. During the hours of darkness, the minimum passing score is 180 points, with a minimum of 90 points on each target. The shotgun course is not scored, however, personnel must demonstrate proficiency with the shotgun to satisfy the qualification requirement. Multiple Attempts to Qualify Officers who fail to receive a minimum passing score after a third attempt in a qualification cycle are required to attend firearms remediation. The Department does not currently track first or second attempt failures since weapon malfunctions and/or defective ammunition contribute to unsuccessful qualification attempts. A failure to qualify (FTQ) in three or more attempts results in the employee appearing on a report USE OF FORCE YEAR-END REVIEW LOS ANGELES POLICE DEPARTMENT 73
38 {TRAINING & DEVELOPMENT} generated by ITB, which is sent to the Administrative Unit, Firearms Training Section for each qualification cycle. When the Firearms Training Section receives the report from ITB, a mandatory remediation class is scheduled for each concerned employee. Even if the employee received a passing score after a third (or more) attempt, the employee is required to attend firearms remediation. The one-on-one remediation is completed by TD s firearms instructors at the Elysian Park Academy or the Davis Training Facility. The instructor observes, diagnoses, and remediates the employee. Once the firearms instructor believed the officer is prepared to qualify, the employee shoots the Department s qualification course again to demonstrate proficiency. The remediation is documented on a TD Record of Remediation/ Supplemental Training form and entered into the Learning Management System (LMS) and the Shooting Qualification and Bonus (SQUAB) computer system. Failure to Qualify A Department FTQ report is generated for officers who FTQ and is sent to IAG. The IAG s Annual Complaint Report contains information on actions taken for FTQs. When a CO is notified that an officer, reserve officer, or security officer under his or her command fails to meet qualification requirements set forth by the Department and lacks a valid exemption, the concerned CO may initiate a personnel complaint. Commanding officers shall be responsible for administering disciplinary action for personnel who FTQ. The Shooting Qualification and Bonus computer application was developed to document shooting and FOS qualification, firearms training and bonus scores for sworn and armed civilian personnel. The application is used at the four range locations (Davis Training Facility, Elysian Park Academy, Harbor Range, and Oaktree Range) by the Firearms Training Section, Tactics Training Section, and Harbor Range personnel. The information entered into SQUAB appears on an employee s Training Evaluation and Management System (TEAMS) II Report, showing a record of the employee s qualification history for the last five years. The system generates the Department s FTQ report after each qualification cycle. That report is forwarded by ITB to IAG for dissemination. A report can also be generated by ITB upon request. Medical Exemptions Sworn personnel who are unable to qualify due to an injury shall be examined by a physician. A statement shall be obtained from the physician imposing the medical restriction and an estimated time for which the officer should be exempt from qualification requirements. Note: Temporary medical restrictions are valid for 30 days only. If a medical condition persists past 30 days and continues to inhibit an officer from meeting Department qualification standards, the officer must obtain a subsequent doctor s statement every 30 days until the restriction is rescinded or is classified permanent and stationary. An officer with a medical exemption who has not qualified with his or her duty firearm for one calendar year shall be served with a Notice to Meet Firearm Qualification Requirements within 30 Calendar Days (30-Day Notice). Once served, the officer has 30 days to determine if he or she is medically fit to qualify and successfully pass the minimum firearm qualification standards. If the officer is unable to qualify with his or her duty firearm by the expiration of the 30-Day Notice, the officer shall be served with an Order to Relinquish City-Issued Duty Firearm and Police Identification Card, and Restriction of Peace Officer Powers (Order to Relinquish). Note: If an officer with either a temporary or permanent restriction believes that he or she is medically fit to meet Department firearm qualification standards, the officer is encouraged to make an appointment with his or her doctor and have the restrictions re-evaluated and possibly rescinded. Vacation Exemptions Officers are not exempt from qualification requirements due to vacation. Exemptions for qualification requirements may be granted for approved extended absences at the discretion of the concerned CO. DEPARTMENT FIREARM QUALIFICATION STATISTICS Firearms Qualification (by Cycle) - Sworn Personnel ,000 4,000 6,000 8,000 10,000 In 2017, the Department had 28,579 total firearm qualifications throughout the year. Qualification Cycle 2 contained the highest number of Department sworn personnel qualifying, with 8,725 employees, representing 31 percent of the total annual firearm qualifications. Comparatively, Cycle 2 contained the highest number of personnel qualifying during the four-year period from 2013 through 2016 with an annual average of 8,894 employees. Three or More Attempts (Failure) In 2017, 59 Department personnel failed to successfully qualify three or more times in the four firearm qualification cycles throughout the year. This accounted for a decrease of eight individuals, or 12 percent, compared to 67 total personnel in Additionally, the 2017 total fell below the 2013 through 2016 annual average of 97 total personnel by 38 individuals, or 39 percent. Failure Rate 0 0.1% 0.2% 0.3% 0.4% 0.5% 0.6% The failure rate is calculated based on the number of personnel who failed to successfully qualify three or more times within a particular cycle compared to the total of personnel attempting to qualify. In 2017, an average of 0.2 percent of Department personnel failed to successfully qualify throughout the year. This represented no change when compared to the same failure rate percentage in When compared to the aggregate failure rate In 2017, the Department had a 99.8 percent firearm qualification pass rate, with the largest number of personnel qualifying in Cycle 2. percentage from 2013 through 2016 of 0.3 percent, 2017 experienced a 0.1 percentage point decrease. Failure to Qualify Complaints Issued vs. Sustained Issued Sustained Of the 24 personnel who FTQ in 2017, and of whom were subject to a personnel complaint, four personnel, representing 17 percent, received a sustained allegation for neglecting to abide by the Department s qualification policy. This accounted for a 53 percentage point decrease compared to 70 percent of sustained FTQ allegations in When compared to the aggregate percentage of sustained FTQ allegations from 2013 through 2016 of 41 percent, 2017 experienced a 24 percentage point decrease. REINTEGRATION A sworn employee who has returned to work from a temporary relief from duty, or inactive duty in excess of 365 calendar days, shall meet with his/her CO to begin the reintegration process and accomplish all reintegration tasks as directed by the Department. Training Division is responsible for determining what training is appropriate to bring the employee into compliance with the POST requirements and any other Department requirements that are consistent with the employee s work restrictions. Training Division will re-issue all City-issued equipment and will periodically update the returning employee s CO as to the status of the employee in the reintegration process USE OF FORCE YEAR-END REVIEW LOS ANGELES POLICE DEPARTMENT 75


, and the public can be reduced.")
39 {LESS-LETHAL DEPLOYMENT} LESS-LETHAL DEPLOYMENT Above: PepperBall Variable Kinetic System (VKS) Launcher Below: 12-gauge LAPD Super-Sock round used with the beanbag shotgun The Department s guiding value when using force shall always be the Reverence for Human Life. When a situation warrants the UOF, and when practicable, personnel can utilize a variety of less-lethal force options to safely defuse a situation where intermediate force is authorized. Based on recent court decisions, less-lethal force options shall not be used on a suspect or subject who is passively resisting or merely failing to comply with commands. Verbal threats of violence or mere non-compliance do not alone justify the use of less-lethal force. Therefore, lesslethal force options are only permissible when an officer reasonably believes the suspect or subject is violently resisting arrest or posses an immediate threat of violence or physical harm. Less-lethal devices afford officers the opportunity to seek cover and increase the distance between themselves and suspects, which are both fundamental concepts of time for tactical decision-making. When officers are able to safely and effectively deploy such devices, the risk of injury to themselves, the suspect(s), and the public can be reduced. Less-lethal weapons can also be effective tactical deescalation deterrents, preventing situations from escalating and ultimately reducing the necessity for more serious levels of force. The Department currently has a variety of less-lethal weapons available to personnel for use during daily field operations and other tactical occurrences. LAPD Less-lethal Fact: In 2017, 21 of the 78 CUOF incidents, or 27 percent, involved the use of a less-lethal weapon USE OF FORCE YEAR-END REVIEW LOS ANGELES POLICE DEPARTMENT 77
 Impact Launcher is a direct impact device that delivers a foam or sponge type round at the desired target.")

40 The Department constantly examines new, innovative, and more effective less-lethal systems to prevent volatile situations or suspects actions from escalating. 40-MILLIMETE ER IMPACT LAUNCHER The 40-millimeter (40mm) Impact Launcher is a direct impact device that delivers a foam or sponge type round at the desired target. Originally authorized for use by Metropolitan Division, Special Weapons and Tactics (SWAT), the 40mm Impact Launcher was later approved for deployment ent by normal patrol functions in That year, the Department initiated a pilot program to evaluate the effectiveness and functionality of the device in a patrol setting. At the conclusion of the pilot program, the Department determined that additional testing and data gathering was necessary for a more comprehensive analysis. In April 2017, the Department re-initiated the pilot program indefinitely for the following Divisions: Metropolitan Division; Southeast Patrol Division; Central Patrol Division; Pacific Patrol Division; and, Mission Patrol Division. The Tactics and Training Review Committee (TTRC) is currently drafting a UOF Tactics Directive for deployment criteria and other procedural requirements, which currently mirror those of the beanbag shotgun. The Department purchased an additional 215 units mid-year Those devices are expected to be deployed in the field during TASER The Thomas A. Swift Electric Rifle (TASER) is an electroshock weapon that causes neuro-muscular incapacitation of a suspect. The device induces stimulation of the motor nerves, causing uncontrollable muscle contractions that prevent a suspect s ability to perform coordinated movements. The Department recently acquired the next generation TASER, model X26P. This model has the following improvements from the previous model: Consistent performance and complete data capture due to a new all-digital architecture; Improved ergonomics; and, Green color coding for easy identification by officers and the community. As of 2015, all uniformed officers assigned to OO are required to carry a TASER on their person while working any field assignment (OO Order No. 4, dated September 21, 2015). During Academy training, all recruit officers are required to successfully complete TASER training. For personnel who are familiar with prior TASER generation models and not currently certified to carry the new X26P model, the Department mandates that those employees complete an updated course (which is currently administered during the 10-hour UOF Update Class). In 2016, the Department approved the use of the new 25-foot TASER cartridge, which increases the distance between an officer and their intended target USE OF FORCE YEAR-END REVIEW
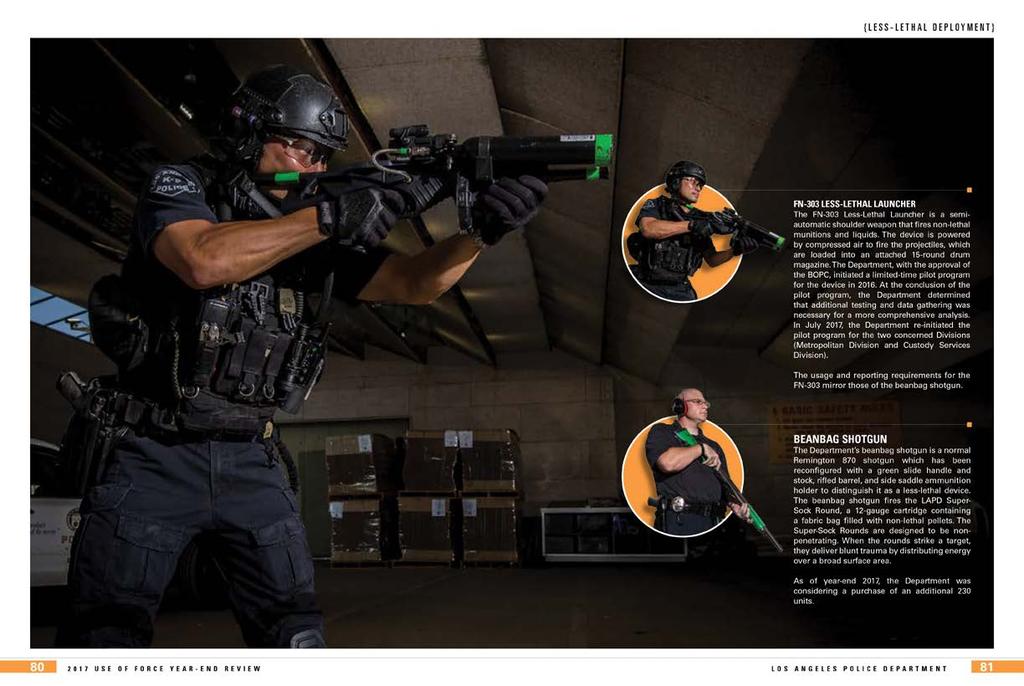
41


42 BATON A baton is an impact and/or control device used to push, move, or strike individuals who exhibit unlawful or hostile behavior. Currently, the Department deploys four versions of the baton; a collapsible baton, a side handle baton, a collapsible side handle baton, and a straight baton. In 2017, the Department transitioned to the Peacekeeper RCB collapsible baton as the preferred and standardissued model. When compared to previous models, the Peacekeeper RCB has a more durable and functional design. 37-MILLIMETER PROJECTILE LAUNCHER The 37mm Projectile Launcher is a less-lethal shoulder weapon that fires various types of munitions. A rifled barrel and calibrated sighting system makes the device highly accurate when delivering rounds to their intended target. Typical munitions include blunt trauma and chemical agent ordnance USE OF FORCE YEAR-END REVIEW LOS ANGELES POLICE DEPARTMENT 83
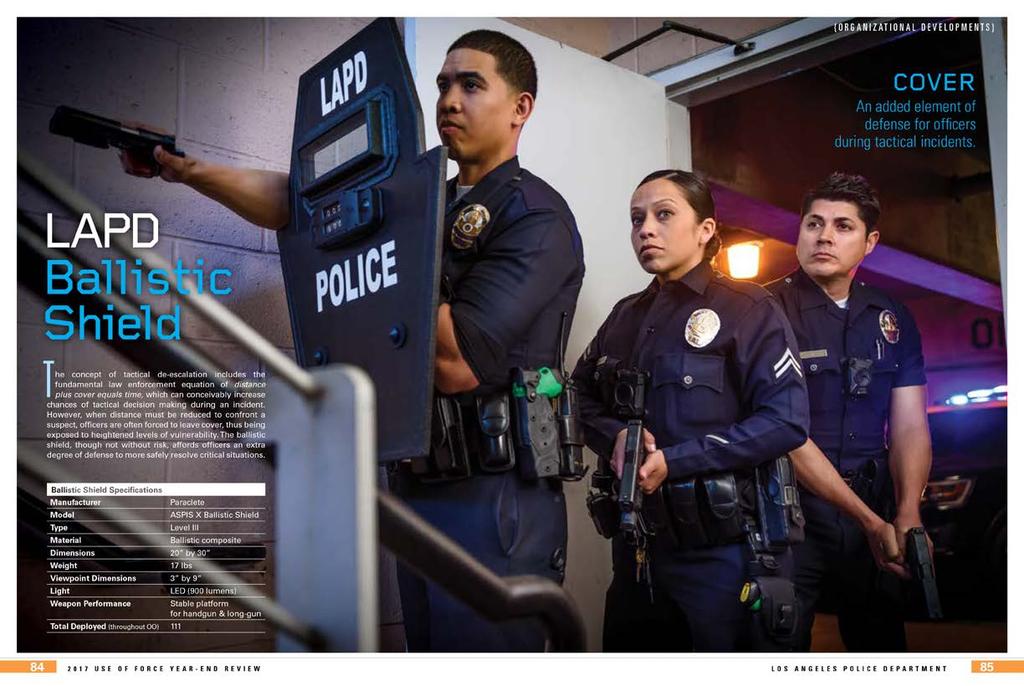
43


44 {ORGANIZATIONAL DEVELOPMENTS} As of year-end 2017, the Department had 7,521 body-worn and in-car cameras deployed throughout the City. This accounted for 90% of all Department commands with projected video platforms. Organizational Developments The era of police-initiated video recordings in the City was established primarily to further the Department s community policing efforts by promoting accountability and to build public trust. T he DICVS platform was the first of two camera systems, initially introduced in Southeast Area in Current efforts have expanded the Department s video assets with the ongoing rollout of BWV to all uniformed personnel in patrol functions. These camera platforms have proven to be powerful policing tools that enhance community relations, foster best practices within the organization, and more effectively resolve criminal matters. Moreover, DICVS and BWV can limit financial harm from false or unscrupulous criminal and/or civil allegations against the City. The release of DICVS and BWV footage, in addition to other video of which the Department is the proprietor, following critical incidents was an agenda item during the March 20, 2018 BOPC meeting. As of the publication of this Report, the BOPC approved the Department s recommendation for the release of relevant video imagery that depicts the actions and events leading up to, and including, critical incidents within 45 days of the date of incident. In consideration of public interest, the BOPC or the COP may determine that an earlier release could be warranted. The release of video will be contingent on certain privacy and legal considerations. When such factors are a cause for concern, a three-member panel, comprised of the COP and two selected BOPC members, can elect to delay the release for a 14-day period, after which that decision must be reconsidered. A vote by the full five-member Commission can overrule the subcommittee s decision to delay the release. If the delayed release continues for more than 28 days, the matter shall be placed on the agenda for next regularly scheduled BOPC meeting for discussion of continued justification for delay, as well as an anticipated time frame for release. The BOPC shall make the decision to release or continue the delay, and the video imagery in question shall be released as soon as the reason for the delay has been resolved. Although the Department has incorporated video and audio evidence in the investigative, review, and adjudication processes of internal investigations for many years, it should be noted that, with the increased availability of reliable footage, the legal standard used to determine the lawfulness of an officer s actions during a UOF incident is still objective reasonableness, as detailed in Graham v. Connor. As such, events captured on DICVS and/or BWV is only one source of evidence and should not be used as the sole factor in determining the lawfulness of an officer s actions. In-car real-time video analytics have the potential to make policing more efficient, but more importantly, the technology can help with our efforts to reduce crime and the fear of crime in our community. We see this type of technology improving how we serve the community in the future. Sgt. Dan Gomez Officer-in-Charge, Tactical Technology Section, Information Technology Bureau USE OF FORCE YEAR-END REVIEW LOS ANGELES POLICE DEPARTMENT 87

45 {ORGANIZATIONAL DEVELOPMENTS} Digital In-Car Video System A front-seat view of LAPD s calls for service. The DICVS program was outlined in Special Order No. 45, dated October 20, In effect, DICVS assists officers in: Providing accurate depictions of events for courtroom testimony; Capturing statements from suspects, victims, and witnesses; and, Obtaining actual time frames of events for reporting purposes. The Digital In-Car Video System is comprised of: Two fixed cameras inside patrol vehicles (one forward facing inside the windshield, and a second mounted to the ceiling in the rear passenger compartment); Microphones that link to the video system; Docking ports for each of the microphones; A touchscreen monitor in the driver cabin of the vehicle; and, System hardware, located in the trunk of the vehicle. The wireless microphones are worn on the officer s person and have the capability of activating the camera system with the push of a button. When the emergency lightbar on a patrol vehicle is activated for more than eight seconds, the DICVS automatically begins recording. Officers can also manually activate the camera system on the touchscreen monitor inside the cabin of the vehicle. The DICVS video and audio recordings are stored digitally and cannot be manipulated, altered, or deleted. Video footage from DICVS can be viewed on a monitor inside the vehicle, or once successfully uploaded on the Department s server, on any computer connected to the Department s Local Area Network. Prior to usage and deployment, field personnel must complete the Department s DICVS training on the proper use, maintenance, and activation criteria. Supervisors are required to ensure that subordinates adhere to Department DICVS policy and procedures by providing the necessary guidance, training, and direction of both mandatory and proactive implementation standards. Officers are encouraged to inform individuals that they are being recorded when feasible. However, consent is not required when the officer is lawfully in an area where the recording takes place. For example, an officer who lawfully enters a business or residence shall record any enforcement or investigative activity and is not required to obtain consent from members of the public who may also be present. In addition, officers are not required to play back DICVS recordings for review by members of the public. If an officer is involved in a CUOF, they shall not review any DICVS footage until authorized by the assigned FID investigator. Once authorized, the officer shall review the footage, and any other relevant recording (including BWV footage), as deemed necessary and appropriate by the assigned FID supervisor, prior to being interviewed by investigators. An officer may have an employee representative present during the review of the DICVS recordings without the FID investigator or supervisor present. The separating and monitoring of officers involved in a CUOF shall be maintained during the review of DICVS recordings and a review shall not occur jointly among other involved employees. Supervisors investigating NCUOF incidents shall, when available, allow involved officers to review their DICVS recordings and, if deemed necessary, review other DICVS recordings to ensure complete and accurate reports and documentation of the incident. Digital In-Car Video System Specifications Manufacturer Coban Technologies Model Edge Monitor 5.7 LED touchscreen Video Resolution 1080P Audio 900 Mhz, Up to 1,000 ft Front HD Camera 28x Optical zoom 12x Digital zoom 56 field of view Rear Camera 130 field of view Storage 64 GB Record Time 25 hrs talk time 7 days standby Total Deployed 1,185 Data Use (through 2017) 772 TB Officers are required to activate their DICVS equipment during the initiation of the following activities: All vehicle stops; All code 3 responses and pursuits; All suspect transports; All pedestrian stops (when practicable); and, Any other occasions when, in the officer s judgement, it would be beneficial to do so. This may include, but is not limited to, stops and detentions, crimes in progress when recording is reasonably feasible, Mobile Field Force situations, or any situation, condition, or event presenting the potential for injury, loss of life, damage to property, or any potential risk-management issue. Exception: Exigent circumstances may preclude officers from the immediate activation of DICVS. Each exception will be evaluated on a case-by-case basis. Activation of the front DICVS camera shall remain in effect until the entire incident has stabilized or field contact has ended. The rear camera shall remain activated until the suspect (rear passenger) has exited the vehicle USE OF FORCE YEAR-END REVIEW LOS ANGELES POLICE DEPARTMENT 89

46 Body-Worn Video Video evidence in the 21 st Century. Consistent with the objectives of DICVS, the Department s BWV program was instituted to enhance: Police operations and safety; Police reporting; Officer accountability; Investigation and resolution of personnel complaints; and, Documentation of evidence for criminal prosecution. Body Worn Video equipment generally consists of a bodymounted camera with a built-in microphone and a separate handheld viewing device. The BWV camera is worn on the outside of the uniform, facing in the forward position. The BWV recordings are stored digitally on the camera s internal memory and can be viewed on the separate handheld viewing device or on any computer connected to the Department s Local Area Network. The recordings cannot be manipulated, altered, or deleted. Prior to usage and deployment in the field, Department personnel assigned BWV must complete the Department s training on the proper use, maintenance, and activation criteria. Supervisors are required to ensure that subordinates adhere to Department BWV policy and procedures by providing the necessary guidance, training, and direction of both mandatory and proactive implementation standards. Absent exigent circumstances that preclude the immediate activation of BWV (in which case activation is required when safe and practicable), officers are required to record any investigative or enforcement activity involving a member of the public, including all: Vehicle stops; Pedestrian stops (including officer-initiated consensual encounters); Calls for service; Code 3 responses (including vehicle pursuits); Foot pursuits; Searches; Arrests; Uses of force; In-custody transports; Witness and victim interviews; Crowd management and control involving enforcement or investigative contacts; and, Other investigative or enforcement activities where, in an officer s judgement, a video recording would assist in the investigation or prosecution of a crime or when a recording of an encounter would assist in documenting the incident for a later investigation or review. The BWV shall continue recording until the investigative or enforcement activity has ended. If enforcement or investigative activity resumes, officers are required to reactivate the BWV device and resume recording. Officers are encouraged to inform individuals that they are being recorded when feasible. However, consent is not required when the officer is lawfully in an area where the recording takes place. In addition, officers are not required to play back BWV recordings for review by members of the public. If an officer is involved in a CUOF, they shall not review any BWV footage until authorized by the assigned FID investigator. Once authorized, the officer shall review the footage, and any other relevant recording (including DICVS footage), as deemed necessary and appropriate by the assigned FID supervisor, prior to being interviewed by investigators. An officer may have an employee representative present during the review of the BWV recordings without the FID investigator or supervisor present. The separating and monitoring of officers involved in a CUOF shall be maintained during the review of BWV recordings and a review shall not occur jointly among other involved employees. Supervisors assigned to monitor any officer(s) involved in a CUOF must take possession of the concerned employee s BWV equipment, ensure the device remains powered off, and maintain custody of the equipment until transferred to FID personnel. Supervisors investigating NCUOF incidents shall, when available, allow involved officers to review their BWV recordings and, if deemed necessary, review other BWV recordings to ensure complete and accurate reports and documentation of the incident USE OF FORCE YEAR-END REVIEW
.")
47 {ORGANIZATIONAL DEVELOPMENTS} TIMELINE OF BWV & DICVS 2005 The Los Angeles Police Department officially requests City funding for the DICVS program. October 2009 The BOPC votes and approves implementation of the DICVS program (first as a pilot program). December 2014 The Los Angeles Police Foundation donates 860 BWV cameras to the Department, including two years of licensing, maintenance and storage. Chief Beck and Mayor Garcetti announce the deployment of 860 BWV cameras in October 2013 The BOPC approves an $8 million contract to outfit 381 DICVS cameras in patrol vehicles in Operations-Central Bureau, nearly doubling the then-existing total. September 2015 Newton Division becomes the first geographic command to go operational with BWV. August 2016 The Department receives additional grant funding from the National Institute of Justice for the BWV program. Year-End of the 25 geographic Areas and traffic divisions under OO, or 96 percent, are successfully outfitted with BWV, and 22, or 88 percent, are successfully outfitted with DICVS. June 2008 The Department officially unveils the DICVS program, announcing partnership with IBM to equip 300 patrol vehicles with DICVS. Coban Technologies identified as the subcontracting entity that would provide hardware and software solutions. Initial funding was provided by the City s Efficiency Grant and the General Fund, each with a contribution of $2.5 million. April 2010 Southeast Division becomes the first geographic command to go operational with DICVS. August 2010 All Operations-South Bureau commands are successfully outfitted with DICVS, concluding with Harbor Division. August 2015 The Department receives grant funding from the Bureau of Justice for the BWV program. Year-End 2015 Five of the 25 geographic Areas and Traffic Divisions under OO are successfully outfitted with BWV; five of the 25 are also equipped with DICVS. Year-End 2016 Eight of the 25 geographic Areas and traffic divisions under OO are successfully outfitted with BWV; 16 of the 25 also equipped with DICVS. 24 of the 25 are 24 of the 25 geographic Areas and traffic divisions have operational BWV systems. The remaining Area (Foothill Division) is projected for BWV deployment in the beginning of Five-year contract The Department s five-year contract with Axon requires that Axon replace any outdated product (BWV cameras, viewing devices, and/or software) with the most current devices/specs. 6,336 BWV cameras deployed throughout the City. 88% DICVS 1,185 cameras 88% of the Department (22 of the 25 geographic Areas and traffic divisions) have operational DICVS cameras. 1,185 DICVS cameras are deployed throughout the City. 6+ million DICVS videos Over 3 million BWV videos and DICVS videos, respectively, have been uploaded to the Department s cloud-based storage. Funding The Department s DICVS program is fully funded by an annual allocation through the City s General Fund USE OF FORCE YEAR-END REVIEW LOS ANGELES POLICE DEPARTMENT 93

48 {OFFICE OF CONSTITUTIONAL POLICING & POLICY} The Office of CONSTITUTIONAL POLICING & POLICY After the Department successfully implemented the Department of Justice s Federal Consent Decree, the COP established OCPP to further institutionalize the reforms prescribed during the federal oversight. The purpose and function of OCPP is to analyze, develop, and implement organizational reform measures that promote constitutional policing policies for the community and Department personnel. The Office of Constitutional Policing and Policy consists of three groups, six divisions, and three sections that perform essential Department functions meant to advance the Department s shared vision for the future of the City. The following groups, divisions, and sections of OCPP are responsible for ensuring that the Department continues to advance the reforms instituted by a prior federal consent decree through coordinated and collaborative problem solving. GOVERNMENT LIAISON SECTION Government Liaison Section works closely with local, state, and federal legislature and government leaders to ensure new legislation, which impacts the Department, reflects the priority to protect and serve the community. For instance, this section coordinates between the COP and the City Council, the Mayor, City Attorney, City Controller, Chief Legislative Analyst, and City Administrative Officers to provide information, insight, and recommendations relative to matters pending before the City Council and its committees. This same coordination occurs at the state and federal level to ensure Department policies and procedures are in accordance with the law. COMMUNITY POLICING & POLICY GROUP In 2016, Community Policing and Policy Group was created to emphasize the Department s commitment to community outreach, organizational policies, strategic vision, and youth programs. The Community Policing and Policy Group is comprised of Community Relationship Division, Policies and Procedures Division, Strategic Planning Section, and the Youth Program Unit. Strategic Planning Section Strategic Planning Section ensures the Department s strategic plan, LAPD in 2020, is effectively implemented. The plan is a blueprint to build a stronger, more efficient, and more collaborative law enforcement organization of the future with an ultimate vision of making the City the safest big city in the United States by Youth Programs Unit The Youth Program Unit oversees all the Department s youth programs, including the Cadet Academy. First established in 1962, the Cadet program continues to develop our community s youth by fostering leadership and ethical decision-making skills, while grooming youth participants to be responsible and productive citizens through education and community-service. Since 2013, nearly 8,000 cadets have successfully completed the 18-week Cadet Leadership Academy, cultivating social bonds that will last a lifetime. Community Relationship Division Community Relationship Division (CRD) was formed in 2015 as an innovative policing practice, concentrated in pursuing stronger relationships between the Department and the diverse and unique communities throughout the City. The responsibilities of CRD include engaging in proactive outreach, utilizing best practices associated with relationship-based policing, and leveraging social media to strengthen the Department s relationships with the community. Community Relationship Division s responsibilities expanded the Department s portfolio of public trust and confidence programs. To assist with the Department s efforts of maintaining public trust and fostering relationships with the community, CRD instituted a general practice of deploying a team of personnel to scenes of significant events; including major UOF incidents, such as OIS or ICD incidents. These response procedures afford CRD personnel the opportunity to convey essential information about the course of events regarding the incident to the public, offer various support services to effected stakeholders, while also soliciting valuable feedback from the public regarding the incident. RISK MANAGEMENT LEGAL AFFAIRS GROUP Risk Management Legal Affairs Group is responsible for developing and implementing programs to reduce harms and mitigate risks to the community and to Department personnel, primarily in the areas of UOF, work injuries, employee involved traffic collisions, and workplace conflict. The Risk Management Legal Affairs Group is USE OF FORCE YEAR-END REVIEW LOS ANGELES POLICE DEPARTMENT 95

49 {OFFICE OF CONSTITUTIONAL POLICING & POLICY} The Department s Cadet program serves as an invaluable tool to nurture relationships between the Department and thousands of families throughout the City. Over 2,000 youths are currently participating in the program, which aims to develop fundamental skills needed for life-long success. Chief Charlie Beck comprised of Legal Affairs Division, Risk Management Division, and Ombuds Section. The commanding officer is the Department Risk Manager, who also serves as the Chair of the Risk Management Executive Committee (RMEC). Legal Affairs Division Legal Affairs Division coordinates with the City Attorney regarding legal matters affecting the Department, including UOF incidents. It provides investigative services to the City Attorney during litigation, and is responsible for Discovery and Public Records requests. Risk Management Division Risk Management Division includes the Risk Management Mitigation Unit, Analysis and Evaluation Section, and RMEC Support Unit. The Risk Mitigation Unit includes a UOF team. To help advance the Department-wide efforts to mitigate financial risks resulting from UOF incidents, the team is dedicated to researching innovative solutions that foster programs to keep the Department s workforce and community safe. This is a deliberate effort to improve how the organization serves the community and affirms its commitment to the Reverence for Human Life. The Analysis and Evaluation Section guides the Risk Mitigation Unit by capturing critical data valuable for the UOF problem solving team. Qualitative and quantitative data analyses assists in the creation and implementation of timely and appropriate solutions to UOF related matters. The Risk Management Executive Committee Support Unit assists RMEC in their review of an employee s work performance to assess risk management concerns. In cases that involve UOF, the Department may examine an employee s conduct to determine if potential ongoing liability issues are present, especially once the BOPC has adjudicated a UOF incident. When deemed necessary and appropriate, RMEC may impose work restrictions and/or other mitigating efforts to rehabilitate the employee and take necessary corrective actions to address any performance, behavioral, or managerial concerns. PUBLIC COMMUNICATIONS GROUP The Department values transparency and reverence for a free and open press, and is therefore committed to a positive and productive relationship with print, digital, and broadcast media from around the world. It is the responsibility of the Public Communications Group (PCG) to cultivate and maintain that important relationship by informing the media and the public about critical incidents (including UOF incidents), public safety issues, and other general police related information regarding the City. Public Communications Group maintains a strong connection with the press that is fostered through mutual respect. This connection is a bond that is held together by timely and accessible information. While the news media is PCG s primary stakeholder, the group is committed to delivering that information to the public through several traditional and alternative methods including, news releases, press conferences, video vignettes, social media posts, online media pages, and direct face-to-face community outreach efforts. A Public Information Officer supervisor is always on-call, ready to respond to every OIS or ICD incident (or other UOF incident deemed especially significant) and is responsible for managing the flow of information between the public and the Department throughout the event. Public Communications Group consists of Media Relations Division and the Digital Section, which support the initiative to provide timely and accurate information to the press across all media USE OF FORCE YEAR-END REVIEW LOS ANGELES POLICE DEPARTMENT 97


50 {MAPPING RESOURCES} MAPPING RESOURCES The Department s publication of various mapping resources assist management in the planning, deployment, and analysis of various assets. Furthermore, mapping resources provide invaluable visual references for field personnel in their daily efforts to prevent crime and better serve the City UOF INCIDENTS 13 (BY REPORTING DISTRICT) Geographic Areas 1 Central Area 12 77th Street Area 2 Rampart Area 13 Newton Area 3 Southwest Area 14 Pacific Area 4 Hollenbeck Area 15 North Hollywood Area 5 Harbor Area 16 Foothill Area 6 Hollywood Area 17 Devonshire Area 7 Wilshire Area 18 Southeast Area 8 West Los Angeles Area 19 Mission Area 9 Van Nuys Area 20 Olympic Area 10 West Valley Area 21 Topanga Area 11 Northeast Area Police Stations UOF Occurrence No Moderate Very Low High Low Very High 13 Map excludes UOF incidents that occurred outside of the Los Angeles city limits. Prepared by LAPD/ADSD/GIS Mapping USE OF FORCE YEAR-END REVIEW LOS ANGELES POLICE DEPARTMENT 99

51 {MAPPING RESOURCES} 2017 VIOLENT CRIME OCCURRENCE 14 AND OIS INCIDENTS OIS INCIDENTS Geographic Areas Geographic Areas 1 Central Area 12 77th Street Area 1 Central Area 2 Rampart Area 3 Southwest Area 4 Hollenbeck Area 5 Harbor Area 6 Hollywood Area 7 Wilshire Area 8 West Los Angeles Area 9 Van Nuys Area 10 West Valley Area 12 77th Street Area 13 Newton Area 14 Pacific Area 15 North Hollywood Area 16 Foothill Area 17 Devonshire Area 18 Southeast Area 19 Mission Area 20 Olympic Area 21 Topanga Area 2 Rampart Area 3 Southwest Area 4 Hollenbeck Area 5 Harbor Area 6 Hollywood Area 7 Wilshire Area 8 West Los Angeles Area 9 Van Nuys Area 10 West Valley Area 11 Northeast Area 13 Newton Area 14 Pacific Area 15 North Hollywood Area 16 Foothill Area 17 Devonshire Area 18 Southeast Area 19 Mission Area 20 Olympic Area 21 Topanga Area Police Stations 11 Northeast Area Police Stations OIS Incidents Violent Crime Occurrence Very Low Density Low Density Moderate Density High Density Very High Density OIS Incidents: Hit Incidents No Hit Incidents Prepared by LAPD/ADSD/GIS Mapping Map excludes UOF incidents that occurred outside of the Los Angeles city limits. 15 Map excludes UOF incidents that occurred outside of the Los Angeles city limits. Prepared by LAPD/ADSD/GIS Mapping USE OF FORCE YEAR-END REVIEW LOS ANGELES POLICE DEPARTMENT 101
52 {MAPPING RESOURCES} OIS HIT INCIDENTS Geographic Areas OIS-NO HIT INCIDENTS Geographic Areas 1 Central Area 12 77th Street Area 1 Central Area 12 77th Street Area 2 Rampart Area 13 Newton Area 2 Rampart Area 13 Newton Area 3 Southwest Area 14 Pacific Area 3 Southwest Area 14 Pacific Area 4 Hollenbeck Area 15 North Hollywood Area 4 Hollenbeck Area 15 North Hollywood Area 5 Harbor Area 16 Foothill Area 5 Harbor Area 16 Foothill Area 6 Hollywood Area 17 Devonshire Area 6 Hollywood Area 17 Devonshire Area 7 Wilshire Area 18 Southeast Area 7 Wilshire Area 18 Southeast Area 8 West Los Angeles Area 19 Mission Area 8 West Los Angeles Area 19 Mission Area 9 Van Nuys Area 20 Olympic Area 9 Van Nuys Area 20 Olympic Area 10 West Valley Area 21 Topanga Area 10 West Valley Area 21 Topanga Area 11 Northeast Area Police Stations 11 Northeast Area Police Stations OIS-Hit Incidents OIS-No Hit Incidents Map excludes UOF incidents that occurred outside of the Los Angeles city limits. Prepared by LAPD/ADSD/GIS Mapping Map excludes UOF incidents that occurred outside of the Los Angeles city limits. Prepared by LAPD/ADSD/GIS Mapping USE OF FORCE YEAR-END REVIEW LOS ANGELES POLICE DEPARTMENT 103


53 {MAPPING RESOURCES} 2017 UNSHELTERED PEOPLE 18 BY CENSUS TRACT Geographic Areas 2017 CALLS FOR SERVICE INVOLVING POSSIBLE MENTAL ILLNESS Geographic Areas 1 Central Area 12 77th Street Area 1 Central Area 12 77th Street Area 2 Rampart Area 13 Newton Area 2 Rampart Area 13 Newton Area 3 Southwest Area 14 Pacific Area 3 Southwest Area 14 Pacific Area 4 Hollenbeck Area 15 North Hollywood Area 4 Hollenbeck Area 15 North Hollywood Area 5 Harbor Area 16 Foothill Area 5 Harbor Area 16 Foothill Area 6 Hollywood Area 17 Devonshire Area 6 Hollywood Area 17 Devonshire Area 7 Wilshire Area 18 Southeast Area 7 Wilshire Area 18 Southeast Area 8 West Los Angeles Area 19 Mission Area 8 West Los Angeles Area 19 Mission Area 9 Van Nuys Area 20 Olympic Area 9 Van Nuys Area 20 Olympic Area 10 West Valley Area 21 Topanga Area 10 West Valley Area 21 Topanga Area 11 Northeast Area Police Stations 11 Northeast Area Police Stations Number of Unsheltered People Volume of Calls and over Low Medium High 18 Data from Los Angeles Homeless Services Authority Prepared by LAPD/ADSD/GIS Mapping Prepared by LAPD/ADSD/GIS Mapping USE OF FORCE YEAR-END REVIEW LOS ANGELES POLICE DEPARTMENT 105

54 {THE USE OF FORCE} THE USE OF LEGAL STANDARDS Federal and State law defines general UOF policy standards and practices for all law enforcement agencies. The City s civilian police oversight body, the BOPC, however, further refines the Department s UOF policy by establishing administrative standards. As a result, the Department s prescribed policies and procedures are more restrictive when compared to the broader legal guidelines. Therefore, OIS incidents and other applications of force utilized by Department personnel can be adjudicated as administrative disapproval/out of policy by the BOPC, despite the lawfulness of the officer s decisions or actions. Federal Legal Standards The United States Constitution and extensive case law dictates how all law enforcement organizations across the nation establish and maintain their UOF policies. The federal legal standard used to determine the lawfulness of a UOF is the Fourth Amendment to the United States Constitution. In Graham v. Connor,, the United States Supreme Court determined that an objective reasonableness standard should apply to a civilian s claim that law enforcement officials used excessive force in the course of making an arrest, investigatory stop, or other seizure of his/her person. Graham states in part: The reasonableness of a particular use of force must be judged from the perspective of a reasonable officer on the scene, rather than with the 20/20 vision of hindsight. The calculus of reasonableness must embody allowance for the fact that police officers are often forced to make split-second judgments in circumstances that are tense, uncertain and rapidly evolving about the amount of force that is necessary in a particular situation. The test of reasonableness is not capable of precise definition or mechanical application. In essence, the Supreme Court s ruling established that the force used must be reasonable under the circumstances known to the officer at the time. Therefore, the Department examines all UOF incidents from an objective, rather than a subjective, standard. State of California Legal Standards In accordance with California Penal Code Section 835a, law enforcement personnel may only use the amount force that is objectively reasonable to: Effect an arrest or detention; Prevent escape; or, Overcome resistance. A peace officer who makes or attempts to make an arrest need not retreat or desist from his efforts by reason of the resistance or threatened resistance of the person being arrested; nor shall such officer be deemed an aggressor or lose his right to self-defense by the use of reasonable force to effect the arrest or to prevent escape or to overcome resistance. LOS ANGELES POLICE DEPARTMENT 107
55 {THE USE OF FORCE} THE LOS ANGELES POLICE DEPARTMENT USE OF FORCE POLICY Preamble to the Use of Force Policy The UOF by members of law enforcement is a matter of critical concern both to the public and the law enforcement community. It is recognized that some individuals will not comply with the law or submit to control unless compelled to do so by the UOF. Therefore, Department personnel are sometimes called upon to use force in the performance of their duties. It is also recognized that members of law enforcement derive their authority from the public and must be ever mindful that they are not only the guardians, but also the servants of the public. The Department s guiding value when using force shall be Reverence for Human Life. Officers shall attempt to control an incident by using time, distance, communications, and available resources in an effort to de-escalate the situation, whenever it is safe and reasonable to do so. When warranted, Department personnel may use objectively reasonable force to carry out their duties. Officers who use unreasonable force degrade the confidence of the community they serve, expose the Department and fellow officers to legal and physical hazards, and violate the rights of individuals upon whom unreasonable force is used. Conversely, officers who fail to use force when warranted may endanger themselves, the community and fellow officers. Note Drawing and/or Exhibiting During a special meeting on September 29, 1977, the BOPC adopted the following as a valid justification for Department personnel to draw and/or exhibit firearms: Unnecessarily or prematurely drawing or exhibiting a firearm limits an officer s alternatives in controlling a situation, creates unnecessary anxiety on the part of citizens, and may result in an unwarranted or accidental discharge of the firearm. An officer s decision to draw or exhibit a firearm should be based on the tactical situation and the officer s reasonable belief there is a substantial risk that the situation may escalate to the point where deadly force may be justified. When an officer has determined that the use of deadly force is not necessary, the officer shall, as soon as practicable, secure or holster the firearm. The Use of Force Policy It is the policy of the Department that personnel may only use the amount of force that is objectively reasonable to: Defend themselves; Defend others; Effect an arrest or detention; Prevent escape; or, Overcome resistance. The Department s UOF policies are more restrictive than State and Federal law. For example, State and Federal law allows officers to shoot at moving vehicles where the suspect is using the vehicle itself as a weapon, while Department policy generally prohibits officers from using deadly force in such circumstances. The Department examines reasonableness using Graham v. Connor, the State of California legal standards set forth in California Penal Code Section 835a, and from the articulable facts from the perspective of a Los Angeles police officer with similar training and experience placed in generally the same set of circumstances as those of the evaluated incident. In determining the appropriate level of force, officers shall evaluate each situation in light of the facts and circumstances of each particular case. Those factors may include, but are not limited to: Imminent Black s Law Dictionary defines imminent as, near at hand; impending; on the point of happening. Serious Bodily Injury: As defined in California Penal Code Section 243(f)(4), serious bodily injury includes, but is not limited to, the following: Loss of consciousness; Concussion; Bone fracture; Protracted loss or impairment of function of any bodily member or organ; A wound requiring extensive suturing; and, Serious disfigurement. The seriousness of the crime or suspected offense; The level of threat or resistance presented by the subject; Whether the subject was posing an immediate threat to officers or a danger to the community; The potential for injury to citizens, officers or subjects; The risk or apparent attempt by the subject to escape; The conduct of the subject being confronted (as reasonably perceived by the officer at the time); The time available to an officer to make a decision; The availability of other resources; The training and experience of the officer; The proximity or access of weapons to the subject; Officer versus subject factors such as age, size, relative strength, skill level, injury/exhaustion and number of officers versus subjects; and, The environmental factors and/or other exigent circumstances. According to the objectively reasonable standard in Graham, a suspect s actions and behavior, among other factors, determine whether the officer s reactions are in policy. Drawing and/or Exhibiting Firearms Police officers frequently face dangerous and volatile conditions that carry inherent danger and the potential to result in deadly force situations. During an incident, officers must continually re-assess the various conditions and circumstances of the incident itself, including the suspect s actions, in determining whether the use of deadly force could be warranted. Although officers must be prepared to protect themselves and the public from life threatening acts by others, it is equally important that officers refrain from drawing their weapon when such conditions do not exist. Therefore, the Department created a specific policy governing when personnel may draw and/or exhibit duty firearms. Officers shall not draw or exhibit a firearm unless the circumstances surrounding the incident create a reasonable belief that it may be necessary to use the firearm in conformance with this policy. Deadly Force During the rare and unfortunate circumstances when deadly force is justified to stop a threat to the public or police officers, the Department authorizes such force to be utilized by personnel in any of the following situations: 1 Protect themselves or others from what is reasonably believed to be an imminent threat of death or serious bodily injury; or, 2 Prevent a crime where the suspect s actions place person(s) in imminent jeopardy of death or serious bodily injury; or, 3 Prevent the escape of a violent fleeing felon when there is probable cause to believe the escape will pose a significant threat of death or serious bodily injury to the officer or others if apprehension is delayed. In these circumstances, officers shall, to the extent practical, avoid using deadly force that might subject innocent bystanders or hostages to possible death or injury. In response to the decision rendered by the Supreme Court of California in the case of Hayes v. County of San Diego, the Department revised its UOF policy in 2014 to include consideration of officers tactical conduct and decisions leading up to the use of deadly force when evaluating the objective reasonableness of an incident. Warning Shots Warning shots shall only be used in exceptional circumstances where it might reasonably be expected to avoid the need to use deadly force. Generally, warning shots shall be directed in a manner that minimizes the risk of injury to innocent persons, ricochet dangers and property damage. In response to the decision rendered by the Supreme Court of California in the case of Hayes v. County of San Diego, the Department revised its UOF policy in 2014 to include consideration of officers tactical conduct and decisions leading up to the use of deadly force when evaluating the objective reasonableness of an incident. Shooting at or From Moving Vehicles Firearms shall not be discharged at a moving vehicle unless a person in the vehicle is threatening the officer or others with deadly force by means other than the vehicle itself. The moving vehicle shall not presumptively constitute a threat that justifies an officer s use of deadly force. An officer threatened by an oncoming vehicle shall move out of its path instead of discharging a firearm at it or any of its occupants. Firearms shall not be discharged from a moving vehicle, except in exigent circumstances and in the immediate defense of life USE OF FORCE YEAR-END REVIEW LOS ANGELES POLICE DEPARTMENT 109

56 {THE USE OF FORCE} Not Reportable as NCUOF The following incidents are not reportable as a NCUOF incident: The use of a C-grip, firm grip, or joint lock to compel a person to comply with an employee s direction which does not result in an injury or complaint of injury; The UOF reasonable to overcome passive resistance due to physical disability, mental illness, intoxication, or muscle rigidity of a person (e.g., use of a C-grip or firm grip, joint lock, joint lock walk down or body weight) which does not result in an injury or complaint of injury; DEPARTMENT CATEGORIZATION OF UOF INCIDENTS The Department classifies UOF incidents as either a CUOF or a NCUOF, depending on the level of force used or severity of injuries sustained by the suspect and/or officer. Categorical Use of Force A CUOF is defined as: An incident involving the use of deadly force (e.g., discharge of a firearm) by a Department employee; All uses of an upper body control hold by a Department employee, including the use of a modified carotid, full carotid or locked carotid hold; All deaths while the arrestee or detainee is in the custodial care of the Department (also known as an ICD); A UOF incident resulting in death; A UOF incident resulting in an injury requiring hospitalization, commonly referred to as a LERII; All intentional head strikes with an impact weapon or device (e.g., baton, flashlight, etc.) and all unintentional (inadvertent or accidental) head strikes that result in serious bodily injury, hospitalization or death; Officer involved animal shootings; Tactical and non-tactical unintentional discharges; An incident in which a member of the public has contact with a Department canine and hospitalization is required; and, Incidents where the Department has agreed to conduct similar critical incident investigations for a non-department entity, such as a Los Angeles Fire Department Arson Unit. All other reportable UOF incidents, including the discharge of a TASER, the use of a chemical irritant control device, or all unintentional (inadvertent or accidental) head strikes with an impact weapon or device which do not result in serious bodily injury, hospitalization or death which have been approved to be handled as a Level I NCUOF by the CO of FID, are classified as NCUOF incidents. Non-Categorical Use of Force A reportable NCUOF is defined as an incident in which any on-duty Department employee, or off-duty employee whose occupation as a Department employee is a factor, uses a lesslethal control device or physical force to compel a person to comply with the employee s direction, overcome resistance of a person during an arrest or a detention, or defend any individual from an aggressive action by another person resulting in an injury or a complaint of injury. Non-Categorical Use of Force Levels All NCUOF incidents shall be classified as either a Level I or Level II incident. A NCUOF shall be reported as a Level I incident under the following circumstances: An allegation of unauthorized force is made regarding the force used by a Department employee(s); or, The force used results in a serious injury, such as a broken bone, dislocation, an injury requiring sutures, etc., that does not rise to the level of a CUOF; or, Note: If the investigating supervisor is unable to verify the seriousness of an injury or complaint of injury, it shall be reported as a Level I incident. If the injury requires admission to a hospital, the incident becomes a CUOF and will be investigated by FID. The injuries to the person upon whom force was used are inconsistent with the amount or type of force reported by involved Department employee(s); or, Accounts of the incident provided by witnesses and/or the subject of the UOF substantially conflict with the involved employee(s) account. All other reportable NCUOF incidents that do not meet Level I criteria shall be reported as Level II incidents. This includes the use of an impact device or less-lethal munitions with hits. Note: If the use of an impact device or less-lethal munitions causes a serious injury such as a broken bone, dislocation, or an injury requiring sutures, etc., and does not rise to the level of a CUOF, it shall be reported as a Level I incident. Under any circumstances, the discharge of a less-lethal projectile weapon (e.g., beanbag shotgun, TASER, 37mm or 40mm projectile launcher, any chemical control dispenser or Compressed Air Projectile System) that does not contact a person; Force used by an organized squad in a crowd control situation, or a riotous situation when the crowd exhibits hostile behavior and does not respond to verbal directions from Department employees; and, Note: Isolated incidents resulting from a crowd control situation may require a UOF investigation as determined by a supervisor at the scene. Any incident investigated by FID and determined not to rise to the level of a CUOF USE OF FORCE YEAR-END REVIEW LOS ANGELES POLICE DEPARTMENT 111

57 {MEDICAL CARE} Medical Care of Arrestees Once an arrestee is in the custody of the Department, a safe housing environment and access to adequate medical care are required. The watch commander at the arresting officers geographic Area inquires whether the arrestee has any medical problems prior to authorizing booking procedures to begin. Once at a Department custody facility, the initial medical assessment of an arrestee is twofold. First, the arresting officer(s) completes a standardized medical questionnaire. The questionnaire is utilized to identify any medical concerns, mental illnesses, use of prescribed medication, and substance use. Second, the officer(s) performs a visual screening of the arrestee for any visible injuries, impairment, and/or medical conditions that would require medical attention or an increased level of care. If the arrestee reports or displays the need for medical treatment, onsite Medical Services Division personnel evaluate the arrestee within each of the three regional custody facility medical dispensaries (Metropolitan Detention Center, 77th Regional Jail, and Valley Regional Jail). If the level of care cannot be sufficiently provided at the Department s custody facility, the arrestee is transferred to a contract hospital or the county jail for further treatment. If the treating physician at the contract hospital clears the arrestee to return to the detention facility, a re-screening is conducted and the level of care is monitored until the arrestee is transferred to another agency. After the arrestee has been screened by the arresting officer(s) and evaluated by medical personnel, if needed, the booking officer conducts a second evaluation of the arrestee to identify any factors that necessitate special housing arrangements. Once housed at the custody facility, the arrestee is observed in person by jail personnel at a minimum of every 30 minutes, exceeding the hourly check required under State Title 15 mandates. Medical staff conducts sick-call visits to the housing units at approximately 3:00 a.m. and 3:00 p.m. each day to provide follow-up care. Medical staff also utilize the sickcall visits to address any new concerns by arrestees who did not report any initial medical issues USE OF FORCE YEAR-END REVIEW LOS ANGELES POLICE DEPARTMENT 113


58 THE INVESTIGATION, REVIEW, & ADJUDICATION PROCESS The Department understands the impact of every UOF and has implemented thorough investigative, review, and adjudicative processes to ensure that Department policies are being adhered to, and most importantly, to safeguard the constitutional rights of the public USE OF FORCE YEAR-END REVIEW LOS ANGELES POLICE DEPARTMENT 115


59 {INVESTIGATION, REVIEW, & ADJUDICATION PROCESS} CATEGORICAL USE OF FORCE The Department, like all other law enforcement agencies, is mandated by law to oversee and investigate all UOF incidents by its officers. The adjudication process for CUOF incidents involves a precise and systematic process with specific procedures. Officer involved shootings, for example, take on a different level of investigation and review compared to NCUOF incidents. Unlike NCUOF incidents, all CUOF incidents are followed by a formal adjudication process consisting of a comprehensive investigation, a thorough analysis of the force used by a UOFRB (does not apply to animal shootings and UDs), recommended findings presented by the UOFRB to the COP, recommended findings by the COP to the BOPC, and the final adopted findings imposed by the BOPC. Commanding Officer, PSB; Involved employee(s) CO; Department Risk Manager; and, Los Angeles County District Attorney s Office (for those cases identified in the roll out protocol governing such notifications). Initial Notification and Call-Out Procedures Currently, RACR notifies the on-call FID Officer-in-Charge (OIC) of the CUOF incident, who coordinates for FID personnel to respond to the scene within one hour of notification. The first arriving FID investigator ensures that on-scene personnel have secured the crimes scene(s), generated crime scene logs, and have established a perimeter. Public Safety Statement Immediately after a CUOF incident occurs, specifically an OIS, a Department supervisor will take a Public Safety Statement (PSS) from substantially involved personnel (SIP). The PSS is a cursory statement of what occurred in order to address public safety concerns. After obtaining sufficient information, the supervisor shall immediately cause the individual separation of SIP and/or other witness employees and order them not to discuss the incident with anyone other than the assigned investigators and/or the employee s representative(s). Separation and Transportation of Personnel After the PSS has been obtained and all public safety concerns have been addressed (e.g., establishing a perimeter, protecting the crime scene, locating witnesses/ evidence, managing the response of additional resources, etc.), the incident commander shall ensure that additional supervisors transport all SIPs and witness employees individually to the location of the FID interview as soon as practicable. Separation shall remain in effect until FID interviews all concerned employees. Real Time Analysis and Critical Response Division Responsibilities Real-Time Analysis and Critical Response Division (RACR) is responsible for making the following notifications within 20 minutes of being notified by the Area watch commander/ incident commander that a CUOF incident has occurred: Force Investigation Division; Office of the COP or his designee; Chief of Staff; and, Office of the Inspector General (acting on behalf of the BOPC). As soon as possible after being notified of a CUOF incident, but not required within 20 minutes, RACR is responsible for making notifications to the following entities: Force Investigation Division Upon arrival at the scene of a CUOF incident, FID personnel assume responsibility of the overall investigation. As part of the investigation, FID personnel conduct interviews with all involved parties, locate and collect evidence, manage crime scenes, coordinate the acquisition of photographs, and liaise with other relevant Department and non- Department entities. Force Investigation Division was established on August 22, 2004, as the Department entity responsible for the administrative investigation of all UOF incidents determined to be Categorical, as defined in the Federal Consent Decree. Force Investigation Division is comprised of four Administrative Investigation Sections, comprised of two teams each; a Criminal Apprehension Team; an Investigative Support Unit; and an Investigative Support Section. Resources Utilized by FID Depending upon the type of CUOF incident, the following Department resources may be utilized: Command Post Unit; Forensic Science Division (FSD), comprised of Field Investigation, Firearms Analysis, Narcotics Analysis, Quality Assurance, Questioned Documents, Serology/ DNA, Toxicology and Trace Analysis Units; Technical Investigation Division (TID) comprised of the Electronics, Latent Print, Photography and Polygraph Units; and, Air Support Division (aerial photographs). Additionally, the following Department and/or outside entities may respond: Media Relations Section; Robbery Homicide Division; Office of the Inspector General; Officer Representation Section; Los Angeles Police Protective League; Los Angeles County District Attorney s Office; - Justice System Integrity Division; - Crimes Against Police Officers Section (CAPOS); and, Los Angeles County Department of Medical Examiner Coroner. Investigative Procedures & Guidelines Following the Field Investigation Force Investigation Division is obligated to complete the investigation and forward the case to UOFRD within 240 days of the date of the CUOF incident date. If necessary, FID investigators may conduct additional investigative inquiries, as requested by the COP or the BOPC. To ensure that a CUOF is properly reviewed and adjudicated in a timely manner, the COP shall submit all CUOF recommended administrative findings to the BOPC by an administrative statute deadline of 60 calendar days prior to the administrative statute date. The COP will submit correspondence to the BOPC, detailing the recommended administrative findings by the administrative statute deadline, unless sufficient cause exists for an extension of that deadline. Grounds for such extension are as follows: 1) the FID investigation has not been completed within 125 calendar days prior to the administrative statute date, causing delay in the review and the UOFRB process; or, 2) UOFRD; the Director, OAS; or the COP identifies a need for additional or supplemental investigation. Inclusion of Other Investigative Entities During the course of the initial investigation, evidence and/ or other facts about the incident may emerge, warranting joint-investigations amongst several investigative entities. Factors that contribute to the decision on whether to incorporate joint investigations are typically identified while FID conducts their initial investigation or during the preliminary notification process of information obtained from supervisors who respond to the incident. Such factors include, but are not limited to, the death of, or serious bodily injury sustained by, a police officer as a result of the suspect s actions, the identification of a Department employee as the victim of a crime directly related to the incident being investigated, or allegations of serious misconduct on behalf of the officer. In such events, the Department may involve the following: Robbery-Homicide Division; Internal Affairs Group; and, Los Angeles County District Attorney s Office, CAPOS. Forensic Science Division & Technical Investigation Division Forensic Sciences Division and TID include the Criminalistics Laboratory and the Technical Laboratory. In the broadest sense, FSD and TID s functions are to facilitate the collection, comparison, and interpretation of all types of physical evidence found at crime scenes, or collected from suspects and victims, and to provide expert testimony in these areas. The Criminalistics Laboratory is a part of the Hertzberg- Davis Forensic Science Center at the Los Angeles Regional Crime Laboratory. The 180,000 square foot forensic science facility is located on the campus of California State University, Los Angeles, and is shared by the Department, the Los Angeles County Sheriff s Department, California State University, Los Angeles, the California Forensic Science Institute, and the California Criminalistics Institute USE OF FORCE YEAR-END REVIEW LOS ANGELES POLICE DEPARTMENT 117

, bloodborne pathogen exposure, and military deployment.")
60 {INVESTIGATION, REVIEW, & ADJUDICATION PROCESS} The Criminalistics Laboratory is comprised of the Field Investigation Unit, Firearm Analysis Unit, Narcotics Analysis Unit, Quality Assurance Unit, Questioned Documents Unit, Serology/DNA Unit, and the Toxicology and Trace Analysis Unit. The Technical Laboratory encompasses the Electronics, Latent Print, Photography and Polygraph Units. Behavioral Science Services There are four specific situations that Department employees may be involved in that generate a mandated referral to BSS. These situations include OIS incidents, CUOF incidents (other than OIS incidents), bloodborne pathogen exposure, and military deployment. Appointments are arranged by the employee s CO and are conducted on-duty. 72-Hour Briefing Within 72-Hours of an OIS (or other significant CUOF incident wherein a briefing is deemed necessary by Within 72-Hours of an OIS an initial briefing is scheduled for the COP and other concerned command staff members. During the briefing, FID provides a preliminary presentation of the incident and answers questions by the COP and attending staff members. the COP), an initial briefing is scheduled for the COP and other concerned command staff members. During the briefing, FID provides a preliminary presentation of the incident and answers questions by the COP and attending staff members. Although the briefing is an initial assessment of the incident, based on preliminary information, many basic facts are available at this stage. The objective of the briefing is to address issues that require immediate Department attention. The involved employees of the incident do not attend the briefing. General Training Update General Training Updates are mandatory training sessions for all substantially involved personnel following a CUOF incident. Personnel are not allowed to return to field duties until the GTUs have been successfully completed. There are six mandatory topics (seven for OIS incidents), in addition to any other concerns addressed by the COP, the concerned Area CO, UOFRD, and/or PSTB: Command and Control; Equipment Required/Maintained; Tactical Communication; Tactical De-Escalation; Tactical Planning; Use of Force Policy; and, Force Option Simulator (for OIS incidents). In 2017, TD was tasked with the responsibility of conducting GTUs for all CUOF incidents. Prior to TD assuming responsibility of the GTU instruction, Area training coordinators completed the required training. General Training Update sessions are administered by instructors from TD, with assistance of training unit personnel from the concerned Area and Bureau. In addition to facilitating the actual training, TD is responsible for documentation and tracking of employees who did not attend the training due to valid temporary exemptions (e.g. on-leave due to injury, scheduled vacation, etc.). Statute of Limitations for Adjudication To ensure that CUOF incidents are properly reviewed and adjudicated in a timely manner, time limitations are implemented for various levels of investigation and review. These include: The statute date, or completion date for the entire process, which is one year from the CUOF incident date (or the date the incident is reported to a Department supervisor); FID s completion of the entire CUOF incident, which is within 240 calendar days from the date of incident; and, The COP s recommended findings, which shall be submitted to the BOPC within 60 calendar days prior to the administrative statute date. Review & Findings Upon completion of FID s investigation of a CUOF incident, UOFRD receives and completes a comprehensive review and analysis of the incident. Use of Force Review Division then schedules a UOFRB. In determining the proper adjudication for a CUOF incident, the following sections are extensively evaluated by all levels of review (including the UOFRB, the COP, the OIG, and the BOPC): TACTICS Findings Tactical Debrief Administrative Disapproval Outcome Tactical Debrief Tactical Debrief plus: Extensive Retraining; Notice to Correct Deficiencies; and/or, Personnel Complaint. DRAWING/EXHIBITING OF FIREARM Findings Outcome In Policy/No Further Action Tactical Debrief Administrative Disapproval/ Out of Policy USE OF FORCE Findings In Policy/No Further Action Administrative Disapproval/ Out of Policy Tactical Debrief plus: Extensive Retraining; Notice to Correct Deficiencies; and/or, Personnel Complaint. Outcome Tactical Debrief Tactical Debrief plus: Extensive Retraining; Notice to Correct Deficiencies; and/or, Personnel Complaint. Factors Considered in Determining Appropriate Findings Tactics: Was the officer s tactical decision making appropriate during and prior to the incident? Were his/ her actions considered a substantial deviation from Department training and, if so, was that deviation justifiable? Drawing/Exhibiting: Did the officer have a reasonable belief that the tactical situation could potentially escalate to the point where deadly force may be justified? Use of Force: Was the officer s force objectively reasonable and carried out in accordance with the Department s UOF policy? USE OF FORCE YEAR-END REVIEW LOS ANGELES POLICE DEPARTMENT 119

61 {INVESTIGATION, REVIEW, & ADJUDICATION PROCESS} Use of Force Review Board The UOFRB consists of a representative from each of the following entities: Office of Administrative Services (Chair); Representative from the respective Office; Police Sciences and Training Bureau; Representative from the concerned geographic Bureau; and, Peer member (similar rank of the substantially involved personnel). Additionally, a representative from the OIG is present at the UOFRB in an oversight capacity. The UOFRB is presented information and analysis from FID personnel, who brief the UOFRB about the facts of the incident and the subsequent investigation. The CO of the concerned substantially involved employee also attends and offers his/her assessment of the incident and recommendations. After careful examination, the UOFRB makes its recommendations of the findings and forwards them to the COP. Chief of Police The COP analyzes and examines all the facts presented, including the UOFRB s recommendations, and either concurs with the recommended findings or provides contrasting findings of his/her own. The COP submits correspondence to the BOPC, detailing the recommended administrative findings by the administrative statute deadline. Los Angeles County District Attorney s Office Personnel from LACDA respond to OIS and ICD incidents to lend advice to FID regarding criminal law issues as they pertain to the investigation and also to assess whether an independent criminal investigation is necessary. Office of the Inspector General All FID investigations are closely overseen by the OIG. The OIG s oversight begins immediately following the occurrence of a CUOF. The OIG has a 24-hour response capability, and is promptly notified following the occurrence of a CUOF. The OIG responds to the scene of CUOF incidents and monitors the conduct of FID s onscene investigation, assessing compliance with applicable policy standards, as well as more generally working to ensure the overall quality of the investigative work being performed. As the investigation progresses over the months that follow the incident, the OIG maintains its oversight role. The OIG s oversight of each investigation culminates in a detailed review of every completed investigation case file, and a written assessment of such to the BOPC of the quality of that investigation. In practice, the OIG works closely with FID in order to ensure that, whenever possible, investigative issues identified during the course of the investigation are addressed and resolved. Concurrent with the Department s internal review of each CUOF by the UOFRB and the COP, the OIG independently reviews every CUOF case. As it conducts its own review, the OIG s staff also monitors the progression of the Department s internal review. This monitoring role includes attendance at every UOFRB, where the OIG may ask questions and provide input to the board members. Once the COP s report to the BOPC of each CUOF case is completed, it is reviewed by the OIG. The OIG evaluates the COP s findings and reports its own, independent set of recommendations to the BOPC for use in its adjudication of the case. In cases where the OIG concurs with the findings of the COP, it will recommend to the BOPC that it adopt those findings. If the OIG believes additional or different analysis is warranted, the OIG will provide that analysis to the BOPC in its report. If the OIG determines that the available evidence supports findings other than those set forth by the COP, it will recommend, with supporting analysis, that the BOPC modify the COP s findings. Board of Police Commissioners The BOPC reviews and examines the facts of the case while considering the recommended findings proposed by the COP, on behalf of the Department, as well as the independent recommended findings proposed by the OIG. The BOPC adjudicates the case and delivers the adopted findings for each of the concerned Department personnel. Post-Adjudication Procedures Internal Process Report (IPR) Immediately following the adjudication process, UOFRD forwards an IPR Form, which lists the individual findings for each substantially involved employee, to the involved employee s CO. The CO personally meets with the employee(s) and discusses the incident and the adopted BOPC findings. Additionally, the CO shall discuss any adverse actions related to the incident as a result of a finding of Administrative Disapproval or Out of Policy. Tactical Debrief, Extensive Retraining, & Disciplinary Proceedings Under current policy, an Administrative Disapproval/Out of Policy determination will result in the following: extensive As part of the investigation, FID personnel conduct interviews with all involved parties, locate and collect evidence, manage crime scenes, coordinate the acquisition of photographs, and liaise with other relevant Department and non- Department entities USE OF FORCE YEAR-END REVIEW LOS ANGELES POLICE DEPARTMENT 121

62 {INVESTIGATION, REVIEW, & ADJUDICATION PROCESS} retraining, notice to correct deficiencies, and/ or a personnel complaint. If such findings are adopted, the COP will render a decision on which of the outcomes are most suitable to address the employee s actions. The formal debriefing of all CUOF incidents, also referred to as the Tactical Debrief, is a critical part of the process for the employees, the Department, and law enforcement in general. It affords all parties the opportunity to identify what was successful and which areas require improvement. The Tactical Debrief addresses topics that could assist in the modification or enhancement of the Department s commitment to best practices and overall employee performance. Curriculum and class instruction are formatted to promote dialogue and an open forum between personnel and the instructors, thus allowing a more suitable platform for collaboration and overall enrichment. The Tactical Debrief is facilitated by a member of the Department s Training Division and occurs within 90 days after the BOPC s adjudication of the incident. Extensive Retraining is conducted by TD. The facilitator of the Extensive Retraining course tailors the training to be incident specific and verifies that the areas of concern are included in the course curriculum. If a Notice to Correct Deficiencies is served, the CO of the employee will complete and submit the necessary documentation, which is to be recorded on the employee s TEAMS II Report. In certain circumstances, it may be appropriate for the Department to initiate a personnel complaint. Those instances include when training alone is insufficient, has already been provided and proven ineffective, and/or the employee substantially deviated from Department policy or procedure(s) without justification. In such cases, the employee could face an official reprimand, demotion, suspension, or termination. Department Personnel Tracking & Monitoring Following the enactment of the Federal Consent Decree in 2001, the Department was required to implement numerous reform measures to track the trajectory and scope of its performance and consent decree adherence. One such measure was the development of the computerized TEAMS II database USE OF FORCE YEAR-END REVIEW TEAMS II is the Department s version of a risk management database, wherein information is collected about each officer s UOF involvement, civilian complaints, training activities, commendations, vehicle accidents, and many other performance measures. Once a threshold in any of those fields is reached, the system automatically alerts supervisors about officers whose patterns of activity seem more at risk than their peers. The TEAMS II system is an effective human resource management tool for the Department, which promotes transparency and accountability within the organization. CATEGORICAL OIG Office of the Inspector General responds to the scene and monitors the investigation. In Policy/No Further Action Tactical Debrief Los Angeles County District Attorney s Office LACDA call-out team monitors the investigation of incidents that meet the criteria. USE OF FORCE Substantially Involved Personnel immediately restricted from field duties and scheduled for an appointment with BSS (if applicable) COP 72-hour Brief GTU for Substantially Involved Personnel BOPC Board of Police Commissioners receive COP recommendations and evaluate the incident. BOPC adjudicates the incident. COP Justice System Integrity Division The LACDA Justice System Integrity Division submits letter of declination or files charges against the officer. FID Force Investigation Division personnel respond and conduct the CUOF investigation. COP UOFRD Use of Force Review Division receives completed FID investigation for review and schedules a UOFRB. The Chief of Police receives UOFRB recommendations and evaluates the incident. COP reports his recommendations to the BOPC. UOFRB UOFRB is convened, chaired by the Director of OAS. Administrative Disapproval/Out of Policy Tactical Debrief; and, COP determines additional outcome: Extensive Retraining; Notice to Correct Deficiencies; and/or, Personnel Complaint. Personnel Complaint A personnel complaint may be initiated as a result of BOPC s findings. See page 128 for details on the personnel complaint process. LOS ANGELES POLICE DEPARTMENT 123
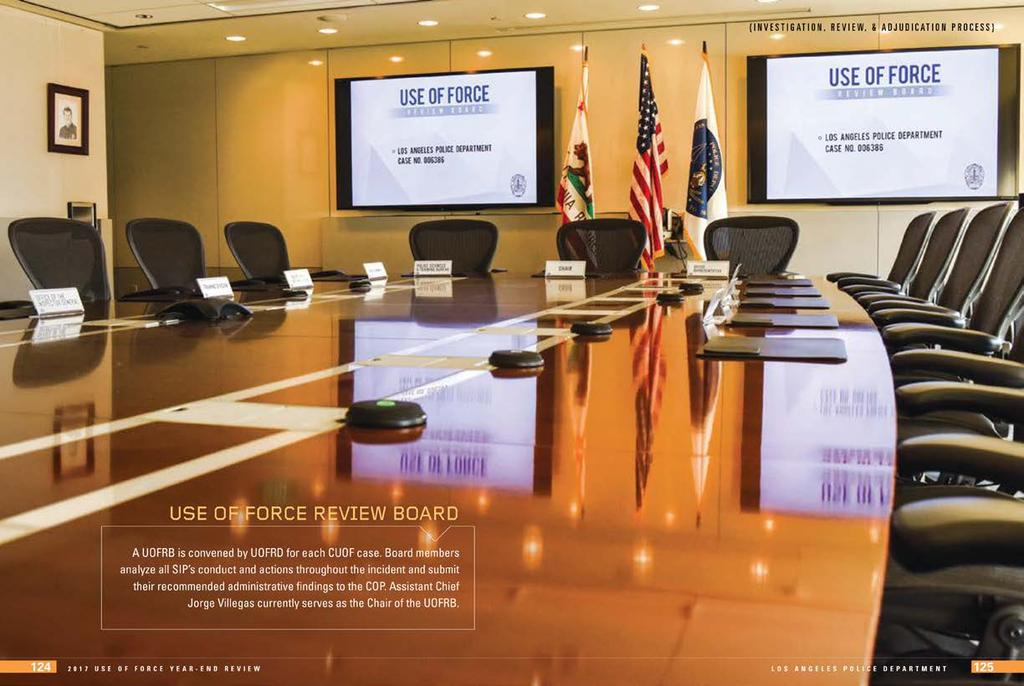
63
64 {INVESTIGATION, REVIEW, & ADJUDICATION PROCESS} NON-CATEGORICAL USE OF FORCE The adjudication process for NCUOF incidents differs with respect to the chain of investigation, review, analysis, and adoption of findings compared to CUOF incidents. Nonetheless, the implementation of highly precise, systematic, and proficient levels of review ensures that all NCUOF cases receive the highest degree of evaluation and proper disposition by the Department. Investigation of a NCUOF Level I Incident Supervisors are required to record non-department witness statements, document/photograph injuries and obtain medical treatment (when applicable) of involved suspect(s) or employee(s), and acquire photographs of the NCUOF incident scene. Investigation of a NCUOF Level II Incident The process for documenting/reporting Level II incidents shall mirror that of a Level I incident, with the following exceptions: Tape-recording non-department employee witnesses is optional; The requirement for an Incident Overview is eliminated; and, The requirement to document any suspect and witness statements in the narrative of the NCUOF report is eliminated. The related crime and/or arrest report or Employee s Report will serve as documentation of statements for the subject of the UOF, witnesses, and involved Department employees. Any discrepancies between statements shall still be addressed in Investigating Supervisor s Notes. Note: Discrepancies that constitute a substantial conflict between witness or suspect accounts and the involved employee(s) account shall be reported as a Level I incident. Watch Commander Responsibility As part of the watch commander s evaluation of the NCUOF incident, they shall: Evaluate whether or not the applications of force used were objectively reasonable and consistent with actions reported by the involved Department employee(s), ensuring that all relevant tactical actions, UOF application(s) and policy issues are addressed. Note: The watch commander/oic shall evaluate the force that was used, not the force options that could have been considered. Ensure that all supervisors are interviewed regarding their conduct at the scene during the incident; and, Evaluate the actions of each of these supervisors. Commanding Officer Responsibility Upon receipt of a NCUOF investigation, the CO of the concerned Bureau/Area/Division shall: Utilize the Area/Division Training Coordinator to evaluate the incident; Contact subject matter experts (e.g. Training Division) to obtain additional information, as needed; Review all reports and make a recommendation on the disposition; and, Notify the employee of UOFRD s final disposition as soon as practicable. Commanding Officer, UOFRD Responsibility The Director of OAS is the Department s review authority for the administrative review of all UOF incidents. For NCUOF incidents, that authority is generally exercised through the CO of UOFRD, who shall: Review the NCUOF investigation and all related reports to ensure compliance with Department policy and procedure; and, Approve or disapprove the recommended disposition and provide a written rationale for any finding that differs from that of the Bureau CO. Post-Adjudication Procedures Following adjudication of a NCUOF incident, the following shall occur: Recordation of training into the concerned employee s TEAMS II Report; and, If applicable, directed training for issues or deficiencies identified from the incident, and/or initiation of a personnel complaint. NON-CATEGORICAL USE OF FORCE AREA CO SUPERVISOR A supervisor responds and conducts the NCUOF investigation. WATCH COMMANDER Watch Commander and Training/TEAMS II Coordinator reviews the supervisor s completed investigation and makes adjudication recommendations. Area/Division CO reviews the NCUOF investigation. Adjudicates as Administrative Approval/In Policy or Administrative Disapproval/Out of Policy. BUREAU CO Bureau CO reviews the NCUOF investigation. Bureau CO may approve the recommendations or; Bureau CO may direct training and/or discipline. Possible Dispositions for Administrative Disapproval/Out of Policy Findings No action Incident debrief Informal meeting/counseling Divisional training Formal training Comment card Notice to correct difficiencies Personnel complaint Modified field duties Assigned to non-field duties UOFRD Use of Force Review Division reviews the NCUOF investigation. UOFRD CO may approve the recommendations or; UOFRD CO may direct training and/or discipline USE OF FORCE YEAR-END REVIEW LOS ANGELES POLICE DEPARTMENT 127

65 {PERSONNEL COMPLAINTS} Internal Affairs was first created as a Bureau of the Department in For nearly sixty-nine years, IAG, under the command of PSB, operates as the investigative arm of the COP to identify and report corruption and employee behavior that violates Department policy or otherwise discredits the organization. INITIATION & INVESTIGATION PROCESS The initiation process for complaints resulting from UOF findings of Administrative Disapproval/Out of Policy differs depending on whether the force was classified as a CUOF or NCUOF incident. Categorical Use of Force The Board of Police Commissioners adjudicates the UOF and determines the findings for each involved employee. If an Administrative Disapproval/Out of Policy finding is adopted, the COP determines which of the below listed outcomes is most appropriate to address the employee s actions. Such remedial actions may include: Completion of extensive retraining; Notice to Correct Deficiencies; and/or Personnel complaint. If the COP determines a personnel complaint is appropriate, UOFRD initiates the complaint through the Complaint Management System and transmits it to the Complaint Classifications Unit (CCU), IAG. Complaints resulting from CUOF incidents are investigated by CCU. Because the FID investigation and subsequent review process are exhaustive, these complaints are commonly initiated within two months of the administrative statute date. To complete the complaint investigation within such short time period, CCU investigators generally use the FID investigation, interviews, and transcripts to complete the complaint, though on occasion, ancillary allegations and discrepancies necessitate additional investigation. Non-Categorical Use of Force Personnel complaints and/or training resulting from Administrative Disapproval/Out of Policy findings for NCUOF incidents may be initiated by one of the following at any point throughout the UOF review cycle: Divisional CO; Bureau CO; or Commanding Officer, UOFRD. Commanding Officer, UOFRD Ultimately, the CO of UOFRD either approves or disapproves the bureau s recommended disposition. When there is a finding of Administrative Disapproval/Out of Policy, UOFRD may recommend training and/or discipline. Complaints associated with NCUOF incidents are generally investigated by CCU, and occasionally by other IAG investigators. The investigators review all reports and interviews related to the UOF, probe ancillary allegations, and address discrepancies as they would any other type of allegation. COMPLAINT ADJUDICATION PROCESS The Department s adjudication process begins with the accused employee s CO and goes through multiple levels of review. Upon completion of a disciplinary complaint investigation, the employee s CO is responsible for reviewing the investigation, determining whether misconduct occurred, and recommending the disposition, and penalty, if applicable. Consistent with the Department s standards, LOS ANGELES POLICE DEPARTMENT 129
66 {PERSONNEL COMPLAINTS} adjudicators must determine by a preponderance of evidence whether misconduct occurred. Preponderance of evidence means the weight of evidence on one side is greater than the evidence presented for the other side. The adjudicator must make a determination for each allegation based on factual, reasonable consideration of the evidence and statements presented in the investigation. Theoretically, the possible disciplinary dispositions for all complaints of misconduct include: The recommended penalty is also evaluated to ensure it is within a range consistent with that which other similarly situated officers have received for similar misconduct. Once the group agrees the findings and penalty are appropriate, the case is ready for presentation to the COP. All personnel complaints resulting from CUOF incidents found to be Administrative Disapproval/Out of Policy by the BOPC are presented to the COP for final adjudication and penalty. Disciplinary dispositions for complaints of misconduct Sustained; Unfounded (the act did not occur); Exonerated (the act occurred but was justified, lawful and proper); Not Resolved (when evidence does not clearly prove or disprove the allegation); Insufficient Evidence to Adjudicate; or, Withdrawn by the COP (used only by the COP when an allegation would be better adjudicated by a court; imposing discipline is legally prohibited; the alleged act is minor misconduct and significant time has passed; or evidence has been lost or destroyed). Sustained; Unfounded (the act did not occur); Exonerated (the act occurred but was justified, lawful and proper); Not Resolved (when evidence does not clearly prove or disprove the allegation); Insufficient Evidence to Adjudicate; or, Withdrawn by the COP (used only by the COP when an allegation would be better adjudicated by a court; imposing discipline is legally prohibited; the alleged act is minor misconduct and significant time has passed; or evidence has been lost or destroyed). However, when force known to have occurred is found to be Administrative Disapproval/Out of Policy, and the COP has determined it should be addressed with a personnel complaint, the most likely disposition is sustained. The CO submits the adjudication disposition recommendation up the chain of command to the employee s bureau CO. The bureau CO can concur with the recommendation, or if the bureau CO disagrees with the recommended adjudication, the bureau CO will prepare correspondence to IAG explaining the disagreement, the bureau s recommended adjudication, and the rationale for the bureau recommendation. This is referred to as a Military Endorsement. Complaints resulting from Administrative Disapproval/ Out of Policy findings for NCUOF incidents are subject to the same review process as all other types of complaints. When the recommended adjudication is sustained with a penalty of an official reprimand or greater, IAG submits the completed investigation and recommendation to the COP for final adjudication and penalty consideration. POSSIBLE OUTCOMES When a complaint is sustained, under City Charter Section 1070(b), the COP may: Temporarily relieve the employee from duty pending a hearing before and decision by a Board of Rights; or Suspend the employee for a total period not to exceed 22 working days with loss of pay and with or without reprimand; or Demote the employee in rank, with or without suspension or reprimand or both; or, Demote the employee in rank, with or without temporary relief from duty or cancellation of such relief from duty. If the COP desires to suspend an employee for more than 22 days, or believes removal is the appropriate penalty, the matter is referred to a Board of Rights. If the officer is found guilty, under City Charter Section 1070(n), the Board of Rights recommends a penalty, which is prescribed by written order of: Suspension for a definite period not exceeding 65 working days with total loss of pay, and with or without reprimand; or Demotion in rank, with or without suspension or reprimand or both; or Reprimand without further penalty; or Removal. In determining the final penalty, the COP will consider the Board of Rights recommendation, but has the authority to impose a lesser penalty than recommended. The COP, however, may not impose a higher penalty [City Charter Section 1070(p)]. APPEAL PROCESS The appeal process for complaints resulting from Administrative Disapproval/Out of Policy findings on UOF incidents vary depending on the penalty imposed. for a Board of Rights [City Charter Section 1070(b)(2)]. If the officer elects an Administrative Appeal, the officer is admitting guilt, and the only issue to be appealed is the degree of penalty. The hearing officer s report is submitted as a recommendation to the COP who makes the final determination. An Administrative Appeal may result in a lower level of discipline, but may not result in a higher penalty [MOU Article 9]. If the officer opts to appeal to a Board of Rights, the officer may appeal both the sustained finding and the penalty imposed. As explained above, under City Charter Section 1070(n), the Board of Rights can impose a penalty of: Suspension for a definite period not exceeding 65 working days with total loss of pay, and with or without reprimand; or Demotion in rank, with or without suspension or reprimand or both; or Reprimand without further penalty; or Removal. The next level of review is done in a group setting referred to as a Case Analysis Team. This group consists of the COs of PSB and IAG, the captains assigned to PSB and IAG, the Department Advocate, and the lieutenants preparing to present sustained cases to the COP. The purpose of the meeting is to provide an opportunity for the presenters to brief the group on each case being presented to the COP. The presenters include a synopsis of the supporting evidence, or lack thereof, discuss errors made by the adjudicator(s) in the findings or recommended penalty, a risk analysis of the employee, which includes disciplinary history, and other unusual circumstance(s) that may affect the final decision by the COP. The group asks questions to ensure that all pertinent areas of the investigation were covered and that the final disposition of findings is sound. BOARD OF RIGHTS A Board of Rights is considered a de novo hearing. The Board is composed of two sworn Department members (at the rank of Captain or above), and one civilian member from the BOPC s list of approved hearing officers. Members of the Board of Rights must make an independent assessment of the matter based solely on the evidence presented to them at the hearing [City Charter Sections 1070(f), 1070(h), and 1070(x)]. The Board of Rights will determine by majority vote if the officer is guilty or not guilty based on the preponderance of evidence [City Charter Section 1070(l)]. If the Board of Rights finds the officer not guilty, the complaint concludes and the COP may not impose a penalty. If the complaint is sustained with no penalty, a penalty of admonishment, or an official reprimand, the officer may request an Administrative Appeal to be held before a civilian hearing officer selected from the BOPC s list of approved hearing officers. The standard used is a preponderance of the evidence. The hearing officer s recommendation is provided to the COP for consideration. The decision of the COP is final (Memorandum of Understanding No. 24 Police Officers, Lieutenant and Below Representation Unit, by and between the City and the Los Angeles Police Protective League, July 2014 June 2018 [MOU], Article 9). If the penalty imposed is a demotion and/or suspension of one to 22 days, the officer may either appeal using the Administrative Appeal procedure [MOU Article 9], or opt The COP shall either uphold the recommendation of the Board of Rights or may, at his discretion, impose a penalty less severe than that ordered by the Board of Rights, but may not impose a greater penalty [City Charter Section 1070(p)]. Officers are also provided an opportunity to appeal the Department s action when a CUOF results in Administrative Disapproval Extensive Retraining. As set for in Article 9 of the MOU, CUOF adjudications of Administrative Disapproval Extensive Retraining are subject to the Administrative Appeal process. The Department shall bear the burden of proof to establish by a preponderance of evidence that the Department s action should remain USE OF FORCE YEAR-END REVIEW LOS ANGELES POLICE DEPARTMENT 131

67 Officer Wellness The Department s Behavioral Science Services is the oldest and most established in-house law enforcement psychological service entity in the United States. Since 1968, BSS has been a leader in the field of law enforcement psychology, having introduced not only the first in-house counseling service, but the first group of field-deployed police psychologists assigned to geographical Areas and Divisions. Behavioral Science Services police psychologists are experienced in debriefing officers exposed to a wide array of potentially traumatizing occurrences, including OIS and other CUOF incidents. Officers involved in an OIS, including those who discharged their weapons and others who were immediately present, are mandated to visit BSS for individual psychological debriefings by a licensed psychologist. A CO can also order his/her personnel to BSS at their discretion if the employee was involved in a CUOF incident other than an OIS. The purpose of the debriefing is to evaluate the officer s emotional, cognitive, behavioral, and physiological reactions to the incident. The debriefing is not an assessment of the officer s global functioning, nor is it a fitness-for-duty evaluation. The appointment is scheduled between two and five days after the incident. Appointments are arranged by the concerned employee s CO and are conducted on an on-duty basis. Following the first session, the psychologist typically makes a recommendation to the concerned CO whether the officer should be allowed to return to their pre-incident work assignment. The psychologist may also direct the officer to return for additional mandated sessions, or suggest temporary non-field duties, if warranted. To be reinstated to full work-duty status, an employee must receive approval from BSS and concurrence from the COP, via the employee s concerned chain of command. Behavioral Science Services also provides individual and couples counseling to all Department personnel and their spouses. Although counseling is the primary service offered by BSS, the psychologists also provide training for Department personnel on topics such as stress management, suicide prevention, and anger management. Behavioral Science Services also provides organizational/ psychological consultation to work groups within the Department. In addition, psychologists from BSS respond with SWAT personnel to hostage negotiations and barricaded suspect situations. Further, BSS designs and conducts research regarding various specialized areas related to law enforcement. To assist with the Department s commitment to providing employees with wellness related services, BSS recently articulated specific organizational goals, including expansion of wellness and injury reduction efforts, quality enhancements of its pre-existing services, and automatization of its procedures for increased efficiency. To effectively achieve these goals, BSS will: Examine ways of expanding wellness promotion activities to both sworn and civilian personnel; Publish public service announcement-style educational materials regarding various health and injury prevention subjects; Expanding proactive addiction prevention efforts of the Addiction Prevention Unit; Minimize the risk of compassion fatigue among staff; Develop, implement, and audit strategies to enhance clinical service delivery; Critically examine the various functions and tasks the organization performs for opportunities to automate and improve monitoring, service delivery, and efficiency; and, Implement real-time service delivery reporting and analysis. & USE OF FORCE YEAR-END REVIEW

68
. Officer Involved Shooting incidents are categorized into Hit or No Hit occurrences.")

69 CATEGORICAL USE OF FORCE TOTALS OFFICER INVOLVED SHOOTING INCIDENTS An incident in which a Department employee intentionally discharges a firearm (excluding Warning Shot, Animal Shooting, and/or Tactical Intentional Discharge incidents). Officer Involved Shooting incidents are categorized into Hit or No Hit occurrences. {CUOF INCIDENTS OIS} OIS-No Hit 14 OIS-Hit Total OIS INCIDENTS ANNUAL DEPARTMENT TOTALS DEPT TTL OIS Department Total In 2017, Department personnel were involved in 44 OIS incidents, an increase of four incidents, or 10 percent, compared to In the four-year period from 2013 through 2016, there were a total of 164 OIS incidents, resulting in an annual average of 41 incidents. The 2017 count exceeded the 2013 through 2016 annual average by three incidents, or approximately seven percent. CLASSIFICATION OF OIS INCIDENTS 4 Carotid Restraint Control Hold Incidents (CRCH) 2 5 Law Enforcement Related Injury Incidents 4 1Warning Shot Incident 1 In-Custody Death Incidents Head Strike Incident K9 Contact Incidents Requiring Hospitalization 7Unintentional Discharge Incidents Year-to-Year Reclassifications CUOF Category Incident Year Reporting Year LERII F060-16: Reclassified from Head Strike to LERII Head Strike F060-16: Reclassified from Head Strike to LERII - F066-16: Reclassified from Head Strike to NCUOF ICD F039-16: Reclassified from ICD to Death Investigation - F048-16: Reclassified from ICD to Death Investigation - F065-16: Reclassified from ICD to Death Investigation - F069-16: Reclassified from ICD to Death Investigation - F075-16: Reclassified from ICD to Death Investigation - F088-16: Reclassified from ICD to Death Investigation K9 Contact F074-15: Reclassified from K9 Contact to non-uof Shooting Incidents 10Animal I II III IV V VI VII UNK In 2017, 17 of the 44 total OIS incidents, or 39 percent, were categorized as Classification II shootings. This accounted for an 11 percentage point decrease compared to 50 percent in When compared to the aggregate percentage of Classification II shooting incidents from 2013 through 2016 of 36 percent, 2017 experienced a three percentage point increase. Historically from 2013 through 2017, Classification II shooting incidents accounted for 76 of the 208 total OIS incidents, or 37 percent. Continues on page 139 Classification I II III IV V VI VII Unknown Total Classification I II III IV V VI VII Description Suspect verified with firearm - fired at officer or 3 rd party Suspect verified with firearm - firearm in hand or position to fire (but did not fire) Perception shooting - firearm present but not drawn Perception shooting - no firearm found Suspect armed with weapon other than firearm Suspect not armed, but threat of/causing serious bodily injury or death to others Other USE OF FORCE YEAR-END REVIEW LOS ANGELES POLICE DEPARTMENT 137
70 {CUOF INCIDENTS OIS} Classification of OIS Incidents continued In 2017, 15 of the 44 total OIS incidents, or 34 percent, were categorized as Classification V shootings. This accounted for a 16.5 percentage point increase compared to 17.5 percent in When compared to the aggregate percentage of Classification V shooting incidents from 2013 through 2016 of 24 percent, 2017 experienced a 10 percentage point increase. Historically from 2013 through 2017, Classification V shooting incidents accounted for 55 of the 208 total OIS incidents, or 26 percent. In 2017, 10 of the 44 total OIS incidents, or 23 percent, were categorized as Classification I shootings. This accounted for a 5.5 percentage point increase compared to 17.5 percent in When compared to the aggregate percentage of Classification I shooting incidents from 2013 through 2016 of 23 percent, 2017 experienced no percentage point change. Historically from 2013 through 2017, Classification I shooting incidents accounted for 48 of the 208 total OIS incidents, or 23 percent. In 2017, two of the 44 total OIS incidents, or 4.5 percent, were categorized as Classification IV shootings. This accounted for a 5.5 percentage point decrease compared to 10 percent in When compared to the aggregate percentage of Classification IV shooting incidents from 2013 through 2016 of 10 percent, 2017 experienced a 5.5 percentage point decrease. Historically from 2013 through 2017, Classification IV shooting incidents accounted for 19 of the 208 total OIS incidents, or nine percent. SOURCE OF ACTIVITY OIS INCIDENTS Geographic Areas 1 Central Area 12 77th Street Area 2 Rampart Area 13 Newton Area 3 Southwest Area 14 Pacific Area 4 Hollenbeck Area 15 North Hollywood Area 5 Harbor Area 16 Foothill Area 6 Hollywood Area 17 Devonshire Area 7 Wilshire Area 18 Southeast Area 8 West Los Angeles Area 19 Mission Area 9 Van Nuys Area 20 Olympic Area 10 West Valley Area 21 Topanga Area 11 Northeast Area Police Stations OIS Incidents RCALL OBS CZN FD PRE-PLN SCALL AMB OFF DTY OTH In 2017, 19 of the Department s 44 OIS incidents, or 43 percent, originated from radio calls. This accounted for an 18 percentage point increase compared to 25 percent in When compared to the aggregate percentage of OIS incidents resulting from radio calls from 2013 through 2016 of 48 percent, 2017 experienced a five percentage point decrease. Historically from 2013 through 2017, radio calls represented the largest source category of OIS incidents, accounting for 98 of the 208 total incidents, or 47 percent. In 2017, 12 of the Department s 44 OIS incidents, or 27 percent, originated from field detentions based on officers observations (i.e. pedestrian and traffic stops). This accounted for a 23 percentage point decrease compared to 50 percent in When compared to the aggregate percentage of OIS incidents resulting from field detentions based on officers observations from 2013 through 2016 of 32 percent, 2017 experienced a five percentage point decrease. Historically from 2013 through 2017, field Source Radio Call Observation Citizen Flag Down Pre-Planned Station Call Ambush Off-Duty Other Total detentions based on officers observations represented the second largest source category of OIS incidents, accounting for 65 of the 208 total incidents, or 31 percent. In 2017, seven of the Department s 44 OIS incidents, or 16 percent, originated from pre-planned activities (i.e. warrant services; parole/probation checks; etc.). This accounted for an 8.5 percentage point increase compared to 7.5 percent in When compared to the aggregate percentage of OIS incidents resulting from pre-planned activities from 2013 through 2016 of approximately nine percent, 2017 experienced a seven percentage point increase. Historically from 2013 through 2017, pre-planned activities represented the third largest source category of OIS incidents, accounting for 21 of the 208 total incidents, or 10 percent. The remaining six incidents, or approximately 14 percent, in 2017 occurred during citizen flag downs and off-duty occurrences. 19 Map excludes UOF incidents that occurred outside of the Los Angeles city limits. Prepared by LAPD/ADSD/GIS Mapping USE OF FORCE YEAR-END REVIEW LOS ANGELES POLICE DEPARTMENT 139
71 {CUOF INCIDENTS OIS} BUREAU OF OCCURRENCE OPERATIONS-CENTRAL BUREAU OPERATIONS-WEST BUREAU CENT Area HWD NEWT Central OLYM NOE Newton PAC RAMP Northeast Rampart WLA HOBK Hollenbeck WIL Total Area Hollywood Olympic Pacific West Los Angeles Wilshire Total In 2017, 12 of the Department s OIS incidents occurred within the geographical area of Central Bureau, which was a decrease of six incidents, or 33 percent, compared to Approximately 27 percent of the Department s OIS incidents occurred in Central Bureau (Department - 44; Central Bureau - 12). In the four-year period from 2013 through 2016, 54 OIS incidents occurred in Central Bureau, resulting in an annual average of 13.5 incidents. The Central Bureau count for 2017 fell below the 2013 through 2016 annual average by 1.5 incidents, or approximately 11 percent. In 2017, nine of the Department s OIS incidents occurred within the geographical area of West Bureau, an increase of five incidents, or 125 percent, compared to Approximately 20 percent of the Department s OIS incidents occurred in West Bureau (Department - 44; West Bureau - nine). In the four-year period from 2013 through 2016, 20 OIS incidents occurred in West Bureau, resulting in an annual average of five incidents. The West Bureau count for 2017 exceeded the 2013 through 2016 annual average by four incidents, or 80 percent. OPERATIONS-SOUTH BUREAU OPERATIONS-VALLEY BUREAU 77TH SOE HARB SOW In 2017, six of the Department s OIS incidents occurred within the geographical area of South Bureau, which was a decrease of two incidents, or 25 percent, compared to Approximately 14 percent of the Department s OIS incidents occurred in South Bureau (Department - 44; Area 77th Street Southeast Harbor Southwest Total South Bureau - six). In the four-year period from 2013 through 2016, 36 OIS incidents occurred in South Bureau, resulting in an annual average of nine incidents. The South Bureau count for 2017 fell below the 2013 through 2016 annual average by three incidents, or 33 percent. DEV FTHL MISN NHWD TOP VNYS WVAL In 2017, 13 of the Department s OIS incidents occurred within the geographical area of Valley Bureau, which was an increase of seven incidents, or 117 percent, compared to Approximately 30 percent of the Department s OIS incidents occurred in Valley Bureau (Department - 44; Valley Bureau - 13). Area Devonshire Foothill Mission North Hollywood Topanga Van Nuys West Valley Total In the four-year period from 2013 through 2016, 36 OIS incidents occurred in Valley Bureau, resulting in an annual average of nine incidents. The Valley Bureau count for 2017 exceeded the 2013 through 2016 annual average by four incidents, or 44 percent USE OF FORCE YEAR-END REVIEW LOS ANGELES POLICE DEPARTMENT 141
72 {CUOF INCIDENTS OIS} OUTSIDE JURISDICTION DAY OF OCCURRENCE OUTSIDE MONTH OF OCCURRENCE Area Outside Jurisdiction In 2017, four of the Department s OIS incidents occurred outside the Department s jurisdiction, which represented no change when compared to Approximately 9 percent of the Department s OIS incidents occurred in areas outside the Department s jurisdiction (Department - 44; Outside Areas - four). In the four-year period from 2013 through 2016, 18 OIS incidents occurred in areas outside the Department s jurisdiction, resulting in an annual average of 4.5 incidents. The total incident count for outside areas in 2017 fell below the 2013 through 2016 annual average by 0.5 incidents, or approximately 11 percent. MON TUE WED THUR FRI SAT SUN In 2017, Monday, Tuesday, Thursday, and Saturday represented the days of the week with the most OIS incidents, accounting for eight occurrences, or 18 percent, respectively. Wednesday represented the second most frequent day of the week with six incidents, or 14 percent. Day Monday Tuesday Wednesday Thursday Friday Saturday Sunday Total From 2013 through 2017, Tuesday represented the day with the most OIS incidents with 35 out of the 208 total, or 17 percent. Thursday represented the day with the least with 23 incidents, or 11 percent. The remaining 150 incidents, or 72 percent, were fairly evenly distributed throughout the remaining days of the week. JAN FEB MAR APR MAY JUN JUL AUG SEP OCT NOV DEC Month January February March April May June July August September October November December Total TIME OF OCCURRENCE In 2017, 19 OIS incidents, or 43 percent, occurred between the hours of 6 a.m. and 5:59 p.m., while 25 incidents, or 57 percent, occurred between the hours of 6 p.m. and 5:59 a.m. The time distribution was similar from 2013 through 2016, where 69 OIS incidents, or 42 percent, occurred between the hours of 6 a.m. and 5:59 p.m., and 95 incidents, or 58 percent, occurred between the hours of 6 p.m. and 5:59 a.m. Time of Day Total The five-year annual average for 2013 through 2017 was 17.6 OIS incidents occurring between the hours of 6 a.m. and 5:59 p.m., and 24 incidents between the hours of 6 p.m. and 5:59 a.m. In 2017, June represented the month with the most OIS incidents with seven occurrences, or 16 percent, out of 44 total incidents for the year. January and December each had the second most incidents with six incidents, or 14 percent, respectively. March and May had the third highest counts with five incidents, or 11 percent, respectively. The remaining 15 incidents, or 34 percent, were fairly evenly distributed throughout the remaining months of the year. From 2013 through 2017, December represented the month with the most OIS incidents with 22 out of the 208 total incidents, or 11 percent. October represented the month with the least, accounting for nine incidents, or four percent. September had the second fewest with 11 incidents or five percent. The remaining 166 incidents, or 80 percent, were fairly evenly distributed throughout the remaining months of the year. The OIS percentage breakdown on a quarterly basis from 2013 through 2017 was as follows: January March: 54 incidents, or 26 percent; April June: 56 incidents, or 27 percent; July September: 52 incidents; or 25 percent; and, October through December: 46 incidents, or 22 percent USE OF FORCE YEAR-END REVIEW LOS ANGELES POLICE DEPARTMENT 143
73 {CUOF INCIDENTS OIS} OFFICER INFORMATION OFFICER - ETHNICITY The officer sections below include data for all employees who received, or were pending, BOPC lethal force adjudicative findings for their involvement in OIS incidents. In 2017, 110 Department personnel were involved in the 44 OIS incidents throughout the year, resulting in an average of 2.5 officers per incident. This accounted for a 92 percent increase compared to an average of 1.3 officers per incident in The 2017 officer to incident average exceeded the 2013 through 2016 aggregate annual average of 1.8 by 39 percent. In 2017, there were four OIS incidents in which 9 or more officers were involved. These four incidents accounted for 47 personnel, which represented 43 percent of the 110 total involved officers. Of those 47 personnel, 25 officers, or 53 percent, were assigned to Metropolitan Division. The remaining 22 personnel, or 47 percent, were assigned to patrol. Absent those four incidents, 2017 had a 1.6 officer to incident average (63 Department personnel involved in 40 OIS incidents). AM IND ASN BLK FILIP HISP WHT OTH Ethnicity American Indian Asian/Pacific Islander Black Filipino Hispanic White Other Total OFFICER - GENDER Female Male In 2017, 104 male officers were involved in OIS incidents, which represented 95 percent of the 110 total employees. This accounted for a one percentage point increase compared to 94 percent in The percentage of male officers involved in OIS incidents in 2017 was 13 percentage points above the Department s overall male total. When compared to the aggregate percentage of involved male personnel from 2013 through 2016 of 95 percent, 2017 experienced no percentage change. Historically, from 2013 through 2017, a majority of officers involved in OIS incidents were male, accounting for 377 of the 398 total employees, or 95 percent. Gender Female Male Total In 2017, six female officers were involved in OIS incidents, which represented five percent of the 110 total employees. This accounted for a one percentage point decrease compared to six percent in The percentage of female officers involved in OIS incidents in 2017 was 13 percentage points below the Department s overall female total. When compared to the aggregate percentage of involved female personnel from 2013 through 2016 of five percent, 2017 experienced no percentage change. Historically, from 2013 through 2017, females accounted for 21 of the 398 total involved employees, or five percent. In 2017, 53 Hispanic officers were involved in OIS incidents, which represented 48 percent of the 110 total employees. This accounted for a 23 percentage point decrease compared to 71 percent in The percentage of Hispanic officers involved in OIS incidents in 2017 was one percentage point above the Department s overall Hispanic total. When compared to the aggregate percentage of involved Hispanic personnel from 2013 through 2016 of 59 percent, 2017 experienced an 11 percentage point decrease. Historically, from 2013 through 2017, a majority of officers involved in OIS incidents were Hispanic, accounting for 223 of the 398 total employees, or 56 percent. In 2017, 42 White officers were involved in OIS incidents, which represented 38 percent of the 110 total employees. This accounted for an 18 percentage point increase compared to 20 percent in The percentage of White officers involved in OIS incidents in 2017 was six percentage points above the Department s overall White total. When compared to the aggregate percentage of involved White personnel from 2013 through 2016 of 30 percent, 2017 experienced an eight percentage point increase. Historically, from 2013 through 2017, White officers represented for the second largest ethnic category of personnel involved in OIS incidents, accounting for 128 of the 398 total employees, or 32 percent. In 2017, five Asian/Pacific Islander officers were involved in OIS incidents, which represented five percent of the 110 total employees. This accounted for a one percentage point increase compared to four percent in The percentage of Asian/Pacific Islander officers involved in OIS incidents in 2017 was three percentage points below the Department s overall Asian/Pacific Islander total. When compared to the aggregate percentage of involved Asian/Pacific Islander personnel from 2013 through 2016 of five percent, 2017 Ethnicity City Population Department Personnel OIS Personnel Asian/Pacific Isl. 12% 8% 5% Black 9% 10% 5% Hispanic 49% 47% 48% White 28% 32% 38% Other 2% 3% 5% Total 100% 100% 100% experienced no percentage change. Historically from 2013 through 2017, Asian/Pacific Islander officers accounted for 20 of the 398 total employees involved in OIS incidents, or five percent. In 2017, five Black officers were involved in OIS incidents, which represented five percent of the 110 total employees. This accounted for a one percentage point increase compared to four percent in The percentage of Black officers involved in OIS incidents in 2017 was five percentage points below the Department s overall Black total. When compared to the aggregate percentage of involved Black personnel from 2013 through 2016 of three percent, 2017 represented a two percentage point increase. Historically from 2013 through 2017, Black officers represented for the fourth largest category of personnel involved in OIS incidents, accounting for 15 of the 398 total employees, or four percent. The remaining five employees, or five percent, involved in 2017 OIS incidents included two American Indian officers and three Filipino officers USE OF FORCE YEAR-END REVIEW LOS ANGELES POLICE DEPARTMENT 145
74 {CUOF INCIDENTS OIS} OFFICER YEARS OF SERVICE OFFICER RANK < > The following depicts the percentage of personnel involved in OIS incidents in 2017 based on their respective years of service classifications: Less than one year of service three percent (three out of 110 total officers); 1-5 years of service 21 percent (23 out of 110 total officers); 6-10 years of service 21 percent (23 out of 110 total officers); years of service 36 percent (40 out of 110 total officers); and, More than 20 years of service 19 percent (21 out of 110 total officers). In 2017, there were percentage point increases in three of the five categories and decreases in two, when compared to The following depicts these changes: Less than one year of service one percentage point increase (two percent in 2016, three percent in 2017); 1-5 years of service three percentage point decrease (24 percent in 2016, 21 percent in 2017); 6-10 years of service 28 percentage point decrease (49 percent in 2016, 21 percent in 2017); years of service 20 percentage point increase (16 percent in 2016, 36 percent in 2017); and, More than 20 years of service nine percentage point increase (10 percent in 2016, 19 percent in 2017). Years Less than More than Total In 2017, there were percentage point increases in three of the five years of service categories and decreases in two when compared to the aggregate percentage of personnel involved in OIS incidents during the four-year period from 2013 through The following depicts these changes: Less than one year of service one percentage point increase (two percent during four-year period, three percent in 2017); 1-5 years of service one percentage point decrease (22 percent during four-year period, 21 percent in 2017); 6-10 years of service 20 percentage point decrease (41 percent during four-year period, 21 percent in 2017); years of service 10 percentage point increase (26 percent during four-year period, 36 percent in 2017); and, More than 20 years of service 10 percentage point increase (nine percent during four-year period, 19 percent in 2017). Historically, from 2013 through 2017, a majority of officers involved in OIS incidents had 6-10 years of service, accounting for 142 of the 398 total employees, or 36 percent. Officers with years of service accounted for the second largest category with a total of 116 employees, or 29 percent, during the same five-year period. Officers with 1-5 years of service were the third largest group, with 85 personnel, or 21 percent, followed by officers with more than 20 years of service, which had 47 officers, or 12 percent. Officers with less than one year of service, which accounted for eight officers, represented only two percent of the total. >LT LT SGT DET PO DO RO In 2017, 103 employees at the rank of police officer were involved in OIS incidents, which represented 94 percent of the 110 total employees. This accounted for an eight percentage point increase compared to 86 percent in The percentage of police officers involved in OIS incidents in 2017 was 26 percentage points above the Department s overall police officer total. When compared to the aggregate percentage of involved personnel at the rank of police officer from 2013 through 2016 of 93 percent, 2017 experienced a one percentage point increase. Historically, from 2013 through 2017, a majority of personnel involved in OIS incidents were at the rank of police officer, accounting for 371 of the 398 total employees, or 93 percent. In 2017, six employees at the rank of detective were involved in OIS incidents, which represented five percent Rank Captain and Above Lieutenant Sergeant Detective Police Officer Detention Officer Reserve Officer Other Total of the 110 total employees. This accounted for a five percentage point decrease compared to 10 percent in The percentage of detectives involved in OIS incidents in 2017 was 11 percentage points below the Department s overall detective total. When compared to the aggregate percentage of involved personnel at the rank of detective from 2013 through 2016 of three percent, 2017 experienced a two percentage point increase. Historically, from 2013 through 2017, detectives represented the second largest category of personnel involved in OIS incidents, accounting for 16 of the 398 total employees, or four percent. The remaining employee involved in an OIS incident in 2017, representing one percent of the 110 total personnel, was at the rank of sergeant USE OF FORCE YEAR-END REVIEW LOS ANGELES POLICE DEPARTMENT 147
75 {CUOF INCIDENTS OIS} OFFICER AREA/DIVISION OF ASSIGNMENT Division/Area/Bureau 77th Street TH Central CENT Devonshire DEV Foothill FTHL Harbor HARB Hollenbeck HOBK Hollywood HWD Mission MISN Newton NEWT North Hollywood NHWD Northeast NOE Olympic OLYM Pacific PAC Rampart RAMP Southeast SOE SOW Southwest TOP Topanga VNYS Van Nuys WLA West Los Angeles WVAL West Valley WIL Wilshire TRFC All Traffic Divisions ADMIN Administrative Units SPCL Specialized Units BUREAU Bureau Level METRO Metropolitan SSD Security Services Total In 2017, 12 personnel assigned to Rampart Division were involved in OIS incidents, which represented 11 percent of the 110 total employees. This represented a one percentage point decrease compared to 12 percent in When compared to the aggregate percentage of involved personnel assigned to Rampart Division from 2013 through 2016 of seven percent, 2017 experienced a four percentage point increase. Historically, from 2013 through 2017, personnel assigned to Rampart Division accounted for 32 of the 398 total employees involved in OIS incidents, or eight percent. The remaining 49 Department personnel, or 45 percent, were fairly evenly distributed amongst the remaining Areas/Divisions. The following is the employee Bureau assignment for the 110 total personnel involved in OIS incidents in 2017: Central Bureau: 17 personnel, or 15 percent; West Bureau: 20 personnel, or 18 percent; South Bureau: 10 personnel, or nine percent; Valley Bureau: 20 personnel, or 18 percent; CTSOB: 34 personnel, or 31 percent; and, Other: nine personnel, or eight percent. In 2017, there were percentage point increases in three of the six Bureau categories and decreases in three, when compared to The following depicts these changes: Central Bureau: 20 percentage point decrease (35 percent in 2016, 15 percent in 2017); West Bureau: four percentage point increase (14 percent in 2016, 18 percent in 2017); South Bureau: nine percentage point decrease (18 percent in 2016, nine percent in 2017); Valley Bureau: six percentage point increase (12 percent in 2016, 18 percent in 2017); CTSOB: 19 percentage point increase (12 percent in 2016, 31 percent in 2017); and, Other: two percentage point decrease (10 percent in 2016, eight percent in 2017). In 2017, there were percentage point increases in three of the six Bureau categories and decreases in three, when compared to their respective aggregate percentages during the four-year period from 2013 through The following depicts these changes: Central Bureau: 12 percentage point decrease (27 percent during four-year period, 15 percent in 2017); West Bureau: seven percentage point increase (11 percent during four-year period, 18 percent in 2017); South Bureau: 13 percentage point decrease (22 percent during four-year period, nine percent in 2017); Valley Bureau: one percentage point decrease (19 percent during four-year period, 18 percent in 2017); CTSOB: 17 percentage point increase (14 percent during four-year period, 31 percent in 2017); and, Other: one percentage point increase (seven percent during four-year period, eight percent in 2017). In 2017, 34 personnel assigned to Metropolitan Division were involved in OIS incidents, which represented 31 percent of the 110 total employees. This represented a 19 percentage point increase compared to 12 percent in When compared to the aggregate percentage of involved personnel assigned to Metropolitan Division from 2013 through 2016 of 14 percent, 2017 experienced a 17 percentage point increase. Historically, from 2013 through 2017, a majority of officers involved in OIS incidents were assigned to Metropolitan Division, accounting for 74 of the 398 total employees, or 19 percent. In 2017, 15 personnel assigned to Hollywood Division were involved in OIS incidents, which represented 14 percent of the 110 total employees. This represented a two percentage point increase compared to 12 percent in When compared to the aggregate percentage of involved personnel assigned to Hollywood Division from 2013 through 2016 of nine percent, 2017 experienced a five percentage point increase. Historically, from 2013 through 2017, Hollywood Division accounted for the second highest involved personnel count with 42 of the 398 total employees, or 11 percent USE OF FORCE YEAR-END REVIEW LOS ANGELES POLICE DEPARTMENT 149
76 {CUOF INCIDENTS OIS} OFFICER UNIT OF ASSIGNMENT OFFICER INJURIES ADMIN METRO PATROL SPCL INV CSD OTH In 2017, 48 personnel assigned to patrol were involved in OIS incidents, which represented 44 percent of the 110 total personnel. This accounted for a three percentage point increase compared to 41 percent in When compared to the aggregate percentage of involved personnel assigned to patrol from 2013 through 2016 of 60 percent, 2017 experienced a 16 percentage point decrease. Historically, from 2013 through 2017, a majority of officers involved in OIS incidents were assigned to patrol, accounting for 222 of the 398 total employees, or 56 percent. In 2017, 34 personnel assigned to Metropolitan Division were involved in OIS incidents, which represented 31 percent of the 110 total personnel. This accounted for a 19 percentage point increase compared to 12 percent in When compared to the aggregate percentage of involved personnel assigned to Metropolitan Division from 2013 through 2016 of 14 percent, 2017 experienced a 17 percentage point increase. Historically, from 2013 through 2017, personnel assigned to Metropolitan Division represented the third largest category of personnel involved in OIS incidents, accounting for 74 of the 398 total employees, or 19 percent. Unit Administrative Metropolitan Patrol Specialized Investigative Custody Other Total In 2017, 22 personnel assigned to specialized assignments were involved in OIS incidents, which represented 20 percent of the 110 total personnel. This accounted for a 13 percentage point decrease compared to 33 percent in When compared to the aggregate percentage of involved personnel assigned to specialized assignments from 2013 through 2016 of 20 percent, 2017 experienced no percentage point change. Historically, from 2013 through 2017, personnel assigned to specialized assignments represented the second largest category of personnel involved in OIS incidents, accounting for 81 of the 398 total employees, or 20 percent. In 2017, six personnel assigned to investigative assignments were involved in OIS incidents, which represented five percent of the 110 total personnel. This accounted for a nine percentage point decrease compared to 14 percent in When compared to the aggregate percentage of involved personnel assigned to investigative assignments from 2013 through 2016 of five percent, 2017 experienced no percentage point change. Historically, from 2013 through 2017, personnel assigned to investigative assignments represented the fourth largest category of personnel involved in OIS incidents, accounted for 21 of the 398 total employees, or five percent. INJ DEC No Department personnel were killed during or resulting from OIS incidents during the five-year period from 2013 through However, 53 officers sustained injuries during the same five-year period. In 2017, 10 officers sustained injuries during the 44 OIS incidents throughout the year. This accounted for a nine NUMBER OF OFFICERS FIRING PER INCIDENT > In 2017, there were 28 single shooter OIS incidents, which represented 64 percent of the 44 total incidents. This accounted for a nine percentage point decrease compared to 73 percent in When compared to the aggregate percentage of single shooter OIS incidents from 2013 through 2016 of 60 percent, 2017 experienced a four percentage point increase. In 2017, there were six double shooter OIS incidents, which represented 14 percent of the 44 total incidents. This accounted for an 11 percentage point decrease compared to 25 percent in When compared to the aggregate percentage of double shooter OIS incidents from 2013 through 2016 of 26 percent, 2017 experienced a 12 percentage point decrease. In 2017, there were five quadruple shooter OIS incidents, which represented 11 percent of the 44 total incidents. This Category Injured Deceased Total percent decrease compared to 11 injured officers in Additionally, when compared to the 2013 through 2016 annual average of injured officers, 2017 was 0.75 injured officers, or seven percent, below the four-year annual average. No. of Shooters or more Total accounted for an 11 percentage point increase compared to zero percent in When compared to the aggregate percentage of quadruple shooter OIS incidents from 2013 through 2016 of two percent, 2017 experienced a nine percentage point increase. In 2017, there were three shootings with 11 or more officers who fired their firearms, which represented seven percent of the 44 total incidents. This accounted for the highest total in this respective category in the five-year period from 2013 through When compared to the aggregate percentage of 11 or more shooter OIS incidents from 2013 through 2016 of one percent, 2017 experienced a six percentage point increase. The two remaining OIS incidents, or five percent, were a triple officer shooting and a five to 10 shooter occurrence USE OF FORCE YEAR-END REVIEW LOS ANGELES POLICE DEPARTMENT 151
77 {CUOF INCIDENTS OIS} OFFICER WEAPON SYSTEM ANNUAL AVERAGE OF ROUNDS FIRED PER INCIDENT HGUN OIS Average Rounds SGUN RIFLE Weapon Type Handgun Shotgun Rifle Total AVG RNDS In 2017, an average of 11.1 rounds were fired during OIS incidents. When compared to the 2016 average of 4.9 rounds fired, 2017 experienced an increase of 6.2 rounds, or 127 percent. Additionally, when compared to the 2013 through 2016 annual average of 8.6 rounds fired per incident, 2017 was 2.5 rounds, or 29 percent, above the four-year annual average. In 2017, 72 handguns were utilized during OIS incidents, which represented 65 percent of the 110 total weapon types. This accounted for a 27 percentage point decrease compared to 92 percent in When compared to the aggregate percentage of handguns utilized during OIS incidents from 2013 through 2016 of 82 percent, 2017 experienced a 17 percentage point decrease. Historically, from 2013 through 2017, handguns were the most utilized weapon type during OIS incidents, accounting for 313 of the 405 total weapons, or 77 percent. In 2017, 35 rifles were utilized during OIS incidents, which represented 32 percent out of the 110 total weapon types. This accounted for a 24 percentage point increase compared to eight percent in When compared to the aggregate percentage of rifles utilized during OIS incidents from 2013 through 2016 of 13 percent, 2017 experienced a 19 percentage point increase. Historically, from 2013 through 2017, rifles were the second most utilized weapon type during OIS incidents, accounting for 72 of the 405 total weapons, or 18 percent. In 2017, three shotguns were utilized during OIS incidents, which represented three percent out of the 110 total weapon types. This accounted for an increase of three shotguns compared to zero in When compared to the aggregate percentage of shotguns utilized during OIS incidents from 2013 through 2016 of six percent, 2017 experienced a three percentage point decrease. Historically, from 2013 through 2017, shotguns accounted for 20 of the 405 total weapons utilized in OIS incidents, representing five percent. TOTAL NUMBER OF ROUNDS FIRED BY OFFICERS PER WEAPON SYSTEM HGUN SGUN Weapon Type Handgun RIFLE Shotgun Rifle Total TOTAL NUMBER OF ROUNDS FIRED BY OFFICERS PER YEAR TTL RNDS OIS Total Rounds In 2017, 487 rounds were fired during all 44 OIS incidents. When compared to the 2016 total of 194 rounds fired, 2017 experienced an increase of 293 rounds, or 151 percent. Additionally, when compared to the 2013 through 2016 annual average of 353 rounds fired, 2017 was 134 rounds, or 38 percent, above the four-year annual average. In 2017, 270 rounds were fired from handguns during OIS incidents, which represented 55 percent of the 487 total rounds fired. This accounted for a 38 percentage point decrease compared to 93 percent in When compared to the aggregate percentage of rounds fired from handguns during OIS incidents from 2013 through 2016 of 86 percent, 2017 experienced a 31 percentage point decrease. Historically, from 2013 through 2017, rounds fired from handguns were the most frequent round type fired during OIS incidents, accounting for 1,492 of the 1,900 total rounds, or 79 percent. In 2017, 213 rounds were fired from rifles during OIS incidents, which represented 44 percent of the 487 total rounds fired. This accounted for a 37 percentage point increase compared to seven percent in When compared to the aggregate percentage of rounds fired from rifles during OIS incidents from 2013 through 2016 of 10 percent, 2017 experienced a 34 percentage point increase. Historically from 2013 through 2017, rounds fired from rifles were the second most frequent round type fired during OIS incidents, accounting for 359 of the 1,900 total rounds, or 19 percent. In 2017, four rounds were fired from shotguns during OIS incidents, which represented one percent of the 487 total rounds fired. This accounted for an increase of four rounds compared to zero in When compared to the aggregate percentage of rounds fired from shotguns during OIS incidents from 2013 through 2016 of three percent, 2017 experienced a two percentage point decrease. Historically from 2013 through 2017, rounds fired from shotguns accounted for 49 of the 1,900 total rounds fired, or three percent USE OF FORCE YEAR-END REVIEW LOS ANGELES POLICE DEPARTMENT 153
78 {CUOF INCIDENTS OIS} NUMBER OF ROUNDS FIRED PER INCIDENT BY OFFICERS OFFICER HIT RATIO > In 2017, there were 27 OIS incidents in which 1-5 rounds were fired, which represented 61 percent of the 44 total incidents. This accounted for a 17 percentage point decrease compared to 78 percent in In addition, when compared to the aggregate percentage of incidents in which 1-5 rounds were fired during OIS incidents from 2013 through 2016 of 64 percent, 2017 experienced a three percentage point decrease. In 2017, there were five OIS incidents in which rounds were fired, which represented 11 percent of the 44 total incidents. This accounted for an eight percentage point increase compared to three percent in In addition, when compared to the aggregate percentage of incidents in which rounds were fired during OIS incidents from 2013 through 2016 of six percent, 2017 experienced a five percentage point increase. In 2017, there were four OIS incidents in which rounds were fired, which represented nine percent of the 44 total incidents. This accounted for an increase of four incidents No. of Rounds or more Total compared to zero in When compared to the aggregate percentage of incidents in which rounds were fired during OIS incidents from 2013 through 2016 of five percent, 2017 experienced a four percentage point increase. In 2017, there were three OIS incidents in which 6-10 rounds were fired, which represented seven percent of the 44 total incidents. This accounted for an 11 percentage point decrease compared to 18 percent in In addition, when compared to the aggregate percentage of incidents in which 6-10 rounds were fired during OIS incidents from 2013 through 2016 of 17 percent, 2017 experienced a 10 percentage point decrease. The remaining five occurrences, or 11 percent, were shootings in which 36-40, 41-45, 46-50, and 51 or more rounds were fired per incident. When compared to the aggregate percentage of incidents with these same categories during the four-year period from 2013 through 2016 of three percent, 2017 experienced an eight percentage point increase. RNDS FRD HITS HIT RTO OIS Rounds Fired Hits Hit Ratio (%) 20% 34% 38% 42% 18% The 2017 total number of rounds fired compared to the total number of rounds which struck their intended targets resulted in a hit ratio of 18 percent. This accounted for a 24 percentage point decrease compared to 42 percent in In addition, when compared to the 2013 through 2016 aggregate hit ratio of 30 percent, 2017 experienced a 12 percentage point decrease. Historically, from 2013 through 2017, the hit ratio of all OIS incidents, accounting for 509 of the 1,900 total rounds fired, was 27 percent USE OF FORCE YEAR-END REVIEW LOS ANGELES POLICE DEPARTMENT 155
79 {CUOF INCIDENTS OIS} SUSPECT INFORMATION The suspect sections below include data for all individuals that Department personnel applied force against during OIS incidents. SUSPECT ETHNICITY AM IND ASN BLK FILIP HISP WHT OTH UNK Ethnicity American Indian Asian/Pacific Islander Black Filipino Hispanic White Other Unknown Total SUSPECT GENDER Female Male Unknown In 2017, 43 male suspects were involved in OIS incidents, which represented approximately 93 percent of the 46 total suspects. This accounted for a five percentage point decrease compared to 98 percent in When compared to the aggregate percentage of involved male suspects from 2013 through 2016 of 96 percent, 2017 experienced a three percentage point decrease. Historically, from 2013 through 2017, a majority of suspects involved in OIS incidents were male, representing 201 of the 211 total suspects, or 95 percent. In 2017, two female suspects were involved in OIS incidents, which represented approximately four percent Gender Female Male Unknown Total of the 46 total suspects. This accounted for an increase of two individuals compared to When compared to the aggregate percentage of involved female suspects from 2013 through 2016 of four percent, 2017 experienced no percentage point change. Historically, from 2013 through 2017, females represented eight of the 211 total suspects involved in OIS incidents, or four percent. The remaining suspect, representing two percent, currently has an unknown gender designation, pending completion of the investigation by FID. In 2017, 26 Hispanic suspects were involved in OIS incidents, which represented 57 percent of the 46 total suspects. This accounted for a one percentage point increase compared to 56 percent in The percentage of Hispanic suspects involved in OIS incidents in 2017 was eight percentage points above the City s overall Hispanic population total. Additionally, the percentage of Hispanic suspects involved in OIS incidents in 2017 was 17 percentage points above the City s overall Hispanic violent crime offender total. When compared to the aggregate percentage of involved Hispanic suspects from 2013 through 2016 of 48 percent, 2017 experienced a nine percentage point increase. Historically, from 2013 through 2017, the Hispanic category was the most represented ethnic group involved in OIS incidents with 106 of the 211 total suspects, or 50 percent. In 2017, 10 White suspects were involved in OIS incidents, which represented 22 percent of the 46 total suspects. This accounted for a 20 percentage point increase compared to two percent in The percentage of White suspects involved in OIS incidents in 2017 was six percentage points below the City s overall White population total. However, the percentage of White suspects involved in OIS incidents in 2017 was 14 percentage points above the City s overall White violent crime offender total. When compared to the aggregate percentage of involved White suspects from 2013 through 2016 of 12 percent, 2017 experienced a 10 percentage point increase. Historically, from 2013 through 2017, the White category was the third most represented ethnic group involved in OIS incidents with 29 of the 211 total suspects, or 14 percent. Ethnicity City Population Violent Crime Suspect OIS Suspect Asian/Pacific Isl. 12% (See Other) 0% Black 9% 44% 20% Hispanic 49% 40% 57% White 28% 8% 22% Other 2% 3% 0% Unknown DNA 5% 2% Total 100% 100% 100% In 2017, nine Black suspects were involved in OIS incidents, which represented 20 percent of the 46 total suspects. This accounted for a 12 percentage point decrease compared to 32 percent in The percentage of Black suspects involved in OIS incidents in 2017 was 11 percentage points above the City s overall Black population total. However, the percentage of Black suspects involved in OIS incidents in 2017 was 24 percentage points below the City s overall Black violent crime offender total. When compared to the aggregate percentage of involved Black suspects from 2013 through 2016 of 34 percent, 2017 experienced a 14 percentage point decrease. Historically, from 2013 through 2017, the Black category was the second most represented ethnic group involved in OIS incidents with 65 of the 211 total suspects, or 31 percent. One suspect, representing two percent, had an Unknown ethnicity classification, pending completion of the investigation by FID. SUSPECT AGE >59 UNK In 2017, most suspects involved in OIS incidents were in the age group. Specifically, 16 of the 46 total suspects, or 35 percent, were included in this age group. The age category accounted for a 20 percentage point increase compared to 15 percent in When compared to the aggregate percentage of involved suspects within the age range from 2013 through 2016 of 26 percent, 2017 experienced a nine percentage point increase. Historically, from 2013 through 2017, the age group represented the largest age category of suspects involved in OIS incidents with 59 of the 211 total suspects, or 28 percent. Age and Above Unknown Total In 2017, the age group represented the second largest age category, with 10 out of the 46 total suspects, or 22 percent. The age category accounted for a 15 percentage point decrease compared to 37 percent in When compared to the aggregate percentage of involved suspects within the age range from 2013 through 2016 of 24 percent, 2017 experienced a two percentage point decrease. Historically, from 2013 through 2017, the age group represented the second largest age category of suspects involved in OIS incidents with 49 of the 211 total suspects, or 23 percent. Continues on page USE OF FORCE YEAR-END REVIEW LOS ANGELES POLICE DEPARTMENT 157
80 {CUOF INCIDENTS OIS} Suspect-Age continued SUSPECT GANG MEMBERSHIP In 2017, the age group represented the third largest age category, with seven out of the 46 total suspects, or 15 percent. The age category accounted for a 12 percentage point decrease compared to 27 percent in When compared to the aggregate percentage of involved suspects within the age range from 2013 through 2016 of 24 percent, 2017 experienced a nine percentage point decrease. Historically, from 2013 through 2017, the age group represented the third largest age category of suspects involved in OIS incidents with 47 of the 211 total suspects, or 22 percent. In 2017, the age group represented the fourth largest age category, with six out of the 46 total suspects, or 13 percent. The age category accounted for a 11 percentage point increase compared to two percent in When compared to the aggregate percentage of involved suspects within the age range from 2013 through 2016 of 10 percent, 2017 experienced a three percentage point increase. Historically, from 2013 through 2017, the age group represented the fourth largest age category of suspects involved in OIS incidents with 22 of the 211 total suspects, or 10 percent. In 2017, the 0-17 age group included two out of the 46 total OIS suspects, or four percent. The 0-17 age category accounted for an eight percentage point decrease compared to 12 percent in When compared to the aggregate percentage of involved suspects within the 0-17 age range from 2013 through 2016 of five percent, 2017 experienced a one percentage point decrease. Historically, from 2013 through 2017, the 0-17 age group was one of the least represented age categories of suspects involved in OIS incidents with 10 of the 211 total suspects, or five percent. The five remaining suspects, or 11 percent, in 2017 were in the age ranges of 50-59, 60 and above, and one with an unknown age designation. Pursuant to California Assembly Bill 90, the Fair and Accurate Gang Database Act of 2017, Department resources housing gang membership information were temporarily SUSPECT HOMELESS 20 YES NO UNK disabled effective January 1, As such, the Department was unable to determine whether suspects involved in UOF incidents were designated as gang members. Homeless Yes N/A N/A N/A 2 3 No N/A N/A N/A Unknown N/A N/A N/A 2 3 Total In 2017, three of the 46 total suspects, or approximately seven percent, involved in OIS incidents were homeless. This accounted for a two percentage point increase compared to five percent in From 2016 through 2017, homeless suspects involved in OIS incidents accounted for five of the 87 total suspects, or six percent. SUSPECT PERCEIVED MENTAL ILLNESS DECEASED SUSPECT TOXICOLOGY RESULTS YES YES NO Per. Mental Illness Yes NO UNK No UNK Unknown DNA DNA PEND Total Substance Present Yes No Unknown/Pending Total In 2017, 13 of the 46 total suspects, or 28 percent, involved in OIS incidents were perceived to suffer from a mental illness and/or a mental health crisis. This accounted for an 18 percentage point increase compared to 10 percent in When compared to the aggregate percentage of involved suspects who were perceived to suffer from a mental illness and/or a mental health crisis from 2013 through 2016 of 24 percent, 2017 experienced a four percentage point increase. Historically from 2013 through 2017, suspects who were perceived to suffer from a mental illness and/or a mental health crisis accounted for 52 of the 211 total suspects, or 25 percent. Of the 17 decedents involved in 2017 OIS incidents, 12 of whom have completed toxicology examinations by the Los Angeles County Department of Medical Examiner Coroner, 10 individuals, representing 83 percent of those completed cases, had positive results for alcohol and/ or a controlled substance(s). Toxicology reports for five decedents, or 29 percent of the 17 total decedents, are pending from the Los Angeles County Department of Medical Examiner Coroner s Office. The partial 2017 percentage of completed cases with positive alcohol and/or a controlled substance results, representing 83 percent, accounted for a six percentage point decrease compared to 89 percent of positive cases in When compared to the aggregate percentage of decedents with positive toxicology results for alcohol and/or a controlled substance(s) in OIS incidents from 2013 through 2016 of 77 percent, 2017 experienced a six percentage point increase. 20 The Department was directed by the BOPC to track homeless data for suspects involved in CUOF incidents starting in Force Investigation Division has since implemented new procedures to capture this statistic USE OF FORCE YEAR-END REVIEW LOS ANGELES POLICE DEPARTMENT 159
81 {CUOF INCIDENTS OIS} SUSPECT TOXICOLOGY ANALYSIS SUSPECT WEAPON/FORCE ALCOH COCA MARIJ METH OPIATE PCP Substance Alcohol 13% 22% 24% 5% N/A Cocaine 13% 28% 5% 0% N/A Marijuana 40% 33% 43% 47% N/A Methamphetamine 40% 28% 52% 53% N/A Opiates 0% 6% 0% 0% N/A PCP 0% 0% 5% 0% N/A Psychiatric Medication 13% 11% 5% 0% N/A Other 0% 0% 0% 0% N/A Unknown 7% 6% 0% 0% N/A None 27% 28% 24% 11% N/A Weapon Type Automobile Edged Weapon Firearm Impact Device Perception Physical Force Replica/Pellet Other Unknown None PSYCH OTH UNK NONE PEND As of year-end 2017, toxicology results for five decedents involved in OIS incidents for the year were unavailable due to pending toxicology reports from the Los Angeles County Department of Medical Examiner Coroner. In 2017, five of the 12 OIS decedents with completed toxicology examinations, or 42 percent, had positive results for alcohol. This partial 2017 percentage accounted for a 37 percentage point increase compared to five percent of decedents with positive alcohol results in 2016 OIS incidents. Historically, 12 of the 73 decedents involved in 2013 through 2016 OIS incidents, representing 16 percent, had positive toxicology results for alcohol. In 2017, five of the 12 OIS decedents with completed toxicology examinations, or 42 percent, had positive results for methamphetamine. This partial 2017 percentage accounted for an 11 percentage point decrease compared to 53 percent of decedents with positive methamphetamine results in 2016 OIS incidents. Historically, 32 of the 73 decedents involved in 2013 through 2016 OIS incidents, representing 44 percent, had positive toxicology results for methamphetamine. In 2017, four of the 12 OIS decedents with completed toxicology examinations, or 33 percent, had positive results Substance Alcohol Cocaine Marijuana Methamphetamine Opiates PCP Psychiatric Medication Other Unknown None Pending for marijuana. This partial 2017 percentage accounted for a 14 percentage point decrease compared to 47 percent of decedents with positive marijuana results in 2016 OIS incidents. Historically, 30 of the 73 decedents involved in 2013 through 2016 OIS incidents, representing 41 percent, had positive toxicology results for marijuana. One decedent, representing eight percent of the 12 OIS decedents with completed toxicology examinations, had a positive result for opiates. Two decedents, or 17 percent, had positive results for psychiatric medication. Two decedents, or 17 percent, had negative toxicology results for alcohol and/or controlled substances. AUTO EDGED FARM IMPACT PERCP PHYS REPL OTH UNK NONE In 2017, 24 firearms were utilized by suspects during OIS incidents, which represented 52 percent of the 46 total weapon types. This accounted for a nine percentage point decrease compared to 61 percent in When compared to the aggregate percentage of firearms utilized by suspects during OIS incidents from 2013 through 2016 of 55 percent, 2017 experienced a three percentage point decrease. Historically, from 2013 through 2017, firearms were the most utilized weapon type by suspects during OIS incidents, representing 115 of the 211 total weapons, or 55 percent. In 2017, nine edged weapons were utilized by suspects during OIS incidents, which represented 20 percent of the 46 total weapon types. This accounted for an eight percentage point increase compared to 12 percent in When compared to the aggregate percentage of edged weapons utilized by suspects during OIS incidents from 2013 through 2016 of 18 percent, 2017 experienced a two percentage point increase. Historically, from 2013 through 2017, edged weapons were the second most utilized weapon type by suspects during OIS incidents, representing 38 of the 211 total weapons, or 18 percent. In 2017, four replica/pellet guns were utilized by suspects during OIS incidents, which represented approximately nine percent of the 46 total weapon types. This accounted for a one percentage point decrease compared to 10 percent in When compared to the aggregate percentage of replica/pellet guns utilized by suspects during OIS incidents from 2013 through 2016 of seven percent, 2017 experienced a two percentage point increase. Historically, from 2013 through 2017, replica/pellet guns were the third most utilized weapon type by suspects during OIS incidents, representing 16 of the 211 total weapons, or approximately eight percent. In 2017, four impact devices were utilized by suspects during OIS incidents, which represented approximately nine percent of the 46 total weapon types. This accounted for an increase of four impact devices when compared to zero in When compared to the aggregate percentage of impact devices utilized by suspects during OIS incidents from 2013 through 2016 of two percent, 2017 experienced a seven percentage point increase. Historically, from 2013 through 2017, impact devices were the fourth most utilized weapon type (in addition to the physical force category) by suspects during OIS incidents, representing eight of the 211 total weapons, or approximately four percent. In 2017, three suspects were perceived to be armed with a weapon (perception-based shooting), which represented approximately seven percent of the 46 total weapon types. This accounted for a two percentage point increase compared to five percent in When compared to the aggregate percentage of perception-based OIS incidents from 2013 through 2016 of seven percent, 2017 experienced no percentage point change. Historically, from 2013 through 2017, perception-based OIS incidents were the fourth most represented weapon category, with 14 of the 211 total weapon classifications, or seven percent. The two remaining suspect weapon types, representing four percent, involved in 2017 OIS incidents were automobiles USE OF FORCE YEAR-END REVIEW LOS ANGELES POLICE DEPARTMENT 161
82 {CUOF INCIDENTS OIS} SUSPECT INJURIES ETHNICITY OF DECEASED SUSPECTS INJ DEC UNK Category Injured Deceased Unknown Total AM IND ASN BLK FILIP HISP WHT OTH Ethnicity American Indian Asian/Pacific Islander Black Filipino Hispanic White Other Total One suspect in 2016 suffered a fatal self-inflicted gunshot wound during an OIS-No Hit incident and was not included in the analysis below. In 2017, 17 suspects died from police gunfire, resulting in a death in 39 percent of the 44 total OIS incidents (none of the 44 incidents included two or more decedents). When compared to the 2016 total of 19 deaths (excluding one suspect who suffered a fatal self-inflicted gunshot wound), the number of deceased suspects decreased by two individuals, or 11 percent, in Additionally, the 2017 percentage of deaths relative to the number of incidents accounted for a nine percentage point decrease compared to 48 percent in When compared to the 2013 through 2016 annual average of deceased suspects, 2017 was 1.25 decedents, or seven percent, below the fouryear annual average. Additionally, when compared to the aggregate percentage of suspect deaths from police gunfire from 2013 through 2016 of 54 percent, 2017 experienced a 15 percentage point decrease. Historically, from 2013 through 2017, an average of 18 suspects died from police gunfire each year. In 2017, 14 suspects sustained injuries from police gunfire during 13 OIS incidents, resulting in an injury from police gunfire (other than a fatal injury) in 30 percent of the 44 total OIS incidents (one of the 44 incidents included two suspects who both suffered non-fatal injuries from police gunfire). When compared to the 2016 total of nine suspects injured by police gunfire, the number of injured suspects increased by five individuals, or 56 percent, in When compared to the 2013 through 2016 annual average of injured suspects, 2017 experienced a 0.75 percentage point increase. Historically, from 2013 through 2017, an average of 13.4 suspects sustained non-fatal injuries from police gunfire each year. Sixty-eight percent of the Department s 44 OIS incidents in 2017 included a suspect struck by police gunfire (either suffering a fatal or non-fatal injury). Also in 2017, six suspects sustained injuries during OIS-No Hit incidents from causes other than police gunfire. One outstanding suspect s injury status remained unknown as of year-end One suspect involved in a 2016 OIS incident died from a self-inflicted gunshot wound and was not included in the analysis below. Of the 17 decedents involved in OIS incidents in 2017, 10 individuals, or 59 percent, were Hispanic. This accounted for a six percentage point decrease compared to 65 percent in When compared to the aggregate percentage of involved deceased Hispanic suspects from OIS incidents from 2013 through 2016 of 55 percent, 2017 experienced a four percentage point increase. Historically, from 2013 through 2017, a majority of deceased suspects involved in OIS incidents were Hispanic, accounting for 50 of the 90 total decedents, or 56 percent. Of the 17 decedents involved in OIS incidents in 2017, six individuals, or 35 percent, were White. This accounted for a 30 percentage point increase compared to five percent in When compared to the aggregate percentage of involved deceased White suspects from OIS incidents from 2013 through 2016 of 12 percent, 2017 experienced a 23 percentage point increase. Historically, from 2013 through 2017, White suspects represented the third highest ethnic decedent count, accounting for 15 of the 90 total decedents, or 17 percent. Of the 17 decedents involved in OIS incidents in 2017, one individual, or six percent, was Black. This accounted for a 20 percentage point decrease compared to 26 percent in When compared to the aggregate percentage of involved deceased Black suspects from OIS incidents from 2013 through 2016 of 29 percent, 2017 experienced a 23 percentage point decrease. Historically, from 2013 through 2017, Black suspects represented the second highest ethnic decedent count, accounting for 22 of the 90 total decedents, or 24 percent USE OF FORCE YEAR-END REVIEW LOS ANGELES POLICE DEPARTMENT 163
83 {CUOF INCIDENTS OIS} DEPARTMENT ADJUDICATION 21 TACTICAL DEBRIEF/IN-POLICY (NO FURTHER ACTION) ADMINISTRATIVE DISAPPROVAL/OUT OF POLICY (ADMINISTRATIVE DISAPPROVAL) TAC D&E N-LETH L-LETH LETH LETH-NO Category Tactics N/A Drawing & Exhibiting N/A Non-Lethal N/A Less Lethal N/A Lethal N/A Lethal-No Findings N/A Total N/A TAC D&E N-LETH L-LETH LETH Category Tactics N/A Drawing & Exhibiting N/A Non-Lethal N/A Less Lethal N/A Lethal N/A Total N/A In 2016, 23 out of the 50 total OIS Tactics findings, representing 46 percent, were adjudicated as Tactical Debrief. This accounted for a 16 percentage point decrease compared to 62 percent in When compared to the aggregate percentage of Tactical Debrief Tactics findings from 2013 through 2015 of 80 percent, 2016 experienced a 34 percentage point decrease. Historically, from 2013 through 2016, a majority of adjudicated Tactics findings resulted in a Tactical Debrief outcome, accounting for 211 of the 285 total Tactics findings, or 74 percent. In 2016, 50 out of the 50 total OIS Drawing/Exhibiting findings, representing 100 percent, were adjudicated as In Policy (No Further Action). This accounted for a 1.3 percentage point increase compared to 98.7 percent in When compared to the aggregate percentage of In Policy (No Further Action) Drawing/Exhibiting findings from 2013 through 2015 of 99.6 percent, 2016 experienced a 0.4 percentage point increase. Historically, from 2013 through 2016, a majority of adjudicated Drawing/Exhibiting findings resulted in an In Policy (No Further Action) outcome, accounting for 284 of the 285 total Drawing/ Exhibiting findings, or 99.6 percent. In 2016, the lethal force in one OIS incident resulted in a No Findings decision by the BOPC. As such, 49 total Lethal force findings were rendered for the year. 22 Of those 49 findings, 43, or 88 percent, were adjudicated as In Policy (No Further Action). This accounted for a two percentage point increase compared to 86 percent in When compared to the aggregate percentage of In Policy (No Further Action) Lethal force findings from 2013 through 2015 of 87 percent, 2016 experienced a one percentage point increase. Historically, from 2013 through 2016, a majority of adjudicated Lethal force findings resulted in an In Policy (No Further Action) outcome, accounting for 248 of the 284 total findings, or 87 percent. In 2016, 27 out of the 50 total OIS Tactics findings, representing 54 percent, were adjudicated as Administrative Disapproval. This accounted for a 16 percentage point increase compared to 38 percent in When compared to the aggregate percentage of Administrative Disapproval Tactics findings from 2013 through 2015 of 20 percent, 2016 experienced a 34 percentage point increase. Historically, from 2013 through 2016, 74 of the 285 total Tactics findings, accounting for 26 percent, resulted in an Administrative Disapproval outcome. In 2016, none of the 50 total OIS Drawing/Exhibiting findings were adjudicated as Out of Policy (Administrative Disapproval). In the four-year period from 2013 through 2016, only one of the 285 Drawing/Exhibiting findings, representing less than one percent, was adjudicated as Out of Policy (Administrative Disapproval). In 2016, the lethal force in one OIS incident resulted in a No Findings decision by the BOPC. As such, 49 total Lethal force findings were rendered for the year. Of those 49 findings, six, or 12 percent, were adjudicated as Out of Policy (Administrative Disapproval). This accounted for a two percentage point decrease compared to 14 percent in When compared to the aggregate percentage of Out of Policy (Administrative Disapproval) Lethal force findings from 2013 through 2015 of 13 percent, 2016 experienced a one percentage point decrease. Historically, from 2013 through 2016, 36 of the 284 total Lethal force findings, representing 13 percent, resulted in an Out of Policy (Administrative Disapproval) outcome. 21 Adjudication data for 2017 was omitted from this Report since a vast majority of the CUOF incidents will be adjudicated by the BOPC in The Department s statute of limitations for adjudication of a CUOF incident is one year from the date of incident. When the case is heard by the BOPC for adjudication, a quorum of three of the five BOPC members is required for a majority decision of an adjudicative finding. In this instance, the case was heard by the BOPC during two closed session meetings. However, no majority decision was reached, and thus, no adjudicative lethal force finding was rendered USE OF FORCE YEAR-END REVIEW LOS ANGELES POLICE DEPARTMENT 165
84 {CUOF INCIDENTS OIS-HIT} OFFICER INVOLVED SHOOTING- HIT INCIDENTS An incident in which a Department employee intentionally discharges a firearm (excluding Warning Shot, Animal Shooting, and/or Tactical Intentional Discharge incidents). Officer Involved Shooting incidents are categorized into Hit or No Hit occurrences. ANNUAL DEPARTMENT TOTALS OIS - Hit Department Total DEPT TTL In 2017, Department personnel were involved in 30 OIS- Hit incidents, an increase of three incidents, or 11 percent, compared to In the four-year period from 2013 through 2016, there were a total of 125 OIS-Hit incidents, resulting in an annual average of incidents. The 2017 count fell below the 2013 through 2016 annual average by 1.25 incidents, or four percent. CLASSIFICATION OF OIS-HIT INCIDENTS I II III IV V VI VII UNK In 2017, 12 of the 30 total OIS-Hit incidents, or 40 percent, were categorized as Classification II shootings. This accounted for a 12 percentage point decrease compared to 52 percent in When compared to the aggregate percentage of Classification II shooting incidents from 2013 through 2016 of 34 percent, 2017 experienced a six percentage point increase. Historically from 2013 through 2017, Classification II shooting incidents accounted for 55 of the 155 total OIS-Hit incidents, or 35 percent. Continues on page 168 Classification I II III IV V VI VII Unknown Total Classification I II III IV V VI VII Description Suspect verified with firearm - fired at officer or 3 rd party Suspect verified with firearm - firearm in hand or position to fire (but did not fire) Perception shooting - firearm present but not drawn Perception shooting - no firearm found Suspect armed with weapon other than firearm Suspect not armed, but threat of/causing serious bodily injury or death to others Other OIS HIT INCIDENTS Geographic Areas 1 Central Area 12 77th Street Area 2 Rampart Area 13 Newton Area 3 Southwest Area 14 Pacific Area 4 Hollenbeck Area 15 North Hollywood Area 5 Harbor Area 16 Foothill Area 6 Hollywood Area 17 Devonshire Area 7 Wilshire Area 18 Southeast Area 8 West Los Angeles Area 19 Mission Area 9 Van Nuys Area 20 Olympic Area 10 West Valley Area 21 Topanga Area 11 Northeast Area Police Stations OIS-Hit Incidents Map excludes UOF incidents that occurred outside of the Los Angeles city limits. Prepared by LAPD/ADSD/GIS Mapping USE OF FORCE YEAR-END REVIEW LOS ANGELES POLICE DEPARTMENT 167
85 {CUOF INCIDENTS OIS-HIT} Classification of OIS-Hit Incidents continued BUREAU OF OCCURRENCE OPERATIONS-CENTRAL BUREAU In 2017, 10 of the 30 total OIS-Hit incidents, or 33 percent, were categorized as Classification V shootings. This accounted for an 11 percentage point increase compared to 22 percent in When compared to the aggregate percentage of Classification V shooting incidents from 2013 through 2016 of 29 percent, 2017 experienced a four percentage point increase. Historically from 2013 through 2017, Classification V shooting incidents accounted for 46 of the 155 total OIS-Hit incidents, or 30 percent. In 2017, six of the 30 total OIS-Hit incidents, or 20 percent, were categorized as Classification I shootings. This accounted for a five percentage point increase compared to 15 percent in When compared to the aggregate percentage of Classification I shooting incidents from SOURCE OF ACTIVITY 2013 through 2016 of 22 percent, 2017 experienced a two percentage point decrease. Historically from 2013 through 2017, Classification I shooting incidents accounted for 33 of the 155 total OIS-Hit incidents, or 21 percent. In 2017, two of the 30 total OIS-Hit incidents, or seven percent, were categorized as Classification IV shootings. This accounted for a three percentage point increase compared to four percent in When compared to the aggregate percentage of Classification IV shooting incidents from 2013 through 2016 of nine percent, 2017 experienced a two percentage point decrease. Historically from 2013 through 2017, Classification IV shooting incidents accounted for 13 of the 155 total OIS- Hit incidents, or eight percent. CENT NEWT NOE RAMP HOBK In 2017, seven of the Department s OIS-Hit incidents occurred within the geographical area of Central Bureau, which was a decrease of four incidents, or 36 percent, compared to Twenty-three percent of the Department s OIS-Hit incidents occurred in Central Bureau (Department - 30; Central Bureau - seven). Area Central Newton Northeast Rampart Hollenbeck Total In the four-year period from 2013 through 2016, 42 OIS- Hit incidents occurred in Central Bureau, resulting in an annual average of 10.5 incidents. The Central Bureau count for 2017 fell below the 2013 through 2016 annual average by 3.5 incidents, or 33 percent. RCALL OBS CZN FD PRE-PLN SCALL AMB OFF DTY OTH Source Radio Call Observation Citizen Flag Down Pre-Planned Station Call Ambush Off-Duty Other Total OPERATIONS-SOUTH BUREAU 77TH SOE HARB SOW Area 77th Street Southeast Harbor Southwest Total In 2017, 16 of the Department s 30 OIS-Hit incidents, or 53 percent, originated from radio calls. This accounted for a 20 percentage point increase compared to 33 percent in When compared to the aggregate percentage of OIS-Hit incidents resulting from radio calls from 2013 through 2016 of 56 percent, 2017 experienced a three percentage point decrease. Historically from 2013 through 2017, radio calls represented the largest source category of OIS-Hit incidents, accounting for 86 of the 155 total incidents, or 55 percent. In 2017, six of the Department s 30 OIS-Hit incidents, or 20 percent, originated from field detentions based on officers observations (i.e. pedestrian and traffic stops). This accounted for a 32 percentage point decrease compared to 52 percent in When compared to the aggregate percentage of OIS-Hit incidents resulting from field detentions based on officers observations from 2013 through 2016 of 30 percent, 2017 experienced a 10 percentage point decrease. Historically from 2013 through 2017, field detentions based on officers observations represented the second largest source category of OIS-Hit incidents, accounting for 43 of the 155 total incidents, or 28 percent. In 2017, four of the Department s 30 OIS-Hit incidents, or 13 percent, originated from pre-planned activities (i.e. warrant services; parole/probation checks; etc.). This accounted for a nine percentage point increase compared to four percent in When compared to the aggregate percentage of OIS- Hit incidents resulting from pre-planned activities from 2013 through 2016 of approximately six percent, 2017 experienced a seven percentage point increase. Historically from 2013 through 2017, pre-planned activities represented the third largest source category of OIS-Hit incidents, accounting for 12 of the 155 total incidents, or eight percent. The remaining four incidents, or approximately 13 percent, in 2017 occurred during citizen flag downs and off-duty occurrences. In 2017, two of the Department s OIS-Hit incidents occurred within the geographical area of South Bureau, which was a decrease of three incidents, or 60 percent, compared to Approximately seven percent of the Department s OIS-Hit incidents occurred in South Bureau (Department - 30; South Bureau - two). In the four-year period from 2013 through 2016, 25 OIS-Hit incidents occurred in South Bureau, resulting in an annual average of 6.25 incidents. The South Bureau count for 2017 fell below the 2013 through 2016 annual average by 4.25 incidents, or 68 percent USE OF FORCE YEAR-END REVIEW LOS ANGELES POLICE DEPARTMENT 169
86 {CUOF INCIDENTS OIS-HIT} OPERATIONS-WEST BUREAU OUTSIDE JURISDICTION HWD OLYM PAC WLA WIL In 2017, seven of the Department s OIS-Hit incidents occurred within the geographical area of West Bureau, an increase of four incidents, or 133 percent, compared to Twenty-three percent of the Department s OIS-Hit incidents occurred in West Bureau (Department - 30; West Bureau - seven). Area Hollywood Olympic Pacific West Los Angeles Wilshire Total In the four-year period from 2013 through 2016, 16 OIS-Hit incidents occurred in West Bureau, resulting in an annual average of four incidents. The West Bureau count for 2017 exceeded the 2013 through 2016 annual average by three incidents, or 75 percent. OUTSIDE Area Outside Jurisdiction In 2017, four of the Department s OIS-Hit incidents occurred outside the Department s jurisdiction, which was an increase of one incident, or 33 percent, compared to Thirteen percent of the Department s OIS-Hit incidents occurred in areas outside the Department s jurisdiction (Department - 30; Outside Areas - four). In the four-year period from 2013 through 2016, 13 OIS-Hit incidents occurred in areas outside the Department s jurisdiction, resulting in an annual average of 3.25 incidents. The total incident count for outside areas in 2017 exceeded the 2013 through 2016 annual average by 0.75 incidents, or 23 percent. OPERATIONS-VALLEY BUREAU MONTH OF OCCURRENCE DEV FTHL MISN NHWD TOP VNYS WVAL In 2017, 10 of the Department s OIS-Hit incidents occurred within the geographical area of Valley Bureau, which was an increase of five incidents, or 100 percent, compared to Approximately 33 percent of the Department s OIS- Hit incidents occurred in Valley Bureau (Department - 30; Valley Bureau - 10). Area Devonshire Foothill Mission North Hollywood Topanga Van Nuys West Valley Total In the four-year period from 2013 through 2016, 29 OIS-Hit incidents occurred in Valley Bureau, resulting in an annual average of 7.25 incidents. The Valley Bureau count for 2017 exceeded the 2013 through 2016 annual average by 2.75 incidents, or 38 percent. JAN FEB MAR APR MAY JUN JUL AUG SEP OCT NOV DEC Month January February March April May June July August September October November December Total In 2017, June represented the month with the most OIS-Hit incidents with six occurrences, or 20 percent, out of 30 total incidents for the year. January, March, and December each had the second highest incident count with four incidents, or approximately 13 percent, respectively. August had the third highest count with three incidents, or 10 percent. The remaining nine incidents, or 30 percent, were fairly evenly distributed throughout the remaining months of the year. From 2013 through 2017, August represented the month with the most OIS-Hit incidents with 20 out of the 155 total incidents, or 13 percent. September and October represented the months with the least, representing seven incidents, or approximately five percent, respectively. February had the second fewest with eight incidents, or five percent. The remaining 113 incidents, or 73 percent, were fairly evenly distributed throughout the remaining months of the year. The OIS-Hit percentage breakdown on a quarterly basis from 2013 through 2017 was as follows: January March: 36 incidents, or 23 percent; April June: 42 incidents, or 27 percent; July September: 42 incidents; or 27 percent; and, October December: 35 incidents, or 23 percent USE OF FORCE YEAR-END REVIEW LOS ANGELES POLICE DEPARTMENT 171
87 {CUOF INCIDENTS OIS-HIT} DAY OF OCCURRENCE OFFICER INFORMATION MON TUE WED THUR FRI SAT SUN In 2017, Tuesday represented the day of the week with the most OIS-Hit incidents with seven occurrences, or 23 percent. Saturday represented the second most frequent day of the week with six incidents, or 20 percent. TIME OF OCCURRENCE Day Monday Tuesday Wednesday Thursday Friday Saturday Sunday Total From 2013 through 2017, Tuesday represented the day with the most OIS-Hit incidents with 28 out of the 155 total, or 18 percent. Thursday represented the day with the least with 17 incidents, or 11 percent. The remaining 116 incidents, or 75 percent, were fairly evenly distributed throughout the remaining days of the week. Time of Day Total The officer sections below include data for all employees who received, or were pending, BOPC lethal force adjudicative findings for their involvement in OIS-Hit incidents. In 2017, 81 Department personnel were involved in the 30 OIS-Hit incidents throughout the year, resulting in an OFFICER - GENDER MALE Female Male In 2017, 78 male officers were involved in OIS-Hit incidents, which represented 96 percent of the 81 total employees. This accounted for a one percentage point increase compared to 95 percent in The percentage of male officers involved in OIS-Hit incidents in 2017 was 14 percentage points above the Department s overall male total. When compared to the aggregate percentage of involved male personnel from 2013 through 2016 of 95 percent, 2017 experienced a one percentage point increase. Historically, from 2013 through 2017, a majority of officers involved in OIS-Hit incidents were male, accounting for 306 of the 321 total employees, or 95 percent. average of 2.7 officers per incident. This accounted for a 93 percent increase compared to an average of 1.4 officers per incident in The 2017 officer to incident average exceeded the 2013 through 2016 aggregate annual average of 1.9 by 42 percent. Gender Female Male Total In 2017, three female officers were involved in OIS-Hit incidents, which represented four percent of the 81 total employees. This accounted for a one percentage point decrease compared to five percent in The percentage of female officers involved in OIS-Hit incidents in 2017 was 14 percentage points below the Department s overall female total. When compared to the aggregate percentage of involved female personnel from 2013 through 2016 of five percent, 2017 experienced a one percentage point decrease. Historically, from 2013 through 2017, females accounted for 15 of the 321 total involved employees, or five percent. In 2017, 14 OIS-Hit incidents, or approximately 47 percent, occurred between the hours of 6 a.m. and 5:59 p.m., while 16 incidents, or 53 percent, occurred between the hours of 6 p.m. and 5:59 a.m. The time distribution was similar from 2013 through 2016, where 57 OIS-Hit incidents, or 46 percent, occurred between the hours of 6 a.m. and 5:59 p.m., and 68 incidents, or 54 percent, occurred between the hours of 6 p.m. and 5:59 a.m. The five-year annual average for 2013 through 2017 was 14.2 OIS-Hit incidents occurring between the hours of 6 a.m. and 5:59 p.m., and 16.8 incidents between the hours of 6 p.m. and 5:59 a.m USE OF FORCE YEAR-END REVIEW LOS ANGELES POLICE DEPARTMENT 173
88 {CUOF INCIDENTS OIS-HIT} OFFICER - ETHNICITY OFFICER YEARS OF SERVICE AM IND ASN BLK FILIP HISP WHT OTH Ethnicity American Indian Asian/Pacific Islander Black Filipino Hispanic White Other Total < > Years Less than More than Total In 2017, 40 Hispanic officers were involved in OIS-Hit incidents, which represented 49 percent of the 81 total employees. This accounted for a 21 percentage point decrease compared to 70 percent in The percentage of Hispanic officers involved in OIS-Hit incidents in 2017 was two percentage points above the Department s overall Hispanic total. When compared to the aggregate percentage of involved Hispanic personnel from 2013 through 2016 of 58 percent, 2017 experienced a nine percentage point decrease. Historically, from 2013 through 2017, a majority of officers involved in OIS-Hit incidents were Hispanic, accounting for 179 of the 321 total employees, or 56 percent. In 2017, 29 White officers were involved in OIS-Hit incidents, which represented 36 percent of the 81 total employees. This accounted for a 12 percentage point increase compared to 24 percent in The percentage of White officers involved in OIS-Hit incidents in 2017 was four percentage points above the Department s overall White total. When compared to the aggregate percentage of involved White personnel from 2013 through 2016 of 30 percent, 2017 experienced a six percentage point increase. Historically, from 2013 through 2017, White officers represented the second largest ethnic category of personnel involved in OIS-Hit incidents, accounting for 101 of the 321 total employees, or 31 percent. In 2017, four Asian/Pacific Islander officers were involved in OIS-Hit incidents, which represented five percent of the 81 total employees. This accounted for a two percentage point increase compared to three percent in The percentage of Asian/Pacific Islander officers involved in OIS-Hit incidents in 2017 was three percentage points below the Department s overall Asian/Pacific Islander total. When compared to the aggregate percentage of involved Ethnicity City Population Department Personnel OIS-Hit Personnel Asian/Pacific Isl. 12% 8% 5% Black 9% 10% 5% Hispanic 49% 47% 49% White 28% 32% 36% Other 2% 3% 5% Total 100% 100% 100% Asian/Pacific Islander personnel from 2013 through 2016 of six percent, 2017 experienced a one percentage decrease. Historically from 2013 through 2017, Asian/Pacific Islander officers represented the third largest category of personnel involved in OIS-Hit incidents, accounting for 18 of the 321 total employees, or six percent. In 2017, four Black officers were involved in OIS-Hit incidents, which represented five percent of the 81 total employees. This accounted for a two percentage point increase compared to three percent in The percentage of Black officers involved in OIS-Hit incidents in 2017 was five percentage points below the Department s overall Black total. When compared to the aggregate percentage of involved Black personnel from 2013 through 2016 of four percent, 2017 represented a one percentage point increase. Historically from 2013 through 2017, Black officers represented the fourth largest category of personnel involved in OIS-Hit incidents, accounting for 13 of the 321 total employees, or four percent. The remaining four employees, or five percent, involved in 2017 OIS-Hit incidents included two American Indian officers and two Filipino officers. The following depicts the percentage of personnel involved in OIS-Hit incidents in 2017 based on their respective years of service classifications: Less than one year of service two percent (two out of 81 total officers); 1-5 years of service 26 percent (21 out of 81 total officers); 6-10 years of service 17 percent (14 out of 81 total officers); years of service 37 percent (30 out of 81 total officers); and, More than 20 years of service 17 percent (14 out of 81 total officers). In 2017, there were percentage point decreases in three of the five categories and increases in two, when compared to The following depicts these changes: Less than one year of service one percentage point decrease (three percent in 2016, two percent in 2017); 1-5 years of service one percentage point decrease (27 percent in 2016, 26 percent in 2017); 6-10 years of service 29 percentage point decrease (46 percent in 2016, 17 percent in 2017); years of service 23 percentage point increase (14 percent in 2016, 37 percent in 2017); and, More than 20 years of service six percentage point increase (11 percent in 2016, 17 percent in 2017). In 2017, there were percentage point increases in three of the five years of service categories, a decrease in one, and one that remained unchanged when compared to the aggregate percentage of personnel involved in OIS-Hit incidents during the four-year period from 2013 through The following depicts these changes: Less than one year of service no percentage point change (two percent during four-year period, two percent in 2017); 1-5 years of service three percentage point increase (23 percent during four-year period, 26 percent in 2017); 6-10 years of service 24 percentage point decrease (41 percent during four-year period, 17 percent in 2017); years of service 12 percentage point increase (25 percent during four-year period, 37 percent in 2017); and, More than 20 years of service eight percentage point increase (nine percent during four-year period, 17 percent in 2017). Historically, from 2013 through 2017, a majority of officers involved in OIS-Hit incidents had 6-10 years of service, accounting for 112 of the 321 total employees, or 35 percent. Officers with years of service accounted for the second largest category with a total of 90 employees, or 28 percent, during the same five-year period. Officers with 1-5 years of service were the third largest group, with 76 personnel, or 24 percent, followed by officers with more than 20 years of service, which had 36 officers, or 11 percent. Officers with less than one year of service, which accounted for seven officers, represented only two percent of the total USE OF FORCE YEAR-END REVIEW LOS ANGELES POLICE DEPARTMENT 175
89 {CUOF INCIDENTS OIS-HIT} OFFICER RANK OFFICER AREA/DIVISION OF ASSIGNMENT >LT Rank Captain and Above TH CENT Division/Area/Bureau 77th Street LT Lieutenant DEV Central SGT DET PO DO RO In 2017, 74 employees at the rank of police officer were involved in OIS-Hit incidents, which represented 91 percent of the 81 total employees. This accounted for a five percentage point increase compared to 86 percent in The percentage of police officers involved in OIS- Hit incidents in 2017 was 23 percentage points above the Department s overall police officer total. When compared to the aggregate percentage of involved personnel at the rank of police officer from 2013 through 2016 of 94 percent, 2017 experienced a three percentage point decrease. Historically, from 2013 through 2017, a majority of personnel involved in OIS-Hit incidents were at the rank of police officer, accounting for 300 of the 321 total employees, or 93 percent. In 2017, six employees at the rank of detective were involved in OIS-Hit incidents, which represented seven Sergeant Detective Police Officer Detention Officer Reserve Officer Other Total percent of the 81 total employees. This accounted for a one percentage point decrease compared to eight percent in The percentage of detectives involved in OIS-Hit incidents in 2017 was nine percentage points below the Department s overall detective total. When compared to the aggregate percentage of involved personnel at the rank of detective from 2013 through 2016 of three percent, 2017 experienced a four percentage point increase. Historically, from 2013 through 2017, employees at the rank of detective accounted for the second largest category of personnel involved in OIS-Hit incidents, representing 12 of the 321 total employees, or four percent. The remaining employee involved in an OIS-Hit incident in 2017, representing one percent of the 81 total personnel, was at the rank of sergeant. FTHL HARB HOBK HWD MISN NEWT NHWD NOE OLYM PAC RAMP SOE SOW TOP VNYS WLA WVAL WIL TRFC ADMIN SPCL BUREAU METRO SSD Devonshire Foothill Harbor Hollenbeck Hollywood Mission Newton North Hollywood Northeast Olympic Pacific Rampart Southeast Southwest Topanga Van Nuys West Los Angeles West Valley Wilshire All Traffic Divisions Administrative Units Specialized Units Bureau Level Metropolitan Security Services Other Areas Total In 2017, 18 personnel assigned to Metropolitan Division through 2016 of 15 percent, 2017 experienced a seven were involved in OIS-Hit incidents, which represented 22 percentage point increase. Historically, from 2013 through percent of the 81 total employees. This represented an , a majority of officers involved in OIS-Hit incidents percentage point increase compared to 11 percent in were assigned to Metropolitan Division, accounting for 53 When compared to the aggregate percentage of involved of the 321 total employees, or 17 percent. personnel assigned to Metropolitan Division from 2013 Continues on page USE OF FORCE YEAR-END REVIEW LOS ANGELES POLICE DEPARTMENT 177
90 {CUOF INCIDENTS OIS-HIT} Officer Area/Division of Assignment continued OFFICER UNIT OF ASSIGNMENT In 2017, 14 personnel assigned to Hollywood Division were involved in OIS-Hit incidents, which represented 17 percent of the 81 total employees. This represented a one percentage point increase compared to 16 percent in When compared to the aggregate percentage of involved personnel assigned to Hollywood Division from 2013 through 2016 of 11 percent, 2017 experienced a six percentage point increase. Historically, from 2013 through 2017, Hollywood Division accounted for the second highest involved personnel count with 41 of the 321 total employees, or 13 percent. In 2017, 12 personnel assigned to Rampart Division were involved in OIS-Hit incidents, which represented 15 percent of the 81 total employees. This represented a 10 percentage point increase compared to five percent in When compared to the aggregate percentage of involved personnel assigned to Rampart Division from 2013 through 2016 of seven percent, 2017 experienced an eight percentage point increase. Historically, from 2013 through 2017, personnel assigned to Rampart Division accounted for 28 of the 321 total employees involved in OIS-Hit incidents, or nine percent. The remaining 37 Department personnel, or 46 percent, were fairly evenly distributed amongst the remaining Areas/Divisions. The following is the employee Bureau assignment for the 81 total personnel involved in OIS-Hit incidents in 2017: Central Bureau: 16 personnel, or 20 percent; West Bureau: 18 personnel, or 22 percent; South Bureau: six personnel, or seven percent; Valley Bureau: 16 personnel, or 20 percent; CTSOB: 18 personnel, or 22 percent; and, Other: seven personnel, or nine percent. In 2017, there were percentage point increases in four of the six Bureau categories and decreases in two, when compared to The following depicts these changes: Central Bureau: 12 percentage point decrease (32 percent in 2016, 20 percent in 2017); West Bureau: three percentage point increase (19 percent in 2016, 22 percent in 2017); South Bureau: nine percentage point decrease (16 percent in 2016, seven percent in 2017); Valley Bureau: six percentage point increase (14 percent in 2016, 20 percent in 2017); CTSOB: 11 percentage point increase (11 percent in 2016, 22 percent in 2017); and, Other: one percentage point increase (eight percent in 2016, nine percent in 2017). In 2017, there were percentage point increases in three of the six Bureau categories, decreases in two, and one that remained unchanged when compared to their respective aggregate percentages during the four-year period from 2013 through The following depicts these changes: Central Bureau: six percentage point decrease (26 percent during four-year period, 20 percent in 2017); West Bureau: eight percentage point increase (14 percent during four-year period, 22 percent in 2017); South Bureau: 13 percentage point decrease (20 percent during four-year period, seven percent in 2017); Valley Bureau: no percentage point change (20 percent during four-year period, 20 percent in 2017); CTSOB: seven percentage point increase (15 percent during four-year period, 22 percent in 2017); and, Other: four percentage point increase (five percent during four-year period, nine percent in 2017). ADMIN METRO PATROL SPCL INV CSD OTH In 2017, 39 personnel assigned to patrol were involved in OIS-Hit incidents, which represented 48 percent of the 81 total personnel. This accounted for a three percentage point decrease compared to 51 percent in When compared to the aggregate percentage of involved personnel assigned to patrol from 2013 through 2016 of 66 percent, 2017 experienced an 18 percentage point decrease. Historically, from 2013 through 2017, a majority of officers involved in OIS-Hit incidents were assigned to patrol, accounting for 197 of the 321 total employees, or 61 percent. In 2017, 18 personnel assigned to Metropolitan Division were involved in OIS-Hit incidents, which represented 22 percent of the 81 total personnel. This accounted for an 11 percentage point increase compared to 11 percent in When compared to the aggregate percentage of involved personnel assigned to Metropolitan Division from 2013 through 2016 of 15 percent, 2017 experienced a seven percentage point increase. Historically, from 2013 through 2017, personnel assigned to Metropolitan Division accounted for the third largest category of officers involved in OIS-Hit incidents, with 53 of the 321 total employees, or 17 percent. Unit Administrative Metropolitan Patrol Specialized Investigative Custody Other Total In 2017, 18 personnel assigned to specialized assignments were involved in OIS-Hit incidents, which represented 22 percent of the 81 total personnel. This accounted for an eight percentage point decrease compared to 30 percent in When compared to the aggregate percentage of involved personnel assigned to specialized assignments from 2013 through 2016 of 17 percent, 2017 experienced a five percentage point increase. Historically, from 2013 through 2017, personnel assigned to specialized assignments accounted for the second largest category of officers involved in OIS-Hit incidents, with 59 of the 321 total employees, or 18 percent. In 2017, six personnel assigned to investigative assignments were involved in OIS-Hit incidents, which represented seven percent of the 81 total personnel. This accounted for a one percentage point decrease compared to eight percent in When compared to the aggregate percentage of involved personnel assigned to investigative assignments from 2013 through 2016 of three percent, 2017 experienced a four percentage point increase. Historically, from 2013 through 2017, personnel assigned to investigative assignments accounted for the fourth largest category of officers involved in OIS-Hit incidents, with 12 of the 321 total employees, or four percent USE OF FORCE YEAR-END REVIEW LOS ANGELES POLICE DEPARTMENT 179
91 {CUOF INCIDENTS OIS-HIT} OFFICER INJURIES OFFICER WEAPON SYSTEM INJ HGUN SGUN Category DEC Injured RIFLE Deceased Total Weapon Type Handgun Shotgun Rifle Total No Department personnel were killed during or resulting from OIS-Hit incidents during the five-year period from 2013 through However, 39 officers sustained injuries during the same five-year period. NUMBER OF OFFICERS FIRING PER INCIDENT > In 2017, there were 16 single shooter OIS-Hit incidents, which represented 53 percent of the 30 total incidents. This accounted for a 10 percentage point decrease compared to 63 percent in When compared to the aggregate percentage of single shooter OIS-Hit incidents from 2013 through 2016 of 54 percent, 2017 experienced a one percentage point decrease. In 2017, there were six double shooter OIS-Hit incidents, which represented 20 percent of the 30 total incidents. This accounted for a 13 percentage point decrease compared to 33 percent in When compared to the aggregate percentage of double shooter OIS-Hit incidents from 2013 through 2016 of 29 percent, 2017 experienced a nine percentage point decrease. In 2017, there were four quadruple shooter OIS-Hit incidents, which represented 13 percent of the 30 total incidents. This In 2017, five officers sustained injuries during the 30 OIS- Hit incidents throughout the year. This accounted for a 44 percent decrease compared to nine injured officers in Additionally, when compared to the 2013 through 2016 annual average of 8.5 injured officers, 2017 was 3.5 injured officers, or 41 percent, below the four-year annual average. No. of Shooters or more Total accounted for an increase of four incidents in which four shooters fired compared to none in When compared to the aggregate percentage of quadruple shooter OIS- Hit incidents from 2013 through 2016 of two percent, 2017 experienced an 11 percentage point increase. In 2017, there were two shootings with 11 or more officers who fired their firearms, which represented seven percent of the 30 total incidents. This accounted for the highest total in this respective category in the five-year period from 2013 through When compared to the aggregate percentage of 11 or more shooter OIS-Hit incidents from 2013 through 2016 of two percent, 2017 experienced a five percentage point increase. The two remaining OIS-Hit incidents, or seven percent, were a triple officer shooting and a five to 10 shooter occurrence. In 2017, 52 handguns were utilized during OIS-Hit incidents, which represented 64 percent out of the 81 total weapon types. This accounted for a 25 percentage point decrease compared to 89 percent in When compared to the aggregate percentage of handguns utilized during OIS- Hit incidents from 2013 through 2016 of 80 percent, 2017 experienced a 16 percentage point decrease. Historically, from 2013 through 2017, handguns were the most utilized weapon type during OIS-Hit incidents, accounting for 248 of the 326 total weapons, or 76 percent. In 2017, 26 rifles were utilized during OIS-Hit incidents, which represented 32 percent out of the 81 total weapon types. This accounted for a 21 percentage point increase compared to 11 percent in When compared to the aggregate percentage of rifles utilized during OIS-Hit TOTAL NUMBER OF ROUNDS FIRED BY OFFICERS PER YEAR TTL RNDS incidents from 2013 through 2016 of 14 percent, 2017 experienced an 18 percentage point increase. Historically, from 2013 through 2017, rifles were the second most utilized weapon type during OIS-Hit incidents, accounting for 61 of the 326 total weapons, or 19 percent. In 2017, three shotguns were utilized during OIS-Hit incidents, which represented four percent out of the 81 total weapon types. This accounted for an increase of three shotguns compared to zero in When compared to the aggregate percentage of shotguns utilized during OIS- Hit incidents from 2013 through 2016 of six percent, 2017 experienced a two percentage point decrease. Historically, from 2013 through 2017, shotguns accounted for 17 of the 326 total weapons utilized in OIS-Hit incidents, representing five percent. OIS - Hit Total Rounds In 2017, a total of 330 rounds were fired during the 30 OIS- Hit incidents. When compared to the 2016 total of 162 rounds fired, 2017 experienced an increase of 168 rounds, or 104 percent. Additionally, when compared to the 2013 through 2016 annual average of 302 rounds fired, 2017 was 28 rounds, or nine percent, above the four-year annual average USE OF FORCE YEAR-END REVIEW LOS ANGELES POLICE DEPARTMENT 181
92 {CUOF INCIDENTS OIS-HIT} ANNUAL AVERAGE OF ROUNDS FIRED PER INCIDENT NUMBER OF ROUNDS FIRED PER INCIDENT BY OFFICERS AVG RNDS OIS - Hit Average Rounds In 2017, an average of 11 rounds were fired during OIS- Hit incidents. When compared to the 2016 average of six rounds fired, 2017 experienced an increase of five rounds, or 83 percent. Additionally, when compared to the 2013 through 2016 annual average of 9.7 rounds fired per incident, 2017 was 1.3 rounds, or 13 percent, above the four-year annual average. TOTAL NUMBER OF ROUNDS FIRED BY OFFICERS PER WEAPON SYSTEM HGUN > No. of Rounds or more Total SGUN RIFLE In 2017, 201 rounds were fired from handguns during OIS- Hit incidents, which represented 61 percent of the 330 total rounds fired. This accounted for a 31 percentage point decrease compared to 92 percent in When compared to the aggregate percentage of rounds fired from handguns during OIS-Hit incidents from 2013 through 2016 of 85 percent, 2017 experienced a 24 percentage point decrease. Historically, from 2013 through 2017, rounds fired from handguns were the most frequent round type fired during OIS-Hit incidents, accounting for 1,229 of the 1,539 total rounds, or 80 percent. In 2017, 125 rounds were fired from rifles during OIS- Hit incidents, which represented 38 percent of the 330 total rounds fired. This accounted for a 30 percentage point increase compared to eight percent in When compared to the aggregate percentage of rounds fired Weapon Type Handgun Shotgun Rifle Total from rifles during OIS-Hit incidents from 2013 through 2016 of 12 percent, 2017 experienced a 26 percentage point increase. Historically from 2013 through 2017, rounds fired from rifles were the second most frequent round type fired during OIS-Hit incidents, accounting for 265 of the 1,539 total rounds, or 17 percent. In 2017, four rounds were fired from shotguns during OIS-Hit incidents, which represented one percent of the 330 total rounds fired. This accounted for an increase of four rounds compared to zero in When compared to the aggregate percentage of rounds fired from shotguns during OIS-Hit incidents from 2013 through 2016 of three percent, 2017 experienced a two percentage point decrease. Historically from 2013 through 2017, rounds fired from shotguns accounted for 45 of the 1,539 total rounds fired, or three percent. In 2017, there were 16 OIS-Hit incidents in which 1-5 rounds were fired, which represented 53 percent of the 30 total incidents. This accounted for a 17 percentage point decrease compared to 70 percent in In addition, when compared to the aggregate percentage of incidents in which 1-5 rounds were fired during OIS-Hit incidents from 2013 through 2016 of 61 percent, 2017 experienced an eight percentage point decrease. In 2017, there were four OIS-Hit incidents in which rounds were fired, which represented 13 percent of the 30 total incidents. This accounted for a nine percentage point increase compared to four percent in In addition, when compared to the aggregate percentage of incidents in which rounds were fired during OIS-Hit incidents from 2013 through 2016 of five percent, 2017 experienced an eight percentage point increase. In 2017, there were three OIS-Hit incidents in which 6-10 rounds were fired, which represented 10 percent of the 30 total incidents. This accounted for an 12 percentage point decrease compared to 22 percent in In addition, when compared to the aggregate percentage of incidents in which 6-10 rounds were fired during OIS-Hit incidents from 2013 through 2016 of 20 percent, 2017 experienced a 10 percentage point decrease. In 2017, there were three OIS-Hit incidents in which rounds were fired, which represented 10 percent of the 30 total incidents. This accounted for an increase of three incidents compared to zero in When compared to the aggregate percentage of incidents in which rounds were fired during OIS-Hit incidents from 2013 through 2016 of six percent, 2017 experienced a four percentage point increase. The remaining four occurrences, or 13 percent, were shootings in which 36-40, 41-45, and rounds were fired per incident. When compared to the aggregate percentage of incidents with these same categories during the four-year period from 2013 through 2016 of zero percent, 2017 was 13 percentage points above the fouryear annual average USE OF FORCE YEAR-END REVIEW LOS ANGELES POLICE DEPARTMENT 183
93 {CUOF INCIDENTS OIS-HIT} OFFICER HIT RATIO SUSPECT INFORMATION RNDS FRD The suspect sections below include data for all individuals that Department personnel applied force against during OIS-Hit incidents. HITS OIS-Hit Rounds Fired Hits Hit Ratio (%) 23% 36% 50% 50% 27% SUSPECT ETHNICITY HIT RTO The 2017 total number of rounds fired compared to the total number of rounds which struck their intended targets resulted in a hit ratio of 27 percent. This accounted for a 23 percentage point decrease compared to 50 percent in In addition, when compared to the 2013 through 2016 aggregate hit ratio of 35 percent, 2017 experienced an eight percentage point decrease. Historically, from 2013 through 2017, the hit ratio of all OIS-Hit incidents, accounting for 509 of the 1,539 total rounds fired, was 33 percent. AM IND ASN BLK FILIP HISP WHT OTH Ethnicity American Indian Asian/Pacific Islander Black Filipino Hispanic White Other Total In 2017, 18 Hispanic suspects were involved in OIS-Hit incidents, which represented 58 percent of the 31 total suspects. This accounted for a four percentage point increase compared to 54 percent in The percentage of Hispanic suspects involved in OIS-Hit incidents in 2017 was nine percentage points above the City s overall Hispanic population total. Additionally, the percentage of Hispanic suspects involved in OIS-Hit incidents in 2017 was 18 percentage points above the City s overall Hispanic violent crime offender total. When compared to the aggregate percentage of involved Hispanic suspects from 2013 through 2016 of 51 percent, 2017 experienced a seven percentage point increase. Historically, from 2013 through 2017, the Hispanic category was the most represented ethnic group involved in OIS-Hit incidents with 82 of the 157 total suspects, or 52 percent. In 2017, nine White suspects were involved in OIS-Hit incidents, which represented 29 percent of the 31 total suspects. This accounted for a 25 percentage point increase compared to four percent in The percentage of White suspects involved in OIS-Hit incidents in 2017 was one percentage point above the City s overall White population total. Additionally, the percentage of White suspects involved in OIS-Hit incidents in 2017 was 21 percentage points above the City s overall White violent crime offender total. When compared to the aggregate percentage of involved White suspects from 2013 through 2016 of 12 percent, 2017 experienced a 17 percentage point increase. Historically, from 2013 through 2017, the White category was the third most represented ethnic group involved in OIS-Hit incidents with 24 of the 157 total suspects, or 15 percent. Ethnicity City Population Violent Crime Suspect OIS-Hit Suspect Asian/Pacific Isl. 12% (See Other) 0% Black 9% 44% 13% Hispanic 49% 40% 58% White 28% 8% 29% Other 2% 3% 0% Unknown DNA 5% 0% Total 100% 100% 100% In 2017, four Black suspects were involved in OIS-Hit incidents, which represented 13 percent of the 31 total suspects. This accounted for a 19 percentage point decrease compared to 32 percent in The percentage of Black suspects involved in OIS-Hit incidents in 2017 was four percentage points above the City s overall Black population total. However, the percentage of Black suspects involved in OIS-Hit incidents in 2017 was 31 percentage points below the City s overall Black violent crime offender total. When compared to the aggregate percentage of involved Black suspects from 2013 through 2016 of 31 percent, 2017 experienced an 18 percentage point decrease. Historically, from 2013 through 2017, the Black category was the second most represented ethnic group involved in OIS-Hit incidents with 43 of the 157 total suspects, or 27 percent USE OF FORCE YEAR-END REVIEW LOS ANGELES POLICE DEPARTMENT 185
94 {CUOF INCIDENTS OIS-HIT} SUSPECT GENDER Female Male In 2017, 30 male suspects were involved in OIS-Hit incidents, which represented 97 percent of the 31 total suspects. This accounted for a three percentage point decrease compared to 100 percent in When compared to the aggregate percentage of involved male suspects from 2013 through 2016 of 95 percent, 2017 experienced a two percentage point increase. Historically, from 2013 through 2017, a majority of suspects involved in OIS-Hit incidents were male, representing 150 of the 157 total suspects, or 96 percent. Gender Female Male Total In 2017, one female suspect, representing three percent of the 31 total suspects, was involved in an OIS-Hit incident. This accounted for an increase of one individual compared to When compared to the aggregate percentage of involved female suspects from 2013 through 2016 of five percent, 2017 experienced a two percentage point decrease. Historically, from 2013 through 2017, females represented seven of the 157 total suspects involved in OIS-Hit incidents, or four percent. 19 percent, 2017 experienced a three percentage point decrease. Historically, from 2013 through 2017, the age group represented the third largest age category of suspects involved in OIS-Hit incidents with 29 of the 157 total suspects, or 18 percent. In 2017, five of the 31 total suspects involved in OIS-Hit incidents, representing 16 percent, were in the age group. The age group accounted for a 16 percentage point decrease compared to 32 percent in When compared to the aggregate percentage of involved suspects within the age range from 2013 through 2016 of 26 percent, 2017 experienced a 10 percentage point decrease. Historically, from 2013 through 2017, the age group represented the second largest age category of suspects involved in OIS-Hit incidents with 38 of the 157 total suspects, or 24 percent. In 2017, five of the 31 total suspects involved in OIS-Hit incidents, representing 16 percent, were in the age group. The age group accounted for a 12 percentage point increase compared to four percent in When compared to the aggregate percentage of involved suspects within the age range from 2013 through 2016 of 10 percent, 2017 experienced a six percentage point increase. Historically, from 2013 through 2017, the age group represented the fourth largest age category of suspects involved in OIS-Hit incidents with 18 of the 157 total suspects, or 11 percent. The five remaining suspects, or 16 percent, in 2017 OIS-Hit incidents were in the age ranges of 0-17, 50-59, and 60 and above. SUSPECT AGE SUSPECT PERCEIVED MENTAL ILLNESS > Age and Above Total YES NO DNA Per. Mental Illness Yes No DNA Total In 2017, most suspects involved in OIS-Hit incidents were in the age group. Specifically, 11 of the 31 total suspects, or 35 percent, were included in this age group. The age category accounted for a 17 percentage point increase compared to 18 percent in When compared to the aggregate percentage of involved suspects within the age range from 2013 through 2016 of 29 percent, 2017 experienced a six percentage point increase. Historically, from 2013 through 2017, the age group represented the largest age category of suspects involved in OIS-Hit incidents with 48 of the 157 total suspects, or 31 percent. In 2017, five of the 31 total suspects involved in OIS-Hit incidents, representing 16 percent, were in the age group. The age group accounted for a 13 percentage point decrease compared to 29 percent in When compared to the aggregate percentage of involved suspects within the age range from 2013 through 2016 of In 2017, nine of the 31 total suspects, or 29 percent, involved in OIS-Hit incidents were perceived to suffer from a mental illness and/or a mental health crisis. This accounted for a 15 percentage point increase compared to 14 percent in When compared to the aggregate percentage of involved suspects who were perceived to suffer from a mental illness and/or a mental health crisis from 2013 through 2016 of 26 percent, 2017 experienced a three percentage point increase. Historically from 2013 through 2017, suspects who were perceived to suffer from a mental illness and/or a mental health crisis accounted for 42 of the 157 total suspects, or 27 percent USE OF FORCE YEAR-END REVIEW LOS ANGELES POLICE DEPARTMENT 187
95 {CUOF INCIDENTS OIS-HIT} SUSPECT GANG MEMBERSHIP SUSPECT TOXICOLOGY ANALYSIS Pursuant to California Assembly Bill 90, the Fair and Accurate Gang Database Act of 2017, Department resources housing gang membership information were temporarily DECEASED SUSPECT TOXICOLOGY RESULTS YES NO UNK PEND disabled effective January 1, As such, the Department was unable to determine whether suspects involved in UOF incidents were designated as gang members. Substance Present Yes No Unknown/Pending Total ALCOH COCA MARIJ METH OPIATE PCP PSYCH OTH UNK NONE PEND Substance Alcohol Cocaine Marijuana Methamphetamine Opiates PCP Psychiatric Medication Other Unknown None Pending Of the 17 decedents involved in 2017 OIS-Hit incidents, 12 of which have completed toxicology examinations by the Los Angeles County Department of Medical Examiner Coroner, 10 individuals, representing 83 percent of those completed cases, had positive results for alcohol and/or a controlled substance(s). Toxicology reports for five decedents, or 29 percent of the 17 total decedents, are pending from the Los Angeles County Department of Medical Examiner Coroner s Office. The partial 2017 percentage of completed cases with positive alcohol and/or a controlled substance results, representing 83 percent, accounted for a six percentage point decrease compared to 89 percent of positive cases in When compared to the aggregate percentage of decedents with positive toxicology results for alcohol and/or a controlled substance(s) during OIS-Hit incidents from 2013 through 2016 of 77 percent, 2016 experienced a six percentage point increase. As of year-end 2017, toxicology results for five decedents involved in OIS-Hit incidents for the year were unavailable due to pending toxicology reports from the Los Angeles County Department of Medical Examiner Coroner. In 2017, five of the 12 OIS-Hit decedents with completed toxicology examinations, or 42 percent, had positive results for alcohol. This partial 2017 percentage accounted for a 37 percentage point increase compared to five percent of decedents with positive alcohol results in 2016 OIS-Hit incidents. Historically, 12 of the 73 decedents involved in 2013 through 2016 OIS-Hit incidents, representing 16 percent, had positive toxicology results for alcohol. In 2017, five of the 12 OIS-Hit decedents with completed toxicology examinations, or 42 percent, had positive results for methamphetamine. This partial 2017 percentage accounted for an 11 percentage point decrease compared to 53 percent of decedents with positive methamphetamine results in 2016 OIS-Hit incidents. Historically, 32 of the 73 decedents involved in 2013 through 2016 OIS-Hit incidents, representing 44 percent, had positive toxicology results for methamphetamine. In 2017, four of the 12 OIS-Hit decedents with completed toxicology examinations, or 33 percent, had positive results for marijuana. This partial 2017 percentage accounted for Substance Alcohol 13% 22% 24% 5% N/A Cocaine 13% 28% 5% 0% N/A Marijuana 40% 33% 43% 47% N/A Methamphetamine 40% 28% 52% 53% N/A Opiates 0% 6% 0% 0% N/A PCP 0% 0% 5% 0% N/A Psychiatric Medication 13% 11% 5% 0% N/A Other 0% 0% 0% 0% N/A Unknown 7% 6% 0% 0% N/A None 27% 28% 24% 11% N/A a 14 percentage point decrease compared to 47 percent of decedents with positive marijuana results in 2016 OIS- Hit incidents. Historically, 30 of the 73 decedents involved in 2013 through 2016 OIS-Hit incidents, representing 41 percent, had positive toxicology results for marijuana. One decedent, representing eight percent of the 12 OIS-Hit decedents with completed toxicology examinations, had a positive result for opiates. Two decedents, or 17 percent, had positive results for psychiatric medication. Two decedents, or 17 percent, had negative toxicology results for alcohol and/or controlled substances USE OF FORCE YEAR-END REVIEW LOS ANGELES POLICE DEPARTMENT 189
96 {CUOF INCIDENTS OIS-HIT} SUSPECT HOMELESS 24 YES NO UNK SUSPECT WEAPON/FORCE Homeless Yes N/A N/A N/A 1 3 No N/A N/A N/A Unknown N/A N/A N/A 0 0 Total In 2017, three of the 31 total suspects, or approximately 10 percent, involved in OIS-Hit incidents were homeless. This accounted for a six percentage point increase compared to four percent in From 2016 through 2017, homeless suspects involved in OIS-Hit incidents accounted for four of the 59 total suspects, or seven percent. devices utilized by suspects during OIS-Hit incidents from 2013 through 2016 of two percent, 2017 experienced an 11 percentage point increase. Historically, from 2013 through 2017, impact devices were the fifth most utilized weapon type by suspects during OIS-Hit incidents, representing seven of the 157 total weapons, or four percent. In 2017, three suspects were perceived to be armed with a weapon (perception-based shooting), which represented approximately 10 percent of the 31 total weapon types. This accounted for a six percentage point increase compared to four percent in When compared to the aggregate percentage of perception-based OIS- Hit incidents from 2013 through 2016 of seven percent, 2017 experienced a three percentage point increase. Historically, from 2013 through 2017, perception-based OIS-Hit incidents were the third most represented among the various weapon categories (along with replica/pellet gun-related incidents), with 12 of the 157 total weapon classifications, or eight percent. In 2017, three replica/pellet guns were utilized by suspects during OIS-Hit incidents, which represented approximately 10 percent of the 31 total weapon types. This accounted for a one percentage point decrease compared to 11 percent in When compared to the aggregate percentage of replica/pellet guns utilized by suspects during OIS-Hit incidents from 2013 through 2016 of seven percent, 2017 experienced a three percentage point increase. Historically, from 2013 through 2017, replica/pellet guns were the third most utilized weapon type by suspects during OIS-Hit incidents (along with perception-based shooting incidents), with 12 of the 157 total weapon classifications, or eight percent. Weapon Type AUTO Automobile EDGED Edged Weapon FARM Firearm SUSPECT INJURIES IMPACT Impact Device PERCP Perception PHYS Physical Force INJ REPL Replica/Pellet OTH Other UNK Unknown DEC NONE None Total Category Injured Deceased Total In 2017, 15 firearms were utilized by suspects during OIS- Hit incidents, which represented 48 percent of the 31 total weapon types. This accounted for a nine percentage point decrease compared to 57 percent in When compared to the aggregate percentage of firearms utilized by suspects during OIS-Hit incidents from 2013 through 2016 of 50 percent, 2017 experienced a two percentage point decrease. Historically, from 2013 through 2017, firearms were the most utilized weapon type by suspects during OIS-Hit incidents, representing 78 of the 157 total weapons, or 50 percent. In 2017, six edged weapons were utilized by suspects during OIS-Hit incidents, which represented 19 percent of the 31 total weapon types. This accounted for a one percentage point increase compared to 18 percent in When compared to the aggregate percentage of edged weapons utilized by suspects during OIS-Hit incidents from 2013 through 2016 of 22 percent, 2017 experienced a three percentage point decrease. Historically, from 2013 through 2017, edged weapons were the second most utilized weapon type by suspects during OIS-Hit incidents, representing 34 of the 157 total weapons, or 22 percent. In 2017, four impact devices were utilized by suspects during OIS-Hit incidents, which represented 13 percent of the 31 total weapon types. This accounted for an increase of four impact devices when compared to zero in When compared to the aggregate percentage of impact In 2017, 17 suspects died from police gunfire. When compared to the 2016 total of 19, the number of deceased suspects decreased by two individuals, or 11 percent, in When compared to the 2013 through 2016 annual average of deceased suspects, 2017 was 1.25 decedents, or seven percent, below the four-year annual average. Historically, from 2013 through 2017, an average of 18 suspects died from police gunfire each year. In 2017, 14 suspects sustained injuries from police gunfire. When compared to the 2016 total of nine, the number of injured suspects increased by five individuals, or 56 percent, in When compared to the 2013 through 2016 annual average of involved injured suspects, 2017 was 0.75 injured suspects above the four-year annual average. Historically, from 2013 through 2017, an average of 13.4 suspects sustained non-fatal injuries from police gunfire each year. 24 The Department was directed by the BOPC to track homeless data for suspects involved in CUOF incidents starting in Force Investigation Division has since implemented new procedures to capture this statistic USE OF FORCE YEAR-END REVIEW LOS ANGELES POLICE DEPARTMENT 191
97 {CUOF INCIDENTS OIS-HIT} ETHNICITY OF DECEASED SUSPECTS DEPARTMENT ADJUDICATION 25 TACTICAL DEBRIEF/IN-POLICY (NO FURTHER ACTION) AM IND ASN BLK FILIP HISP WHT OTH Ethnicity American Indian Asian/Pacific Islander Black Filipino Hispanic White Other Total TAC D&E N-LETH L-LETH LETH Category Tactics N/A Drawing & Exhibiting N/A Non-Lethal N/A Less Lethal N/A Lethal N/A Total N/A One suspect involved in a 2016 OIS-Hit incident died from a self-inflicted gunshot wound and was not included in the analysis below. Of the 17 decedents involved in OIS-Hit incidents in 2017, 10 individuals, or 59 percent, were Hispanic. This accounted for a four percentage point decrease compared to 63 percent in When compared to the aggregate percentage of involved deceased Hispanic suspects from OIS-Hit incidents from 2013 through 2016 of 55 percent, 2017 experienced a four percentage point increase. Historically, from 2013 through 2017, a majority of deceased suspects involved in OIS-Hit incidents were Hispanic, representing 50 of the 90 total decedents, or 56 percent. Of the 17 decedents involved in OIS-Hit incidents in 2017, six individuals, or 35 percent, were White. This accounted for a 30 percentage point increase compared to five percent in When compared to the aggregate percentage of involved deceased White suspects from OIS-Hit incidents from 2013 through 2016 of 12 percent, 2017 experienced a 23 percentage point increase. Historically, from 2013 through 2017, White suspects accounted for the third highest ethnic decedent count, representing 15 of the 90 total decedents, or 17 percent. Of the 17 decedents involved in OIS-Hit incidents in 2017, one individual, or six percent, was Black. This accounted for a 20 percentage point decrease compared to 26 percent in When compared to the aggregate percentage of involved deceased Black suspects from OIS-Hit incidents from 2013 through 2016 of 29 percent, 2017 experienced a 23 percentage point decrease. Historically, from 2013 through 2017, Black suspects accounted for the second highest ethnic decedent count, representing 22 of the 90 total decedents, or 24 percent. In 2016, 17 out of the 36 total OIS-Hit Tactics findings, representing 47 percent, were adjudicated as Tactical Debrief. This accounted for a 19 percentage point decrease compared to 66 percent in When compared to the aggregate percentage of Tactical Debrief findings from 2013 through 2015 of 84 percent, 2016 experienced a 37 percentage point decrease. Historically, from 2013 through 2016, a majority of adjudicated Tactics findings resulted in a Tactical Debrief outcome, representing 186 of the 237 total Tactics findings, or 78 percent. In 2016, 36 out of the 36 total OIS-Hit Drawing/Exhibiting findings, representing 100 percent, were adjudicated as In Policy (No Further Action). This accounted for a 1.6 percentage point increase compared to 98.4 percent in When compared to the aggregate percentage of In Policy (No Further Action) findings from 2013 through 2015 of 99.5 percent, 2016 experienced a 0.5 percentage point increase. Historically, from 2013 through 2016, a majority of adjudicated Drawing/Exhibiting findings resulted in an In Policy (No Further Action) outcome, representing 236 of the 237 total Drawing/Exhibiting findings, or 99.6 percent. In 2016, 32 out of the 36 total OIS-Hit Lethal force findings, representing 88.9 percent, were adjudicated as In Policy (No Further Action). This accounted for a 1.8 percentage point increase compared to 87.1 percent in When compared to the aggregate percentage of In Policy (No Further Action) findings from 2013 through 2015 of 89.1 percent, 2016 experienced a 0.2 percentage point decrease. Historically, from 2013 through 2016, a majority of adjudicated Lethal force findings resulted in an In Policy (No Further Action) outcome, representing 211 of the 237 total findings, or 89 percent. 25 Adjudication data for 2017 was omitted from this Report since a vast majority of the CUOF incidents will be adjudicated by the BOPC in USE OF FORCE YEAR-END REVIEW LOS ANGELES POLICE DEPARTMENT 193
98 {CUOF INCIDENTS OIS-NO HIT} ADMINISTRATIVE DISAPPROVAL/OUT OF POLICY (ADMINISTRATIVE DISAPPROVAL) TAC D&E N-LETH L-LETH LETH In 2016, 19 out of the 36 total OIS-Hit Tactics findings, representing 53 percent, were adjudicated as Administrative Disapproval. This accounted for a 19 percentage point increase compared to 34 percent in When compared to the aggregate percentage of Administrative Disapproval findings from 2013 through 2015 of 16 percent, 2016 experienced a 37 percentage point increase. Historically, from 2013 through 2016, 51 of the 237 total Tactics findings, representing 22 percent, resulted in an Administrative Disapproval outcome. In 2016, none of the 36 total OIS-Hit Drawing/Exhibiting findings were adjudicated as Out of Policy (Administrative Disapproval). Historically, from 2013 through 2016, only one of the 237 total Drawing/ Exhibiting findings, Category Tactics N/A Drawing & Exhibiting N/A Non-Lethal N/A Less Lethal N/A Lethal N/A Total N/A representing 0.4 percent, resulted in an Out of Policy (Administrative Disapproval) outcome. In 2016, four out of the 36 total OIS-Hit Lethal force findings, representing 11 percent, were adjudicated as Out of Policy (Administrative Disapproval). This accounted for a two percentage point decrease compared to 13 percent in When compared to the aggregate percentage of Out of Policy (Administrative Disapproval) findings from 2013 through 2015 of 11 percent, 2016 experienced no percentage point change. Historically, from 2013 through 2016, 26 of the 237 total Lethal force findings, representing 11 percent, resulted in an Out of Policy (Administrative Disapproval) outcome. OFFICER INVOLVED SHOOTING- NO HIT INCIDENTS An incident in which a Department employee intentionally discharges a firearm (excluding Warning Shot, Animal Shooting, and/or Tactical Intentional Discharge incidents). Officer Involved Shooting incidents are categorized into Hit or No Hit occurrences. ANNUAL DEPARTMENT TOTALS DEPT TTL CLASSIFICATION OF OIS-NO HIT INCIDENTS I II III IV V VI VII UNK OIS - No Hit Department Total In 2017, Department personnel were involved in 14 OIS-No Hit incidents, an increase of one incident, or approximately eight percent, compared to In the four-year period from 2013 through 2016, there were a total of 39 OIS-No Hit incidents, resulting in an annual average of 9.75 incidents. The 2017 count exceeded the 2013 through 2016 annual average by 4.25 incidents, or 44 percent. Classification I II III IV V VI VII Unknown Total In 2017, five of the 14 total OIS-No Hit incidents, or 36 percent, were categorized as Classification II shootings. This accounted for a 10 percentage point decrease compared to 46 percent in When compared to the aggregate percentage of Classification II shooting incidents from 2013 through 2016 of 41 percent, 2017 experienced a five percentage point decrease. Historically from 2013 through 2017, Classification II shooting incidents accounted for 21 of the 53 total OIS-No Hit incidents, or 40 percent. In 2017, five of the 14 total OIS-No Hit incidents, or 36 percent, were categorized as Classification V shootings. This accounted for a 28 percentage point increase Continues on page 197 Classification I II III IV V VI VII Description Suspect verified with firearm - fired at officer or 3 rd party Suspect verified with firearm - firearm in hand or position to fire (but did not fire) Perception shooting - firearm present but not drawn Perception shooting - no firearm found Suspect armed with weapon other than firearm Suspect not armed, but threat of/causing serious bodily injury or death to others Other USE OF FORCE YEAR-END REVIEW LOS ANGELES POLICE DEPARTMENT 195

99 {CUOF INCIDENTS OIS-NO HIT} Classification of OIS-No Hit Incidents continued compared to eight percent in When compared to the aggregate percentage of Classification V shooting incidents from 2013 through 2016 of 10 percent, 2017 experienced a 26 percentage point increase. Historically from 2013 through 2017, Classification V shooting incidents accounted for nine of the 53 total OIS-No Hit incidents, or 17 percent. In 2017, four of the 14 total OIS-No Hit incidents, or 29 percent, were categorized as Classification I shootings. This accounted for a six percentage point increase compared to 23 percent in When compared to the aggregate percentage of Classification I shooting incidents from 2013 through 2016 of 28 percent, 2017 experienced a one percentage point increase. Historically from 2013 through 2017, Classification I shooting incidents accounted for 15 of the 53 total OIS-No Hit incidents, or 28 percent. OIS-NO HIT INCIDENTS Geographic Areas 1 Central Area 2 Rampart Area 3 Southwest Area 4 Hollenbeck Area 5 Harbor Area 6 Hollywood Area 7 Wilshire Area 8 West Los Angeles Area 9 Van Nuys Area 10 West Valley Area 11 Northeast Area OIS-No Hit Incidents 12 77th Street Area 13 Newton Area 14 Pacific Area 15 North Hollywood Area 16 Foothill Area 17 Devonshire Area 18 Southeast Area 19 Mission Area 20 Olympic Area 21 Topanga Area Police Stations SOURCE OF ACTIVITY RCALL OBS CZN FD PRE-PLN SCALL AMB OFF DTY OTH In 2017, six of the Department s 14 OIS-No Hit incidents, or 43 percent, originated from field detentions based on officers observations (i.e. pedestrian and traffic stops). This accounted for a three percentage point decrease compared to 46 percent in When compared to the aggregate percentage of OIS-No Hit incidents resulting from field detentions based on officers observations from 2013 through 2016 of 41 percent, 2017 experienced a two percentage point increase. Historically from 2013 through 2017, field detentions based on officers observations represented the largest source category of OIS-No Hit incidents, accounting for 22 of the 53 total incidents, or 42 percent. In 2017, three of the Department s 14 OIS-No Hit incidents, or 21 percent, originated from radio calls. This accounted for a 13 percentage point increase compared to eight percent in When compared to the aggregate percentage of OIS- No Hit incidents resulting from radio calls from 2013 through 2016 of 23 percent, 2017 experienced a two percentage Source Radio Call Observation Citizen Flag Down Pre-Planned Station Call Ambush Off-Duty Other Total point decrease. Historically from 2013 through 2017, radio calls represented the second largest source category of OIS- No Hit incidents, accounting for 12 of the 53 total incidents, or 23 percent. In 2017, three of the Department s OIS-No Hit incidents, or 21 percent, originated from pre-planned activities (i.e. warrant services; parole/probation checks; etc.). This accounted for a six percentage point increase compared to 15 percent in When compared to the aggregate percentage of OIS-No Hit incidents resulting from pre-planned activities from 2013 through 2016 of approximately 15 percent, 2017 experienced a six percentage point increase. Historically from 2013 through 2017, pre-planned activities represented the third largest source category of OIS-No Hit incidents, accounting for nine of the 53 total incidents, or 17 percent. The remaining two incidents, or 14 percent, in 2017 occurred during a citizen flag down and an off-duty occurrence Map excludes UOF incidents that occurred outside of the Los Angeles city limits. Prepared by LAPD/ADSD/GIS Mapping USE OF FORCE YEAR-END REVIEW LOS ANGELES POLICE DEPARTMENT 197
100 {CUOF INCIDENTS OIS-NO HIT} BUREAU OF OCCURRENCE OPERATIONS-CENTRAL BUREAU OPERATIONS-WEST BUREAU CENT NEWT NOE RAMP HOBK Area Central Newton Northeast Rampart Hollenbeck Total HWD OLYM PAC WLA WIL Area Hollywood Olympic Pacific West Los Angeles Wilshire Total In 2017, five of the Department s OIS-No Hit incidents occurred within the geographical area of Central Bureau, which was a decrease of two incidents, or 29 percent, compared to Thirty-six percent of the Department s OIS-No Hit incidents occurred in Central Bureau (Department - 14; Central Bureau - five). In the four-year period from 2013 through 2016, 12 OIS-No Hit incidents occurred in Central Bureau, resulting in an annual average of three incidents. The Central Bureau count for 2017 exceeded the 2013 through 2016 annual average by two incidents, or 67 percent. In 2017, two of the Department s OIS-No Hit incidents occurred within the geographical area of West Bureau, which was an increase of one incident, or 100 percent, compared to Fourteen percent of the Department s OIS-No Hit incidents occurred in West Bureau (Department - 14; West Bureau - two). In the four-year period from 2013 through 2016, four OIS-No Hit incidents occurred in West Bureau, resulting in an annual average of one incident. The West Bureau count for 2017 exceeded the 2013 through 2016 annual average by one incident, or 100 percent. OPERATIONS-SOUTH BUREAU OPERATIONS-VALLEY BUREAU 77TH SOE HARB SOW Area 77th Street Southeast Harbor Southwest Total DEV FTHL MISN NHWD TOP VNYS WVAL Area Devonshire Foothill Mission North Hollywood Topanga Van Nuys West Valley Total In 2017, four of the Department s OIS-No Hit incidents occurred within the geographical area of South Bureau, which was an increase of one incident, or 33 percent, compared to Approximately 29 percent of the Department s OIS-No Hit incidents occurred in South Bureau (Department - 14; South Bureau - four). In the four-year period from 2013 through 2016, 11 OIS-No Hit incidents occurred in South Bureau, resulting in an annual average of 2.75 incidents. The South Bureau count for 2017 exceeded the 2013 through 2016 annual average by 1.25 incidents, or 45 percent. In 2017, three of the Department s OIS-No Hit incidents occurred within the geographical area of Valley Bureau, which was an increase of two incidents, or 200 percent, compared to Twenty-one percent of the Department s OIS-No Hit incidents occurred in Valley Bureau (Department - 14; Valley Bureau - three). In the four-year period from 2013 through 2016, seven OIS-No Hit incidents occurred in Valley Bureau, resulting in an annual average of 1.75 incidents. The Valley Bureau count for 2017 exceeded the 2013 through 2016 annual average by 1.25 incidents, or 71 percent USE OF FORCE YEAR-END REVIEW LOS ANGELES POLICE DEPARTMENT 199
101 {CUOF INCIDENTS OIS-NO HIT} OUTSIDE JURISDICTION DAY OF OCCURRENCE OUTSIDE Area Outside Jurisdiction In 2017, none of the Department s OIS-No Hit incidents occurred outside the Department s jurisdiction, which was a decrease of one incident, or 100 percent, compared to In the four-year period from 2013 through 2016, five OIS- No Hit incidents occurred in areas outside the Department s jurisdiction, resulting in an annual average of 1.25 incidents. The incident count for outside areas in 2017 fell below the 2013 through 2016 annual average by 1.25 incidents. MON TUE WED THUR FRI SAT SUN Day Monday Tuesday Wednesday Thursday Friday Saturday Sunday Total MONTH OF OCCURRENCE Month - OIS No Hit JAN FEB MAR APR MAY JUN JUL AUG SEP OCT NOV DEC Month January February March April May June July August September October November December Total In 2017, Monday represented the day of the week with the most OIS-No Hit incidents with four occurrences, or 29 percent. Thursday represented the second most frequent day of the week with three incidents, or 21 percent. From 2013 through 2017, Sunday represented the day with the most OIS-No Hit incidents with 10 out of the 53 total, TIME OF OCCURRENCE or 19 percent. Monday and Thursday represented the days with the least with six incidents, or 11 percent, respectively. The remaining 31 incidents, or 58 percent, were fairly evenly distributed throughout the remaining days of the week. Time of Day Total In 2017, May represented the month with the most OIS- No Hit incidents with three occurrences, or 21 percent, out of the 14 total incidents for the year. The remaining 11 incidents, or 79 percent, were fairly evenly distributed throughout the remaining months of the year. From 2013 through 2017, January represented the month with the most OIS-No Hit incidents with nine out of the 53 total incidents, or 17 percent. August represented the month with the least with no occurrences during the same five-year period. October and November had the second fewest with two incidents, or four percent, respectively. The remaining 40 incidents, or 75 percent, were fairly evenly distributed throughout the remaining months of the year. The OIS-No Hit percentage breakdown on a quarterly basis from 2013 through 2017 was as follows: January through March: 18 incidents, or 34 percent; April through June: 14 incidents, or 26 percent; July through September: 10 incidents; or 19 percent; and, October through December: 11 incidents, or 21 percent. In 2017, five OIS-No Hit incidents, or approximately 36 percent, occurred between the hours of 6 a.m. and 5:59 p.m., while nine incidents, or 64 percent, occurred between the hours of 6 p.m. and 5:59 a.m. The time distribution was similar from 2013 through 2016, where 12 OIS-No Hit incidents, or 31 percent, occurred between the hours of 6 a.m. and 5:59 p.m., and 27 incidents, or 69 percent, occurred between the hours of 6 p.m. and 5:59 a.m. The five-year annual average for 2013 through 2017 was 3.4 OIS-No Hit incidents occurring between the hours of 6 a.m. and 5:59 p.m., and 7.2 incidents between the hours of 6 p.m. and 5:59 a.m USE OF FORCE YEAR-END REVIEW LOS ANGELES POLICE DEPARTMENT 201
102 {CUOF INCIDENTS OIS-NO HIT} OFFICER INFORMATION OFFICER - ETHNICITY The officer sections below include data for all employees who received, or were pending, BOPC lethal force adjudicative findings for their involvement in OIS-No Hit incidents. In 2017, 29 Department personnel were involved in the 14 OIS-No Hit incidents throughout the year, resulting in an average of 2.1 officers per incident. This accounted for a 75 percent increase compared to an average of 1.2 officers per incident in Similarly, the 2017 officer to incident average exceeded the 2013 through 2016 aggregate annual average of 1.2 by 75 percent. AM IND ASN BLK FILIP HISP WHT OTH Ethnicity American Indian Asian/Pacific Islander Black Filipino Hispanic White Other Total OFFICER - GENDER MALE Female Male In 2017, 26 male officers were involved in OIS-No Hit incidents, which represented 90 percent of the 29 total employees. This accounted for a three percentage point decrease compared to 93 percent in The percentage of male officers involved in OIS-No Hit incidents in 2017 was eight percentage points above the Department s overall male total. When compared to the aggregate percentage of involved male personnel from 2013 through 2016 of 94 percent, 2017 experienced a four percentage point decrease. Historically, from 2013 through 2017, a majority of officers involved in OIS-No Hit incidents were male, accounting for 71 of the 77 total employees, or 92 percent. Gender Female Male Total In 2017, three female officers were involved in OIS-No Hit incidents, which represented 10 percent of the 29 total employees. This accounted for a three percentage point increase compared to seven percent in The percentage of female officers involved in OIS-No Hit incidents in 2017 was eight percentage points below the Department s overall female total. When compared to the aggregate percentage of involved female personnel from 2013 through 2016 of six percent, 2017 experienced a four percentage point increase. Historically, from 2013 through 2017, females accounted for six of the 77 total involved employees, or eight percent. In 2017, 13 Hispanic officers were involved in OIS-No Hit incidents, which represented 45 percent of the 29 total employees. This accounted for a 26 percentage point decrease compared to 71 percent in The percentage of Hispanic officers involved in OIS-No Hit incidents in 2017 was two percentage points below the Department s overall Hispanic total. When compared to the aggregate percentage of involved Hispanic personnel from 2013 through 2016 of 65 percent, 2017 experienced an 20 percentage point decrease. Historically, from 2013 through 2017, a majority of officers involved in OIS-No Hit incidents were Hispanic, accounting for 44 of the 77 total employees, or 57 percent. In 2017, 13 White officers were involved in OIS-No Hit incidents, which represented 45 percent of the 29 total employees. This accounted for an 38 percentage point increase compared to seven percent in The percentage of White officers involved in OIS-No Hit incidents in 2017 was 13 percentage points above the Department s overall White total. When compared to the aggregate percentage of involved White personnel from 2013 through 2016 Ethnicity City Population Department Personnel OIS-No Hit Personnel Asian/Pacific Isl. 12% 8% 3% Black 9% 10% 3% Hispanic 49% 47% 45% White 28% 32% 45% Other 2% 3% 3% Total 100% 100% 100% of 29 percent, 2017 experienced a 16 percentage point increase. Historically, from 2013 through 2017, White officers represented the second largest ethnic category of personnel involved in OIS-No Hit incidents, accounting for 27 of the 77 total employees, or 35 percent. The remaining three employees, or 10 percent, involved in 2017 OIS-No Hit incidents included one Asian/Pacific Islander officer, one Black officer, and one Filipino officer USE OF FORCE YEAR-END REVIEW LOS ANGELES POLICE DEPARTMENT 203
103 {CUOF INCIDENTS OIS-NO HIT} OFFICER YEARS OF SERVICE OFFICER RANK <1 >LT Years LT 1-5 Less than SGT DET PO >20 More than DO Total Rank Captain and Above Lieutenant Sergeant Detective Police Officer Detention Officer Total The following depicts the percentage of personnel involved in OIS-No Hit incidents in 2017 based on their respective years of service classifications: Less than one year of service three percent (one out of 29 total officers); 1-5 years of service seven percent (two out of 29 total officers); 6-10 years of service 31 percent (nine out of 29 total officers); years of service 34 percent (10 out of 29 total officers); and, More than 20 years of service 24 percent (seven out of 29 total officers). In 2017, there were percentage point increases in three of the five categories and decreases in two, when compared to The following depicts these changes: Less than one year of service three percentage point increase (zero percent in 2016, three percent in 2017); 1-5 years of service seven percentage point decrease (14 percent in 2016, seven percent in 2017); 6-10 years of service 26 percentage point decrease (57 percent in 2016, 31 percent in 2017); years of service 13 percentage point increase (21 percent in 2016, 34 percent in 2017); and, More than 20 years of service 17 percentage point increase (seven percent in 2016, 24 percent in 2017). In 2017, there were percentage point increases in three of the five years of service categories and decreases in two when compared to the aggregate percentage of personnel involved in OIS-No Hit incidents during the four-year period from 2013 through The following depicts these changes: Less than one year of service three percentage point increase (zero percent during four-year period, three percent in 2017); 1-5 years of service eight percentage point decrease (15 percent during four-year period, seven percent in 2017); 6-10 years of service 13 percentage point decrease (44 percent during four-year period, 31 percent in 2017); years of service one percentage point increase (33 percent during four-year period, 34 percent in 2017); and, More than 20 years of service 16 percentage point increase (eight percent during four-year period, 24 percent in 2017). Historically, from 2013 through 2017, a majority of officers involved in OIS-No Hit incidents had 6-10 years of service, accounting for 30 of the 77 total employees, or 39 percent. Officers with years of service accounted for the second largest category with a total of 26 employees, or 34 percent, during the same five-year period. Officers with more than 20 years of service were the third largest group, with 11 personnel, or 14 percent, followed by officers with 1-5 years of service, which had nine officers, or 12 percent. Officers with less than one year of service, which represented only one officer, accounted for one percent of the total. In 2017, 29 employees at the rank of police officer were involved in OIS-No Hit incidents, which represented 100 percent of all involved employees. This accounted for a 14 percentage point increase compared to 86 percent in The percentage of police officers involved in OIS-No Hit incidents in 2017 was 32 percentage points above the Department s overall police officer total. When compared to the aggregate percentage of involved personnel at the rank of police officer from 2013 through 2016 of approximately 88 percent, 2017 experienced a 12 percentage point increase. Historically, from 2013 through 2017, a majority of personnel involved in OIS-No Hit incidents were at the rank of police officer, accounting for 71 of the 77 total employees, or 92 percent USE OF FORCE YEAR-END REVIEW LOS ANGELES POLICE DEPARTMENT 205
104 {CUOF INCIDENTS OIS-NO HIT} OFFICER AREA/DIVISION OF ASSIGNMENT Division/Area/Bureau 77th Street Central TH Devonshire CENT Foothill DEV Harbor FTHL Hollenbeck HARB Hollywood HOBK Mission HWD Newton MISN North Hollywood NEWT Northeast NHWD Olympic NOE Pacific OLYM Rampart PAC Southeast RAMP Southwest SOE SOW Topanga TOP Van Nuys VNYS West Los Angeles WLA West Valley WVAL Wilshire WIL All Traffic Divisions TRFC Administrative Units ADMIN Specialized Units SPCL Bureau Level BUREAU Metropolitan METRO Security Services SSD Other Areas Total In 2017, two personnel assigned to Southwest Division were involved in OIS-No Hit incidents, which represented seven percent of the 29 total employees. This accounted for an increase of two personnel compared to zero in When compared to the aggregate percentage of involved personnel assigned to Southwest Division from 2013 through 2016 of four percent, 2017 experienced a three percentage point increase. Historically, from 2013 through 2017, personnel assigned to Southwest Division accounted for four of the 77 total employees involved in OIS-No Hit incidents, or five percent. The remaining nine Department personnel involved in 2017 OIS-No Hit incidents, representing 31 percent, were fairly evenly distributed amongst the remaining Areas/Divisions. The following is the employee Bureau assignment for the 29 total personnel involved in OIS-No Hit incidents in 2017: Central Bureau: one employee, or three percent; West Bureau: two personnel, or seven percent; South Bureau: four personnel, or 14 percent; Valley Bureau: four personnel, or 14 percent; CTSOB: 16 personnel, or 55 percent; and, Other: two personnel, or seven percent. In 2017, there were percentage point increases in three of the six Bureau categories and decreases in three, when compared to The following depicts these changes: Central Bureau: 40 percentage point decrease (43 percent in 2016, three percent in 2017); West Bureau: seven percentage point increase (zero percent in 2016, seven percent in 2017); South Bureau: seven percentage point decrease (21 percent in 2016, 14 percent in 2017); Valley Bureau: seven percentage point increase (seven percent in 2016, 14 percent in 2017); CTSOB: 41 percentage point increase (14 percent in 2016, 55 percent in 2017); and, Other: seven percentage point decrease (14 percent in 2016, seven percent in 2017). In 2017, there were percentage point decreases in four of the six Bureau categories and increases in two, when compared to their respective aggregate percentages during the four-year period from 2013 through The following depicts these changes: Central Bureau: 22 percentage point decrease (25 percent during four-year period, three percent in 2017); West Bureau: seven percentage point increase (zero percent during four-year period, seven percent in 2017); South Bureau: 15 percentage point decrease (29 percent during four-year period, 14 percent in 2017); Valley Bureau: one percentage point decrease (15 percent during four-year period, 14 percent in 2017); CTSOB: 45 percentage point increase (10 percent during four-year period, 55 percent in 2017); and, Other: 12 percentage point decrease (19 percent during four-year period, seven percent in 2017). In 2017, 16 personnel assigned to Metropolitan Division were involved in OIS-No Hit incidents, which represented 55 percent of the 29 total employees. This accounted for a 41 percentage point increase compared to 14 percent in When compared to the aggregate percentage of involved personnel assigned to Metropolitan Division from 2013 through 2016 of 10 percent, 2017 experienced a 45 percentage point increase. Historically, from 2013 through 2017, a majority of officers involved in OIS-No Hit incidents were assigned to Metropolitan Division, accounting for 21 of the 77 total employees, or 27 percent. In 2017, two personnel assigned to 77th Street Division were involved in OIS-No Hit incidents, which represented seven percent of the 29 total employees. This accounted for a seven percentage point decrease compared to 14 percent in When compared to the aggregate percentage of involved personnel assigned to 77th Street Division from 2013 through 2016 of 21 percent, 2017 experienced a 14 percentage point decrease. Historically, from 2013 through 2017, 77th Street Division accounted for the second highest involved personnel count with 12 of the 77 total employees, or 16 percent USE OF FORCE YEAR-END REVIEW LOS ANGELES POLICE DEPARTMENT 207
105 {CUOF INCIDENTS OIS-NO HIT} OFFICER UNIT OF ASSIGNMENT OFFICER INJURIES ADMIN METRO PATROL SPCL INV CSD OTH In 2017, 16 personnel assigned to Metropolitan Division were involved in OIS-No Hit incidents, which represented 55 percent of the 29 total personnel. This accounted for a 41 percentage point increase compared to 14 percent in When compared to the aggregate percentage of involved personnel assigned to Metropolitan Division from 2013 through 2016 of 10 percent, 2017 experienced a 45 percentage point increase. Historically, from 2013 through 2017, personnel assigned to Metropolitan Division accounted for the third largest category of personnel involved in OIS-No Hit incidents, representing 21 of the 77 total employees, or 27 percent. In 2017, nine personnel assigned to patrol were involved in OIS-No Hit incidents, which represented 31 percent of the 29 total personnel. This accounted for a 17 percentage point increase compared to 14 percent in When compared to the aggregate percentage of involved personnel assigned Unit Administrative Metropolitan Patrol Specialized Investigative Custody Other Total to patrol from 2013 through 2016 of 33 percent, 2017 experienced a two percentage point decrease. Historically, from 2013 through 2017, a majority of officers involved in OIS-No Hit incidents were assigned to patrol, accounting for 25 of the 77 total employees, or 32 percent. In 2017, four personnel assigned to specialized assignments were involved in OIS-No Hit incidents, which represented 14 percent of the 29 total personnel. This represented no change when compared to the same percentage in When compared to the aggregate percentage of involved personnel assigned to specialized assignments from 2013 through 2016 of approximately 38 percent, 2017 experienced a 24 percentage point decrease. Historically, from 2013 through 2017, personnel assigned to specialized assignments accounted for the second largest category of personnel involved in OIS-No Hit incidents, representing 22 of the 77 total employees, or 29 percent. INJ DEC No Department personnel were killed during or resulting from OIS-No Hit incidents during the five-year period from 2013 through However, 14 officers sustained injuries during the same five-year period. In 2017, five officers sustained injuries during the 14 OIS- No Hit incidents throughout the year. This accounted for NUMBER OF OFFICERS FIRING PER INCIDENT > Category Injured Deceased Total a 150 percent increase compared to two injured officers in Additionally, when compared to the 2013 through 2016 annual average of 2.25 injured officers, 2017 was 2.75 injured officers, or 122 percent, above the four-year annual average. No. of Shooters or more Total In 2017, there were 12 single shooter OIS-No Hit incidents, which represented 86 percent of the 14 total incidents. This accounted for a six percentage point decrease compared to 92 percent in When compared to the aggregate percentage of single shooter OIS-No Hit incidents from 2013 through 2016 of 79 percent, 2017 experienced a seven percentage point increase. The remaining two incidents, representing seven percent respectively, were instances in which four shooters and 11 or more shooters were involved. Both incidents were the only OIS-No Hit occurrences in their respective categories during the five-year period from 2013 through USE OF FORCE YEAR-END REVIEW LOS ANGELES POLICE DEPARTMENT 209
106 {CUOF INCIDENTS OIS-NO HIT} OFFICER WEAPON SYSTEM ANNUAL AVERAGE OF ROUNDS FIRED PER INCIDENT HGUN OIS - No Hit Average Rounds SGUN Weapon Type AVG RNDS Handgun RIFLE Shotgun Rifle Total In 2017, an average of 11.2 rounds were fired during OIS- No Hit incidents. When compared to the 2016 average of 2.5 rounds fired, 2017 experienced an increase of 8.7 rounds, or 348 percent. Additionally, when compared to the 2013 through 2016 annual average of 5.2 rounds fired per incident, 2017 was six rounds, or 115 percent, above the four-year annual average. In 2017, 20 handguns were utilized during OIS-No Hit incidents, which represented 69 percent out of the 29 total weapon types. This accounted for a 31 percentage point decrease compared to 100 percent in When compared to the aggregate percentage of handguns utilized during OIS-No Hit incidents from 2013 through 2016 of 90 percent, 2017 experienced a 21 percentage point decrease. Historically, from 2013 through 2017, handguns were the most utilized weapon type during OIS-No Hit incidents, accounting for 65 of the 79 total weapons, or 82 percent. TOTAL NUMBER OF ROUNDS FIRED BY OFFICERS PER YEAR TTL RNDS In 2017, nine rifles were utilized during OIS-No Hit incidents, which represented 31 percent out of the 29 total weapon types. This accounted for a 31 percentage point increase compared to zero percent in When compared to the aggregate percentage of rifles utilized during OIS-No Hit incidents from 2013 through 2016 of four percent, 2017 experienced a 27 percentage point increase. Historically, from 2013 through 2017, rifles were the second most utilized weapon type during OIS-No Hit incidents, accounting for 11 of the 79 total weapons, or 14 percent. OIS - No Hit Total Rounds In 2017, 157 rounds were fired during all 14 OIS-No Hit incidents. When compared to the 2016 total of 32 rounds fired, 2017 experienced an increase of 125 rounds, or 391 percent. Additionally, when compared to the 2013 through 2016 annual average of 51 rounds fired, 2017 was 106 rounds, or 208 percent, above the four-year annual average. TOTAL NUMBER OF ROUNDS FIRED BY OFFICERS PER WEAPON SYSTEM HGUN SGUN RIFLE In 2017, 88 rounds were fired from rifles during OIS-No Hit incidents, which represented 56 percent of the 157 total rounds fired. This accounted for a 56 percentage point increase compared to zero percent in When compared to the aggregate percentage of rounds fired from rifles during OIS-No Hit incidents from 2013 through 2016 of three percent, 2017 experienced a 53 percentage point increase. Historically from 2013 through 2017, rounds fired from rifles were the second most frequent round type fired during OIS-No Hit incidents, accounting for 94 of the 361 total rounds, or 26 percent. Weapon Type Handgun Shotgun Rifle Total In 2017, 69 rounds were fired from handguns during OIS- No Hit incidents, which represented 44 percent of the 157 total rounds fired. This accounted for a 56 percentage point decrease compared to 100 percent in When compared to the aggregate percentage of rounds fired from handguns during OIS-No Hit incidents from 2013 through 2016 of 95 percent, 2017 experienced a 51 percentage point decrease. Historically, from 2013 through 2017, rounds fired from handguns were the most frequent round type fired during OIS-No Hit incidents, accounting for 263 of the 361 total rounds, or 73 percent USE OF FORCE YEAR-END REVIEW LOS ANGELES POLICE DEPARTMENT 211
107 {CUOF INCIDENTS OIS-NO HIT} NUMBER OF ROUNDS FIRED PER INCIDENT BY OFFICERS SUSPECT INFORMATION > No. of Rounds or more Total The suspect sections below include data for all individuals that Department personnel applied force against during OIS-No Hit incidents. SUSPECT ETHNICITY AM IND ASN BLK FILIP HISP WHT OTH UNK Ethnicity American Indian Asian/Pacific Islander Black Filipino Hispanic White Other Unknown Total In 2017, there were 11 OIS-No Hit incidents in which 1-5 rounds were fired, which represented 79 percent of the 14 total incidents. This accounted for a 13 percentage point decrease compared to 92 percent in However, when compared to the aggregate percentage of incidents in which 1-5 rounds were fired during OIS-No Hit incidents from 2013 through 2016 of 74 percent, 2017 experienced a five percentage point increase. In 2017, there was one OIS-No Hit incident in which rounds were fired, which represented seven percent of the 14 total incidents. This accounted for a seven percentage point increase compared to zero percent in However, when compared to the aggregate percentage of incidents in which rounds were fired during OIS-No Hit incidents from 2013 through 2016 of 10 percent, 2017 experienced a three percentage point decrease. In 2017, there was one OIS-No Hit incident in which rounds were fired, which represented seven percent of the 14 total incidents. This accounted for a seven percentage point increase compared to zero percent in In addition, when compared to the aggregate percentage of incidents in which rounds were fired during OIS-No Hit incidents from 2013 through 2016 of five percent, 2017 experienced a two percentage point increase. In 2017, there was one OIS-No Hit incident in which 51 or more rounds were fired, which represented seven percent of the 14 total incidents. This accounted for the only incident in this respective category during the five-year period from 2013 through In 2017, eight Hispanic suspects were involved in OIS- No Hit incidents, which represented 53 percent of the 15 total suspects. This accounted for a nine percentage point decrease compared to 62 percent in The percentage of Hispanic suspects involved in OIS-No Hit incidents in 2017 was four percentage points above the City s overall Hispanic population total. Additionally, the percentage of Hispanic suspects involved in OIS-No Hit incidents in 2017 was 13 percentage points above the City s overall Hispanic violent crime offender total. When compared to the aggregate percentage of involved Hispanic suspects from 2013 through 2016 of 41 percent, 2017 experienced a 12 percentage point increase. Historically, from 2013 through 2017, the Hispanic category was the most represented ethnic group involved in OIS-No Hit incidents with 24 of the 54 total suspects, or 44 percent. In 2017, five Black suspects were involved in OIS-No Hit incidents, which represented 33 percent of the 15 total suspects. This accounted for a two percentage point increase compared to 31 percent in The percentage of Black suspects involved in OIS-No Hit incidents in 2017 was 24 percentage points above the City s overall Black population total. However, the percentage of Black suspects involved in OIS-No Hit incidents in 2017 was 11 percentage points below the City s overall Black violent crime offender total. When compared to the aggregate percentage of involved Black suspects from 2013 through 2016 of 44 percent, 2017 experienced an 11 percentage point decrease. Historically, from 2013 through 2017, the Black category was the second most represented ethnic group involved in OIS-No Hit incidents with 22 of the 54 total suspects, or 41 percent. Ethnicity City Population Violent Crime Suspect OIS-No Hit Suspect Asian/Pacific Isl. 12% (See Other) 0% Black 9% 44% 33% Hispanic 49% 40% 53% White 28% 8% 7% Other 2% 3% 0% Unknown DNA 5% 7% Total 100% 100% 100% In 2017, one White suspect was involved in a OIS-No Hit incident, which represented seven percent of the 15 total suspects. This accounted for an increase of one White suspect compared to The percentage of White suspects involved in OIS-No Hit incidents in 2017 was 21 percentage points below the City s overall White population total. Additionally, the percentage of White suspects involved in OIS-No Hit incidents in 2017 was one percentage point below the City s overall White violent crime offender total. When compared to the aggregate percentage of involved White suspects from 2013 through 2016 of 10 percent, 2017 experienced a three percentage point decrease. Historically, from 2013 through 2017, the White category was the third most represented ethnic group involved in OIS-No Hit incidents with five of the 54 total suspects, or nine percent. One suspect, representing seven percent, had an Unknown ethnicity classification, pending completion of the investigation by FID USE OF FORCE YEAR-END REVIEW LOS ANGELES POLICE DEPARTMENT 213
108 {CUOF INCIDENTS OIS-NO HIT} SUSPECT GENDER SUSPECT AGE Female Male Unknown In 2017, 13 male suspects were involved in OIS-No Hit incidents, which represented 87 percent of the 15 total suspects. This accounted for a five percentage point decrease compared to 92 percent in When compared to the aggregate percentage of involved male suspects from 2013 through 2016 of 97 percent, 2017 experienced a 10 percentage point decrease. Historically, from 2013 through 2017, a majority of suspects involved in OIS-No Hit incidents were male, representing 51 of the 54 total suspects, or 94 percent. SUSPECT PERCEIVED MENTAL ILLNESS YES NO UNK Gender Female Male Unknown Total In 2017, one female suspect was involved in an OIS-No Hit incident, which represented approximately seven percent of the 15 total suspects. The individual in this gender category was the only involved OIS-No Hit female suspect during the five-year period from 2013 through The remaining suspect, representing seven percent, currently has an Unknown gender designation, pending completion of the investigation by FID. Per. Mental Illness Yes No Unknown Total >59 UNK In 2017, OIS-No Hit suspects within the age group accounted for five of the 15 total suspects, or 33 percent. The age category accounted for a 21 percentage point decrease compared to 54 percent in When compared to the aggregate percentage of involved suspects within the age range from 2013 through 2016 of 38 percent, 2017 experienced a five percentage point decrease. Historically, from 2013 through 2017, the age group represented the largest age category of suspects involved in OIS-No Hit incidents with 20 of the 54 total suspects, or 37 percent. In 2017, OIS-No Hit suspects within the age group accounted for five of the 15 total suspects, or 33 percent. The age category accounted for a 25 percentage point increase compared to eight percent in When compared to the aggregate percentage of involved suspects within the age range from 2013 through 2016 of 15 percent, 2017 experienced an 18 percentage point increase. Historically, from 2013 through 2017, the 30- Age and Above Unknown Total age group represented the second largest age category of suspects involved in OIS-No Hit incidents with 11 of the 54 total suspects, or 20 percent. In 2017, OIS-No Hit suspects within the age group accounted for two of the 15 total suspects, or 13 percent. The age category accounted for a two percentage point decrease compared to 15 percent in When compared to the aggregate percentage of involved suspects within the age range from 2013 through 2016 of 18 percent, 2017 experienced a five percentage point decrease. Historically, from 2013 through 2017, the age group represented the third largest age category of suspects involved in OIS-No Hit incidents with nine of the 54 total suspects, or 17 percent. The three remaining suspects, or 20 percent, in 2017 were in the age ranges of 40-49, 50-59, and one with an Unknown age designation. In 2017, four of the 15 total suspects, or 27 percent, involved in OIS-No Hit incidents were perceived to suffer from a mental illness and/or a mental health crisis. This accounted for an increase of four perceived mentally ill and/or mentally distressed suspects involved in OIS-No Hit incidents compared to When compared to the aggregate percentage of involved suspects who were perceived to suffer from a mental illness and/or a mental health crisis from 2013 through 2016 of 15 percent, 2017 experienced a 12 percentage point increase. Historically from 2013 through 2017, suspects who were perceived to suffer from a mental illness and/or a mental health crisis accounted for 10 of the 54 total suspects, or 19 percent. SUSPECT GANG MEMBERSHIP Pursuant to California Assembly Bill 90, the Fair and Accurate Gang Database Act of 2017, Department resources housing gang membership information were temporarily disabled effective January 1, As such, the Department was unable to determine whether suspects involved in UOF incidents were designated as gang members USE OF FORCE YEAR-END REVIEW LOS ANGELES POLICE DEPARTMENT 215
109 {CUOF INCIDENTS OIS-NO HIT} SUSPECT HOMELESS 27 SUSPECT WEAPON/FORCE YES NO UNK None of the suspects involved in 2017 OIS-No Hit incidents were homeless. Homeless Yes N/A N/A N/A 1 0 No N/A N/A N/A Unknown N/A N/A N/A 2 3 Total AUTO EDGED FARM IMPACT PERCP PHYS REPL OTH NONE Weapon Type Automobile Edged Weapon Firearm Impact Device Perception Physical Force Replica/Pellet Other None Total SUSPECT INJURIES INJ DEC UNK From 2013 through 2017, no suspects involved in OIS-No Hit incidents died or sustained injuries as a direct result of police gunfire. The data, however, reflects 13 injuries and one death (caused by a fatal self-inflicted gunshot wound) sustained by suspects by causes other than police gunfire during the same five-year period. Category Injured Deceased Unknown Total In 2017, six suspects, representing 40 percent of the 15 total suspects, sustained injuries during OIS-No Hit incidents from causes other than police gunfire. One suspect, representing seven percent of the 15 total suspects, currently has an unknown injury designation pending completion of the investigation by FID. In 2017, nine firearms were utilized by suspects during OIS- No Hit incidents, which represented 60 percent of the 15 total weapon types. This accounted for a nine percentage point decrease compared to 69 percent in When compared to the aggregate percentage of firearms utilized by suspects during OIS-No Hit incidents from 2013 through 2016 of 72 percent, 2017 experienced a 12 percentage point decrease. Historically, from 2013 through 2017, firearms were the most utilized weapon type by suspects during OIS-No Hit incidents, representing 37 of the 54 total weapons, or 69 percent. In 2017, three edged weapons were utilized by suspects during OIS-No Hit incidents, which represented 20 percent of the 15 total weapon types. This accounted for an increase of three edged weapon-related incidents compared to When compared to the aggregate percentage of edged weapons utilized by suspects during OIS-No Hit incidents from 2013 through 2016 of three percent, 2017 experienced a 17 percentage point increase. Historically, from 2013 through 2017, edged weapons accounted for four of the 54 total suspect weapon types, or seven percent, utilized during OIS-No Hit incidents. The three remaining suspect weapon types, representing 20 percent, involved in 2017 OIS-No Hit incidents were two automobiles and one replica/pellet gun. 27 The Department was directed by the BOPC to track homeless data for suspects involved in CUOF incidents starting in Force Investigation Division has since implemented new procedures to capture this statistic USE OF FORCE YEAR-END REVIEW LOS ANGELES POLICE DEPARTMENT 217
110 {CUOF INCIDENTS OIS-NO HIT} DEPARTMENT ADJUDICATION 28 TACTICAL DEBRIEF/IN-POLICY (NO FURTHER ACTION) ADMINISTRATIVE DISAPPROVAL/OUT OF POLICY (ADMINISTRATIVE DISAPPROVAL) Category TAC Tactics N/A TAC D&E Drawing & Exhibiting N/A D&E N-LETH Non-Lethal N/A N-LETH L-LETH Less Lethal N/A LETH L-LETH Lethal N/A LETH-NO Lethal-No Findings N/A LETH Total N/A Category Tactics N/A Drawing & Exhibiting N/A Non-Lethal N/A Less Lethal N/A Lethal N/A Total N/A In 2016, six of the 14 total OIS-No Hit Tactics findings, representing 43 percent, were adjudicated as Tactical Debrief. This represented no change when compared to the same percentage of Tactical Debrief Tactics findings in When compared to the aggregate percentage of Tactical Debrief findings from 2013 through 2015 of 56 percent, 2016 experienced a 13 percentage point decrease. Historically, from 2013 through 2016, a majority of adjudicated Tactics findings resulted in a Tactical Debrief outcome, accounting for 25 of the 48 total Tactics findings, or 52 percent. In 2016, 14 out of the 14 total OIS-No Hit Drawing/Exhibiting findings, representing 100 percent, were adjudicated as In Policy (No Further Action). Historically, from 2013 through 2016, all adjudicated Drawing/Exhibiting findings resulted in an In Policy (No Further Action) outcome. In 2016, the lethal force in one OIS-No Hit incident resulted in a No Findings decision by the BOPC. As such, 13 total Lethal force findings were rendered for the year. 29 Of those 13 findings, 11, or 85 percent, were adjudicated as In Policy (No Further Action). This accounted for a six percentage point increase compared to 79 percent in When compared to the aggregate percentage of In Policy (No Further Action) Lethal force findings from 2013 through 2015 of 76 percent, 2016 experienced a nine percentage point increase. Historically, from 2013 through 2016, a majority of adjudicated Lethal force findings resulted in an In Policy (No Further Action) outcome, accounting for 37 of the 47 total findings, or 79 percent. In 2016, eight out of the 14 total OIS-No Hit Tactics findings, representing 57 percent, were adjudicated as Administrative Disapproval. This represented no change when compared to the same percentage of Administrative Disapproval Tactics findings in When compared to the aggregate percentage of Administrative Disapproval Tactics findings from 2013 through 2015 of 44 percent, 2016 experienced a 13 percentage point increase. Historically, from 2013 through 2016, 23 of the 48 total Tactics findings, representing 48 percent, resulted in an Administrative Disapproval outcome. In the four-year period from 2013 through 2016, none of the 48 total OIS-No Hit Drawing/Exhibiting findings were adjudicated as Out of Policy (Administrative Disapproval). In 2016, the lethal force in one OIS-No Hit incident resulted in a No Findings decision by the BOPC. As such, 13 total Lethal force findings were rendered for the year. Of those 13 findings, two, or 15 percent, were adjudicated as Out of Policy (Administrative Disapproval). This accounted for a six percentage point decrease compared to 21 percent in When compared to the aggregate percentage of Out of Policy (Administrative Disapproval) Lethal force findings from 2013 through 2015 of 24 percent, 2016 experienced a nine percentage point decrease. Historically, from 2013 through 2016, 10 of the 47 total Lethal force findings, representing 21 percent, resulted in an Out of Policy (Administrative Disapproval) outcome. 28 Adjudication data for 2017 was omitted from this Report since a vast majority of the CUOF incidents will be adjudicated by the BOPC in The Department s statute of limitations for adjudication of a CUOF incident is one year from the date of incident. When the case is heard by the BOPC for adjudication, a quorum of three of the five BOPC members is required for a majority decision of an adjudicative finding. In this instance, the case was heard by the BOPC during two closed session meetings. However, no majority decision was reached, and thus, no adjudicative lethal force finding was rendered USE OF FORCE YEAR-END REVIEW LOS ANGELES POLICE DEPARTMENT 219
111 {CUOF INCIDENTS ANIMAL SHOOTING} ANIMAL SHOOTING INCIDENTS An incident in which a Department employee intentionally discharges a firearm at an animal. ANNUAL DEPARTMENT TOTALS 30 BUREAU OF OCCURRENCE OPERATIONS-CENTRAL BUREAU DEPT TTL OIS - Animal Department Total In 2017, Department personnel were involved in 10 Animal Shooting incidents, a decrease of four incidents, or 29 percent, compared to In the four-year period from 2013 through 2016, there were a total of 48 Animal Shooting incidents, resulting in an annual average of 12 incidents. The 2017 count fell below the 2013 through 2016 annual average by two incidents, or 17 percent. CENT NEWT NOE RAMP HOBK Area Central Newton Northeast Rampart Hollenbeck Total SOURCE OF ACTIVITY RCALL OBS CZN FD PRE-PLN SCALL AMB OFF DTY OTH Source Radio Call Observation Citizen Flag Down Pre-Planned Station Call Ambush Off-Duty Other Total In 2017, four of the Department s Animal Shooting incidents occurred within the geographical area of Central Bureau, which was an increase of one incident, or 33 percent, compared to Forty percent of the Department s Animal Shooting incidents occurred in Central Bureau (Department - 10; Central Bureau - four). In the four-year OPERATIONS-SOUTH BUREAU 77TH period from 2013 through 2016, six Animal Shooting incidents occurred in Central Bureau, resulting in an annual average of 1.5 incidents. The Central Bureau count for 2017 exceeded the 2013 through 2016 annual average by 2.5 incidents, or approximately 167 percent. In 2017, six of the Department s 10 Animal Shooting incidents, or 60 percent, originated from radio calls. This accounted for a three percentage point increase compared to 57 percent in When compared to the aggregate percentage of Animal Shooting incidents resulting from radio calls from 2013 through 2016 of 46 percent, 2017 experienced a 14 percentage point increase. Historically from 2013 through 2017, radio calls represented the largest source category of Animal Shooting incidents, accounting for 28 of the 58 total incidents, or 48 percent. In 2017, three of the Department s 10 Animal Shooting incidents, or 30 percent, originated from off-duty occurrences. This accounted for a 23 percentage point increase compared to seven percent in When compared to the aggregate percentage of Animal Shooting incidents resulting from off-duty occurrences from 2013 through 2016 of eight percent, 2017 experienced a 22 percentage point increase. Historically from 2013 through 2017, off-duty occurrences represented the fourth largest source category of Animal Shooting incidents, accounting for seven of the 58 total incidents, or 12 percent. In 2017, one of the Department s Animal Shooting incidents, representing 10 percent, originated from a preplanned activity (i.e. warrant services; parole/probation checks; etc.). This accounted for an 11 percentage point decrease compared to 21 percent in When compared to the aggregate percentage of Animal Shooting incidents resulting from pre-planned activities from 2013 through 2016 of 21 percent, 2017 experienced an 11 percentage point decrease. Historically from 2013 through 2017, preplanned activities represented the second largest source category of Animal Shooting incidents, accounting for 11 of the 58 total incidents, or 19 percent. SOE HARB SOW In 2017, four of the Department s Animal Shooting incidents occurred within the geographical area of South Bureau, which was a decrease of two incidents, or 33 percent, compared to Forty percent of the Department s Animal Shooting incidents occurred in South Bureau (Department - 10; South Area 77th Street Southeast Harbor Southwest Total Bureau - four). In the four-year period from 2013 through 2016, 21 Animal Shooting incidents occurred in South Bureau, resulting in an annual average of 5.25 incidents. The South Bureau count for 2017 fell below the 2013 through 2016 annual average by 1.25 incidents, or 24 percent. 30 A bystander was struck by a round fired by a Department employee during an Animal Shooting in This incident was classified as an Animal Shooting since the round struck the animal as intended, but travelled through it and struck the bystander who had no role in the incident USE OF FORCE YEAR-END REVIEW LOS ANGELES POLICE DEPARTMENT 221
112 {CUOF INCIDENTS ANIMAL SHOOTING} OPERATIONS-WEST BUREAU OUTSIDE JURISDICTION HWD Area OLYM Hollywood PAC Olympic OUTSIDE WLA Pacific West Los Angeles WIL Wilshire Total Area Outside Jurisdiction In 2017, one of the Department s Animal Shooting incidents occurred within the geographical area of West Bureau, a decrease of one incident, or 50 percent, compared to Ten percent of the Department s Animal Shooting incidents occurred in West Bureau (Department - 10; West Bureau - one). In the four-year period from 2013 through 2016, six Animal Shooting incidents occurred in West Bureau, resulting in an annual average of 1.5 incidents. The West Bureau count for 2017 fell below the 2013 through 2016 annual average by 0.5 incidents, or 33 percent. In 2017, one of the Department s Animal Shooting incidents occurred outside the Department s geographical jurisdiction, which remained an unchanged count compared to Ten percent of the Department s Animal Shooting incidents occurred in areas outside the Department s jurisdiction (Department - 10; Outside Areas - one). In the four-year period from 2013 through 2016, eight Animal Shooting incidents occurred in areas outside the Department s jurisdiction, resulting in an annual average of two incidents. The total incident count for outside areas in 2017 fell below the 2013 through 2016 annual average by one incident, or 50 percent. OPERATIONS-VALLEY BUREAU MONTH OF OCCURRENCE DEV FTHL MISN NHWD TOP VNYS WVAL No Animal Shooting incidents occurred in Valley Bureau in Area Devonshire Foothill Mission North Hollywood Topanga Van Nuys West Valley Total JAN FEB MAR APR MAY JUN JUL AUG SEP OCT NOV DEC Month January February March April May June July August September October November December Total In 2017, May represented the month with the most Animal Shooting incidents with five occurrences, or 50 percent, out of 10 total incidents for the year. The remaining five incidents were distributed throughout the remaining months of the year without any apparent pattern. respectively. October had the least with one incident, or two percent, during the same five-year period. The Animal Shooting percentage breakdown on a quarterly basis from 2013 through 2017 was as follows: From 2013 through 2017, May represented the month with the most Animal Shooting incidents with nine out of the 58 total incidents, or 16 percent. July and August had the second highest count with seven incidents, or 12 percent, January March: 15 incidents, or 26 percent; April June: 16 incidents, or 28 percent; July September: 19 incidents; or 33 percent; and, October December: eight incidents, or 14 percent USE OF FORCE YEAR-END REVIEW LOS ANGELES POLICE DEPARTMENT 223
113 {CUOF INCIDENTS ANIMAL SHOOTING} DAY OF OCCURRENCE OFFICER INFORMATION MON TUE WED THUR FRI SAT SUN In 2017, Friday represented the day of the week with the most Animal Shooting incidents with four out of the 10 occurrences, or 40 percent. Sunday and Monday represented the days with the least with no Animal Shooting incidents. TIME OF OCCURRENCE Day Monday Tuesday Wednesday Thursday Friday Saturday Sunday Total From 2013 through 2017, Friday represented the day with the most Animal Shooting incidents with 14 out of the 58 total, or 24 percent. Thursday had the second highest count with 10 incidents, or 17 percent. Saturday and Sunday represented the days with the least with four incidents, or seven percent, respectively. The officer sections below include data for all employees who received, or were pending, lethal force BOPC adjudicated findings for their involvement in an Animal Shooting incident. In 2017, 10 Department personnel were involved in the 10 Animal Shooting incidents throughout the year, resulting OFFICER GENDER MALE Female Male In 2017, 10 male officers were involved in Animal Shooting incidents, which represented 100 percent of the 10 total employees. This accounted for a 12 percentage point increase compared to 88 percent in The percentage of male officers involved in Animal Shooting incidents in 2017 was 18 percentage points above the Department s in an average of one officer per incident. This accounted for a nine percent decrease compared to an average of 1.1 officers per incident in Similarly, the 2017 officer to incident average fell below the 2013 through 2016 aggregate annual average of 1.1 by nine percent. Gender Female Male Total overall male total. When compared to the aggregate percentage of involved male personnel from 2013 through 2016 of 85 percent, 2017 experienced a 15 percentage point increase. Historically, from 2013 through 2017, a majority of officers involved in Animal Shooting incidents were male, accounting for 57 of the 65 total employees, or 88 percent In 2017, eight Animal Shooting incidents, or 80 percent, occurred between the hours of 6 a.m. and 5:59 p.m., while two incidents, or 20 percent, occurred between the hours of 6 p.m. and 5:59 a.m. During the four-year period from 2013 through 2016, 28 Animal Shooting incidents, or 58 percent, occurred between Time of Day Total the hours of 6 a.m. and 5:59 p.m., and 20 incidents, or 42 percent, occurred between the hours of 6 p.m. and 5:59 a.m. The five-year annual average for 2013 through 2017 was 7.2 Animal Shooting incidents occurring between the hours of 6 a.m. and 5:59 p.m., and 4.4 incidents between the hours of 6 p.m. and 5:59 a.m. OFFICER ETHNICITY AM IND ASN BLK FILIP HISP WHT OTH Ethnicity American Indian Asian/Pacific Islander Black Filipino Hispanic White Other Total In 2017, five Hispanic officers were involved in Animal Shooting incidents, which represented 50 percent of the 10 total employees. This accounted for a six percentage point decrease compared to 56 percent in The percentage of Hispanic officers involved in Animal Shooting incidents in 2017 was three percentage points above the Department s overall Hispanic total. When compared to the aggregate percentage of involved Hispanic personnel from 2013 through 2016 of 56 percent, 2017 experienced a six percentage point decrease. Historically, from 2013 through 2017, a majority of officers involved in Animal Shooting incidents were Hispanic, accounting for 36 of the 65 total employees, or 55 percent. Continues on page 226 Ethnicity City Population Department Personnel OIS-Animal Personnel Asian/Pacific Isl. 12% 8% 0% Black 9% 10% 0% Hispanic 49% 47% 50% White 28% 32% 50% Other 2% 3% 0% Total 100% 100% 100% USE OF FORCE YEAR-END REVIEW LOS ANGELES POLICE DEPARTMENT 225
114 {CUOF INCIDENTS ANIMAL SHOOTING} Officer-Ethnicity continued OFFICER AREA/DIVISION OF ASSIGNMENT In 2017, five White officers were involved in Animal Shooting incidents, which represented 50 percent of the 10 total employees. This accounted for a 19 percentage point increase compared to 31 percent in The percentage of White officers involved in Animal Shooting incidents in 2017 was 18 percentage points above the Department s overall White total. When compared to the OFFICER YEARS OF SERVICE < > The following depicts the percentage of personnel involved in Animal Shooting incidents in 2017 based on their respective years of service classifications: Less than one year of service zero percent (zero out of 10 total officers); 1-5 years of service 10 percent (one out of 10 total officers); 6-10 years of service 10 percent (one out of 10 total officers); years of service 30 percent (three out of 10 total officers); and, More than 20 years of service 50 percent (five out of 10 total officers). In 2017, there were percentage point decreases in three of the five categories, an increase in one, and one that remained unchanged, when compared to The following depicts these changes: Less than one year of service no percentage point change (zero percent in 2016, zero percent in 2017); 1-5 years of service 15 percentage point decrease (25 percent in 2016, 10 percent in 2017); 6-10 years of service nine percentage point decrease (19 percent in 2016, 10 percent in 2017); years of service 14 percentage point decrease (44 percent in 2016, 30 percent in 2017); and, More than 20 years of service 37 percentage point increase (13 percent in 2016, 50 percent in 2017). aggregate percentage of involved White personnel from 2013 through 2016 of 29 percent, 2017 experienced a 21 percentage point increase. Historically, from 2013 through 2017, White officers represented for the second largest ethnic category of personnel involved in Animal Shooting incidents, accounting for 21 of the 65 total employees, or 32 percent. Years Less than More than Total In 2017, there were percentage point decreases in four of the five years of service categories and an increase in one when compared to the aggregate percentage of personnel involved in Animal Shooting incidents during the fouryear period from 2013 through The following depicts these changes: Less than one year of service two percentage point decrease (two percent during four-year period, zero percent in 2017); 1-5 years of service 10 percentage point decrease (20 percent during four-year period, 10 percent in 2017); 6-10 years of service 10 percentage point decrease (20 percent during four-year period, 10 percent in 2017); years of service 19 percentage point decrease (49 percent during four-year period, 30 percent in 2017); and, More than 20 years of service 41 percentage point increase (nine percent during four-year period, 50 percent in 2017). Historically, from 2013 through 2017, a majority of officers involved in Animal Shooting incidents had years of service, accounting for 30 of the 65 total employees, or 46 percent. Officers with 1-5 and 6-10 years of service accounted for the second largest categories with 12 employees respectively, or 18 percent. Officers with more than 20 years of service were the third largest group, with 10 personnel, or 15 percent, followed by officers with less than one year of service, which accounted for only one employee, representing approximately two percent. 77TH CENT DEV FTHL HARB HOBK HWD MISN NEWT NHWD NOE OLYM PAC RAMP SOE SOW TOP VNYS WLA WVAL WIL TRFC ADMIN SPCL BUREAU METRO SSD OTH In 2017, two personnel assigned to Rampart Division were involved in Animal Shooting incidents, which represented 20 percent of the 10 total employees. This accounted for a 20 percentage point increase compared to zero percent in When compared to the aggregate percentage of involved personnel assigned to Rampart Division from 2013 through 2016 of two percent, 2017 experienced an 18 percentage point increase. Historically, from 2013 through 2017, personnel assigned to Rampart Division accounted for three of the 65 total employees involved in Animal Shooting incidents, or five percent. In 2017, two personnel assigned to Traffic Divisions were involved in Animal Shooting incidents, which represented Division/Area/Bureau 77th Street Central Devonshire Foothill Harbor Hollenbeck Hollywood Mission Newton North Hollywood Northeast Olympic Pacific Rampart Southeast Southwest Topanga Van Nuys West Los Angeles West Valley Wilshire All Traffic Divisions Administrative Units Specialized Units Bureau Level Metropolitan Security Services Other Areas Total percent of the 10 total employees. This accounted for a 20 percentage point increase compared to zero percent in When compared to the aggregate percentage of involved personnel assigned to Traffic Divisions from 2013 through 2016 of five percent, 2017 experienced a 15 percentage point increase. Historically, from 2013 through 2017, personnel assigned to Traffic Divisions accounted for five of the 65 total employees involved in Animal Shooting incidents, or eight percent. The remaining six Department personnel, or 60 percent, were fairly evenly distributed amongst the remaining Areas/Divisions. Continues on page USE OF FORCE YEAR-END REVIEW LOS ANGELES POLICE DEPARTMENT 227
115 {CUOF INCIDENTS ANIMAL SHOOTING} Officer Area/Division of Assignment continued OFFICER UNIT OF ASSIGNMENT The following is the employee Bureau assignment for the 10 total personnel involved in Animal Shooting incidents in 2017: Central Bureau: four personnel, or 40 percent; West Bureau: zero personnel, or zero percent; South Bureau: three personnel, or 30 percent; Valley Bureau: zero personnel, or zero percent; CTSOB: zero personnel, or zero percent; and, Other: three personnel, or 30 percent. In 2017, there were percentage point decreases in four of the six Bureau categories and increases in two, when compared to The following depicts these changes: Central Bureau: 15 percentage point increase (25 percent in 2016, 40 percent in 2017); West Bureau: six percentage point decrease (six percent in 2016, zero percent in 2017); South Bureau: one percentage point decrease (31 percent in 2016, 30 percent in 2017); Valley Bureau: 19 percentage point decrease (19 percent in 2016, zero percent in 2017); OFFICER RANK >LT LT SGT DET PO DO CTSOB: 13 percentage point decrease (13 percent in 2016, zero percent in 2017); and, Other: 24 percentage point increase (six percent in 2016, 30 percent in 2017). In 2017, there were percentage point decreases in four of the six Bureau categories and increases in two, when compared to their respective aggregate percentages during the four-year period from 2013 through The following depicts these changes: Central Bureau: 22 percentage point increase (18 percent during four-year period, 40 percent in 2017); West Bureau: nine percentage point decrease (nine percent during four-year period, zero percent in 2017); South Bureau: five percentage point decrease (35 percent during four-year period, 30 percent in 2017); Valley Bureau: 18 percentage point decrease (18 percent during four-year period, zero percent in 2017); CTSOB: four percentage point decrease (four percent during four-year period, zero percent in 2017); and, Other: 14 percentage point increase (16 percent during four-year period, 30 percent in 2017). Rank Captain and Above Lieutenant Sergeant Detective Police Officer Detention Officer Other Total ADMIN METRO PATROL SPCL INV CSD OTH In 2017, eight personnel assigned to patrol were involved in Animal Shooting incidents, which represented 80 percent of the 10 total personnel. This accounted for a 24 percentage point increase compared to 56 percent in When compared to the aggregate percentage of involved personnel assigned to patrol from 2013 through 2016 of 58 percent, 2017 experienced a 22 percentage point increase. Historically, from 2013 through 2017, a majority of officers involved in Animal Shooting incidents were assigned to patrol, accounting for 40 of the 65 total employees, or 62 percent. In 2017, one employee assigned to a specialized assignment was involved in an Animal Shooting incident, which represented 10 percent of the 10 total personnel. This accounted for a 21 percentage point decrease compared Unit Administrative Metropolitan Patrol Specialized Investigative Custody Other Total to 31 percent in When compared to the aggregate percentage of involved personnel assigned to specialized assignments from 2013 through 2016 of 25 percent, 2017 experienced a 15 percentage point decrease. Historically, from 2013 through 2017, officers assigned to specialized assignments accounted for the second most represented category of personnel involved in Animal Shooting incidents with 15 of the 65 total employees, or 23 percent. The remaining employee involved in a 2017 Animal Shooting incident, representing 10 percent, was assigned to an administrative assignment. Based on data for the five-year period from 2013 though 2017, there appears to be no statistical trend associated with involved employees assigned to administrative assignments. In 2017, eight employees at the rank of police officer were involved in Animal Shooting incidents, which represented 80 percent of the 10 total employees. This accounted for a 20 percentage point decrease compared to 100 percent in The percentage of police officers involved in Animal Shooting incidents in 2017 was 12 percentage points above the Department s overall police officer total. When compared to the aggregate percentage of involved personnel at the rank of police officer from 2013 through 2016 of 95 percent, 2017 experienced a 15 percentage point decrease. Historically, from 2013 through 2017, a majority of personnel involved in Animal Shooting incidents were at the rank of police officer, accounting for 60 of the 65 total employees, or 92 percent. In 2017, two employees at the rank of sergeant were involved in Animal Shooting incidents, which represented 20 percent of the 10 total employees. This accounted for a 20 percentage point increase compared to zero percent in The percentage of sergeants involved in Animal Shooting incidents in 2017 was eight percentage points above the Department s overall sergeant total. When compared to the aggregate percentage of involved personnel at the rank of sergeant from 2013 through 2016 of four percent, 2017 experienced a 16 percentage point increase. Historically, from 2013 through 2017, employees at the rank of sergeant represented the second largest category of personnel involved in Animal Shooting incidents, accounting for four of the 65 total employees, or six percent USE OF FORCE YEAR-END REVIEW LOS ANGELES POLICE DEPARTMENT 229
116 {CUOF INCIDENTS ANIMAL SHOOTING} OFFICER INJURIES TOTAL NUMBER OF ROUNDS FIRED BY OFFICERS PER YEAR INJ OIS - Animal Total Rounds DEC Category Injured Deceased Total TTL RNDS In 2017, 20 rounds were fired during all 10 Animal Shooting incidents. When compared to the 2016 total of 52 rounds fired, 2017 experienced a decrease of 32 rounds, or 62 percent. Additionally, when compared to the 2013 through 2016 annual average of 33 rounds fired, 2017 was 13 rounds, or 39 percent, below the four-year annual average. No Department personnel were killed during or resulting from Animal Shooting incidents during the five-year period from 2013 through However, six officers sustained injuries during the same five-year period. In 2017, two officers sustained injuries during the 10 Animal Shooting incidents throughout the year. This represented no percentage change when compared to the same number of injured officers in 2016 Animal Shooting incidents. When compared to the 2013 through 2016 annual average of one injured officer, 2017 was one injured officer, or 100 percent, above the four-year annual average. ANNUAL AVERAGE OF ROUNDS FIRED PER INCIDENT OIS - Animal Average Rounds OFFICER WEAPON SYSTEM HGUN AVG RNDS In 2017, an average of two rounds were fired during Animal Shooting incidents. When compared to the 2016 average of 3.7 rounds fired, 2017 experienced a decrease of 1.7 rounds, or 46 percent. Additionally, when compared to the 2013 through 2016 annual average of 2.8 rounds fired per incident, 2017 was 0.8 rounds, or 29 percent, below the four-year annual average. SGUN RIFLE In 2017, nine handguns were utilized during Animal Shooting incidents, which represented 90 percent out of the 10 total weapon types. This accounted for a 10 percentage point decrease compared to 100 percent in When compared to the aggregate percentage of handguns utilized during Animal Shooting incidents from 2013 through 2016 of 100 percent, 2017 experienced a 10 percentage point decrease. Historically, from 2013 through 2017, handguns were the most utilized weapon type during Weapon Type Handgun Shotgun Rifle Total Animal Shooting incidents, accounting for 64 of the 65 total weapons, or 98 percent. In 2017, one shotgun was utilized during an Animal Shooting incident, which represented 10 percent out of the 10 total weapon types. This accounted for the only occurrence in which a shotgun was utilized during an Animal Shooting incident in the five-year period from 2013 through TOTAL NUMBER OF ROUNDS FIRED BY OFFICERS PER WEAPON SYSTEM HGUN SGUN RIFLE In 2017, 17 rounds were fired from handguns during Animal Shooting incidents, which represented 85 percent of the 20 total rounds fired. This accounted for a 15 percentage point decrease compared to 100 percent in Similarly, when compared to the aggregate percentage of rounds fired from handguns during Animal Shooting incidents from 2013 through 2016 of 100 percent, 2017 experienced a 15 percentage point decrease. Historically, from 2013 through 2017, rounds fired from handguns were the Weapon Type Handgun Shotgun Rifle Total most frequent round type fired during Animal Shooting incidents, accounting for 149 of the 152 total rounds, or 98 percent. In 2017, three rounds were fired from shotguns during Animal Shooting incidents, which represented 15 percent of the 20 total rounds fired. The 2017 Animal Shooting incident in which a shotgun was utilized was the only such occurrence in the five-year period from 2013 through USE OF FORCE YEAR-END REVIEW LOS ANGELES POLICE DEPARTMENT 231
117 {CUOF INCIDENTS UD} DEPARTMENT ADJUDICATION 31 TACTICAL DEBRIEF/IN-POLICY (NO FURTHER ACTION) TAC D&E N-LETH L-LETH LETH Category Tactics N/A Drawing & Exhibiting N/A Non-Lethal N/A Less Lethal N/A Lethal N/A Total N/A UNINTENTIONAL DISCHARGE INCIDENTS The unintentional discharge of a firearm by a Department employee regardless of cause. Unintentional discharges are evaluated and categorized as Tactical Discharges or Non-Tactical Discharges (2017 LAPD Manual 3/792.05). ANNUAL DEPARTMENT TOTALS In 2016, 13 out of the 16 total Animal Shooting Tactics findings, representing 81 percent, were adjudicated as Tactical Debrief. This accounted for a 19 percentage point decrease compared to 100 percent in When compared to the aggregate percentage of Tactical Debrief Tactics findings from 2013 through 2015 of 97 percent, 2016 experienced a 16 percentage point decrease. Historically, from 2013 through 2016, a majority of adjudicated Tactics findings resulted in a Tactical Debrief outcome, accounting for 51 of the 55 total Tactics findings, or 93 percent. In 2016, 16 out of the 16 total Animal Shooting Drawing/ Exhibiting findings, representing 100 percent, were adjudicated as In Policy (No Further Action). In the fouryear period from 2013 through 2016, all Animal Shooting Drawing/Exhibiting findings resulted in an In Policy (No Further Action) outcome. In 2016, 15 out of the 16 total Animal Shooting Lethal force findings, representing 94 percent, were adjudicated as In Policy (No Further Action). This accounted for a six percentage point decrease compared to 100 percent in When compared to the aggregate percentage of In Policy (No Further Action) Lethal force findings from 2013 through 2015 of 100 percent, 2016 experienced a six percentage point decrease. Historically, from 2013 through 2016, a majority of adjudicated Lethal force findings resulted in an In Policy (No Further Action) outcome, accounting for 54 of the 55 total findings, or 98 percent. DEPT TTL In 2017, Department personnel were involved in seven Unintentional Discharge incidents, which remained an unchanged count compared to In the four-year period from 2013 through 2016, there were a total of 37 Unintentional Discharge Department Total Unintentional Discharge incidents, resulting in an annual average of 9.25 incidents. The 2017 count fell below the 2013 through 2016 annual average by 2.25 incidents, or 24 percent. ADMINISTRATIVE DISAPPROVAL/OUT OF POLICY (ADMINISTRATIVE DISAPPROVAL) SOURCE OF ACTIVITY TAC D&E N-LETH L-LETH LETH Category Tactics N/A Drawing & Exhibiting N/A Non-Lethal N/A Less Lethal N/A Lethal N/A Total N/A OFF DTY ON DTY, TAC ON DTY, NTAC Source Off-Duty On-Duty, Tactical On-Duty, Non-Tactical Total In 2016, three out of the 16 total Animal Shooting Tactics findings, representing 19 percent, were adjudicated as Administrative Disapproval. This accounted for a 19 percentage point increase compared to zero percent in When compared to the aggregate percentage of Administrative Disapproval Tactics findings from 2013 through 2015 of three percent, 2016 experienced a 16 percentage point increase. Historically, from 2013 through 2016, four of the 55 total Tactics findings, accounting for seven percent, resulted in an Administrative Disapproval outcome. In the four-year period from 2013 through 2016, none of the Animal Shooting Drawing/Exhibiting findings resulted in an Out of Policy (Administrative Disapproval) outcome. In 2016, one of the 16 total Animal Shooting Lethal force findings, representing six percent, was adjudicated as Out of Policy (Administrative Disapproval). This accounted for the only Out of Policy (Administrative Disapproval) Lethal force finding for Animal Shooting incidents in the four-year period from 2013 through In 2017, six of the Department s seven Unintentional Discharge incidents, or 86 percent, occurred during onduty non-tactical situations (e.g. weapon inspections, weapon cleaning, etc.). One incident, representing 14 percent, occurred during an on-duty tactical situation (field operation event wherein deployment of the weapon system was warranted). From 2013 through 2017, on-duty non-tactical situations were the most frequent source of Unintentional Discharge incidents, accounting for 19 of the 44 total incidents, or 43 percent. On-duty tactical situations were the second most common, accounting for 13 incidents, or 30 percent, followed by off-duty situations, accounting for 12 incidents, or 27 percent. 31 Adjudication data for 2017 was omitted from this Report since a vast majority of the CUOF incidents will be adjudicated by the BOPC in USE OF FORCE YEAR-END REVIEW LOS ANGELES POLICE DEPARTMENT 233
118 {CUOF INCIDENTS UD} BUREAU OF OCCURRENCE OPERATIONS-CENTRAL BUREAU OPERATIONS-WEST BUREAU CENT NEWT NOE RAMP HOBK Area Central Newton Northeast Rampart Hollenbeck Total HWD OLYM PAC WLA WIL Area Hollywood Olympic Pacific West Los Angeles Wilshire Total In 2017, two of the Department s Unintentional Discharge incidents occurred within the geographical area of Central Bureau, which remained unchanged compared to Twenty-nine percent of the Department s Unintentional Discharge incidents occurred in Central Bureau (Department - seven; Central Bureau - two). In the four- year period from 2013 through 2016, nine Unintentional Discharge incidents occurred in Central Bureau, resulting in an annual average of 2.25 incidents. The Central Bureau count for 2017 fell below the 2013 through 2016 annual average by 0.25 incidents, or approximately 11 percent. In 2017, two of the Department s Unintentional Discharge incidents occurred within the geographical area of West Bureau, which remained unchanged compared to Twenty-nine percent of the Department s Unintentional Discharge incidents occurred in West Bureau (Department - seven; West Bureau - two). In the four-year period from 2013 through 2016, seven Unintentional Discharge incidents occurred in West Bureau, resulting in an annual average of 1.75 incidents. The West Bureau count for 2017 exceeded the 2013 through 2016 annual average by 0.25 incidents, or 14 percent. OPERATIONS-SOUTH BUREAU OPERATIONS-VALLEY BUREAU 77TH SOE HARB SOW Area 77th Street Southeast Harbor Southwest Total DEV FTHL MISN NHWD TOP VNYS WVAL Area Devonshire Foothill Mission North Hollywood Topanga Van Nuys West Valley Total No Unintentional Discharge incidents occurred in South Bureau in In 2017, two of the Department s Unintentional Discharge incidents occurred within the geographical area of Valley Bureau, which was an increase of one incident, or 100 percent, compared to Twenty-nine percent of the Department s Unintentional Discharge incidents occurred in Valley Bureau (Department - seven; Valley Bureau - two). In the four-year period from 2013 through 2016, eight Unintentional Discharge incidents occurred in Valley Bureau, resulting in an annual average of two incidents. The Valley Bureau count for 2017 remained unchanged when compared to the 2013 through 2016 annual average USE OF FORCE YEAR-END REVIEW LOS ANGELES POLICE DEPARTMENT 235
119 {CUOF INCIDENTS UD} OUTSIDE JURISDICTION DAY OF OCCURRENCE OUTSIDE In 2017, one of the Department s Unintentional Discharge incidents occurred outside the Department s jurisdiction, which remained unchanged when compared to Fourteen percent of the Department s Unintentional Discharge incidents occurred in areas outside the Department s jurisdiction (Department - seven; Outside Area Outside Jurisdiction Areas - one). In the four-year period from 2013 through 2016, nine Unintentional Discharge incidents occurred in areas outside the Department s jurisdiction, resulting in an annual average of 2.25 incidents. The total incident count for outside areas in 2017 fell below the 2013 through 2016 annual average by 1.25 incidents, or 56 percent. MON TUE WED THUR FRI SAT SUN In 2017, Monday represented the day of the week with the most Unintentional Discharge incidents with four out of the seven occurrences, or 57 percent. The remaining three incidents were distributed throughout the remaining days of the week without any apparent pattern. Day Monday Tuesday Wednesday Thursday Friday Saturday Sunday Total From 2013 through 2017, Wednesday represented the day with the most Unintentional Discharge incidents with 10 out of the 44 total, or 23 percent. Monday accounted for the second highest count with eight incidents, or 18 percent. The remaining 26 incidents were distributed throughout the remaining days of the week without any apparent pattern. MONTH OF OCCURRENCE TIME OF OCCURRENCE JAN FEB MAR APR MAY JUN JUL AUG SEP OCT NOV DEC Month January February March April May June July August September October November December Total In 2017, five Unintentional Discharge incidents, or 71 percent, occurred between the hours of 6 a.m. and 5:59 p.m., while two incidents, or 29 percent, occurred between the hours of 6 p.m. and 5:59 a.m. During the four-year period from 2013 through 2016, 22 Unintentional Discharge incidents, or 59 percent, occurred between the hours of 6 a.m. and 5:59 p.m., and 15 incidents, or 41 percent, occurred between the hours of 6 p.m. and 5:59 a.m. Time of Day Total The five-year annual average for 2013 through 2017 was 5.4 Unintentional Discharge incidents occurring between the hours of 6 a.m. and 5:59 p.m., and 3.4 incidents between the hours of 6 p.m. and 5:59 a.m. In 2017, March represented the month with the most Unintentional Discharge incidents with two occurrences, or 29 percent, out of seven total for the year. The remaining five incidents were distributed throughout the remaining months of the year without any apparent pattern. From 2013 through 2017, April represented the month with the most Unintentional Discharge incidents with six out of the 44 total incidents, or 14 percent. The remaining 38 incidents were distributed throughout the remaining months of the year without any apparent pattern. The Unintentional Discharge incident percentage breakdown on a quarterly basis from 2013 through 2017 was as follows: January through March: 11 incidents, or 25 percent; April through June: 11 incidents, or 25 percent; July through September: 10 incidents; or 23 percent; and, October through December: 12 incidents, or 27 percent USE OF FORCE YEAR-END REVIEW LOS ANGELES POLICE DEPARTMENT 237
120 {CUOF INCIDENTS UD} OFFICER INFORMATION OFFICER YEARS OF SERVICE The officer sections below include data for all employees who received, or were pending, BOPC unintentional discharge adjudicative findings for their involvement in Unintentional Discharge incidents. In 2017, seven Department personnel were involved in the seven Unintentional Discharge incidents throughout the OFFICER GENDER year, resulting in an average of one officer per incident. This represented no change when compared to the same officer per incident average in Similarly, the 2017 officer to incident average represented no change when compared to the same officer to incident aggregate annual average from 2013 through < > Years Less than More than Total In 2017, seven male officers were involved in Unintentional Discharge incidents, which represented 100 percent of the seven total employees. This accounted for a 14 percentage point increase compared to 86 percent in The percentage of male officers involved in Unintentional Discharge incidents in 2017 was 18 percentage points above the Department s overall male total. When compared to the AM IND ASN BLK FILIP HISP WHT Female OFFICER ETHNICITY Male OTH In 2017, six Hispanic officers were involved in Unintentional Discharge incidents, which represented 86 percent of the seven total employees. This accounted for a 43 percentage point increase compared to 43 percent in The percentage of Hispanic officers involved in Unintentional Discharge incidents in 2017 was 39 percentage points above the Department s overall Hispanic total. When compared to the aggregate percentage of involved Hispanic personnel from 2013 through 2016 of 43 percent, 2017 experienced a 43 percentage point increase. Historically, from 2013 through 2017, a majority of officers involved in Unintentional Discharge incidents were Hispanic, representing 22 of the 44 total employees, or 50 percent. Gender Female Male Total aggregate percentage of involved male personnel from 2013 through 2016 of 84 percent, 2017 experienced a 16 percentage point increase. Historically, from 2013 through 2017, a majority of officers involved in Unintentional Discharge incidents were male, representing 38 of the 44 total employees, or 86 percent. Ethnicity American Indian Asian/Pacific Islander Black Filipino Hispanic White Other Total Ethnicity City Population Department Personnel UD Personnel Asian/Pacific Isl. 12% 8% 0% Black 9% 10% 0% Hispanic 49% 47% 86% White 28% 32% 14% Other 2% 3% 0% Total 100% 100% 100% The remaining officer involved in a 2017 Unintentional Discharge incident, representing 14 percent, was White. The following depicts the percentage of personnel involved in Unintentional Discharge incidents in 2017 based on their respective years of service classifications: Less than one year of service (no involved officers); 1-5 years of service 29 percent (two out of seven total officers); 6-10 years of service 29 percent (two out of seven total officers); years of service 14 percent (one out of seven total officers); and, More than 20 years of service 29 percent (two out of seven total officers). In 2017, there was a percentage point increase in one of the five categories, a decrease in one, and three that remained unchanged, when compared to The following depicts these changes: Less than one year of service no percentage point change (zero percent in 2016, zero percent in 2017); 1-5 years of service no percentage point change (29 percent in 2016, 29 percent in 2017); 6-10 years of service 28 percentage point decrease (57 percent in 2016, 29 percent in 2017); years of service no percentage point change (14 percent in 2016, 14 percent in 2017); and, More than 20 years of service 29 percentage point increase (zero percent in 2016, 29 percent in 2017). In 2017, there were percentage point increases in three of the five years of service categories and decreases in two when compared to the aggregate percentage of personnel involved in Unintentional Discharge incidents during the four-year period from 2013 through The following depicts these changes: Less than one year of service three percentage point decrease (three percent during four-year period, zero percent in 2017); 1-5 years of service five percentage point increase (24 percent during four-year period, 29 percent in 2017); 6-10 years of service two percentage point increase (27 percent during four-year period, 29 percent in 2017); years of service 21 percentage point decrease (35 percent during four-year period, 14 percent in 2017); and, More than 20 years of service 18 percentage point increase (11 percent during four-year period, 29 percent in 2017). Historically, from 2013 through 2017, a majority of officers involved in Unintentional Discharge incidents had years of service, accounting for 14 of the 44 total employees, or 32 percent. Officers with 6-10 years of service accounted for the second largest category with a total of 12 employees, or 27 percent, during the same five-year period. Officers with 1-5 years of service were the third largest group, with 11 personnel, or 25 percent, followed by officers with more than 20 years of service, which had six officers, or 14 percent. Officers with less than one year of service, which accounted for only one officer, represented two percent of the total USE OF FORCE YEAR-END REVIEW LOS ANGELES POLICE DEPARTMENT 239
121 {CUOF INCIDENTS UD} OFFICER RANK OFFICER AREA/DIVISION OF ASSIGNMENT >LT LT SGT DET PO DO In 2017, six employees at the rank of police officer were involved in Unintentional Discharge incidents, which represented 86 percent of the seven total employees. This accounted for a 14 percentage point decrease compared to 100 percent in The percentage of police officers involved in Unintentional Discharge incidents in 2017 was 18 percentage points above the Department s overall police officer total. When compared to the aggregate percentage of involved personnel at the rank of police officer from 2013 through 2016 of 84 percent, 2017 experienced a two percentage point increase. Historically, from 2013 through 2017, a majority of officers involved in Unintentional Discharge incidents were at the rank of police officer, accounting for 37 of the 44 total employees, or 84 percent. Rank Captain and Above Lieutenant Sergeant Detective Police Officer Detention Officer Total In 2017, one employee at the rank of detective was involved in Unintentional Discharge incident, which represented 14 percent of the seven total employees. This accounted for a 14 percentage point increase compared to zero percent in The percentage of detectives involved in Unintentional Discharge incidents in 2017 was two percentage points below the Department s overall detective total. When compared to the aggregate percentage of involved personnel at the rank of detective from 2013 through 2016 of eight percent, 2017 experienced a six percentage point increase. Historically, from 2013 through 2017, employees at the rank of detective accounted for the second largest category of personnel involved in Unintentional Discharge incidents, with four of the 44 total employees, or nine percent. 77TH CENT DEV FTHL HARB HOBK HWD MISN NEWT NHWD NOE OLYM PAC RAMP SOE SOW TOP VNYS WLA WVAL WIL TRFC ADMIN SPCL BUREAU METRO SSD OTH Division/Area/Bureau 77th Street Central Devonshire Foothill Harbor Hollenbeck Hollywood Mission Newton North Hollywood Northeast Olympic Pacific Rampart Southeast Southwest Topanga Van Nuys West Los Angeles West Valley Wilshire All Traffic Divisions Administrative Units Specialized Units Bureau Level Metropolitan Security Services Other Areas Total In 2017, two personnel assigned to Rampart Division were involved in Unintentional Discharge incidents, which represented 29 percent of the seven total employees. In the five-year period from 2013 through 2017, Rampart Division accounted for the most Unintentional Discharge incidents with six of the 44 total, or 14 percent. In 2017, two personnel assigned to Wilshire Division were involved in Unintentional Discharge incidents, which represented 29 percent of the seven total employees. In the five-year period from 2013 through 2017, Wilshire Division accounted for the second highest Unintentional Discharge incident count (along with personnel assigned to various Administrative Units) with four of the 44 total, or nine percent. In 2017, one employee assigned to an Administrative Unit, representing 14 percent, was involved in Unintentional Discharge incident. In the five-year period from 2013 through 2017, Department Administrative Units accounted for the second highest Unintentional Discharge incident count (along with Wilshire Division) with four of the 44 total, or nine percent. The remaining two officers involved in 2017 Unintentional Discharge incidents, representing 29 percent, were distributed throughout the remaining Areas/Divisions of assignment without any apparent pattern USE OF FORCE YEAR-END REVIEW LOS ANGELES POLICE DEPARTMENT 241
122 {CUOF INCIDENTS UD} OFFICER UNIT OF ASSIGNMENT OFFICER INJURIES ADMIN METRO PATROL SPCL INV CSD OTH Unit Administrative Metropolitan Patrol Specialized Investigative Custody Other Total INJ DEC Category Injured Deceased Total In 2017, five personnel assigned to patrol were involved in Unintentional Discharge incidents, which represented 71 percent of the seven total personnel. This accounted for a 14 percentage point increase compared to 57 percent in When compared to the aggregate percentage of involved personnel assigned to patrol from 2013 through 2016 of 49 percent, 2017 experienced a 22 percentage point increase. Historically, from 2013 through 2017, a majority of officers involved in Unintentional Discharge incidents were assigned to patrol, representing 23 of the 44 total employees, or 52 percent. In 2017, one employee assigned to an administrative function was involved in an Unintentional Discharge incident, which represented 14 percent of the seven total personnel. This accounted for a 14 percentage point increase compared to zero percent in When compared to the aggregate percentage of involved personnel assigned to an administrative function from 2013 through 2016 of eight percent, 2017 experienced a six percentage point increase. Historically, from 2013 through 2017, personnel assigned to an administrative function accounted for four of the 44 total involved employees in Unintentional Discharge incidents, representing nine percent. In 2017, one employee assigned to an investigative function was involved in an Unintentional Discharge incident, which represented 14 percent of the seven total personnel. This accounted for a 14 percentage point increase compared to zero percent in When compared to the aggregate percentage of involved personnel assigned to an investigative function from 2013 through 2016 of 11 percent, 2017 experienced a three percentage point increase. Historically, from 2013 through 2017, personnel assigned to an investigative function accounted for five of the 44 total involved employees in Unintentional Discharge incidents, representing 11 percent. No Department personnel were killed as a result of Unintentional Discharge incidents during the five-year period from 2013 through However, six officers sustained injuries as a result of Unintentional Discharge incidents during the same five-year period. OFFICER WEAPON SYSTEM HGUN SGUN RIFLE In 2017, one officer, representing 14 percent of the seven total, sustained an injury as a result of an Unintentional Discharge incident. This accounted for a 15 percentage point decrease compared to 29 percent in When compared to the 2013 through 2016 annual average of 14 percent injured officers, 2017 experienced no percentage point change. Weapon Type Handgun Shotgun Rifle Total In 2017, four shotguns were utilized during Unintentional Discharge incidents, which represented 57 percent out of the seven total weapons. This accounted for a 57 percentage point increase compared to zero percent in When compared to the aggregate percentage of shotguns utilized during Unintentional Discharge incidents from 2013 through 2016 of 16 percent, 2017 experienced a 41 percentage point increase. Historically, from 2013 through 2017, shotguns represented the second highest weapon type count in Unintentional Discharge incidents with 10 of the 44 total firearms, or 23 percent. In 2017, two handguns were utilized during Unintentional Discharge incidents, which represented 29 percent out of the seven total weapons. This accounted for a 71 percentage point decrease compared to 100 percent in When compared to the aggregate percentage of handguns utilized during Unintentional Discharge incidents from 2013 through 2016 of 78 percent, 2017 experienced a 49 percentage point decrease. Historically, from 2013 through 2017, handguns represented the highest weapon type count in Unintentional Discharge incidents with 31 of the 44 total firearms, or 70 percent. In 2017, one rifle was utilized during an Unintentional Discharge incident, which represented 14 percent out of the seven total weapons. This accounted for a 14 percentage point increase compared to zero percent in When compared to the aggregate percentage of rifles utilized during Unintentional Discharge incidents from 2013 through 2016 of five percent, 2017 experienced a nine percentage point increase. Historically, from 2013 through 2017, rifles accounted for the fewest weapon types involved in Unintentional Discharge incidents with three of the 44 total firearms, or seven percent USE OF FORCE YEAR-END REVIEW LOS ANGELES POLICE DEPARTMENT 243
123 {CUOF INCIDENTS UD} TOTAL NUMBER OF ROUNDS FIRED BY OFFICERS PER WEAPON SYSTEM DEPARTMENT ADJUDICATION 32 TACTICAL DEBRIEF/IN-POLICY (NO FURTHER ACTION) HGUN SGUN RIFLE Weapon Type Handgun Shotgun Rifle Total TAC D&E N-LETH L-LETH LETH UD Category Tactics N/A Drawing & Exhibiting N/A Non-Lethal N/A Less Lethal N/A Lethal N/A Unintentional Discharge N/A Total N/A During all Unintentional Discharge incidents from 2013 through 2017, only one round was fired per incident. OFFICER HANDGUN MAKE ADMINISTRATIVE DISAPPROVAL/OUT OF POLICY (ADMINISTRATIVE DISAPPROVAL) BERETTA GLOCK KIM 1911 RUGER S&W (REV) S&W (S/A) SPR 1911 INT 9MM In 2017, four of the seven incidents, or 57 percent, involved shotguns. During the five-year period from 2013 through 2017, shotguns were the second most frequent firearm involved in Unintentional Discharge incidents, accounting for 10 out of 44 total firearms, or 23 percent. In 2017, one of the seven incidents, representing 14 percent, involved a Glock handgun. During the five-year period from 2013 through 2017, Glock handguns were the most frequent firearm involved in Unintentional Discharge incidents, accounting for 21 out of 44 total firearms, or 48 percent. Handgun Type Beretta Glock Kimber Ruger Smith & Wesson (Revolver) Smith & Wesson (Semi-Auto) Springfield Intratec 9mm Total In 2017, one of the seven incidents, representing 14 percent, involved a Kimber 1911 handgun. During the five-year period from 2013 through 2017, Kimber 1911 handguns accounted for two of the 44 total firearms involved in Unintentional Discharge incidents, representing five percent. In 2017, one of the seven incidents, representing 14 percent, involved a rifle. During the five-year period from 2013 through 2017, rifles accounted for three of the 44 total firearms involved in Unintentional Discharge incidents, representing seven percent. TAC D&E N-LETH L-LETH LETH UD In 2016, six out of the seven total Unintentional Discharge Tactics findings, representing 86 percent, were adjudicated as Tactical Debrief. This accounted for a 36 percentage point increase compared to 50 percent in When compared to the aggregate percentage of Tactical Debrief findings from 2013 through 2015 of 83 percent, 2016 experienced a three percentage point increase. Historically, from 2013 through 2016, a majority of adjudicated Tactics findings resulted in a Tactical Debrief outcome, accounting for 30 of the 36 total Tactics findings, or 83 percent. In 2016, one of the seven total Unintentional Discharge Tactics findings, representing 14 percent, was adjudicated as Administrative Disapproval. This accounted for a 36 percentage point decrease compared to 50 percent Category Tactics N/A Drawing & Exhibiting N/A Non-Lethal N/A Less Lethal N/A Lethal N/A Unintentional Discharge N/A Total N/A in When compared to the aggregate percentage of Administrative Disapproval findings from 2013 through 2015 of 17 percent, 2016 experienced a three percentage point decrease. Historically, from 2013 through 2016, six of the 36 total Tactics findings, or 17 percent, resulted in an Administrative Disapproval outcome. During the four-year period from 2013 through 2016, all adjudicated Drawing/Exhibiting findings resulted in an In Policy (No Further Action) outcome, accounting for 11 of the 11 total Drawing/Exhibiting findings, or 100 percent. During the four-year period from 2013 through 2016, all adjudicated Unintentional Discharge findings resulted in an Out of Policy (Administrative Disapproval) outcome. 32 Adjudication data for 2017 was omitted from this Report since a vast majority of the CUOF incidents will be adjudicated by the BOPC in USE OF FORCE YEAR-END REVIEW LOS ANGELES POLICE DEPARTMENT 245
124 {CUOF INCIDENTS ICD} IN-CUSTODY DEATH INCIDENTS The death of an arrestee or detainee who is in the custodial care of the Department (2017 LAPD Manual 3/792.05). Note: Per Special Order No.10 (dated May 10, 2011), the Department is authorized to reclassify CUOF ICD investigations to death investigations when the Los Angeles County Department of Medical Examiner Coroner s Office determines that the concerned subject s death was caused by natural, accidental, or undetermined means, and when the incident did not involve a UOF or evidence of foul play. ANNUAL DEPARTMENT TOTALS 33 In-Custody Death Department Total BUREAU OF OCCURRENCE OPERATIONS-CENTRAL BUREAU CENT NEWT NOE RAMP HOBK Area Central Newton Northeast Rampart Hollenbeck Total DEPT TTL In 2017, Department personnel were involved in five ICD incidents, an increase of three incidents, or 150 percent, compared to In the four-year period from 2013 through 2016, there were a total of 19 ICD incidents, resulting in an annual average of 4.75 incidents. The 2017 count exceeded the 2013 through 2016 annual average by 0.25 incidents, or five percent. In 2017, one of the Department s ICD incidents occurred within the geographical area of Central Bureau, which was an increase of one incident compared to Twenty percent of the Department s ICD incidents occurred in Central Bureau (Department - five; Central Bureau - one). In the four-year period from 2013 through 2016, six ICD incidents occurred in Central Bureau, resulting in an annual average of 1.5 incidents. The Central Bureau count for 2017 fell below the 2013 through 2016 annual average by 0.5 incidents, or approximately 33 percent. SOURCE OF ACTIVITY OPERATIONS-SOUTH BUREAU RCALL OBS CZN FD PRE-PLN SCALL AMB OFF DTY OTH Source Radio Call Observation Citizen Flag Down Pre-Planned Station Call Ambush Off-Duty Other Total w 77TH SOE HARB SOW No ICD incidents occurred in South Bureau in Area 77th Street Southeast Harbor Southwest Total In 2017, three of the Department s five ICD incidents, or 60 percent, had sources of activity designated as other. This accounted for a 10 percentage point increase compared to 50 percent in When compared to the aggregate percentage of ICD incidents resulting from sources of activity designated as other from 2013 through 2016 of 21 percent, 2017 experienced a 39 percentage point increase. Historically from 2013 through 2017, ICD incidents with sources of activity designated as other accounted for seven of the 24 total incidents, or 29 percent. In 2017, two of the Department s five ICD incidents, or 40 percent, originated from radio calls. This accounted for a 40 percentage point increase compared to zero percent in However, when compared to the aggregate percentage of ICD incidents resulting from radio calls from 2013 through 2016 of 53 percent, 2017 experienced a 13 percentage point decrease. Historically from 2013 through 2017, radio calls represented the largest source type of ICD incidents, accounting for 12 of the 24 total incidents, or 50 percent. 33 Cases reclassified from ICD investigations to Death Investigations: F039-16; F048-16; F065-16; F069-16; F075-16; and F USE OF FORCE YEAR-END REVIEW LOS ANGELES POLICE DEPARTMENT 247
125 {CUOF INCIDENTS ICD} OPERATIONS-VALLEY BUREAU CUSTODY SERVICES DIVISION DEV FTHL MISN NHWD TOP VNYS WVAL Area Devonshire Foothill Mission North Hollywood Topanga Van Nuys West Valley Total CSD Area Custody Services In 2017, one of the Department s ICD incidents occurred within the geographical area of Valley Bureau, which was an increase of one incident compared to Twenty percent of the Department s ICD incidents occurred in Valley Bureau (Department - five; Valley Bureau - one). In the four-year period from 2013 through 2016, three ICD incidents occurred in Valley Bureau, resulting in an annual average of 0.75 incidents. The Valley Bureau count for 2017 exceeded the 2013 through 2016 annual average by 0.25 incidents, or 33 percent. In 2017, three of the Department s ICD incidents occurred under the command of Custody Services Division, which was an increase of two incidents, or 200 percent, compared to Sixty percent of the Department s ICD incidents occurred within Custody Services Division (Department - five; Custody Services Division - three). In the four-year period from 2013 through 2016, four ICD incidents occurred within Custody Services Division, resulting in an annual average of one incident. The Custody Services Division count for 2017 exceeded the 2013 through 2016 annual average by two incidents, or 200 percent. OPERATIONS-WEST BUREAU OUTSIDE JURISDICTION HWD OLYM PAC WLA WIL Area Hollywood Olympic Pacific West Los Angeles Wilshire Total No ICD incidents occurred outside the Department s geographical jurisdiction in Area Outside Jurisdiction No ICD incidents occurred in West Bureau in USE OF FORCE YEAR-END REVIEW LOS ANGELES POLICE DEPARTMENT 249
126 {CUOF INCIDENTS ICD} MONTH OF OCCURRENCE TIME OF OCCURRENCE JAN FEB MAR APR MAY JUN JUL AUG SEP OCT NOV DEC Month - ICD Based on the data for the five-year period from 2013 through 2017, there appears to be no statistical trend associated with the month of occurrence for ICD incidents. Month January February March April May June July August September October November December Total In 2017, three ICD incidents, or 60 percent, occurred between the hours of 6 a.m. and 5:59 p.m., while two incidents, or 40 percent, occurred between the hours of 6 p.m. and 5:59 a.m. The time distribution varied from 2013 through 2016, where seven ICD incidents, or 37 percent, occurred between OFFICER INFORMATION The officer sections below include data for all employees who received, or were pending, BOPC non-lethal, lesslethal, and/or lethal force adjudicative findings for their involvement in ICD incidents. In 2017, two of the five ICD incidents involved some application of force against a suspect. Of those two incidents, 11 Department personnel were identified, based on the preliminary investigations, as having used some type of force. Time of Day Total the hours of 6 a.m. and 5:59 p.m., and 12 incidents, or 63 percent, occurred between the hours of 6 p.m. and 5:59 a.m. The five-year annual average for 2013 through 2017 was two ICD incidents occurring between the hours of 6 a.m. and 5:59 p.m., and 2.8 incidents between the hours of 6 p.m. and 5:59 a.m. In 2017, 11 Department personnel were involved in the five ICD incidents throughout the year, resulting in an average of 2.2 officers per incident. This accounted for a 120 percent increase compared to an average of one officer per incident in The 2017 officer to incident average fell below the 2013 through 2016 aggregate annual average of 2.3 by four percent. DAY OF OCCURRENCE OFFICER GENDER MON TUE WED THUR FRI SAT SUN Based on the data for the five-year period from 2013 through 2017, there appears to be no statistical trend associated with the day of occurrence for ICD incidents. Day Monday Tuesday Wednesday Thursday Friday Saturday Sunday Total Female Male In 2017, 10 male officers were involved in ICD incidents, which represented 91 percent of the 11 total employees. This accounted for a nine percentage point decrease compared to 100 percent in The percentage of male officers involved in ICD incidents in 2017 was nine percentage points above the Department s overall male total. When compared to the aggregate percentage of involved male personnel from 2013 through 2016 of 93 percent, 2017 experienced a two percentage point decrease. Historically, from 2013 through 2017, a majority of officers involved in ICD incidents were male, accounting for 50 of the 54 total employees, or 93 percent. Gender Female Male Total In 2017, one female officer was involved in an ICD incident, which represented nine percent of the 11 total employees. This accounted for a nine percentage point increase compared to zero percent in The percentage of female officers involved in ICD incidents in 2017 was nine percentage points below the Department s overall female total. When compared to the aggregate percentage of involved female personnel from 2013 through 2016 of seven percent, 2017 experienced a two percentage point increase. Historically, from 2013 through 2017, females accounted for four of the 54 total involved employees, or seven percent USE OF FORCE YEAR-END REVIEW LOS ANGELES POLICE DEPARTMENT 251
127 {CUOF INCIDENTS ICD} OFFICER ETHNICITY OFFICER YEARS OF SERVICE AM IND Ethnicity ASN BLK FILIP HISP WHT OTH In 2017, seven Hispanic officers were involved in ICD incidents, which represented 64 percent of the 11 total employees. This accounted for a 14 percentage point increase compared to 50 percent in The percentage of Hispanic officers involved in ICD incidents in 2017 was 17 percentage points below the Department s overall Hispanic total. When compared to the aggregate percentage of involved Hispanic personnel from 2013 through 2016 of 56 percent, 2017 experienced an eight percentage point increase. Historically, from 2013 through 2017, a majority of officers involved in ICD incidents were Hispanic, accounting for 31 of the 54 total employees, or 57 percent. In 2017, three White officers were involved in ICD incidents, which represented 27 percent of the 11 total employees. This accounted for an 27 percentage point increase compared to zero percent in The percentage of White officers involved in ICD incidents in 2017 was five percentage points below the Department s overall White total. When compared to the aggregate percentage of involved White personnel from 2013 through 2016 of 28 percent, 2017 experienced a one percentage point decrease. Historically, from 2013 through 2017, White officers represented for the second largest ethnic category of personnel involved in ICD incidents, accounting for 15 of the 54 total employees, or 28 percent. American Indian Asian/Pacific Islander Black Filipino Hispanic White Other Total Ethnicity City Population Department Personnel ICD Personnel Asian/Pacific Isl. 12% 8% 9% Black 9% 10% 0% Hispanic 49% 47% 64% White 28% 32% 27% Other 2% 3% 0% Total 100% 100% 100% In 2017, one Asian/Pacific Islander officer was involved in an ICD incident, which represented nine percent of the 11 total employees. This accounted for a nine percentage point increase compared to zero percent in The percentage of Asian/Pacific Islander officers involved in ICD incidents in 2017 was one percentage point above the Department s overall Asian/Pacific Islander total. When compared to the aggregate percentage of involved Asian/Pacific Islander personnel from 2013 through 2016 of seven percent, 2017 experienced a two percentage point increase. Historically from 2013 through 2017, Asian/Pacific Islander officers accounted for four of the 54 total employees involved in ICD incidents, or seven percent. < > The following depicts the percentage of personnel involved in ICD incidents in 2017 based on their respective years of service classifications: Less than one year of service zero percent (zero out of 11 total officers); 1-5 years of service 36 percent (four out of 11 total officers); 6-10 years of service 55 percent (six out of 11 total officers); years of service zero percent (zero out of 11 total officers); and, More than 20 years of service nine percent (one out of 11 total officers). The two employees involved in 2016 ICD incidents were both within the 6-10 years of service category. This particular years of service category in 2017 experienced a 45 percentage point decrease compared to In 2017, there were percentage point decreases in all five years of service categories when compared to the aggregate percentage of personnel involved in ICD incidents during the four-year period from 2013 through The following depicts these changes: Years Less than More than Total Less than one year of service five percentage point decrease (five percent during four-year period, zero percent in 2017); 1-5 years of service 22 percentage point decrease (26 percent during four-year period, four percent in 2017); 6-10 years of service 31 percentage point decrease (37 percent during four-year period, six percent in 2017); years of service 21 percentage point decrease (21 percent during four-year period, zero percent in 2017); and, More than 20 years of service three percentage point decrease (12 percent during four-year period, nine percent in 2017). Historically, from 2013 through 2017, a majority of officers involved in ICD incidents had 6-10 years of service, accounting for 22 of the 54 total employees, or 41 percent. Officers with 1-5 years of service accounted for the second largest category with a total of 15 employees, or 28 percent, during the same five-year period. Officers with years of service were the third largest group, with nine personnel, or 17 percent, followed by officers with more than 20 years of service, which had six officers, or 11 percent. Officers with less than one year of service, which accounted for two officers, represented four percent of the total USE OF FORCE YEAR-END REVIEW LOS ANGELES POLICE DEPARTMENT 253
128 {CUOF INCIDENTS ICD} OFFICER AREA/DIVISION OF ASSIGNMENT OFFICER RANK 77TH CENT DEV FTHL HARB HOBK HWD MISN NEWT NHWD NOE OLYM PAC RAMP SOE SOW TOP VNYS WLA WVAL WIL TRFC ADMIN SPCL BUREAU METRO SSD CSD Division/Area/Bureau 77th Street Central Devonshire Foothill Harbor Hollenbeck Hollywood Mission Newton North Hollywood Northeast Olympic Pacific Rampart Southeast Southwest Topanga Van Nuys West Los Angeles West Valley Wilshire All Traffic Divisions Administrative Units Specialized Units Bureau Level Metropolitan Security Services Custody Services Total >LT Rank LT Captain and Above SGT Lieutenant Sergeant DET Detective PO Police Officer DO Detention Officer RO Reserve Officer Total In 2017, nine employees at the rank of police officer were involved in ICD incidents, which represented 82 percent of the 11 total employees. This accounted for an 18 percentage point decrease compared to 100 percent in The percentage of police officers involved in ICD incidents in 2017 was 14 percentage points above the Department s overall police officer total. When compared to the aggregate percentage of involved personnel at the rank of police officer from 2013 through 2016 of OFFICER UNIT OF ASSIGNMENT ADMIN Unit METRO PATROL SPCL INV CSD OTH percent, 2017 experienced a nine percentage point decrease. Historically, from 2013 through 2017, a majority of personnel involved in ICD incidents were at the rank of police officer, accounting for 48 of the 54 total employees, or 89 percent. The two remaining employees involved in 2017 ICD incidents, representing 18 percent, were at the rank of reserve police officer and sergeant. Administrative Metropolitan Patrol Specialized Investigative Custody Other Total In 2017, seven personnel assigned to Hollenbeck Division were involved in ICD incidents, which represented 64 percent of the 11 total employees. This accounted for all of Hollenbeck Division personnel involved in ICD incidents during the five-year period from 2013 through In 2017, two personnel assigned to Foothill Division were involved in ICD incidents, which represented 18 percent of the 11 total employees. In the four-year period from 2013 through 2016, Foothill Division personnel accounted for two of the 43 total employees involved in ICD incidents, representing five percent. The remaining two Department personnel, or 18 percent, were assigned to Hollywood Division and Rampart Division. Based on data for the five-year period from 2013 through 2017, there appears to be no statistical trend associated with the Bureau of assignment for personnel involved in ICD incidents. In 2017, 10 personnel assigned to patrol were involved in ICD incidents, which represented 91 percent of the 11 total personnel. This accounted for a 91 percentage point increase compared to zero percent in When compared to the aggregate percentage of involved personnel assigned to patrol from 2013 through 2016 of 72 percent, 2017 experienced a 19 percentage point increase. Historically, from 2013 through 2017, a majority of officers involved in ICD incidents were assigned to patrol, accounting for 41 of the 54 total employees, or 76 percent. In 2017, one employee assigned to a specialized assignment was involved in an ICD incident, which represented nine percent of the 11 total personnel. This accounted for a 91 percentage point decrease compared to 100 percent in When compared to the aggregate percentage of involved personnel assigned to specialized assignments from 2013 through 2016 of 14 percent, 2017 experienced a five percentage point decrease. Historically, from 2013 through 2017, personnel assigned to specialized assignments accounted for seven of the 54 total employees involved in ICD incidents, or 13 percent USE OF FORCE YEAR-END REVIEW LOS ANGELES POLICE DEPARTMENT 255
129 {CUOF INCIDENTS ICD} OFFICER INJURIES SUSPECT ETHNICITY INJ DEC No Department personnel were killed as a result of ICD incidents during the five-year period from 2013 through However, three officers sustained injuries during the SUSPECT INFORMATION SUSPECT GENDER Category Injured Deceased Total same five-year period. No officers were injured during the five ICD incidents in The suspect sections below include data for all individuals that Department personnel applied force against during occurrences investigated and/or later classified as ICD incidents. Female Male In 2017, all five suspects involved in ICD incidents for the year, or 100 percent, were male. This accounted for a 50 percentage point increase compared to 50 percent in When compared to the aggregate percentage of involved male suspects from 2013 through 2016 of 84 percent, 2017 Gender Female Male Total experienced a 16 percentage point increase. Historically, from 2013 through 2017, a majority of suspects involved in ICD incidents were male, accounting for 21 of the 24 total suspects, or 88 percent. AM IND ASN BLK FILIP HISP WHT OTH In 2017, three Hispanic suspects were involved in ICD incidents, which represented 60 percent of the five total suspects. This accounted for a 10 percentage point increase compared to 50 percent in The percentage of Hispanic suspects involved in ICD incidents in 2017 was 11 percentage points above the City s overall Hispanic population total. Additionally, the percentage of Hispanic suspects involved in ICD incidents in 2017 was 20 percentage points above the City s overall Hispanic violent crime offender total. When compared to the aggregate percentage of involved Hispanic suspects from 2013 through 2016 of 42 percent, 2017 experienced an 18 percentage point increase. Historically, from 2013 through 2017, the Hispanic category was the most represented ethnic group involved in ICD incidents with 11 of the 24 total suspects, or 46 percent. In 2017, two White suspects were involved in ICD incidents, which represented 40 percent of the five total suspects. This accounted for a 40 percentage point increase compared to zero percent in The percentage of White suspects involved in ICD incidents in 2017 was 12 percentage points above the City s overall White population total. Additionally, the percentage of White suspects involved in ICD incidents Ethnicity American Indian Asian/Pacific Islander Black Filipino Hispanic White Other Total Ethnicity City Population Violent Crime Suspect ICD Suspect Asian/Pacific Isl. 12% (See Other) 0% Black 9% 44% 0% Hispanic 49% 40% 60% White 28% 8% 40% Other 2% 3% 0% Unknown DNA 5% 0% Total 100% 100% 100% in 2017 was 32 percentage points above the City s overall White violent crime offender total. When compared to the aggregate percentage of involved White suspects from 2013 through 2016 of 37 percent, 2017 experienced a three percentage point increase. Historically, from 2013 through 2017, the White category was the second most represented ethnic group involved in ICD incidents with nine of the 24 total suspects, or 38 percent USE OF FORCE YEAR-END REVIEW LOS ANGELES POLICE DEPARTMENT 257
130 {CUOF INCIDENTS ICD} SUSPECT AGE SUSPECT GANG MEMBERSHIP > Age and Above Total Pursuant to California Assembly Bill 90, the Fair and Accurate Gang Database Act of 2017, Department resources housing gang membership information were temporarily DECEASED SUSPECT TOXICOLOGY RESULTS disabled effective January 1, As such, the Department was unable to determine whether suspects involved in UOF incidents were designated as gang members. YES In 2017, two of the five suspects involved in ICD incidents, or 40 percent, were in the age range. This particular age category accounted for a 10 percentage point decrease compared to 50 percent in When compared to the aggregate percentage of involved suspects within the age range from 2013 through 2016 of 37 percent, 2017 experienced a three percentage point increase. Historically, from 2013 through 2017, the age group accounted for nine of the 24 total suspects involved in ICD incidents, representing 38 percent. In 2017, two of the five suspects involved in ICD incidents, or 40 percent, were in the age range. This particular SUSPECT PERCEIVED MENTAL ILLNESS age category accounted for a 40 percentage point increase compared to zero percent in When compared to the aggregate percentage of involved suspects within the age range from 2013 through 2016 of 26 percent, 2017 experienced a 14 percentage point increase. Historically, from 2013 through 2017, the age group accounted for seven of the 24 total suspects involved in ICD incidents, representing 29 percent. The one remaining suspect in a 2017 ICD incident, representing 20 percent, was within the age range. NO PEND Of the five decedents involved in 2017 ICD incidents, two of which that have completed toxicology examinations by the Los Angeles County Department of Medical Examiner Coroner, both individuals, representing 100 percent of those completed cases, had positive results for alcohol and/or a controlled substance(s). Toxicology reports for the remaining three decedents, or 60 percent of the five total decedents, are pending from the Los Angeles County Department of Medical Examiner Coroner s Office. Substance Present Yes No Unknown/Pending Total The partial 2017 percentage of completed cases with positive alcohol and/or a controlled substance results, representing 100 percent, represented no percentage change when compared to 100 percent of positive cases in When compared to the aggregate percentage of decedents with positive toxicology results for alcohol and/ or a controlled substance(s) during ICD incidents from 2013 through 2016 of 84 percent, 2017 experienced a 16 percentage point increase. YES NO Per. Mental Illness Yes No Total In 2017, one of the five total suspects, representing 20 percent, involved in an ICD incident was perceived to suffer from a mental illness and/or a mental health crisis. This accounted for a 20 percentage point increase compared to zero percent in When compared to the aggregate percentage of involved suspects who were perceived to suffer from a mental illness and/or a mental health crisis from 2013 through 2016 of 21 percent, 2017 experienced a one percentage point decrease. Historically from 2013 through 2017, suspects who were perceived to suffer from a mental illness and/or a mental health crisis accounted for five of the 24 total suspects, or 21 percent USE OF FORCE YEAR-END REVIEW LOS ANGELES POLICE DEPARTMENT 259
131 {CUOF INCIDENTS ICD} SUSPECT TOXICOLOGY ANALYSIS SUSPECT HOMELESS 34 ALCOH COCA MARIJ METH OPIATE PCP PSYCH OTH UNK NONE PEND Substance Alcohol Cocaine Marijuana Methamphetamine Opiates PCP Psychiatric Medication Other Unknown None Pending YES NO UNK In 2017, one of the five total suspects, or 20 percent, involved in ICD incidents was homeless. This accounted for a 20 percentage point increase compared to zero percent Homeless Yes N/A N/A N/A 0 1 No N/A N/A N/A 2 4 Unknown N/A N/A N/A 0 0 Total in From 2016 through 2017, homeless suspects involved in ICD incidents accounted for one of the seven total suspects, representing 14 percent. As of year-end 2017, toxicology results for three decedents involved in ICD incidents for the year were unavailable due to pending toxicology reports from the Los Angeles County Department of Medical Examiner Coroner. In 2017, both of the ICD decedents with completed toxicology examinations, or 100 percent, had positive results for methamphetamine. This partial 2017 percentage accounted for a 50 percentage point increase compared to 50 percent of decedents with positive methamphetamine results in 2016 ICD incidents. Historically, eight of the 19 decedents involved in 2013 through 2016 ICD incidents, representing 42 percent, had positive toxicology results for methamphetamine. Substance Alcohol 0% 0% 22% 50% N/A Cocaine 25% 75% 11% 0% N/A Marijuana 50% 25% 22% 0% N/A Methamphetamine 50% 25% 44% 50% N/A Opiates 25% 0% 22% 50% N/A PCP 25% 0% 0% 0% N/A Psychiatric Medication 25% 25% 11% 50% N/A Other 0% 0% 0% 0% N/A Unknown 0% 0% 0% 0% N/A None 0% 0% 33% 0% N/A SUSPECT WEAPON/FORCE AUTO EDGED FARM IMPACT PERCP PHYS REPL OTH NONE Weapon Type Automobile Edged Weapon Firearm Impact Device Perception Physical Force Replica/Pellet Other None In 2017, one of the two ICD decedents with completed toxicology examinations, or 50 percent, had positive results for marijuana. This partial 2017 percentage accounted for a 50 percentage point increase compared to zero percent of decedents with positive marijuana results in 2016 ICD incidents. Historically, five of the 19 decedents involved in 2013 through 2016 ICD incidents, representing 26 percent, had positive toxicology results for marijuana. DNA DNA Total Of the two 2017 ICD incidents in which suspects were armed with a weapon or used some type of force, one suspect, representing 20 percent, was armed with an impact device. This accounted for the only impact device utilized by ICD suspects during the five-year period from 2013 through Of the two 2017 ICD incidents in which suspects were armed with a weapon or used some type of force, one suspect, representing 20 percent, utilized physical force. This accounted for a 30 percentage point decrease compared to 50 percent of ICD suspects who used physical force in 2016 ICD incidents. When compared to the aggregate percentage of ICD suspects who used physical force during the four-year period from 2013 through 2016 of 47 percent, 2017 experienced a three percentage point increase. Historically, from 2013 through 2017, physical force was the most utilized suspect weapon/force type in ICD incidents, used by 10 of the 24 total ICD suspects, or 42 percent. No suspect weapons and/or force were utilized by three of the five total ICD suspects in The Department was directed by the BOPC to track homeless data for suspects involved in CUOF incidents starting in Force Investigation Division has since implemented new procedures to capture this statistic USE OF FORCE YEAR-END REVIEW LOS ANGELES POLICE DEPARTMENT 261
132 {CUOF INCIDENTS ICD} SUSPECT INJURIES DEPARTMENT ADJUDICATION 36 TACTICAL DEBRIEF/IN-POLICY (NO FURTHER ACTION) INJ DEC Category Injured Deceased Total TAC D&E N-LETH L-LETH LETH Category Tactics N/A Drawing & Exhibiting N/A Non-Lethal N/A Less Lethal N/A Lethal N/A Total N/A Because ICD incidents only involve suspects who are deceased, this section does not include those who only sustained injuries (those who sustained injuries that required hospitalization, but are not deceased, are included in the LERII section). SUSPECT MANNER OF DEATH 35 In 2017, five individuals died while in the Department s custody. When compared to the 2016 total of two, 2017 accounted for three more decedents, representing a 150 percent increase. When compared to the 2013 through 2016 annual average of 4.75 decedents from ICD incidents, 2016 was 0.25 decedents, or five percent, above the fouryear annual average. In 2016, two out of the two total ICD Tactics findings, representing 100 percent, were adjudicated as Tactical Debrief. This accounted for a 38 percentage point increase compared to 62 percent in When compared to the aggregate percentage of Tactical Debrief Tactics findings from 2013 through 2015 of 86 percent, 2016 experienced a 14 percentage point increase. Historically, from 2013 through 2016, a majority of adjudicated Tactics findings resulted in a Tactical Debrief outcome, accounting for 38 of the 44 total Tactics findings, or 86 percent. In 2016, the one ICD Non-Lethal force finding was adjudicated as In Policy (No Further Action). This represented no change when compared to the same percentage of In Policy (No Further Action) Non-Lethal force findings in When compared to the aggregate percentage of In Policy (No Further Action) Non-Lethal force findings from 2013 through 2015 of 100 percent, 2016 again experienced no percentage change. Historically, from 2013 through 2016, all adjudicated Non-Lethal force findings resulted in an In Policy (No Further Action) outcome. ACC HOM OD SUIC UND PEND In 2017, one of the five decedents, representing 20 percent, died from accidental causes. One additional suspect, again representing 20 percent, died from a manner of death indicative of homicide. The three remaining decedents, or 60 percent, currently have pending Manner of Death classifications, pending completion of their respective investigations by FID. In 2016, one of the two decedents, representing 50 percent, died from accidental causes. This accounted for a six percentage point decrease of decedent deaths attributed to accidental causes compared to 56 percent in When compared to the aggregate percentage of ICD decedents who died from accidental causes during the threeyear period from 2013 through 2015 of 47 percent, 2016 experienced a three percentage point increase. Historically, Manner Accidental Homicide Overdose Suicide Undetermined Pending Total during the four-year period from 2013 through 2016, ICD deaths attributed to accidental causes accounted for nine of the 19 total ICD deaths, or 47 percent. In 2016, one of the two decedents, representing 50 percent, died from a manner of death indicative of suicide. This accounted for a 28 percentage point increase of decedent deaths attributed to suicide compared to 22 percent in When compared to the aggregate percentage of ICD decedents who died from suicide during the threeyear period from 2013 through 2015 of 18 percent, 2016 experienced a 32 percentage point increase. Historically, during the four-year period from 2013 through 2016, ICD deaths attributed to suicide accounted for four of the 19 total ICD deaths, or 21 percent. ADMINISTRATIVE DISAPPROVAL/OUT OF POLICY (ADMINISTRATIVE DISAPPROVAL) TAC D&E N-LETH L-LETH LETH In 2016, the one ICD Less-Lethal force finding was adjudicated as Out of Policy (Administrative Disapproval). In the prior three-year period from 2013 through 2015, only one additional Less-Lethal force finding was Out of Policy (Administrative Disapproval). Category Tactics N/A Drawing & Exhibiting N/A Non-Lethal N/A Less Lethal N/A Lethal N/A Total N/A Historically, from 2013 through 2016, two of the six total Less-Lethal force findings, representing 33 percent, resulted in an Out of Policy (Administrative Disapproval) outcome. 35 The Los Angeles County Department of Medical Examiner Coroner determines the manner of death. As of year-end 2017, the Department was awaiting the completion of three autopsy reports from the Coroner s office, which include manner of death determinations. 36 Adjudication data for 2017 was omitted from this Report since a vast majority of the CUOF incidents will be adjudicated by the BOPC in USE OF FORCE YEAR-END REVIEW LOS ANGELES POLICE DEPARTMENT 263


133 USE OF FORCE YEAR-END REVIEW LOS ANGELES POLICE DEPARTMENT 265
134 {CUOF INCIDENTS CRCH} CAROTID RESTRAINT CONTROL HOLD INCIDENTS An upper body control hold by a Department employee, including the modified carotid, full carotid, and locked carotid hold (2017 LAPD Manual 3/792.05). OPERATIONS-SOUTH BUREAU No CRCH incidents occurred within the geographical area of South Bureau in In the four-year period from 2013 through 2016, one CRCH incident occurred in South Bureau, resulting in an annual average of 0.25 incidents. Area 77th Street Southeast Harbor Southwest Total ANNUAL DEPARTMENT TOTALS OPERATIONS-WEST BUREAU In 2017, Department personnel were involved in two CRCH incidents, which remained an unchanged total compared to In the four-year period from 2013 through 2016, there were a total of six CRCH incidents, resulting in an annual average of 1.5 incidents. The 2017 count exceeded the 2013 through 2016 annual average by 0.5 incidents, or 33 percent. CRCH Department Total No CRCH incidents occurred within the geographical area of West Bureau during the five-year period from 2013 through Area Hollywood Olympic Pacific West Los Angeles Wilshire Total SOURCE OF ACTIVITY OPERATIONS-VALLEY BUREAU In 2017, one of the two CRCH incidents resulted from a field detention based on officers observations (i.e. pedestrian and traffic stops), and the other resulted from a station call. Based on the data for the five-year period from 2013 through 2017, there appears to be no significant statistical trend associated with the source of activity for CRCH incidents. Source Radio Call Observation Citizen Flag Down Pre-Planned Station Call Ambush Off-Duty Other Total No CRCH incidents occurred within the geographical area of Valley Bureau in In the four-year period from 2013 through 2016, two CRCH incidents occurred in Valley Bureau, resulting in an annual average of 0.5 incidents. Area Devonshire Foothill Mission North Hollywood Topanga Van Nuys West Valley Total BUREAU OF OCCURRENCE OPERATIONS-CENTRAL BUREAU OUTSIDE JURISDICTION In 2017, both of the Department s CRCH incidents occurred within the geographical area of Central Bureau, which was an increase of one incident, or 100 percent, compared to In the four-year period from 2013 through 2016, two CRCH incidents occurred in Central Bureau, resulting in an annual average of 0.5 incidents. The Central Bureau count for 2017 exceeded the 2013 through 2016 annual average by 1.5 incidents, or 300 percent. Area Central Newton Northeast Rampart Hollenbeck Total No CRCH incidents occurred outside the Department s geographical jurisdiction in In the four-year period from 2013 through 2016, one CRCH incident occurred outside the Department s geographical jurisdiction, resulting in an annual average of 0.25 incidents. Area Outside Jurisdiction USE OF FORCE YEAR-END REVIEW LOS ANGELES POLICE DEPARTMENT 267
135 {CUOF INCIDENTS CRCH} MONTH OF OCCURRENCE OFFICER INFORMATION In 2017, one of the CRCH incidents occurred in May, and the other in July. Based on the data for the five-year period from 2013 through 2017, there appears to be no statistical trend associated with the month of occurrence for CRCH incidents. Month January February March April May June July August September October November December Total The officer sections below include data for all employees who received, or were pending, BOPC lethal force adjudicative findings for their involvement in CRCH incidents. In 2017, two Department personnel were involved in the two CRCH incidents throughout the year, resulting in an OFFICER GENDER In 2017, two male officers were involved in CRCH incidents, which represented 100 percent of the two total employees. In the five-year period from 2013 through 2017, all eight involved personnel in CRCH incidents were male. average of one officer per incident. This represented no change when compared to the same officer per incident average in Similarly, the 2017 officer to incident average represented no change when compared to the same officer to incident aggregate annual average from 2013 through Gender Female Male Total DAY OF OCCURRENCE OFFICER ETHNICITY In 2017, one of the CRCH incidents occurred on a Monday, and the other on a Tuesday. Based on the data for the five-year period from 2013 through 2017, there appears to be no statistical trend associated with the day of occurrence for CRCH incidents. Day Monday Tuesday Wednesday Thursday Friday Saturday Sunday Total In 2017, one Black officer was involved in a CRCH incident, which represented 50 percent of the two total employees. In the four-year period from 2013 through 2016, no Black officers were involved in CRCH incidents. In 2017, one Hispanic officer was involved in a CRCH incident, which represented 50 percent of the two total employees. When compared to the aggregate percentage of involved Hispanic personnel from 2013 through 2016 of 33 percent, 2017 experienced a 17 percentage point increase. Historically, from 2013 through 2017, three Hispanic officers were involved in CRCH incidents, which accounted for 38 percent of the eight total employees. Ethnicity American Indian Asian/Pacific Islander Black Filipino Hispanic White Other Total TIME OF OCCURRENCE In 2017, one of the CRCH incidents occurred between the hours of 6 a.m. and 5:59 p.m., and the other between the hours of 6 p.m. and 5:59 a.m. Based on the data for the five-year period from 2013 through 2017, there appears to be no statistical trend associated with the time of occurrence for CRCH incidents. Time of Day Total Ethnicity City Population Department Personnel CRCH Personnel Asian/Pacific Isl. 12% 8% 0% Black 9% 10% 50% Hispanic 49% 47% 50% White 28% 32% 0% Other 2% 3% 0% Total 100% 100% 100% USE OF FORCE YEAR-END REVIEW LOS ANGELES POLICE DEPARTMENT 269
136 {CUOF INCIDENTS CRCH} OFFICER YEARS OF SERVICE OFFICER AREA/DIVISION OF ASSIGNMENT In 2017, one of the two involved employees in CRCH incidents, or 50 percent, were within the 6-10 years of service category. When compared to the aggregate percentage of involved personnel within the 6-10 years of service category from 2013 through 2016 of 50 percent, 2016 experienced no percentage point change. Historically, from 2013 through 2017, four of the eight total involved personnel, or 50 percent, were within the 6-10 years of service category. In 2017, one of the two involved employees in CRCH incidents, or 50 percent, were within the years of service category. When compared to the aggregate percentage of involved personnel within the years of service category from 2013 through 2016 of 17 percent, 2016 experienced a 33 percentage point increase. Historically, from 2013 through 2017, two of the eight total involved personnel, or 25 percent, were within the years of service category. OFFICER RANK In 2017, the two employees involved in CRCH incidents, or 100 percent, were at the rank of police officer. During the prior four-year period from 2013 through 2016, all involved personnel in CRCH incidents were in this same rank category. Years Less than More than Total Rank Captain and Above Lieutenant Sergeant Detective Police Officer Detention Officer Other Total In 2017, one of the two involved personnel in CRCH incidents, representing 50 percent, was assigned to a Traffic Division. The other officer was assigned to 77th Street Division. Based on the data for the five-year period from 2013 through 2017, there appears to be no statistical trend associated with an employee s Area/Division and/or Bureau of assignment for CRCH incidents. Division/Area/Bureau 77th Street Central Devonshire Foothill Harbor Hollenbeck Hollywood Mission Newton North Hollywood Northeast Olympic Pacific Rampart Southeast Southwest Topanga Van Nuys West Los Angeles West Valley Wilshire All Traffic Divisions Administrative Units Specialized Units Bureau Level Metropolitan Security Services Other Areas Total OFFICER UNIT OF ASSIGNMENT OFFICER INJURIES In 2017, the two employees involved in CRCH incidents, or 100 percent, were assigned to patrol. Historically, from 2013 through 2017, personnel assigned to patrol accounted for six of the eight total employees involved in CRCH incidents, or 75 percent. Unit Administrative Metropolitan Patrol Specialized Detective Police Officer Detention Officer Other Total No Department personnel were killed during or resulting from CRCH incidents during the five-year period from 2013 through However, 13 officers sustained injuries during CRCH incidents during the same five-year period. In 2017, three officers sustained injuries during the two CRCH incidents throughout the year. This accounted for a 25 percent decrease compared to four injured officers in However, when compared to the 2013 through 2016 annual average of 2.5 injured officers, 2017 was 0.5 officers, or 20 percent, above the four-year annual average. Category Injured Deceased Total USE OF FORCE YEAR-END REVIEW LOS ANGELES POLICE DEPARTMENT 271
137 {CUOF INCIDENTS CRCH} SUSPECT INFORMATION The suspect sections below include data for all individuals that Department personnel applied lethal force against during CRCH incidents. SUSPECT ETHNICITY In 2017, one Hispanic suspect was involved in a CRCH incident, which represented 50 percent of the two total suspects. During the four-year period from 2013 through 2016, Hispanic suspects accounted for three of the six total suspects involved in CRCH incidents, or 50 percent. Additionally, during the five-year period from 2013 through 2017, involved Hispanic suspects accounted for four of the eight total CRCH suspects, or 50 percent. In 2017, one White suspect was involved in a CRCH incident, which represented 50 percent of the two total suspects. During the four-year period from 2013 through 2016, White suspects accounted for two of the six total suspects involved in CRCH incidents, or 33 percent. Additionally, during the five-year period from 2013 through 2017, involved White suspects accounted for three of the eight total CRCH suspects, or 38 percent. Ethnicity American Indian Asian/Pacific Islander Black Filipino Hispanic White Other Total Ethnicity City Population Violent Crime Suspect CRCH Suspect Asian/Pacific Isl. 12% (See Other) 0% Black 9% 44% 0% Hispanic 49% 40% 50% White 28% 8% 50% Other 2% 3% 0% Unknown DNA 5% 0% Total 100% 100% 100% SUSPECT PERCEIVED MENTAL ILLNESS Neither of the suspects involved in CRCH incidents in 2017 were perceived to suffer from a mental illness and/or a mental health crisis. Historically from 2013 through 2017, suspects involved in CRCH incidents who were perceived to suffer from a mental illness and/or a mental health crisis accounted for two of the eight total suspects, or 25 percent. SUSPECT HOMELESS 37 In 2017, one of the two suspects involved in CRCH incidents, representing 50 percent, was homeless. This represented no change compared to the same percentage of 2016 CRCH suspects who were determined to be homeless. SUSPECT GANG MEMBERSHIP Pursuant to California Assembly Bill 90, the Fair and Accurate Gang Database Act of 2017, Department resources housing gang membership information were temporarily Per. Mental Illness Yes No Total Homeless Yes N/A N/A N/A 1 1 No N/A N/A N/A 1 1 Unknown N/A N/A N/A 0 0 Total disabled effective January 1, As such, the Department was unable to determine whether suspects involved in UOF incidents were designated as gang members. SUSPECT GENDER SUSPECT WEAPON/FORCE All suspects involved in CRCH incidents during the fiveyear period from 2013 through 2017 were male. SUSPECT AGE Both suspects involved in 2017 CRCH incidents were within the age group. Based on the data for the fiveyear period from 2013 through 2017, there appears to be no statistical trend associated with the age of suspects involved in CRCH incidents. Gender Female Male Total Age and Above Total Both suspects involved in 2017 CRCH incidents utilized physical force. Comparatively, during the four-year period from 2013 through 2016, five of the six total suspects, or 83 percent, utilized physical force. Weapon Type Automobile Edged Weapon Firearm Impact Device Perception Physical Force Replica/Pellet Other None Total The Department was directed by the BOPC to track homeless data for suspects involved in CUOF incidents starting in Force Investigation Division has since implemented new procedures to capture this statistic USE OF FORCE YEAR-END REVIEW LOS ANGELES POLICE DEPARTMENT 273

138 {CUOF INCIDENTS CRCH} SUSPECT INJURIES No suspects were killed during CRCH incidents during the five-year period from 2013 through However, all eight involved suspects during the same five-year period sustained injuries during the respective incidents. Both suspects involved in 2017 CRCH incidents sustained injuries. This represented no change when compared to the same number of injured suspects in When compared to the 2013 through 2016 annual average of 1.5 injured suspects, 2017 was 0.5 injured suspects, or 33 percent, above the four-year annual average. Category Injured Deceased Total DEPARTMENT ADJUDICATION 38 TACTICAL DEBRIEF/IN-POLICY (NO FURTHER ACTION) In 2016, both CRCH Lethal force findings were adjudicated as In Policy (No Further Action). When compared to the aggregate percentage of In Policy (No Further Action) findings from 2013 through 2015 of 75 percent, 2016 experienced a 25 percentage point increase. Historically, from 2013 through 2016, a majority of adjudicated Lethal force findings resulted in an In Policy (No Further Action) outcome, representing five of the six total findings, or 83 percent. Category Tactics N/A Drawing & Exhibiting N/A Non-Lethal N/A Less Lethal N/A Lethal N/A Total N/A ADMINISTRATIVE DISAPPROVAL/OUT OF POLICY (ADMINISTRATIVE DISAPPROVAL) In 2016, both CRCH Tactics finding were adjudicated as Administrative Disapproval. This accounted for a 100 percentage point increase compared to no Administrative Disapproval tactics findings during the three-year period from 2013 through Category Tactics N/A Drawing & Exhibiting N/A Non-Lethal N/A Less Lethal N/A Lethal N/A Total N/A 38 Adjudication data for 2017 was omitted from this Report since a vast majority of the CUOF incidents will be adjudicated by the BOPC in USE OF FORCE YEAR-END REVIEW LOS ANGELES POLICE DEPARTMENT 275
139 {CUOF INCIDENTS LERII} LAW ENFORCEMENT RELATED INJURY INVESTIGATION INCIDENTS A use of force incident resulting in an injury requiring hospitalization, commonly referred to as a law enforcement related injury (2017 LAPD Manual 3/792.05). ANNUAL DEPARTMENT TOTALS 39 BUREAU OF OCCURRENCE OPERATIONS-CENTRAL BUREAU DEPT TTL LERII Department Total CENT NEWT NOE RAMP HOBK Area Central Newton Northeast Rampart Hollenbeck Total In 2017, Department personnel were involved in four LERII incidents, a decrease of six incidents, or 60 percent, compared to In the four-year period from 2013 through 2016, there were a total of 47 LERII incidents, resulting in an annual average of incidents. The 2017 count fell below the 2013 through 2016 annual average by 7.75 incidents, or 66 percent. In 2017, three of the Department s LERII incidents occurred within the geographical area of Central Bureau, which was an increase of two incidents, or 50 percent, compared to In the four-year period from 2013 through 2016, 15 LERII incidents occurred in Central Bureau, resulting in an annual average of 3.75 incidents. The Central Bureau count for 2017 fell below the 2013 through 2016 annual average by 0.75 incidents, or 20 percent. SOURCE OF ACTIVITY OPERATIONS-SOUTH BUREAU RCALL OBS CZN FD PRE-PLN SCALL AMB OFF DTY OTH Source Radio Call Observation Citizen Flag Down Pre-Planned Station Call Ambush Off-Duty Other Total TH SOE HARB SOW No LERII incidents occurred within the geographical area of South Bureau in Area 77th Street Southeast Harbor Southwest Total In the four-year period from 2013 through 2016, seven LERII incident occurred in South Bureau, resulting in an annual average of 1.75 incidents. In 2017, all four LERII incidents resulted from radio calls. This accounted for a 50 percentage point increase compared to 50 percent of LERII incidents resulting from radio calls in When compared to the 2013 through 2016 aggregate percentage of LERII incidents resulting from radio calls of 60 percent, 2016 experienced a 40 percentage point increase. Historically, from 2013 through 2017, 32 of the 51 total LERII incidents, or 63 percent, resulted from radio calls. 39 Case F reclassified from Head Strike investigation to LERII investigation USE OF FORCE YEAR-END REVIEW LOS ANGELES POLICE DEPARTMENT 277
140 {CUOF INCIDENTS LERII} OPERATIONS-WEST BUREAU MONTH OF OCCURRENCE HWD OLYM PAC WLA WIL No LERII incidents occurred within the geographical area of West Bureau in Area Hollywood Olympic Pacific West Los Angeles Wilshire Total In the four-year period from 2013 through 2016, 12 LERII incident occurred in West Bureau, resulting in an annual average of three incidents. JAN FEB MAR APR MAY JUN JUL AUG SEP OCT NOV DEC Month January February March April May June July August September October November December Total OPERATIONS-VALLEY BUREAU DEV FTHL MISN NHWD TOP VNYS WVAL In 2017, one of the Department s LERII incidents occurred within the geographical area of Valley Bureau, which was a decrease of one incident, or 50 percent, compared to In the four-year period from 2013 through 2016, 13 LERII Area Devonshire Foothill Mission North Hollywood Topanga Van Nuys West Valley Total incidents occurred in Valley Bureau, resulting in an annual average of 3.25 incidents. The Valley Bureau count for 2017 fell below the 2013 through 2016 annual average by 2.25 incidents, or 69 percent. Based on the data for the five-year period from 2013 through 2017, there appears to be no statistical trend associated with the month of occurrence for LERII incidents. DAY OF OCCURRENCE MON TUE WED THUR FRI SAT SUN Day Monday Tuesday Wednesday Thursday Friday Saturday Sunday Total Based on the data for the five-year period from 2013 through 2017, there appears to be no statistical trend associated with the day of occurrence for LERII incidents. OUTSIDE JURISDICTION TIME OF OCCURRENCE No LERII incidents occurred outside the Department s geographical jurisdiction in the five-year period from 2013 through Area Outside Jurisdiction Time of Day Total In 2017, three of the four LERII incidents occurred between the hours of 6 a.m. and 5:59 p.m., and the other between the hours of 6 p.m. and 5:59 a.m. Based on the data for the five-year period from 2013 through 2017, there appears to be no significant statistical trend associated with the time of occurrence for LERII incidents USE OF FORCE YEAR-END REVIEW LOS ANGELES POLICE DEPARTMENT 279
141 {CUOF INCIDENTS LERII} OFFICER INFORMATION OFFICER GENDER The officer sections below include data for all employees who received, or were pending, BOPC non-lethal, lesslethal, and lethal force adjudicative findings for their involvement in LERII incidents. In 2017, 20 Department personnel were involved in the five LERII incidents throughout the year, resulting in an OFFICER ETHNICITY AM IND ASN BLK FILIP HISP WHT OTH average of five officers per incident. This accounted for a 43 percent increase compared to an average of 3.5 officers per incident in The 2017 officer to incident average exceeded the 2013 through 2016 aggregate annual average of 3.6 by 39 percent. Ethnicity American Indian Asian/Pacific Islander Black Filipino Hispanic White Other Total Female Male In 2017, 17 male officers were involved in LERII incidents, which represented 85 percent of the 20 total employees. This accounted for a nine percentage point decrease compared to 94 percent in The percentage of male officers involved in LERII incidents in 2017 was three percentage points above the Department s overall male total. When compared to the aggregate percentage of involved male personnel from 2013 through 2016 of 95 percent, 2017 experienced a 10 percentage point decrease. Historically, from 2013 through 2017, a majority of officers involved in LERII incidents were male, accounting for 180 of the 191 total employees, or 94 percent. OFFICER YEARS OF SERVICE Gender Female Male Total In 2017, three female officers were involved in LERII incidents, which represented 15 percent of the 20 total employees. This accounted for a nine percentage point increase compared to six percent in The percentage of female officers involved in LERII incidents in 2017 was three percentage points below the Department s overall female total. When compared to the aggregate percentage of involved female personnel from 2013 through 2016 of five percent, 2017 experienced a 10 percentage point increase. Historically, from 2013 through 2017, females accounted for 11 of the 191 total involved employees, or six percent. In 2017, 10 Hispanic officers were involved in LERII incidents, which represented 50 percent of the 20 total employees. This accounted for a 19 percentage point increase compared to 31 percent in The percentage of Hispanic officers involved in LERII incidents in 2017 was three percentage points above the Department s overall Hispanic total. When compared to the aggregate percentage of involved Hispanic personnel from 2013 through 2016 of 47 percent, 2017 experienced a three percentage point increase. Historically, from 2013 through 2017, a majority of officers involved in LERII incidents were Hispanic, accounting for 90 of the 191 total employees, or 47 percent. In 2017, seven White officers were involved in LERII incidents, which represented 35 percent of the 20 total employees. This accounted for an 11 percentage point decrease compared to 46 percent in The percentage of White officers involved in LERII incidents in 2017 was three percentage points above the Department s overall White total. When compared to the aggregate percentage of involved White personnel from 2013 through 2016 of 39 percent, 2017 experienced a four percentage point decrease. Historically, from 2013 through 2017, White officers represented the second largest ethnic category of personnel involved in LERII incidents, accounting for 73 of the 191 total employees, or 38 percent. Ethnicity City Population Department Personnel LERII Personnel Asian/Pacific Isl. 12% 8% 5% Black 9% 10% 10% Hispanic 49% 47% 50% White 28% 32% 35% Other 2% 3% 0% Total 100% 100% 100% In 2017, two Black officers were involved in LERII incidents, which represented 10 percent of the 20 total employees. This accounted for a four percentage point increase compared to six percent in The percentage of Black officers involved in LERII incidents in 2017 was consistent with the Department s overall Black total. When compared to the aggregate percentage of involved Black personnel from 2013 through 2016 of six percent, 2017 experienced a four percentage point increase. Historically from 2013 through 2017, Black officers accounted for 12 of the 191 total employees involved in LERII incidents, or six percent. One employee, representing five percent, involved in a 2017 LERII incident was Asian/Pacific Islander. < > In 2017, eight of the 20 involved employees in LERII incidents, or 40 percent, were within the years of service category. This accounted for a three percentage point increase compared to 37 percent in When compared to the aggregate percentage of involved personnel within the years of service category from 2013 through 2016 of 27 percent, 2017 experienced a 13 percentage point increase. Historically, from 2013 through 2017, 55 of the 191 total employees involved in LERII incidents, or 29 percent, were within the years of service category. In 2017, six of the 20 involved employees in LERII incidents, or 30 percent, were within the 1-5 years of service category. This accounted for a 16 percentage point increase compared to 14 percent in When compared to the aggregate percentage of involved personnel within the 1-5 years of service category from 2013 through 2016 of 23 percent, 2017 experienced a seven percentage point Years Less than More than Total increase. Historically, from 2013 through 2017, 46 of the 191 total employees involved in LERII incidents, or 24 percent, were within the 1-5 years of service category. In 2017, four of the 20 involved employees in LERII incidents, or 20 percent, were within the 6-10 years of service category. This accounted for a nine percentage point decrease compared to 29 percent in When compared to the aggregate percentage of involved personnel within the 6-10 years of service category from 2013 through 2016 of 37 percent, 2017 experienced a 17 percentage point decrease. Historically, from 2013 through 2017, 68 of the 191 total employees involved in LERII incidents, or 36 percent, were within the 6-10 years of service category. The remaining two employees involved in 2017 LERII incidents, representing 10 percent of the 20 total involved personnel, had more than 20 years of service USE OF FORCE YEAR-END REVIEW LOS ANGELES POLICE DEPARTMENT 281
142 {CUOF INCIDENTS LERII} OFFICER RANK OFFICER AREA/DIVISION OF ASSIGNMENT Rank Division/Area/Bureau >LT LT SGT DET PO DO In 2017, 19 employees at the rank of police officer were involved in LERII incidents, which represented 95 percent of the 20 total employees. This accounted for a two percentage point decrease compared to 97 percent in The percentage of police officers involved in LERII incidents in 2017 was 27 percentage points above the Department s overall police officer total. When compared to the aggregate percentage of involved personnel at the rank of police officer from 2013 through 2016 of 95 percent, Captain and Above Lieutenant Sergeant Detective Police Officer Detention Officer Other Total experienced no percentage change. Historically, from 2013 through 2017, a majority of personnel involved in LERII incidents were at the rank of police officer, accounting for 182 of the 191 total employees, or 95 percent. One employee involved in a 2017 LERII incident, representing five percent of the 20 total involved personnel, was at the rank of sergeant. 77TH CENT DEV FTHL HARB HOBK HWD MISN NEWT NHWD NOE OLYM PAC RAMP SOE SOW TOP VNYS WLA WVAL WIL 77th Street Central Devonshire Foothill Harbor Hollenbeck Hollywood Mission Newton North Hollywood Northeast Olympic Pacific Rampart Southeast Southwest Topanga Van Nuys West Los Angeles West Valley Wilshire TRFC All Traffic Divisions ADMIN Administrative Units SPCL Specialized Units BUREAU Bureau Level METRO SSD Metropolitan Security Services Other Areas Total One 2017 LERII incident that occurred in Northeast Division accounted for the involvement of six personnel assigned to Northeast Division. From 2013 through 2016, 13 personnel assigned to Northeast Division were involved in LERII incidents, which represented eight percent of the 171 total involved employees in all LERII incidents during the same four-year period. One 2017 LERII incident that occurred in West Valley Division accounted for the involvement of seven personnel assigned to West Valley Division. From 2013 through 2016, 12 personnel assigned to West Valley Division were involved in LERII incidents, which represented seven percent of the 171 total involved employees in all LERII incidents during the same four-year period. One 2017 LERII incident that occurred in Rampart Division accounted for the involvement of three personnel assigned to Rampart Division. From 2013 through 2016, three personnel assigned to Rampart Division were involved in LERII incidents, which represented two percent of the 171 total involved employees in all LERII incidents during the same four-year period. One 2017 LERII incident that occurred in Hollenbeck Division accounted for the involvement of four personnel assigned to Metropolitan Division. From 2013 through 2016, 14 personnel assigned to Metropolitan Division were involved in LERII incidents, which represented eight percent of the 171 total involved employees in all LERII incidents during the same four-year period USE OF FORCE YEAR-END REVIEW LOS ANGELES POLICE DEPARTMENT 283
143 {CUOF INCIDENTS LERII} OFFICER UNIT OF ASSIGNMENT ADMIN METRO PATROL SPCL INV CSD OTH In 2017, 16 personnel assigned to patrol were involved in LERII incidents, which represented 80 percent of the 20 total personnel. This accounted for a 37 percentage point increase compared to 43 percent in When compared to the aggregate percentage of involved personnel assigned to patrol from 2013 through 2016 of 69 percent, 2017 experienced an 11 percentage point increase. Historically, from 2013 through 2017, a majority of officers involved in LERII incidents were assigned to patrol, accounting for 134 of the 191 total employees, or 70 percent. OFFICER INJURIES INJ DEC No Department personnel were killed during or resulting from LERII incidents during the five-year period from 2013 through However, 32 officers sustained injuries during LERII incidents during the same five-year period. Unit Administrative Metropolitan Patrol Specialized Investigative Custody Other Total In 2017, four personnel assigned to Metropolitan Division were involved in LERII incidents, which represented 20 percent of the 20 total personnel. This accounted for a 14 percentage point decrease compared to 34 percent in When compared to the aggregate percentage of involved personnel assigned to Metropolitan Division from 2013 through 2016 of nine percent, 2017 experienced an 11 percentage point increase. Historically, from 2013 through 2017, personnel assigned to Metropolitan Division accounted for 19 of the 191 total employees involved in LERII incidents, or 10 percent. Category Injured Deceased Total In 2017, three officers sustained injuries during the four LERII incidents throughout the year. This accounted for a 62 percent decrease compared to eight injured officers in Additionally, when compared to the 2013 through 2016 annual average of 7.25 injured officers, 2017 was 4.25 officers, or 59 percent, below the four-year annual average. SUSPECT INFORMATION The suspect sections below include data for all individuals that Department personnel applied force against during LERII incidents. SUSPECT ETHNICITY AM IND ASN BLK FILIP HISP WHT OTH In 2017, two Hispanic suspects were involved in LERII incidents, which represented 50 percent of the four total suspects. This accounted for a 30 percentage point increase compared to 20 percent in The percentage of Hispanic suspects involved in LERII incidents in 2017 was one percentage point above the City s overall Hispanic population total. Additionally, the percentage of Hispanic suspects involved in LERII incidents in 2017 was 10 percentage points above the City s overall Hispanic violent crime offender total. When compared to the aggregate percentage of involved Hispanic suspects from 2013 through 2016 of 40 percent, 2017 experienced a 10 percentage point increase. Historically, from 2013 through 2017, the Hispanic category was the most represented ethnic group involved in LERII incidents with 21 of the 51 total suspects, or 41 percent. In 2017, one Black suspect was involved in a LERII incident, which represented 25 percent of the four total suspects. This accounted for a 45 percentage point decrease compared to 70 percent in The percentage of Black suspects involved in LERII incidents in 2017 was 16 percentage points above the City s overall Black population total. However, the percentage of Black suspects involved in LERII incidents in 2017 was 19 percentage points below the City s overall Black violent crime offender total. When compared to the aggregate percentage of involved Black suspects from 2013 through 2016 of 36 percent, 2017 experienced an 11 percentage point decrease. Historically, from 2013 through 2017, the Black category was the second Ethnicity American Indian Asian/Pacific Islander Black Filipino Hispanic White Other Total Ethnicity City Population Violent Crime Suspect LERII Suspect Asian/Pacific Isl. 12% (See Other) 0% Black 9% 44% 25% Hispanic 49% 40% 50% White 28% 8% 25% Other 2% 3% 0% Unknown DNA 5% 0% Total 100% 100% 100% most represented ethnic group involved in LERII incidents with 18 of the 51 total suspects, or 35 percent. In 2017, one White suspect was involved in a LERII incident, which represented 25 percent of the four total suspects. This accounted for a 25 percentage point increase compared to zero percent in The percentage of White suspects involved in LERII incidents in 2017 was three percentage points below the City s overall White population total. However, the percentage of White suspects involved in LERII incidents in 2017 was 17 percentage points above the City s overall White violent crime offender total. When compared to the aggregate percentage of involved White suspects from 2013 through 2016 of 15 percent, 2017 experienced an 10 percentage point increase. Historically, from 2013 through 2017, the White category accounted for eight of the 51 total suspects involved in LERII incidents, or 16 percent USE OF FORCE YEAR-END REVIEW LOS ANGELES POLICE DEPARTMENT 285
144 {CUOF INCIDENTS LERII} SUSPECT GENDER SUSPECT PERCEIVED MENTAL ILLNESS Female Male All four suspects involved in 2017 LERII incidents were male, which was the same percentage of suspects in 2016 incidents. During the five-year period from 2013 through Gender Female Male Total , males accounted for 47 of the 51 total LERII suspects, or 92 percent YES NO Per. Mental Illness Yes No Total SUSPECT AGE In 2017, two of the four total suspects, or 50 percent, involved in LERII incidents were perceived to suffer from a mental illness and/or a mental health crisis. This accounted for a 30 percentage point increase compared to 20 percent in When compared to the aggregate percentage of involved suspects who were perceived to suffer from a mental illness and/or a mental health crisis from 2013 through 2016 of 40 percent, 2017 experienced a 10 percentage point increase. Historically from 2013 through 2017, LERII suspects who were perceived to suffer from a mental illness and/or a mental health crisis accounted for 21 of the 51 total suspects, or 41 percent > Age and Above Total SUSPECT GANG MEMBERSHIP Pursuant to California Assembly Bill 90, the Fair and Accurate Gang Database Act of 2017, Department resources housing gang membership information were temporarily disabled effective January 1, As such, the Department was unable to determine whether suspects involved in UOF incidents were designated as gang members. In 2017, two suspects involved in LERII incidents, which represented 50 percent of the four total suspects, were in the age range. This accounted for a 40 percentage point increase compared to 10 percent in When compared to the aggregate percentage of LERII suspects in the age range from 2013 through 2016 of 28 percent, 2017 experienced a 22 percentage point increase. Historically, from 2013 through 2017, the age range accounted for 15 of the 51 total LERII suspects, or 29 percent. In 2017, one suspect involved in a LERII incident, which represented 25 percent of the four total suspects, was in the age range. This accounted for a 15 percentage point decrease compared to 40 percent in When compared to the aggregate percentage of LERII suspects in the age range from 2013 through 2016 of 28 percent, 2017 experienced a three percentage point decrease. Historically, from 2013 through 2017, the age range accounted for 14 of the 51 total LERII suspects, or 27 percent. In 2017, one suspect involved in a LERII incident, which represented 25 percent of the four total suspects, was in the age range. This accounted for a five percentage point decrease compared to 30 percent in When compared to the aggregate percentage of LERII suspects in the age range from 2013 through 2016 of 26 percent, 2017 experienced a one percentage point decrease. Historically, from 2013 through 2017, the age range accounted for 13 of the 51 total LERII suspects, or 25 percent. SUSPECT HOMELESS 40 YES NO UNK In 2017, two of the four suspects involved in LERII incidents, representing 50 percent, were homeless. This represented no change when compared to the same percentage in Homeless Yes N/A N/A N/A 5 2 No N/A N/A N/A 5 2 Unknown N/A N/A N/A 0 0 Total The Department was directed by the BOPC to track homeless data for suspects involved in CUOF incidents starting in Force Investigation Division has since implemented new procedures to capture this statistic USE OF FORCE YEAR-END REVIEW LOS ANGELES POLICE DEPARTMENT 287
145 {CUOF INCIDENTS LERII} SUSPECT WEAPON/FORCE DEPARTMENT ADJUDICATION 41 TACTICAL DEBRIEF/IN-POLICY (NO FURTHER ACTION) AUTO EDGED FARM IMPACT PERCP PHYS REPL OTH NONE All four suspects involved in 2017 LERII incidents utilized physical force against officers during the four respective occurrences. This specific weapon/force type category accounted for a 60 percentage point increase compared to 40 percent in When compared to the aggregate percentage of incidents in which physical force was utilized Weapon Type Automobile Edged Weapon Firearm Impact Device Perception Physical Force Replica/Pellet Other None Total during LERII incidents from 2013 through 2016 of 57 percent, 2017 experienced a 43 percentage point increase. Historically, from 2013 through 2017, the physical force category accounted for 31 of the 51 total suspect weapon/ force types utilized during LERII incidents, or 61 percent. TAC D&E N-LETH L-LETH LETH In 2016, 29 out of the 35 total LERII Tactics findings, representing 83 percent, were adjudicated as Tactical Debrief. This accounted for a four percentage point increase compared to 79 percent in When compared to the aggregate percentage of Tactical Debrief Tactics findings from 2013 through 2015 of 89 percent, 2016 experienced a six percentage point decrease. Historically, from 2013 through 2016, a majority of adjudicated Tactics findings resulted in a Tactical Debrief outcome, accounting for 150 of the 171 total Tactics findings, or 88 percent. Category Tactics N/A Drawing & Exhibiting N/A Non-Lethal N/A Less Lethal N/A Lethal N/A Total N/A In 2016, all 15 Less-Lethal force findings were adjudicated as In Policy (No Further Action). This represented no change when compared to the same percentage in When compared to the aggregate percentage of In Policy (No Further Action) Less-Lethal force findings from 2013 through 2015 of 97 percent, 2016 experienced a three percentage point increase. Historically, from 2013 through 2016, a majority of adjudicated Less-Lethal force findings resulted in an In Policy (No Further Action) outcome, accounting for 45 of the 46 total findings, or 98 percent. SUSPECT - INJURIES INJ DEC Category Injured Deceased Total In 2016, all 27 Non-Lethal force findings were adjudicated as In Policy (No Further Action). This accounted for a three percentage point increase compared to 97 percent in When compared to the aggregate percentage of In Policy (No Further Action) Non-Lethal force findings from 2013 through 2015 of 97 percent, 2016 experienced a three percentage point increase. Historically, from 2013 through 2016, a majority of adjudicated Non-Lethal force findings resulted in an In Policy (No Further Action) outcome, accounting for 138 of the 141 total findings, or 98 percent. In 2016, the one Lethal force finding was adjudicated as In Policy (No Further Action). This represented no change when compared to the same percentage in When compared to the aggregate percentage of In Policy (No Further Action) Lethal force findings from 2013 through 2015 of 50 percent, 2016 experienced a 50 percentage point increase. Historically, from 2013 through 2016, a majority of adjudicated Lethal force findings resulted in an In Policy (No Further Action) outcome, accounting for three of the five total findings, or 60 percent. As the category indicates, LERII incidents are those wherein suspects sustain injuries as a result of Department action. Thus, suspects who died from injuries sustained by force used by Department personnel are included in the ICD section. In 2017, four suspects sustained injuries during the four LERII incidents throughout the year. The number of involved suspects in 2017 decreased by six individuals, or 60 percent, when compared to Additionally, the 2017 count fell below the 2013 through 2016 annual average of suspects by 7.75 individuals, or 66 percent. 41 Adjudication data for 2017 was omitted from this Report since a vast majority of the CUOF incidents will be adjudicated by the BOPC in USE OF FORCE YEAR-END REVIEW LOS ANGELES POLICE DEPARTMENT 289

146 {CUOF INCIDENTS LERII} ADMINISTRATIVE DISAPPROVAL/OUT OF POLICY (ADMINISTRATIVE DISAPPROVAL) TAC Category D&E N-LETH L-LETH LETH In 2016, six out of the 35 total LERII Tactics findings, representing 17 percent, were adjudicated as Administrative Disapproval. This accounted for a four percentage point decrease compared to 21 percent in When compared to the aggregate percentage of Administrative Disapproval Tactics N/A Drawing & Exhibiting N/A Non-Lethal N/A Less Lethal N/A Lethal N/A Total N/A Tactics findings from 2013 through 2015 of 11 percent, 2016 experienced a six percentage point increase. Historically, from 2013 through 2016, 21 of the 171 total Tactics findings, accounting for 12 percent, resulted in an Administrative Disapproval outcome USE OF FORCE YEAR-END REVIEW LOS ANGELES POLICE DEPARTMENT 291
147 {CUOF INCIDENTS HEAD STRIKE} HEAD STRIKE INCIDENTS An intentional head strike with an impact weapon or device (e.g., baton, flashlight) and all unintentional (inadvertent or accidental) head strikes that results in serious bodily injury, hospitalization, or death (2017 LAPD Manual 3/792.05). ANNUAL DEPARTMENT TOTALS 42 In 2017, Department personnel were involved in one Head Strike incident, an increase of one incident compared to In the four-year period from 2013 through 2016, there were a total of four Head Strike incidents, resulting in an annual average of one incident. The 2017 count remained unchanged when compared the 2013 through 2016 annual average. Head Strike Department Total BUREAU OF OCCURRENCE OPERATIONS-CENTRAL BUREAU No Head Strike incidents occurred within the geographical area of Central Bureau in OPERATIONS-SOUTH BUREAU Area Central Newton Northeast Rampart Hollenbeck Total SOURCE OF ACTIVITY The single 2017 Head Strike incident resulted from a radio call. Historically, from 2013 through 2017, all five Head Strike incidents resulted from radio calls or field detentions based on officers observations. Source Radio Call Observation Citizen Flag Down Pre-Planned Station Call Ambush Off-Duty Other Total The single 2017 Head Strike incident occurred within the geographical area of South Bureau. No Head Strike incidents occurred in South Bureau during the four-year period from 2013 through OPERATIONS-WEST BUREAU No Head Strike incidents occurred within the geographical area of West Bureau in Area 77th Street Southeast Harbor Southwest Total Area Hollywood Olympic Pacific West Los Angeles Wilshire Total OPERATIONS-VALLEY BUREAU No Head Strike incidents occurred within the geographical area of Valley Bureau in Area Devonshire Foothill Mission North Hollywood Topanga Van Nuys West Valley Total Case F reclassified from Head Strike investigation to LERII investigation, and case F reclassified from Head Strike investigation to NCUOF investigation USE OF FORCE YEAR-END REVIEW LOS ANGELES POLICE DEPARTMENT 293
148 {CUOF INCIDENTS HEAD STRIKE} OUTSIDE JURISDICTION OFFICER INFORMATION No Head Strike incidents occurred outside the Department s geographical jurisdiction in the five-year period from 2013 through Area Outside Jurisdiction The officer sections below include data for all employees who received, or were pending, BOPC lethal force adjudicative findings for their involvement in Head Strike incidents. incident average represented no change when compared to the same officer to incident aggregate annual average from 2013 through MONTH OF OCCURRENCE In 2017, one Department personnel was involved in one Head Strike incident throughout the year, resulting in an average of one officer per incident. The 2017 officer to The single 2017 Head Strike incident occurred in the month of January. Based on the data for the five-year period from 2013 through 2017, there appears to be no statistical trend associated with the month of occurrence for Head Strike incidents. DAY OF OCCURRENCE The single 2017 Head Strike incident occurred on a Friday. Based on the data for the five-year period from 2013 through 2017, there appears to be no statistical trend associated with the day of occurrence for Head Strike incidents. Month January February March April May June July August September October November December Total Day Monday Tuesday Wednesday Thursday Friday Saturday Sunday Total OFFICER GENDER The single employee involved in the 2017 Head Strike incident was male. Historically, from 2013 through 2017, a majority of officers involved in Head Strike incidents were male, accounting for four of the five total employees, or 80 percent. OFFICER ETHNICITY The single employee involved in the 2017 Head Strike incident was Hispanic. Historically, from 2013 through 2017, a majority of officers involved in Head Strike incidents were Hispanic, accounting for three of the five total employees, or 60 percent. Gender Female Male Total Ethnicity American Indian Asian/Pacific Islander Black Filipino Hispanic White Other Total Ethnicity City Population Department Personnel Head Strike Personnel Asian/Pacific Isl. 12% 8% 0% Black 9% 10% 0% Hispanic 49% 47% 100% White 28% 32% 0% Other 2% 3% 0% Total 100% 100% 100% TIME OF OCCURRENCE OFFICER YEARS OF SERVICE The single 2017 Head Strike incident occurred between the hours of 6 p.m. and 5:59 a.m. The time distribution for the five Head Strike incidents from 2013 through 2017 was as follows: 6 a.m. and 5:59 p.m.: one incident, or 20 percent; and, 6 p.m. and 5:59 a.m.: four incidents, or 80 percent. Time of Day Total The single employee involved in the 2017 Head Strike incident was within the 1-5 years of service category. Based on the data for the five-year period from 2013 through 2017, there appears to be no statistical trend associated with an employee s years of service for Head Strike incidents. Years Less than More than Total USE OF FORCE YEAR-END REVIEW LOS ANGELES POLICE DEPARTMENT 295
149 {CUOF INCIDENTS HEAD STRIKE} OFFICER RANK OFFICER UNIT OF ASSIGNMENT The single employee involved in the 2017 Head Strike incident was at the rank of police officer. Historically, from 2013 through 2017, all five employees involved in Head Strike incidents were at the rank of police officer. Rank Captain and Above Lieutenant Sergeant Detective Police Officer Detention Officer Other Total The single officer involved in the 2017 Head Strike incident was assigned to patrol. Historically, from 2013 through 2017, a majority of officers involved in Head Strike incidents were assigned to patrol, accounting for four of the five total employees, or 80 percent. Unit Administrative Metropolitan Patrol Specialized Investigative Custody Other Total OFFICER AREA/DIVISION OF ASSIGNMENT OFFICER INJURIES The single employee involved in the 2017 Head Strike incident was assigned to 77th Street Division. Based on the data for the five-year period from 2013 through 2017, there appears to be no statistical trend associated with an employee s Area/Division and/or Bureau of assignment for Head Strike incidents. Division/Area/Bureau 77th Street Central Devonshire Foothill Harbor Hollenbeck Hollywood Mission Newton North Hollywood Northeast Olympic Pacific Rampart Southeast Southwest Topanga Van Nuys West Los Angeles West Valley Wilshire All Traffic Divisions Administrative Units Specialized Units Bureau Level Metropolitan Security Services Other Areas Total One officer sustained an injury during the 2017 Head Strike incident. Category Injured Deceased Total USE OF FORCE YEAR-END REVIEW LOS ANGELES POLICE DEPARTMENT 297
150 {CUOF INCIDENTS HEAD STRIKE} SUSPECT INFORMATION The suspect sections below include data for all individuals that Department personnel applied force against during Head Strike incidents. SUSPECT ETHNICITY SUSPECT PERCEIVED MENTAL ILLNESS The single suspect involved in the 2017 Head Strike incident was determined not to suffer from a perceived mental illness and/or a mental health crisis. SUSPECT GANG MEMBERSHIP Per. Mental Illness Yes No Total The single suspect involved in the 2017 Head Strike incident was Hispanic. Historically, from 2013 through 2017, all suspects involved in Head Strike incidents were Hispanic. Ethnicity American Indian Asian/Pacific Islander Black Filipino Hispanic White Other Total Ethnicity City Population Violent Crime Suspect Head Strike Suspect Pursuant to California Assembly Bill 90, the Fair and Accurate Gang Database Act of 2017, Department resources housing gang membership information were temporarily SUSPECT HOMELESS 43 The single suspect involved in the 2017 Head Strike incident was determined not to be homeless. SUSPECT WEAPON/FORCE disabled effective January 1, As such, the Department was unable to determine whether suspects involved in UOF incidents were designated as gang members. Homeless Yes N/A N/A N/A 0 0 No N/A N/A N/A 0 1 Unknown N/A N/A N/A 0 0 Total SUSPECT GENDER The single suspect involved in the 2017 Head Strike incident was male. Historically, from 2013 through 2017, a majority of suspects involved in Head Strike incidents were male, accounting for four of the five total suspects, or 80 percent. SUSPECT AGE The single suspect involved in the 2017 Head Strike incident was within the 60 and above age category. Based on the data for the five-year period from 2013 through 2017, there appears to be no statistical trend associated with a suspects age for Head Strike incidents. Asian/Pacific Isl. 12% (See Other) 0% Black 9% 44% 0% Hispanic 49% 40% 100% White 28% 8% 0% Other 2% 3% 0% Unknown DNA 5% 0% Total 100% 100% 100% Gender Female Male Total Age and Above Total The single suspect involved in the 2017 Head Strike occurrence utilized physical force against officers during the incident. Historically, from 2013 through 2017, a majority of suspects involved in Head Strike incidents utilized physical force, which accounted for three of the five total weapon/force types, or 60 percent. SUSPECT - INJURIES One suspect sustained an injury during the 2017 Head Strike incident. DEPARTMENT ADJUDICATION 44 No Head Strike incidents occurred in 2016, thus no adjudicative findings were rendered for the year. 43 The Department was directed by the BOPC to track homeless data for suspects involved in CUOF incidents starting in Force Investigation Division has since implemented new procedures to capture this statistic. 44 Adjudication data for 2017 was omitted from this Report since a vast majority of the CUOF incidents will be adjudicated by the BOPC in Weapon Type Automobile Edged Weapon Firearm Impact Device Perception Physical Force Replica/Pellet Other None Total Category Injured Deceased Total Category Tactics N/A Drawing & Exhibiting N/A Non-Lethal N/A Less Lethal N/A Lethal N/A Total N/A USE OF FORCE YEAR-END REVIEW LOS ANGELES POLICE DEPARTMENT 299
151 {CUOF INCIDENTS K9} K9 CONTACT INCIDENTS An incident in which a member of the public has contact with a Department K9 and hospitalization is required. If hospitalization is not required, the incident does not rise to the level of a use of force (2017 LAPD Manual 3/792.05). ANNUAL DEPARTMENT TOTALS 45 In 2017, Department personnel were involved in four K9 Contact incidents, which remained unchanged compared to the 2016 total. In the four-year period from 2013 through 2016, there were a total of 14 K9 Contact incidents, resulting in an annual average of 3.5 incident. The 2017 count exceeded the 2013 through 2016 annual average by 0.5 incidents, or 14 percent. K9 Contact Department Total BUREAU OF OCCURRENCE OPERATIONS-CENTRAL BUREAU In 2017, two of the Department s K9 Contact incidents occurred within the geographical area of Central Bureau, which was an increase of one incident, or 100 percent, compared to Fifty percent of the Department s K9 Contact incidents occurred in Central Bureau (Department - four; Central Bureau - two). In the four-year period from 2013 through 2016, five K9 Contact incidents occurred in Central Bureau, resulting in an annual average of 1.25 incidents. The Central Bureau count for 2017 exceeded the 2013 through 2016 annual average by 0.75 incidents, or 60 percent. OPERATIONS-SOUTH BUREAU Area Central Newton Northeast Rampart Hollenbeck Total SOURCE OF ACTIVITY In 2017, all four K9 Contact incidents resulted from field detentions based on officers observations. Historically, from 2013 through 2017, 11 out of the 18 total K9 Contact incidents, or 61 percent, resulted from field detentions based on officers observations. Source Radio Call Observation Citizen Flag Down Pre-Planned Station Call Ambush Off-Duty Other Total In 2017, one of the Department s K9 Contact incidents occurred within the geographical area of South Bureau, which was an increase of one incident compared to zero in Twenty-five percent of the Department s K9 Contact incidents occurred in South Bureau (Department - four; South Bureau - one). In the four-year period from 2013 through 2016, three K9 Contact incidents occurred in South Bureau, resulting in an annual average of 0.75 incidents. The South Bureau count for 2017 exceeded the 2013 through 2016 annual average by 0.25 incidents, or 33 percent. OPERATIONS-WEST BUREAU No K9 Contact incidents occurred within the geographical area of West Bureau in Area 77th Street Southeast Harbor Southwest Total Area Hollywood Olympic Pacific West Los Angeles Wilshire Total Case F reclassified from K9 Contact investigation to non-uof USE OF FORCE YEAR-END REVIEW LOS ANGELES POLICE DEPARTMENT 301
152 {CUOF INCIDENTS K9} OPERATIONS-VALLEY BUREAU DAY OF OCCURRENCE In 2017, one of the Department s K9 Contact incidents occurred within the geographical area of Valley Bureau, which was an increase of one incident compared to zero in Twenty-five percent of the Department s K9 Contact incidents occurred in Valley Bureau (Department - four; Valley Bureau - one). In the four-year period from 2013 through 2016, one K9 Contact incident occurred in Valley Bureau, resulting in an annual average of 0.25 incidents. The Valley Bureau count for 2017 exceeded the 2013 through 2016 annual average by 0.75 incidents, or 300 percent. Area Devonshire Foothill Mission North Hollywood Topanga Van Nuys West Valley Total In 2017, Saturday represented the day of the week with the most K9 Contact incidents with two occurrences, or 50 percent. The two remaining incidents, or 50 percent, occurred on a Tuesday and Wednesday. From 2013 through 2017, Wednesday and Saturday represented the days with the most K9 Contact incidents with five out of the 18 total occurrences, or 28 percent, respectively. Sunday represented the day with the least with zero incidents. The remaining eight incidents, or 44 percent, were fairly evenly distributed throughout the remaining days of the week. Day Monday Tuesday Wednesday Thursday Friday Saturday Sunday Total OUTSIDE JURISDICTION TIME OF OCCURRENCE No K9 Contact incidents occurred outside the Department s geographical jurisdiction in MONTH OF OCCURRENCE Area Outside Jurisdiction In 2017, two K9 Contact incidents, or 50 percent, occurred between the hours of 6 a.m. and 5:59 p.m. while two incidents, or 50 percent, occurred between the hours of 6 p.m. and 5:59 a.m. Historically, the time distribution from 2013 through 2017 was as follows: Time of Day Total Based on the data for the five-year period from 2013 through 2017, there appears to be no statistical trend associated with the month of occurrence for K9 Contact incidents. Month January February March April May June July August September October November December Total a.m. and 5:59 p.m.: 11 incidents, or 61 percent; and, 6 p.m. and 5:59 a.m.: seven incidents, or 39 percent. The five-year annual average for 2013 through 2017 was 2.2 K9 Contact incidents occurring between the hours of 6 a.m. and 5:59 p.m., and 1.4 incidents between the hours of 6 p.m. and 5:59 a.m USE OF FORCE YEAR-END REVIEW LOS ANGELES POLICE DEPARTMENT 303
153 {CUOF INCIDENTS K9} OFFICER INFORMATION OFFICER RANK The officer sections below include data for all employees who received, or were pending, BOPC K9 Contact deployment and force adjudicative findings for their involvement in K9 Contact incidents. In 2017, four Department personnel were involved in the four K9 Contact incidents throughout the year, resulting in OFFICER GENDER an average of one officer per incident. This represented no change when compared to the same officer per incident average in Similarly, the 2017 officer to incident average represented no change when compared to the same officer to incident aggregate annual average from 2013 through All four officers involved in 2017 K9 Contact incidents were at the rank of police officer. Similarly, from 2013 through 2017, all personnel involved in K9 Contact incidents were of this same rank classification. Rank Captain and Above Lieutenant Sergeant Detective Police Officer Detention Officer Other Total All four officers involved in 2017 K9 Contact incidents were male. Similarly, from 2013 through 2017, all personnel involved in K9 Contact incidents were male. OFFICER ETHNICITY In 2017, three White officers were involved in K9 Contact incidents, which represented 75 percent of the four total employees. This accounted for a 25 percentage point decrease compared to 100 percent in The percentage of White officers involved in K9 incidents in 2017 was 43 percentage points above the Department s overall White total. When compared to the aggregate percentage of involved White personnel from 2013 through 2016 of 57 percent, 2017 experienced an 18 percentage point increase. Historically, from 2013 through 2017, White officers involved in K9 Contact incidents accounted for 11 of the 18 total personnel, or 61 percent. One employee involved in a 2017 K9 Contact incident, representing 25 percent, was Hispanic. OFFICER YEARS OF SERVICE All four officers involved in 2017 K9 Contact incidents were within the years of service category. Historically, from 2013 through 2017, 14 of the 18 personnel involved in K9 Contact incidents, or 78 percent, had this same years of service classification. The remaining four officers, or 22 percent, were within the 20 or more years of service category. Gender Female Male Total Ethnicity American Indian Asian/Pacific Islander Black Filipino Hispanic White Other Total Ethnicity City Population Department Personnel K9 Contact Personnel Asian/Pacific Isl. 12% 8% 0% Black 9% 10% 0% Hispanic 49% 47% 25% White 28% 32% 75% Other 2% 3% 0% Total 100% 100% 100% Years Less than More than Total OFFICER AREA/DIVISION OF ASSIGNMENT In 2017, the four employees involved in K9 Contacts, or 100 percent, were assigned to Metropolitan Division. From 2013 through 2017, all of the employees involved in K9 Contact incidents were assigned to Metropolitan Division. Division/Area/Bureau 77th Street Central Devonshire Foothill Harbor Hollenbeck Hollywood Mission Newton North Hollywood Northeast Olympic Pacific Rampart Southeast Southwest Topanga Van Nuys West Los Angeles West Valley Wilshire All Traffic Divisions Administrative Units Specialized Units Bureau Level Metropolitan Security Services Other Areas Total USE OF FORCE YEAR-END REVIEW LOS ANGELES POLICE DEPARTMENT 305
154 {CUOF INCIDENTS K9} OFFICER UNIT OF ASSIGNMENT In 2017, the four employees involved in K9 Contacts, or 100 percent, were assigned to Metropolitan Division. From 2013 through 2017, all of the employees involved in K9 Contact incidents were assigned to Metropolitan Division. OFFICER INJURIES No Department personnel were killed during or resulting from K9 Contact incidents during the five-year period from 2013 through However, three officers sustained injuries during the same five-year period. In 2017, no officers sustained injuries during the four K9 Contact incidents that occurred throughout the year. Unit Administrative Metropolitan Patrol Specialized Investigative Custody Other Total Category Injured Deceased Total SUSPECT INFORMATION The suspect sections below include data for all individuals that Department personnel applied force against during K9 Contact incidents. SUSPECT ETHNICITY In 2017, three Hispanic suspects were involved in K9 Contact incidents, which represented 75 percent of the four total suspects. This accounted for a 25 percentage point decrease compared to 100 percent in The percentage of Hispanic suspects involved in K9 Contact incidents in 2017 was 26 percentage points above the City s overall Hispanic population total. Additionally, the percentage of Hispanic suspects involved in K9 Contact incidents in 2017 was 35 percentage points above the City s overall Hispanic violent crime offender total. When compared to the aggregate percentage of involved Hispanic suspects from 2013 through 2016 of 71 percent, 2017 experienced a four percentage point increase. Historically, from 2013 through 2017, the Hispanic category was the most represented ethnic group involved in K9 Contact incidents with 13 of the 18 total suspects, or 72 percent. In 2017, one Black suspect was involved in K9 Contact incident, which represented 25 percent of the four total suspects. This accounted for a 25 percentage point increase compared to zero percent in The percentage of Black suspects involved in K9 Contact incidents in 2017 was 16 percentage points above the City s overall Black population total. However, the percentage of Black suspects involved in K9 Contact incidents in 2017 was 19 percentage points below the City s overall Black violent crime offender total. When compared to the aggregate percentage of involved Black suspects from 2013 through 2016 of 14 percent, 2017 experienced an 11 percentage point increase. Historically, from 2013 through 2017, the Black category was the second most represented ethnic group involved in K9 Contact incidents with three of the 18 total suspects, or 17 percent. Ethnicity American Indian Asian/Pacific Islander Black Filipino Hispanic White DNA Total Ethnicity City Population Violent Crime Suspect K9 Contact Suspect Asian/Pacific Isl. 12% (See Other) 0% Black 9% 44% 25% Hispanic 49% 40% 75% White 28% 8% 0% Other 2% 3% 0% Unknown DNA 5% 0% Total 100% 100% 100% USE OF FORCE YEAR-END REVIEW LOS ANGELES POLICE DEPARTMENT 307
155 {CUOF INCIDENTS K9} SUSPECT GENDER SUSPECT HOMELESS 46 All four suspects involved in 2017 K9 Contact incidents were male. Similarly, from 2013 through 2017, all 18 suspects involved in K9 Contact incidents were male. Gender Female Male DNA Total One suspect involved in a 2017 K9 Contact incident, representing 25 percent of the four total suspects, was determined homeless. This accounted for a 25 percentage point decrease compared to 50 percent of K9 Contact suspects who were determined to be homeless in Homeless Yes N/A N/A N/A 2 1 No N/A N/A N/A 2 3 Unknown N/A N/A N/A 0 0 Total SUSPECT AGE SUSPECT WEAPON/FORCE In 2017, two suspects involved in K9 Contact incidents, representing 50 percent of the four total suspects, were in the age group. This specific age category represented no percentage change when compared to When compared to the aggregate percentage of involved suspects within the age range from 2013 through 2016 of 21 percent, 2017 experienced a 29 percentage point increase. Historically, from 2013 through 2017, the age group accounted for five of the 18 total suspects involved in K9 Contact incidents, or 28 percent. The two remaining suspects, representing 50 percent, were in the and age ranges. Age and Above DNA Total Three suspects involved in 2017 K9 Contact incidents, representing 75 percent of the four total suspects, were unarmed. This specific weapon/force type category represented no percentage change when compared to When compared to the aggregate percentage of suspects who were unarmed during K9 Contact incidents from 2013 through 2016 of 21 percent, 2017 experienced a 54 percentage point increase. Historically, from 2013 through 2017, suspects who were unarmed during K9 Contact incidents accounted for six of the 18 total suspect weapon/force types, or 33 percent. One suspect, representing 25 percent of the four total suspects, was armed with an impact device during the respective K9 Contact incident. Weapon Type Automobile Edged Weapon Firearm Impact Device Perception Physical Force Replica/Pellet Other Unknown None DNA Total SUSPECT PERCEIVED MENTAL ILLNESS SUSPECT - INJURIES All four suspects involved in 2017 K9 Contact incidents were determined not to suffer from perceived mental illnesses and/or mental health crises. Per. Mental Illness Yes No DNA Total All four suspects involved in 2017 K9 Contact incidents sustained injuries. Category Injured Deceased DNA Total SUSPECT GANG MEMBERSHIP DEPARTMENT ADJUDICATION 47 Pursuant to California Assembly Bill 90, the Fair and Accurate Gang Database Act of 2017, Department resources housing gang membership information were temporarily disabled effective January 1, As such, the Department was unable to determine whether suspects involved in UOF incidents were designated as gang members. Of the four K9 Contact incidents in 2016, all received consistent with established criteria adjudicative K9 deployment findings. Of the four K9 Contact incidents in 2016, all received consistent with established criteria adjudicative K9 contact findings. Of the four K9 Contact incidents in 2016, all received consistent with established criteria adjudicative postcontact procedure findings. Category Tactics N/A Drawing & Exhibiting N/A Non-Lethal N/A Less Lethal N/A Lethal N/A K-9 Deployment N/A K-9 Contact N/A K-9 Post Contact Procedures N/A K-9 Other Issues N/A Total N/A 46 The Department was directed by the BOPC to track homeless data for suspects involved in CUOF incidents starting in Force Investigation Division has since implemented new procedures to capture this statistic. 47 Adjudication data for 2017 was omitted from this Report since a vast majority of the CUOF incidents will be adjudicated by the BOPC in USE OF FORCE YEAR-END REVIEW LOS ANGELES POLICE DEPARTMENT 309
156 {CUOF INCIDENTS WARNING SHOT} WARNING SHOT INCIDENTS The intentional discharge of a firearm off target not intended to hit a person, to warn others that deadly force is imminent (LAPD Manual 1/556.01). OPERATIONS-WEST BUREAU No Warning Shot incidents occurred in West Bureau during the five-year period from 2013 through ANNUAL DEPARTMENT TOTALS OPERATIONS-VALLEY BUREAU In 2017, one Department employee was involved in a Warning Shot incident, which was the only occurrence in the five-year period from 2013 through Warning Shot Department Total No Warning Shot incidents occurred in Valley Bureau during the five-year period from 2013 through SOURCE OF ACTIVITY OUTSIDE JURISDICTION The 2017 Warning Shot incident resulted from an off-duty occurrence. BUREAU OF OCCURRENCE OPERATIONS-CENTRAL BUREAU No Warning Shot incidents occurred in Central Bureau during the five-year period from 2013 through OPERATIONS-SOUTH BUREAU Source Radio Call Observation Citizen Flag Down Pre-Planned Station Call Ambush Off-Duty Other Total The 2017 Warning Shot incident occurred outside the Department s geographical jurisdiction. MONTH OF OCCURRENCE The 2017 Warning Shot incident occurred in the month of February. Area Outside Jurisdiction Month January February March April May June July August September October November December Total No Warning Shot incidents occurred in South Bureau during the five-year period from 2013 through USE OF FORCE YEAR-END REVIEW LOS ANGELES POLICE DEPARTMENT 311
157 {CUOF INCIDENTS WARNING SHOT} DAY OF OCCURRENCE OFFICER GENDER The 2017 Warning Shot incident occurred on a Tuesday. TIME OF OCCURRENCE The 2017 Warning Shot incident occurred between the hours of 6 a.m. and 5:59 p.m. Day Monday Tuesday Wednesday Thursday Friday Saturday Sunday Total Time of Day Total The involved employee in the 2017 Warning Shot incident was male. OFFICER YEARS OF SERVICE The involved employee in the 2017 Warning Shot incident had 1-5 years of service at the time of the occurrence. Gender Female Male Total Years Less than More than Total OFFICER INFORMATION OFFICER RANK The officer sections below include data for the employee who was pending BOPC lethal force adjudicative findings for his involvement in the 2017 Warning Shot incident. OFFICER ETHNICITY The involved employee in the 2017 Warning Shot incident was White. In 2017, one Department personnel was involved in the one Warning Shot incident throughout the year, resulting in an average of one officer per incident. Ethnicity American Indian Asian/Pacific Islander Black Filipino Hispanic White Other Total Ethnicity City Population Department Personnel Warning Shot Personnel Asian/Pacific Isl. 12% 8% 0% Black 9% 10% 0% Hispanic 49% 47% 0% White 28% 32% 100% Other 2% 3% 0% Total 100% 100% 100% The involved employee in the 2017 Warning Shot incident was at the rank of police officer at the time of the occurrence. OFFICER UNIT OF ASSIGNMENT The involved employee in the 2017 Warning Shot incident was assigned to patrol at the time of the occurrence. Rank Captain and Above Lieutenant Sergeant Detective Police Officer Detention Officer Other Total Unit Administrative Metropolitan Patrol Specialized Investigative Custody Other Total USE OF FORCE YEAR-END REVIEW LOS ANGELES POLICE DEPARTMENT 313
158 {CUOF INCIDENTS WARNING SHOT} OFFICER AREA/DIVISION OF ASSIGNMENT The involved employee in the 2017 Warning Shot incident was assigned to Hollywood Division at the time of the occurrence. Division/Area/Bureau 77th Street Central Devonshire Foothill Harbor Hollenbeck Hollywood Mission Newton North Hollywood Northeast Olympic Pacific Rampart Southeast Southwest Topanga Van Nuys West Los Angeles West Valley Wilshire All Traffic Divisions Administrative Units Specialized Units Bureau Level Metropolitan Security Services Other Areas Total OFFICER INJURIES The involved employee in the 2017 Warning Shot incident sustained an injury during the occurrence. OFFICER WEAPON SYSTEM The involved employee in the 2017 Warning Shot incident utilized a handgun during the occurrence. TOTAL NUMBER OF ROUNDS FIRED BY OFFICERS PER YEAR The involved employee in the 2017 Warning Shot incident fired one round during the occurrence. DEPARTMENT ADJUDICATION 48 Adjudicative findings were pending for the employee involved in the Warning Shot incident at year-end Category Injured Deceased Total Weapon Type Handgun Shotgun Rifle Total Warning Shot Total Rounds Adjudication data for 2017 was omitted from this Report since a vast majority of the CUOF incidents will be adjudicated by the BOPC in USE OF FORCE YEAR-END REVIEW LOS ANGELES POLICE DEPARTMENT 315

159 {NCUOF INCIDENTS} ANNUAL DEPARTMENT TOTALS NCUOF Department Total 1,801 1,863 1,825 1,925 2,117 DEPT TTL ,000 1,500 2,000 2,500 In 2017, Department personnel were involved in 2,117 NCUOF incidents, an increase of 192 incidents, or 10 percent, compared to In the four-year period from 2013 through 2016, there were a total of 7,414 NCUOF incidents, resulting in an annual average of 1,854 incidents. The 2017 count exceeded the 2013 through 2016 annual average by 263 incidents, or 14 percent. LEVEL TOTALS LVL I LVL II ,000 1,500 2,000 In 2017, 1,941 NCUOF incidents were Level II occurrences, which represented 92 percent of the 2,117 total incidents. This represented no change when compared to the same percentage in When compared to the aggregate percentage of Level II NCUOF incidents from 2013 through 2016 of 91 percent, 2017 experienced a one percentage point increase. Historically, from 2013 through 2017, a majority of NCUOF incidents were Level II occurrences, accounting for 8,688 of the 9,531 total incidents, or 91 percent. Level Level I Level II 1,633 1,672 1,669 1,773 1,941 Total 1,801 1,863 1,825 1,925 2,117 In 2017, 176 NCUOF incidents were Level I occurrences, which represented eight percent of the 2,117 total incidents. This represented a marginal increase when compared to When compared to the aggregate percentage of Level I NCUOF incidents from 2013 through 2016 of nine percent, 2016 experienced a one percentage point decrease. Historically, from 2013 through 2017, 843 NCUOF incidents were Level I occurrences, which represented nine percent of the 9,531 total incidents. LOS ANGELES POLICE DEPARTMENT 317
160 {NCUOF INCIDENTS} FORCE OPTION 40MM BTN/IMP DEV BB SGUN BDY WGT FGRP/JLCK OC OTH PHY FRCE STRK/KCK/PNCH TDOWN/LSWP TASER ,000 1,500 2,000 Number of NCUOF Incidents Each Force Option was Applied Force Option 40MM Launcher Baton/Impact Device Beanbag Shotgun Body Weight 1,279 1,335 1,301 1,394 1,563 Firm Grip/Joint Lock 1,440 1,539 1,511 1,627 1,825 OC Spray Other Physical Force ,009 1,274 Strike/Kick/Punch Takedown/Leg Sweep TASER TASER INFORMATION DEPT TTL TASER Activations ,200 1,500 Department Total ,137 1,363 1,224 ANNUAL EFFECTIVENESS TOTALS & PERCENTAGES YES 40MM BTN/IMP DEV BB SGUN BDY WGT FGRP/JLCK OC OTH PHY FRCE STRK/KCK/PNCH TDOWN/LSWP TASER 0% 20% 40% 60% 80% 100% Percentage of NCUOF Incidents Each Force Option was Applied Force Option 40MM Launcher 0% 0% 0% <1% <1% Baton/Impact Device 3% 3% 3% 2% 1% Beanbag Shotgun 3% 3% 4% 4% 5% Body Weight 71% 72% 71% 72% 74% Firm Grip/Joint Lock 80% 83% 83% 85% 86% OC Spray 6% 5% 5% 3% 2% Other 13% 18% 19% 20% 17% Physical Force 44% 45% 44% 52% 60% Strike/Kick/Punch 23% 19% 16% 10% 10% Takedown/Leg Sweep 44% 42% 40% 40% 37% TASER 22% 22% 29% 30% 27% NO EFCT % % 10% 20% 30% 40% 50% 60% 70% 80% TASER Effectiveness Yes No Total ,137 1,363 1,224 TASER Effectiveness Effectiveness Percentage 60% 64% 53% 57% 54% In 2017, TASERs were utilized in 578, or 27 percent, of the 2,117 NCUOF incidents. This accounted for a three percentage point decrease compared to 30 percent in When compared to the aggregate percentage of TASER usage during NCUOF incidents from 2013 through 2016 of 26 percent, 2017 experienced a one percentage point increase. In 2017, beanbag shotguns were utilized in 97, or five percent, of the 2,117 NCUOF incidents. This accounted for a one percentage point increase compared to four percent Similarly, when compared to the aggregate percentage of beanbag shotguns utilized during NCUOF incidents from 2013 through 2016 of four percent, 2017 experienced a one percentage point increase. In 2017, Strikes/Kicks/Punches were utilized in 207, or 10 percent, of the 2,117 NCUOF incidents. This represented no change when compared to the same percentage in When compared to the aggregate percentage of Strikes/ Kicks/Punches utilized during NCUOF incidents from 2013 through 2016 of 17 percent, 2017 experienced a seven percentage point decrease. In 2017, batons were utilized in 23, or one percent, of the 2,117 NCUOF incidents. This accounted for a one percentage point decrease compared to two percent in When compared to the aggregate percentage of batons utilized during NCUOF incidents from 2013 through 2016 of three percent, 2017 experienced a two percentage point decrease. In 2017, OC spray was utilized in 32, or two percent, of the 2,117 NCUOF incidents. This accounted for a one percentage point decrease compared to three percent in When compared to the aggregate percentage of OC spray utilized during NCUOF incidents from 2013 through 2016 of five percent, 2017 experienced a three percentage point decrease. In 2017, Department personnel activated a TASER device 1,224 times during 578 NCUOF incidents in which TASERs were utilized, resulting in an average of 2.12 activations per incident. This accounted for a 10 percent decrease compared to the 2016 average activations per incident of When compared to the aggregate annual average of TASER activations per incident from 2013 through 2016 of 2.17, 2017 fell below the four-year average by 0.05 activations per incident, or two percent. In 2017, TASER activations were effective 663 times during NCUOF incidents, which represented 54 percent of the 1,224 total activations. This accounted for a three percentage point decrease compared to 57 percent in When compared to the aggregate percentage of effective TASER activations from 2013 through 2016 of 59 percent, 2017 experienced a five percentage point decrease. Historically, from 2013 through 2017, TASER activations were effective 3,076 times out of the 5,386 total activations, or 57 percent USE OF FORCE YEAR-END REVIEW LOS ANGELES POLICE DEPARTMENT 319
161 {NCUOF INCIDENTS} SOURCE OF ACTIVITY OPERATIONS-SOUTH BUREAU CZN FD OBS Source Citizen Flag Down TH RCALL Obervation SCALL Radio Call ,010 1,070 1,181 HARB OTH Station Call SOE Other UNK Unknown SOW ,000 1,200 Total 1,801 1,863 1,825 1,925 2, Area 77th Street Harbor Southeast Southwest Total In 2017, 1,181 of the Department s 2,117 NCUOF incidents, or 56 percent, originated from radio calls. This represented no percentage change when compared to When compared to the aggregate percentage of NCUOF incidents resulting from radio calls from 2013 through 2016 of 53 percent, 2017 experienced a three percentage point increase. Historically from 2013 through 2017, radio calls represented the largest source category of NCUOF incidents, accounting for 5,096 of the 9,531 total incidents, or 53 percent. In 2017, 593 of the Department s 2,117 NCUOF incidents, or 28 percent, originated from field detentions based on officers observations (i.e. pedestrian and traffic stops). BUREAU OF OCCURRENCE OPERATIONS-CENTRAL BUREAU This represented no percentage change when compared to When compared to the aggregate percentage of NCUOF incidents resulting from field detentions based on officers observations from 2013 through 2016 of 32 percent, 2017 experienced a four percentage point decrease. Historically from 2013 through 2017, field detentions based on officers observations represented the second largest source category of NCUOF incidents, accounting for 2,930 of the 9,531 total incidents, or 31 percent. The remaining 343 NCUOF incidents, or 16 percent, in 2017 occurred during citizen flag downs, station calls, occurrences with other designations, and those with unknown classifications. In 2017, 519 of the Department s NCUOF incidents occurred within the geographic Areas of South Bureau, which was a decrease of 20 incidents, or four percent, compared to Approximately 25 percent of the Department s NCUOF incidents occurred in South Bureau (Department 2,117; South Bureau - 519). In the four-year period from OPERATIONS-WEST BUREAU HWD OLYM PAC WLA WIL through 2016, 1,933 NCUOF incidents occurred in South Bureau, resulting in an annual average of 483 incidents. The South Bureau count for 2017 exceeded the 2013 through 2016 annual average by 36 incidents, or seven percent. Area Hollywood Olympic Pacific West Los Angeles Wilshire Total CENT HOBK NEWT NOE RAMP Area Central Hollenbeck Newton Northeast Rampart Total In 2017, 401 of the Department s NCUOF incidents occurred within the geographic Areas of West Bureau, an increase of 77 incidents, or 24 percent, compared to Approximately 19 percent of the Department s NCUOF incidents occurred in West Bureau (Department 2,117; West Bureau - 401). In the four-year period from 2013 through 2016, 1,313 NCUOF incidents occurred in West Bureau, resulting in an annual average of 328 incidents. The West Bureau count for 2017 exceeded the 2013 through 2016 annual average by 73 incidents, or 22 percent. In 2017, 657 of the Department s NCUOF incidents occurred within the geographic Areas of Central Bureau, which was an increase of 84 incidents, or 15 percent, compared to Approximately 31 percent of the Department s NCUOF incidents occurred in Central Bureau (Department 2,117; Central Bureau - 657). In the four-year period from 2013 through 2016, 2,177 NCUOF incidents occurred in Central Bureau, resulting in an annual average of 544 incidents. The Central Bureau count for 2017 exceeded the 2013 through 2016 annual average by 113 incidents, or approximately 21 percent USE OF FORCE YEAR-END REVIEW LOS ANGELES POLICE DEPARTMENT 321
162 {NCUOF INCIDENTS} OPERATIONS-VALLEY BUREAU MONTH OF OCCURRENCE DEV FTHL MISN NHWD TOP VNYS WVAL In 2017, 506 of the Department s NCUOF incidents occurred within the geographic Areas of Valley Bureau, which was an increase of 42 incidents, or nine percent, compared to Approximately 24 percent of the Department s NCUOF incidents occurred in Valley Bureau (Department 2,117; Valley Bureau - 506). In the four-year period from Area Devonshire Foothill Mission North Hollywood Topanga Van Nuys West Valley Total through 2016, 1,896 NCUOF incidents occurred in Valley Bureau, resulting in an annual average of 474 incidents. The Valley Bureau count for 2017 exceeded the 2013 through 2016 annual average by 32 incidents, or seven percent. JAN FEB MAR APR MAY JUN JUL AUG SEP OCT NOV DEC Month January February March April May June July August September October November December Total 1,801 1,863 1,825 1,925 2,117 OUTSIDE JURISDICTION OTSD In 2017, 34 of the Department s NCUOF incidents occurred outside the Department s jurisdiction, which was an increase of nine incidents, or 36 percent, compared to Approximately two percent of the Department s NCUOF incidents occurred in areas outside the Department s jurisdiction (Department 2,117; Outside Areas - 34). In Area Outside Jurisdiction the four-year period from 2013 through 2016, 95 NCUOF incidents occurred in areas outside the Department s jurisdiction, resulting in an annual average of 24 incidents. The total incident count for outside areas in 2017 exceeded the 2013 through 2016 annual average by 10 incidents, or approximately 42 percent. In 2017, July represented the month with the most NCUOF incidents with 204 occurrences, or 10 percent, out of 2,117 total incidents for the year. November had the second highest count with 193 incidents, or nine percent. August had the third highest count with 191 incidents, or nine percent. March and April followed with the fourth highest counts with 190 incidents, or approximately nine percent, respectively. The remaining 1,149 incidents, or 54 percent, were fairly evenly distributed throughout the remaining months of the year. From 2013 through 2017, March represented the month with the most NCUOF incidents with 882 out of the 9,531 total incidents, or nine percent. February represented the month with the fewest number of incidents, accounting for 723 incidents, or approximately eight percent. The NCUOF percentage breakdown on a quarterly basis from 2013 through 2017 was as follows: January through March: 2,376 incidents, or approximately 25 percent; April through June: 2,425 incidents, or approximately 25 percent; July through September: 2,407 incidents; or approximately 25 percent; and, October through December: 2,323 incidents, or approximately 24 percent USE OF FORCE YEAR-END REVIEW LOS ANGELES POLICE DEPARTMENT 323
163 {NCUOF INCIDENTS} DAY OF OCCURRENCE OFFICER INFORMATION MON TUE WED THUR FRI SAT SUN In 2017, Friday represented the day of the week with the most NCUOF incidents, accounting for 311 occurrences, or 15 percent. Monday had the second highest count with 307 incidents, or approximately 15 percent. TIME OF OCCURRENCE In 2017, 527 of the 2,117 total NCUOF incidents, or 25 percent, occurred between the hours of 8:00 p.m. and 11:59 p.m. The time category with the second highest count was 4:00 p.m. to 7:59 p.m., which accounted for 495 incidents, or 23 percent. The time period with the fewest NCUOF incidents was 4:00 a.m. and 7:59 a.m., which accounted for 141 incidents, or seven percent. The remaining 954 incidents, or 45 percent, were fairly evenly distributed amongst the remaining time categories. Day Monday Tuesday Wednesday Thursday Friday Saturday Sunday Total 1,801 1,863 1,825 1,925 2,117 From 2013 through 2017, Friday represented the day with the most NCUOF incidents with 1,422 out of the 9,531 total, or 15 percent. Monday represented the day with the fewest number of incidents, with 1,250 occurrences, or 13 percent. Time Total 1,801 1,863 1,825 1,925 2,117 During the five-year period from 2013 through 2017, 2,432 NCUOF incidents occurred between the hours of 8:00 p.m. and 11:59 p.m., which represented 26 percent of the 9,531 total incidents. The time category with the second highest count was 4:00 p.m. and 7:59 p.m., which accounted for 2,185 incidents, or 23 percent. The time category with the fewest number of NCUOF incidents was 4:00 a.m. and 7:59 a.m., which had 670 incidents, or seven percent. The officer sections below include data for all employees who received, or were pending, NCUOF force findings for their involvement in NCUOF incidents. In 2017, 7,110 Department personnel were involved in 2,117 NCUOF incidents, resulting in an average of 3.4 officers OFFICER GENDER Female In 2017, 6,375 male officers were involved in NCUOF incidents, which represented 90 percent of the 7,110 total employees. This accounted for a one percentage point increase compared to 89 percent in The percentage of male officers involved in NCUOF incidents in 2017 was eight percentage points above the Department s overall male total. When compared to the aggregate percentage of involved male personnel from 2013 through 2016 of 90 percent, 2017 experienced no percentage change. Historically, from 2013 through 2017, a majority of officers involved in NCUOF incidents were male, accounting for 26,032 of the 28,977 total employees, or 90 percent. OFFICER ETHNICITY AM IND ASN BLK HISP WHT OTH Male ,000 1,500 2,000 2,500 3,000 3,500 4,000 per incident. This accounted for a six percent increase compared to an average of 3.2 officers per incident in The 2017 average number of officers per incident exceeded the 2013 through 2016 aggregate annual average of 2.9 by 17 percent. Gender Female Male 4,419 4,718 5,044 5,471 6,375 Total 4,934 5,225 5,588 6,118 7,110 In 2017, 735 female officers were involved in NCUOF incidents, which represented 10 percent of the 7,110 total employees. This accounted for a one percentage point decrease compared to 11 percent in The percentage of female officers involved in NCUOF incidents in 2017 was eight percentage points below the Department s overall female total. When compared to the aggregate percentage of involved female personnel from 2013 through 2016 of 10 percent, 2017 experienced no percentage change. Historically, from 2013 through 2017, females accounted for 2,945 of the 28,977 total involved employees, or 10 percent. Ethnicity American Indian Asian Black Hispanic 2,433 2,632 2,944 3,234 3,860 White 1,625 1,743 1,746 1,889 2,057 Other Total 4,934 5,225 5,588 6,118 7,110 Ethnicity City Population Department Personnel NCUOF Personnel In 2017, 3,860 Hispanic officers were involved in NCUOF incidents, which represented 54 percent of the 7,110 total employees. This accounted for a one percentage point increase compared to 53 percent in The percentage of Hispanic officers involved in NCUOF incidents in 2017 was seven percentage points above the Department s overall Hispanic total. When compared to the aggregate Asian/Pacific Isl. 12% 8% 9% Black 9% 10% 7% Hispanic 49% 47% 54% White 28% 32% 29% Other 2% 3% 1% Total 100% 100% 100% USE OF FORCE YEAR-END REVIEW LOS ANGELES POLICE DEPARTMENT 325
164 {NCUOF INCIDENTS} percentage of involved Hispanic personnel from 2013 through 2016 of 51 percent, 2017 experienced a three percentage point increase. Historically, from 2013 through 2017, a majority of officers involved in NCUOF incidents were Hispanic, accounting for 15,104 of the 28,977 total employees, or 52 percent. In 2017, 2,057 White officers were involved in NCUOF incidents, which represented 29 percent of the 7,110 total employees. This accounted for a two percentage point decrease compared to 31 percent in The percentage of White officers involved in NCUOF incidents in 2017 was three percentage points below the Department s overall White total. When compared to the aggregate percentage of involved White personnel from 2013 through 2016 of 32 percent, 2017 experienced a three percentage point decrease. Historically, from 2013 through 2017, White officers represented for the second largest ethnic category of personnel involved in NCUOF incidents, accounting for 9,058 of the 28,977 total employees, or 31 percent. OFFICER RANK >LT LT SGT PO RO DET DO CIVL 0 1,000 2,000 3,000 4,000 5,000 6,000 In 2017, 5,991 employees at the rank of police officer were involved in NCUOF incidents, which represented 84 percent of the 7,110 total employees. This accounted for a one percentage point decrease compared to 85 percent in The percentage of police officers involved in NCUOF incidents in 2017 was 16 percentage points above the Department s overall police officer total. When compared to the aggregate percentage of involved personnel at the rank of police officer from 2013 through 2016 of 87 percent, 2017 experienced a three percentage point decrease. Historically, from 2013 through 2017, a majority of personnel involved in NCUOF incidents were at the rank In 2017, 639 Asian/Pacific Islander officers were involved in NCUOF incidents, which represented nine percent of the 7,110 total employees. This represented no change when compared to the same percentage of involved Asian/ Pacific Islander officers in The percentage of Asian/ Pacific Islander officers involved in NCUOF incidents in 2017 was one percentage point above the Department s overall Asian/Pacific Islander total. When compared to the aggregate percentage of involved Asian/Pacific Islander personnel from 2013 through 2016 of nine percent, 2017 experienced no percentage change. Historically from 2013 through 2017, Asian/Pacific Islander officers accounted for 2,572 of the 28,977 total employees involved in NCUOF incidents, or nine percent. The remaining 554 employees, or eight percent, involved in 2017 NCUOF incidents included 485 Black officers, 13 American Indian officers, and 56 officers with other ethnic designations. Rank Command Staff Lieutenant Sergeant Police Officer 4,423 4,606 4,776 5,227 5,991 Reserve Police Officer Detective Detention Officer Civilian Total 4,934 5,225 5,588 6,118 7,110 of police officer, accounting for 25,025 of the 28,977 total employees, or 86 percent. In 2017, 659 employees at the rank of sergeant were involved in NCUOF incidents, which represented nine percent of the 7,110 total employees. This represented no change when compared to the same percentage of involved employees at the rank of sergeant in The percentage of sergeants involved in NCUOF incidents in 2017 was three percentage points below the Department s overall sergeant total. When compared to the aggregate percentage of involved personnel at the rank of sergeant from 2013 through 2016 of eight percent, 2017 experienced a one percentage point increase. Historically, from 2013 through 2017, sergeants accounted for 2,389 of the 28,977 total number of personnel involved in NCUOF incidents, representing eight percent. In 2017, 264 employees at the rank of detention officer were involved in NCUOF incidents, which represented four percent of the 7,110 total employees. This accounted for a one percentage point increase when compared to three percent in When compared to the aggregate OFFICER ASSIGNMENT ADMIN CSD INV PATROL RSRV SPCL TRAF OTH UASGN 0 1,000 2,000 3,000 4,000 5,000 6,000 In 2017, 5,361 personnel assigned to patrol were involved in NCUOF incidents, which represented 75 percent of the 7,110 total personnel. This represented no change when compared to the same percentage of personnel assigned to patrol in When compared to the aggregate percentage of involved personnel assigned to patrol from 2013 through 2016 of 76 percent, 2017 experienced a one percentage point decrease. Historically, from 2013 through 2017, a majority of personnel involved in NCUOF incidents were assigned to patrol, accounting for 21,919 of the 28,977 total employees, or 76 percent. In 2017, 908 personnel assigned to specialized assignments were involved in NCUOF incidents, which represented 13 percent of the 7,110 total personnel. This represented no change when compared to the same percentage of personnel assigned to specialized units in When compared to the aggregate percentage of involved personnel assigned to specialized assignments from percentage of involved personnel at the rank of detention officer from 2013 through 2016 of three percent, 2017 experienced a one percentage point increase. Historically, from 2013 through 2017, detention officers accounted for 849 of the 28,977 total number of personnel involved in NCUOF incidents, representing three percent. The remaining 196 employees, or three percent, involved in 2017 NCUOF incidents included five command staff personnel, 11 lieutenants, six reserve officers, 87 detectives, and 87 civilian personnel. Assignment Administrative Custody Investigative Patrol 3,838 3,982 4,123 4,615 5,361 Reserve Police Officer Specialized Enforcement Traffic Other Unassigned Total 4,934 5,225 5,588 6,118 7, through 2016 of 13 percent, 2017 experienced no percentage point change. Historically, from 2013 through 2017, personnel assigned to specialized assignments accounted for the second largest category of personnel involved in NCUOF incidents, representing 3,653 of the 28,977 total employees, or 13 percent. In 2017, 380 personnel assigned to custody assignments were involved in NCUOF incidents, which represented five percent of the 7,110 total personnel. This represented no change when compared to the same percentage of personnel assigned to custody in When compared to the aggregate percentage of involved personnel assigned to custody from 2013 through 2016 of five percent, 2017 experienced no percentage point change. Historically, from 2013 through 2017, personnel assigned to custody accounted for the third largest category of personnel involved in NCUOF incidents, representing 1,571 of the 28,977 total employees, or five percent USE OF FORCE YEAR-END REVIEW LOS ANGELES POLICE DEPARTMENT 327
165 {NCUOF INCIDENTS} OFFICER INJURIES YES NO 0 1,000 2,000 3,000 4,000 5,000 6,000 7,000 8,000 No Department personnel were killed during or resulting from NCUOF incidents during the five-year period from 2013 through However, 3,287 officers sustained injuries during the same five-year period. In 2017, 694 officers sustained injuries during the 2,117 NCUOF incidents throughout the year. This accounted for SUSPECT INFORMATION Injuries Yes No 4,265 4,595 4,933 5,480 6,416 Total 4,934 5,225 5,588 6,118 7,110 a nine percent increase compared to 638 injured officers in Additionally, when compared to the 2013 through 2016 annual average of 648 injured officers, 2017 was 46 injured officers, or seven percent, above the four-year annual average. points below the City s overall Hispanic population total. However, the percentage of Hispanic suspects involved in NCUOF incidents in 2017 was five percentage points above the City s overall Hispanic violent crime offender total. When compared to the aggregate percentage of involved Hispanic suspects from 2013 through 2016 of 45 percent, 2017 experienced no percentage change. Historically, from 2013 through 2017, the Hispanic category was the most represented ethnic group of suspects involved in NCUOF incidents, accounting for 4,411 of the 9,848 total suspects, or 45 percent. In 2017, 802 Black suspects were involved in NCUOF incidents, which represented 37 percent of the 2,163 total suspects. This accounted for a one percentage point decrease compared to 38 percent in The percentage of Black suspects involved in NCUOF incidents in 2017 was 28 percentage points above the City s overall Black population total. However, the percentage of Black suspects involved in NCUOF incidents in 2017 was seven percentage points below the City s overall Black violent crime offender total. When compared to the aggregate percentage of involved Black suspects from 2013 through 2016 of 36 percent, 2017 experienced a one percentage point increase. Historically, from 2013 through 2017, the Black category was the second most represented ethnic group of suspects involved in NCUOF incidents with 3,583 of the 9,848 total suspects, or 36 percent. In 2017, 309 White suspects were involved in NCUOF incidents, which represented 14 percent of the 2,163 total suspects. This represented no change when compared to the same percentage of suspects who were White in 2016 NCUOF incidents. The percentage of White suspects involved in NCUOF incidents in 2017 was 14 percentage points below the City s overall White population total. However, the percentage of White suspects involved in NCUOF incidents in 2017 was six percentage points above the City s overall White violent crime offender total. When compared to the aggregate percentage of involved White suspects from 2013 through 2016 of 15 percent, 2017 experienced a one percentage point decrease. Historically, from 2013 through 2017, the White category was the third most represented ethnic group of suspects involved in NCUOF incidents with 1,455 of the 9,848 total suspects, or 15 percent. The remaining 80 suspects, or four percent, involved in 2017 NCUOF incidents included one American Indian, 30 Asians, 46 with other ethnic designations, and three with unknown ethnicities. The suspect sections below include data for all individuals that Department personnel applied NCUOF against. SUSPECT ETHNICITY SUSPECT GENDER AM IND ASN BLK HISP WHT OTH UNK ,000 In 2017, 972 Hispanic suspects were involved in NCUOF incidents, which represented 45 percent of the 2,163 total suspects. This represented no change when compared to the same percentage of suspects who were Hispanic in 2016 NCUOF incidents. The percentage of Hispanic suspects involved in NCUOF incidents in 2017 was four percentage Ethnicity American Indian Asian Black Hispanic White Other Unknown Total 1,860 1,933 1,896 1,996 2,163 Ethnicity City Population Violent Crime Suspect NCUOF Suspect Asian/Pacific Isl. 12% (See Other) 1% Black 9% 44% 37% Hispanic 49% 40% 45% White 28% 8% 14% Other 2% 3% 2% Unknown DNA 5% 0% Total 100% 100% 100% FEMALE MALE UNKNOWN In 2017, 1,795 male suspects were involved in NCUOF incidents, which represented 83 percent of the 2,163 total suspects. This accounted for a two percentage point decrease compared to 85 percent in Similarly, when compared to the aggregate percentage of involved male suspects from 2013 through 2016 of 85 percent, 2017 experienced a two percentage point decrease. Historically, from 2013 through 2017, a majority of suspects involved in NCUOF incidents were male, accounting for 8,346 of the 9,848 total suspects, or 85 percent. In 2017, 359 female suspects were involved in NCUOF incidents, which represented 17 percent of the 2,163 Gender Female Male 1,594 1,657 1,602 1,698 1,795 Unknown Total 1,860 1,933 1,896 1,996 2,163 total suspects. This accounted for a two percentage point increase compared to 15 percent in Similarly, when compared to the aggregate percentage of involved female suspects from 2013 through 2016 of 15 percent, 2017 experienced a two percentage point increase. Historically, from 2013 through 2017, females accounted for 1,474 of the 9,848 total suspects involved in NCUOF incidents, or 15 percent. The remaining nine suspects, or less than one percent, involved in 2017 NCUOF incidents have unknown gender classifications USE OF FORCE YEAR-END REVIEW LOS ANGELES POLICE DEPARTMENT 329
166 {NCUOF INCIDENTS} SUSPECT AGE SUSPECT PERCEIVED MENTAL ILLNESS >57 UNK Age and Above Unknown Total 1,860 1,933 1,896 1,996 2,163 YES NO UNK ,000 1,500 2,000 In 2017, 662 of the 2,163 total suspects, or 31 percent, involved in NCUOF incidents were perceived to suffer from a mental illness and/or a mental health crisis. This accounted for a four percentage point increase compared to 27 percent in When compared to the aggregate percentage of involved suspects who were perceived to Mental Illness Yes No 1,451 1,508 1,413 1,443 1,486 Unknown Total 1,860 1,933 1,896 1,996 2,163 suffer from a mental illness and/or a mental health crisis from 2013 through 2016 of 23 percent, 2017 experienced an eight percentage point increase. Historically from 2013 through 2017, suspects who were perceived to suffer from a mental illness and/or a mental health crisis accounted for 2,462 of the 9,848 total suspects, or 25 percent. In 2017, the age group accounted for 498 of the 2,163 total suspects involved in NCUOF incidents, or 23 percent. This specific age category accounted for a one percentage point increase compared to 22 percent in When compared to the aggregate percentage of involved suspects within the age range from 2013 through 2016 of 21 percent, 2017 experienced a two percentage point increase. Historically, from 2013 through 2017, the age group represented the largest age category of suspects involved in NCUOF incidents with 2,134 of the 9,848 total suspects, or 22 percent. In 2017, the age group represented the second largest age category, with 367 out of the 2,163 total suspects, or 17 percent. The age category accounted for a two percentage point increase compared to 15 percent in When compared to the aggregate percentage of involved suspects within the age range from 2013 through 2016 of 16 percent, 2017 experienced a one percentage point increase. Historically, from 2013 through 2017, the age group represented the third largest age category of suspects involved in NCUOF incidents with 1,577 of the 9,848 total suspects, or 16 percent. In 2017, the age group represented the third largest age category, with 337 out of the 2,163 total suspects, or 16 percent. The age category accounted for a two percentage point decrease compared to 18 percent in When compared to the aggregate percentage of involved suspects within the age range from 2013 through 2016 of 19 percent, 2017 experienced a three percentage point decrease. Historically, from 2013 through 2017, the age group represented the second largest age category of suspects involved in NCUOF incidents with 1,814 of the 9,848 total suspects, or 18 percent. Consistent with 2013 through 2016 figures, the remaining 2017 NCUOF suspect age categories experienced diminishing totals as age increased. SUSPECT PERCEIVED IMPAIRMENT ALC DRG & ALC DRG DRG OR ALC NO UNK ,000 1,200 In 2017, 934 of the 2,163 total suspects, or 43 percent, involved in NCUOF incidents were perceived to be impaired by drugs and/or alcohol. This represented no change when compared to the same percentage of impaired suspects in 2016 NCUOF incidents. Additionally, when compared to the aggregate percentage of involved NCUOF suspects who Impairment Alcohol Impaired Drug & Alcohol Impaired Drug Impaired Drug or Alcohol Impaired No Impression ,121 Unknown Total 1,860 1,933 1,896 1,996 2,163 were perceived to be impaired by drugs and/or alcohol from 2013 through 2016 of 43 percent, 2017 experienced no percentage point change. Historically from 2013 through 2017, 4,257 suspects involved in NCUOF incidents were perceived to be impaired by drugs and/or alcohol, representing 43 percent of the 9,848 total suspects USE OF FORCE YEAR-END REVIEW LOS ANGELES POLICE DEPARTMENT 331
167 {NCUOF INCIDENTS} SUSPECT HOMELESS DEPARTMENT ADJUDICATION 49 ADMINISTRATIVE APPROVAL YES TACT NO/UNK ,000 1,500 2,000 Homeless Yes No/Unknown 1,556 1,579 1,468 1,493 1,556 Total 1,860 1,933 1,896 1,996 2,163 FORCE 0 5,000 10,000 15,000 20,000 Admin. Approval Tactics 4,913 5,195 5,546 6,053 N/A Force 13,261 13,753 14,860 16,669 N/A In 2017, 607 of the 2,163 total suspects, or 28 percent, involved in NCUOF incidents were perceived to be homeless. This accounted for a three percentage point increase compared to 25 percent in When compared to the aggregate percentage of involved NCUOF suspects who were perceived to be homeless from 2013 through 2016 of 21 percent, 2017 experienced a seven percentage point increase. Historically from 2013 through 2017, 2,196 suspects involved in NCUOF incidents were perceived to be homeless, representing 22 percent of the 9,848 total suspects. In 2016, 6,053 out of the 6,119 total NCUOF Tactics findings, representing 98.9 percent, were adjudicated as Administrative Approval. This accounted for a 0.2 percentage point decrease compared to 99.1 percent of Administrative Approval Tactics findings in When compared to the aggregate percentage of Administrative Approval Tactics findings from 2013 through 2015 of 99.2 percent, 2016 experienced a 0.3 percentage point decrease. Historically from 2013 through 2016, a vast majority of adjudicated Tactics findings resulted in an Administrative Approval outcome, accounting for 21,707 of the 21,895 total Tactics findings, or 99.1 percent. In 2016, 16,669 out of the 16,718 total NCUOF Force findings, representing 99.7 percent, were adjudicated as Administrative Approval. This represented a 0.1 percentage point decrease compared to 99.8 percent of Administrative Approval Force findings in Similarly, when compared to the 2013 through 2015 aggregate percentage of Administrative Approval Force findings of 99.8 percent, 2016 experienced a 0.1 percentage point decrease. Historically from 2013 through 2016, a vast majority of adjudicated Force findings resulted in an Administrative Approval outcome, accounting for 58,543 of the 58,668 total Force findings, or 99.8 percent. SUSPECT INJURIES ADMINISTRATIVE DISAPPROVAL YES TACT NO UNK ,000 1,500 2,000 Injuries Yes 1,616 1,701 1,656 1,726 1,786 No Unknown Total 1,860 1,933 1,896 1,996 2,163 FORCE Admin. Disapproval Tactics N/A Force N/A In 2017, 1,786 suspects sustained injuries during the 2,117 NCUOF incidents throughout the year, which represented 83 percent of the 2,163 total suspects. This represented a three percentage point decrease compared to 86 percent in When compared to the aggregate percentage of involved suspects who sustained injuries during NCUOF incidents from 2013 through 2016 of 87 percent, 2017 experienced a four percentage point decrease. Historically, from 2013 through 2017, 8,485 suspects involved in NCUOF incidents sustained injuries, representing 86 percent of the 9,848 total involved suspects. In 2016, 66 out of the 6,119 total NCUOF Tactics findings, representing 1.1 percent, were adjudicated as Administrative Disapproval. This accounted for a 0.2 percentage point increase compared to 0.9 percent of Administrative Disapproval Tactics findings in When compared to the aggregate percentage of Administrative Disapproval Tactics findings from 2013 through 2015 of 0.8 percent, 2016 experienced a 0.3 percentage point increase. Historically from 2013 through 2016, 188 adjudicated Tactics findings resulted in an Administrative Disapproval outcome, representing 0.9 percent of the 21,895 total Tactics findings. In 2016, 49 out of the 16,718 total NCUOF Force findings, representing 0.3 percent, were adjudicated as Administrative Disapproval. This represented a 0.1 percentage point increase compared to 0.2 percent of Administrative Disapproval Force findings in Similarly, when compared to the 2013 through 2015 aggregate percentage of Administrative Disapproval Force findings of 0.2 percent, 2016 experienced a 0.1 percentage point increase. Historically from 2013 through 2016, 125 adjudicated Force findings resulted in an Administrative Disapproval outcome, representing 0.2 percent of the 58,668 total Force findings. 49 Adjudication data for 2017 was omitted from this Report since a vast majority of the NCUOF incidents will be adjudicated by the BOPC in USE OF FORCE YEAR-END REVIEW LOS ANGELES POLICE DEPARTMENT 333


168 {OIS SYNOPSES & SUSPECT WEAPONS 2013} FID : JANUARY 1, 2013 During a New Year s Eve gunfire suppression detail, uniformed officers heard the sound of gunfire. When they went to investigate, they observed the suspect shooting a rifle into the air. When ordered to drop the weapon, the suspect pointed the rifle at the officer, resulting in an OIS. The suspect evaded capture which resulted in a foot pursuit. The rifle was discarded by the suspect and not recovered. However, multiple firearms were recovered as well as rifle magazines and ammunition. FID : JANUARY 18, 2013 Uniformed officers received a radio call of a man armed with a knife. Upon arriving at the location, they contacted the suspect and a struggle ensued. During the struggle, the suspect attempted to disarm an officer, resulting in an OIS. There is no photograph available as the suspect s weapon was an automobile. FID : JANUARY 25, 2013 While off-duty, an officer became involved in a road rage incident. After believing he had evaded the suspect, the officer drove to his residence. The suspect appeared and struck the officer with his vehicle causing the officer to land on top of the vehicle. The suspect drove off with the officer on his vehicle, resulting in an OIS. There is no photograph available as the suspect fled the location and was later apprehended. FID : FEBRUARY 2, 2013 Uniformed officers received a radio call of a man armed with a gun. Officers located the suspect, who then fled on foot. A perimeter was established and a search of the area was conducted. During the search, the suspect was located and given orders to surrender. The suspect pointed a handgun at the officers, resulting in an OIS. LOS ANGELES POLICE DEPARTMENT 335


169 {OIS SYNOPSES & SUSPECT WEAPONS 2013} There is no photograph available as the suspect fled the location after firing at the officers. FID : FEBRUARY 7, 2013 Uniformed officers were assigned to a protection detail outside the City for a wanted murder suspect. A citizen approached the officers and pointed out the suspect s vehicle. While officers were following the vehicle, the suspect stopped and exited his vehicle with a rifle and began shooting at them, resulting in an OIS. There is no photograph available as the incident was a perception shooting. FID : MARCH 15, 2013 Plainclothes officers were serving a search warrant at a residence. Upon identifying themselves, a suspect appeared holding a black object, which was pointed at the officers, resulting in an OIS. FID : FEBRUARY 8, 2013 Uniformed officers were assigned to a protection detail outside the City for a wanted murder suspect. Officers observed a vehicle approach the location driving erratically. Officers heard what they believed was gunfire coming from the vehicle, resulting in an OIS. FID : MARCH 16, 2013 Uniformed officers responded to a radio call of a robbery in progress. Upon arrival, the officers located the suspect inside a restaurant holding a handgun. The suspect exited the restaurant with the handgun and pointed it at the officers, resulting in an OIS. There is no photograph available as the incident was a perception shooting. FID : FEBRUARY 24, 2013 Uniformed officers responded to a radio call of an assault with a deadly weapon suspect armed with a handgun. Officers located the suspect who had his hands concealed inside a bag. The suspect approached the officers and stated he was going to kill them. The suspect refused to stop his advance and show his hands, resulting in an OIS. FID : MARCH 9, 2013 Uniformed officers responded to a radio call of an assault with a deadly weapon. Upon arrival, they located the suspect who had an object concealed behind his back. The suspect yelled at the officers to kill him. The suspect fled, turned toward the officers, and pointed a silver object at them, resulting in an OIS. FID : MARCH 8, 2013 Uniformed officers responded to a radio call of a man armed with a gun. Upon arrival, officers heard a victim yell that the suspect was armed and hurting her. Officers approached the residence and observed the suspect appear through window pointing a handgun at them, resulting in an OIS. There is no photograph available as the incident was a perception shooting. FID : APRIL 29, 2013 Uniformed officers observed a vehicle driving erratically. Officers attempted to stop the vehicle and a pursuit ensued. The pursuit left the City and terminated when the suspect crashed his vehicle and fled into a residence. The residence was surrounded and SWAT responded. SWAT officers asked for the suspect to surrender, which he refused to do. The suspect appeared with what officers believed to be a handgun, pointed it at the officers, and an OIS occurred USE OF FORCE YEAR-END REVIEW LOS ANGELES POLICE DEPARTMENT 337


170 {OIS SYNOPSES & SUSPECT WEAPONS 2013} FID : MAY 1, 2013 Plainclothes officers in different vehicles were returning to Central Facilities. They were stopped in traffic when they each observed a suspect emerge from a business firing a handgun into the establishment, resulting in an OIS. FID : MAY 17, 2013 Uniformed officers attempted to initiate a consensual encounter on a pedestrian. While doing so, the suspect began running with his hand on his waistband. The officers followed the suspect on foot, and observed him remove a handgun from his waistband. The suspect pointed the handgun at the officers, resulting in an OIS. A firearm was recovered at the crime scene. However, TID did not provide a photograph of the weapon. FID : MAY 1, 2013 Plainclothes officers working a task force observed a vehicle being driven erratically and requested uniformed officers conduct a traffic stop. Upon conducting the traffic stop, officers observed the suspect emerge from the vehicle armed with an assault weapon. The suspect pointed the rifle at the officers, resulting in an OIS. FID : MAY 17, 2013 Uniformed officers received a radio call of a violent male with a possible mental illness. Upon arrival, they located the suspect inside of his residence armed with two knives. The suspect raised the knives and charged toward the officers, resulting in an OIS. FID : MAY 5, 2013 Uniformed officers responded to a radio call of a burglary suspect. Upon arrival, they observed the suspect on a second story balcony holding a handgun. The suspect pointed the handgun at the officers, resulting in an OIS. FID : MAY 20, 2013 Plainclothes officers observed a suspect on a bicycle commit several vehicle code violations and attempted to conduct a traffic stop. When the officers attempted to stop the suspect, he fled on the bicycle. The suspect then abandoned the bicycle and ran on foot. The suspect produced a handgun and pointed it at the officers, resulting in an OIS. FID : MAY 16, 2013 Uniformed officers received a radio call of an attempted suicide. Upon arrival, they observed a suspect armed with two knives. The suspect charged at the officers with the knives, resulting in an OIS. FID : JUNE 25, 2013 Plainclothes detectives were returning to their Division of assignment and were stopped at the front gate entrance in their vehicle. The suspect approached their vehicle and began firing an unknown weapon at them, resulting in an OIS. There is no photograph available as the incident was a perception shooting USE OF FORCE YEAR-END REVIEW LOS ANGELES POLICE DEPARTMENT 339


171 {OIS SYNOPSES & SUSPECT WEAPONS 2013} FID : JUNE 30, 2013 Uniformed officers, along with the Probation Department, conducted a Parole/Probation compliance check. As they were searching an attic, the suspect appeared and shot an officer in the face, resulting in an OIS. FID : JULY 18, 2013 A uniformed lieutenant had parked and exited his police vehicle. The lieutenant was approached by a citizen, who informed him of an armed robbery suspect. The citizen directed the lieutenant to the suspect, who entered his vehicle and drove towards the lieutenant, resulting in an OIS. There is no photograph available as the suspect s weapon was an automobile. FID : JUNE 30, 2013 Uniformed officers responded to a radio call of a man with a gun. Upon arrival, they observed a man inside the residence to the rear of the location holding a pistol. The suspect exited the residence and pointed the pistol at the officers, resulting in an OIS. FID : JULY 16, 2013 Plainclothes officers were monitoring a vigil at a church to obtain gang intelligence. The suspect walked away from the church and approached the officers. The suspect removed a handgun and fired at the officers, resulting in an OIS. FID : JUNE 30, 2013 Uniformed officers responded to an assault with a deadly weapon/shots fired radio call. Upon arrival and after speaking to a victim who sustained a gunshot wound, the officers observed the suspect armed with a handgun. The suspect pointed the handgun at the officers, resulting in an OIS. FID : JULY 26, 2013 SWAT officers responded to a radio call of a barricaded suspect armed with a handgun. Officers were attempting to persuade the suspect to exit the apartment without the handgun, when the suspect exited the apartment and pointed the handgun at the officers, resulting in an OIS. A firearm was recovered at the crime scene. However, TID did not provide a photograph of the weapon. Two firearms were recovered at the crime scene. However, TID did not provide photographs of the weapons. FID : JULY 8, 2013 Uniformed officers responded to a radio call of a robbery in progress at a marijuana dispensary. Upon arrival, they observed the suspect s vehicle and attempted to initiate a traffic stop. A vehicle pursuit ensued and terminated a short distance away. The suspect exited the vehicle and began firing a handgun at the officers, resulting in an OIS. FID : JULY 28, 2013 Uniformed officers were stopped in traffic when the suspect walked past them holding a shotgun. When the officers directed him to drop the weapon, the suspect turned and pointed the shotgun at the officers, resulting in an OIS USE OF FORCE YEAR-END REVIEW LOS ANGELES POLICE DEPARTMENT 341


172 {OIS SYNOPSES & SUSPECT WEAPONS 2013} FID : JULY 31, 2013 Uniformed officers observed a suspect acting irrationally and dressed in heavy clothing during hot weather. Officers made contact with the suspect, who assumed a shooting stance and pointed an unknown object at them, resulting in an OIS. FID : SEPTEMBER 11, 2013 Uniformed officers responded to a radio call of shooting that had just occurred. Upon arrival at a business, the officers observed the suspect pointing a revolver at a victim. The officers attempted to make contact with the suspect, who then pointed the revolver at them, resulting in an OIS. FID : AUGUST 3, 2013 Uniformed officers responded to a radio call of a man with a gun. Upon arrival, they observed the suspect seated on a residential porch. The suspect produced a handgun and fired at the officers, resulting in an OIS. FID : SEPTEMBER 13, 2013 Uniformed officers responded to a radio call of a man armed with a gun. Upon arrival, they observed the suspect seated near a food truck holding a revolver. When they ordered him to drop the gun, he pointed it at the officers, resulting in an OIS. FID : AUGUST 20, 2013 Uniformed officers responded to a radio call of a shooting in progress. Upon arrival, they located the suspect who was in possession of a handgun. When the officers ordered him to drop the handgun, he turned and pointed it at them, resulting in an OIS. FID : OCTOBER 11, 2013 Uniformed officers responded to a radio call of an assault with a deadly weapon suspect who was inside a camper parked in the driveway. The officers attempted to persuade the suspect to exit the camper, which he failed to do. The officers then used a pry tool to breech the camper door. While doing so, the suspect exited the camper armed with a hammer. The suspect raised the hammer at the officers, resulting in an OIS. FID : AUGUST 28, 2013 Uniformed officers observed a known gang member standing on the sidewalk. Upon attempting to make contact with him, he ran from the officers. The suspect stopped and pointed a handgun at the officers, resulting in an OIS. FID : OCTOBER 11, 2013 Uniformed officers received a radio call of a woman armed with a knife. Officers arrived and were directed to her apartment. While attempting to verbalize with her, the suspect charged the officers with a knife, resulting in an OIS USE OF FORCE YEAR-END REVIEW LOS ANGELES POLICE DEPARTMENT 343


173 {OIS SYNOPSES & SUSPECT WEAPONS 2013} FID : OCTOBER 26, 2013 Uniformed officers were providing extra patrol in a housing project when they were flagged down by citizens. As they approached the citizens, they pointed toward a group of men, one of whom was in possession of a handgun. The suspect ran away, then turned towards the officers and pointed the handgun at them, resulting in an OIS. FID : NOVEMBER 22, 2013 Uniformed officers responded to a radio call of a man armed with a gun. Upon arrival, they observed the suspect and made contact with him. The suspect drew a handgun from his waistband and pointed it at the officers, resulting in an OIS. FID : NOVEMBER 3, 2013 Uniformed officers observed a known gang member standing on a street corner and decided to initiate a consensual encounter. As they approached, the suspect fled while holding his waistband. As the officers pursued him, he removed a revolver from his waistband and pointed it at the officers, resulting in an OIS. FID : NOVEMBER 25, 2013 Uniformed officers received a radio call of shots fired at a residence. Upon arrival, the officers surrounded the location and attempted to convince the suspect to exit. The suspect refused and was observed to be in possession of a rifle. While awaiting the arrival of SWAT, the suspect pointed the rifle at the officers, resulting in an OIS. A pistol and rifle were recovered. FID : NOVEMBER 11, 2013 Plainclothes officers received information regarding an assault with a deadly weapon suspect. During a surveillance of the suspect s residence, they observed him leave in a vehicle with two other individuals. The officers followed the suspect vehicle and attempted to conduct a traffic stop. The suspect exited the vehicle and ran from the officers. During a foot pursuit, the suspect pointed a handgun at the officers, resulting in an OIS. There is no photograph available as the incident was a perception shooting. FID : DECEMBER 13, 2013 Officers observed a vehicle driving at a high rate of speed. When they attempted to stop the vehicle, a pursuit ensued. The suspect became involved in a traffic collision, after which he exited the vehicle and began walking towards the rear of the vehicle. A beanbag shotgun was deployed at the suspect and an OIS ensued. FID : NOVEMBER 17, 2013 Uniformed officers responded to a radio call regarding an assault with a deadly weapon. After speaking to the victim, the officers responded to the suspect s residence, where they observed him on the balcony. The suspect pointed a shotgun at them, resulting in an OIS. There is no photograph available as the suspect fled the location and was later apprehended. FID : DECEMBER 25, 2013 Uniformed officers received a radio call of a robbery that had just occurred. After completing a report, the officers observed the suspect s vehicle in the parking lot of a convenience store. While officers attempted to detain the occupants of the vehicle, the suspect pointed an unknown object at them, resulting in an OIS USE OF FORCE YEAR-END REVIEW LOS ANGELES POLICE DEPARTMENT 345


174 {OIS SYNOPSES & PHOTOGRAPHS OF WEAPONS 2013} {OIS SYNOPSES & SUSPECT WEAPONS 2014} FID : DECEMBER 27, 2013 Uniformed officers responded to a radio call of man armed with a gun at a residence. While searching the backyard of the location, the suspect exited the detached garage armed with a handgun. The suspect pointed the handgun at the officers, resulting in an OIS. There is no photograph available as the incident was a perception shooting. F003-14: JANUARY 14, 2014 Uniformed officers responded to a radio call regarding a robbery investigation at a business. Utilizing the tracking feature on the victim s cell phone, officers tracked the suspect s movements and verified his whereabouts. A foot pursuit ensued and the suspect entered a residence at gunpoint, resulting in an extensive standoff with numerous Department resources. At one point, the suspect emerged from the residence and pointed what officers believed to be a handgun at them, resulting in an OIS. F004-14: JANUARY 15, 2014 Uniformed officers responded to an assault with a deadly weapon/domestic violence radio call at a residence. Upon their arrival, officers heard a single gunshot emanating from the residence. Officers located the suspect and a foot pursuit ensued. During the foot pursuit, an OIS occurred. F008-14: MARCH 6, 2014 Plainclothes officers contacted a suspicious male and observed a handgun in his front waistband. The suspect failed to comply with officers commands and removed the handgun from his waistband, resulting in an OIS. A firearm was recovered at the crime scene. However, TID did not provide a photograph of the weapon. F009-14: MARCH 24, 2014 Uniformed officers responded to a radio call regarding a man armed with a knife and threatening to harm a female victim inside a residence. A LAPD helicopter arrived at scene before patrol officers. Personnel in the airship observed the suspect armed with a shotgun and information was broadcast to the responding units. Patrol officers arrived at scene and began formulating a tactical plan. While on the perimeter, the suspect emerged from the residence and pointed the shotgun at officers, resulting in an OIS USE OF FORCE YEAR-END REVIEW LOS ANGELES POLICE DEPARTMENT 347


175 {OIS SYNOPSES & SUSPECT WEAPONS 2014} F014-14: APRIL 4, 2014 Uniformed officers responded to a radio call regarding a male armed with a knife who was attempting suicide. After using less-lethal force to effect the arrest of the suspect, which had no effect, the suspect charged at the officers with the knife, resulting in an OIS. F019-14: APRIL 24, 2014 Uniformed officers responded to a radio call regarding an assault with a deadly weapon suspect armed with a machete in front of a residence. A police helicopter arrived over the scene and observed the suspect running from the location and into a nearby business. Officers deployed into the business and made contact with the suspect, who they verified was armed with a sword. Officers utilized less-lethal force against the suspect, which had no effect. The suspect then charged at the officers with the sword, resulting in an OIS. F016-14: APRIL 7, 2014 Two uniformed officers assigned to the front desk at a community police station observed a male, later identified as the suspect, enter the front lobby area. The suspect reached into his waistband, removed a handgun, and fired at the officers, resulting in an OIS. F024-14: MAY 12, 2014 Uniformed officers responded to a radio call regarding a group fighting at a major entertainment venue. As officers arrived at the location, they observed a large group of individuals fighting and then heard gunfire. Officers tactically deployed along a planter and observed a suspect crouched in a shooting position while holding a handgun. The suspect pointed the handgun in the direction of an oncoming crowd of people, resulting in an OIS. F017-14: APRIL 13, 2014 Uniformed officers responded to a radio call regarding an assault with a deadly weapon suspect armed with a knife inside a business. Officers arrived at the scene and observed the suspect walking away from the location. After ordering him to stop, the suspect removed a knife from a bag and charged at one of the officers with the knife raised above his head, resulting in an OIS. F027-14: MAY 17, 2014 Uniformed officers responded to a radio call regarding an assault with a deadly weapon suspect at a residence. Officers arrived and made contact with the person reporting. As they continued talking to the PR, large rocks were thrown at their police vehicle. Officers requested back-up and additional resources arrived at the scene. A male suspect then emerged and ran toward the officers holding a kitchen knife while making slashing motions at them with the knife, resulting in an OIS. F018-14: APRIL 21, 2014 Uniformed officers responded to a radio call regarding a possible assault with a deadly weapon suspect at a parking structure. A police sergeant assisted the responding officers and was the first to arrive at the scene. The sergeant made contact with the suspect, who emerged from behind a pillar holding a box cutter in his hand. After failing to comply with commands, the suspect began swinging the box cutter at the sergeant. The sergeant then utilized less-lethal force, which had no effect on the suspect and caused him to more aggressively and intently slash at the sergeant, resulting in an OIS. F033-14: JUNE 25, 2014 Uniformed officers responded to a shooting in progress at a business. A perimeter was established after officers verified the suspect s last known location. While conducting a search of the area, a police K-9 located the suspect and commands were given to the suspect to surrender. Officers observed a handgun near the suspect, which he gained possession of, resulting in an OIS USE OF FORCE YEAR-END REVIEW LOS ANGELES POLICE DEPARTMENT 349


176 {OIS SYNOPSES & SUSPECT WEAPONS 2014} F038-14: JULY 13, 2014 REPLICA/PELLET/BB Uniformed officers responded to a radio call regarding a burglary alarm activation at a business. As the officers were preparing to search the location, one officer observed a male suspect arm himself with a rifle and point it at him, resulting in an OIS. There is no photograph available as the suspect used physical force against the officer. F049-14: AUGUST 12, 2014 While monitoring a location for narcotics activity, plainclothes officers observed a narcotic transaction. Officers attempted to detain the suspect who sold the item; however, he fled from the location. Officers searched the area and encountered the suspect, who again fled from the officers, provoking a foot pursuit. A physical altercation ensued with the suspect, resulting in an OIS. F041-14: JULY 25, 2014 Uniformed officers responded to a vandalism suspect at a residence. Upon their arrival, officers observed a male suspect holding two metal poles in his right hand and screaming. The officers gave the suspect numerous commands to drop the poles, which he failed to do. Officers then utilized less-lethal force against the suspect, which had no effect. The suspect advanced towards one of the officers with the metal poles, resulting in an OIS. F052-14: AUGUST 17, 2014 Uniformed officers responded to a violent male with a mental condition at a residence. Upon arrival, officers observed the suspect in the rear of the location armed with a shotgun. Officers ordered the suspect numerous times to drop the shotgun; however, their efforts were ineffective. The suspect then charged at the officers with the shotgun, resulting in an OIS. F042-14: JULY 30, 2014 Uniformed officers responded to a shooting involving an off-duty law enforcement employee, which also involved a kidnapping. The suspect entered a vehicle and pointed a handgun at a female occupant, who was forced to remain inside the vehicle as the suspect fled the location. Officers located the vehicle and a vehicle pursuit ensued. At one point, the suspect stopped, exited his vehicle, and pointed a handgun at the officers, resulting in an OIS. F053-14: AUGUST 18, 2014 Uniformed officers attempted to conduct a vehicle stop after observing the occupant driving reckless. The driver failed to yield and a vehicle pursuit was initiated. At one point, the vehicle suddenly stopped and the front passenger exited the vehicle armed with an assault rifle and fired at officers, resulting in an OIS. The suspects continued fleeing, after which the vehicle collided into a building and the suspects fled on foot. As the suspects continued running, the front passenger again fired at officers with the rifle, resulting in a second OIS. Both suspects temporarily evaded capture and a perimeter was established. SWAT arrived at the scene and initiated a search of the area. The driver was subsequently located and taken into custody. While continuing with their search for the passenger, SWAT officers observed him emerge from behind a parked vehicle and begin firing at them with the rifle, resulting in a third OIS. There is no photograph available as the suspect attempted to disarm the officer. F047-14: AUGUST 11, 2014 Uniformed officers attempted to detain a male suspect regarding a narcotics investigation. As one officer approached the suspect, he immediately turned towards the officer and a physical altercation ensued. During the altercation, the suspect attempted to remove the officer s service pistol from his holster, resulting in an OIS. F054-14: SEPTEMBER 8, 2014 Uniformed officers responded to a domestic violence radio call at a residence. Upon their arrival, officers heard arguing emanating from the porch area of the residence. As the officers approached, they heard gunshots and a woman screaming. Additionally, they observed muzzle flashes coming from the silhouette of the suspect, who was standing on the front porch. The suspect began shooting into the house and then pointed the handgun at the officers, resulting in an OIS USE OF FORCE YEAR-END REVIEW LOS ANGELES POLICE DEPARTMENT 351


177 {OIS SYNOPSES & SUSPECT WEAPONS 2014} F056-14: SEPTEMBER 17, 2014 REPLICA/PELLET/BB Uniformed officers responded to a radio call regarding a man armed with a gun in front of a hospital. Upon their arrival, the officers observed the suspect pointing a handgun at motorists and followed him on foot while attempting to communicate with him. In the course of doing so, the suspect pointed his handgun at one of the officers, resulting in an OIS. F074-14: NOVEMBER 30, 2014 Uniformed officers responded to a radio call regarding a burglary from a motor vehicle investigation in front of a residence. Upon their arrival, officers observed the suspect sitting inside a vehicle parked on the street. The suspect looked in the direction of the officers, immediately exited the vehicle and began running from the location. Officers initiated a foot pursuit of the suspect. At one point during the foot pursuit, the suspect pointed a handgun at one of the officers, resulting in an OIS. F066-14: NOVEMBER 9, 2014 Uniformed officers observed and identified a wanted male suspect from a Crime Bulletin who was driving a vehicle. Officers attempted to conduct a vehicle stop, which resulted in the initiation of a vehicle pursuit. During the pursuit, the suspect stopped his vehicle at multiple locations and pointed a sawed-off shotgun at officers, at one point resulting in an OIS. The suspect continued driving and was incidentally contained in an area by SWAT armored vehicles. During the containment, the suspect pointed his shotgun at a SWAT officer, resulting in a second OIS. F075-14: DECEMBER 2, 2014 Uniformed officers responded to a radio call regarding a screaming woman at an apartment. Officers arrived at the scene and heard a female victim yell for help and indicated she was being stabbed. Additional officers arrived at scene and a tactical plan to gain entry into the residence was formulated. Upon making entry, officers observed the suspect stabbing the victim numerous times in the chest, resulting in an OIS. F067-14: NOVEMBER 9, 2014 Uniformed officers responded to a radio call regarding shots fired at a residence. Upon their arrival, officers observed the suspect leaving the location on foot. Officers initiated a foot pursuit, during which the suspect removed a handgun from his waistband and an OIS ensued. The suspect fled into the neighborhood and a perimeter was established. Metropolitan Division K-9 and SWAT personnel arrived at scene and conducted a search of the area. During the search, officers located the suspect and gave him numerous commands to surrender. The suspect refused and a K-9 was released, which resulted in a K-9 contact with the suspect. As the K-9 continued biting onto the suspect, he removed the pistol from his front waistband area and shot himself in the head. F076-14: DECEMBER 5, 2014 Uniformed officers responded to an ambulance cutting at a major entertainment center. Comments of the call also indicated that the suspect was still at the location. Upon arrival, the officers were directed to the suspect, who was armed with the knife. Officers ordered the suspect numerous times to drop the knife; however, he refused to comply. The suspect then charged at the officers with the knife, resulting in an OIS. F068-14: NOVEMBER 9, 2014 Uniformed officers responded to a radio call regarding a male stabbing himself with a knife. Upon their arrival, officers observed the suspect walking on a nearby sidewalk and saw blood on his T-shirt, hands, and neck area. Officers also observed a black knife in his right hand. The officers ordered the suspect to drop the knife numerous times; however, he ignored their commands and continued cutting and stabbing himself. As officers continued following the suspect on foot, he suddenly turned towards of the officers and began to advance toward them with the knife, resulting in an OIS. F078-14: DECEMBER 26, 2014 Uniformed officers responded to a radio call regarding a female suspect armed with a handgun and fist fighting other females at a major entertainment center. Upon their arrival, officers were redirected to an underground parking structure, where the suspect was located. While conducting their follow-up investigation, officers observed the suspect armed with a handgun and pointing it at her own head. The officers gave the suspect numerous commands to drop the gun; however, she refused to comply. The suspect then pointed the handgun at the officers, resulting in an OIS USE OF FORCE YEAR-END REVIEW LOS ANGELES POLICE DEPARTMENT 353


178 {OIS SYNOPSES & PHOTOGRAPHS OF WEAPONS 2014} {OIS SYNOPSES & SUSPECT WEAPONS 2015} F079-14: DECEMBER 28, 2014 Uniformed officers were responding to a radio call and observed two males walking on the sidewalk. The officers then heard numerous gunshots, causing them to believe that they were being shot at. Both officers deployed out of their vehicle and took cover behind the engine block. Officers observed the suspect point a handgun at them, resulting in an OIS. F002-15: JANUARY 5, 2015 Uniformed officers responded to a kidnap suspect there now radio call. Upon the officers arrival, the victim advised the officers that the suspect had held him overnight at gunpoint in the residence and had refused to let him leave. A perimeter was established and numerous attempts to have the suspect surrender failed. Special Weapons and Tactics and K9 units responded as a result of the barricaded suspect and deployed on the residence. A citizen advised officers that the next door residence was abandoned and that there was a shed behind the house that should be checked. The officers responded to the back and subsequently observed the suspect armed with a pistol. After failed attempts to gain his cooperation, the suspect fired numerous rounds at officers through a window, resulting in an OIS. F004-15: JANUARY 15, 2015 Uniformed officers responded to a radio call of a subject attempting suicide at a residence. Los Angeles City Fire Department personnel were the first to arrive at scene and discovered a combative patient who locked himself inside a room. Officers, who responded to a back-up request by the LAFD, formed a contact team and entered the residence. During officers attempts to contact the suspect and allow medical personnel to treat him, the suspect stood up with a kitchen knife in his hand and moved toward officers, resulting in an OIS. F005-15: JANUARY 17, 2015 Uniformed patrol officers responded to a radio call of a suspect firing a gun in the air. Officers arrived at the location and saw the suspect holding a firearm in his hand. Officers gave him orders to drop the gun, however the suspect pointed the firearm at the officers, resulting in an OIS. F006-15: JANUARY 20, 2015 While conducting crime suppression, uniformed officers observed a suspect whom they believed was attempting to conceal a weapon under his clothing. When the suspect saw the officers approaching, he began to walk away at a rapid pace. As the officers exited their vehicle, they directed the suspect to stop and show his hands. The suspect reached under his clothing, produced a shotgun, and fired a round, resulting in an OIS USE OF FORCE YEAR-END REVIEW LOS ANGELES POLICE DEPARTMENT 355


179 {OIS SYNOPSES & SUSPECT WEAPONS 2015} F007-15: JANUARY 21, 2015 Uniformed officers initiated a vehicle pursuit of a vehicle containing four armed suspects. During the pursuit, the suspect s vehicle struck several parked vehicles and came to rest in the middle of the street. The driver and the front passenger of the vehicle exited and ran, followed by the officers. As the officers chased after the driver, the suspect pointed a handgun at one of the officers, resulting in an OIS. F016-15: FEBRUARY 23, 2015 Plainclothes investigators were conducting surveillance for a named suspect in an attempted murder investigation. While parked west of the location, plainclothes detectives observed the suspect and a female exit the concerned residence and enter separate vehicles in the driveway. The female slowly drove toward the detective s location while systematically looking inside each of the parked vehicles on the street. As she slowly drove by the detective, she noticed his presence and conducted a three-point turn, slowly driving by him a second time. The female then returned to the residence where she appeared to have a conversation with the suspect. The suspect immediately drove to the detective s parked vehicle and confronted him with a semi-automatic handgun. The suspect then began shooting at the detective, resulting in an OIS. There is no photograph available as the suspect used physical force against a victim. F008-15: JANUARY 25, 2015 Off-duty detectives responded to the screams of a woman yelling for help at the end of the cul-de-sac outside the city. Following their 911 phone call to the Los Angeles County Sheriff s Department, the detectives approached the area of the screaming woman and observed a male straddling a woman on the ground. The suspect appeared to be strangling the woman with his hands. Both detectives approached, identified themselves as police officers, and ordered the suspect to stop his actions and raise his hands. The suspect did not comply and continued to strangle the woman, resulting in an OIS. F017-15: FEBRUARY 26, 2015 While conducting a narcotics investigation, plainclothes officers observed several suspects on the porch of a residence. As the officers drove past the residence, they heard a gunshot behind them. Both officers looked back toward the residence and observed additional muzzle flashes emanating from the corner of the property. Officers stopped their vehicle and an OIS ensued. F011-15: FEBRUARY 9, 2015 REPLICA/PELLET/BB While being pursued by uniformed patrol officers, the suspect (driver) drove erratically, struck several cars, and changed vehicles by carjacking a female victim at gunpoint. The pursuit eventually terminated and the suspect attempted a second carjacking; however, he was unsuccessful. The suspect then fled on foot carrying the firearm in his hand while being pursued by officers. Officers gave the suspect numerous verbal commands to drop his weapon and to get down on the ground; however, he refused. The suspect turned toward the officers with the gun in his hand, resulting in an OIS. There is no photograph available as the suspect attempted to disarm the officer. F018-15: MARCH 1, 2015 Uniformed officers responded to a radio call regarding a robbery in progress. Upon their arrival, the officers contacted the suspect and a violent altercation occurred. An officer deployed a TASER, which struck the suspect but had no effect. During the altercation, the suspect attempted to disarm an officer by pulling on his handgun from the holster, resulting in an OIS. F012-15: FEBRUARY 10, 2015 REPLICA/PELLET/BB While driving back to their police facility, Criminal Gang Homicide Division uniformed officers passed an alley and observed a suspect pointing a firearm at a third party. Officers stopped, approached the suspect on foot, and ordered him to drop the gun. The suspect did not comply, resulting in an OIS. F019-15: MARCH 3, 2015 Uniformed officers initiated a vehicle pursuit of a van that was involved in prior shooting incidents. The pursuit travelled into an alley, where two suspects exited the vehicle and fled on foot while the driver continued evading additional officers in the vehicle. As the passengers exited, officers pursued them on foot. During the foot pursuit, one of the suspects drew a pistol from his waistband and pointed it at the officers, resulting in an OIS USE OF FORCE YEAR-END REVIEW LOS ANGELES POLICE DEPARTMENT 357


180 {OIS SYNOPSES & SUSPECT WEAPONS 2015} There is no photograph available as the suspect did not have a weapon. F020-15: MARCH 5, 2015 Uniformed officers initiated a vehicle pursuit of a reckless driver. During the pursuit, the suspect s vehicle and the officer s vehicle collided. One officer was unable to exit the vehicle. As the suspect stood next to the door of the police vehicle, the officer was in fear of being ambushed, and an OIS ensued. F026-15: MARCH 26, 2015 Uniformed officers responded to a radio call of a male with a possible mental illness who was stabbing himself in the throat and had a belt wrapped around his neck. Upon their arrival, the suspect s mother directed officers to the suspect, who was lying on the kitchen floor bleeding profusely. The officers attempted to render aid, while awaiting the arrival of a Fire Department Rescue Ambulance, and verbalized with the suspect to stay calm. When the rescue ambulance arrived, one officer exited the residence to escort LAFD personnel. The suspect leapt to his feet, grabbed two kitchen knives off the counter, and advanced toward the officer. The officer redeployed out of the residence and alerted his partner and the paramedics. As the officers were attempting to gain distance from the residence, the suspect exited the front door, armed with a knife in each hand, and charged at the officers, resulting in an OIS. F022-15: MARCH 14, 2015 REPLICA/PELLET/BB Uniformed officers responded to a radio call of an assault with a deadly weapon suspect at a residence. Upon their arrival, the suspect s father, who had a shoulder injury, stated the suspect was throwing items out of the house and had attacked him with a knife. As officers approached the residence where the suspect lived, the suspect pointed a handgun out of the window at the officers, resulting in an OIS. There is no photograph available as the suspect fled the location and was not apprehended. F027-15: MARCH 29, 2015 While off-duty and driving with a friend, an officer was driving behind a vehicle, driven by an unidentified male suspect. The suspect suddenly conducted a U-turn, causing the officer to brake to avoid a collision. The officer continued driving and was stopped to turn into a side street when he observed the suspect s vehicle rapidly approaching the passenger side of his vehicle. As the suspect drove past the officer s vehicle, the suspect pointed a handgun at them and fired two gunshots. The suspect fled the location in his vehicle, and the officer followed. The officer located the suspect, drew his service weapon, identified himself as a police officer, and gave the suspect commands to surrender. The suspect failed to comply, suddenly backed up, and again pointed a handgun at the officer, resulting in an OIS. A firearm was recovered at the crime scene. However, TID did not provide a photograph of the weapon. F023-15: MARCH 15, 2015 As plainclothes officers were driving in an unmarked Department vehicle, their vehicle was struck by gunfire. The officers then observed two suspects shooting at them, resulting in an OIS. F029-15: APRIL 8, 2015 After hearing gunshots, uniformed officers observed a victim down in the middle of the street. The officers observed a suspect running away from the location and immediately requested additional resources, including an ambulance for the downed victim. A LAPD airship observed the suspect running from the scene and directed uniformed officers to the suspect s location. As the officers tactically approached on foot, the suspect began to shoot at them, resulting in an OIS. There is no photograph available as the suspect did not have a weapon. F025-15: MARCH 25, 2015 An off-duty officer was asleep in his residence and was awoken by noises and a flashlight illuminating the interior of the residence. The officer armed himself and exited the residence to further investigate. Upon exiting the front door, the officer observed an unfamiliar vehicle parked in his driveway. A male suspect suddenly appeared from a walkway to the rear yard that was adjacent to the driveway, and an OIS ensued. F031-15: APRIL 21, 2015 Uniformed officers responded to a radio call of a male stabbing himself. Upon their arrival, the officers attempted to make contact with the male. The suspect appeared at the apartment door armed with a hunting knife in his right hand and approached the officers. Officers verbalized with the suspect to drop the knife but he refused to comply and advanced toward officers, resulting in an OIS USE OF FORCE YEAR-END REVIEW LOS ANGELES POLICE DEPARTMENT 359


181 {OIS SYNOPSES & SUSPECT WEAPONS 2015} F032-15: APRIL 23, 2015 REPLICA/PELLET/BB Uniformed officers responded to numerous radio calls of a man armed with a gun. Upon arrival, officers located the suspect and observed him armed with a handgun, which he alternately pointed at passing motorists, the officers, and himself. The officers attempted to contain the suspect as he began walking, while repeatedly giving him commands to drop the weapon. The suspect refused to obey the officers commands and kept waving the gun and pointing it at himself as he continued walking. Suddenly, the suspect turned and pointed the handgun at the officers, resulting in an OIS. F044-15: MAY 26, 2015 Uniformed officers were flagged down by two victims who advised them that two suspects had threatened them with a gun. The victims directed the officers to the suspects, who were seen walking away from the location. The officers gave the suspects numerous commands to stop and both failed to comply. One suspect continued walking while the other crouched behind a car with his hands in his waistband. The crouched suspect then advanced on one of the officers, resulting in an OIS. F037-15: MAY 05, 2015 While driving in an unmarked police vehicle, uniformed officers observed a suspect running away from them while holding his waistband area. Believing the suspect was armed, the officers exited their vehicle and pursued the suspect on foot. The suspect jumped over a gate into a driveway and jumped over a fence into the rear yard of another property. Officers contained the area where the suspect was last seen and began establishing a perimeter. Moments later, the suspect emerged from a parked vehicle holding a black handgun. One of the officers issued commands to the suspect to drop the gun; however, the suspect failed to comply and raised the handgun at the officer, resulting in an OIS. There is no photograph available as the suspect fled the location and was not apprehended. F046-15: JUNE 10, 2015 Uniformed officers and supervisors responded to a radio call of a suicidal man armed with a knife. Two uniformed supervisors arrived and observed the suspect sitting on the sidewalk. The supervisors awaited the arrival of the second unit, requested a beanbag shotgun and a TASER, and coordinated the deployment of the second unit. Two uniformed officers arrived and attempted to verbalize with the suspect from a distance. The suspect charged at one of the supervisors with the knife, resulting in an OIS. There is no photograph available as the suspect did not have a weapon. F038-15: MAY 5, 2015 Uniformed officers received a radio call of a man harassing customers and refusing to leave a business. Upon their arrival, the officers encountered the suspect and engaged him in conversation. The suspect agreed to leave the area and began to walk away. Moments later, the suspect became engaged in a fight with a security officer. While attempting to assist the security officer, the officers became involved in a struggle with the suspect and an OIS ensued. F043-15: MAY 24, 2015 Uniformed officers walked out of an LAPD Service Center and observed a group of three males standing in the parking lot across the street involved in a verbal dispute. Officers then observed the males begin walking away from the location and noted a fourth individual walk to the rear of a nearby parked vehicle, retrieve a handgun and begin walking toward the group of males. When the suspect pointed the handgun at the group, an OIS ensued. F048-15: JUNE 19, 2015 REPLICA/PELLET/BB Uniformed officers responded to a domestic violence radio call. Comments of the radio call identified the suspect and advised he had battered his wife, was under the influence, and was possibly driving the victim s van. Upon their arrival, the officers observed the suspect in the van and attempted to initiate a traffic stop. The suspect failed to yield to the officers and a pursuit ensued. During the pursuit, the suspect called the California Highway Patrol via 911 and advised he had a gun in his lap and was suicidal. After fleeing through Los Angeles and neighboring cities, the suspect stopped his vehicle and exited with a handgun. An officer deployed a beanbag shotgun, firing numerous rounds at the suspect, which had no effect. The suspect pointed the handgun at officers resulting in an OIS. The suspect appeared unaffected by both the beanbag rounds and the gunfire and re-entered the vehicle and continued fleeing from the officers. When the pursuit terminated, the suspect exited the van, pointed the handgun at officers again, resulting in a second OIS USE OF FORCE YEAR-END REVIEW LOS ANGELES POLICE DEPARTMENT 361


182 {OIS SYNOPSES & SUSPECT WEAPONS 2015} There is no photograph available as the incident was a perception shooting. F049-15: JUNE 19, 2015 While on patrol in a marked black and white police vehicle, uniformed officers were stopped in traffic when they observed a suspect on a nearby sidewalk advancing toward them with his hands wrapped in a gray cloth in a shooting stance. Believing they were about to be fired upon, the officers exited their car, ordered the suspect to drop the gun, and an OIS ensued. F058-15: JULY 13, 2015 Uniformed officers responded to a radio call of a man armed with a knife. Upon their arrival, the officers observed the suspect was armed with a knife and began giving him commands to drop it. The suspect refused to comply, stood up and began to aggressively approach the officers. One officer utilized a TASER on the suspect, which had no effect. The suspect continued to advance on one of the officers while still armed with the knife, resulting in an OIS. There is no photograph available as the suspects fled the location and were later apprehended. F054-15: JUNE 29, 2015 Uniformed officers responded to a radio call regarding a drive-by shooting. During the officers response, they heard gunfire emanating north of their location. The officers subsequently observed three to four suspects midblock where additional shots were heard and muzzle flash from a firearm was seen. One of the suspects then turned and pointed a handgun at the officers, resulting in an OIS. F062-15: JULY 24, 2015 REPLICA/PELLET/BB Citizens observed a suspect firing what was perceived to be live rounds into the air, causing numerous shots fired and man with a gun radio calls to be generated. A uniformed sergeant and two uniformed officers responded and observed the suspect sitting on a brick wall with what officers believed was a handgun between his legs. The suspect ignored officers verbal commands to drop the gun, resulting in an OIS. F055-15: JULY 6, 2015 Uniformed officers responded to a radio call regarding an assault with a deadly weapon. The comments of the call indicated a woman was screaming and a man covered in blood was armed with a knife at the location. Upon their arrival with a secondary unit, officers were met in the middle of the street by a male covered in blood while armed with a large kitchen knife. The officers deployed out of their vehicle and directed the suspect to drop the knife. The suspect refused to comply and advanced toward the officers armed with the knife, resulting in an OIS. F065-15: AUGUST 6, 2015 Plainclothes officers were monitoring narcotic sales activity when they observed a suspect standing at the corner holding a handgun. The suspect ran from the location into a nearby alley while holding the handgun in plain view and the officers followed in their vehicle. The suspect attempted to scale a chain link fence, but his clothing became entangled and he became stuck on top of the fence. When the officers exited their vehicle, the suspect pointed his handgun at them, resulting in an OIS. F057-15: JULY 9, 2015 Uniformed officers responded to a radio call of a vandalism suspect breaking business windows. Upon their arrival, the officers observed a smashed window and the suspect attempting to smash an additional window with a skateboard. When officers attempted to detain the suspect, the suspect fled on his skateboard and officers followed him in their patrol vehicle. Eventually, the suspect fell off his skateboard and the officers attempted to detain the suspect. A physical altercation ensued and one of the officers utilized the TASER on the suspect. The suspect was able to gain control of the TASER and used it on one officer who became incapacitated, resulting in an OIS by the partner officer. F067-15: AUGUST 12, 2015 Uniformed officers responded to a radio call of a robbery suspect that had just left a business. The comments of the radio call also indicated that the suspect was armed with a large knife. The officers observed the suspect walking away from the location and exited their police vehicles in an attempt to detain her. A foot pursuit ensued and officers chased the suspect into an alley where she armed herself with a large knife. Officers gave the suspect commands to drop it; however, she refused to comply and continued to flee before she suddenly stopped and turned toward the officers with the knife in hand. One officer utilized his TASER on the suspect, which had no effect. She began to advance on one of the officers while still armed with the knife, resulting in an OIS USE OF FORCE YEAR-END REVIEW LOS ANGELES POLICE DEPARTMENT 363


183 {OIS SYNOPSES & SUSPECT WEAPONS 2015} F071-15: AUGUST 22, 2015 Uniformed patrol officers responded to a radio call regarding a violent male with a possible mental illness at a residence. Officers knocked on the apartment door and the subject of the radio call answered the door while in possession of knives. The suspect threw one of the knives at the officers and then fled on foot. Two additional units responded and observed the suspect running from the location. The officers exited their vehicles and observed the suspect running towards them in an aggressive manner while still in possession of a large knife, resulting in an OIS. F081-15: SEPTEMBER 15, 2015 Uniformed officers responded to a radio call regarding a man armed with a gun. Upon their arrival, officers observed the suspect and attempted to detain him. As the suspect continued walking away, officers observed that he was armed with a handgun in his right hand. As the officers tactically deployed, the suspect pointed the handgun at one of the officers, resulting in an OIS. F072-15: AUGUST 22, 2015 While working crime suppression duties, uniformed officers observed a male walking in the street, obstructing vehicle traffic. The officers stopped their police vehicle in order to conduct a pedestrian stop for the observed violation. As the driver officer exited the vehicle, he observed the handle of a handgun protruding from the suspect s jacket pocket and immediately voiced his observation to his partner. The suspect ran onto the adjacent sidewalk and the officers followed. The suspect turned in the direction of the officers with the handgun in his right hand, resulting in an OIS. F082-15: SEPTEMBER 16, 2015 Numerous officers responded to a shots fired radio call. In addition to the call, two additional 911 calls were received, one of which was made by the shooting suspect. The responding personnel began to deploy on the residence when the suspect walked out the side door of the residence armed with a rifle. The suspect pointed the rifle at officers, resulting in an OIS. F075-15: AUGUST 27, 2015 Uniformed officers responded to a radio call of a neighbor dispute. Upon arrival, the officers determined that one of the parties involved in the dispute was using utilities from the other s address without permission. The officers responded to investigate and encountered the suspect. A physical altercation ensued, during which the suspect picked up a metal tool and struck both officers on the head and shoulder area, resulting in an OIS. F083-15: SEPTEMBER 27, 2015 Uniformed officers received a radio call of a woman armed with a knife. Upon their arrival, the officers were confronted by the suspect. The suspect failed to obey the officers commands and continued to approach the officers with the knife, resulting in an OIS. F080-15: SEPTEMBER 10, 2015 While conducting a follow-up investigation, detectives observed a wanted shooting suspect driving in the vehicle used in the commission of the crime. The detectives followed him and broadcast their observations and location. The suspect suddenly negotiated a U-turn and drove towards the detectives. The detectives drove into a driveway, exited their vehicle, and were confronted by the suspect, resulting in an OIS. F084-15: OCTOBER 3, 2015 Uniformed officers were stopped at a red tri-light signal waiting to negotiate a turn. The officers heard and saw their rear window explode. Believing they were being fired upon, the officers attention was drawn to a suspect who was standing to the rear of their vehicle. The officers exited their vehicle and an OIS ensued USE OF FORCE YEAR-END REVIEW LOS ANGELES POLICE DEPARTMENT 365


184 {OIS SYNOPSES & SUSPECT WEAPONS 2015} F087-15: OCTOBER 27, 2015 Uniformed officers attempted to detain the driver of a stolen vehicle, resulting in a physical altercation. The officers and suspect fell to the ground and fought over a knife that the suspect had armed himself with. During the physical altercation, the suspect attempted to remove an officer s gun from the holster, resulting in an OIS. There is no photograph available as the incident was a perception shooting. F101-15: DECEMBER 29, 2015 Uniformed officers assisted in the service of a search and arrest warrant for a murder suspect. The suspect barricaded himself inside the residence and refused to surrender. After some time, the suspect fled the location and began climbing onto the roof of a storage shed in the rear yard of the property. While doing so, the suspect turned towards officers positioned nearby with an object that was believed to be a handgun in his hand, resulting in an OIS. F090-15: NOVEMBER 9, 2015 Uniformed officers responded to a radio call of a male in the middle of the street causing vehicles to swerve around him. Upon the officers arrival, the suspect reached into his waistband area, simulated drawing a handgun and ran toward the officers. The officers utilized a beanbag shotgun and TASER on the suspect, which had no effect. A physical altercation ensued and an officer was knocked to the ground. The suspect obtained control of the beanbag shotgun and stood over the officer with the beanbag shotgun, resulting in an OIS. F095-15: DECEMBER 14, 2015 An off-duty officer was outside his private vehicle which was parked in front of his residence. The officer was confronted by a suspect armed with a handgun, resulting in an OIS. There is no photograph available as the suspect attempted to disarm the officer. F098-15: DECEMBER 19, 2015 Uniformed officers were monitoring a suspect receiving medical treatment after he was involved in a prior CUOF incident where he attempted to disarm an officer of his handgun. After medical treatment was provided and the suspect was cleared to be booked by the attending physician, the officers began handcuffing the suspect. In the process, the suspect attacked the officers with bodily force and a metal chair. Officers utilized TASERs to control him, which had no effect. The suspect attempted to disarm an officer of his handgun, resulting in an OIS USE OF FORCE YEAR-END REVIEW LOS ANGELES POLICE DEPARTMENT 367


185 {OIS SYNOPSES & SUSPECT WEAPONS 2016} F002-16: JANUARY 4, 2016 Undercover detectives were conducting surveillance for a wanted suspect. The detectives located the suspect, who attempted to flee from them in a vehicle. The suspect was involved in a traffic collision and fled on foot. As detectives confronted the suspect, he armed himself with a handgun, and an OIS ensued. F009-16: FEBRUARY 6, 2016 STOLEN Having received information regarding a previously stolen vehicle, uniformed officers observed the vehicle driving on City streets and attempted to conduct a traffic stop. The driver pulled in to a driveway and produced a sawed-off shotgun, resulting in an OIS. F005-16: JANUARY 16, 2016 REPLICA/PELLET/BB Uniformed officers responded to a radio call regarding a robbery suspect. Officers were directed to the suspect s location by an LAPD air unit. As officers stopped their patrol vehicle, they were confronted by the suspect, who had armed himself with a handgun. The suspect ran towards their patrol vehicle with the weapon pointed at the officers, resulting in an OIS. F010-16: FEBRUARY 14, 2016 Uniformed officers responded to a radio call regarding an assault with a deadly weapon suspect who had stabbed one individual inside a residence. As the officers approached the location, they observed the suspect standing on the roof of a motor home-type vehicle. The suspect, who was armed with a knife, then began to cut himself on the neck. The officers attempted to verbalize with the suspect to descend from the roof so they could render medical aid for his injuries, however he refused. The suspect managed to enter the motor home and sat in the driver s seat. Believing the suspect would attempt to drive away, the officers gained entry into the motor home and deployed the TASER on the suspect, which appeared to have no effect. The suspect advanced towards one of the officers, resulting in an OIS. F007-16: JANUARY 17, 2016 Uniformed officers responded to a radio call regarding a man armed with a knife. As the officers arrived at the scene, they observed the suspect, who was armed with a large hunting knife, begin to walk toward them. The officers gave the suspect verbal commands to drop the knife, however the suspect refused and continued his advance. One officer deployed a TASER on the suspect, which had no effect. As the suspect continued advancing towards the officers with the knife in hand, an OIS ensued. There is no photograph available as the suspect fled the location and was not apprehended. F013-16: FEBRUARY 20, 2016 While off -duty and driving in his personal vehicle, an officer observed a driveby shooting occur, which resulted in a homicide. The officer called 911 and reported his observations while following the suspect s vehicle. While doing so, the driver of the suspect s vehicle came to an abrupt stop and began firing numerous rounds at the officer, resulting in an OIS. F008-16: JANUARY 30, 2016 While conducting crime suppression, uniformed officers attempted to stop two pedestrians. As the officers exited their patrol vehicle, one of the individuals, later identified as the suspect, fled on foot. While pursuing the suspect, one officer observed the suspect remove a handgun from his waistband and begin to turn towards the officer, resulting in an OIS. There is no photograph available as the incident was a perception shooting. F016-16: MARCH 15, 2016 While off-duty and inside his residence asleep, an officer heard multiple footsteps originating from the interior of his home. The officer armed himself with a handgun and exited his bedroom to investigate. As the officer entered the living room, he was confronted by two suspects. Both suspects immediately fled the residence through a window in the kitchen. As the suspects continued their escape, one turned and reached inside his waistband, resulting in an OIS USE OF FORCE YEAR-END REVIEW LOS ANGELES POLICE DEPARTMENT 369


186 {OIS SYNOPSES & SUSPECT WEAPONS 2016} There is no photograph available as the suspect s weapon was an automobile. F020-16: APRIL 3, 2016 Uniformed officers responded to a radio call of a screaming woman. Upon their arrival, the officers heard screaming originating from a dark colored SUV parked on the street. Upon further investigation, the officers observed a male suspect in the back seat of the SUV assaulting a woman. As the suspect continued strangling and punching the female, an officer smashed one of the vehicle s windows to render aid to the victim. The suspect entered the driver s seat and drove the vehicle at an officer, resulting in an OIS. F026-16: APRIL 29, 2016 STOLEN While on-duty and stopped at a red tri-light, two plainclothes detectives observed two individuals engaged in an altercation with a victim. The detectives observed one of the individuals arm himself with a handgun and begin to shoot at the victim, resulting in an OIS. F021-16: APRIL 6, 2016 Uniformed officers responded to a radio call of a male with a possible mental illness. Upon arrival, officers observed the suspect involved in a verbal dispute with family members. The officers intervened, to diffuse the situation. The suspect became irate and directed his aggression towards the officers. The officers deployed a TASER on the suspect, which had no effect. The suspect then barricaded himself in a bedroom, armed himself with two knives. Metropolitan Division, SWAT, and the Department s Crisis Negotiation Team, responded. After delivering gas inside the residence, the suspect fled through a bedroom window and charged at a SWAT officer with scissors. Officers deployed a TASER and a beanbag shotgun on the suspect, both of which had no effect. The suspect continued advancing toward one SWAT officer, ultimately cutting his arm with the scissors. An OIS subsequently ensued. F027-16: APRIL 30, 2016 Uniformed officers responded to a radio call regarding a domestic violence at an apartment. Comments of the radio call indicated the suspect had locked himself inside a bedroom and was assaulting his girlfriend. Upon their arrival, the officers entered the apartment and located a female who was unconscious and unresponsive. As one officer began providing medical attention to the female, the partner officer covered the hallway and remaining rooms. The covering officer encountered the suspect, who was armed with two knives. The officer ordered the suspect to drop the knives, however, he refused, and an OIS ensued. F022-16: APRIL 10, 2016 Uniformed officers responded to a radio call regarding a burglary in progress at an apartment. Comments of the radio call indicated the suspect had shattered a window and entered the location. Upon their arrival, officers were notified that the suspect was inside one of the apartment units holding an older male hostage with a knife to his neck. The officers entered the location and observed the suspect holding a knife against the neck of an elderly male. The officers repeatedly ordered the suspect to drop the knife, however he failed to comply, and an OIS ensued. F028-16: MAY 4, 2016 An off-duty detective was followed on foot by a male, later identified as the suspect, who subsequently produced a handgun and attempted to rob the detective of his property, which resulted in an OIS. There is no photograph available as the suspect fled the location and was later apprehended. F024-16: APRIL 20, 2016 Uniformed officers observed a male, later identified as the suspect, commit a traffic violation while riding a bicycle during the hours of darkness. As the officers attempted to stop the suspect for the violation, he fled on his bicycle. After some time, the suspect dismounted the bicycle and fled on foot. As the officers gave chase, the lead officer observed the suspect remove a handgun from his waistband and turn towards him, resulting in an OIS. F029-16: MAY 13, 2016 PRIOR CRIMES Uniformed officers observed a group of males congregated by a parked vehicle. While attempting to detain the individuals, one fled from the group and the officers gave chase on foot. During the foot pursuit, the suspect produced a handgun and fired at the officers, striking one, and an OIS ensued USE OF FORCE YEAR-END REVIEW LOS ANGELES POLICE DEPARTMENT 371


187 {OIS SYNOPSES & SUSPECT WEAPONS 2016} F035-16: JUNE 10, 2016 STOLEN Uniformed officers initiated a traffic stop on a vehicle that had a strong odor of marijuana emanating from inside the cab. As the officers ordered the occupants to exit the vehicle, one suddenly ran from the officers in between two nearby parked vehicles. One officer observed the suspect reach for a handgun located in the suspect s waistband, and an OIS ensued. F043-16: JULY 24, 2016 While conducting patrol, uniformed officers approached a group of individuals on foot and observed one of the individuals armed with a handgun. A foot pursuit and exchange of gunfire with the suspect ultimately ensued, resulting in one officer being struck by gunfire. F037-16: JUNE 26, 2016 While conducting a traffic stop on a vehicle, uniformed officers observed the driver exit the vehicle armed with a handgun. As the suspect ran from the officers, he turned and pointed the handgun at one officer, resulting in an OIS. There is no photograph available as the suspect fled the location and was not apprehended. F044-16: JULY 26, 2016 While awaiting the arrival of local law enforcement to respond to his residence in regards to a burglary investigation, an off-duty detective observed the suspects from the incident return. One suspect pointed a handgun at the detective and began shooting at him, resulting in an OIS. It was later discovered that the handgun was a paintball gun. Both the suspect and the weapon remain outstanding. There is no photograph available as the incident was a perception shooting. F038-16: JUNE 26, 2016 While working a crime suppression detail, uniformed officers observed a group of male subjects standing on the sidewalk drinking alcoholic beverages. As the officers attempted to detain the individuals in the group, one began walking away from the officers while holding his waistband. One officer followed the suspect and ordered him to stop. The suspect abruptly stopped and turned towards the officer while making a furtive movement, resulting in an OIS. F045-16: JULY 28, 2016 Following a vehicle pursuit, one of the occupants of the suspect vehicle exited and ran from officers. As the officers attempted to take the suspect into custody, the suspect armed himself with a handgun, and an OIS ensued. F041-16: JULY 7, 2016 REPLICA/PELLET/BB While at a restaurant, an off-duty officer was the victim of a robbery. The suspect displayed a handgun at the officer and demanded his property, resulting in an OIS. F049-16: AUGUST 2, 2016 Uniformed officers responded to a business dispute at a store. While at the location of the radio call, the suspect became irate and placed one of the officers in a choke hold. The suspect then attempted to disarm officers of their service pistol, resulting in an OIS. There is no photograph available as the suspect attempted to disarm the officer USE OF FORCE YEAR-END REVIEW LOS ANGELES POLICE DEPARTMENT 373


188 {OIS SYNOPSES & SUSPECT WEAPONS 2016} F052-16: AUGUST 9, 2016 Uniformed officers conducted a traffic stop on a vehicle for a minor traffic violation. As officers were speaking with the driver, he abruptly exited the vehicle armed with a handgun, and an OIS ensued. F059-16: SEPTEMBER 16, 2016 While conducting an undercover narcotics investigation, an LAPD officer was approached by a male, later identified as the suspect, who attempted robbing him of his property. The suspect punched the officer in the face, backed away, lifted his shirt, reached for his waistband, and an OIS ensued. There is no photograph available as the incident was a perception shooting. F053-16: AUGUST 9, 2016 Uniformed officers responded to a radio call regarding a vandalism in progress. Upon their arrival, the officers exited their vehicle and approached a group of individuals. One individual, later identified as the suspect, ran from the group and immediately grabbed his front waistband. The officers pursued the suspect on foot and requested additional resources to respond. While approaching the corner of an intersection, the suspect fired at the officers with a handgun, resulting in an OIS. There is no photograph available as the suspect s weapon was an automobile. F062-16: SEPTEMBER 28, 2016 Uniformed officers escorted an arrestee to a local hospital for a medical examination. During the examination, the suspect escaped custody and fled from the officers. The suspect attempted to carjack an individual near the hospital, resulting in an OIS. F055-16: AUGUST 16, 2016 STOLEN While conducting patrol, an LAPD motor officer observed a vehicle commit a vehicle code violation and intended to initiate a traffic stop. Before doing so, the driver, later identified as the suspect, pulled the vehicle to the side of the road, exited, and began walking away. The officer ordered the suspect to stop, however he refused to obey commands. The suspect removed a handgun from his person and began running from the officer. The suspect turned towards the officer with the gun in hand, and an OIS ensued. F063-16: OCTOBER 1, 2016 STOLEN While assigned to a crime suppression detail, uniformed officers observed a vehicle commit a vehicle code violation. As the officers attempted to initiate a traffic stop on the vehicle, the driver failed to yield and a vehicle pursuit ensued. During the pursuit, one occupant, later identified as the suspect, fled on foot and was pursued by uniformed officers. While chasing the suspect, the officers observed the suspect armed with a handgun. The suspect turned towards the officers with the gun in hand, and an OIS ensued. F057-16: AUGUST 19, 2016 While on patrol, uniformed officers observed a male suspect holding a rifle with an affixed bayonet walking on the sidewalk. Officers gave the suspect numerous commands to drop the rifle, however he refused, and an OIS ensued. F064-16: OCTOBER 2, 2016 REPLICA/PELLET/BB Uniformed officers responded to a radio call regarding a male armed with a handgun. Officers located an individual who matched the description of the suspect based on the comments of the radio call and attempted to initiate a pedestrian stop. Upon doing so, the suspect turned and pointed a handgun at the officers, resulting in an OIS USE OF FORCE YEAR-END REVIEW LOS ANGELES POLICE DEPARTMENT 375


189 {OIS SYNOPSES & SUSPECT WEAPONS 2016} F067-16: OCTOBER 23, 2016 While on patrol, uniformed officers observed a large group of individuals involved in an altercation. As the officers exited their vehicle to investigate, they observed a male individual, later identified as the suspect, armed with a handgun, and an OIS ensued. The suspect ran from the officers approximately one block, where a second OIS occurred. F084-16: DECEMBER 17, 2016 While on routine patrol, uniformed officers recognized a wanted murder suspect. As the officers approached the suspect to detain him, he fled on foot. While being pursued by the officers, the suspect turned and pointed a handgun at them, resulting in an OIS. F072-16: NOVEMBER 7, 2016 STOLEN Officers initiated a pedestrian stop on a suspicious individual near a business. Upon doing so, the suspect pointed a handgun at the officers, resulting in an OIS. F085-16: DECEMBER 18, 2016 Uniformed officers observed an individual, later identified as the suspect, armed with a handgun in his waistband. When officers attempted to detain him, the suspect fled on foot. While being pursued by the officers, the suspect turned and pointed the handgun at them, resulting in an OIS. F078-16: NOVEMBER 28, 2016 Uniformed officers attempted to detain an individual, later identified as the suspect, regarding a burglary investigation. The suspect fled from the officers on foot into the backyard of a nearby residence. During the officers attempt to apprehend the suspect, he produced a handgun, and an OIS ensued. F086-16: DECEMBER 20, 2016 A uniformed officer responded to an assault with a deadly weapon/shots fired radio call at a residence. While conducting the subsequent investigation at the location of the radio call, the officer observed one suspect from the incident riding his bike. As the officer approached the suspect to take him into custody, the suspect retrieved a handgun, resulting in an OIS. There is no photograph available as the suspect fled the location and was later apprehended. F081-16: DECEMBER 11, 2016 PRIOR CRIMES Uniformed officers attempted to detain numerous individuals gathered at a residence. As officers approached the location, various individuals within the group ran from the residence and discarded multiple firearms. One of the individuals, later identified as the suspect, fired at the officers, resulting in an OIS USE OF FORCE YEAR-END REVIEW LOS ANGELES POLICE DEPARTMENT 377


190 {OIS SYNOPSES & SUSPECT WEAPONS 2017} F002-17: January 9, 2017 Uniformed officers conducted surveillance on several known locations for a wanted attempted murder suspect. Officers observed the suspect, who entered a vehicle and drove away. Officers initiated a traffic stop with the assistance of additional patrol units. During the stop, the suspect exited the vehicle, was uncooperative and failed to comply with officers commands. Officers deployed the beanbag shotgun on the suspect, which had no effect. The suspect re-entered the vehicle and a vehicle pursuit ensued. During the pursuit, the suspect stopped the vehicle and fired at officers with a handgun, resulting in an OIS. The suspect continued driving, stopped his vehicle a second time, and fired at officers, resulting in a second OIS. Officers utilized the pursuit intervention technique, which disabled the suspect s vehicle. The suspect did not comply with officers commands and a K9 Contact occurred. There was no photograph available, as the suspect s weapon was physical force. F010-17: January 30, 2017 While off-duty, a LAPD officer confronted two suspects inside his residence. A physical altercation between the officer and the suspects occurred, which resulted in an OIS. F003-17: January 10, 2017 While on patrol, uniformed officers observed a Department of Transportation officer being chased by an individual armed with a knife. The suspect ran toward the officers vehicle with the knife in hand and attempted to open the drivers door. After requesting help and repositioning their vehicle, the officers exited the police vehicle and utilized their doors as cover. The suspect again advanced toward the officers with the knife in hand and told the officers he was going to kill them, resulting in an OIS. There was no photograph available at the publication of this report. F011-17: January 31, 2017 Uniformed officers responded to a radio call of a man armed with a knife near a major entertainment center. Officers were directed to the suspect s location and incidentally observed a victim with an apparent stab wound. The officers then observed the suspect standing outside a nearby business holding a knife. As the officers approached the suspect, he immediately turned and entered the business. Once inside, the suspect began stabbing a second individual, which resulted in the deployment of a TASER and an OIS. F004-17: January 15, 2017 Uniformed officers responded to a radio call of a male suffering from a mental illness at a residence. Comments of the call indicated the suspect was armed with a knife and vandalizing the residence. The officers arrived at the scene and were directed to the suspect s whereabouts. The officers formulated a plan, entered the residence and located the suspect in one of the bedrooms. The officers attempted to communicate with the suspect as they requested his cooperation and compliance, but were unsuccessful. The suspect opened the bedroom door armed with a knife, and moved toward one of the officers, resulting in the deployment of a beanbag shotgun and an OIS. F012-17: February 8, 2017 While on patrol, uniformed officers observed a vehicle that matched the description of one involved in a prior shooting incident. Officers attempted to stop the vehicle and a vehicle pursuit ensued. The driver of the vehicle, later identified as the suspect, entered a multi-story parking structure in the downtown area. As officers attempted to contain the location, the suspect accelerated the vehicle toward an officer who was on foot, resulting in an OIS. A firearm was recovered during the investigation of the OIS incident. F005-17: January 17, 2017 A Federal Bureau of Investigation task force, consisting of various entities and plainclothes LAPD personnel, were directed to a commercial nursery outside City limits where a wanted homicide suspect was located. As the task force members approached the suspect to take him into custody, he armed himself with a sharpened bladed spade and refused to comply with repeated commands to drop the bladed spade and surrender. A task force member deployed a TASER twice, which struck the suspect but was ineffective. The suspect then lunged at an LAPD officer with the bladed spade, and an OIS occurred. F015-17: March 4, 2017 Uniformed officers responded to a radio call regarding an assault with a deadly weapon suspect. Officers arrived at the scene and made contact with the suspect, who was armed with a large metal pipe. The officers gave numerous commands to the suspect to drop the pipe, however he refused. The officers then deployed a TASER, which had negative results, and an OIS ensued USE OF FORCE YEAR-END REVIEW LOS ANGELES POLICE DEPARTMENT 379


191 {OIS SYNOPSES & SUSPECT WEAPONS 2017} F016-17: March 6, 2017 Uniformed officers responded to a radio call regarding woman armed with a firearm at a residence. Officers arrived at the location, established a perimeter, and utilized various means to attempt to contact her. The suspect refused to exit the residence and Metropolitan Division SWAT was requested. While awaiting the arrival of SWAT personnel, uniformed officers observed the suspect exit the residence armed with a rifle. The suspect pointed the rifle at the officers, resulting in an OIS. F025-17: April 7, 2017 Uniformed officers responded to a location where several assault with a deadly weapon radio calls were generated. Comments of the calls indicated the suspect was armed with a knife. When the officers arrived at the scene, they observed the suspect involved in a verbal dispute with another individual. The suspect then began stabbing the individual, and an OIS ensued. F018-17: March 7, 2017 While on patrol, uniformed officers observed a stolen vehicle being driven by a suspect involved in a previous carjacking and domestic violence incident. Officers attempted to initiate a traffic stop, however the suspect refused to yield, and a vehicle pursuit ensued. Officers utilized the pursuit intervention technique, which rendered the suspect s vehicle inoperable. As officers approached the vehicle, they observed the victim from the previous domestic violence incident attempt to flee the vehicle. The suspect then began to stab the victim, and an OIS ensued. F027-17: April 22, 2017 Uniformed officers responded to a radio call regarding an assault with a deadly weapon incident at a residence. When the officers arrived, they encountered the suspect, who informed them he was armed with a knife and a gun. After refusing multiple commands to submit to being detained, the suspect drew a handgun from his waistband and pointed it at officers, resulting in an OIS. F019-17: March 8, 2017 Uniformed officers were flagged down by an individual who informed them that he was the victim of a firearm brandishing incident. The victim then directed the officers to the nearby group of suspects. As the officers approached the group, one of the individuals, later identified as the suspect, ran from the officers into a nearby alley. The suspect drew a handgun from his waistband, and an OIS ensued. F029-17: May 8, 2017 Uniformed officers responded to a radio call regarding a burglary in progress at a residence. Comments of the call indicated the suspect entered the location while the lone resident was sleeping in one of the bedrooms. The resident observed the suspect in the kitchen area and believed he was armed with a firearm. Officers arrived at the scene, verified the suspect was in fact still inside the residence, and requested Metropolitan Division SWAT. A tactical plan was formulated and SWAT personnel began to deploy around the residence. After various less-lethal munitions were deployed, the suspect emerged and fired at SWAT personnel with a handgun, resulting in an OIS. F021-17: March 25, 2017 PRIOR CRIMES While on patrol, uniformed officers heard numerous gunshots emanating from a nearby area. Moments later, the officers observed an individual, later identified as the suspect, walking from the area of the shooting. The officers attempted to detain the suspect, who immediately ran from them, resulting in the initiation of a foot pursuit. As officers continued pursing the suspect, they observed him remove a pistol from his waistband, and an OIS occurred. F032-17: May 13, 2017 Uniformed officers attempted to detain a suspicious individual who appeared to be armed with a firearm in a City park. The suspect removed a pistol from his front pocket and began to turn toward the officers with the weapon in hand, resulting in an OIS USE OF FORCE YEAR-END REVIEW LOS ANGELES POLICE DEPARTMENT 381


192 {OIS SYNOPSES & SUSPECT WEAPONS 2017} F034-17: May 16, 2017 Uniformed officers attempted to detain an individual, later identified as the suspect, for drinking alcohol in public. As the officers approached the suspect, he immediately ran from them and drew a handgun from his waistband. The suspect turned and pointed the handgun at the officers, resulting in an OIS. F043-17: June 8, 2017 Uniformed officers initiated a consensual encounter with a known gang member. The officers observed a bulge underneath the suspect s shorts and believed he was armed with a handgun. The suspect failed to comply with verbal commands and a physical altercation ensued. During the altercation, the suspect armed himself with a handgun and began to flee on foot. While doing so, he turned toward the officers with the handgun in hand and an OIS occurred. F036-17: May 25, 2017 Uniformed and plainclothes officers executed a search warrant at a residence. Once inside the residence, the suspect advanced on one of the officers with a machete, and an OIS ensued. F046-17: June 15, 2017 Uniformed officers conducted a parole/probation compliance check at a residence. As occupants of the residence were exiting the location, an individual who remained inside, later identified as the suspect, fired at officers, and an OIS ensued. The suspect fled the residence through a rear window and again fired at officers who were in the rear of the property, resulting in a second OIS. The suspect fled the location and a perimeter was established. Metropolitan K9 units responded and assisted in a search of the area. During the search, the suspect shot a Department K9. Metropolitan Division SWAT responded and located the suspect in a nearby shed, where the suspect again fired at them, resulting in a third OIS. There is no photograph available as the suspect fled the location and was not apprehended. F038-17: May 29, 2017 PRIOR CRIMES While at a social function, an off-duty officer observed a group of suspects armed with handguns in the middle of an intersection walking toward the area of the event. Individuals within the group began firing at a separate group, resulting in an OIS. F047-17: June 19, 2017 Uniformed officers responded to a radio call regarding a domestic violence incident at a residence. Upon their arrival, the officers verified that an assault had in fact occurred. The officers later located the suspect in front of a nearby residence armed with a knife. The suspect failed to follow commands to drop the knife and approached the officers, resulting in the deployment of a TASER and an OIS. F042-17: June 6, 2017 Uniformed officers responded to a radio call regarding a male armed with a firearm. Upon their arrival, officers observed an individual matching the description of the suspect and attempted to detain him. As the officers exited their police vehicle, the suspect turned toward them with what officers believed to be a handgun, and an OIS ensued. F048-17: June 22, 2017 Uniformed officers responded to a radio call regarding a battery investigation at a residence. The officers arrived at the scene and met with the victim, who directed them to the suspect s whereabouts. As the officers attempted to contact the suspect, he produced a handgun, and an OIS ensued. The suspect retreated into the residence, affording officers the opportunity to request additional resources. As a separate patrol unit arrived at the scene, they observed the suspect pointing a gun at them from a balcony, and additional OIS occurred USE OF FORCE YEAR-END REVIEW LOS ANGELES POLICE DEPARTMENT 383


193 {OIS SYNOPSES & SUSPECT WEAPONS 2017} F049-17: June 28, 2017 Uniformed officers contacted a known gang member, who abruptly removed a handgun from his backpack and pointed it at his head. Additional units responded to the scene as officers continued verbalizing with the suspect. Officers deployed a beanbag shotgun at the suspect, which was ineffective. The suspect then pointed the handgun at the officers, and an OIS ensued. F057-17: July 22, 2017 Uniformed officers attempted to conduct a pedestrian stop on an individual, who then ran from them, resulting in a foot pursuit. During the foot pursuit, the suspect pointed a handgun at one of the officers, and an OIS occurred. F050-17: June 29, 2017 Metropolitan Division SWAT was involved in a vehicle pursuit with an individual, later identified as the suspect. The pursuit terminated when the suspect exited his vehicle outside City limits and attempted to flee on foot. While running toward an apartment complex, the suspect fired at officers, resulting in two separate OIS incidents. F058-17: July 27, 2017 Uniformed officers responded to a radio call of a man armed with a gun at a motel. Upon the officers arrival, they were directed to the suspect s location in a second-story room. The officers verbalized with the suspect for approximately 10 minutes to exit the room, however he refused. The suspect then suddenly opened the door, pointed a handgun at the officers, and an OIS ensued. F053-17: July 14, 2017 Uniformed officers responded to a radio call regarding a male armed with a knife at a residence. Comments of the call indicated the suspect was threatening to stab additional residents. Officers arrived at the scene and attempted to make contact with the suspect. The suspect opened the front door armed with a knife, and an OIS ensued. F059-17: August 4, 2017 Uniformed officers responded to a radio call regarding a request to keep the peace at a residence. Upon the officers arrival, they were met by the person reporting, who advised them that the male resident, later identified as the suspect, was inside the location destroying property. The officers entered the residence and observed the suspect sitting in a chair across the room with his back to the door while armed with an assault rifle. The suspect ignored verbal commands to drop the rifle, stood, and pointed the rifle at one officer, resulting in an OIS. F054-17: July 15, 2017 Uniformed officers responded to a radio call regarding a domestic violence incident at a residence. The officers encountered the suspect at the location, and a brief vehicle pursuit and foot pursuit ensued. At the termination of the foot pursuit, the suspect fired at officers, and an OIS occurred. F060-17: August 9, 2017 Uniformed officers responded to a radio call regarding a domestic violence incident at a residence. Comments of the call indicated the suspect, who was armed with a shotgun and two handguns, had shot at the victim. Officers arrived at the scene and determined the suspect was barricaded, thus requesting the assistance of Metropolitan Division SWAT. A perimeter was established. The suspect shot at SWAT personnel manning the perimeter, and an OIS occurred USE OF FORCE YEAR-END REVIEW LOS ANGELES POLICE DEPARTMENT 385


194 {OIS SYNOPSES & SUSPECT WEAPONS 2017} F061-17: August 22, 2017 A Federal Bureau of Investigation task force, consisting of plainclothes LAPD personnel, conducted surveillance at a residence for a wanted murder/kidnap suspect. Officers located the suspect along with the kidnapped victim and attempted to effect an arrest. In doing so, the suspect removed a handgun from his waist and pointed it at the officers, resulting in an OIS. There was no photograph available, as the suspect fled location and was not apprehended. F077-17: December 4, 2017 PRIOR CRIMES While inside a business, a uniformed officer heard gunfire emanating from outside the location. When the officer exited the business to investigate, he observed a suspect firing at a victim, and an OIS ensued. F064-17: September 8, 2017 Uniformed officers responded to a radio call of a violent male with a mental illness/assault with a deadly weapon investigation at a residence. Upon their arrival, officers heard screaming from within the location. As the officers walked toward the residence, the suspect emerged and pointed a rifle at them, resulting in the discharge of a beanbag shotgun and an OIS. F079-17: December 19, 2017 STOLEN While on patrol, uniformed officers heard gunfire emanating from a nearby parking lot. The officers responded to the area and observed a suspect armed with an assault rifle and a revolver. The suspect pointed the revolver at the officers, and an OIS occurred. F071-17: October 29, 2017 Uniformed officers responded to a radio call of a male with mental illness at a residence. After determining entry into the residence was not warranted, officers remained outside while another resident, later identified as the victim, entered the location. After doing so, the suspect began to chase the victim inside the residence while armed with a knife. The officers then entered the location and observed the victim being held by the suspect from behind with a knife to her throat. The suspect, after refusing commands to drop the knife and threatening to kill the victim and the officers, began to approach the officers with the knife in hand, resulting in an OIS. F080-17: December 20, 2017 While off-duty, an LAPD officer was confronted by a suspect armed with a metal flashlight. The suspect struck the officer on the head with the flashlight, which resulted in an OIS. F076-17: November 30, 2017 Plainclothes detectives attempted to conduct a vehicle stop on a wanted robbery suspect, which resulted in the initiation of a vehicle pursuit. Metropolitan Division SWAT responded and joined the pursuit. At the termination of the pursuit, the plainclothes detectives were involved in an OIS. F081-17: December 23, 2017 A uniformed officer responded to a radio call regarding a domestic violence incident at a residence. After arriving at the scene, the officer encountered the suspect armed with a machete and requested additional resources. An additional unit responded and located the suspect. The suspect, who was armed with a machete and hammer, ran towards the officers with the weapons in hand, and an OIS ensued USE OF FORCE YEAR-END REVIEW LOS ANGELES POLICE DEPARTMENT 387


195 {OIS SYNOPSES & SUSPECT WEAPONS 2017} F082-17: December 30, 2017 Uniformed officers responded to a radio call regarding a domestic dispute at a residence. Comments of the call indicated the victim had fled the residence after the incident and the suspect remained at the scene while attempting to arm himself with a firearm. Additionally, the victim s mother was inside the residence with the suspect. When the officers arrived at the scene, they heard gunfire emanating from within the location. The officers then observed the suspect exit the front door while armed with a handgun. The suspect fired the gun at the officers, and an OIS ensued. F083-17: December 31, 2017 PRIOR CRIMES Uniformed officers responded to a radio call at a business regarding a man armed with a firearm, who brandished it at a victim. When the officers arrived at the scene, they observed the suspect in a nearby parking lot armed with a handgun. The officers ordered the suspect to drop the gun, however the suspect refused and began to point the weapon at the officers, resulting in an OIS USE OF FORCE YEAR-END REVIEW LOS ANGELES POLICE DEPARTMENT 389
.")
.")
196 {DEFINITIONS} Definitions ADJUDICATION: Tactics, drawing/exhibiting a firearm, and UOF shall be evaluated during the adjudication process. The adjudication process for CUOF incidents differs from NCUOF with respect to the chain of investigation, review, and analysis (2017 LAPD Manual 3/792 and 3/793). ADMINISTRATIVE DISAPPROVAL/OUT OF POLICY DRAWING AND EXHIBITING AND/OR UOF: A finding, supported by a preponderance of the evidence that the actions of the employee relative to drawing/exhibiting a firearm or UOF were not within the Department s policies (2017 LAPD Manual 3/792.05). ADMINISTRATIVE DISAPPROVAL NEGLIGENT DISCHARGE: A finding, where it was determined that the unintentional discharge of a firearm resulted from operator error, such as the violation of a firearm safety rule (2017 LAPD Manual 3/792.05). ADMINISTRATIVE DISAPPROVAL TACTICS: A finding, supported by a preponderance of the evidence that the tactics employed during a CUOF incident unjustifiably and substantially deviated from approved Department tactical training (2017 LAPD Manual 3/792.05). ANIMAL SHOOTING: An incident in which a Department employee intentionally discharges a firearm at an animal. CANINE (K9) CONTACT: An incident in which a member of the public has contact with a Department K9 and hospitalization is required. If hospitalization is not required, the incident does not rise to the level of a UOF (2017 LAPD Manual 3/792.05). CAROTID RESTRAINT CONTROL HOLD: An upper body control hold by a Department employee, including the modified carotid, full carotid, and locked carotid hold (2017 LAPD Manual 3/792.05). CATEGORICAL UOF INCIDENT A CUOF is defined as: The use of deadly force (e.g., discharge of a firearm) by a Department employee; All uses of an upper body control hold by a Department employee, including the use of a modified carotid, full carotid or locked carotid hold; All deaths while the arrestee or detainee is in the custodial care of the Department (also known as an In-Custody Death or ICD); A UOF incident resulting in death; A UOF incident resulting in an injury requiring hospitalization (commonly referred to as a LERII); All intentional head strikes with an impact weapon or device (e.g., baton, flashlight, etc.) and all unintentional (inadvertent or accidental) head strikes that results in serious bodily injury, hospitalization or death; Officer involved animal shootings; Non-tactical unintentional discharges; and, An incident in which a member of the public has contact with a Department canine and hospitalization is required (2017 LAPD Manual 3/792.05). CRIME Part I Crime: The FBI s UCR program classifies the following offenses as Part I crimes: criminal homicide, rape, robbery, aggravated assault, burglary, larcenytheft (except motor vehicle theft), motor vehicle theft, and arson. Part II Crime: The FBI s UCR program classifies all violations of state or local laws not specifically identified as Part I offenses (except traffic violations) as Part II crimes. Violent Crime: The FBI defines violent crime in its UCR program as those offenses which involve force or threat of force. As such, violent crime is comprised of four offenses (criminal homicide, rape, robbery, and aggravated assault. FIELD DETENTION: Refer to Public Contact. FORCE OPTIONS: All Department-approved physical force techniques (e.g. firm grip, strike, takedown) or devices (e.g. OC spray, baton, TASER) available to an officer. Force Options fall into the following three categories: Deadly Force; Less-Lethal force (e.g. TASER, bean bag), and Non- Lethal force (e.g. firm grip, takedown). GENERAL TRAINING UPDATE: Standardized training provided by the employee s command or Training Division personnel to personnel involved in a CUOF incident. The Training Update is not an inquiry into the specific details of the CUOF. The intent of the update is to provide involved personnel with standardized training material in tactical issues and actions readily identified in the CUOF incident as well as an update on the UOF policy. Training should be provided as soon as practicable, and before the involved officer(s) return to field duties, but within 90 days following the incident (2017 LAPD Manual 3/796.35) USE OF FORCE YEAR-END REVIEW LOS ANGELES POLICE DEPARTMENT 391
197 {DEFINITIONS} HEAD STRIKES: An intentional head strike with an impact weapon or device (e.g., baton, flashlight) and all unintentional (inadvertent or accidental) head strikes that results in serious bodily injury, hospitalization, or death (2017 LAPD Manual 3/792.05). HOMELESSNESS: Per the Department s Special Order No. 13, Policy Regarding Police Contacts with Persons Experiencing Homelessness, dated June 22, 2016, the terms homelessness, homeless individual, and homeless person shall refer to the following: An individual or family who lacks a fixed, regular, and adequate nighttime residence; An individual or family with a primary nighttime residence that is a public or private place not designed for, or ordinarily used as, a regular sleeping accommodation for human beings (including a car, park, abandoned building, bus or train station, airport, or camping ground); An individual or family living in a supervised publicly or privately operated shelter designated to provide temporary living arrangements (including hotels and motels paid for by federal, state, or local government programs for low-income individuals or by charitable organizations, congregate shelters, and transitional housing); or, An individual who resided in a shelter or place not meant for human habitation and who is exiting an institution where he or she temporarily resided. IN-CUSTODY DEATH: The death of an arrestee or detainee who is in the custodial care of the Department (2017 LAPD Manual 3/792.05). LAW ENFORCEMENT RELATED INJURY INVESTIGATION: A UOF incident resulting in an injury requiring hospitalization, commonly referred to as a LERII (2017 LAPD Manual 3/792.05). MANNER OF DEATH: The Los Angeles County Department of Medical Examiner Coroner defines the different manners of death based on the following criteria: Natural: Due entirely (or nearly so) to natural disease processes; Homicide: Due to a volitional act of another person; Suicide: Due to injury that occurred with the intent to induce self-harm or cause one s own death; Accident: Due to injury when there is no evidence of intent to harm (for purposes of this Report, accidental deaths are further categorized into causes of death attributed to narcotic/alcohol overdose); and, Undetermined: Inadequate information regarding the circumstances of death to determine manner. Example: An individual is found unconscious with massive subdural hemorrhage. In the absence of information on the events leading up to death, it is impossible to determine if the hemorrhage was due to accidental fall, homicidal violence, etc. NON-CATEGORICAL UOF: An incident in which any on-duty Department employee, or off-duty employee whose occupation as a Department employee is a factor, uses a less-lethal control device or physical force to compel a person to comply with the employee s direction; overcome resistance of a person during an arrest or a detention; or, defend any individual from an aggressive action by another person (2017 LAPD Manual 4/245.05). OBJECTIVELY REASONABLE: The legal standard used to determine the lawfulness of a UOF is the Fourth Amendment to the United States Constitution. See Graham v. Connor, 490 U.S. 386 (1989). Graham states in part, The reasonableness of a particular UOF must be judged from the perspective of a reasonable officer on the scene, rather than with the 20/20 vision of hindsight (2017 LAPD Manual 1/556.10). OFFICER INVOLVED SHOOTING: An incident in which a Department employee intentionally discharges a firearm (excluding Warning Shot, Animal Shooting, and/or Tactical Intentional Discharge incidents). Officer Involved Shooting incidents are categorized into Hit or No Hit occurrences. PART I CRIME: Refer to Crime. PART II CRIME: Refer to Crime. PUBLIC CONTACT: For this report, public contacts are comprised of calls for service and field detentions. Calls for Service: Any radio call generated by communications in response to a call from the public. Field Detentions: A temporary detention where a person is not free to leave and is initiated by officer s own observations. Such detentions are categorized as: Pedestrian Stop: Those incidents where officers use the lights, or lights and siren, or make a command, or even a request, for a person to stop or converse. The officers should have reasonable suspicion to believe the suspect to be stopped is involved in criminal activity. Vehicle Stop: Those incidents where officers use the emergency lights, or emergency lights and siren to stop a suspected traffic violator or the officers have reasonable suspicion to believe the suspect(s) to be stopped is involved in criminal activity and is either driving and or a passenger in a motor vehicle. SERIOUS BODILY INJURY: Serious bodily injury, as defined in California Penal Code Section 243(f)(4), includes, but is not limited to, the following: loss of consciousness, concussion, bone fracture, protracted loss or impairment of function of any bodily member organ, a wound requiring extensive suturing, and serious disfigurement (2017 LAPD Manual 1/556.10). SOURCE OF ACTIVITY Radio Call: Call for service directed by Communications Division; Observation: Contact initiated by officers based on reasonable suspicion, probable cause, or as a consensual encounter; Citizen Flag Down: Private person alert officers to a subject, an activity, or a location not otherwise observed by officers or reported to Communications Division; Pre-Planned: Any type of activity that requires an operational plan (e.g. search/arrest warrant services, task forces); Station Call: Non-coded or low priority incidents where officers are directed to a location by Department personnel, other than Communications Division; Ambush: An act or an instance to attack by surprise or lure officers resulting in an officer involved shooting; and, Off-Duty: Incident where officers are off-duty and not conducting official Department business. SUBSTANTIALLY INVOLVED PERSONNEL: Employee(s) applying force or who had a significant tactical or decision making role in the incident (2017 LAPD Manual 3/792.05). SUICIDE BY COP: Those incidents where the suspect appeared to intentionally provoke officers into believing that he posed a deadly threat that resulted in an OIS. TACTICAL DEBRIEF: The collective review of an incident to identify those areas where actions and decisions were effective and those areas where actions and decisions could have been improved. The intent of a Tactical Debrief is to enhance future performance. The Tactical Debrief is conducted by the Training Division personnel (2017 LAPD Manual 3/792.05). UNINTENTIONAL DISCHARGE: The unintentional discharge of a firearm by a Department employee regardless of cause. Unintentional discharges are evaluated and categorized as Tactical Discharges or Non-Tactical Discharges (2017 LAPD Manual 3/792.05). USE OF FORCE: In a complex urban society, officers are confronted daily with situations where control must be exercised to effect arrests and to protect the public safety. Control may be exercised through advice, warnings, persuasion, or by use of physical force. Officers are permitted to use force that is objectively reasonable to defend themselves or others, to effect an arrest or detention, and/or to prevent escape or overcome resistance, consistent with the Department s Policy on the UOF (2017 LAPD Manual 1/240.10). USE OF FORCE -TACTICS DIRECTIVE: A written directive that contains procedure and/or insight into UOF and tactics issues. Use of Force policy will continue to be expressed in the Department Manual but may be reiterated in UOF-Tactics Directives. Use of Force-Tactics Directives supersedes any Training Bulletins that have been published regarding the subject matter of the directives (2017 LAPD Manual 1/240.12). USE OF FORCE REVIEW BOARD: The UOF Review Board shall convene at the direction of the Chair of the Board and shall: Avail itself of any facilities of the Department necessary to conduct a complete examination of the circumstances involved in the incident under investigation, report its findings and recommendations to the Chief of Police and upon adjournment, forward the UOF Internal Process Report, and other related reports to the Chief of Police (2017 LAPD Manual 2/092.50). USE OF LETHAL FORCE (OTHER): An incident involving the use of deadly force by Department personnel. This type of force will encompass those forces that are not included in other CUOF classifications. VIOLENT CRIME: Refer to Crime. WARNING SHOTS: The intentional discharge of a firearm off target not intended to hit a person, to warn others that deadly force is imminent (LAPD Manual 1/556.01) USE OF FORCE YEAR-END REVIEW LOS ANGELES POLICE DEPARTMENT 393
198 {ACRONYMS} Acronyms BOPC Board of Police Commissioners FTO Field Training Officer MOT Museum of Tolerance RACR Real-Time Analysis and Critical Response Division BSS Behavioral Science Services FTQ Failure to Qualify NAMI National Alliance for the Mentally Ill RBC Recruit Basic Course BWV Body-Worn Video GTU General Training Update NCUOF Non-Categorical Use of Force REPORT Use of Force Year-End Review CAPOS Crimes Against Police Officers Section CCU Complaint Classifications Unit CITY City of Los Angeles CO Commanding Officer COP Chief of Police CPD Chicago Police Department CPT Continuing Professional Training CRCH Carotid Restraint Control Hold CRD Community Relationship Division CUOF Categorical Use of Force DEPARTMENT (or LAPD) Los Angeles Police Department DICVS Digital In-Car Video System DMH Department of Mental Health FBI Federal Bureau of Investigation FID Force Investigation Division FIP Fair and Impartial Policing FOS Force Option Simulator FOTU Field Officer Training Unit FSD Forensic Science Division HOPE Homeless Outreach and Proactive Engagement (teams) HPD Houston Police Department IAG Internal Affairs Group ICD In-Custody Death ICDC Integrating Communication, De-escalation, and Crowd Control IPR Internal Process Report ITB Information Technology Bureau K9 Canine (contact) LACDA Los Angeles County District Attorney LAHSA Los Angeles Homeless Service Authority LAPD (see Department) LASD Los Angeles Sheriff s Department LERII Law Enforcement-Related Injury Investigation LETAC Law Enforcement Tactical Application Course LMS Learning Management System MC Major Capsaicinoid Content MEU Mental Evaluation Unit MHIT Mental Health Intervention Training NYPD New York Police Department OAS Office of Administrative Services OC Oleoresin Capsicum (spray) OCPP Office of Constitutional Policing and Policy OIC Officer-in-Charge OIG Office of the Inspector General OIS Officer Involved Shooting OO Office of Operations OSO Office of Special Operations PATROL Planning, Assessment, Time, Redeployment (and/ or Containment), Other Resources, and Lines of Communication PCG Public Communications Group POST California Commission on Peace Officer Standards and Training PPD Philadelphia Police Department PSB Professional Standards Bureau PSL Police Sciences Leadership PSS Public Safety Statement PSTB Police Sciences and Training Bureau PTE Police Training and Education RESET Resource Enhancement and Services Enforcement Team RFC Release from Custody (arrest report) RMEC Risk Management Executive Committee SIP Substantially Involved Personnel SMART System-wide Mental Assessment Response Team SQUAB Shooting Qualification and Bonus SWAT Special Weapons and Tactics TASER Thomas A. Swift Electric Rifle TD Training Division TEAMS Training Evaluation and Management System TID Technical Investigation Division TTRC Tactics and Training Review Committee UCR Uniform Crime Reporting UD Unintentional Discharge UOF Use of Force UOFRB Use of Force Review Board UOFRD Use of Force Review Division VKS Variable Kinetic System, Pepperball USE OF FORCE YEAR-END REVIEW LOS ANGELES POLICE DEPARTMENT 395

199 Methodology CATEGORICAL USE OF FORCE INCIDENTS The Department s method of classifying CUOF incidents is based on the type of force used during the incident. The FID investigation may reveal that multiple force options were used during an incident, which could potentially be classified as different CUOF categories. For tracking purposes, and to avoid duplicate recordation of an incident, the Department classifies an incident based on the highest level of force used by Department personnel. However, all CUOFs are fully investigated and adjudicated, including additional force options not captured under the primary classification. Use of Force Review Division queried the CUOF data for the 2017 Use of Force Year-End Review from internal databases. In addition, FID was instrumental in providing any outstanding information from their records. However, FID was unable to provide some information due to the ongoing nature of various CUOF investigations. ANNUAL DEPARTMENT TOTALS The query period included all CUOF incidents from January 1, 2013 through December 31, BUREAU AND AREA/DIVISION OF OCCURRENCE The Bureau and Area/Division of occurrence is the location where the CUOF incident occurred, regardless of where the incident originated or where the involved personnel were assigned. The exception is ICD incidents, where CSD is the Area/Division of occurrence, not the geographic Area where the jail facility is located. INVOLVED DEPARTMENT PERSONNEL For purposes of this Report, only Department personnel who received an adjudication finding, or has a pending finding, in the concerned force type for each respective CUOF incident are counted as involved employees. Department personnel are often at scene as part of the tactical situation, but do not apply force. The officers who did not utilize the relevant force were not counted as involved in this Report. All employee statistics were based on their current status as of the date of the UOF incident. Department Personnel by CUOF Incident Type: OIS Incidents: All employees who received, or were pending, lethal force BOPC adjudicated findings for their involvement in the OIS incident were included in this Report. OIS-Hit Incidents: All employees who received, or were pending, lethal force BOPC adjudicated findings for their involvement in the OIS incident were included in this Report. OIS-No Hit Incidents: All employees who received, or were pending, lethal force BOPC adjudicated findings for their involvement in the OIS incident were included in this Report. Animal Shooting Incidents: All employees who received, or were pending, lethal force BOPC adjudicated findings for their involvement in the Animal Shooting incident were included in this Report. UD Incidents: All employees who received, or were pending, unintentional discharge BOPC adjudicated findings for their involvement in the UD incident were included in this Report. Warning Shot: All employees who received, or were pending, lethal force BOPC adjudicated findings for their involvement in the Warning Shot incident were included in this Report. ICD Incidents: The County of Los Angeles Department of Medical Examiner Coroner, determines the cause and manner of death of a suspect. A UOF may be ruled as a primary or contributing factor to their cause of death. All employees who received, or were pending, non-lethal, less-lethal, and/or lethal force BOPC adjudicated findings for their involvement in the ICD incident were included in this Report. CRCH Incidents: All employees who received, or were pending, lethal force BOPC adjudicated findings for their involvement in the CRCH incident were included in this Report. LERII Incidents: All employees who received, or were pending, non-lethal, less-lethal, and/or lethal force BOPC adjudicated findings for their involvement in the LERII incident were included in this Report. Head Strike Incidents: All employees who received, or were pending, lethal force BOPC adjudicated findings for their involvement in the Head Strike incident were included in this Report. K9 Contact Incidents: All employees who received, or were pending, K9 Contact deployment criteria BOPC adjudicated findings for their involvement in the K9 Contact incident were included in this Report USE OF FORCE YEAR-END REVIEW LOS ANGELES POLICE DEPARTMENT 397
200 {METHODOLOGY} Officer Injuries Officer injuries were recorded based on the number of those who sustained injuries during CUOF incidents, regardless if caused by the suspect s actions or other factors. INVOLVED SUSPECTS Suspects included in this Report are those subject to categorical force used by Department personnel. The exception is ICD incidents, which also include individuals whose death occurred while in the custodial care of a Department employee, or the Department, regardless if force was used. SUSPECT INJURIES Suspect injuries include self-inflicted injuries, pre-existing medical conditions aggravated during the incident, accidental injuries, and those caused by Department personnel. The manner of death of decedents are determined by the Los Angeles County Department of Medical Examiner - Coroner. DECEASED SUSPECT TOXICOLOGY RESULTS Toxicology results for deceased suspects were obtained by FID from the County of Los Angeles Department of Medical Examiner Coroner. It is uncommon for suspects to release their medical records to the Department. Therefore, toxicology results could only be obtained for deceased suspects involved in OIS-Hit and ICD incidents. Suspect Perceived Mental Illness A suspect was identified as having a perceived mental illness based on the following: 1. Officer(s) and/or investigator(s) perception of the suspect; 2. Suspect having self-reported mental illness; 3. Third-party statement; and/or, 4. Prior MEU contact resulting in a 5150 WIC hold or referral. Suspect Gang Membership Pursuant to California Assembly Bill 90, the Fair and Accurate Gang Database Act of 2017, Department resources housing gang membership information were temporarily disabled effective January 1, As such, the Department was unable to determine whether suspects involved in UOF incidents were designated as gang members. Suspect Homelessness Per the Department s Special Order No. 13, Policy Regarding Police Contacts with Persons Experiencing Homelessness, dated June 22, 2016, the terms homelessness, homeless individual, and homeless person shall refer to the following: An individual or family who lacks a fixed, regular, and adequate nighttime residence; An individual or family with a primary nighttime residence that is a public or private place not designed for, or ordinarily used as, a regular sleeping accommodation for human beings (including a car, park, abandoned building, bus or train station, airport, or camping ground); An individual or family living in a supervised publicly or privately operated shelter designated to provide temporary living arrangements (including hotels and motels paid for by federal, state, or local government programs for low-income individuals or by charitable organizations, congregate shelters, and transitional housing); or, An individual who resided in a shelter or place not meant for human habitation and who is exiting an institution where he or she temporarily resided. Homeless data for suspects involved in CUOF incidents was not tracked by the Department prior to However, at the request of the BOPC, FID implemented means to capture homeless status as part of all CUOF investigations, starting in Suspect Perceived Suicide by Cop Those incidents where the suspect appeared to intentionally provoke officers into believing that he posed a deadly threat that resulted in an OIS. NON-CATEGORICAL USE OF FORCE INCIDENTS With assistance from Application Development and Support Division, UOFRD queried the NCUOF data for the 2017 Use of Force Year-End Review from TEAMS II. ANNUAL DEPARTMENT TOTALS The query period included all NCUOF incidents from January 1, 2013 through December 31, BUREAU AND AREA/DIVISION OF OCCURRENCE Incident by Bureau and Area detailed where the NCUOF incident occurred, rather than where the involved officers were assigned. FORCE OPTION USED Each force option was counted once per incident, regardless of the number of times the force option was applied by one or more Department personnel. However, the force options were not mutually exclusive, as multiple force options could have been utilized in an incident. In such cases, all force options used were counted once per incident. TASER TASER Activations TASER activations were measured by the total number of times a TASER device was activated on a suspect during a NCUOF incident. All TASER activations were included in the total count when multiple activations occurred in an incident. Therefore, the total number of TASER activations exceeds the number of incidents in which a TASER was used. TASER Effectiveness Effectiveness captured whether a TASER activation caused the suspect to submit to arrest. Multiple TASER activations may have been required for the force option to prove effective. INVOLVED DEPARTMENT PERSONNEL For purposes of this Report, only Department personnel who received an adjudication finding, or has a pending finding, in the concerned force type for each respective NCUOF incident are counted as involved employees. Department personnel are often at scene as part of the tactical situation, but do not apply force. The officers who did not utilize the relevant force were not counted as involved in this Report. All employee statistics were based on their current status as of the date of the UOF incident. Officer Injuries Officer injuries included all injuries sustained by a Department employee during the NCUOF incident. INVOLVED SUSPECTS Suspects included in this Report are those subject to Non- Categorical force used by Department personnel. Suspect Perceived Mental Illness A suspect s perceived mental illness for NCUOF incidents was determined based on officers observations and was not verified by MEU. Suspect Perceived Impairment Officers observations were used to determine if a suspect was under the influence of alcohol and/or narcotics for NCUOF incidents. Suspects impairment status was not verified through field sobriety tests. Suspect Perceived Homelessness Perceived homelessness for NCUOF incidents was determined based on officers observations and statements made by suspects. Suspect - Injuries Suspect injuries included injuries sustained by a suspect during a NCUOF incident that were caused by Department personnel. OTHER ATTACKS ON POLICE OFFICERS Attacks on Police Officers include all battery and assault with a deadly weapon incidents against Department personnel USE OF FORCE YEAR-END REVIEW LOS ANGELES POLICE DEPARTMENT 399
201 {INDEX} Index #s 37-Millimeter Projectile Launcher Millimeter Impact Launcher 71, Hour Briefing A Animal Shooting 55, 136, Arrests 54 B Ballistic Shield Baton 18, 82 Beanbag Shotgun 18, 81 Behavioral Science Services 118, 132 Below , 70 Biased Policing 12-13, 66, Board of Police Commissioners 10-13, , 123 Board of Rights Body-Worn Video 12, 86, C Canine Contact 55, 136, Carotid Restraint Control Hold 55, 136, Citations 54 Core Values Crime Part I 53 Part II 53 Violent 52-53, 62-63, 100 D De-escalation, Tactical 12, 16-17, 66, 68, 70-71, 108 Department of Mental Health 13, 68 Digital In-Car Video System 12, 86-89, F Fair and Impartial Policing 70 Family Liaison Section 9 Field Detentions 54, Force Investigation Division , 123, 129 FN-303 Less-Lethal Launcher Force Option Simulator 64-65, G General Training Update 71-72, H Head Strike 55, 136, Homeless Outreach and Proactive Engagement 13, 68 Homelessness 13, 68, 104 I Implicit Bias (see Biased Policing) In-Custody Death Incidents 30-34, 55, 120, 136, Integrating Communication, De-escalation, and Crowd Control 66, 71 Internal Process Report 120, 122 L Law Enforcement-Related Injury Investigation 55, 136, Law Enforcement Tactical Application Course 71 Los Angeles Homeless Service Authority 13 M Mapping Resources , 138, 167, 196 Mental Evaluation Unit 13, 68, 70 Mental Health 13, 66, 68, 70, 105 Mental Health Intervention Training 13, 68, 70 Museum of Tolerance 71 N National Alliance for the Mentally Ill 13, 68 Non-Categorical Use of Force Incidents 18-19, 35-41, 60, , , O Officer Involved Shooting Incidents 14-15, 21-29, 55-60, 64-65, , 120, , Office of Administrative Services 46, 117, 120 Office of Constitutional Policing and Policy 48, 94-97, 120 Office of Operations 13, 45 Office of Special Operations 47 Office of the Inspector General 12-13, 116, , 123 Oleoresin Capsicum Spray 18, P PATROL (acronym) 16-17, 71 Pepperball VKS Launcher 76, 79 Personnel Complaint 74, , Personnel Figures, for Department 61 Police Sciences Leadership 68, 70 Population, City 52 Professional Standards Bureau 49, 116, 130 Public Contacts 54, Public Safety Statement 116 Q Qualification (Firearm) R Resource Enhancement and Services Enforcement Team 13, 68 Reverence for Human Life 12, 66, 70-71, 77, 108 S System-wide Mental Assessment Response Team 13 T Tactical Debrief 71-72, 122 TASER 78, 319 Training Academy Firearm In-Service U Unintentional Discharge 55, 136, Use of Force Department Policy Legal Standards Review Board 117, , Review Division 117, , 123, , 129 V Video Footage (release of) 12-13, 86 W Warning Shot 55, 109, 136, USE OF FORCE YEAR-END REVIEW LOS ANGELES POLICE DEPARTMENT 401

202 Key Contributors Michel Moore, First Assistant Chief Director, Office of Operations Arif Alikhan, Police Administrator III Director, Office of Constitutional Policing and Policy Sean Malinowski, Deputy Chief Chief of Staff, Office of the Chief of Police Jon Peters, Deputy Chief Commanding Officer, Police Sciences and Training Bureau Robert Lopez, Commander Commanding Officer, Force Investigation Division John Neuman, Police Administrator I Commanding Officer, COMPSTAT Division Robert Bean, Sergeant II Eva Chiaravalle, Secretary Matthew Hoffman, Sergeant I Ian Jackson, Police Officer II Rafael Rodriguez, Police Officer II Jeffrey Quinlan, Police Officer III Use of Force Review Division Edith Zelaya, Senior Clerk Typist Office of Administrative Services Victor Acevedo, Detective I, Southeast Area Roseann Adams, Police Officer III+I, Recruitment and Employment Division Lyndon Barber, Police Officer III, Newton Area Darius Bone, Police Officer II, Southwest Area Bruce Borihanh, Sergeant I, Southwest Area Garrett Brooks, Police Officer II, Newton Area Michael Chan, Police Officer II, Media Relations Division Magdalena Chun, Police Officer III, Southwest Area Brian Churchill, Sergeant II, Media Relations Division Nicole Evans, Sergeant I, Wilshire Area Michael Hall, Sergeant II, Training Division Christopher Hoffman, Police Officer III+I, Recruitment and Employment Division Chris Ignacio, Police Officer II, Hollywood Area Lai Lam, GIS Supervisor II, Application Development and Support Division Jonathan Lebel, Police Officer II, Van Nuys Area Stephanie Lopez, Police Officer II, Pacific Area Natasha Madjd, Police Officer II, Hollywood Area Cheryl Masters, Senior Management Analyst, Force Investigation Division Matthew Mitchell, Police Officer III, Training Division Jim Newton, Editor-in-Chief, UCLA Blueprint Huynh Nhut, Police Officer III, Metropolitan Division Salvador Ramirez, Police Officer II, Southwest Area Frank Rodriguez, Police Officer II, Hollywood Area Marcos Rubio, Police Officer III, Metropolitan Division David Sprague, Photographer, UCLA Blueprint Ryan Terukina, Police Officer III, Training Division Hassan Trotter, Police Officer II, Recruitment and Employment Division Hannah Tucker, Police Officer II, Southwest Area Melissa Zarris, Police Officer II, Rampart Area USE OF FORCE YEAR-END REVIEW
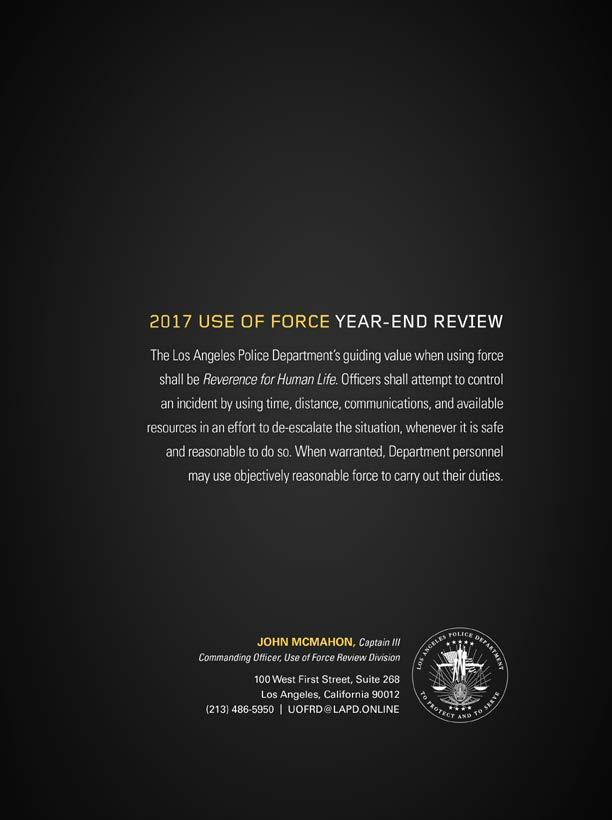
203
USE OF FORCE ANNUAL REPORT
 USE OF FORCE ANNUAL REPORT 2009 PURPOSE OF THIS REPORT This is the second annual report on the status of the Los Angeles Police Department s Categorical and Non-Categorical Use of Force incidents. The
January 29, Guiding Principles
 CRITICAL ISSUES IN POLICING SERIES Use of Force: Taking Policing to a Higher Standard January 29, 2016 30 Guiding Principles Note: A comprehensive approach will be required to implement the changes described
INTRADEPARTMENTAL CORRESPONDENCE. June 7, 2016 BPC #
 INTRADEPARTMENTAL CORRESPONDENCE June 7, 2016 BPC #16-0173 1.0 TO: The Honorable Board of Police Commissioners FROM: Inspector General, Police Commission SUBJECT: OFFICE OF THE INSPECTOR GENERAL INVESTIGATION
SAN DIEGO COUNTY SHERIFF S DEPARTMENT
 SAN DIEGO COUNTY SHERIFF S DEPARTMENT Use of Force Statistical Report 2015-2016 William D. Gore, Sheriff Mark Elvin, Undersheriff Introduction Law enforcement agencies across the nation are collecting
SAN DIEGO COUNTY SHERIFF S DEPARTMENT
 SAN DIEGO COUNTY SHERIFF S DEPARTMENT Use of Force Statistical Report 2016-2017 William D. Gore, Sheriff Michael Barnett, Undersheriff Introduction Law enforcement agencies across the nation are collecting
SAN DIEGO COUNTY SHERIFF S DEPARTMENT
 SAN DIEGO COUNTY SHERIFF S DEPARTMENT Use of Force Statistical Report 04-05 William D. Gore, Sheriff Mark Elvin, Undersheriff Introduction Law enforcement agencies across the nation are collecting use
SACRAMENTO POLICE DEPARTMENT GENERAL ORDERS
 580.03 DISCHARGE OF FIREARM 05-16-17 PURPOSE The purpose of this order is to establish procedures regarding the discharge of a firearm by Department employees. PREAMBLE The Sacramento Police Department
University of Texas System Police Use of Force Report
 217 University of Texas System Police Use of Force Report BY: UNIVERSITY OF TEXAS SYSTEM POLICE ACADEMY STAFF INSPECTOR GEOFFREY MERRITT OFFICE OF THE DIRECTOR OF POLICE 2 West 7th Street, Austin, Texas
THIS ORDER CONSISTS OF THE FOLLOWING NUMBERED SECTIONS: 2. DEPUTY/COURT SECURITY ACTION (During Use Of Force/No Firearms) page 26
 page 26") POLICY STATEMENT: The Baltimore City Sheriff s Office recognizes and respects the value and special integrity of each human life. In vesting its members with the authority to use force to achieve lawful
POLICY STATEMENT: The Baltimore City Sheriff s Office recognizes and respects the value and special integrity of each human life. In vesting its members with the authority to use force to achieve lawful
Principled Policing: The Mayor s 2016 Q3 & Q4 Police Accountability Report
 Principled Policing: The Mayor s Q3 & Q4 Police Accountability Report Dear Oaklanders, This is the Principled Policing Report for the second half of. The purpose of the report is to bring greater transparency
Exhibit 1 Racial Profiling Quarterly Report October 1, 2014 thru December 31, 2014
 Exhibit 1 Racial Profiling Quarterly Report October 1, 2014 thru December 31, 2014 Racial Profiling Report for Fourth Quarter 2014 Page 1 Racial Profiling Quarterly Report for the period ending December
ABRIDGED SUMMARY OF CATEGORICAL USE OF FORCE INCIDENT AND FINDINGS BY THE LOS ANGELES BOARD OF POLICE COMMISSIONERS OFFICER-INVOLVED SHOOTING
 ABRIDGED SUMMARY OF CATEGORICAL USE OF FORCE INCIDENT AND FINDINGS BY THE LOS ANGELES BOARD OF POLICE COMMISSIONERS OFFICER-INVOLVED SHOOTING 041-16 Division Date Duty-On () Off (X) Uniform-Yes () No (X)
ABRIDGED SUMMARY OF CATEGORICAL USE OF FORCE INCIDENT AND FINDINGS BY THE LOS ANGELES BOARD OF POLICE COMMISSIONERS
 ABRIDGED SUMMARY OF CATEGORICAL USE OF FORCE INCIDENT AND FINDINGS BY THE LOS ANGELES BOARD OF POLICE COMMISSIONERS K-9 CONTACT REQUIRING HOSPITALIZATION 050-16 Division Date Duty-On (X) Off ( ) Uniform-Yes
REPORT OF THE INDEPENDENT MONITOR LOS ANGELES POLICE DEPARTMENT FOR THE REPORT FOR THE QUARTER ENDING MARCH 31, 2008
 FOR THE LOS ANGELES POLICE DEPARTMENT REPORT FOR THE QUARTER ENDING MARCH 31, 2008 EXECUTIVE SUMMARY The City of Los Angeles and the Los Angeles Police Department (LAPD) entered into a Consent Decree with
San Francisco Police Department DGO 5.21 GENERAL ORDER 12/21/16 THE CRISIS INTERVENTION TEAM (CIT) RESPONSE TO PERSON IN CRISIS CALLS FOR SERVICE
 RESPONSE TO PERSON IN CRISIS CALLS FOR SERVICE") THE CRISIS INTERVENTION TEAM (CIT) RESPONSE TO PERSON IN CRISIS CALLS FOR SERVICE The San Francisco Police Department s highest priority is safeguarding the life, dignity and liberty of all persons. Officers
THE CRISIS INTERVENTION TEAM (CIT) RESPONSE TO PERSON IN CRISIS CALLS FOR SERVICE The San Francisco Police Department s highest priority is safeguarding the life, dignity and liberty of all persons. Officers
INTRADEPARTMENTAL CORRESPONDENCE. March 10, 2016 BPC # TEN-YEAR OVERVIEW OF CATEGORICAL USE OF FORCE INVESTIGATIONS, POLICY, AND TRAINING
 INTRADEPARTMENTAL CORRESPONDENCE March 10, 2016 BPC #16-0077 TO: The Honorable Board of Police Commissioners FROM: Inspector General, Police Commission SUBJECT: TEN-YEAR OVERVIEW OF CATEGORICAL USE OF
MIDDLETON POLICE DEPARTMENT 7341 Donna Drive Middleton, WI 53562
 MIDDLETON POLICE DEPARTMENT PROGRESS ON SPECIAL COMMUNITY/POLICE TASK FORCE USE OF FORCE RECOMMENDATIONS A. Institutionalize major incident debriefings: Critical Incident Debriefings are routinely offered
This is the first annual report on the status of the Los Angeles Police Department s Categorical and Non-Categorical Use of Force incidents for 2008.
 LOS ANGELES POLICE DEPARTMENT Office of Chief of Staff Use of Force Review Division 100 West First Street, Suite 257D Los Angeles, California 90012 (213) 486-5950 1 PURPOSE OF THE 2008 USE OF FORCE YEAR
ABRIDGED SUMMARY OF CATEGORICAL USE OF FORCE INCIDENT AND FINDINGS BY THE LOS ANGELES BOARD OF POLICE COMMISSIONERS
 ABRIDGED SUMMARY OF CATEGORICAL USE OF FORCE INCIDENT AND FINDINGS BY THE LOS ANGELES BOARD OF POLICE COMMISSIONERS LAW ENFORCEMENT RELATED INJURY 097-05 Division Date Duty-On (X) Off() Uniform-Yes(X)
2007 Force Response Report
 2007 Force Response Report January 1, 2007-December 31, 2007 San Jose Police Department INTRODUCTION In 2004, the San Jose Police Department (SJPD) voluntarily initiated a study and subsequent report of
FIRST AMENDED WASHOE COUNTY OFFICER INVOLVED SHOOTING PROTOCOL 2007
 FIRST AMENDED WASHOE COUNTY OFFICER INVOLVED SHOOTING PROTOCOL 2007 TABLE OF CONTENTS OIS NOTIFICATION CHECKLIST. page i I. DEFINITIONS....... page 1 II. PROCEDURE: OFFICER... page 3 III. PROCEDURE: ATTENDANT
ABRIDGED SUMMARY OF CATEGORICAL USE OF FORCE INCIDENT AND FINDINGS BY THE LOS ANGELES BOARD OF POLICE COMMISSIONERS OFFICER-INVOLVED SHOOTING
 ABRIDGED SUMMARY OF CATEGORICAL USE OF FORCE INCIDENT AND FINDINGS BY THE LOS ANGELES BOARD OF POLICE COMMISSIONERS OFFICER-INVOLVED SHOOTING 057-13 Division Date Duty-On (X) Off () Uniform-Yes (X) No
ALBUQUERQUE POLICE DEPARTMENT PROCEDURAL ORDERS. SOP 2-8 Effective:6/2/17 Review Due: 6/2/18 Replaces: 4/28/16
 2-8 USE OF ON-BODY RECORDING DEVICES Policy Index 2-8-1 Purpose 2-8-2 Policy 2-8-3 References 2-8-4 Definitions 2-8-5 Procedures A. Wearing the OBRD B. Using the OBRD C. Training Requirements D. Viewing,
ABRIDGED SUMMARY OF CATEGORICAL USE OF FORCE INCIDENT AND FINDINGS BY THE LOS ANGELES BOARD OF POLICE COMMISSIONERS
 ABRIDGED SUMMARY OF CATEGORICAL USE OF FORCE INCIDENT AND FINDINGS BY THE LOS ANGELES BOARD OF POLICE COMMISSIONERS K-9 CONTACT REQUIRING HOSPITALIZATION 036-15 Division Date Duty-On (X) Off () Uniform-Yes
ABRIDGED SUMMARY OF CATEGORICAL USE OF FORCE INCIDENT AND FINDINGS BY THE LOS ANGELES BOARD OF POLICE COMMISSIONERS OFFICER-INVOLVED SHOOTING
 ABRIDGED SUMMARY OF CATEGORICAL USE OF FORCE INCIDENT AND FINDINGS BY THE LOS ANGELES BOARD OF POLICE COMMISSIONERS OFFICER-INVOLVED SHOOTING 041-10 Division Date Duty-On (X) Off () Uniform-Yes (X) No
I. LIFE OF THIS AGREEMENT
 MEMORANDUM OF AGREEMENT BETWEEN THE LOS ANGELES COUNTY DEPARTMENT OF MENTAL HEALTH AND LOS ANGELES POLICE DEPARTMENT FOR PARTNERSHIP IN CONTINUING THE MENTAL EVALUATION UNIT This Memorandum of Agreement
INTEROFFICE MEMORANDUM
 INTEROFFICE MEMORANDUM DATE: June 7, 2010 PHONE: 760-243-8612 FROM: Shannon L. Faherty Deputy District Attorney Victorville Office TO: Dennis Christy Assistant District Attorney Gary Roth Chief Deputy
Utah County Law Enforcement Officer Involved Incident Protocol
 Utah County Law Enforcement Officer Involved Incident Protocol TABLE OF CONTENTS TOPIC... PAGE I. DEFINITIONS...4 A. OFFICER INVOLVED INCIDENT...4 B. EMPLOYEE...4 C. ACTOR...5 D. INJURED...5 E. PROTOCOL
ABRIDGED SUMMARY OF CATEGORICAL USE OF FORCE INCIDENT AND FINDINGS BY THE LOS ANGELES BOARD OF POLICE COMMISSIONERS
 ABRIDGED SUMMARY OF CATEGORICAL USE OF FORCE INCIDENT AND FINDINGS BY THE LOS ANGELES BOARD OF POLICE COMMISSIONERS LAW ENFORCEMENT RELATED INJURY -- 035-07 Division Date Duty-On(X) Off() Uniform-Yes(X)
ABRIDGED SUMMARY OF CATEGORICAL USE OF FORCE INCIDENT AND FINDINGS BY THE LOS ANGELES BOARD OF POLICE COMMISSIONERS
 ABRIDGED SUMMARY OF CATEGORICAL USE OF FORCE INCIDENT AND FINDINGS BY THE LOS ANGELES BOARD OF POLICE COMMISSIONERS K-9 CONTACT REQUIRING HOSPITALIZATION 049-09 Division Date Duty-On(X) Off() Uniform-Yes(X)
PERF Guiding Principles: Policy Red Text = MPD Assessment
 PERF Guiding Principles: Policy Red Text = MPD Assessment 1. The sanctity of human life should be at the heart of everything an agency does. In Progress Agency mission statements, policies, and training
ABRIDGED SUMMARY OF CATEGORICAL USE OF FORCE INCIDENT AND FINDINGS BY THE LOS ANGELES BOARD OF POLICE COMMISSIONERS OFFICER-INVOLVED SHOOTING
 ABRIDGED SUMMARY OF CATEGORICAL USE OF FORCE INCIDENT AND FINDINGS BY THE LOS ANGELES BOARD OF POLICE COMMISSIONERS OFFICER-INVOLVED SHOOTING 101-13 Division Date Duty-On (X) Off () Uniform-Yes (X) No
Applicable To: Division and section commanders, Homicide Unit sworn employees. Signature: Signed by GNT Date Signed: 2/18/2014
 Atlanta Police Department Policy Manual Standard Operating Procedure Effective Date February 1, 2014 Applicable To: Division and section commanders, sworn employees Approval Authority: George N. Turner
Background Memo. FROM: Erica Haft DATE: September 16, 2011
 Background Memo FROM: Erica Haft DATE: September 16, 2011 SUBJECT: RedEye Homicide Tracker, Police Beats & Illinois Violent Death Reporting System (IVDRS) I. How RedEye identifies cases RedEye s Tracking
ABRIDGED SUMMARY OF CATEGORICAL USE OF FORCE INCIDENT AND FINDINGS BY THE LOS ANGELES BOARD OF POLICE COMMISSIONERS
 ABRIDGED SUMMARY OF CATEGORICAL USE OF FORCE INCIDENT AND FINDINGS BY THE LOS ANGELES BOARD OF POLICE COMMISSIONERS OFFICER-INVOLVED SHOOTING AND K-9 CONTACT REQUIRING HOSPITALIZATION 039-12 Division Date
A Brief Overview of The Las Vegas Metropolitan Police Department
 A Brief Overview of The Las Vegas Metropolitan Police Department Director Chuck Callaway LVMPD Office of Intergovernmental Services History and Overview -LVMPD was formed in 1973 by an act of the state
ABRIDGED SUMMARY OF CATEGORICAL USE OF FORCE INCIDENT AND FINDINGS BY THE LOS ANGELES BOARD OF POLICE COMMISSIONERS OFFICER-INVOLVED SHOOTING
 ABRIDGED SUMMARY OF CATEGORICAL USE OF FORCE INCIDENT AND FINDINGS BY THE LOS ANGELES BOARD OF POLICE COMMISSIONERS OFFICER-INVOLVED SHOOTING 022-12 Division Date Duty-On (X) Off () Uniform-Yes (X) No
Model Policy. Active Shooter. Updated: April 2018 PURPOSE
 Model Policy Active Shooter Updated: April 2018 I. PURPOSE Hot Zone: A geographic area, consisting of the immediate incident location, with a direct and immediate threat to personal safety or health. All
INTRADEPARTMENTAL CORRESPONDENCE. December 6, 2016 BPC #
 INTRADEPARTMENTAL CORRESPONDENCE December 6, 2016 BPC #16-0392 TO: The Honorable Board of Police Commissioners FROM: Inspector General, Police Commission SUBJECT: OFFICE OF THE INSPECTOR GENERAL INVESTIGATION
ABRIDGED SUMMARY OF CATEGORICAL USE OF FORCE INCIDENT AND FINDINGS BY THE LOS ANGELES BOARD OF POLICE COMMISSIONERS
 ABRIDGED SUMMARY OF CATEGORICAL USE OF FORCE INCIDENT AND FINDINGS BY THE LOS ANGELES BOARD OF POLICE COMMISSIONERS K-9 CONTACT REQUIRING HOSPITALIZATION 050-15 Division Date Duty-On (X) Off () Uniform-Yes
Signature: Signed by GNT Date Signed: 10/28/2013
 Atlanta Police Department Policy Manual Standard Operating Procedure Effective Date October 30, 2013 Applicable To: All sworn employees Approval Authority: Chief George N. Turner Signature: Signed by GNT
PORTLAND POLICE BUREAU DEPARTMENT OF JUSTICE PROGRESS REPORT. March 2014
 PORTLAND POLICE BUREAU DEPARTMENT OF JUSTICE PROGRESS REPORT March 2014 THE FOLLOWING IS A BRIEF SNAPSHOT OF THE WORK BEING DONE BY THE PORTLAND POLICE BUREAU (PPB) TO ENHANCE POLICY, INCREASE ACCOUNTABILITY
INTRADEPARTMENTAL CORRESPONDENCE. The Honorable Board of Police Commissioners
 INTRADEPARTMENTAL CORRESPONDENCE May 2, 2013 14.2 TO: The Honorable Board of Police Commissioners FROM: Chief of Police SUBJECT: OPERATIONS CENTRAL BUREAU VICE COMMAND ACCOUNTABILITY PERFORMANCE AUDIT
INTRADEPARTMENTAL CORRESPONDENCE. October 8, 2014 BPC #
 INTRADEPARTMENTAL CORRESPONDENCE October 8, 2014 BPC #14-0370 1.0 TO: The Honorable Board of Police Commissioners FROM: Inspector General, Police Commission SUBJECT: OFFICE OF THE INSPECTOR GENERAL S INVESTIGATION
ABRIDGED SUMMARY OF CATEGORICAL USE OF FORCE INCIDENT AND FINDINGS BY THE LOS ANGELES BOARD OF POLICE COMMISSIONERS
 ABRIDGED SUMMARY OF CATEGORICAL USE OF FORCE INCIDENT AND FINDINGS BY THE LOS ANGELES BOARD OF POLICE COMMISSIONERS HEAD STRIKE WITH AN IMPACT WEAPON - 017-05 Division Date Duty-On (x) Off( ) Uniform-Yes(x)
Aggravated Active Aggression Response: Use of a physical response that may cause death or serious bodily harm, as governed by Georgia State Law.
 GEORGIA DEPARTMENT OF JUVENILE JUSTICE Applicability: {x} All DJJ Staff {x} Administration {x} Community Services {x} Secure Facilities (RYDCs and YDCs) Transmittal # 12-11 Policy # 8.30 Related Standards
The leading digital media company for Public Safety & Local Government
 South Carolina Criminal Justice Academy - PoliceOne Academy Course Guide Provider Course Title Hours PoliceOne Academy Active Shooter 1 1 PoliceOne Academy Active Shooter 2 1 PoliceOne Academy Active Shooter
ABRIDGED SUMMARY OF CATEGORICAL USE OF FORCE INCIDENT AND FINDINGS BY THE LOS ANGELES BOARD OF POLICE COMMISSIONERS
 ABRIDGED SUMMARY OF CATEGORICAL USE OF FORCE INCIDENT AND FINDINGS BY THE LOS ANGELES BOARD OF POLICE COMMISSIONERS K-9 CONTACT REQUIRING HOSPITALIZATION 074-16 Division Date Duty-On (X) Off ( ) Uniform-Yes
Portland Police Bureau Responses to OIR Group Fourth Report to the City of Portland Portland Police Bureau Officer-Involved Shootings
 Portland Police Bureau Responses to OIR Group Fourth Report to the City of Portland Portland Police Bureau Officer-Involved Shootings 1. The Bureau should ensure that command staff recognizes that it should
LMPD Training Curriculum
 LMPD Training Curriculum The Louisville Metro Police Training Academy has been providing Basic Law Enforcement Training for its new employees since merger in 2003. All training curriculum is reviewed and
Rod Underhill, District Attorney
 Rod Underhill, District Attorney 1021 SW Fourth Avenue, Room 600 Portland, OR 97204-1193 Phone: 503-988-3162 Fax: 503-988-3643 www.mcda.us MULTNOMAH LAW ENFORCEMENT ASSISTED DIVERSION (LEAD ) MISSION &
MCOLES PoliceOne Academy Course Guide
 MCOLES PoliceOne Academy Course Guide Provider Course Title Hours PoliceOne Academy Active Shooter PoliceOne Academy Active Shooter 2 PoliceOne Academy Active Shooter 3 PoliceOne Academy Active Shooter
Hebron Police Department
 Hebron Police Department Annual Report 2014 Table of Contents Mission Statement.. 2 Core Values 3 Department Personnel......4-6 Equipment Acquisition....7 Training......8-11 Calls for Service...12 Offense
A survey of the Views and Attitudes of Police Officers on their existing Operational Safety Training, Personal Protective Equipment and potential
 A survey of the Views and Attitudes of Police Officers on their existing Operational Safety Training, Personal Protective Equipment and potential future enhancements SCOTTISH POLICE FEDERATION PERSONAL
GENERAL POLICE ORDER CLEVELAND DIVISION OF POLICE
 GENERAL POLICE ORDER CLEVELAND DIVISION OF POLICE ORIGINAL EFFECTIVE DATE : SUBJECT: ASSOCIATED MANUAL: REVISED DATE: 1/5/2017 NO. PAGES: 1 of 11 CRISIS INTERVENTION TEAM RESPONSE RELATED ORDERS: NUMBER:
LOS ANGELES POLICE DEPARTMENT
 LOS ANGELES POLICE DEPARTMENT Sergeant John Lusardi Police Executive Research Forum 1120 Connecticut Avenue Northwest Washington D.c. 20037 Dear Sergeant Lusardi: I am pleased to nominate Pacific Area's
IMPLEMENTATION PLAN Moving from Recommendations to Action
 CITY OF COLUMBIA S IMPLEMENTATION PLAN Moving from Recommendations to Action CITY OF COLUMBIA S COMMUNITY BASED PLAN Implementation of the recommendations of the President s Task Force on 21st Century
South Carolina Criminal Justice Academy - PoliceOne Academy Course Guide
 South Carolina Criminal Justice Academy - PoliceOne Academy Course Guide Provider Course Title Hours PoliceOne Academy Active Shooter 1 1 PoliceOne Academy Active Shooter 2 1 PoliceOne Academy Active Shooter
National Resource and Technical Assistance Center for Improving Law Enforcement Investigations
 Readers to Enhance Criminal Investigations Assistant Chief of Police Travis Martinez Redlands Police Department Introduction With the vast majority of crimes involving the use of motor vehicles, law enforcement
CANINE UNIT. C. Building Search: The utilization of the K-9 Unit to locate suspect(s) believed to be or known to be hiding in a building or structure.
 believed to be or known to be hiding in a building or structure.") CITY OF MARYLAND HEIGHTS OFFICE OF THE CHIEF OF POLICE Cancels: GO 498.00 Index as: March 15, 2011 Assistance to other agencies Canine Off-duty Call-ins Search, Canine 498.00 PURPOSE CANINE UNIT The purpose
CITY OF MARYLAND HEIGHTS OFFICE OF THE CHIEF OF POLICE Cancels: GO 498.00 Index as: March 15, 2011 Assistance to other agencies Canine Off-duty Call-ins Search, Canine 498.00 PURPOSE CANINE UNIT The purpose
TCOLE - PoliceOne Academy Course Guide
 TCOLE - PoliceOne Academy Course Guide Provider Course Title Course Number Hours PoliceOne Active Shooter 1 77301 1 PoliceOne Active Shooter 2 77368 1 PoliceOne Active Shooter 3 77369 1 PoliceOne Active
February 7, Chief of Police George Kral. Deputy Chief Cheryl Hunt Support and Administrative Services Division
 February 7, 2018 To: Through: Chief of Police George Kral Deputy Chief Cheryl Hunt Support and Administrative Services Division Captain Joseph Heffernan Support Services Bureau Lieutenant David Wieczorek
At A hens t Po P lice Departmen t Departmen 2011 Annual Report
 Athens Police Department 2011 Annual Report Introduction TheAthens Police Department currently employs: 31 sworn officers 6 civilians including: 2 Records clerks A part time liaison officer 3 reserve officers
TYPE OF ORDER NUMBER/SERIES ISSUE DATE EFFECTIVE DATE General Order /25/2014 9/25/2014
 TYPE OF ORDER NUMBER/SERIES ISSUE DATE EFFECTIVE DATE General Order 300.01 9/25/2014 9/25/2014 SUBJECT TITLE PREVIOUSLY ISSUED DATES Use Of Force 6/5/2014; 3/28/2014; 2/8/2009; Amends: PPD Rules & Regulations
INTRADEPARTMENTAL CORRESPONDENCE. March 12, 2013 BPC #
 INTRADEPARTMENTAL CORRESPONDENCE March 12, 2013 BPC #13-0097 TO: The Honorable Board of Police Commissioners FROM: Inspector General, Police Commission SUBJECT: SUSPICIOUS ACTIVITY REPORT AUDIT RECOMMENDED
Diagnosing Gang Problems in the Caribbean
 Diagnosing Gang Problems in the Caribbean Charles M. Katz, Ph.D. Center for Violence Prevention & Community Safety CARICOM Conference on Violence Prevention Theme: Confronting the Challenge of Youth Violence
ESF 13 Public Safety and Security
 ESF 13 Public Safety and Security Purpose This ESF Annex provides guidance for the organization of law enforcement resources in Sumner County to respond to emergency situations exceeding normal law enforcement
Staffing Study of the Fort Worth Police Department. Presented to the City Council by Jeffrey W. Halstead, Chief of Police
 Staffing Study of the Fort Worth Police Department Presented to the City Council by Jeffrey W. Halstead, Chief of Police November 4, 2014 1 Purpose of Today s Presentation Review Purpose of Staffing Study
DEATHS FROM SUICIDE among U.S. Veterans & Armed Forces in 16 States
 DEATHS FROM SUICIDE among U.S. Veterans & Armed Forces in 16 States A Special Report with Data from the National Violent Death Reporting System, 2010-2014 Alaska Colorado Georgia Kentucky Maryland New
Third Quarter Rank Recommended. Page 1 of 6
 This report is based on the Department s Letters of Intent and does not reflect modifications to recommended discipline due to Grievances, Skelly Hearings, Arbitration Hearings, Civil Service Commission
GENERAL POLICE ORDER CLEVELAND DIVISION OF POLICE
 GENERAL POLICE ORDER CLEVELAND DIVISION OF POLICE ORIGINAL EFFECTIVE DATE: June 29, 2016 ASSOCIATED MANUAL: REVISED DATE: NO. PAGES: 1 of 12 RELATED ORDERS: NUMBER: CHIEF OF POLICE: This General Police
Maryland Chiefs of Police Association Maryland Sheriffs Association. Agency Guidelines For Use of Electronic Control Devices
 Maryland Chiefs of Police Association Maryland Sheriffs Association Agency Guidelines For Use of Electronic Control Devices I. Purpose: These guidelines have been developed by the Maryland Chiefs of Police
ORGANIZATION AND FUNCTIONS OF ADMINISTRATION. This addendum establishes the organizational structure and functions of Administration.
 G.O. 09-02-03 Chicago Police Department TITLE: ORGANIZATION AND FUNCTIONS OF ADMINISTRATION ISSUE DATE: 26 January 2009 EFFECTIVE DATE: 27 January 2009 DISTRIBUTION: A* RESCINDS: I. PURPOSE This addendum
ABRIDGED SUMMARY OF CATEGORICAL USE OF FORCE INCIDENT AND FINDINGS BY THE LOS ANGELES BOARD OF POLICE COMMISSIONERS OFFICER-INVOLVED SHOOTING
 ABRIDGED SUMMARY OF CATEGORICAL USE OF FORCE INCIDENT AND FINDINGS BY THE LOS ANGELES BOARD OF POLICE COMMISSIONERS OFFICER-INVOLVED SHOOTING 018-12 Division Date Duty-On (X) Off () Uniform-Yes (X) No
Chief Linda J. Stump
 Chief Linda J. Stump A brief overview of Police Department operations and use of force training. An overview of use of force incidents for 2013. A comparison of use of force statistics with local law
AKRON POLICE DEPARTMENT PROPOSED EMERGENCY MENTAL ILLNESS PROCEDURE INTRODUCTION
 INTRODUCTION AKRON POLICE DEPARTMENT Police officers are often called upon to respond to incidents involving persons who are known to be or suspected of suffering from a mental illness. The degree of police
DOJ/CNA's Recommendations Philadelphia Police Department INTERNAL USE ONLY - STATUS OF RECOMMENDATIONS
 REC# RECOMMENDATION BASELINE CRITERIA STATUS UNIT/DEPT 1.1 PPD should develop a standard training Training lesson plan; general order or policy prescribing mandatory training; module on Directives 10 and
C I T Y O F O A K L A N D. Memorandum
 C I T Y O F O A K L A N D Memorandum TO: Bureau of Field Operations One ATTN: Deputy Chief D. Downing FROM: PRS Aki James DATE: 03 Mar 16 RE: Monthly UOF Risk Management Report Reporting Period: 01 Jan
DATA SOURCES AND METHODS
 DATA SOURCES AND METHODS In August 2006, the Department of Juvenile Justice s (DJJ) Quality Assurance, Technical Assistance and Research and Planning units were assigned to the Office of Program Accountability.
TOTAL REVIEWS
 Training Memorandum 18-023 DATE: February 28, 2018 TO: FROM: CC: SUBJECT: Chief Linda Stump-Kurnick Lieutenant Jake Pruitt and Lieutenant Kristy Sasser Deputy Chief Tony Dunn, Office of Professional Standards,
For detailed information regarding the programs and services, as well as information about the Department itself, please visit
 U.C. Riverside Program Highlights PDF Version For 2008, the most significant program highlighted is the partnership of the Police Department, Computing and Communication and Environmental Health & Safety
For detailed information regarding the programs and services, as well as information about the Department itself, please visit
 UCPD Annual Report & Crime Statistics 2007 - U.C. Riverside Program Highlights PDF Version For 2007, the most significant program highlighted is the partnership of the Police Department, Computing and
Evansville Police Department 2017 Annual Web Report
 Evansville Police Department 2017 Annual Web Report "An International Accredited Law Enforcement Agency 1 MISSION STATEMENT The mission of the Evansville Police Department, in partnership with the community,
II. Definitions... Page 1 V. Cross References... Page 6 III. Regulations... Page 2 VI. Attachments... Page 6
 SPECIAL ORDER DISTRICT OF COLUMBIA Subject Instructions for Completing the Reportable Incident Form (RIF: PD Forms 901-g and 901-h) Series Number 06 06 Effective Date April 7, 2006 Related to General Order
GREENVILLE POLICE DEPARTMENT POLICY AND PROCEDURES MANUAL. By the Order Of: Mark Holtzman, Chief of Police Date Reissued: 11/28/17 Page 1 of 8
 GREENVILLE POLICE DEPARTMENT POLICY AND PROCEDURES MANUAL Chapter 11 Date Initially Effective: 09/01/94 Date Revised: 11/02/17 Organization and Administration By the Order Of: Mark Holtzman, Chief of Police
Notice of Examination with Source Material List
 DATE: December 5, 2012 NOTICE FIREFIGHTERS AND POLICE OFFICERS CIVIL SERVICE COMMISSION CITY OF AUSTIN WRITTEN EXAMINATION POLICE SERGEANT Notice of Examination with Source Material List TIME: PLACE: 9:00
Rod Underhill, District Attorney
 Rod Underhill, District Attorney 1021 SW Fourth Avenue, Room 600 Portland, OR 97204-1193 Phone: 503-988-3162 Fax: 503-988-3643 www.mcda.us MULTNOMAH LAW ENFORCEMENT ASSISTED DIVERSION (LEAD) MISSION &
LOS ANGELES COUNTY SHERIFF S DEPARTMENT
 LOS ANGELES COUNTY SHERIFF S DEPARTMENT USE OF FORCE AUDIT NORTH PATROL DIVISION LANCASTER No. 2017-5-A JIM McDONNELL SHERIFF September 28, 2017 LOS ANGELES COUNTY SHERIFF S DEPARTMENT Audit and Accountability
Bureau of Services. Communications Division. Annual Report 2008
 Oakland Police Department Bureau of Services Communications Division Annual Report 2008 Table of Contents I. Division Functions / Responsibilities... 3 II. Staffing... 4 III. Fiscal Management... 6 IV.
OFFICE OF CITIZEN COMPLAINTS
 THE POLICE COMMISSION OFFICE OF CITIZEN COMPLAINTS CITY AND COUNTY OF SAN FRANCISCO Date: March 1 1,2005 To: Hon. Louise Renne, President Members, San Francisco Police Commission Kevin Allen Director Re:
GENERAL ORDER DISTRICT OF COLUMBIA I. BACKGROUND
 GENERAL ORDER DISTRICT OF COLUMBIA Title Use of Force Review Board Topic Series Number RAR 901 09 Effective Date March 30, 2016 Replaces: GO-RAR-901.09 (Use of Force Review Board), Effective Date October
Public Safety Organizational Chart. Public Safety
 Public Safety Organizational Chart Public Safety 237 Public Safety Budget Summary Public Safety Agencies 2015 Actuals 2016 Appropriated 2017 Recommended Safety Management 3,827,369 4,487,630 5,130,531
LOS ANGELES COUNTY SHERIFF S DEPARTMENT
 LOS ANGELES COUNTY SHERIFF S DEPARTMENT USE OF FORCE AUDIT NORTH PATROL DIVISION PALMDALE STATION No. 2017-4-A JIM McDONNELL SHERIFF October 25, 2017 LOS ANGELES COUNTY SHERIFF S DEPARTMENT Audit and Accountability
RALEIGH FIREARM VIOLENCE REDUCTION STRATEGY
 RALEIGH FIREARM VIOLENCE REDUCTION STRATEGY A focused approach to reduce firearm violence through education and training, intelligence led policing, and community partnerships RALEIGH POLICE DEPARTMENT
Chief William Scott s Statement Regarding Conducted Energy Devices for the San Francisco Police Department
 Chief William Scott s Statement Regarding Conducted Energy Devices for the San Francisco Police Department The San Francisco Police Department is considering implementing Conducted Energy Devices (CEDs),
GRAND PRAIRIE POLICE ANNUAL REPORT GRANDPRAIRIEPOLICE.ORG 1525 ARKANSAS LANE GRAND PRAIRIE, TX
 GRAND PRAIRIE POLICE 2015 ANNUAL REPORT GRANDPRAIRIEPOLICE.ORG 1525 ARKANSAS LANE GRAND PRAIRIE, TX MESSAGE FROM THE CHIEF In 2015, the Grand Prairie Police Department continued the development of our
PHILADELPHIA POLICE DEPARTMENT DIRECTIVE 12.18
 PHILADELPHIA POLICE DEPARTMENT DIRECTIVE 12.18 Issued Date: 08-29-14 Effective Date: 08-29-14 Updated Date: 05-15-15 SUBJECT: COMPLAINTS AGAINST THE PHILADELPHIA POLICE DEPARTMENT PLEAC 2.3.1 1. POLICY
CELL AND AREA EXTRACTIONS (Critical Policy)
") DESCHUTES COUNTY ADULT JAIL CD-8-12 L. Shane Nelson, Sheriff Jail Operations Approved by: January 14, 2018 POLICY. CELL AND AREA EXTRACTIONS (Critical Policy) It is the policy of the Deschutes County Sheriff
DESCHUTES COUNTY ADULT JAIL CD-8-12 L. Shane Nelson, Sheriff Jail Operations Approved by: January 14, 2018 POLICY. CELL AND AREA EXTRACTIONS (Critical Policy) It is the policy of the Deschutes County Sheriff
EASTHAM, ORLEANS AND WELLFLEET, MASSACHUSETTS
 EASTHAM, ORLEANS AND WELLFLEET, MASSACHUSETTS LOWER/OUTER CAPE REGIONAL PUBLIC SAFETY SERVICE STUDY MARCH 2010 MMA CONSULTING GROUP, INC. 1330 BEACON STREET BROOKLINE, MASSACHUSETTS 02446 CONTENTS I. EXECUTIVE
North Carolina Department of Public Safety
 North Carolina Department of Public Safety Prevent. Protect. Prepare. Pat McCrory, Governor Frank L. Perry, Secretary MEMORANDUM TO: FROM: SUBJECT: Chairs of House Appropriations Committee on Justice and