Bureau of Primary Health Care
|
|
|
- Spencer Stephens
- 5 years ago
- Views:
Transcription


1 Bureau of Primary Health Care
2 Introduction to the Uniform Data System (UDS): Who, What, When, Where, Why 2017 UDS Changes and 2018 UDS Proposed Changes UDS Modernization Step-by-Step UDS Table Instructions and Definitions Strategies for Successful Reporting Assistance Available to Help Complete the UDS 2
3 Who, What, When, Where and Why 3
4 Health Center Program grantees authorized by section 330 of the Public Health Service Act Community Health Center (CHC - 330(e)) Health Care for the Homeless (HCH - 330(h)) Migrant Health Center (MHC - 330(g)) Public Housing Primary Care (PHPC - 330(i)) Health Center Program look-alikes (LAL) Bureau of Health Workforce (BHW) primary care clinics 4

5 5
6 Report all in-scope activities in the health center s Notice of Award/designation All related staff, services, patients, visits, income/revenue, expenses/costs Do not include sites or services that are not approved Report on activities that occurred during the period from January 1, 2017-December 31, 2017 Calendar year reporting not based on grant year or fiscal year Activities funded or designated before October
7 A detailed picture of your health center using: Twelve tables of demographic, clinical, operational, and financial data Two forms of health information technology (HIT), telehealth, and other data elements What is Reported Table(s) Patients served and their demographic characteristics ZIP Code, 3A, 3B, 4 Types and quantities of services provided Staffing mix and tenure 5, 6A 5, 5A Quality of care, health outcomes, and disparities 6A, 6B, 7 Costs of providing services Revenue sources HIT capabilities, electronic health record (EHR) interoperability, Meaningful Use leveraging Telehealth, medication-assisted treatment (MAT), and outreach and enrollment assists 8A 9D, 9E HIT Form Other Form 7
8 How many of you are here with colleagues from your center? How many of you work on the UDS with others from your center? How many of you work in teams that cross departments? In order to best approach the UDS Report, it is best for you to work with others to understand how the tables fit together 8
9 Who we serve Revenues to support the health center The services they receive What it costs to provide services The quality of care provided 9
10 Universal Report completed by reporting health centers Grant Report(s) completed by grantees that receive Table 330 grants under multiple program funding Universal Report if you are: 330-funded program LAL BHW primary care clinic Also report Grant Report(s) if you receive 330 grants under multiple program authorities: CHC (330 (e)) HCH (330 (h)) MHC (330 (g)) PHPC (330 (i)) ZIP Code Yes No 3A, 3B, 4 Yes Yes 5 Yes Yes, but patients and visits only 5A Yes No 6A Yes Yes 6B, 7, 8A, 9D, 9E Yes No 10
11 Report through Electronic Handbook (EHB) webbased data collection system mon/accesscontrol/login.aspx Authorized staff can work on the UDS Multiple people can work at the same time as long as they are updating different tables Acknowledge that data was reviewed for accuracy and validated prior to submission EHB includes a summary of incomplete tables and questions about the data reported 11
12 EHB table format may look slightly different than tables in the manual The Data Audit Report (DAR) needs to be run when tables are marked as complete to identify system questions (edits) about the data reported You must correct or explain each edit on the DAR, not in the comments section available on each table 12

13 September 11 Performance Data Collection Environment (PDCE) available January 1 UDS Report available in EHB February 15 Due Date February 15 - March 31 Review period Work with your assigned UDS reviewer March 31 All corrected submissions must be finalized No further changes made after this date 13
14 Comply with legislative and regulatory requirements Inform Health Resources and Services Administration (HRSA), Congress, and the public about health center performance and operations Identify and measure trends over time Reward effective programs and services Support quality improvement at the health center Target needed interventions Compare health center performance with national benchmarks and quality standards 14

15 Changes by Table 15
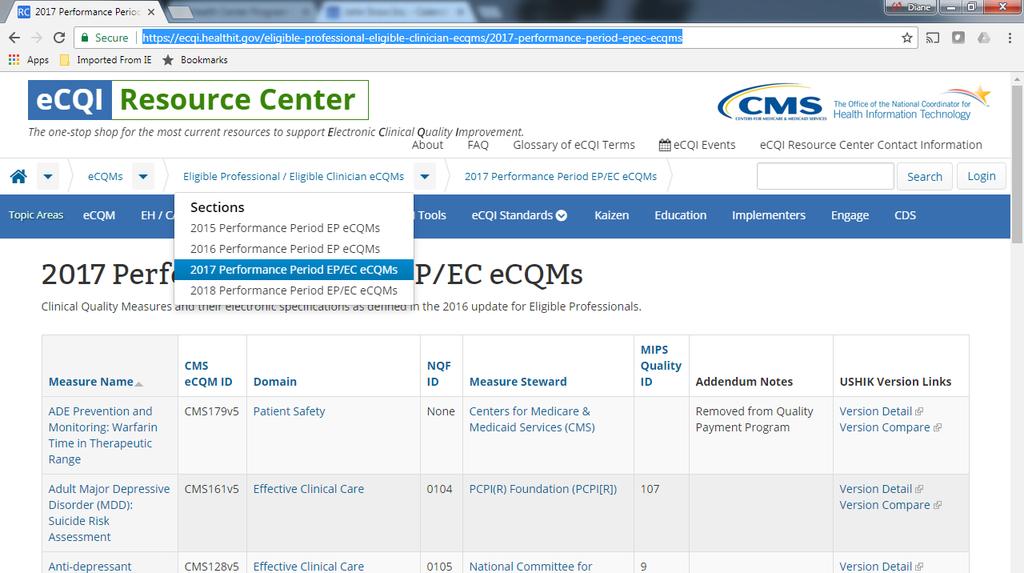
16 Tables 6B and 7: Continue to align UDS Clinical Quality Measures (ecqms) with the electronic CQMs used by the Centers for Medicare & Medicaid Services (CMS) Use the January 2017 Addendum ereporting update for 2017 reporting Specifications included at the CMS ecqi Resource Center Link: Note: Major differences between 2016 and 2017 will be outlined later in presentation 16

17 Collects some data previously collected on HIT Form: Medication-assisted treatment (MAT) Note: Opioid treatment prescribing privileges have been extended beyond physicians to include certain qualified nurse practitioners and physician assistants Use of telehealth Outreach and enrollment assists by a trained assister Note: Definition of assists is unchanged and assists still do not count as visits on the UDS tables 17
18 Retire the reporting of Hemoglobin A1c less than 8% (Table 7) Remove the patient-centered medical home (PCMH) recognition question (HIT Form) Enhance the questions about telehealth (Other Data Form) 18
19 Performance Data Collection Environment 19
20 <Play video> Suma Nair PhD, MS, RD Director, Office of Quality Improvement New: Performance Data Collection Environment Available September 11 December 31 20
21 Step-by-Step Instructions 21
22 Unduplicated Count 22
23 People who have at least one reportable visit* during the calendar year On the demographic tables: ZIP Code Table, Table 3A, and in each section of Tables 3B and 4, count each patient once and only once Even if the patient received more than one type of service or had more than one visit Patients are unduplicated on these tables do not report the same patient twice * A visit determines who to count as a patient and will be further described on Table 5 23


24 Table 3A, total on Line 39, must equal the totals from the ZIP Code Table and each section from Tables 3B and 4 to provide an unduplicated count of patients 24
25 Also report these patients on Tables 5 and 6A only once for each type of service or diagnosis received during the year Table 5 Has seven service categories: medical, dental, mental health, substance abuse, other professional, vision, and enabling services Table 6A There are multiple diagnoses and services 25
26 A patient comes in three times during the year: once for medical, once for dental, and once for vision services. Count the patient once on: Each demographic table and section (ZIP Code, Tables 3A, 3B, and 4) AND Table 5 as a medical patient AND Table 5 as a dental patient AND Table 5 as a vision patient Note: Patients will also be considered for clinical tables, described later 26
27 Patients by ZIP Code by Primary Medical Insurance 27
28 None/Uninsured Medicaid/ CHIP/ Medicare Private Total Patients ZIP Code (b) Other Public (d) (e) (f) (a) (c) blank blank blank blank blank blank blank blank blank blank blank blank <system allows insertion of rows for more ZIP blank blank blank blank blank Codes> Other ZIP Codes blank blank blank blank blank Unknown Residence blank blank blank blank blank Total blank blank Blank blank blank 28
29 List all ZIP codes with 11 or more patients in Column A Aggregate ZIP codes with 10 or fewer patients as other Report each ZIP code by primary medical insurance Apply same rules used for reporting patients by insurance on Table 4 (totals must be equal) 29
 residency ZIP code for people from other countries who reside in the U.S. These data provide current geographic service area of health centers and are updated yearly on UDS Mapper at http://www.")
30 For patients experiencing homelessness, use the ZIP code of service location if no address is obtained For migratory agricultural workers, use the ZIP code where the patient was housed when they received care Use current United States (U.S.) residency ZIP code for people from other countries who reside in the U.S. These data provide current geographic service area of health centers and are updated yearly on UDS Mapper at 30
31 Common edit: Patient numbers do not agree for Medicaid on ZIP Code Table and Table 4. 31
32 Common edit: Patient numbers do not agree for Medicaid on ZIP Code Table and Table 4. Possible solutions: What to look for: Insurance categories across the two tables must equal Edit may appear for other insurance categories Correct errors: Neglecting to combine Medicaid, CHIP, and Other Public on ZIP Code Table Reporting patients with multiple insurance under different categories across tables Explain: Patient total by insurance categories across the two tables must equal (edit is not explainable) 32
33 ZIP Code Table: ZIP Code (a) None/Uninsured (b) Medicaid/ CHIP/ Other Public (c) Medicare (d) Private (e) Total Patients (f)... blank blank blank blank blank Total blank blank Blank blank blank Table 4: Principal Third Party Medical Insurance 7 None/Uninsured 8a Regular Medicaid (Title XIX) 8b CHIP Medicaid 8 Total Medicaid (Sum lines 8a+8b) 9a Dually Eligible (Medicare and Medicaid) Medicare (Inclusive of dually eligible and other Title XVIII 9 beneficiaries) Other Public Insurance Non-CHIP 10a Specify: 10b Other Public Insurance CHIP 10 Total Public Insurance (Sum lines 10a+10b) 11 Private Insurance 12 Total (Sum lines ) 33
34 Patients by Age and by Sex Assigned at Birth 34

35 Line Age Groups Male Patients (a) Female Patients (b) 1 Under age 1 blank Blank 2 Age 1 blank blank 3 Age 2 blank blank 4 Age 3 blank blank 5 Age 4 blank blank 6 Age 5 blank blank 7 Age 6 blank blank 8 Age 7 blank blank 9 Age 8 blank blank 10 Age 9 blank blank 11 Age 10 blank blank 12 Age 11 blank blank 13 Age 12 blank blank 14 Age 13 blank blank 15 Age 14 blank blank 16 Age 15 blank blank 17 Age 16 blank blank 18 Age 17 blank blank 19 Age 18 blank blank 20 Age 19 blank blank 21 Age 20 blank blank 22 Age 21 blank blank 23 Age 22 blank blank 24 Age 23 blank blank 25 Age 24 blank blank 26 Ages blank blank 27 Ages blank blank 28 Ages blank blank 29 Ages blank blank 30 Ages blank blank 31 Ages blank blank 32 Ages blank blank 33 Ages blank blank 34 Ages blank blank 35 Ages blank blank 36 Ages blank blank 37 Ages blank blank 38 Age 85 and over blank blank 39 Total Patients (Sum lines 1-38) blank blank 35


36 Report the number of patients by age and by sex Use patient s sex at birth or on a birth certificate Use age as of June 30 Note: The non-prenatal and non-childhood immunization portions of Tables 6B and 7 define age as of January 1 36

37 Line Age Groups Male Patients (a) Female Patients (b) All Patients 1 Under age 1 331, , ,916 2 Age 1 224, , ,834 3 Age 2 214, , ,807 4 Age 3 224, , ,542 5 Age 4 239, , ,781 6 Age 5 242, , ,694 7 Age 6 231, , ,398 8 Age 7 231, , ,258 9 Age 8 232, , , Age 9 225, , , Age , , , Age , , , Age , , , Age , , , Age , , , Age , , , Age , , , Age , , ,985 Subtotal Patients (Sum Lines 1-18) 4,003,738 4,002,244 8,005, Age , , , Age , , , Age , , , Age , , , Age , , , Age , , , Age , , , Ages ,120 1,244,596 1,867, Ages ,200 1,184,980 1,827, Ages ,288 1,083,171 1,722, Ages , ,819 1,578, Ages , ,730 1,619, Ages , ,986 1,711, Ages , ,546 1,641, Ages , ,041 1,358,450 Subtotal Patients (Sum Lines 19-33) 6,048,901 9,657,092 15,705, Ages , , , Ages , , , Ages , , , Ages , , , Age 85 and over 61, , ,254 Subtotal Patients (Sum Lines 34-38) 870,064 1,278,257 2,148, Total Patients (Sum lines 1-38) 10,922,703 14,937,593 25,860,296 blank % of Total 42.24% 57.76% blank 37
38 Demographic Characteristics Hispanic or Latino Ethnicity and Race Language Preference Sexual Orientation Gender Identity 38
39 Line Patients by Race Hispanic/Latino (a) Non- Hispanic/Latino (b) Unreported/ Refused to Report Ethnicity ( c ) Total (d) (Sum Columns a+b+c) 1. Asian 2a. Native Hawaiian 2b. Other Pacific Islander Total Native Hawaiian/Other Pacific Islander 2. (Sum Lines 2a + 2b) 3. Black/African American 4. American Indian/Alaska Native 5. White 6. More than one race 7. Unreported/Refused to report race 8. Total Patients (Sum Lines to 7) Line Patients by Language Number (a) 12. Patients Best Served in a Language Other Than English Line Patients by Sexual Orientation Number (a) 13. Lesbian or Gay [blank] 14. Straight (not lesbian or gay) [blank] 15. Bisexual [blank] 16. Something else [blank] 17. Don't know [blank] 18. Chose not to disclose [blank] 19. Total Patients (Sum Lines 13 to 18) [blank] Line Patients by Gender Identity Number (a) 20. Male [blank] 21. Female [blank] 22. Transgender Male/Female-to-Male [blank] 23. Transgender Female/Male-to-Female [blank] 24. Other [blank] 25. Chose not to disclose [blank] 26. Total Patients (Sum Lines 20 to 25) [blank] 39
40 Report patients by ethnicity and race (lines 1-8) Self-reported by patients If patient did not choose Hispanic or Latino BUT chose a race, report them in Column B Report patients of multiple races on Line 6, More than one race If race is unreported, report on Line 7 Only report patients who do not report race OR ethnicity in Column C Report patients best served in a language other than English on Line 12 Only this line may be estimated Unreported/ Non- Hispanic/ Refused to Hispanic/ Line Patients by Race Latino Report Latino (a) Ethnicity (b) ( c ) 1. Asian blank blank blank 2a. Native Hawaiian blank blank blank 2b. Other Pacific Islander blank blank blank Total Native 2. Hawaiian/Other Pacific blank blank Islander (Sum Lines 2a + blank 2b) 3. Black/African American blank blank blank 4. American Indian/Alaska blank blank Native blank 5. White blank blank blank 6. More than one race blank blank blank 7. Unreported/Refused to blank blank report race blank 8. Total Patients (Sum blank blank blank Lines to 7) Line Patients by Language 12. Patients Best Served in a Language Other Than English 40
41 Report patients by their sexual orientation and by their gender identity Self-reported by all patients or their caregivers Important to identify and reduce health disparities and promote culturally competent care in health centers Aligned with the Office of National Coordinator for Health Information Technology (ONC) certification program 41
 Sexual Orientation 17 Sexual Orientation 18 Gender Identity 24 Gender Identity 25")
42 Report patients who chose Description Line Don t Know or Other, and Report patients where data is missing response of (include minors, patients who Chose not to did not respond, and if no Disclose system was in place to capture data) Sexual Orientation 17 Sexual Orientation 18 Gender Identity 24 Gender Identity 25 42
43 You should have established data collection systems to capture this information First year data (2016) shows this information was not collected by most health centers If you did not collect SOGI data from patients, explain the reason in Table 3B Comments The National LGBT Health Education Center can help 43
44 Line Patients by Sexual Orientation Number (a) % of Total 13. Lesbian or Gay 125, % 14. Straight (not lesbian or gay) 4,073, % 15. Bisexual 50, % 16. Something else 43, % 17. Don't know 19,941, % 18. Chose not to disclose 1,625, % 19. Total Patients (Sum Lines 13 to 18) 25,860, % Line Patients by Gender Identity Number (a) % of Total 20. Male 3,617, % 21. Female 5,064, % 22. Transgender Male/Female-to-Male 20, % 23. Transgender Female/Male-to-Female 15, % 24. Other 16,248, % 25. Chose not to disclose 893, % 26. Total Patients (Sum Lines 20 to 25) 25,860, % 44
45 Common edit: All patients by gender identity have been reported as male or female. 45
46 Common edit: All patients by gender identity have been reported as male or female. What to look for: Record patient s self-reported gender identity Edit may appear for all patients reported as straight for sexual orientation, or when all patients are in one category Possible solutions: Correct errors: Using patient s sex assigned at birth to identify gender Assigning patients to one category for missing data Explain: All patients self-reported gender If data is missing, report patients on Line 24, Other 46
47 Selected Patient Characteristics Income as a Percent of Poverty Guideline Principal Third-Party Medical Insurance Managed Care Utilization Special Populations 47
48 Line Characteristic Number of Patients (a) Income as Percent of Poverty Guideline % and below % % 4. Over 200% 5. Unknown 6. blank blank blank blank blank Total (Sum lines 1-5) blank Line Principal Third Party Medical Insurance 0-17 years old 18 and older (a) (b) 7. None/Uninsured blank blank 8a. Regular Medicaid (Title XIX) blank blank 8b. CHIP Medicaid blank blank 8. Total Medicaid (Line 8a + 8b) blank blank 9a. Dually Eligible (Medicare and Medicaid) blank blank 9. Medicare (Inclusive of dually eligible and other Title XVIII beneficiaries) blank blank 10a. Other Public Insurance Non-CHIP (specify:) blank blank 10b. Other Public Insurance CHIP blank blank 10. Total Public Insurance (Line 10a + 10b) blank blank 11. Private Insurance blank blank 12. TOTAL (Sum Lines ) blank blank Line Payer Category Medicaid (a) Medicare (b) Other Public Private Total Including Non-Medicaid CHIP (c) (d) (e) 13a. Capitated Member months blank blank blank Blank blank 13b. Fee-for-service Member months blank blank blank blank blank 13c. Total Member months (Sum Lines 13a + 13b) Line Special Populations Number of Patients (a) 14. Migratory (330g grantees only) blank 15. Seasonal (330g grantees only) blank 16. Total Agricultural Workers or Dependents(All Health Centers Report This Line) blank 17. Homeless Shelter (330h grantees only) blank 18. Transitional (330h grantees only) blank 19. Doubling Up (330h grantees only) blank 20. Street (330h grantees only) blank 21. Other (330h grantees only) blank 22. Unknown (330h grantees only) blank 23. Total Homeless (All Health Centers Report This Line) blank 24. Total School-Based Health Center Patients (All Health Centers Report This Line) 25. Total Veterans (All Health Centers Report This Line) 26. Total Patients Served at a Health Center Located In or Immediately Accessible to a Public Housing Site (All Health Centers Report This Line) blank 48
49 Report patients by household income ranges based on annual Federal Poverty Guidelines on Lines 1-4 Report patients with unknown income on Line 5 Line Characteristic Number of Patients (a) Income as Percent of Poverty Guideline 1 100% and below Blank % Blank % Blank 4 Over 200% Blank 5 Unknown Blank 6 Total (Sum lines 1-5) Blank 49
50 Collect and update income annually Verified income is necessary to qualify for sliding discounts Report most recent family income May be self-declared if consistent with Board-approved policy Do not assume patients are at or below poverty if they are homeless, migrant, or agricultural workers or are on Medicaid But, if patients were verified to have no income, report at or below poverty 50
51 Line Characteristic Number of Patients (a) % of Total % of Known Income as Percent of Poverty Guideline 1 100% and below 13,083, % 70.0% % 2,840, % 15.2% % 1,256, % 6.7% 4 Over 200% 1,503, % 8.0% 5 Unknown 7,175, % Blank 6 Total (Sum lines 1-5) 25,860, % Blank 51
 blank blank 8b CHIP Medicaid blank blank 8 Total Medicaid (Sum lines 8a+8b) blank blank 9a 9 Dually Eligible (Medicare and Medicaid)")
52 Report primary source of medical insurance for all patients by age range Principal Third Party Medical Insurance Columns= Age Ranges 0-17 Years Old 18 and Older (a) (b) 7 None/Uninsured blank blank Rows = Primary Medical Insurance 8a Regular Medicaid (Title XIX) blank blank 8b CHIP Medicaid blank blank 8 Total Medicaid (Sum lines 8a+8b) blank blank 9a 9 Dually Eligible (Medicare and Medicaid) Medicare (Inclusive of dually eligible and other Title XVIII beneficiaries) blank blank blank blank 10a Other Public Insurance Non-CHIP Specify: blank blank 10b Other Public Insurance CHIP blank blank 10 Total Public Insurance (Sum lines 10a+10b) blank blank 11 Private Insurance blank blank 12 Total (Sum lines ) blank blank 52


53 Report medical insurance as of the last visit of the year regardless of whether the patient received medical care Primary medical insurance is the insurance normally billed first for medical services 330 grant funds are not a form of insurance 53
54 Common edit: Total patients ages 0-17 years on Table 4, Line 12, Column A is not equal to the sum of Lines 1-18 on Table 3A. 54
55 Common edit: Total patients ages 0-17 years on Table 4, Line 12, Column A, is not equal to the sum of Lines 1-18 on Table 3A. What to look for: Total patients by insurance reports aggregate age ranges 0-17 and 18 and older These must tie to detailed total on 3A Edit may appear for Table 4, Column B compared to Lines on Table 3A Possible solutions: Correct errors: There is no unknown insurance identify all patients primary medical insurance status Explain: Patient counts by age ranges across tables must be equal (edit is not explainable) Use age as of June 30 on both tables 55
56 Line 7. 8a. 8b. 8. 9a a. Principal Third Party Medical Insurance Regular Medicaid (Title XIX) CHIP Medicaid None/Uninsured Total Medicaid (Line 8a + 8b) Dually Eligible (Medicare and Medicaid) Medicare (Inclusive of dually eligible and other Title XVIII beneficiaries) Other Public Insurance Non-CHIP (specify:) 10b. Other Public Insurance CHIP 10. Total Public Insurance (Line 10a + 10b) 11. Private Insurance 12. TOTAL (Sum Lines ) None/Uninsured (Line 7) Patients who do not have medical insurance at their last visit May include patients whose services are reimbursed through a grant, contract, or uncompensated care fund Do not assume and count as uninsured: Patients experiencing homelessness or seen at a school-based clinic Services not covered by insurance 56
57 Line Principal Third Party Medical Insurance 7. None/Uninsured 8a. Regular Medicaid (Title XIX) 8b. CHIP Medicaid 8. Total Medicaid (Line 8a + 8b) Dually Eligible (Medicare and 9a. Medicaid) 9. 10a. Medicare (Inclusive of dually eligible and other Title XVIII beneficiaries) Other Public Insurance Non-CHIP (specify:) 10b. Other Public Insurance CHIP 10. Total Public Insurance (Line 10a + 10b) 11. Private Insurance 12. TOTAL (Sum Lines ) Regular Medicaid (Line 8a) Report Medicaid patients Include Medicaid managed care programs run by commercial insurers Include patients with all forms of stateexpanded Medicaid Children s Health Insurance Program (CHIP) (Lines 8b or 10b) Report CHIP provided through: Medicaid on Line 8b Commercial carrier outside of Medicaid on Line 10b Do not report CHIP as private insurance CHIP varies from state to state some with different names If unable to distinguish between regular Medicaid and CHIP Medicaid, classify patients on Line 8a, regular Medicaid 57
58 Medicare (Line 9) Report patients covered by Medicare Include Medicare, Medicare Advantage, MediGap, and Dually Eligible Report dually eligible patients on Line 9 AND on Line 9a Other Public Insurance Non-CHIP (Line 10a) Report state and/or local government insurance that covers a broad set of benefits Do not include: Federal or state exchanges Programs with limited benefits, such as family planning (Title X); Early Prevention, Screening, Detection, and Treatment (EPDST); Breast and Cervical Cancer Control Program (BCCCP), etc. Line 7. 8a. 8b. 8. 9a a. Principal Third Party Medical Insurance Regular Medicaid (Title XIX) CHIP Medicaid None/Uninsured Total Medicaid (Line 8a + 8b) Dually Eligible (Medicare and Medicaid) Medicare (Inclusive of dually eligible and other Title XVIII beneficiaries) Other Public Insurance Non-CHIP (specify:) 10b. Other Public Insurance CHIP 10. Total Public Insurance (Line 10a + 10b) 11. Private Insurance 12. TOTAL (Sum Lines ) 58
59 Private Insurance (Line 11) Report patients covered by commercial insurance (sold by for-profit and not-forprofit companies) Include insurance purchased for public employees or retirees, such as Tricare, Trigon, or the Federal Employees Benefits Program Include insurance sold on federal or state exchanges Do not include patients on workers compensation it is a liability insurance Report according to medical insurance patient has; if they do not have medical insurance, report as uninsured on Line 7 Line 7. 8a. 8b. 8. 9a a. Principal Third Party Medical Insurance Regular Medicaid (Title XIX) CHIP Medicaid None/Uninsured Total Medicaid (Line 8a + 8b) Dually Eligible (Medicare and Medicaid) Medicare (Inclusive of dually eligible and other Title XVIII beneficiaries) Other Public Insurance Non-CHIP (specify:) 10b. Other Public Insurance CHIP 10. Total Public Insurance (Line 10a + 10b) 11. Private Insurance 12. TOTAL (Sum Lines ) 59
60 Principal Third Party Medical 0-17 Years 18 and Line Total % Insurance Old (a) Older (b) 7. None/Uninsured 1,044,251 5,014,875 6,059, % 8a. Regular Medicaid (Title XIX) 5,763,790 6,780,028 12,543, % 8b. CHIP Medicaid 152,102 19, , % 8. Total Medicaid (Sum lines 8a+8b) 5,915,892 6,799,563 12,715, % 9a. Dually Eligible (Medicare and Medicaid) 2, , , % 9. 10a. Medicare (Inclusive of dually eligible and other Title XVIII beneficiaries) Other Public Insurance Non-CHIP Specify: 8,680 2,375,643 2,384, % 18,754 99, , % 10b. Other Public Insurance CHIP 109,541 25, , % 10. Total Public Insurance (Sum lines 10a+10b) 128, , , % 11. Private Insurance 908,864 3,539,336 4,448, % 12. Total (Sum lines ) 8,005,982 17,854,314 25,860, % 60

61 Report patient member months in managed care plans Do NOT count as managed care: Primary care case management (PCCM) PCMH demonstration grant Patients enrolled for non-medical services only (e.g., dental, mental health) Patients in managed plans who can receive care from other providers Line Managed Care Utilization Payer Category Medicaid (a) Medicare (b) Other Public Including Non- Medicaid CHIP (c) Private (d) Total (e) 13a. Capitated Member months blank blank blank Blank blank Fee-for-service Member 13b. months blank blank blank blank blank 13c. Total Member months (Sum Lines 13a + 13b) blank blank blank blank blank 61
62 Report number of agricultural workers on Line 16 even if you do not receive the targeted funding for that population Lines 14 and 15 are only completed by MHC grantees Status must be verified at least every 2 years Definitions: Migratory An individual, including aged or disabled former agricultural workers, who establishes a temporary home for purposes of seasonal agricultural employment Seasonal An individual who does not establish a temporary home for the purpose of seasonal agricultural employment Line Special Populations Number of Patients (a) 14. Migratory (330g grantees only) blank 15. Seasonal (330g grantees only) blank 16. Total Agricultural Workers or Dependents(All Health Centers Report This Line) blank 62
63 1. In the last 2 years, have you or anyone in your family been employed as a worker in any type of agriculture (farm work) like planting; picking; preparing the soil; packinghouse; driving a truck for any type of farm work; working with farm animals such as cows, chickens, etc.? Yes or No 2. In the last 2 years, have you or a member of your family lived away from home in order to work in any type of agriculture (farm work)? Yes or No 3. Have you or a member of your family stopped migrating to work in agriculture (farm work) because of a disability or age (too old to do the work)? Yes or No Source: Website: 63
64 Report number of patients who are experiencing homelessness on Line 23 even if you do not receive the targeted funding for that population Include individuals who experienced homelessness at time of any service provided during the year Include patients in permanent supportive housing Lines are only completed by HCH grantees Shelter arrangements (Lines 17-22): Report where they are housed as of first visit during the year for housing status If institutionalized, report where patient will spend the night after release Continue to count as homeless on Line 21 for 12 months after last visit while homeless Line Special Populations Number of Patients (a) 17. Homeless Shelter (330h grantees only) blank 18. Transitional (330h grantees only) blank 19. Doubling Up (330h grantees only) blank 20. Street (330h grantees only) blank 21. Other (330h grantees only) blank 22. Unknown (330h grantees only) Blank 23. Total Homeless (All Health Centers Report This Line) Blank 64
65 Please check the statement that best describes your housing situation: I live in my home, which I rent, lease, or own I am staying with a series of friends and/or extended family members on a temporary basis I am staying in supportive or transitional housing (such as a sober living facility or recovery home) I live in a public or private facility that provides temporary shelters (such as a shelter, mission, single room occupancy facility, or motel) I have been released from an institution (such as jail or hospital) without stable housing to return to I live on the streets, in a car, park, sidewalk, in an abandoned building, or any unstable or non-permanent situation I live in a foster care environment Source: Website: 65
66 Report number of special population patients (if any) on Lines 24 and 25 even if you do not receive the targeted funding for that population Report patients who received primary care services at a school-based health center (Line 24) Report patients who have been discharged from the uniformed services of the United States as veterans (Line 25) Do not count active members of military or reserves Report total patients served at a health center located in or immediately accessible to a public housing site (Line 26) Regardless of whether or not the patients are residents of public housing or the health center receives 330(i) funding Line Special Populations Number of Patients (a) 24. Total School-Based Health Center Patients (All Health Centers Report This Line) blank 25. Total Veterans (All Health Centers Report This Line) blank 26. Total Patients Served at a Health Center Located In or Immediately Accessible to a Public Housing Site (All Health Centers Report This Line) blank 66
67 A health center has 2 sites One is determined by the health center leadership (based on their own definition) to be immediately accessible to a public housing site and one is not The one immediately accessible saw 900 total patients, the one not accessible saw 1,100 patients Count on Line 26 = 900 Line Special Populations Number of Patients (a) Total Patients Served at a Health Center Located In or Immediately Accessible 26. to a Public Housing Site (All Health Centers Report This Line) 900k Assistance: Community Health Partners for Sustainability at National Center for Health in Public Housing at 67
68 Staffing and Utilization 68

69 Documented One-on-one, face-to-face contact between a patient and a licensed or credentialed provider Exception: Only behavioral health can count group visits and telemedicine Who exercises independent professional judgment in providing services Only count visits that meet all these criteria 69
70 Must take place in the health center or at any other approved site or location Count visits provided by both paid and volunteer staff Include paid referral visits Count when following current patients in a nursing home, hospital, or at home Do not count if patient is first encountered at these locations unless the site is listed on Form 5B as being in your approved scope 70

71 Patient, per visit type, per day Provider, per patient, per day, regardless of the number of services provided Provider type Exception: Two providers of same type at two different locations on the same day 71
72 A provider: Assumes primary responsibility for assessing the patient and documenting services in patient s record Exercises independent judgement regarding the services provided, which must be in their field of training (licensure and credentialing) Allocate staff time by function among major service categories Do not allocate clinical providers outside their clinical specialties Only those designated as providers in Appendix A of UDS Manual can generate visits for services not all staff generate visits Providers may be employees of the health center, contracted (paid), or volunteers 72

73 Staffing and Utilization Full-Time Equivalents (FTEs) Visits Rendered Patients Served by Service Category 73
 blank blank blank 9a Nurse")
74 Line Personnel by Major Service Category FTEs (a) Clinic Visits (b) Patients (c) 1 Family Physicians blank blank blank 2 General Practitioners blank blank blank 3 Internists blank blank blank 4 Obstetrician/Gynecologists blank blank blank 5 Pediatricians blank blank blank 7 Other Specialty Physicians blank blank blank 8 Total Physicians (Sum lines 1-7) blank blank blank 9a Nurse Practitioners blank blank blank 9b Physician Assistants blank blank blank 10 Certified Nurse Midwives blank blank blank 10a Total NP, PA, and CNMs (Sum lines 9a - 10) blank blank blank 11 Nurses blank blank blank 12 Other Medical Personnel blank blank blank 13 Laboratory Personnel blank blank blank 14 X-Ray Personnel blank blank blank 15 Total Medical (Sum lines 8+10a through 14) blank blank blank 16 Dentists blank blank blank 17 Dental Hygienists blank blank blank 17a Dental Therapists blank blank blank 18 Other Dental Personnel blank blank blank 19 Total Dental Services (Sum lines 16-18) blank blank blank 20a Psychiatrists blank blank blank 20a1 Licensed Clinical Psychologists blank blank blank 20a2 Licensed Clinical Social Workers blank blank blank 20b Other Licensed Mental Health Providers blank blank blank 20c Other Mental Health Staff blank blank blank 20 Total Mental Health (Sum lines 20a-c) blank blank blank 21 Substance Abuse Services blank blank blank 22 Other Professional Services (specify ) blank blank blank 22a Ophthalmologists blank blank blank 22b Optometrists blank blank blank 22c Other Vision Care Staff blank blank blank 22d Total Vision Services (Sum lines 22a-c) blank blank blank 23 Pharmacy Personnel blank blank blank 24 Case Managers blank blank blank 25 Patient/Community Education Specialists blank blank blank 26 Outreach Workers blank blank blank 27 Transportation Staff blank blank blank 27a Eligibility Assistance Workers blank blank blank 27b Interpretation Staff blank blank blank 27c Community Health Workers blank blank blank 28 Other Enabling Services (specify ) blank blank blank 29 Total Enabling Services (Sum lines 24-28) blank blank blank 29a Other Programs/Services (specify ) blank blank blank 29b Quality Improvement Staff blank blank blank 30a Management and Support Staff blank blank blank 30b Fiscal and Billing Staff blank blank blank 30c IT Staff blank blank blank 31 Facility Staff blank blank blank 32 Patient Support Staff blank blank blank 33 Total Facility and Non-Clinical Support Staff (Sum lines 30a - blank 32) blank blank 34 Grand Total (Sum lines blank 74
75 Column A Staff full-time equivalents (FTEs) Column B Visits by type of provider Column C Patients by seven service categories Medical Dental Mental health Substance abuse Vision Other professional Enabling Service categories on Table 5 have a direct relationship to cost categories on Table 8A. This will be discussed in the Table 8A section. 75

, but DO count their visits and")
76 Report all staff providing in-scope services in terms of an annualized FTE Include employees, contracted staff, residents, interns, and volunteers Do not include paid referral provider FTEs when working on a fee-for-service basis (paid by service, not by hours), but DO count their visits and patients! 76
77 One full-time equivalent (FTE=1.0) describes staff who worked the equivalent of full-time for one year Health center defines the number of hours in full-time Report FTE, not a head count or a census of staff as of end of year Based on: Employment contracts for clinicians and other exempt employees Include paid time off, vacation, sick time, continuing education, admin time, etc. Hours paid for non-exempt staff Divide hours paid by 2,080 for 40-hour work weeks or by appropriate amount for other work weeks The majority of staff are typically non-exempt employees Hours worked for volunteers and locums (divided by fewer hours) 77

78 For Example: Report a 1.0 FTE medical assistant who works as a laboratory technician one day a week as follows: 0.80 FTE on Line 12, Other Medical Personnel 0.20 FTE on Line 13, Laboratory Personnel Also based on the part of the year the employee works Allocate staff by function/work performed, not job title Do not parse out components of an interaction Do not allocate administrative time supervising clinical staff, attending clinical meeting, or writing clinical protocol Medical director s corporate time (only) can be allocated to nonclinical support services 78

79 Regular Employee One full-time staff worked for 6 months of the year: 1. Calculate base hours for full-time: Total hours per year: 40 hours/week x 52 weeks = 2,080 hours 2. Calculate this staff person s paid hours: Total hours for 6 months: 40 hours/week x 26 weeks = 1,040 hours 3. Calculate FTE for this person: 1,040 hours/2,080 hours = 0.50 FTE Volunteer, Locum, etc. Four individuals who had worked 1,040 hours scattered throughout the year: 1. Calculate base hours for fulltime: Total hours per year: 40 hours/week x 52 weeks = 2,080 hours 2. Deduct unpaid benefits of 10 holidays, 12 sick days, 5 continuing medical education (CME) days, and 3 weeks vacation: = 42 days * 8 hours = = 1, Calculate combined person hours: Total hours: 1,040 hours 4. Calculate FTE: 1,040 hours/1,744 hours = 0.60 FTE 79
: Only licensed in Maine, Minnesota, Vermont, and Alaska tribal lands Other Professionals (Line 22): Include chiropractors, acupuncturists, physical, speech,")
80 Other Medical Personnel (Line 12): Include medical assistants, nurses aides, unlicensed interns or residents, but do not report quality improvement (QI), medical records, patient support, or HIT/EHR staff here Dental Therapists (Line 17a): Only licensed in Maine, Minnesota, Vermont, and Alaska tribal lands Other Professionals (Line 22): Include chiropractors, acupuncturists, physical, speech, and occupational therapists, nutritionists, podiatrists, etc. See Staff by Major Service Category and Appendix A in the UDS Manual for help determining staffing categories. 80
81 Community Health Workers (Line 27c): Lay members of the community who provide outreach and education; include promotoras, health advisors, advocates, and representatives Other Programs and Related Services (Line 29a): Include nonhealth care program staff (e.g., child care, adult day health, job training, housing programs) Quality Improvement (QI) Staff (Line 29b) : Staff who design and have oversight of QI systems; include QI staff, data specialists, statisticians, HIT including EHR designers, and those who design medical forms or conduct analysis of HIT data 81
82 IT Staff (Line 30c): Technology and information systems staff supporting maintenance and operation of computing systems and those managing hardware and software of HIT Report data entry, help desk, and technical assistance in the category of service they support, not here 82
 documented, 2) face-to-face and one-on-one (exception: group and telemedicine for behavioral health), and 3) provided by a provider exercising independent, professional")
83 Report visits by service provider (including paid referral visits) that meet the definitions. Remember: Visits must be 1) documented, 2) face-to-face and one-on-one (exception: group and telemedicine for behavioral health), and 3) provided by a provider exercising independent, professional judgment (and licensed and/or credentialed to count a visit) Not all staff generate visits (the visits column is greyed out) Not all services are counted as visits A visit may consist of multiple services, but only report one visit 83
 Imaging (e.g., sonography, radiology, mammography) Health fairs Immunization drives Dental varnishes or sealants * Are these important to the health of your patients and community?")
84 Health screenings Group visits (except for behavioral health) Tests and ancillary services Outreach Group education Information sessions for prospective patients Patient education Health education classes Laboratory (e.g., blood pressure tests, pregnancy tests) Imaging (e.g., sonography, radiology, mammography) Health fairs Immunization drives Dental varnishes or sealants * Are these important to the health of your patients and community? Yes * Are they countable in the UDS as a visit? No * Do the costs of these activities count? Possibly 84
 Telemedicine/ telehealth vices under the Women, Infants, and Children (WIC) Program Administering (e.g., Buprenorphine or Coumadin) Injections (e.g., vaccines, allergy shots, family planning methods) Agonists or antagonists (e.")

85 Dispensing or Telemedicine Ser administering Health status checks medications Dispensing, whether by a clinical pharmacologist or a pharmacist Follow-up tests or checks (except for behavioral health) Telemedicine/ telehealth vices under the Women, Infants, and Children (WIC) Program Administering (e.g., Buprenorphine or Coumadin) Injections (e.g., vaccines, allergy shots, family planning methods) Agonists or antagonists (e.g., methadone, opioid blockers) Wound care Taking health histories Making referrals for or following up on external referrals * Are these important to the health of your patients and community? Yes * Are they countable in the UDS as a visit? No * Do the costs of these activities count? Possibly 85

86 Nurses: Must meet all the visit definition requirements Common visits that might be counted: Triage, nurse evaluation of patient s medical condition AND patient not seen by another provider, home health care Do not count drug or vaccine administration, other shots, tests, blood draws, or visits where the patient sees another medical provider as a nurse visit Students: Do not count services of students, but count those by a licensed provider MAT: Credit the visit to the credentialed medical or psychiatric staff providing treatment (not as substance abuse) 86
87 Report patients by service category Report an unduplicated count of patients who received at least one countable visit in the service category The same patient may be counted in multiple service categories but only once per category 87
88 Common edit: Medical visits per medical patient varies substantially from national average. CY (4.68); PY National Average (3.13). 88
89 Common edit: Medical visits per medical patient varies substantially from national average. CY (4.68); PY National Average (3.13). What to look for: Calculate by service category: Column B (Visits) Column C (Patients) Nationally on average, patients are seen 3-4 times a year for medical care Similar edits may flag for other service categories if there is a large variance in visits per patient when compared to the national average Possible solutions: Correct errors: Reporting multiple visits per patient per day, for types or quantity of medical services Reporting non-countable interactions as visits Left out a site s visit activity Explain: Situations that resulted in large number of return visits per patient Limited staffing capacity to see patients more frequently 89
90 Tenure for Health Center Staff 90
91 Line Health Center Staff Persons (a) Full and Part Time Total Months (b) Locum, On-Call, etc. Persons (c) 1 Family Physicians blank Blank Blank blank 2 General Practitioners blank Blank Blank blank 3 Internists blank Blank Blank blank 4 Obstetrician/Gynecologists blank Blank Blank blank 5 Pediatricians blank Blank Blank blank 7 Other Specialty Physicians blank Blank Blank blank 9a Nurse Practitioners blank Blank Blank blank 9b Physician Assistants blank Blank Blank blank 10 Certified Nurse Midwives blank Blank Blank blank 11 Nurses blank Blank Blank blank 16 Dentists blank Blank Blank blank 17 Dental Hygienists blank Blank Blank blank 17a Dental Therapists blank Blank Blank blank 20a Psychiatrists blank Blank Blank blank 20a1 Licensed Clinical Psychologists blank Blank Blank blank 20a2 Licensed Clinical Social Workers blank Blank Blank blank 20b Other Licensed Mental Health Providers blank Blank Blank blank 22a Ophthalmologist blank Blank Blank blank 22b Optometrist blank Blank Blank blank 30a1 Chief Executive Officer blank Blank Blank blank 30a2 Chief Medical Officer blank Blank Blank blank 30a3 Chief Financial Officer blank Blank Blank blank 30a4 Chief Information Officer blank Blank Blank blank Total Months (d) 91
 A head count (not FTE) of persons in their current position as of December 31 Months (Columns B and D) Number of consecutive months of service in current position")
92 Report persons and months based on census of staff employed on last day of year for the selected categories Tenure = Months of Continuous Employment Persons (Columns A and C) A head count (not FTE) of persons in their current position as of December 31 Months (Columns B and D) Number of consecutive months of service in current position 92
 Residents Locum tenens On-call providers Offsite contract providers paid based on time Volunteers Non-clinical consultants")
93 Full- and part-time staff (Columns A and B) Employees (full- and part-time or part-year) Onsite contracted staff National Health Service Corps assignees Other staff or consultants (Columns C and D) Residents Locum tenens On-call providers Offsite contract providers paid based on time Volunteers Non-clinical consultants 93
94 Include: Staff who did not work on last day of year but have a scheduled commitment for the coming year Exclude: Staff not employed at end of year Paid referral providers (who work many hours but no regular schedule) Round persons and months up to a whole number Staff may be reported on more than one line if they hold more than one position at end of year Months may pre-date health center grant or look-alike designation 94

95 A physician has been (and continues to be) a pediatrician since January 1, 2014, and becomes medical director on July 13, Count the provider with: 48 months as a pediatrician (Line 5) and 6 months as a medical director (Line 30a2) 95
96 Common edit: Tenure reported for full- and part-time staff on Line 16, Dentists, has increased by more than 12 months per person from the prior year. 96
97 Common edit: Tenure reported for full- and part-time staff on Line 16, Dentists, has increased by more than 12 months per person from the prior year. What to look for: Compares total months per person by line to the prior year Check data when increases exceed one year tenure per person Edits may flag for other staff lines Possible solutions: Correct errors: Changing the category that the person is reported in Inaccurate tracking of staff and their months Explain: Had wrong start date entered in prior year 97
98 Selected Diagnoses and Services Rendered 98
99 Diagnostic Category Applicable ICD-10-CM Code Number of Visits by Diagnosis Regardless of Primacy (a) Number of Patients with Diagnosis (b) Selected Infectious and Parasitic Diseases 1-2. Symptomatic / Asymptomatic HIV B20, B97.35, O98.7-, Z21 Blank Blank 3 Tuberculosis A15- through A19- Blank Blank 4 Sexually transmitted infections A50- through A64- (exclude A63.0), M02.3- Blank Blank 4a. Hepatitis B B16.0 through B16.2, B16.9, B17.0, B18.0, B18.1, B19.10, B19.11, Z22.51 B17.10, B17.11, B18.2, B19.20, B19.21, 4b. Hepatitis C Z22.52 Blank Blank Selected Diseases of the Respiratory System 5 Asthma J45- Blank Blank 6 Chronic obstructive pulmonary diseases J40- through J44-, J47- Selected Other Medical Conditions 7 Abnormal breast findings, female 8 Abnormal cervical findings Blank Blank Blank Blank C50.01-, C50.11-, C50.21-, C50.31-, C50.41-, C50.51-, C50.61-, C50.81-, C50.91-, C79.81, D05-, D48.6-, R92- Blank Blank C53-, C79.82, D06-, R87.61-, R87.810, R Blank Blank 9 Diabetes mellitus E08- through E13-, O24- (exclude O24.41-) Blank Blank I01-, I02- (exclude I02.9), I20- through I25-, 10 Heart disease (selected) I26- through I28-, I30- through I52- Blank Blank 11 Hypertension I10- through I15- Blank Blank 12 Contact dermatitis and other eczema L23- through L25-, L30- (exclude L30.1, L30.3, L30.4, L30.5), L55- through L59- (exclude L57.0 through L57.4) Blank Blank *Excerpted from Table 6A 99
 (Lines 15-17) Mental Health and Substance Abuse Diagnoses (Lines 18-20d) Diagnostic Tests/Screening/Preventive Services (Lines 21-26d) Dental Services (Lines 27-34)")
100 Medical Conditions: Infections and Parasitic Diseases (Lines 1-4b) Diseases of the Respiratory System (Lines 5-6) Other Medical Diagnoses (Lines 7-14a) Childhood Diagnoses (limited to ages 0 through 17) (Lines 15-17) Mental Health and Substance Abuse Diagnoses (Lines 18-20d) Diagnostic Tests/Screening/Preventive Services (Lines 21-26d) Dental Services (Lines 27-34) 100

101 Report the number of visits with the selected service or diagnosis in Column A Report the number of unduplicated patients receiving the service or with the diagnosis in Column B 101
102 Report only diagnoses made by a medical, dental, mental health, substance abuse, or vision provider Report only services provided as part of a countable visit If a patient has more than one reportable service or diagnosis during a visit, count each The same patient can have multiple visits during the year Do not count multiple services of same type conducted at one visit as separate visits (e.g., filling two teeth, different immunizations at same visit) 102

103 A patient was seen at the health center during the year for the following services: 1/12/17: Diagnosed by physician with hypertension; also got a flu shot 3/30/17: Further evaluation with nurse practitioner for hypertension; diagnosed with tobacco use; cessation counseling provided 12/11/17: Received emergency dental services from dentist Results: Line Category Visits Patient 11. Hypertension a. Tobacco use disorder a. Seasonal Flu vaccine c. Smoke and tobacco use cessation counseling Emergency Dental Services


 Do not count")

104 Count if: Health center provider orders and performs the service Test is ordered and paid for by the health center Sample is collected at health center and sent to a reference lab for processing (regardless of payment) Do not count tests or services performed by other entities where the health center does not pay for the service 104
105 Common edit: Total dental visits on Table 6A are less than or equal to the total dental visits reported on Table 5. This is unusual because dental visits often include more than one service, so on Table 6A each dental service would be counted on the corresponding line, but on Table 5 the combined services would be shown as one visit. 105
106 Common edit: Total dental visits on Table 6A are less than or equal to the total dental visits reported on Table 5. This is unusual because dental visits often include more than one service, so on Table 6A each dental service would be counted on the corresponding line, but on Table 5 the combined services would be shown as one visit. Possible solutions: What to look for: Data on Table 6A relates to data on Table 5 Review table and codes to ensure no data missing on Table 6A Correct errors: Only one line on Table 6A is reflecting visits for multiple services provided at that visit (e.g., oral exam, sealant, fluoride) Table 5 is reflecting multiple services conducted at one visit as multiple visits Explain: Significant dental activity that has no corresponding dental code Limited services provided to patients 106
107 Learn more about your patients and identify potential errors in the report by calculating the average number of visits per patient Calculation: Column A (Visits) Column B (Patients) The next 2 slides show averages using 2016 UDS national data How does your health center compare? 107
108 Number of Visits by Number of Patients with Diagnostic Category Applicable ICD-10-CM Code Diagnosis Regardless Visits Per Patient Diagnosis (b) of Primacy (a) Selected Infectious and Parasitic Diseases 1-2. Symptomatic / Asymptomatic HIV B20, B97.35, O98.7-, Z21 634, , Tuberculosis A15- through A19-17,871 9, Sexually transmitted infections A50- through A64- (exclude A63.0), M , , B16.0 through B16.2, B16.9, B17.0, 4a. Hepatitis B B18.0, B18.1, B19.10, B19.11, 93,983 46, Z b. Hepatitis C B17.10, B17.11, B18.2, B19.20, B19.21, Z , , Selected Diseases of the Respiratory System 5 Asthma J45-2,184,904 1,196, Chronic obstructive pulmonary diseases J40- through J44-, J47-1,514, , Selected Other Medical Conditions C50.01-, C50.11-, C50.21-, C50.31-, 7 Abnormal breast findings, female C50.41-, C50.51-, C50.61-, C50.81-, C50.91-, C79.81, D05-, D48.6-, R92-8 Abnormal cervical findings C53-, C79.82, D06-, R87.61-, R87.810, R Diabetes mellitus E08- through E13-, O24- (exclude O24.41-) I01-, I02- (exclude I02.9), I20-10 Heart disease (selected) through I25-, I26- through I28-, I30- through I52-172, , , , ,699,943 2,283, ,761, , Hypertension I10- through I15-10,995,226 4,335, Contact dermatitis and other eczema L23- through L25-, L30- (exclude L30.1, L30.3, L30.4, L30.5), L55- through L59- (exclude L57.0 through L57.4) 886, , *Excerpted from Table 6A 108
109 Service Category Applicable ICD-10-CM Code Number of Visits (a) Number of Patients (b) Visits Per Patient Selected Diagnostic Tests/Screening/Preventive Services CPT 4: 86689; 21. HIV test ; 1,612,535 1,422, a. Hepatitis B test CPT-4: 86704, 86706, , , b. Hepatitis C test CPT-4: , , , Mammogram 23. Pap tests CPT-4: 77052, OR ICD-10 Z12.31 CPT-4: ; , or ICD-10: Z01.41-, Z01.42, Z , , ,096,335 1,951, *Excerpted from Table 6A 109
110 Clinical Measures 110
111 Preventive Routine Chronic Diseases Early Entry into Prenatal Care Cervical Cancer Screening Use of Appropriate Medications for Asthma Low Birth Weight Childhood Immunization Status Weight Assessment and Counseling for Nutrition and Physical Activity of Children and Adolescents Colorectal Cancer Screening Preventive Care and Screening: Body Mass Index (BMI) Screening and Follow- Up Plan Preventive Care and Screening: Tobacco Use: Screening and Cessation Intervention Coronary Artery Disease (CAD): Lipid Therapy Ischemic Vascular Disease (IVD): Use of Aspirin or Another Antiplatelet HIV Linkage to Care Dental Sealants for Children between 6-9 Years Preventive Care and Screening: Screening for Depression and Follow-Up Plan Controlling High Blood Pressure Diabetes: Hemoglobin A1c (HbA1c) Poor Control (>9%) 111
112 Measure Description Denominator (Universe) Numerator Exclusions/Exceptions Specification Guidance UDS Reporting Considerations Describes the quantifiable indicator to be evaluated Patients who fit the detailed criteria described for inclusion in the measure Patients included in the denominator whose records meet the measurement standard for the measure Patients not to be considered for the measure or included in the denominator CMS measure guidance that assists with understanding and implementation of ecqms BPHC best practices and guidance to be applied to the measure 112
113 Most measures align with ecqms (measure numbers and links are provided to assist you) Major differences between UDS and ecqms include: Those noted under UDS Reporting Considerations Visit types differences: UDS asks for patients who have had a medical visit (dental patients for the dental measure) Do not exclude patients just because they were seen only for urgent care, family planning, or acute care or had only one visit at the health center UDS measurement period is a fixed calendar year 113
114 ecqm Link: 114
115 Prenatal Care Delivery Outcomes 115

116 Report universe of prenatal patients, women who delivered, and their birth outcomes No sampling permitted Measures to report and major differences from prior year: Table 6B Section Description ecqm Lines 7-9 Major Differences from 2016 to 2017 Early Entry into Prenatal Care No ecqm None 7 Part A Low Birth Weight No ecqm None 116
117 Table 6B: Section A: Lines 1-6 Prenatal Care Provided by Referral Only 0 Blank (Check if Yes) Section A - Age Categories for Prenatal Patients: Demographic Characteristics of Prenatal Care Patients Line Age Number of Patients (a) 1 Less than 15 Years Blank 2 Ages Blank 3 Ages Blank 4 Ages Blank 5 Ages 45 and over Blank 6 Total Patients (Sum lines 1-5) Blank Table 6B: Section B: Lines 7-9 Women Having Women Having First First Visit with Visit with Another Line Early Entry into Prenatal Care Health Center Provider (a) (b) 7 First Trimester blank Blank 8 Second Trimester Blank Blank 9 Third Trimester Blank blank 117
118 Report all prenatal care patients who received directly or were referred for prenatal care services. Include women who were: Provided all prenatal care by the health center, including delivery Provided all prenatal care by the health center but were referred for delivery Provided some prenatal care but were later referred for care and delivery Diagnosed and referred with no prenatal care provided by the health center (for referral-only programs and certain high-risk referrals) 118
119 Report age as of June 30 Report regardless of whether they began prenatal care at health center or were referred to it Mark the check box if your health center provides prenatal care to patients through direct referral only 119

120 Include women who began prenatal care in the: Previous year, continued care, and delivered in the current reporting period Current year and who delivered during the current reporting year Current year but who will not deliver until the next reporting period Do not include patients who only had tests, vitamins, assessments, or education and did not have a prenatal care physical exam 120
121 Denominator Women seen for prenatal care during the year Report women in the trimester they began prenatal care (not when referral was made) Count in Column A if care began at your health center or referred for care by your health center Count in Column B if care began with another provider Numerator Exclusions Women who began prenatal care during their first trimester (Line 7, Columns A+B) None 121
, end of the 2nd trimester changed from end of 26 week to end of 27 week, and 3rd trimester starts at 28 week Total women by trimester of entry on Lines 7-9, Columns A + B, must equal")
122 ecqm Number Major differences from prior year Major differences from ecqm None None None Reminders In 2016, trimester of entry changed to be based on last menstrual period (vs. conception), end of the 2nd trimester changed from end of 26 week to end of 27 week, and 3rd trimester starts at 28 week Total women by trimester of entry on Lines 7-9, Columns A + B, must equal total prenatal women reported on Line 6, Column A Only report women who transferred into your care after seeing another provider in Column B If you referred women to other providers for all their prenatal care, report the trimester of their first prenatal visit with the other provider in Column A Include women who began prenatal care in 2016 and delivered in
123 Table 7: Line 0: Number of health center patients who are pregnant and are HIV positive Table 7: Line 2: Number of women who had deliveries performed by health center clinicians, including deliveries to non-health center patients (e.g., on-call, emergency deliveries) Note: These counts are regardless of whether the health center provided prenatal care to the patients Section A: Deliveries and Birth Weight Line Description Patients 0 HIV Positive Pregnant Women blank 2 Deliveries Performed by Health Center's Providers blank 123
124 Prenatal Care Patients Live Births: Live Births: Live Births: Line Who Delivered During the Race and Ethnicity <1500 grams 2500 grams # Year grams (1b) (1d) (1a) (1c) on> <blank for demonstrati Hispanic/Latino <section divider cell> <section divider cell> <section divider cell> <section divider cell> 1a Asian <blank for demonstration> <blank for demonstration> <blank for demonstration> <blank for demonstration> 1b1 Native Hawaiian <blank for demonstration> <blank for demonstration> <blank for demonstration> <blank for demonstration> 1b2 Other Pacific Islander <blank for demonstration> <blank for demonstration> <blank for demonstration> <blank for demonstration> 1c Black/African American <blank for demonstration> <blank for demonstration> <blank for demonstration> <blank for demonstration> 1d American Indian/Alaska Native <blank for demonstration> <blank for demonstration> <blank for demonstration> <blank for demonstration> 1e White <blank for demonstration> <blank for demonstration> <blank for demonstration> <blank for demonstration> 1f More than One Race <blank for demonstration> <blank for demonstration> <blank for demonstration> <blank for demonstration> 1g Unreported/Refused to Report Race <blank for demonstration> <blank for demonstration> <blank for demonstration> <blank for demonstration> on> <blank for demonstrati Subtotal Hispanic/Latino <cell not reported> <cell not reported> <cell not reported> <cell not reported> on> <blank for demonstrati Non-Hispanic/Latino <section divider cell> <section divider cell> <section divider cell> <section divider cell> 2a Asian <blank for demonstration> <blank for demonstration> <blank for demonstration> <blank for demonstration> 2b1 Native Hawaiian <blank for demonstration> <blank for demonstration> <blank for demonstration> <blank for demonstration> 2b2 Other Pacific Islander <blank for demonstration> <blank for demonstration> <blank for demonstration> <blank for demonstration> 2c Black/African American <blank for demonstration> <blank for demonstration> <blank for demonstration> <blank for demonstration> 2d American Indian/Alaska Native <blank for demonstration> <blank for demonstration> <blank for demonstration> <blank for demonstration> 2e White <blank for demonstration> <blank for demonstration> <blank for demonstration> <blank for demonstration> 2f More than One Race <blank for demonstration> <blank for demonstration> <blank for demonstration> <blank for demonstration> 2g Unreported/Refused to Report Race <blank for demonstration> <blank for demonstration> <blank for demonstration> <blank for demonstration> on> <blank for demonstrati Subtotal Non-Hispanic/Latino <cell not reported> <cell not reported> <cell not reported> <cell not reported> <blank for demonstrati Unreported/Refused to Report on> Ethnicity h Unreported/Refused to Report Race and Ethnicity i Total <cell not reported> <cell not reported> <cell not reported> <cell not reported> <section divider cell> <section divider cell> <section divider cell> <section divider cell> <blank for demonstration> <blank for demonstration> <blank for demonstration> <blank for demonstration> 124
125 Column 1a: Prenatal care patients who delivered during the measurement year Include delivery regardless of outcome Do not include women with no documentation that delivery occurred Do not include women who had a miscarriage Even if the delivery is of twins or triplets or is a stillbirth, report only one woman as having delivered 125
126 Denominator (Columns 1b+1c+1d) Numerator (Columns 1b+1c) Exclusions Babies born during the measurement period to prenatal care patients Babies born with a birth weight below normal (under 2,500 grams) Stillbirths (mother is counted on Table 6B, delivery is counted on Table 7, but birth weight is not counted) Miscarriages (mother is counted only on Table 6B) 126
127 ecqm Number Major differences from prior year Major differences from ecqm None None None Reminders Report babies according to their birth weight in grams: o Very low (Column 1b) = Less than 1,500 grams o Low (Column 1c) = 1,500 grams through 2,499 grams o Normal (Column 1d) = 2,500 grams or greater The higher the percentage of babies born below normal birth weight, the poorer the outcome Report race and ethnicity of mother and baby separately Report all live births separately by birth weight Report mothers in prenatal program and their babies, even if prenatal care or delivery was done by a nonhealth center provider Prenatal Women Deliveries Birth Outcomes Review outcomes against overall patient population mix 127
128 Common edit: All prenatal patients are reported as having their first prenatal visit with another provider (Lines 7-9 Column B). Only report women who transferred into your care after seeing another provider in Column B. If your health center has referred women to other providers for all their prenatal care (no prenatal care at your center), report the trimester that they had the visit with the other provider, but report them in Column A. 128
129 Common edit: All prenatal patients are reported as having their first prenatal visit with another provider (Lines 7-9 Column B). Only report women who transferred into your care after seeing another provider in Column B. If your health center has referred women to other providers for all their prenatal care (no prenatal care at your center), report the trimester that they had the visit with the other provider, but report them in Column A. What to look for: For each prenatal care patient, determine who initiated prenatal care Possible solutions: Correct errors: Women referred out for all their prenatal care were reported in Column B but should be in Column A Explain: All prenatal patients transferred from another organization to your providers 129
130 Common edit: The total women who delivered on Table 7 seems high when compared to the total women in prenatal care on Table 6B. 130
131 Common edit: The total women who delivered on Table 7 seems high when compared to the total women in prenatal care on Table 6B. Possible solutions: What to look for: Calculate women who delivered as a percent of prenatal patients: Table 7, Line i, Column 1a Table 6B, Line 6, Column A Typical range is about 50-60% of women in program deliver Edit may appear for unusually high or low percent Correct errors: Missing women in prenatal count but delivery included Only including women who began and delivered in current year Counting multiple babies born as separate women who delivered For low percent, missing birth outcomes for significant number of women Explain: Changes in prenatal program (e.g., your providers not taking new prenatal patients, external prenatal provider closed practice) 131
132 Non-Prenatal Measures Column Logic Reporting Options 132
133 Universe (Denominator) (Column A): Identify all patients in the initial patient population (universe) and report this total Universe is unique for each measure; defined in terms of characteristics such as age, gender, clinical condition, service provided Number in Review (Column B): Report one of the following: Universe Reduced Universe Number greater than or equal to 80% of universe A random sample of 70 patient charts Use only if you do not have at least 80% of all patient records in the HIT/EHR for the measure or if the missing cases would bias the findings Note: Sampling can result in ineligibility for Health Center Quality Improvement Awards Performance (Numerator) (Column C or F): Report the number of records (from Column B) that meet the measurement standard The numerator divided by Column B is the percentage of patients meeting the measurement standard 133
134 Example of using a reduced universe New location added that was not yet fully integrated into EHR system It is a general practice site and sees a variety of patients of all ages The site is still ramping up and accounts for less than 10% of your total practice Since most of the data is in the EHR, report using a partial universe (since at least 80% of the records are present in the EHR) See example numbers below Example: Section C - Childhood Immunization Status Line Childhood Immunization Status Total Patients with 2nd Birthday (a) Number Charts Sampled or EHR total (b) Number of Patients Immunized (c) 10 MEASURE: Percentage of children 2 years of age who received age appropriate vaccines by their 2nd birthday
135 Quality of Care Measures Lines
136 Report on quality of care measures Process measures serve as a proxy for good long-term health outcomes Patients who receive timely routine and preventive care are more likely to have improved health status By identifying patients who use tobacco, we can provide cessation counseling and reduce the probability of cancer, asthma, emphysema, and other tobacco-related illnesses. 136
137 Line Description ecqm Major Differences from 2016 to Childhood Immunization Status CMS117v5 None 11 Cervical Cancer Screening CMS124v5 12 Weight Assessment and Counseling for Nutrition and Physical Activity for Children and Adolescents CMS155v5 None Numerator = Added concurrent cervical cytology/human papillomavirus (HPV) co-testing for those age performed in measurement period or the four years prior (retained women age who had cervical cytology performed during measurement period or two years prior) 13 14a 16 Preventive Care and Screening: Body Mass Index (BMI) Screening and Follow-Up Plan Preventive Care and Screening: Tobacco Use: Screening and Cessation Intervention Use of Appropriate Medications for Asthma CMS69v5 CMS138v5 None CMS126v5 Numerator = Deleted separate parameters for patients age 65 and older. Normal parameters are now age 18 years and older BMI was greater than or equal to 18.5 and less than 25 kg/m2 Exclusions = Now excludes patients with obstructive chronic bronchitis Numerator = Dispensing of medications changed to ordering of medications 137
138 Line Description ecqm Major Differences from 2016 to Coronary Artery Disease (CAD): Lipid Therapy No ecqm None 18 Ischemic Vascular Disease (IVD): Use of Aspirin or Another Antiplatelet CMS164v5 Exclusions = Now excludes patients using anticoagulant medications Numerator = No longer specifies other antithrombotic. Changed to patients who had an active medication of aspirin or another antiplatelet 19 Colorectal Cancer Screening CMS130v5 None 20 HIV Linkage to Care No ecqm None 21 Preventive Care and Screening: Screening for Depression and Follow-Up Plan CMS2v6 Numerator = Screening is now required for depression, rather than clinical depression 22 Dental Sealants for Children between 6-9 Years CMS277v0 None 138
139 Childhood Immunizations Childhood Weight Dental Sealants for Children 139
140 Number Total Patients Number of Table Charts Childhood Immunization with 2nd Patients 6B, Sampled or Status Birthday Immunized Line EHR Total (a) (c) (b) MEASURE: Percentage of children 2 years of age 10 who received age appropriate vaccines by their 2nd birthday Blank Blank Blank 140
141 Denominator Children who turn 2 years of age during the measurement period and who had a medical visit during the measurement period Include children seen for acute or chronic conditions (not just those seen for well-child care) Numerator Exclusions For each vaccine, children who were fully immunized, had documented history of illness, had a seropositive test result, or had an allergic reaction to the vaccine by their second birthday None 141
")
 3 hepatitis B (Hep B) 1 chicken")
 2 or 3 rotavirus (RV) 2 influenza")
142 ALL of the following vaccines are required: 4 diphtheria, tetanus, and acellular pertussis (DTP/DTaP) 3 polio (IPV) 1 measles, mumps, rubella (MMR) 3 H influenza type B (Hib) 3 hepatitis B (Hep B) 1 chicken pox VZV (Varicella) 4 pneumococcal conjugate (PCV) 1 hepatitis A (Hep A) 2 or 3 rotavirus (RV) 2 influenza (flu) vaccines 142

143 ecqm Number Major differences from prior year Major differences from ecqm CMS117v5 None None Reminders Do not count notes that patient is up to date. Record must list the dates of all immunizations and names of immunization agents Good faith efforts do not meet the measurement standard, including: o Failure to bring patient in o Refusal for personal or religious reasons Be sure to include patients: o Who turned two during the year (do not include other ages), even if they were not seen before they turned two o Whose only medical visit is for acute or urgent care 143
144 Table 6B, Line 12 Number of Weight Assessment and Total Patients Number Charts Patients with Counseling for Nutrition and Aged 3 through Sampled or EHR Counseling Physical Activity for Children 17 Total and BMI and Adolescents (a) (b) Documented (c) MEASURE: Percentage of patients 3-17 years of age with a BMI percentile, and counseling Blank Blank Blank on nutrition and physical activity documented 144
145 Denominator Numerator Exclusions Patients 3 through 17 years of age with at least one medical visit during the measurement period Children and adolescents who had the following during the measurement period: Their BMI percentile (not just BMI or height and weight) recorded and Counseling for nutrition and Counseling for physical activity All three elements must have occurred in order to meet the measurement standard Patients who had a diagnosis of pregnancy during the measurement period 145
146 ecqm Number Major differences from prior year CMS155v5 None Major differences from ecqm ecqm denominator is limited to outpatient visits with a primary care physician (PCP) or obstetrician / gynecologist (OB/GYN). UDS includes children seen by nurse practitioners and physician assistants BMI, nutrition, and activity are calculated separately in the ecqm, but combined in the UDS to meet the measurement standard Reminders Include children and adolescents in the evaluation of this measure if they had any medical visit with the health center during the year Do not count well-child visits as automatically meeting the measurement standard 146
 (c) (a) MEASURE: Percentage of children 6 through 9 years of 22 age, at moderate to high risk of caries who received a sealant on a first permanent molar blank Blank blank")
147 Total Patients Number of Aged 6 through 9 Charts Table Patients Dental Sealants for Children at Moderate to Sampled 6B, with Sealants between 6-9 Years High Risk for or EHR Total Line to First Molars Caries (b) (c) (a) MEASURE: Percentage of children 6 through 9 years of 22 age, at moderate to high risk of caries who received a sealant on a first permanent molar blank Blank blank 147
148 Denominator Numerator Exclusions Children 6 through 9 years of age with an oral assessment or comprehensive or periodic oral evaluation dental visit and are at moderate to high risk for caries in the measurement period Children who received a sealant on a permanent first molar tooth during the measurement period Children for whom all first permanent molars are nonsealable (i.e., molars are either decayed, filled, currently sealed, or un-erupted/missing) 148

149 ecqm Number CMS277v0 Major differences None from prior year Major differences from ecqm Note: Although draft ecqm reflects age 5 through 9 years of age, use age 6 through 9 as measure steward intended Reminders Include patients who had a dental visit with the health center or with another dental provider through a paid referral You must determine risk level, not count all dental patients of this age range in universe Risk level is a finding at the patient-level, not a population-based factor such as low socio-economic status If risk level or tooth placement is unknown for patients, pull a sample to help identify this information 149
150 What do these measures have in common? Preventive care for children Action required for all relevant patients (e.g., immunizations, sealants, counseling on nutrition, counseling on physical activity) Multiple components that must all be met (e.g., all vaccinations, counseling on nutrition and on physical activity) 150

151 Cervical Cancer Screening Colorectal Cancer Screening Adult BMI Tobacco Screening Depression Screening 151
152 Total Female Number Number of Table Patients Charts Patients 6B, Cervical Cancer Screening Aged 23 Sampled or Tested Line through 64 EHR Total (c) (a) (b) MEASURE: Percentage of women years of age, who were screened for cervical cancer blank Blank blank 152
153 Denominator Women 23 through 64 years of age with a during the measurement period medical visit Numerator Exclusions Women with one or more screenings for cervical cancer. Either: Cervical cytology during the measurement year or the two years prior to the measurement year Women age with cervical cytology/human papillomavirus (HPV) co-testing during the measurement year or four years prior (Women must have been at least 21 at time of test) Women who had a hysterectomy with no residual cervix 153

154 ecqm Number Major differences from prior year Major differences from ecqm CMS124v5 Numerator = Added back concurrent cervical cytology/hpv co-testing for those age performed in measurement period or the four years prior None Reminders Documentation in the medical record must include date of test, who performed it, and test result Do not count in the numerator: o Referrals to third parties without documentation of results o Statements from patient that it was done without documentation o Refusal of patient to have the test Include women in the evaluation of this measure if they had any medical visit during the year, regardless of the nature of the visit Include patients who were provided obstetrics / gynecological services elsewhere 154
155 Number of Patients with Total Patients Table Charts Sampled Appropriate Aged 50 6B, Colorectal Cancer Screening or EHR Total Screening for through 75 Line (b) Colorectal (a) Cancer (c) MEASURE: Percentage of patients 50 through 75 years of 19 age who had appropriate screening for colorectal cancer 155
156 Denominator Numerator Exclusions Patients 50 through 75 years of age with a medical visit during the measurement period Patients with one or more screenings for colorectal cancer. Appropriate screenings include: Colonoscopy during the measurement period or the nine years prior to the measurement period Flexible sigmoidoscopy during the measurement period or the four years prior to the measurement period Fecal occult blood test (FOBT), including the fecal immunochemical test (FIT), during the measurement period Patients with a diagnosis of colorectal cancer or a history of total colectomy 156
 DNA colorectal cancer screening tests, such as Cologuard, do not meet the measurement standard 157")
157 ecqm Number Major differences from prior year Major differences from ecqm CMS130v5 None None Reminders There are two FOBT test options: Guaiac fecal occult blood test (gfobt) and the immunochemical-based fecal occult blood test (ifobt - commonly known as a FIT test) DNA colorectal cancer screening tests, such as Cologuard, do not meet the measurement standard 157
 (b) Appropriate (c) MEASURE: Percentage of patients 18 years of age and older with (1) BMI documented 13 and (2) follow-up plan documented if BMI is")
158 Number of Patients with Total Patients Number Charts Table Preventive Care and Screening: BMI Charted and Aged 18 and Sampled or EHR 6B, Body Mass Index (BMI) Follow-Up Plan Older Total Line Screening and Follow-Up Plan Documented as (a) (b) Appropriate (c) MEASURE: Percentage of patients 18 years of age and older with (1) BMI documented 13 and (2) follow-up plan documented if BMI is outside normal parameters 158
159 Denominator Numerator Exclusions Patients 18 years of age or older on the date of the visit with at least one medical visit during the measurement year Patients with: 1. A documented BMI (not just height and weight) during their visit or during the previous six months of that visit, and 2. When the BMI is outside of normal parameters, a follow-up plan is documented during the visit or during the previous six months of the current visit Patients who are pregnant Patients receiving palliative care Patients who refuse measurement of height and/or weight or refuse follow-up Patients with a documented medical reason 159

160 ecqm Number Major differences from prior year Major differences from ecqm CMS69v5 Numerator: Normal BMI parameters are now the same for all adults (No longer different for adults age 65 and older) Normal BMI for patients 18 and older is 18.5 and < 25 None Reminders Patients with a documented medical reason, include: o Patients 65 or older for whom weight reduction/weight gain would complicate other underlying health conditions o Patients in an urgent or emergent medical situation where time is of the essence and to delay treatment would jeopardize the patient s health status Include adults in the evaluation of this measure if they had any medical visit during the year, regardless of the nature of the visit Measurement is required for all medical patients seen during the reporting year 160
161 Number of Patients Total Patients Number Charts Assessed for Table Preventive Care and Screening: Aged 18 and Sampled or EHR Tobacco Use and 6B, Tobacco Use: Screening and Older Total Provided Line Cessation Intervention (a) (b) Intervention if a Tobacco User (c) MEASURE: Percentage of patients aged 18 years of age and older who (1) were screened for tobacco use one 14a or more times within 24 months and if identified to be a tobacco user (2) received cessation counseling intervention 161

162 Denominator Numerator Exclusions Patients aged 18 years and older seen for at least two medical visits in the measurement year or at least one preventive medical visit during the measurement period Patients who 1. Were screened for tobacco use at least once within 24 months before the end of the measurement period, and 2. When identified to be a tobacco user, they received tobacco cessation intervention Documentation of medical reason(s) for not screening for tobacco use (e.g., limited life expectancy, other medical reason) 162
163 ecqm Number Major differences from prior year Major differences from ecqm CMS138v5 None None Reminders Remember to count in the numerator both patients with a negative screening result AND those with a positive screening who had cessation services provided Include all forms of tobacco, but exclude e-cigarettes, in the screening Tobacco cessation services include patients who: o Received tobacco use cessation counseling services, or o Received an order (a prescription or a recommendation to purchase an over the counter [OTC] product) for a tobacco use cessation medication, or o Are on (using) a tobacco use cessation agent 163
164 Number of Patients Total Screened for Charts Table Preventive Care and Screening: Patients Depression and Sampled or 6B, Screening for Depression and Aged 12 Follow-Up Plan EHR Total Line Follow-Up Plan and Older Documented as (b) (a) Appropriate (c) MEASURE: Percentage of patients 12 years of age and older who were (1) screened for 21 depression with a standardized tool and, if screening was positive, (2) had a follow-up plan documented 164
165 Denominator Numerator Exclusions Patients aged 12 years and older with at least one medical visit during the measurement period Patients who: 1. Were screened for depression on the date of the visit using an age-appropriate standardized tool and, 2. If screened positive for depression, a follow-up plan is documented on the date of the positive screen Patients with an active diagnosis for depression or a diagnosis of bipolar disorder Patients: Who refuse to participate Who are in urgent or emergent situations Whose functional capacity or motivation to improve impacts the accuracy of results 165
166 ecqm Number Major differences from prior year Major differences from ecqm CMS2v6 Screening is now required for depression, rather than clinical depression None Reminders Patients who are in ongoing treatment for depression are not included in the universe Note: PHQ-9 (patient health questionnaire) or another form of further screening as follow-up from a positive PHQ-2 is permitted Clinical depression is also known as major depression or major depressive disorder and is not what the measure screens for Depression can include situational or medicationinduced depression Remember to count in the numerator both patients with a negative screening result AND those with a positive screening who had a follow-up plan 166
167 What do these measures have in common? Adult BMI, tobacco, depression require a follow-up plan if positive test result Both negative screening result and positive screening result with follow-up count toward measurement standard Look-back period is used for cervical cancer, colorectal cancer, and tobacco screening checks 167
168 What do these measures have in common? Adult BMI and depression screening must be done every year Medical reasons for not screening is at the discretion of the provider and must be documented in the patient records (allowed for adult BMI, tobacco, depression only) 168
169 Common edit: You are reporting 115% of total possible medical patients in the universe for the Cervical Cancer Screening measure (Line 11, Column A). This appears high compared to estimated medical patients in the age group being measured. 169
170 Common edit: You are reporting 115% of total possible medical patients in the universe for the Cervical Cancer Screening measure (Line 11, Column A). This appears high compared to estimated medical patients in the age group being measured. What to look for: Look at universe for reasonableness of total patients in universe Include medical patients of the age range and with the specific measure criteria in the count Edit may appear for high or low universes and for each of the clinical measures on Table 6B Possible solutions: Correct errors: Including non-medical patients, patients ages 21-23, or hysterectomies Including only primary care patients Explain: Confirm verified patients meet all criteria with date of birth as of January 1 170

171 Asthma CAD: Lipid Therapy IVD: Aspirin Therapy HIV Linkage to Care 171
172 Number of Total Patients Aged Number Charts Table Patients with Use of Appropriate 5 through 64 with Sampled or 6B, Acceptable Medications for Asthma Persistent Asthma EHR Total Line Plan (a) (b) (c) MEASURE: Percentage of patients 5 through 64 years 16 of age identified as having persistent asthma and were appropriately ordered medication Blank Blank Blank 172


173 Denominator Numerator Exclusions Patients 5 through 64 years of age with persistent asthma with a medical visit during the measurement period Patients who were ordered at least one prescription for a preferred therapy during the measurement period Patients with an active diagnosis of emphysema, chronic obstructive pulmonary disease, obstructive chronic bronchitis, cystic fibrosis, or acute respiratory failure during the measurement period 173
174 ecqm Number Major differences from prior year Major differences from ecqm CMS126v5 Exclusions: Now also excludes patients with obstructive chronic bronchitis Numerator: Dispensing of medications changed to ordering of medications Note: ecqm is no longer e-certified Reminders Preferred therapy includes patients who: o Received a prescription for or were using an inhaled corticosteroid, or o Received a prescription for or were using an acceptable pharmacological agent, specifically inhaled steroid combinations, anti-asthmatic combinations, antibody inhibitor, leukotriene modifiers, mast cell stabilizers, or methylxanthines Query system to identify only those patients with persistent asthma (not mild or intermittent asthma) 174
 Therapy (a) (c) MEASURE: Percentage of patients 18 years of age and 17 older with a diagnosis of CAD who were prescribed a lipid lowering therapy Blank Blank Blank")
175 Number of Total Patients Number Charts Patients Table Aged 18 and Coronary Artery Disease (CAD): Sampled or EHR Prescribed A 6B, Older with Lipid Therapy Total Lipid Lowering Line CAD Diagnosis (b) Therapy (a) (c) MEASURE: Percentage of patients 18 years of age and 17 older with a diagnosis of CAD who were prescribed a lipid lowering therapy Blank Blank Blank 175
176 Denominator Numerator Exclusions Patients 18 years of age and older with an active diagnosis of CAD or diagnosed as having had a myocardial infarction (MI) or had cardiac surgery in the past, with a medical visit during the measurement period and at least two medical visits ever Patients who received a prescription for or were provided or were taking lipid lowering medications during the measurement period Patients whose last low-density lipoprotein (LDL) lab test during the measurement year was less than 130 mg/dl Patients with an allergy to, a history of adverse outcomes from, or intolerance to LDL lowering medications 176
177 ecqm Number Major differences from prior year Major differences from ecqm None None None Reminders Include patients with CAD with no record of measurement year LDL lab test in the denominator, but do not include in the numerator Do not count patients who are receiving a form of treatment other than pharmacologic treatment (e.g., therapeutic lifestyle changes) as meeting the measurement standard 177
178 Total Patients Number of Aged 18 and Patients with Table Ischemic Vascular Disease Older with IVD Charts Sampled Documentation of 6B, (IVD): Use of Aspirin or Diagnosis or or EHR Total Aspirin or Other Line Another Antiplatelet AMI, CABG, or (b) Antiplatelet PCI Procedure Therapy (a) (c) 18 MEASURE: Percentage of patients 18 years of age and older with a diagnosis of IVD or AMI, CABG, or PCI procedure with aspirin or another antiplatelet Blank Blank Blank Notes: AMI = acute myocardial infarction CABG = coronary artery bypass graft PCI = percutaneous coronary interventions 178
 of aspirin or another antiplatelet during the measurement period Patients who had documentation")
179 Denominator Numerator Exclusions Patients 18 years of age and older with a medical visit during the measurement period who had an AMI, CABG, PCI during the 12 months prior to the measurement year or who had an active diagnosis of IVD during the measurement year Patients who an active medication (use) of aspirin or another antiplatelet during the measurement period Patients who had documentation of use of anticoagulant medications at some point in time during the measurement period 179
180 ecqm Number Major differences from prior year Major differences from ecqm CMS164v5 Exclusions = Now excludes patients using anticoagulant medications (e.g., warfarin, heparin, dalteparin) Numerator = No longer specifies other antithrombotic (e.g., clopidogrel, prasugrel). Changed to patients who had an active medication of aspirin or another antiplatelet None Reminders Include in the numerator patients who received a prescription for, were given, or were using aspirin or another antiplatelet drug Be sure you are no longer counting antithrombotic (a broader classification of medications) toward measurement standard 180
181 Total Patients Table First 6B, HIV Linkage to Care Diagnosed Line with HIV (a) 20 MEASURE: Percentage of patients whose first ever HIV diagnosis was made by health center staff between October 1, of the prior year and September 30, of the measurement year and who were seen for follow-up treatment within 90 days of that first ever diagnosis Number of Charts Patients Seen Sampled or Within 90 Days EHR Total of First (b) Diagnosis of HIV (c) 181
182 Denominator Numerator Exclusions Patients first diagnosed with HIV by the health center between October 1 of the prior year through September 30 of the current measurement year and who had at least one medical visit during the measurement period or prior year Note: Timeframe for diagnosis is October 1, 2016, and September 30, 2017 Newly diagnosed HIV patients who received treatment within 90 days of diagnosis. Include patients who: Were newly diagnosed by your health center providers Had a medical visit with your health center provider who initiates treatment for HIV Had a visit with a referral resource who initiates treatment for HIV None 182
183 ecqm Number Major differences from prior year Major differences from ecqm None None None Reminders Only include patients who have never before been diagnosed with HIV anywhere Note that the identification of patients for this measure crosses years and may include prior year patients To confirm HIV diagnosis, patient must receive a reactive initial HIV test confirmed by a positive supplemental HIV (blood) test Medical treatment must be initiated within 90 days of HIV diagnosis, not just a referral made, education provided, or retesting conducted 183
184 Hypertension Diabetes (Sections B and C) 184
185 Report on health outcome and disparities measures Intermediate outcome measures serve as a proxy for good longterm health outcomes If measurable outcomes are improved, then later negative outcomes will be less likely By controlling hypertension, we anticipate seeing fewer incidents of cardiovascular damage, heart attacks, and organ damage. 185
186 Major Differences from Section Description ecqm 2016 to 2017 Part B Controlling High Blood Pressure CMS165v5 None Part C Diabetes: Hemoglobin A1c (HbA1c) Poor Control (>9%) CMS122v5 None 186
187 Hispanic/Latino 1 1a. Asian 1b1. Native Hawaiian 1b2. Other Pacific Islander 1c. Black/African American 1d. American Indian/Alaska Native 1e. White 1f. More Than One Race 1g. Unreported/Refused to Report Race Subtotal Hispanic/Latino Non-Hispanic/Latino 2 2a. Asian 2b1. Native Hawaiian 2b2. Other Pacific Islander 2c. Black/African American 2d. American Indian/Alaska Native 2e. White 2f. More Than One Race 2g. Unreported/Refused to Report Race Subtotal Non-Hispanic/Latino Unreported/Refused to Report Ethnicity h. Unreported /Refused to Report Race and Ethnicity i. Total 3 Outcome data are reported by race and ethnicity for: Section A: Births Section B: Hypertension Section C: Diabetes Report in the corresponding section: (1) Report Hispanic/Latino patients (2) Report patients who are not Hispanic/Latino (3) Report patients who do not report a race or an ethnicity 187
188 <section Section B: Controlling High <section divider cell> <section divider cell> <section divider cell> divider cell> Blood Pressure Line # <blank for demonstr ation> Race and Ethnicity Total Patients 18 through 85 Years of Age with Hypertension (2a) Charts Sampled or EHR Total (2b) Patients with HTN Controlled (2c) Hispanic/Latino <section divider cell> <section divider cell> <section divider cell> 1a Asian <blank for demonstration> <blank for demonstration> <blank for demonstration> 1b1 Native Hawaiian <blank for demonstration> <blank for demonstration> <blank for demonstration> 1b2 Other Pacific Islander <blank for demonstration> <blank for demonstration> <blank for demonstration> 1c Black/African American <blank for demonstration> <blank for demonstration> <blank for demonstration> 1d American Indian/Alaska Native <blank for demonstration> <blank for demonstration> <blank for demonstration> 1e White <blank for demonstration> <blank for demonstration> <blank for demonstration> 1f More than One Race <blank for demonstration> <blank for demonstration> <blank for demonstration> 1g Unreported/Refused to Report Race <blank for demonstration> <blank for demonstration> <blank for demonstration> Subtotal Hispanic/Latino <cell not reported> <cell not reported> <cell not reported> <blank for demonstr ation> Non-Hispanic/Latino <section divider cell> <section divider cell> <section divider cell> 2a Asian <blank for demonstration> <blank for demonstration> <blank for demonstration> 2b1 Native Hawaiian <blank for demonstration> <blank for demonstration> <blank for demonstration> 2b2 Other Pacific Islander <blank for demonstration> <blank for demonstration> <blank for demonstration> 2c Black/African American <blank for demonstration> <blank for demonstration> <blank for demonstration> 2d American Indian/Alaska Native <blank for demonstration> <blank for demonstration> <blank for demonstration> 2e White <blank for demonstration> <blank for demonstration> <blank for demonstration> 2f More than One Race <blank for demonstration> <blank for demonstration> <blank for demonstration> 2g Unreported/Refused to Report Race <blank for demonstration> <blank for demonstration> <blank for demonstration> Subtotal Non-Hispanic/Latino <cell not reported> <cell not reported> <cell not reported> <blank for demonstr ation> h i Unreported/Refused to Report Ethnicity Unreported/Refused to Report Race and Ethnicity Total <section divider cell> <section divider cell> <section divider cell> <blank for demonstration> <blank for demonstration> <blank for demonstration> 188
189 Denominator Numerator Exclusions Patients 18 through 85 years of age who had a diagnosis of essential hypertension within first six months of the measurement period or any time prior with a medical visit during the measurement period Patients whose blood pressure at the most recent visit is adequately controlled (systolic blood pressure (BP) less than 140 mmhg and diastolic BP less than 90 mmhg) Patients with evidence of end-stage renal disease (ESRD), dialysis, or renal transplant before or during the measurement period Patients with a diagnosis of pregnancy during the measurement period 189

190 ecqm Number Major differences from prior year Major differences from ecqm CMS165v5 None None Reminders Do not include patients in the denominator if initial diagnosis of hypertension was made after June 30 th of measurement period Include patients with no test during the year in the denominator, but do not include in the numerator o Report them in Columns 2a and 2b, but not in Column 2c Review crude prevalence rates by taking number with hypertension by race and ethnicity (Table 7) divided by total patients of same race and ethnicity (Table 3B) 190
191 <section divider cell> Line # <blank for demonstrati on> Section C: Diabetes: Hemoglobin A1c Poor Control Race and Ethnicity <section divider cell> <section divider cell> <section divider cell> Total Patients 18 through 75 Years of Age with Diabetes (3a) Charts Sampled or EHR Total (3b) Patients with HbA1c <8% (3d1) Patients with HbA1c >9% Or No Test During Year (3f) Hispanic/Latino <section divider cell> <section divider cell> <section divider cell> 1a Asian <blank for demonstration> <blank for demonstration> <blank for demonstration> 1b1 Native Hawaiian <blank for demonstration> <blank for demonstration> <blank for demonstration> 1b2 Other Pacific Islander <blank for demonstration> <blank for demonstration> <blank for demonstration> 1c Black/African American <blank for demonstration> <blank for demonstration> <blank for demonstration> 1d American Indian/Alaska Native <blank for demonstration> <blank for demonstration> <blank for demonstration> 1e White <blank for demonstration> <blank for demonstration> <blank for demonstration> 1f More than One Race <blank for demonstration> <blank for demonstration> <blank for demonstration> 1g Unreported/Refused to Report Race <blank for demonstration> <blank for demonstration> <blank for demonstration> Subtotal Subtotal Hispanic/Latino <cell not reported> <cell not reported> <cell not reported> <blank for demonstrati on> Non-Hispanic/Latino <section divider cell> <section divider cell> <section divider cell> 2a Asian <blank for demonstration> <blank for demonstration> <blank for demonstration> 2b1 Native Hawaiian <blank for demonstration> <blank for demonstration> <blank for demonstration> 2b2 Other Pacific Islander <blank for demonstration> <blank for demonstration> <blank for demonstration> 2c Black/African American <blank for demonstration> <blank for demonstration> <blank for demonstration> 2d American Indian/Alaska Native <blank for demonstration> <blank for demonstration> <blank for demonstration> 2e White <blank for demonstration> <blank for demonstration> <blank for demonstration> 2f More than One Race <blank for demonstration> <blank for demonstration> <blank for demonstration> 2g Unreported/Refused to Report Race <blank for demonstration> <blank for demonstration> <blank for demonstration> Subtotal Subtotal Non-Hispanic/Latino <cell not reported> <cell not reported> <cell not reported> <blank for demonstrati on> Unreported/Refused to Report Ethnicity <section divider cell> <section divider cell> <section divider cell> h Unreported/Refused to Report Race and Ethnicity i Total <cell not reported> <cell not reported> <cell not reported> <blank for demonstration> <blank for demonstration> <blank for demonstration> 191
192 Denominator Numerator Exclusions Patients 18 through 75 years of age with diabetes with a medical visit during the measurement period Patients whose most recent HbA1c level performed during the measurement year is greater than 9.0 percent or who had no test conducted during the measurement period Patients with a diagnosis of secondary diabetes due to another condition (e.g., gestational or steroid-induced diabetes) 192
193 ecqm Number Major differences from prior year Major differences from ecqm CMS122v5 None Report HbA1c levels as follows: o HbA1c less than 8 percent (Column 3d1) o HbA1c greater than 9 percent or no test during the year (Column 3f) (ecqm only reports this level) Reminders Include patients with Type 1 or Type 2 diabetes Include patients with diabetes regardless of when first diagnosed Note: The higher the percentage of patients with Hba1c of 9 percent or over, the poorer the clinical performance Usually Columns 3d1 + 3f will not equal Column 3b this is because generally there are some patients with HbA1c between 8 and 9 percent (which is not reported) Review crude prevalence rates by taking number with diabetes by race and ethnicity (Table 7) divided by total patients of same race and ethnicity (Table 3B) 193

194 What do these measures have in common? Patients must have diagnosis Some have a prescription component required to meet measurement standard (e.g., asthma, CAD, IVD) 194
195 Common edit: The total number of Native Hawaiian patients with hypertension reported on Table 7 (120) is high compared to total Native Hawaiian patients reported on Table 3B (216). 195
196 Common edit: The total number of Native Hawaiian patients with hypertension reported on Table 7 (120) is high compared to total Native Hawaiian patients reported on Table 3B (216). What to look for: Table 7 race and ethnicity categories must align with Table 3B Edit may appear on any category with high prevalence check unusually high rates Do not default to the unreported race and ethnicity categories Table/Section 3B, Native Hawaiian Line, Column Line 2a, Column D Patient Number 216 Possible solutions: Correct errors: Race and ethnicity captured differently in patient registration and clinical EHR Explain: Community factors that clearly address the high prevalence rates for the specific race or ethnicity 7, Native Hawaiians with Hypertension Lines 1b1 + 2b1, Column 2a 120 Overall Prevalence Hypertension 56% 196
197 Quality of Care and Outcome Measures CY 330 PY 330 CY LAL PY LAL Universes* Childhood Immunization Status 102% 88% 105% 93% Weight Assessment and Counseling for Nutrition and Physical Activity for Children and Adolescents 88% 91% 93% 97% Body Mass Index (BMI) Screening and Follow-up (Adult) 95% 97% 90% 97% Tobacco Use: Screening and Cessation Intervention 76% 86% 76% 90% Cervical Cancer Screening 93% 95% 96% 100% Colorectal Cancer Screening 99% 98% 96% 98% Screening for Clinical Depression and Follow-Up Plan 85% 89% 85% 92% Dental Sealants for Children between 6-9 Years 70% 78% 74% 100% Prevalence* Persistent Asthma 2% 3% 3% 4% Coronary Artery Disease 2% 2% 2% 2% Ischemic Vascular Disease 4% 3% 4% 3% High Blood Pressure 26% 23% 26% 23% Diabetes 14% 13% 15% 15% New Diagnosis of HIV 0.04% 0.04% 0.04% 0.04% * Estimated percent of patients based on average percent of medical care provided by health centers (85% for 330 grantees, 89% for look-alikes) Note: CY = 2016, PY =
198 Common edit: A compliance rate of 100% is reported for the Patients Screened for Depression and Follow-Up measure, Line
199 Common edit: A compliance rate of 100% is reported for the Patients Screened for Depression and Follow-Up measure, Line 21. Possible solutions: What to look for: Correct errors: Review count in Column C in Universe includes only those from a relation to Column B Determine if the results are feasible based on program initiatives in this area Similar edits may appear for other clinical measures limited registry or system that only has patients who are part of a collaborative or initiative, so universe is missing patients Sampling results were not randomized Explain: Describe initiatives that your health center has engaged in to explain results If total count is very small 199
200 Quality of Care and Outcome Measures HP 2020 CY 330 PY 330 CY LAL PY LAL Performance Measurement Goal Early Entry into Prenatal Care 74.1% 73.0% 70.1% 67.6% 77.9% Low Birth Weight 7.8% 7.6% 7.7% 7.1% 7.8% Childhood Immunization Status 42.8% 77.5% 49.0% 78.7% - Weight Assessment and Counseling for Nutrition and Physical Activity for Children and Adolescents 62.9% 57.9% 70.5% 63.9% - Body Mass Index (BMI) Screening and Follow-up 62.5% 59.4% 58.4% 48.7% - Tobacco Use: Screening and Cessation Intervention 85.2% 82.8% 83.8% 80.8% - Screening for Clinical Depression and Follow-Up Plan 60.3% 50.6% 57.2% 52.4% - Cervical Cancer Screening 54.4% 56.0% 52.7% 58.2% 93.0% Colorectal Cancer Screening 39.9% 38.3% 41.5% 36.4% 70.5% Use of Appropriate Medications for Asthma 87.4% 84.1% 90.3% 83.7% - Coronary Artery Disease (CAD): Lipid Therapy 79.5% 77.9% 74.3% 76.4% - Ischemic Vascular Disease (IVD): Aspirin or Another Antithrombotic 78.4% 78.0% 80.8% 73.9% - HIV Linkage to Care 83.2% 74.7% 76.3% 90.6% - Controlling High Blood Pressure 62.4% 63.8% 63.0% 60.2% 61.2% Diabetes: Hemoglobin A1c Poor Control 32.1% 29.8% 35.2% 33.1% 16.2% Dental Sealants for Children between 6-9 Years 48.7% 42.4% 54.1% 32.6% 28.1% Sources of Data: Aggregate 2016 UDS, Healthy People 2020 Note: CY = 2016, PY =
201 Financial Costs 201
202 Line [blank for section divide] Financial Costs of Medical Care 1. Medical Staff 2. Lab and X-ray 3. Medical/Other Di Cost Center Allocation of Facility Total Cost After Allocation of Accrued Cost and Non-Clinical Facility and Non-Clinical (a) Support Services Support Services (b) (c) [blank for section divide] [blank for section divide] [blank for section divide] [blank for demonstration] [blank for demonstration] [blank for demonstration] [blank for demonstration] [blank for demonstration] [blank for demonstration] rect [blank for demonstration] [blank for demonstration] [blank for demonstration] [blank for demonstration] [blank for demonstration] [blank for demonstration] 4. Total Medical Care Services (Sum Lines 1-3) Financial Costs of Other Clinical Services [blank for section divide] [blank for section divide] [blank for section divide] [blank for section divide] 5. Dental [blank for demonstration] [blank for demonstration] [blank for demonstration] 6. Mental Health [blank for demonstration] [blank for demonstration] [blank for demonstration] 7. Substance Abuse [blank for demonstration] [blank for demonstration] [blank for demonstration] 8a. Pharmacy not including pharmaceuticals [blank for demonstration] [blank for demonstration] [blank for demonstration] 8b. Pharmaceuticals [blank for demonstration] [Cell not reported] [blank for demonstration] 9. Other Professional (Specify: ) [blank for demonstration] [blank for demonstration] [blank for demonstration] 9a. Vision [blank for demonstration] [blank for demonstration] [blank for demonstration] 10. Total Other Clinical Services (Sum Lines 5 through 9a) Financial Costs of Enabling and Other Services [blank for section divide] [blank for demonstration] [blank for demonstration] [blank for demonstration] [blank for section divide] [blank for section divide] [blank for section divide] 11a. Case Management [blank for demonstration] [Cell not reported] [blank for demonstration] 11b. Transportation [blank for demonstration] [Cell not reported] [blank for demonstration] 11c. Outreach [blank for demonstration] [Cell not reported] [blank for demonstration] 11d. Patient and Community Education [blank for demonstration] [Cell not reported] [blank for demonstration] 11e. Eligibility Assistance [blank for demonstration] [Cell not reported] [blank for demonstration] 11f. Interpretation Services [blank for demonstration] [Cell not reported] [blank for demonstration] 11g. Other Enabling Services [blank for demonstration] [Cell not reported] [blank for demonstration] (Specify: ) 11h. Community Health Workers 11. Total Enabling Services Cost [blank for demonstration] [blank for demonstration] [blank for demonstration] (Sum Lines 11a through 11h) 12. Other Related Services (Specify: ) [blank for demonstration] [blank for demonstration] [blank for demonstration] 12a. Quality Improvement 13. Total Enabling and Other Services (Sum Lines 11, 12, and 12a) [blank for demonstration] [blank for demonstration] [blank for demonstration] [blank for section divide] Facility and Non-Clinical Support Services and Totals [blank for section divide] [blank for section divide] [blank for section divide] 14. Facility [blank for demonstration] [Cell not reported] [Cell not reported] 15. Non-Clinical Support Services [blank for demonstration] [Cell not reported] [Cell not reported] 16. Total Facility and Non-Clinical Support Services (Sum Lines 14 and 15) [blank for demonstration] [Cell not reported] [Cell not reported] 17. Total Accrued Costs (Sum Lines ) [blank for demonstration] [Cell not reported] [blank for demonstration] 18. Value of Donated Facilities, Services, and Supplies (specify: ) [Cell not reported] [Cell not reported] [blank for demonstration] 19. Total With Donations (Sum Lines 17 and 18) [Cell not reported] [Cell not reported] [blank for demonstration] 202
203 Accrued Cost Allocation of Facility and Total Cost After Allocation (a) Non-Clinical Support of Facility and Non-Clinical Services Support Services (b) (c) Report accrued direct costs Include costs of: o Staff o Fringe benefits o Supplies o Equipment o Depreciation o Related travel Exclude bad debt Report allocation of facility and nonclinical support services o Allocate to all other cost centers (lines) o This column must equal Line 16, Column A Sum Columns A + B (done automatically in EHB) 203
204 Medical Care Lines 1-4 [blank for section divide] Financial Costs of Medical Care 1. Medical Staff 2. Lab and X-ray 3. Medical/Other Direct 4. Total Medical Care Services (Sum Lines 1-3) Separate medical staff (Line 1) from medical lab and X-ray (Line 2) and from other direct medical costs (Line 3) o This is the only category that separates costs Also include on Line 1: o o Paid medical interns or residents Vouchered or contracted medical services Report staff dedicated to HIT/EHR design and QI on Line 12a, not here, but include cost of medical HIT/EHR system (including depreciation on software and hardware, system training costs, and licensing fees) on Line 3 204
205 Report direct expenses, including personnel (hired and contracted), benefits, supplies, and equipment together for each remaining service category Other Clinical Lines 5-10 Enabling and Other Services Lines 11a-13 [blank for section divide] Financial Costs of Other Clinical Services 5. Dental 6. Mental Health 7. Substance Abuse 8a. Pharmacy not including pharmaceuticals 8b. Pharmaceuticals 9. Other Professional (Specify: ) 9a. Vision 10. Total Other Clinical Services (Sum Lines 5 through 9a) [blank for section divide] Financial Costs of Enabling and Other Services 11a. Case Management 11b. Transportation 11c. Outreach 11d. Patient and Community Education 11e. Eligibility Assistance 11f. Interpretation Services 11g. Other Enabling Services (Specify: ) 11h. Community Health Workers 11. Total Enabling Services Cost (Sum Lines 11a through 11h) 12. Other Related Services (Specify: ) 12a. Quality Improvement 13. Total Enabling and Other Services (Sum Lines 11, 12, and 12a) 205
206 Facility, Non- Clinical Support, and Totals Lines [blank for Facility and Non-Clinical Support Services and Totals section divide] 14. Facility 15. Non-Clinical Support Services 16. Total Facility and Non-Clinical Support Services (Sum Lines 14 and 15) 17. Total Accrued Costs (Sum Lines ) 18. Value of Donated Facilities, Services, and Supplies (specify: ) 19. Total With Donations (Sum Lines 17 and 18) Facility (Line 14): Include health center s rent or depreciation, mortgage interest payments, utilities, security, janitorial services, maintenance, etc. Do not report Facilities Improvement Program/Capital Improvement Program costs Non-Clinical Support Services (Line 15): Include corporate administration, billing, collections, medical records, intake staff, facility and liability insurance, legal fees, and direct support costs (travel, supplies, etc.) Include malpractice insurance in the service categories, not here 206
207 Pharmacy-related considerations: Report all pharmacy costs (including dispensing fees and share of profit ), except the cost of pharmaceuticals, on Line 8a Report pharmaceutical costs, including cost of 340(b) drugs, on Line 8b Report pharmacy assistance program as eligibility assistance on Line 11e, not pharmacy Report space rented out within the health center, adult day health care, WIC, retail pharmacy to non-patients, etc., as other related services on Line
208 Report QI program staff and HIT/EHR system development and analysis but not the cost of hardware, software, and training on Line 12a Report donations ( in-kind ), including services, facilities, supplies, pharmaceutical, and volunteers, on Line
209 1. Distribute facility costs on Line 14, Column A to each cost center in Column B Base allocation on amount of usable square footage utilized by each cost center Tips: Capture differences in costs per building separately, if possible (improvements, donated space, etc.). Allocate areas leased or rented to third parties on Line 12. Do not include common spaces, unless dedicated to a specific service area 209

210 2. Distribute non-clinical support costs on Line 15, Column A to each cost center in Column B Tip Although contracted services do consume some administrative costs, they normally have a lower allocation of overhead. Allocate after facility costs have been allocated to it Base allocation on actual use or straight line method (proportion of net costs to each service category) 210
211 Allocation of Facility and Total Cost After Line Cost Center Accrued Cost Non-Clinical Support Allocation of Facility and (a) Services Non-Clinical Support (b) Services (c) [blank for Financial Costs of Medical Care section [blank for section divide] [blank for section divide] [blank for section divide] divide] 1. Medical Staff 6,914,216,674 3,729,004,517 10,643,221, Lab and X-ray 412,948, ,206, ,155, Medical/Other Direct 1,306,091, ,858,509 2,000,950, Total Medical Care Services (Sum Lines 1-3) 8,633,257,342 4,631,069,609 13,264,326,951 [blank for Financial Costs of Other Clinical Services section [blank for section divide] [blank for section divide] [blank for section divide] divide] 5. Dental 1,848,822, ,489,368 2,753,312, Mental Health 962,491, ,802,628 1,434,294, Substance Abuse 98,088,154 55,521, ,609,793 8a. Pharmacy not including pharmaceuticals 638,672, ,233, ,906,066 8b. Pharmaceuticals 1,491,482,507 [blank for section divide] 1,491,482, Other Professional (Specify: ) 157,457,625 75,297, ,755,362 9a. Vision 83,057,838 43,740, ,798, Total Other Clinical Services (Sum Lines 5 through 9a) 5,280,073,840 1,868,085,427 7,148,159,267 [blank for Financial Costs of Enabling and Other Services section [blank for section divide] [blank for section divide] [blank for section divide] divide] 11a. Case Management 432,569,333 [blank for section divide] 432,569,333 11b. Transportation 46,332,192 [blank for section divide] 46,332,192 11c. Outreach 155,451,112 [blank for section divide] 155,451,112 11d. Patient and Community Education 155,129,104 [blank for section divide] 155,129,104 11e. Eligibility Assistance 210,939,904 [blank for section divide] 210,939,904 11f. Interpretation Services 68,816,386 [blank for section divide] 68,816,386 11g. Other Enabling Services (Specify: ) 32,498,058 [blank for section divide] 32,498,058 11h. Community Health Workers 39,081,639 [blank for section divide] 39,081, Total Enabling Services Cost (Sum Lines 11a through 11h) 1,140,817, ,431,083 1,685,248, Other Related Services (Specify: ) 489,802, ,894, ,697,408 12a. Quality Improvement 170,750,245 76,677, ,428, Total Enabling and Other Services (Sum Lines 11, 12, and 12a) 1,801,370, ,003,910 2,599,374,395 Facility and Non-Clinical Support Services and Totals [blank for section divide] [blank for section divide] [blank for section divide] [blank for section divide] 14. Facility 1,699,731,974 [Cell not reported] [Cell not reported] 15. Non-Clinical Support Services 5,597,426,972 [Cell not reported] [Cell not reported] 16. Total Facility and Non-Clinical Support Services (Sum Lines 14 and 15) 7,297,158,946 [Cell not reported] [Cell not reported] 17. Total Accrued Costs (Sum Lines ) 23,011,860,613 [Cell not reported] 23,011,860, Value of Donated Facilities, Services, and Supplies (specify: ) [Cell not reported] [Cell not reported] 505,499, Total With Donations (Sum Lines 17 and 18) [Cell not reported] [Cell not reported] 23,517,359,

212 Staff and services on Table 5 need to correspond with costs on Table 8A See Table 5 and 8A Crosswalk in Appendix B of UDS Manual Examples below If a staff FTE is allocated across multiple service categories on Table 5, be sure to do the same on Table 8A. Staff FTE on Table 5, Line: 1 12: Medical Providers and Clinical Support Staff 20a 20c: Mental Health 24 28: Enabling (e.g., case management, outreach, eligibility) Have Costs Reported on Table 8A, Line: 1: Medical Staff 6: Mental Health 11a 11h: Enabling Note: Cost categories on Table 8A are not in the same sequential order as they appear on Table 5 212
213 Common edit: Mental health cost per visit is substantially different than the prior year. Current Year ($118.26); Prior Year ($85.64). 213
214 Common edit: Mental health cost per visit is substantially different than the prior year. Current Year ($118.26); Prior Year ($85.64). What to look for: This evaluates the total mental health costs (Table 8A, Line 6, Column C) per mental health visit (Table 5, Line 20, Column B) Edits may flag for other service categories if there is a large difference Possible solutions: Correct errors: An expense item from the general ledger is mistakenly placed in the wrong service category Explain: Change in service levels or change in types of services For example: Adding a mental health worker who does prevention work would add a cost with no visits 214
215 Patient-Related Revenue 215
216 blank Blank blank Blank Retroactive Settlements, Receipts, and Paybacks (c) blank blank blank Collection of Line Payer Category Collection of Other Full Amount Collection of Bad Reconciliatio Payments: Charges Collected Reconciliation/ Penalty/ Sliding Debt n/ Wrap- P4P, Risk Allowances This This Wrap-Around Payback Discounts Write Around Pools, (d) Period Period Previous Years (c4) (e) Off Current Year Withholds, (a) (b) (c2) (f) (c1) etc. (c3) 1. 2a. 2b a. 5b a. 8b. 9. Medicaid Non-Managed Care Medicaid Managed Care (capitated) Medicaid Managed Care (fee-for-service) Total Medicaid (Lines 1 + 2a + 2b) Medicare Non-Managed Care Medicare Managed Care (capitated) Medicare Managed Care (fee-for-service) Total Medicare (Lines 4 + 5a + 5b) Other Public, including Non-Medicaid CHIP (Non-Managed Care) Other Public, including Non-Medicaid CHIP (Managed Care Capitated) Other Public, including Non-Medicaid CHIP (Managed Care fee-forservice) Total Other Public (Lines 7 + 8a + 8b) [blank for demonstration ] [blank for demonstration ] [blank for demonstration ] [blank for demonstration ] [blank for demonstration ] [blank for demonstration ] [blank for demonstration ] [blank for demonstration ] [blank for demonstration ] [blank for demonstration ] [blank for demonstration ] [blank for demonstration ] [blank for demonstration] [blank for demonstration] [blank for demonstration] [blank for demonstration] [blank for demonstration] [blank for demonstration] [blank for demonstration] [blank for demonstration] [blank for demonstration] [blank for demonstration] [blank for demonstration] [blank for demonstration] [blank for demonstration] [blank for demonstration] [blank for demonstration] [blank for demonstration] [blank for demonstration] [blank for demonstration] [blank for demonstration] [blank for demonstration] [blank for demonstration] [blank for demonstration] [blank for demonstration] [blank for demonstration] [blank for demonstration] [blank for demonstration] [blank for demonstration] [blank for demonstration] [blank for demonstration] [blank for demonstration] [blank for demonstration] [blank for demonstration] [blank for demonstration] [blank for demonstration] [blank for demonstration] [blank for demonstration] [blank for demonstration] [blank for demonstration] [blank for demonstration] [blank for demonstration] [blank for demonstration] [blank for demonstration] [blank for demonstration] [blank for demonstration] [blank for demonstration] [blank for demonstration] [blank for demonstration] [blank for demonstration] [blank for demonstration] [blank for demonstration] [blank for demonstration] [blank for demonstration] [blank for demonstration] [blank for demonstration] [blank for demonstration] [blank for demonstration] [blank for demonstration] [blank for demonstration] [blank for demonstration] [blank for demonstration] [blank for demonstration] [blank for demonstration] [blank for demonstration] [blank for demonstration] [blank for demonstration] [blank for demonstration] [blank for demonstration] [blank for demonstration] [blank for demonstration] [blank for demonstration] [blank for demonstration] [blank for demonstration] [not reported] [not reported] [not reported] [not reported] [not reported] [not reported] [not reported] [not reported] [not reported] [not reported] [not reported] [not reported] [not reporte d] [not reporte d] [not reporte d] [not reporte d] [not reporte d] [not reporte d] [not reporte d] [not reporte d] [not reporte d] [not reporte d] [not reporte d] [not reporte d] 216
217 blank Blank blank Blank Retroactive Settlements, Receipts, and Paybacks (c) blank blank blank Collection of Collection of Full Amount Reconciliatio Collection of Bad Reconciliatio Charges Collected n/ Wrap- Other Payments: Penalty/ Sliding Debt n/ Wrap- Allowances Line Payer Category This This Around P4P, Risk Pools, Payback Discounts Write Around (d) Period Period Previous Withholds, etc. (c4) (e) Off Current Year (a) (b) Years (c3) (f) (c1) (c2) [blank for [blank for [not reported] [not reported] [blank for [blank for [not [not Private Non-Managed 10. demonstr demonstrati demonstration] demonstra reported] reporte Care ation] on] tion] d] 11a. 11b. 12. Private Managed Care (capitated) Private Managed Care (fee-for-service) Total Private (Lines a + 11b) 13. Self-pay 14. TOTAL (Lines ) [blank for demonstr ation] [blank for demonstr ation] [blank for demonstr ation] [blank for demonstr ation] [blank for demonstr ation] [blank for demonstrati on] [blank for demonstrati on] [blank for demonstrati on] [blank for demonstrati on] [blank for demonstrati on] [not reported] [not reported] [blank for demonstration] [not reported] [not reported] [blank for demonstration] [not reported] [not reported] [blank for demonstration] [blank for demonstra tion] [blank for demonstra tion] [blank for demonstra tion] [not reported] [not reported] [not reported] [not reported] [blank for demonstration] [blank for demonstration] [blank for demonstration] [blank for demonstra tion] [blank for demonstratio n] [blank for demonstratio n] [blank for demonstratio n] [not reported] [blank for demonstratio n] [not reported] [not reported] [not reported] [blank for demonstrati on] [blank for demonstrati on] [not reporte d] [not reporte d] [not reporte d] [blank for demons tration] [blank for demons tration] 217
218 Report > Charges (2017) > Collections (cash basis) > Supplemental payments > Contractual allowances > Self-pay sliding discounts > Self-pay bad debt write-off By Payer > Medicaid > Medicare > Other Public > Private > Self-pay By Form of Payment > Non-managed care > Capitated managed care > Fee-for-service managed care 218
219 Third-party payers may have three forms of payment Non-Managed Care ( Fee-for-Service ): Payment for services charged (or global fee) on charge slip, encounter form, or bill at an agreed-upon rate (minus co-payments and deductibles) Managed Care (Capitated): Full charges reported, but payment covers list of services specified in contract for a one month period, regardless of volume Managed Care (Fee-for-Service): Same as non-managed care, except patients are assigned to doctor or clinic for primary care with payment made only when charges are reported Include carved out charges and collections for capitated patients here Include wrap-around and reconciliation payments in Medicaid, Medicare, and CHIP programs 219
220 Report the sum of monthly enrollment for twelve months by type of insurance Complete only for managed care contracts where the patient must go to health center for their primary care. Include: There is generally a relationship between: Member months on Table 4 A member month = one member enrolled for one month Capitated plans: For a flat payment per month, services from a negotiated list are provided to patients Fee-for-Service plans: Paid according to the fees established for primary care and other services rendered Example: 36,788 Medicaid member months 12 = 3,066 Insurance categories on Table 4 Example: 4,174 Medicaid patients Managed care lines on Table 9D Example: Medicaid net capitation $1,044,850 member months 36,788 = $28 220

221 Revenue generally relates to patient enrollment data on Table 4 Table 9D exceptions: Report state- or local-based programs that cover a specific service or disease (e.g., BCCCP, Title X) as Other Public Classify charges and collections from contracts with schools, jails, head start, tribes, and workers compensation as Private Reclassify charges each payer is responsible for on the appropriate payer lines (e.g., Medi-Medi, co-payments, deductibles) Affordable Care Act reporting: Medicaid expansion programs = Medicaid State or federal exchanges = Private State or local indigent care programs = Self-pay, not Other Public 221
222 Full Charges This Period (a) Amount Collected This Period (b) Retroactive Settlements, Receipts, and Paybacks (c) Collection of Reconciliation /Wrap-Around Current Year (c1) Collection of Reconciliation/ Wrap- Around Previous Years (c2) Collection of Other Payments: P4P, Risk Pools, Withholds, etc. (c3) Penalty/ Payback (c4) Allowances (d) Sliding Discounts (e) Bad Debt Write Off (f) Report total billed charges by payer source Undiscounted, unadjusted, gross charges for services based on fee schedule Include all service charges (e.g., medical, dental, mental health, vision, pharmacy including contract 340b pharmacy) Do not include charges where no collection is attempted or expected (e.g., enabling services, donated pharmaceuticals, or free vaccines) Do not include capitation or negotiated rate as charge amount Do not include charges for Medicare G-codes To learn more about CMS payment codes visit the CMS website 222
223 Full Charges This Period (a) Amount Collected This Period (b) Retroactive Settlements, Receipts, and Paybacks (c) Collection of Collection of Collection of Other Reconciliation Reconciliation Payments: P4P, /Wrap-Around /Wrap-Around Risk Pools, Current Year Previous Years Withholds, etc. (c1) (c2) (c3) Penalty/ Payback (c4) Allowances (d) Sliding Discounts (e) Bad Debt Write Off (f) Include all payments received in 2017 for services to patients Capitation payments Contracted payments Payments from patients Third-party insurance Retroactive settlements, receipts, and payments Include pay for performance, quality bonuses, and other incentive payments Do not include meaningful use payments from Medicaid and Medicare here report on Table 9E 223
 Collection of Other Payments: P4P, Risk Pools, Withholds, etc.")
224 Amount Collected This Period (b) Collection of Reconciliation /Wrap-Around Current Year (c1) Retroactive Settlements, Receipts, and Paybacks (c) Collection of Reconciliation /Wrap-Around Previous Years (c2) Collection of Other Payments: P4P, Risk Pools, Withholds, etc. (c3) Penalty/ Payback (c4) Payments reported in c1 c4 are part of Column B total, but do not equal Column B Federally qualified health center (FQHC) prospective payment system (PPS) reconciliations (based on filing of cost report) Wrap-around payments (additional amount per visit to bring payment up to FQHC level) Managed care pool distributions Pay for performance (P4P) Other incentive payments Quality bonuses Withholds Court-ordered payments Paybacks or payer deductions by payers because of overpayments (report as a positive number) 224
225 Common edit: A large change from the prior year in collections per medical + dental + mental health visit is reported. Current year ($217.90); prior year ($143.51). 225

226 Common edit: A large change from the prior year in collections per medical + dental + mental health visit is reported. Current year ($217.90); prior year ($143.51). What to look for: Review average amount received for billable visits Possible solutions: Correct errors: Missing or other errors in reported income or visits Collections: Table 9D, Line 14, Column B Visits: Table 5, Lines , Column B Explain: Receipt of an unusual payment that distorts the number Change in billed services 226
227 Common edit: Medicaid non-managed care net retroactive payments exceed 50% of Medicaid non-managed care collections. 227
228 Common edit: Medicaid non-managed care net retroactive payments exceed 50% of Medicaid non-managed care collections. What to look for: Verify that Columns C1 through C4 are included in Column B and subtracted from Column D Edits may flag for any payer line Possible solutions: Correct errors: Did not include retroactive amounts (C Columns) in total collections (B Columns) Only included retroactive amounts and other payments as total collection Explain: Receipt of a large FQHC retroactive or court-ordered payment 228
229 Allowances are agreed upon reductions/write-offs in payment by a third-party payer - Reduce by amount of retroactive payments in C1, C2, and C3 + Add paybacks reported in C4 May result in a negative number Non-payment for services not covered/rejected by a third-party, deductibles, and co-payments due from patients are not allowances Reclassify to second payer For managed care capitated lines (2a, 5a, 8a, and 11a) only, allowances equal the difference between charges and collections (since they do no typically carry a balance) Column D = A B 229

230 Report reductions in patient Based solely on the patient s charges based on their ability documented income and family size to pay as a sliding discount (per federal poverty guidelines) Only patients may be Are generally applied at time of service granted a sliding discount May be applied: To insured patients co-payments, deductibles, and non-covered services Only when charge has been reclassified from original charge line to self-pay May not be applied to past due amounts 230
231 Only report patient bad debt (not third-party payer bad debt) Report on Line 13 Third-party payer bad debt is not reported in the UDS Include amounts owed by patients considered to be uncollectable and formally written off during 2017, regardless of when service was provided Do not change bad debt to a sliding discount Discounts (e.g., to specific groups of patients, cash discounts) or forgiveness is not patient bad debt (or a sliding discount) 231
232 Line Payer Category Full Charges This Period (a) Amount Collected This Period (b) Retroactive Settlements, Receipts, and Paybacks (c) Collection of Collection of Other Reconciliation / Payments: P4P, Wrap-Around Risk Pools, Previous Years Withholds, etc. (c2) (c3) Collection of Reconciliation /Wrap-Around Current Year (c1) Penalty/ Payback (c4) Allowances (d) Sliding Discounts (e) Bad Debt Write Off (f) 13 Self Pay $200 $10 $180 $10 An uninsured patient was seen at the health center. On the day of the service, the patient qualified for a sliding discount that required them to pay 10% of the service charge. The service s full charge is $200 A fee of $20 was charged to the patient (10% of full charge) The patient paid $10 The patient still owed $10 and this was written off by the health center 232
233 It is essential to reclassify service charges that are unpaid in whole or in part by one payer if another payer is responsible for charges Do not reclassify allowances Reclassify co-payments, deductibles, and charges for non-covered services rejected by third-party payers Show collections received by payer on the appropriate line 233

234 Reclassify charges in these situations: When some part of the charge is not paid by the insurance company And the patient has more than one insurance (e.g., dually-eligible) Co-payments and deductibles owed by the patient 1. Determine the amount that can be charged to another payer. 2. Deduct that amount from the original payer line. 3. Add the portion of charges due from the next payer to the appropriate line. 234
235 Line 10 Payer Category Private Non-Managed Care Reclassify Charge Amount Full Collection of Collected Charges Reconciliation This Period This Period /Wrap Around ( b) (a) Current Year (c1) $200 $170 $120 X X Retroactive Settlements, Receipts, and Paybacks (c) Collection of Reconciliation /Wrap Around Previous Years (c2) Collection of Other Payments: P4P, Risk Pools, Withholds, etc. (c3) [blank for demonstrati on] Penalty/ Payback (c4) [blank] Allowances (d) Sliding Discounts (e) $50 X X Bad Debt Write Off (f) X X X X X X X X greyed X 13 Self Pay $30 Service charge = $200 {blank for blank X X X X X Reduce the initial charge of $200 to private insurance by $30 this is the co-pay owed by the patient Reclassify the $30 co-pay to self-pay charges Report $170 with a $50 allowance on the private line X [blank ] [blank ] Report amount collected from private = $120 ($170-$50) 235
236 Common edit: When we subtract collections (Column B) and adjustments (Column D) from your total Medicare charges (Column A), there is a large difference (51.96)%. 236
237 Common edit: When we subtract collections (Column B) and adjustments (Column D) from your total Medicare charges (Column A), there is a large difference (51.96)%. What to look for: Eventually, charges should be collected or adjusted off Edits may flag for other payers if there is a large balance Check data when charges greatly exceed collections plus adjustments or vice-versa Possible solutions: Correct errors: Moving co-payment collections but not the charges Failing to record allowances in a timely manner Explain: Delay in billing to or processing payments from Medicare Timing issue due to delay in credentialing or billing numbers for providers 237
238 Common edit: More collections and write-offs are reported than charges for self-pay, Line 13. Please review that proper re-allocations of all deductibles and co-payments to the self-pay category are being done. 238
239 Common edit: More collections and write-offs are reported than charges for self-pay, Line 13. Please review that proper re-allocations of all deductibles and co-payments to the self-pay category are being done. What to look for: Self-pay charges will be collected or written off as sliding discount or bad debt and some will still be owed at end of year (includes collections of prior year s charges) Possible solutions: Correct errors: Reporting co-pay as self-pay collection but failing to reclassify the charge to self-pay Significant state or local indigent care program income reported as a sliding discount but failing to report charges Explain: Concerted effort to collect outstanding receivables Large amount of uncollectable bad debt write-offs from a prior year now written off 239
240 Other Revenue 240
 1j Capital Improvement Program Grants(excluding ARRA) 1k Capital Development Grants, including School Based Health Center Capital Grants 1 Total")
241 Line Source Amount (a) BPHC Grants (Enter Amount Drawn Down - Consistent with PMS-272) 1a Migrant Health Center 1b Community Health Center 1c Health Care for the Homeless 1e Public Housing Primary Care 1g Total Health Center (Sum lines 1a through 1e) 1j Capital Improvement Program Grants(excluding ARRA) 1k Capital Development Grants, including School Based Health Center Capital Grants 1 Total BHPC Grants ((Sum Lines 1g +1j +1k) Other Federal Grants 2 Ryan White Part C HIV Early Intervention 3 Other Federal Grants (specify: ) Medicare and Medicaid EHR Incentive Payments for Eligible 3a Providers 5 Total Other Federal Grants (Sum lines 2-3a) Non-Federal Grants Or Contracts 6 State Government Grants and Contracts (specify: ) 6a State/Local Indigent Care Programs (specify: ) 7 Local Government Grants and Contracts (specify: ) 8 Foundation/Private Grants and Contracts (specify: ) 9 Total Non-Federal Grants and Contracts (Sum lines 6+6a+7+8) 10 Other Revenue (Non-patient related revenue not reported elsewhere) (specify: ) 11 Total Revenue (Sum lines ) 241
242 Report non-patient income received during 2017 BPHC grants Other federal grants Non-federal grants or contracts Other non-patient-related revenue Report on a cash basis Include income that supported activities described in your scope of services Use the specify fields to clarify source of grants and contracts reported 242
243 Use last party rule Report funds from the entity from which you received them Do not report on the line of original source of funds If your center received funds from another health center and they received the funds from the Indian Health Service (IHS), report the income on Line
244 Report BPHC grants drawn down in 2017 Report funds received directly from BPHC regardless of their end use Include even if passed through to another agency Include: Health Center Program grants by type Capital improvement grants Capital development grants BPHC Grants (Enter Amount Drawn Down - Consistent with PMS-272) 1a Migrant Health Center 1b Community Health Center 1c Health Care for the Homeless 1e Public Housing Primary Care Total Health Center (Sum lines 1a 1g through 1e) Capital Improvement Program 1j Grants(excluding ARRA) Capital Development Grants, 1k including School Based Health Center Capital Grants 1 Total BHPC Grants ((Sum Lines 1g +1j +1k) 244
245 Ryan White Part C Funds, Line 2 Part A is usually reported on Line 7, Local Part B is usually reported on Line 6, State Report Part D as Other Federal, Line 3 Other Federal Grants, Line 3 Grants received directly from the federal government, other than BPHC Include grants that are paid directly from the U.S. Treasury Medicare and Medicaid EHR Incentive Payments for Eligible Providers, Line 3a Report Meaningful Use funds Include funds paid to providers and turned over to the health center (only exception to the last party rule) 245
246 State, Line 6 and Local, Line 7 From state or local governments Line 6 and 7, respectively Report non-health service delivery grants (e.g., WIC, outreach) Do not include indigent care programs here Do not include fee-for-service payments (e.g., family planning and cancer detection programs) report these on Table 9D 246
247 Foundation/Private Grants or Contracts, Line 8 From foundations or private organizations (e.g., another health center, a primary care association) Other Revenue, Line 10 Report other cash unrelated to charge-based services Do not report in-kind or non-monetary donations here Include contributions, fundraising income, rents, sales, interest income, patient record fees, pharmacy sales to the public, etc. Do not report net income from pharmacy here-report charges and collections on Table 9D 247
248 Table Line Report 4 7 9D 13 9E 6a Patient as uninsured Not other public Charges, collections, bad debt (if any) as self-pay, balance not owed by patient as sliding fee Funds received from state and local program that subsidize/pay for health care (general) services to uninsured and IHS PL Compact funds Based on a current or prior level of service or lump sum per visit (not fee-for-service) Private contracts with tribes are to be reported as private, on Table 9D Do not report these funds on both Tables 9D and 9E 248
249 249 Common edit: When comparing cash income to accrued expenses a large surplus or deficit is reported. Surplus or deficit = $ (1,335,591); percent surplus or deficit (6.78)%.
250 Common edit: When comparing cash income to accrued expenses a large surplus or deficit is reported. Surplus or deficit = $ (1,335,591); percent surplus or deficit (6.78)%. Possible solutions: What to look for: Correct errors: Compare cash income from patient services (Table 9D, Line 14, Column B) and other sources (Table 9E, Line 11, Column A) to total accrued costs (Table 8A, Line 17, Column C) and calculate a percent gain or loss If number is large, make sure you had a large increase or decrease in net worth This is an indicator of cash flow and may be triggered by a typo Explain: If you received a large lump sum retro payment during the year Significant billing and collection delay (e.g., staff turnover) Your center experienced a large profit or loss Large change in grants 250
251 Parting Instructions 251
. Check your data before you submit!")
252 Adhere to definitions and instructions in the UDS Manual. Address edits in EHB by correcting issues or providing good, detailed explanations. The number is correct is not a sufficient response. Work as a team (tables are interrelated). Check your data before you submit! Review last year s reviewer letter and work with your reviewer to correct your report. 252
253 253 WHO WHAT WHERE WHEN Health Activities Through EHB By February centers from starting 15, 2018, funded or January 1, January 1, with a review designated period prior to December between October 1 31, 2017, February 15, in scope of 2018, and project March 31, 2018
254 Regional in-person UDS trainings Manual, tables, fact sheets, webinars, data, online training modules, modernization efforts, and other technical assistance materials, including PALs Telephone and support line for reporting questions and use of UDS data 866-UDS-HELP ( ) or Technical support from a UDS reviewer during the review period 254
255 EHB Access (PDCE, UDS submission, and reports) mon/accesscontrol/login.aspx UDS Mapper EHB Support (see handout) HRSA Call Center for EHB access and roles: or BPHC Help Desk for EHB system issues: or 255
256 National Cooperative Agreements pca/natlagreement.html Primary Care Associations/Primary Care Offices pca/associations.html National Association of Community Health Centers 256
257 Health information technology Health Information Technology, Evaluation, and Quality (HITEQ): hiteqcenter.org Public housing Community Health Partners for Sustainability: National Center for Health in Public Housing: Sexual orientation and gender identity National LGBT Health Education Center: Oral health National Network for Oral Health Access: Agricultural workers Migrant Clinicians Network: National Center for Farmworker Health: Homeless National Health Care for the Homeless Council: nhchc.org Corporation for Supportive Housing: 257
258 ecqi Resource Center Clinical Quality Measures Guidance/Legislation/EHRIncentivePrograms/eCQM_Library.html United States Health Information Knowledgebase (USHIK) 202&sortField=570&sortDirection=ascending&resultsPerPage=100&fi lter590=april+2014+eh&filter590=july+2014+ep&enableasynchron ousloading=true National Quality Forum ONC Issue Tracking System (OITS) for ecqm inquiries 258
259 Healthy People spx?topicid=8 Adjusted Quartile Ranking Million Hearts Hypertension Control Change Package U.S. Preventive Services Task Force CDC National Center for Health Statistics State Facts Health Center Quality Improvement Awards uality/index.html 259
260 Are there issues that you have encountered related to UDS that you would like to share (state-specific reporting, consensus on handling issues, etc.)? Are there any final questions that you would like to discuss before we leave today? 260

261 Remember to call the UDS Support Line if you have additional content questions: UDS-HELP or Thank you for attending this training and for all of your hard work to provide comprehensive and accurate data to BPHC! 261
1/9/2018. Bureau of Primary Health Care
 Bureau of Primary Health Care 2 1 Introduction to the Uniform Data System (UDS): Who, What, When, Where, Why 2017 UDS Changes and 2018 UDS Proposed Changes UDS Modernization Step-by-Step UDS Table Instructions
UDS Training Calendar Year 2016
 UDS Training Calendar Year 2016 Bureau of Primary Health Care Agenda Introduction to the Uniform Data System (UDS): Who, What, When, Where, Why 2016 UDS Changes and 2017 UDS Proposed Changes Definitions
UDS UDS: UNIFORM DATA SYSTEM. General Information UNIFORM DATA SYSTEM WHAT IS THE UDS? WHAT TABLES DO I SUBMIT? REPORTING REQUIREMENTS:
 : General Information WHAT IS THE? The Uniform Data System () is a standardized reporting system that provides consistent information about health centers. The includes: The number and socio-demographic
ZIP CODE. Other Zip Codes Unknown Residence
 ZIP CODE Zip Code Other Zip Codes Unknown Residence TOTAL Patients Note: This is a representation of the form; however the actual on line input process will look significantly different, as may the printed
Reporting Instructions for 2017 Health Center Data
 R T I N G I N S T R U C T I O N S F O R 2 0 1 7 H E A LT H C E N T E R D ATA U N IRFE P OO R M D ATA S Y S T E M Reporting Instructions for 2017 Health Center Data Bureau of Primary Health Care 2017 UDS
Bureau of Primary Health Care UDS Tables
 Bureau of Primary Health Care 2017 UDS Tables Table Patients by ZIP Code Reporting Period: January 1, 2017, through December 31, 2017 ZIP Code None/Uninsured Medicaid / CHIP / Other Public (c) Medicare
UDS UDS: UNIFORM DATA SYSTEM. Patients by ZIP Code UNIFORM DATA SYSTEM TABLE TIPS: PURPOSE: CHANGES: KEY TERMS: HOW DATA ARE USED:
 : Patients by ZIP Code PURPOSE: The Patients by ZIP Code Table identifies patients by both their ZIP code of residence and their primary medical insurance. CHANGES: There are no changes to the ZIP Code
PROGRAM ASSISTANCE LETTER
 PROGRAM ASSISTANCE LETTER DOCUMENT NUMBER: PAL 2016 02 DATE: March 22, 2016 DOCUMENT TITLE: Approved Uniform Data System Changes for Calendar Year 2016 TO: Health Centers Primary Care Associations Primary
Bureau of Primary Health Care
 Bureau of Primary Health Care UNIFORM DATA SYSTEM (UDS) Calendar Year 2010 UDS Reporting Instructions for Section 330 Grantees For help contact: 866-837-4357 (866-UDS-HELP) or udshelp330@bphcdata.net BUREAU
BPHC UDS Training Reference Materials
 BPHC UDS Training 2011 Issued October, 2011 U.S. Department of Health and Human Services Health Resources and Services Administration Reference Materials Today s Handouts: Copy of the presentation slides
Reference Guide for UDS Data Reports Available to Health Centers CY 2016
 Reference Guide for UDS Data Reports Available to Health Centers CY 2016 Introduction: This Reference Guide is a companion document to the CY 2016 BPHC UDS data reports that are available to health centers
Uniform Data System Calendar Year 2014
 Uniform Data System Calendar Year 2014 Bureau of Primary Health Care Agenda Brief introduction to UDS 2014 changes 2015 proposed changes Definitions used in the UDS report Step by step instructions for
Analysis and Use of UDS Data
 Analysis and Use of UDS Data Welcome and thanks for dropping by to learn about how to analyze and use the valuable UDS data you are reporting! Please click START to begin. Welcome If you have attended
CHCANYS NYS HCCN ecw Webinar
 CHCANYS NYS HCCN ecw Webinar Meaningful Use, V10 and UDS January 30, 2013 Stephanie Rose, Project Director Desiree Railine, HIT Implementation Specialist/Trainer Agenda Meaningful Use Stage 1 2014 Review
The Affordable Care Act, HRSA, and the Integration of Behavioral Health Services
 The Affordable Care Act, HRSA, and the Integration of Behavioral Health Services Indiana Council of Community Mental Health Centers Ft. Wayne, Indiana May 19, 2011 David B. Bingaman, LCSW, ACSW U.S. Department
An Introduction to MPCA and Federally Qualified Health Centers~ Partners for Quality Care
 An Introduction to MPCA and Federally Qualified Health Centers~ Partners for Quality Care AIM Partnership Forum June 5, 2014 Lynda C. Meade, MPA Director of Clinical Services Michigan Primary Care Association
UNIFORM DATA SYSTEM. Calendar Year 2012 Bureau of Primary Health Care
 UNIFORM DATA SYSTEM Calendar Year 2012 Bureau of Primary Health Care Agenda Brief Introduction to UDS See Webinars for more Available Assistance 2012 Changes; 2013 Proposed Changes Definitions Step-by-Step
2018 MGMA Practice Operations Survey Guide
 2018 MGMA Practice Operations Survey Guide Due Date: April 13, 2018 This document is intended to serve as a guide for completing the 2018 MGMA Practice Operations Survey. An explanation of each survey
June 2018 COMMUNITY HEALTH CENTER CHART
 June 2018 COMMUNITY HEALTH CENTER CHART About Community Health Centers The National Association of Community Health Centers (NACHC) is pleased to present Community Health Center Chartbook, an overview
Appendix 5. PCSP PCMH 2014 Crosswalk
 Appendix 5 Crosswalk NCQA Patient-Centered Medical Home 2014 July 28, 2014 Appendix 5 Crosswalk 5-1 APPENDIX 5 Crosswalk The table compares NCQA s Patient-Centered Specialty Practice () standards with
Bureau of Primary Health Care Update
 Bureau of Primary Health Care Update February 6, 2014 Angela R. Powell, MPH, CPH Director, Southwest Division U.S. Department of Health and Human Services Health Resources and Services Administration Bureau
Roll Out of the HIT Meaningful Use Standards and Certification Criteria
 Roll Out of the HIT Meaningful Use Standards and Certification Criteria Chuck Ingoglia, Vice President, Public Policy National Council for Community Behavioral Healthcare February 19, 2010 Purpose of Today
NEED, RESPONSE, EVALUATIVE MEASURES, RESOURCES/CAPABILITIES, GOVERNANCE
 New Access Point application (2014) Considering Need The following selected excerpts on need were taken from the most recent New Access Point (NAP) funding announcement. Although each new HRSA funding
Russell B Leftwich, MD
 Russell B Leftwich, MD Chief Medical Informatics Officer Office of ehealth Initiatives, State of Tennessee 1 Eligible providers and hospitals can receive incentives for meaningful use of certified EHR
HARBOR CARE HEALTH & WELLNESS CENTER Patient Intake Form Please print clearly. Please ask for assistance in completing this form if needed.
 Today date: HARBOR CARE HEALTH & WELLNESS CENTER Patient Intake Form Please print clearly. Please ask for assistance in completing this form if needed. Patient Full Name: Of Birth: Street: City: Zip Code:
Dear Kaniksu Patient,
 Dear Kaniksu Patient, Welcome to Kaniksu Health Services (KHS), a Community Health Center that provides quality and affordable medical, pediatric, dental, behavioral health and veteran care, regardless
Medicare & Medicaid EHR Incentive Programs
 Medicare & Medicaid EHR Incentive Programs Southwest Regional Health Care Compliance Association Conference February 18, 2011 Travis Broome, Special Assistant for Quality Improvement and Survey & Certification
Module 1 Program Description
 Module 1 Program Description Palliative Care Program Description 1. What type(s) of communities does your palliative care program serve? Check all that apply. Urban Suburban Rural 2. Which counties does
Welcome to The Brevard Health Alliance
 Welcome to The Brevard Health Alliance The Brevard Health Alliance, Inc. (BHA) is a Community Health Center serving Brevard County residents providing comprehensive medical services to all residents. It
Health Center Program Update
 Health Center Program Update NACHC Policy & Issues Forum March 14, 2018 Jim Macrae Associate Administrator, Bureau of Primary Health Care (BPHC) Health Resources and Services Administration (HRSA) 3/22/2018
April L. Lyons, MSN, RN Director of Clinical Operations Westside Family Healthcare
 April L. Lyons, MSN, RN Director of Clinical Operations Westside Family Healthcare U.S. Incarceration Rates The incarceration rate of the United States is the highest in the world, at 716 per 100,00 of
Adult Health History
 Adult Health History Name: DOB: Please list medications, including: vitamins, herbs, homeopathic remedies, and nonprescription medicines on the attached medication sheet. Medical History: High blood pressure
2017 Home Health Survey. Part A : General Information. Part B : Survey Contact Information. 1. Identification UID: 2.
 2017 Home Health Survey Part A : General Information 1. Identification UID: Facility Name: County: Street Address: City: Zip: Mailing Address: Mailing City: Mailing Zip: Medicaid Provider? Check the box
The Health Center Program
 The Health Center Program MassLeague of Community Health Centers Community Health Institute, 2017 May 3, 2017 Judith Steinberg, MD, MPH Chief Medical Officer Bureau of Primary Health Care (BPHC) Health
Appendix 4 CMS Stage 1 Meaningful Use Requirements Summary Tables 4-1 APPENDIX 4 CMS STAGE 1 MEANINGFUL USE REQUIREMENTS SUMMARY
 Appendix 4 CMS Stage 1 Meaningful Use Requirements Summary Tables 4-1 APPENDIX 4 CMS STAGE 1 MEANINGFUL USE REQUIREMENTS SUMMARY 1. Use CPOE (computerized physician order entry) for medication orders directly
2017 SPECIALTY REPORT ANNUAL REPORT
 2017 SPECIALTY REPORT ANNUAL REPORT National Commission on Certification of Physician Assistants Table of Contents Message from the President... 3 About the Data Collection and Methodology...4 All Specialties....
Measures Reporting for Eligible Providers
 Meaningful Use White Paper Series Paper no. 5a: Measures Reporting for Eligible Providers Published September 4, 2010 Measures Reporting for Eligible Providers The fourth paper in this series reviewed
Financing SBIRT in Primary Care: The Alphabet Soup and Making Sense of it
 Financing SBIRT in Primary Care: The Alphabet Soup and Making Sense of it CAPT Hernan Reyes, MD Deputy Regional Administrator, HRSA Region 6 July 13, 2016 Objectives Understand the role of HRSA within
PCSP 2016 PCMH 2014 Crosswalk
 - Crosswalk 1 Crosswalk The table compares NCQA s Patient-Centered Specialty Practice (PCSP) 2016 standards with NCQA s Patient-Centered Medical Home (PCMH) 2014 standards. The column on the right identifies
Diversity & Disparities: A Benchmark Study of U.S. Hospitals.
 Diversity & Disparities: A Benchmark Study of U.S. Hospitals http://www.hpoe.org/diversity-disparities Contents Executive Summary...2 Survey Methods...4 Collection and Use of REAL Data...5 Cultural Competency
PCMH 2014 Recognition Checklist
 1 PCMH1: Patient Centered Access 10.00 points Element A - Patient-Centered Appointment Access ~~ MUST PASS 4.50 points 1 Providing same-day appointments for routine and urgent care (Critical Factor) Policy
PCA/HCCN Health Center Program Update
 PCA/HCCN Health Center Program Update National Association of Community Health Centers Community Health Institute August 30, 2016 Tonya Bowers, MHS Acting Associate Administrator Bureau of Primary Health
1. Working as a primary health care NP Please complete the entire questionnaire
 PART 1: EMPLOYMENT STATUS We are interested in hearing whether you are currently employed as an NP. Whether you are employed as an NP or not, it is very important that you complete this questionnaire and
2015 Annual Nursing Home Questionnaire
 2015 Annual Nursing Home Questionnaire Part A : General Information 1. Identification UID: Facility Name: County: Street Address: City: Zip: Mailing Address: Mailing City: Mailing Zip: Medicaid Provider?
If you require films or CD, kindly give us 48 hour notice or make technologist aware at the time of your study.
 A Note to Our Patient: Your physician will be receiving a copy of your results via fax within two business days. Please contact your physician to go over your results and to obtain a copy of your report.
APPENDIX 2 NCQA PCMH 2011 AND CMS STAGE 1 MEANINGFUL USE REQUIREMENTS
 Appendix 2 NCQA PCMH 2011 and CMS Stage 1 Meaningful Use Requirements 2-1 APPENDIX 2 NCQA PCMH 2011 AND CMS STAGE 1 MEANINGFUL USE REQUIREMENTS CMS Meaningful Use Requirements* All Providers Must Meet
Family Care Health Centers
 Family Care Health Centers New/Established Patient Information (Please Print) Account # Date: Circle One: New Patient or Established Patient Last: First: M.I. Date of Birth: Address: City: State: Zip:
PATIENT CENTERED. Medical Home. Attestation. Facility Compliance
 2 0 1 7 Attestation PATIENT CENTERED Medical Home of Facility Compliance State of Wyoming, Department of Health, Division of Healthcare Financing Check the Patient Centered Medical Home (PCMH) Programs
STATE FISCAL YEAR 2017 ANNUAL NURSING HOME QUESTIONNAIRE (ANHQ) July 1, 2016 through June 30, 2017
 July 1, 2016 through June 30, 2017") STATE FISCAL YEAR 2017 ANNUAL NURSING HOME QUESTIONNAIRE (ANHQ) July 1, 2016 through June 30, 2017 - IMPORTANT NOTICE ABOUT SURVEY ACCURACY AND COMPLIANCE The information and data collected through this
STATE FISCAL YEAR 2017 ANNUAL NURSING HOME QUESTIONNAIRE (ANHQ) July 1, 2016 through June 30, 2017 - IMPORTANT NOTICE ABOUT SURVEY ACCURACY AND COMPLIANCE The information and data collected through this
PROPOSED MEANINGFUL USE STAGE 2 REQUIREMENTS FOR ELIGIBLE PROVIDERS USING CERTIFIED EMR TECHNOLOGY
 PROPOSED MEANINGFUL USE STAGE 2 REQUIREMENTS FOR ELIGIBLE PROVIDERS USING CERTIFIED EMR TECHNOLOGY On February 23, the Centers for Medicare & Medicaid Services (CMS) posted the much anticipated proposed
2017 Freestanding Ambulatory Surgery Center Survey
 2017 Freestanding Ambulatory Surgery Center Survey Part A : General Information 1. Identification UID: Facility Name: County: Street Address: City: Zip: Mailing Address: Mailing City: Mailing Zip: 2. Report
Hale Ola Kino Maika i
 We ve teamed up to make it easier for students to access healthcare in their school! Together, we are your School-Based Health Center! Waianae High School (WHS) is proud to partner with Waianae Coast Comprehensive
Medicare and Medicaid EHR Incentive Program. Stage 3 and Modifications to Meaningful Use in 2015 through 2017 Final Rule with Comment
 Medicare and Medicaid EHR Incentive Program Stage 3 and Modifications to Meaningful Use in 2015 through 2017 Final Rule with Comment Measures, and Proposed Alternative Measures with Select Proposed 1 Protect
The Health Center Program Quality Improvement
 The Health Center Program Quality Improvement National Network for Oral Health Access Annual Conference November 8, 2016 Vy Nguyen, DDS, MPH Dental Officer, Office of Quality Improvement Bureau of Primary
RHY Project Intake Form (Runaway & Homeless Youth Projects)
") RHY Project Intake Form (Runaway & Homeless Youth Projects) Step 1: Universal Data Collection Please complete the following basic client information and note that all fields with an * are required fields.
RHY Project Intake Form (Runaway & Homeless Youth Projects) Step 1: Universal Data Collection Please complete the following basic client information and note that all fields with an * are required fields.
MEDICARE ENROLLMENT, HEALTH STATUS, SERVICE USE AND PAYMENT DATA FOR AMERICAN INDIANS & ALASKA NATIVES
 American Indian & Alaska Native Data Project of the Centers for Medicare and Medicaid Services Tribal Technical Advisory Group MEDICARE ENROLLMENT, HEALTH STATUS, SERVICE USE AND PAYMENT DATA FOR AMERICAN
PCMH 2014 Standards and Guidelines
 PCMH 2014 Standards and Guidelines 28 NCQA Patient-Centered Medical Home (PCMH) 2014 April 13, 2015 PCMH 1: Patient-Centered Access 29 PCMH 1: Patient-Centered Access 10.00 points provides access to team-based
PCMH 2014 Standards and Guidelines
 PCMH 2014 Standards and Guidelines 28 2014 PCMH Recognition November 21, 2016 PCMH 1: Patient-Centered Access 29 PCMH 1: Patient-Centered Access 10.00 points provides access to team-based care for both
AMERICAN INDIAN 638 CLINICS PROVIDER MANUAL Chapter Thirty-nine of the Medicaid Services Manual
 AMERICAN INDIAN 638 CLINICS PROVIDER MANUAL Chapter Thirty-nine of the Medicaid Services Manual Issued December 1, 2009 Claims/authorizations for dates of service on or after October 1, 2015 must use the
School-Based Health Center William Penn High School 713 E. Basin Road New Castle, DE Phone: Fax:
 School-Based Health Center William Penn High School 713 E. Basin Road New Castle, DE 19720 Phone: 324 5740 Fax: 324 5745 Dear Parents/Guardians: The William Penn School Based Health Center (SBHC) is a
Oklahoma Department of Career and Technology Education
 Oklahoma Department of Career and Technology Education Information Commons September 2016 Oklahoma Healthcare Practitioners and Technical Occupations Parameters Occupations Code Description 29-0000 Healthcare
Measures Reporting for Eligible Hospitals
 Meaningful Use White Paper Series Paper no. 5b: Measures Reporting for Eligible Hospitals Published September 5, 2010 Measures Reporting for Eligible Hospitals The fourth paper in this series reviewed
School-Based Health Center Wilmington Charter/Cab Calloway High Schools 100 N. Dupont Road Wilmington, DE Phone: Fax:
 Dear Parents/Guardians: School-Based Health Center Wilmington Charter/Cab Calloway High Schools 100 N. Dupont Road Wilmington, DE 19807 Phone: 651-2100 Fax: 651-2111 The Wilmington Charter/Cab Calloway
Health Centers Overview. Health Centers Overview. Health Care Safety-Net Toolkit for Legislators
 Health Centers Overview Health Centers Overview Health Care Safety-Net Toolkit for Legislators Health Centers Overview Introduction Federally Qualified Health Centers (FQHCs), also known as health centers,
Responsible Party Information (Information used for patient balance statements) Responsible Party Another Patient Guarantor Self
 Responsible Party Another Patient Guarantor Self") Patient Information (Please Print) Dr. Miss Mr. Mrs. Sir Patient s Name (Last) (First) (MI) Previous Name Address Line 1 City, State ZIP Home Phone Cell No. Work Phone Ext. Primary Care Provider (PCP)
Patient Information (Please Print) Dr. Miss Mr. Mrs. Sir Patient s Name (Last) (First) (MI) Previous Name Address Line 1 City, State ZIP Home Phone Cell No. Work Phone Ext. Primary Care Provider (PCP)
SO YOU WANT TO START A HEALTH CENTER?
 SO YOU WANT TO START A HEALTH CENTER? A Practical Guide for Starting a Federally Qualified Health Center January 2005 7200 Wisconsin Avenue, Suite 210 Bethesda, MD 20814 Ph 301.347.0400 FX 301.347.0459
Colorado s Health Care Safety Net
 PRIMER Colorado s Health Care Safety Net The same is true for Colorado s health care safety net, the network of clinics and providers that care for the most vulnerable residents. The state s safety net
Meaningful Use FAQs for Behavioral Health
 Netsmart is your Meaningful Use technology partner with all the solutions you need to meet all Stage 1 Meaningful Use criteria so you don t have to integrate products from multiple vendors. For more information,
Health Resources & Services Administration and the Affordable Care Act: Strategies for Increasing Provider Capacity & Retention
 Health Resources & Services Administration and the Affordable Care Act: Strategies for Increasing Provider Capacity & Retention Hal Zawacki, San Francisco Regional Office Health Resources and Services
Meaningful Use of EHR Technology:
 Meaningful Use of EHR Technology: What Do the New Standards and Certification Criteria Mean for Your Organization? January 20, 2010 Mitchell J. Olejko Ropes & Gray LLP mitchell.olejko@ropesgray.com 415-315-6328
Not to be completed by paper. Please complete online.
 2018 Survey of Community Health Centers Experiences and Activities under the Affordable Consent Form and Information Sheet about the Research Study (IRB #: 101705) Not to be completed by paper. Please
Medicare & Medicaid EHR Incentive Programs. Stage 2 Final Rule Jason McNamara Technical Director for Health IT HIMSS Meeting April 25, 2013
 Medicare & Medicaid EHR Incentive Programs Stage 2 Final Rule Jason McNamara Technical Director for Health IT HIMSS Meeting April 25, 2013 What is in the Rule Changes to Stage 1 of meaningful use Stage
PATIENT REGISTRATION FORM (ecw)
") PATIENT INFORMATION PATIENT REGISTRATION FORM (ecw) (Please print) Patient s Name: (Last) (First) (MI) Address: City, State, Zip: Home: Cell: Work: E-Mail Address: DOB: Sex: Female Male Transgender Race:
PATIENT INFORMATION PATIENT REGISTRATION FORM (ecw) (Please print) Patient s Name: (Last) (First) (MI) Address: City, State, Zip: Home: Cell: Work: E-Mail Address: DOB: Sex: Female Male Transgender Race:
TABLE OF CONTENTS. Primary Care 3. Child Health Services. 10. Women s Health Services. 13. Specialist Health Services 16. Mental Health Services.
 TABLE OF CONTENTS Primary Care 3 Child Health Services. 10 Women s Health Services. 13 Specialist Health Services 16 Mental Health Services. 24 2 PRIMARY CARE What is it? Primary care is a patient's first
Patient Centered Medical Home 2011 Standards
 PCMH Standard 6 1 Patient Centered Medical Home 2011 Standards 2 Today s Agenda PCMH 6 PCMH 6 PCMH 6 Elements A-B Elements C-E Elements F-G Standard 6 A MEASURE PERFORMANCE PCMH 6A Measure Performance
ALL MENTAL HEALTH AND SUBSTANCE USE DISORDER PROGRAMS MUST INCLUDE PSYCHOSOCIAL AND PSYCHIATRIC EVALUATIONS
 COUNTY of NASSAU DEPARTMENT OF HUMAN SERVICES Office of Mental Health, Chemical Dependency and Developmental Disabilities Services 60 Charles Lindbergh Boulevard, Suite 200, Uniondale, New York 11553-3687
Medicaid Benefits at a Glance
 Medicaid Benefits at a Glance Mountain Health Trust Benefits Children (0 up to 21 years) Ambulatory Surgical Center Services Any distinct entity that operates exclusively for the purpose of providing surgical
Medicare & Medicaid EHR Incentive Programs. Stage 2 Final Rule Pennsylvania ehealth Initiative All Committee Meeting November 14, 2012
 Medicare & Medicaid EHR Incentive Programs Stage 2 Final Rule Pennsylvania ehealth Initiative All Committee Meeting November 14, 2012 What is in the Rule Changes to Stage 1 of meaningful use Stage 2 of
Meaningful Use Basics and Attestation Process Guide for Medicare and Medi-Cal. Lori Hack & Val Tuerk, Object Health
 Meaningful Use Basics and Attestation Process Guide for Medicare and Medi-Cal Lori Hack & Val Tuerk, Object Health 2 3 Agenda Who Qualifies for the EHR Incentive Funds? EHR Incentive Registration Process
John W. Gahan Jr. Department of Health
 John W. Gahan Jr. Department of Health Indigent Care Pool Electronic Health Record Medicaid Reimbursement FQHC s Other Clinics Appeals Meaningful Use Primary Medical Home General Billing 2010 AHCF-1 Questions
DISCLAIMER: ECHO Nevada emphasizes patient privacy and asks participants to not share ANY Protected Health Information during ECHO clinics.
 DISCLAIMER: Video will be taken at this clinic and potentially used in Project ECHO promotional materials. By attending this clinic, you consent to have your photo taken and allow Project ECHO to use this
2015 MEANINGFUL USE STAGE 2 FOR ELIGIBLE PROVIDERS USING CERTIFIED EMR TECHNOLOGY
 2015 MEANINGFUL USE STAGE 2 FOR ELIGIBLE PROVIDERS USING CERTIFIED EMR TECHNOLOGY STAGE 2 REQUIREMENTS EPs must meet or qualify for an exclusion to 17 core objectives EPs must meet 3 of the 6 menu measures.
Standards for Success ROSS Data Elements
 This shortcut assists ROSS Grantees to identify: Relevant data elements to collect; Questions for gathering information for the data element; and Possible response options. Participant Description 1 Person
ARRA New Opportunities for Community Mental Health
 ARRA New Opportunities for Community Mental Health Presented to: The Indiana Council of Community Behavioral Health Kevin Scalia Executive Vice-President, Corporate Development February 11, 2010 Overview
Health Sciences Job Summaries
 Job Summaries Job 20713 20712 20711 20613 20612 20611 20516 20515 20514 20513 20512 20511 Vice President, Senior Associate Vice President, Associate Vice President, Health Assistant Vice President, Health
Columbia Medical Practice- Pediatrics Ken Klebanow M.D. and Associates
 HOWARD COUNTY HEALTH DEPARTMENT SCHOOL-BASED WELLNESS CENTERS PROGRAM TELEMEDICINE SERVICES A partnership between the Howard County Health Department and the Howard County Public School System What is
VISION Every Rhode Islander has equal access to affordable, quality, comprehensive health care.
 Rhode Island Health Center Association 235 Promenade Street, Suite 455 Providence, RI 02908 Phone (401) 274-1771 Fax (401) 274-1789 www.rihca.org 2010 / 2011 Mission The Rhode Island Health Center Association
Patient Name:,, Address: Phones:,, Home Work Cell. Primary Physician: Emergency Contact: Phone#:
 Patient Information Patient Name:,, Last First middle initial Address: Phones:,, Home Work Cell Sex: Female Male E-Mail: Date of Birth: / / Mo. Day Year Primary Physician: Marital Status: Single Married
Alaska Medicaid Program
 Alaska Medicaid Program ALASKA ELECTRONIC HEALTH RECORDS Incentive Program Updated January 2018 Provider Manual 1 Background... 4 2 How Do I use this manual?... 6 3 How do I get help?... 7 4 Eligible provider
Measuring the Cost of Patient Care in a Massachusetts Health Center Environment 2012 Financial Data
 Primary Care Provider Costs Measuring the Cost of Patient Care in a Massachusetts Health Center Environment 0 Financial Data Massachusetts Respondents Alexander, Aronson, Finning & Co., P.C. (AAF) was
Patient Centered Medical Home 2011
 Patient Centered Medical Home 2011 NCQA Standards Rand David, MD, FACP Associate Professor of Medicine Director, Dept. of Ambulatory Care Mount Sinai School of Medicine Elmhurst Hospital Center I have
Oregon's Health System Transformation
 Oregon's Health System Transformation MEASUREMENT PERIOD Baseline Year 2011 and Calendar Year 2013 JUNE 24, 2014 TABLE OF CONTENTS Executive Summary...iii 2013 CCO Performance and Quality Pool Distribution...1
Jail Health Services. Lisa A. Pratt, MD, MPH Director / Medical Director Jail Health Services. Title. Subtitle
 Jail Health Services Lisa A. Pratt, MD, MPH Director / Medical Director Jail Health Services Title Subtitle 1 1 Health Commission Director of Health Finance Policy & Planning Human Resources Information
Meaningful Use: Review of Changes to Objectives and Measures in Final Rule
 Meaningful Use: Review of Changes to Objectives and Measures in Final Rule The proposed rule on meaningful use established 27 objectives that participants would meet in stage 1 of the program. The final
Enhancing Outcomes with Quality Improvement (QI) October 29, 2015
 October 29, 2015") Enhancing Outcomes with Quality Improvement (QI) October 29, 2015 Learning Objectives! Introduce Quality Improvement (QI)! Explain Clinical Performance Person-Centered Medical Home (PCMH) Measures! Implement
Enhancing Outcomes with Quality Improvement (QI) October 29, 2015 Learning Objectives! Introduce Quality Improvement (QI)! Explain Clinical Performance Person-Centered Medical Home (PCMH) Measures! Implement
MEANINGFUL USE STAGE FOR ELIGIBLE PROVIDERS USING CERTIFIED EMR TECHNOLOGY
 MEANINGFUL USE STAGE 2 2014 FOR ELIGIBLE PROVIDERS USING CERTIFIED EMR TECHNOLOGY STAGE 2 REQUIREMENTS EPs must meet or qualify for an exclusion to 17 core objectives. EPs must meet 3 of the 6 menu measures.
FINANCIAL ASSISTANCE BUSS_0040 Start Date: 3/1/2018 Approval Date:
 I. PURPOSE: Bay Area Hospital is committed to providing charity care to persons who have healthcare needs and are uninsured, underinsured, ineligible for a government program, or otherwise unable to pay
American Recovery & Reinvestment Act
 American Recovery & Reinvestment Act Meaningful Use Dawn Ross, Clinical Informatics Director Linda Wilson, Meaningful Use Coordinator 10/26/2015 Overview American Recovery and Reinvestment Act of 2009
Dobson DaVanzo & Associates, LLC Vienna, VA
 Analysis of Patient Characteristics among Medicare Recipients of Separately Billable Part B Drugs from 340B DSH Hospitals and Non-340B Hospitals and Physician Offices Dobson DaVanzo & Associates, LLC Vienna,
PHCPI framework: Presentation Crosswalk to Service Delivery Elements
 PHCPI framework: Presentation Crosswalk to Service Delivery Elements C. Service Delivery America s Federally Qualified Health Centers (FQHC) Program David Stevens, MD, FAAFP George Washington University