University of Michigan Health System. Analysis of the Central Intake Process at University of Michigan Home Care Services
|
|
|
- Abigayle Porter
- 5 years ago
- Views:
Transcription
1 University of Michigan Health System Program and Operations Analysis Analysis of the Central Intake Process at University of Michigan Home Care Services Final Report To: Kenneth Bandy, Director, Home Care Services Mandy McKay, Project Manager, Quality & Compliance Mark Van Oyen Ph. D., Associate Professor Industrial and Operations Engineering 481 From: Industrial and Operations 481 Group 6, Home Care Services Intake Analysis Andrew Gutting Jing Ma Nikita Vardya Ilir Xholi Date of Submission: April 23, 2010
2 Table of Contents Executive Summary...3 Introduction...7 Background...7 Goals and Objectives...8 Key Issues...8 Project Scope...9 Current Situation...9 Approach and Methodology...10 Results...11 Simulation...32 Conclusions...33 Recommendations/Action Plan...34 Expected Outcome
3 Executive Summary The transition of hospital patients to the home frequently requires the utilization of home care services. The University of Michigan Hospitals & Health Centers (UMHHC) services patients who require home care services upon discharge from the hospital, such as home medical equipment, home infusion therapy, or home nursing care. These services are provided by three different providers within University of Michigan Home Care Services (UMHCS): Michigan Visiting Nurses (MVN), HomeMed, and MedEQUIP. Currently, little information exists about the patient intake referral process in UMHCS. The purpose of this project is to gain an understanding of the current intake process and evaluate the process efficiency. Several conclusions and recommendations regarding the amount of time staff members spend processing referrals are presented below. Background UMHCS is comprised of five total health care providers, which will be referred to as departments. These are the following: Michigan Visiting Nurses (MVN) HomeMed MedEQUIP Wheelchair Seating Services Michigan Visiting Care Each provider has dedicated referral processing areas and staff for processing referrals. The team analyzing the current situation focused on three departments: MVN, MedEquip, and HomeMed. The staff members across these departments perform similar tasks using different methods, which creates waste in the process, especially for those patients who require multiple types of care or care from more than one department. Methodology The team divided the project into four stages: observation and interviews, data collection, data analysis, and recommendations. During the first phase, data collection, the team interviewed and observed the intake referral staff and supervisors for the three departments. The MedEQUIP staff is separated into General Intake staff and Continuous Positive Airway Pressure/Bi-level Positive Airway Pressure (CPAP/BiPAP) staff. The team then created data collection sheets for a Beeper Study, Ladder Log Study, and Task Volume Study, which are explained in the following sections. A summary of participating staff members appears in the table below. 3
4 Table 1: Staff Levels MVN 4 HomeMed 4 MedEQUIP - Gen. Intake 11 MedEQUIP - CPAP/BiPAP 4 Grand Total 23 Ladder Log Study After initial interviews and observations, the team conducted a ladder log study to determine the amount of time spent on each intake activity. Staff members were given a Ladder Log Study form consisting of two parts: a patient information sheet and a ladder log sheet. The patient information sheet listed the name of each patient, along with patient information such as insurance provider, type of care required and expected date of discharge from the hospital. The ladder log sheet listed different times of the day, and staff members tracked their daily activities next to the corresponding time. The team divided all intake activities into five or six different task chunks. Staff members used the two forms simultaneously to track the amount of time they spend on each task chunk for each patient. The Ladder Log study terminated once the staff member listed information for 50 patients. Table 2: Task Descriptions Task Description Initial Questioning, Obtain 1 Demographics, Receive Referral Additional Communication with 2 Patient or Discharge Planners 3 Data Entry and Paperwork 4 Insurance Verification Beeper Study The team used beepers to gather information on the proportion of time spent on each intake activity. During the beeper study, the staff were given a beeper and a data collection form. The beeper vibrated an average of four times an hour according to a random Poisson distribution. The data collection form listed different tasks performed by staff in separate rows. These tasks were more specific than the task chunks in the ladder log study and could be considered sub-tasks of the original five task chunks. The staff put a tally mark in the appropriate box (the intersection of the time the beeper vibrated and the current task being performed) every time the beeper vibrated throughout the day. Data was collected for the following number of staff members over five different days of the week for an average of seven working hours per day. 4

5 Task Volume Study Finally, each staff member who completed a Beeper Study and Ladder Log study in MVN and HomeMed participated in the Task Volume study, which analyzed the frequency of different occurrences or obstacles such as the denial of service to a patient, a change in the discharge date, and missing patient information within the referral. Similar to the Beeper Study, the Task Volume study was conducted over five different days of the week for seven working hours per day. The staff placed a tally mark on the data collection form in the appropriate box every time they came across the obstacle or task. Findings and Conclusions Based on the results of the Beeper Study, Ladder Log Study, and Task Volume Studies, as well as general observations of the intake process, a summary of recommendations to the intake staff and supervisors appears below. Quantitative Findings The average time a Home Care staff member takes to process a referral based on the Ladder Log Study and the Beeper Study was found to be 31 minutes with a standard deviation of 5. This time was found to be different across each department, with the biggest difference between MVN and MedEQUIP. A summary of the total time to process a referral broken down by task for each department is illustrated in Figure 1 below. Figure 1: Processing Time by Task Figure 1 shows that staff spends the majority of their time performing Task 3. Much of this is due to the complex system of entering data. The Task Volume Study revealed that Home Care receives an average of 21 referrals per day through their electronic system. Around 47% of these referrals are incomplete, meaning they are missing patient information, such as prescription, patient demographics, or following physician information. Qualitative Findings After initial interviews and observations, the team was able to draw several conclusions about the current process efficiency. Staff members spend much more time processing 5
6 incomplete referrals than they do complete referrals because they must track down all of the missing patient information to accurately determine a schedule and estimate of cost for the patient. The high volume of incomplete referrals is mainly due to the fact that the Discharge Planners who create these referrals work in the hospital, while the Home Care Intake Staff works offsite from the hospital. Additionally, referrals are currently written in a way that is centered around the provider or the type of care the patient requires, rather than the patient themselves. For this reason, patients who require simultaneous care from different departments present difficulties for the electronic data handling system and by Home Care Staff. Recommendations The team recommends that the Home Care Department be moved to the Hospital to improve communication between Discharge Planners and Intake Staff. The Intake Staff should use standardized work across all five departments whenever possible. Finally, the system used to handle data entry for patient information should be standardized for each department and made more user-friendly to reduce the amount of time staff takes to enter data. The reduction of data entry time can potentially lead to optimized staff levels and referral processing time. 6
7 Introduction The transition of patients from the hospital to home frequently requires the utilization of home care services. In FY 2009, the University of Michigan Hospitals & Health Centers (UMHHC) had a total of 43,186 acute care discharges, 40% of which required post acute care service such as home medical equipment, home infusion therapy or home nursing care. These services are provided by MedEQUIP, HomeMed, and Michigan Visiting Nurses (MVN), respectively. The coordination of this care plays an important role in the patient throughput process in the health system as well as impacting the successful transition of the patients to other venues of care. The intake process, by which incoming referrals from the hospital to MedEQUIP, HomeMed, and MVN are processed by intake staff, is critical to patient throughput. The director of the University of Michigan Home Care Services (UMHCS) is concerned that the current process maybe be redundant and could be improved by reducing waste. Therefore, the UMHCS director would like to know if standardizing and centralizing the intake referral process between MedEQUIP, HomeMed, MVN, and the hospital would result in increased efficiency. To gain a better understanding of the current state of the process, the director used a team of Industrial and Operations Engineering students to perform time studies on the tasks performed by intake staff and to stratify the referral data with the objective of identifying redundancies and waste. Based on this analysis, the team has recommended actions to centralize and standardize the intake referral process. The purpose of this report is to provide a summary of the UMHCS patient intake process and a list of recommendations of how to improve this process. Background UMHCS provides the majority of home care support for patients who have been recently discharged from the UMHHC with home care needs. UMHCS is comprised of five providers, which include the following: HomeMed Home Infusion Services MedEQUIP Home Medical Equipment Michigan Visiting Care Michigan Visiting Nurses (MVN) Wheelchair Seating Services Currently, each provider has dedicated referral processing areas and staff for managing and processing patient referrals. The purpose of UMHCS is to facilitate the discharge of the UMHHC patients in an efficient and timely manner by allowing patients to be discharged earlier while continuing their required care at home. The UMHHC patients' Length of Stay (LOS) for inpatients is directly proportional to costs, meaning that the longer a patient stays in the hospital, the more it costs UMHHC to keep them there. Discharging patients from the hospital system and continuing their care through UMHCS is significantly reduces real costs and potential opportunity costs by freeing up inpatient space in the hospital system 7
8 for other patients. Since UMHHC operates on average at 90% capacity, an efficient discharge rate is critical. Additionally, UMHCS expects a large increase of patient referrals in the near future, making this issue of even greater importance. The team was asked to focus on three of the providers, MedEQUIP, HomeMed, and MVN. These providers have very similar referral processing, yet their staffs are independent and not centralized even though they all fall under the umbrella of UMHCS. Also, some patients require multiple services at once. Under these circumstances, the same intake referral process is performed separately for each of the needs, which is redundant and wasteful. Goals and Objectives The primary goal for the UMHCS Intake project was to determine the current state of the intake referral process, particularly the average amount of time that staff members take to complete a referral. The activities of the intake staff were observed and measured to determine the proportion of time spent on each activity, ultimately providing the time elapsed between the arrival of a referral and the acceptance or rejection of the patient from UMHCS. To make appropriate recommendations to centralize and standardize the process, the previously mentioned information was analyzed and stratified to accomplish the following objectives: Eliminate redundant referral process tasks in intake within individual services and for patients who utilize multiple services (MedEQUIP, HomeMed, and MVN) Increase the capacity for referrals by UMHCS, thereby diminishing the Length of Stay (LOS) for UMHHC patients Reduce wasted efforts that do not add to the intake process value stream Improve the overall quality of care and patient satisfaction provided by UMHCS through reduced processing time Once the current state is established, the ultimate goal of the project is to standardize and centralize the intake referral process across each provider such that the UMHCS intake process operates as one system. Key Issues After examining the patient intake referral process within UMHCS, the team concluded that the primary parties involved in this project include Home Care Services employees, nurses, clinicians, patient service assistants, supervisors, the UMHCS Project Manager, and UMHCS Director. The overall plan includes initial observation and interviews of staff, data collection via beeper and ladder log studies by staff, analysis of data, and final recommendations. The following key issues create the need for the project: 8
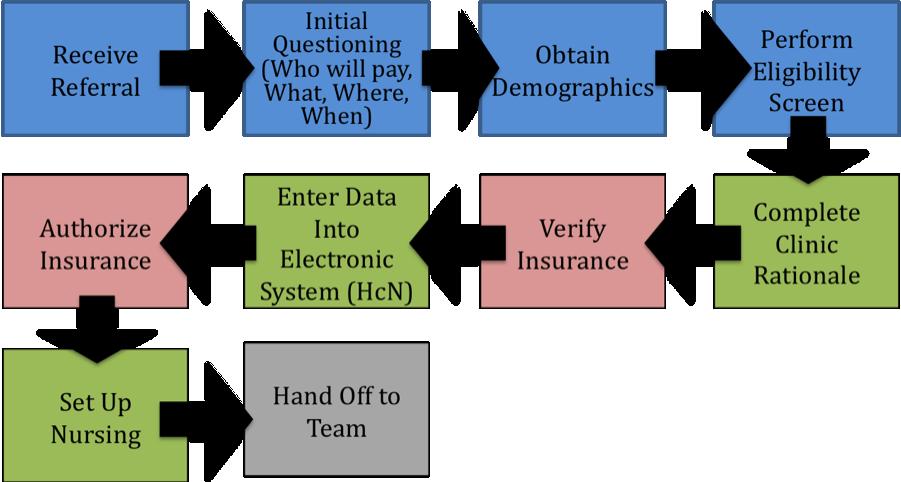
9 There is little understanding of the current intake process, which makes the process difficult to improve The University of Michigan hospital runs on average at 90% capacity, meaning efficient discharge is needed; UMHCS allows patients to be discharged earlier The UMHCS department competes with other home care providers across the country and thus needs to excel in the areas of quality of care, cost, and processing time The UMHCS department anticipates a large increase in demand and is therefore looking to expand Project Scope The project described in this report includes only the intake referral process at UMHCS. The intake process begins with a patient referral from the hospital and has a unique termination point for each MedEQUIP, HomeMed, and MVN. For MedEQUIP, the final step of the intake process is printing the referral to dispatch who then handles the delivery of equipment. For HomeMed, the final step is the last handoff of a processed referral to a Pharmacy Team, which then processes the information. For Michigan Visiting Nurses, the final step in the process is the handoff of the processed referral to scheduling. Any tasks before or after the patient intake referral process were not analyzed. Specifically, the team did not study direct patient interaction in the Home Care Services department. The team also did not focus on the remaining two providers: Michigan Visiting Care and Wheelchair Seating Services. Current Situation As stated before, each separate department within UMHCS uses a slightly different procedure to process referrals. These are detailed in the sections below. Michigan Visiting Nurses (MVN) MVN uses a unique system that is similar to an assembly line to process referrals. The Licensed Practical Nurse (LPN), as well as one Registered Nurse (RN), is dedicated to the initial steps in the process, screening referrals that come in electronically and obtaining patient demographics. The third staff member, a PSA, enters patient information into an electronic system, and the fourth staff member, a PSA, works exclusively with insurance, verifying insurance information for each referral that comes in. HomeMed On a given day in HomeMed Intake, all four staff members are classified into two categories: Intake Referral Processing and Documentation. Each staff member is trained in both these categories and therefore may work on Intake Referral Processing one day and switch to Documentation the next day. This system works for HomeMed because HomeMed experiences a relatively low volume of referrals compared to the other 9
10 divisions in Home Care. This causes the total referral processing time to be very large because staff members can dedicate up to an entire day to Documentation. MedEQUIP MedEQUIP has the most staff members relative to the other divisions. Even though MedEQUIP may receive less new referrals than other providers, they receive numerous restart referrals, which are referrals for patients already in the Home Care System. Most of the referrals received by MedEQUIP are for complex orders involving more than one type of care. It is for this reason that MedEQUIP referrals take longer to process and the MedEQUIP division requires more than double the amount of staff members than other providers. Continuous Positive Airway Pressure (CPAP) The CPAP division of MedEQUIP operates on a system similar to MVN. All staff members working in CPAP are PSAs. One PSA handles the beginning of the process, including initial screening and obtaining patient demographics. The next staff member determines whether or not the patient qualifies for care based on the patient's diagnosis. The third staff member verifies prescriptions and the last staff member handles all that is left in the process, including insurance verification, completeness verification, and ticket editing. The seemingly uneven workload between the first three staff members and the last staff member causes a bottleneck before the fourth staff member. Approach and Methodology The team divided the project into four stages: observation and interview, data collection, data analysis, and recommendations. During the first phase, data collection, the team interviewed and observed the intake referral staff for MVN, HomeMed, and MedEQUIP. The MedEQUIP staff is separated into General Intake staff and Continuous Positive Airway Pressure/Bi-level Positive Airway Pressure (CPAP/BiPAP). The team then created data collection sheets for a Beeper Study, Ladder Log Study, and Task Volume Study, which are explained in the following sections. Beeper Study After initial interviews and observations, the team conducted a beeper study to gather information on the proportion of time spent on each intake activity. During the beeper study, the staff were given a beeper and a data collection form. The beeper was set to vibrate an average of four times an hour according to a random Poisson distribution. The data collection form listed different tasks performed by staff in separate rows (See Appendix A). The staff was instructed to put a tally mark in the appropriate box (the intersection of the time the beeper vibrated and the current task being performed) every time the beeper vibrated throughout the day. Data was collected for the following number of staff members over five different days of the week for an average of seven working hours per day. 10
11 Table 1: Staff members participating in study Unit Number of Staff MVN Total 4 Registered Nurse 1 Licensed Practical Nurse 1 Patient Services Assistant 2 HomeMed Total 4 Patient Services Assistant 4 MedEQUIP 11 Lead Patient Services Assistant 1 Patient Services Assistant 10 CPAP 4 Patient Services Assistant 4 Grand Total 23 Ladder Log Study Each staff member who completed a beeper study was asked to perform a Ladder Log study to determine the amount of time spent on each intake activity. The staff was given a Ladder Log Study form (see Appendix) consisting of two parts. The first part is the patient information sheet, which helps to stratify patient data by referral type, expected discharge date, whether the patient is considered new or restart, type of service provided, single therapy or multiple therapy, payer type, same day or next day service need, along with other variables. Each time the intake referral staff member processes work related to a different patient, she will add the patient's information to the form. The Ladder Log study terminates once the staff member has listed information for approximately patients. The second part of the Ladder Log form consists of the Ladder Log itself. The tasks from the beeper study were divided into six categories or task chunks. The staff member used the two forms to track the amount of time she spends on each task chunk for each patient. Task Volume Study Each person in MVN and HomeMed who completed a Beeper Study and Ladder Log study was asked to participate in the Task Volume study (MedEQUIP did not participate in the task volume study due to time constraints). The study analyzed the frequency of different occurrences or obstacles such as the denial of service to a patient, a change in the discharge date, and missing patient information within the referral. Similar to the Beeper Study, the Task Volume study was conducted over five different days of the week for approximately seven working hours per day. The Task Volume Study form closely resembles the Beeper Study form with the exception of the task list. The staff was asked to place a tally mark in the appropriate box every time they came across the obstacle or task. Results The team analyzed the data from each of the methods described above and concluded the following findings: 11
12 Michigan Visiting Nurses (MVN) The results for MVN are broken up by each study conducted: Beeper, Ladder Logs, and Task Volume. Ladder Log Study MVN had six tasks to keep track of during their ladder log study. They were as follows: Table 2: MVN Ladder Log Task Description T Task Name Task Explanation T1 ECIN Screening/Information Gathering Any work related to scanning ECIN, checking demographics, service area, prescription T2 T3 T4 T5 Extra Communications Data Entry Insurance Verification Misc. Activities Any extra communication with any internal or external entities regarding the referral such as communication with DCPs, clinicians, scheduling, other staff, responding to commentary, etc. Any work related to entering patient information into McKessen, new or existing patients, OB, Lack of Following Physician. Any work related to verifying insurance of the patient, creating EOC, phone calls regarding insurance, phone calls to patients, any required additional insurance information Personal time, checking , administrative/staff meetings, bathroom, lunch breaks 12
13 Every minute of the intake staff s day was recorded as one of these five primary tasks to get an idea of the average length of each task as well as the variation. Each task was coupled with a unique patient and after 50 patients were accumulated, the study was complete. For patient related tasks (T1-T4) Table 3 shows the data retrieved from the ladder logs. Table 3: Task statistics for patient related activities for MVN T Average Stand. Dev. (min) (min) N T T T T T_TOTAL The average time it takes to process a referral sent to MVN is approximately 26 minutes with a standard deviation of 3.93 minutes. Also, T2 occurred 146 times during data collection, versus 88, 82, and 87 times for T1, T3, and T4, respectively. A significant portion (7.68 minutes) of the total time it takes to process a referral is tied up in extra communications. Not only is this the largest proportion of time, it is also the most variable with a standard deviation of It is also worth noting that the second most time consuming task is T3, data entry with an average of 6.57 minutes and a standard deviation of 4.24 minutes. For proportion of time spent on patient related tasks, the total time in minutes spent on T1, T2, T3, and T4 was taken. These results are show in Table 4 in minutes. Table 4: Proportion of Time Spent On Patient Related Activities MVN T Total Time Percentage N T % 88 T % 146 T % 82 T % 87 T_TOTAL % 403 Again, attention is drawn to the extra communication as 44.9% of total time is spent performing this task. Also, the second most common task is data entry at 22.7%. Data for Task 5 was not used because it proved to be significant upon analysis. Please see the Appendix for data regarding Task 5 information. As far as the stratification variables the team did not find any significant results. A Oneway ANOVA test was conducted between the length of the tasks and the stratification variables for all combinations. For MVN, one significant interaction was found, and this was between the length of Task 4 and insurance provider. The box plot and ANOVA test output are in Figure 1 and 2, respectively. 13
14 25 Boxplot of T4_Total 20 T4_Total BC Insurance MEDI Third Figure 1: Boxplot of T3 Length vs. Insurance Provider One-way ANOVA: T4_Total versus Insurance Source DF SS MS F P Insurance Error Total S = R-Sq = 30.60% R-Sq(adj) = 26.85% Individual 95% CIs For Mean Based on Pooled StDev Level N Mean StDev BC ( * ) MEDI ( * ) Third ( *------) Pooled StDev = Figure 2: One-way ANOVA of T3 Length vs. Insurance Provider The insurance provider was stratified by Blue Cross/Blue Shield providers, Medicaid/Medicare providers, and Third party providers. The nameless boxplot in Figure 2 was for provider fields that were left blank in the ladder logs. The boxplot shows that Medicaid/Medicare providers task longer to verify insurance as compared to other providers. This is supported by the ANOVA test showing a P-value of 0. Although the R- 14

15 Sq is low at 30.60%, and this is significant because of all the other variation that is possible within data entry. Other ANOVA tests on the other stratification variables can be found in the Appendix. Beeper Study The team found that there was a wide array of tasks that each employee spent small amounts of time on. As such, most of these tasks were grouped together to form the Other category depicted in Figure 3 below, which accounts for 27% of the employees times throughout the day. The next three highest categories were checking , send alert to scheduling, and enter data into McKesson (a software suite used for employee record keeping), with frequencies of 12%, 10%, and 10%, respectively. Figure 3: Percentage of time spent on the ten most frequent tasks by MVN intake staff The beeper study data were further broken down to show the frequency of tasks at various time intervals throughout the day. Figures four through six below show the frequency of the ten most frequent tasks performed by MVN intake staff during three, three-hour time periods in their work day: 8:00 am 11:00 am, 11:00 am 2:00 pm, and 2:00 pm 5:00 pm. 15


16 Figure 4: Percentage of time spent on the ten most frequent tasks from 8:00 am 11:00 am Figure 5: Percentage of time spent on the ten most frequent tasks from 11:00 am 2:00 pm 16

17 Figure 6: Percentage of time spent on the ten most frequent tasks from 2:00 pm 5:00 pm Similar to the data for the whole workday, the data broken down into time intervals shows that other is the predominant frequency because of the large number of individual tasks that the staff performs. The next three most frequent tasks after other, differ, however. Between 8:00 am and 11:00 am, the staff spends 16% of their time checking , 9% of their time scanning ECIN, and 9% of their time communicating with Discharge Planning. Between 11:00 am and 2:00 pm, the staff spends 18% of their time entering data into McKesson, 11% of their time checking , and 9% of their time reviewing and printing the ECIN sheet. Lastly, between 2:00 pm and 5:00 pm, the staff spends 15% of their time sending alerts to scheduling, 10% of their time completing insurance documentation and verification, and 10% of their time communicating with Discharge Planning. The Beeper Study analysis also yielded the proportion of time that staff spent on the phone (15%) as opposed to off the phone (85%). The complete beeper study data for MVN can be found in the Appendix. Task Volume Study The Task Volume study, which was collected within a time frame of one week, captured information for 133 Electronic Referrals than came to MVN. The staff members collected a multitude of statistics on the referrals using the data collection form, which include information on the completeness of the referral, the time the referral was received, the referral type, and extra communication with discharge planners. A summary of these statistics is illustrated in Table 5 below. 17

18 Table 5: Statistics Collected by MVN staff (N=133 Referrals) Statistic Frequency Referral Received After Patient Discharged 4 Referrals Received Same Day Patient was Discharged 2 Referrals Unable to Accept 8 Communicate with Discharge Planning 67 Obtain Missing Demographics 34 Complete Referrals 71 Incomplete Referrals 62 The most important of these statistics is the number of incomplete referrals received from Discharge Planning, which represented 47% of total referrals, meaning first time quality was only 53%. The missing or incorrect information that contributed to the incomplete referrals is summarized in Figure 7. Figure 7: Breakdown of Complete and Incomplete Referrals Figure 7 shows that the three main contributors to incomplete referrals are No Length of Stay (LOS) included, Lack of Following Physician included, and Incorrect Instructions for the patient. These represent a high volume of referrals and create difficulty for the intake staff processing the referrals. HomeMed The HomeMed intake staff completed two separate sets of tasks in their processing of referrals: referral intake and documentation. The team, therefore, analyzed data for each of the beeper, ladder log, and task volume studies for both sets of tasks. 18

19 Beeper Study Similarly to MVN, HomeMed also completes a large number of individual tasks when performing both referral intake and documentation. Figures 8 and 9 below show that staff spent the majority of their time completing other tasks. Figure 8: Percentage of time spent on the ten most frequent tasks by HomeMed staff during regular referral intake. Figure 9: Percentage of time spent on the ten most frequent tasks by HomeMed staff during documentation. 19
20 When performing regular referral intake, the staff is predominantly completing initial questiong of patients to obtain demographic data, verifying insurance, and checking . When performing documentation, the staff spends a higher proportion of their time creating certificates of medical neccesity (CMN) and obtaining documentation for the prior authorization (PA). The beeper study data is next shown divided into three-hour time intervals to identify tasks that are occuring more frequently at certain times of the day. For referral intake tasks, the data shows that, after other, the most frequent tasks are verifying insurance, entering patient data into HcN (a software suite used for employee record keeping), checking , and performing initial questiong of patients to identify demographic and logistical data. For documentation, the most frequent tasks are other, creating certificates of medical necessity (CMNs), processing/obtaining documentation for prior authorizations (PAs). Figures 10 through 15 below show the data for HomeMed referral intake and documentation broken down by time. Figure 10: Percentage of time spent on the ten most frequent referral intake tasks from 8:00 am 11:00 am 20

21 Figure 11: Percentage of time spent on the ten most frequent referral intake tasks from 11:00 am 2:00 pm Figure 12: Percentage of time spent on the ten most frequent referral intake tasks from 2:00 pm 5:00 pm 21


22 Figure 13: Percentage of time spent on the ten most frequent documentation tasks from 8:00 am 11:00 am Figure 14: Percentage of time spent on the ten most frequent documentation tasks from 11:00 am 2:00 pm 22

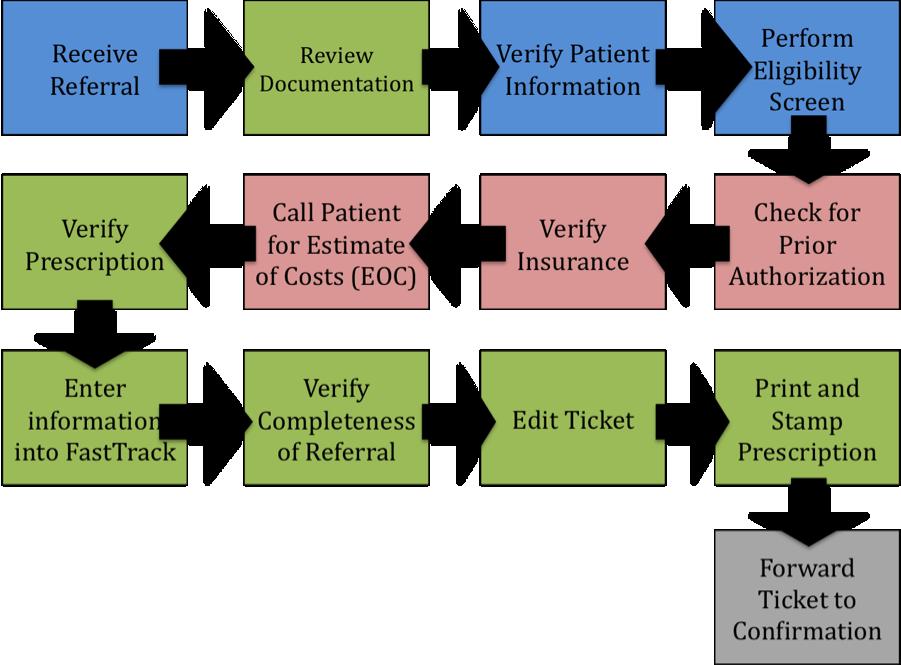
23 Figure 15: Percentage of time spent on the ten most frequent documentation tasks from 2:00 pm 5:00 pm The HomeMed data was also analyzed to determine the proportion of time that intake staff spent on the phone to off the phone while performing tasks. For both referral intake and documentation tasks, the staff completed most of their duties while off the phone. The staff was off the phone 61% and 72% for referral intake and documentation tasks, respectively. The complete beeper study data for HomeMed can be found in Appendix C. MedEQUIP The MedEQUIP department intake staff is separated between general MedEQUIP staff and CPAP staff. The two groups perform very different tasks in the intake process and were therefore analyzed separately for each of the three studies that were conducted. Ladder Log Study MedEQUIP had six tasks to keep track of during their ladder log study. They are depicted in the Table 6 below: 23
24 Table 6: MVN Ladder Log Task Description T Task Name Task Explanation T1 ECIN Screening/Information Gathering Any work related to scanning ECIN, checking demographics, service area, prescription T2 T3 T4 T5 T6 Extra Communications Data Entry Insurance Verification Non-new patient related activities Misc. Activities Any extra communication with any internal or external entities regarding the referral such as communication with DCPs, clinicians, scheduling, other staff, responding to commentary, etc. Any work related to entering patient information into Fastrack, new or existing patients, OB, Lack of Following Physician, SSP forms, Oxygen forms Any work related to verifying insurance of the patient, creating EOC, phone calls regarding insurance, phone calls to patients, any required additional insurance information Any work related to processing of Non new referrals Personal time, checking , administrative/staff meetings, bathroom, lunch breaks Tasks 1-4 were defined specifically in the scope of processing a new referral whereas T5 was defined as other tasks that involved patient care, but not for a new referral. This was done to get an understanding of the time it takes to process a new referral. Every minute 24
25 of the intake staff s day was recorded as one of these six primary tasks to get an idea of the average length of each task as well as the variation. Each task was coupled with a unique patient and after 30 patients were accumulated, the study was complete. For patient related tasks (T1-T5) Table 7 shows the data retrieved from the ladder logs. These values are in minutes. Table 7: Task Statistics for Processing a New Referral for MedEQUIP T Average Stand. Dev. N T T T T T_TOTAL The data shows that the most time consuming task was data entry at minutes with a high standard deviation of minutes. The number of occurrences also supports this as the ladder logs observed 213 instances of this, compared to 199, 121, and 110 for T1, T2, and T4, respectively. This data also supports the team's observations of staff often typing in data into Fastrack as well as often filling out paper work for certain medical equipment such as SPP forms and Patient Order Forms. Again, extra communication (T2) is a significant portion of the total referral process time, which should be eliminated in a future state. The team was also interested in how much time was spent on any patient related activity (including T5). Table 8 shows these results. Table 8: Proportion of Time Spent On Patient Related Tasks for MedEQUIP T Total Time Percentage N T % 199 T % 121 T % 213 T % 110 T % 394 T_TOTAL % 1037 The data shows that a majority of the workload for MedEQUIP staff is spent on patient care for non-new patients at 65.3 percent of their time. Data entry (T3) takes up the largest proportion of time for processing a new referral. Since T6 was not used in the analysis, that data can be found in the attached appendix. As far as the stratification variables the team did not find any significant results. A Oneway ANOVA test was conducted between the length of the tasks and the stratification variables for all combinations. For MedEQUIP, there was one significant interaction, and this was between the length of Task 3 (data entry) and insurance provider. The boxplot and ANOVA test output are in Figure 16 and 17, respectively. 25
26 Boxplot of T3_TOTAL T3_TOTAL BC Insurance MEDI THIRD Figure 16: Boxplot of T3 Length vs. Insurance Provider One-way ANOVA: T3_TOTAL versus Insurance Source DF SS MS F P Insurance Error Total S = R-Sq = 29.06% R-Sq(adj) = 27.52% Individual 95% CIs For Mean Based on Pooled StDev Level N Mean StDev BC (-----*-----) MEDI (-----*------) THIRD (---*---) Pooled StDev = Figure 17: One-way ANOVA of T3 Length vs. Insurance Provider Insurance provider was stratified by Blue Cross/Blue Shield providers, Medicaid/Medicare providers, and Third party providers. The nameless boxplot in Figure 16 were for provider fields that were left blank in the ladder logs. The boxplot shows that Medicaid/Medicare providers take longer to enter data as compared to other providers. This is supported by the ANOVA test showing a P-value of 0. Although the R-Sq is low at 29.06%, the team still finds this significant because of all the other variation that is 26

27 possible within health insurance verification. Other ANOVA tests on the other stratification variables can be found in the Appendix. Beeper Study Eight staff members in general MedEQUIP and four in CPAP collected beeper study data to identify which tasks occurred most frequently. Both groups performed over 25 tasks that were accounted for in the data collection sheet, and thus only the ten most frequent tasks are presented. In addition, since there were such a large number of tasks, other is the category that occurred most frequently (31% for MedEQUIP and 36% for CPAP). The next three most frequent tasks for MedEQUIP are communicating with the patient not pertaining to any of the general tasks that were accounted for, entering data into Fastrack (a software suite used for patient record keeping), and checking . For CPAP, the tasks are verifying insurance, speaking with the patient on the phone to obtain additional information, and entering data into Fastrack. Figures 18 and 19 show these results Figure 18: Percentage of time spent on the ten most frequent tasks by general MedEquip staff 27
28 Figure 19: Percentage of time spent on the ten most frequent tasks by CPAP staff Similarly to MVN and HomeMed, the beeper study data is next shown divided into threehour time intervals to identify tasks that are occuring more frequently at certain times of the day. For MedEquip, after other, the most frequent tasks do not vary much between the three time periods. Performing other patient communication not related to prespecified tasks, entering data into Fastrack, checking , and communicating to internal staff such as dispatch are the predominant tasks in each of the three time periods. The tasks in CPAP are more variable when observed for certain time intervals in the day. For example, between 8:00 am and 11:00 am, verifying insurance, attending staff meetings, and speaking to the patient on the phone are the most frequent tasks. However, between 11:00 am and 2:00 pm, editing the referral ticket is the most frequent task after other, and between 2:00 pm to 5:00 pm, printing and stamping the perscription makes into the top three most frequent. Figures 20 through 25 below show the results of MedEQUIP and CPAP broken down by time. 28


29 Figure 20: Percentage of time spent on the ten most frequent tasks from 8:00 am 11:00 am for MedEquip intake staff Figure 21: Percentage of time spent on the ten most frequent tasks from 11:00 am 2:00 pm for MedEquip intake staff 29

30 Figure 22: Percentage of time spent on the ten most frequent tasks from 2:00 pm 5:00 pm for MedEquip intake staff Figure 23: Percentage of time spent on the ten most frequent tasks from 8:00 am 11:00 am for CPAP intake staff 30

31 Figure 24: Percentage of time spent on the ten most frequent tasks from 11:00 am 2:00 pm for CPAP intake staff Figure 25: Percentage of time spent on the ten most frequent tasks from 2:00 pm 5:00 pm for CPAP intake staff The complete Beeper Study results for MedEQUIP can be found in Appendix C. 31
32 Simulation Problem Formulation To estimate the performance of the future state of the centralized intake department a simulation model should be developed. Based on the data the team collected on service time, referral arrival time and variability, a simple model was designed, though it is limited in several aspects. Objective The objective of the model is to formulate a model using ProModel simulation package to describe the current state system for the 3 departments (MVN, HomeMed and MedEQUIP) and to predict the future state performance of the central intake department. Model Conceptualization Due to the limitation of the data, a dependable service time distribution was only created and used for MVN and HomeMed. In terms of arrival pattern, only ECIN data could be used. As a result, CPAP s referral arrival pattern cannot be obtained. The team developed a model that describes the process of all the departments. However the simulation only included MedEQUIP and MVN. In the model, each intake staff is treated as a location, with capacity of 1, meaning one staff can only process at most 1 referral in any given time. The queue could be built up if the subsequent locations are full. For MVN, the coming referrals first either go to staff1 or staff2, since the work flow in MVN is sequentially designed. After 1 referral has been processed by either staff1 or staff2, it will be past to staff3, if she is available. Similarly, the referral will be past to staff4 once it was finished processing by staff3. Staff4 will complete the whole process. As of MedEQUIP, all the staffs can work parallel. That is, all the intake staff can handle each referral individually without help from other people. In this situation, once a referral has arrived, it will be directed to 1 idle staff to get processed, or has to wait for the next available staff. In the future state, all the staffs are cross-trained so that each one of them could handle any kind of referral individually. As a result, the 2 kinds of arrivals are combined together. Model Transition Based on the raw data collected, the team obtained the inter arrival time for MVN and MedEQUIP. Both have exponential distribution with mean of 26.4min and 42.4min, respectively. The process time for staff in MedEQUIP is normally distributed with mean of 35.7 minutes and standard deviation of 8.79 minutes. For MVN, the mean process time was calculated for staff1 and 2 using the sum of the two independent random numbers. The inter arrival time for the future state (Home Care Service as a whole) was obtained by taking the weighted average of the arrivals of MVN and MedEQUIP. The process time for the cross-trained staff was calculated by taking the weighted average of the total process time of two kinds of referrals with T2 (excessive communication) excluded. 32
33 Validation Due to the limited amount of data, the model is not fully validated. The current and future state utilizations were obtained for comparison. Also, the assumption was made that the arrival pattern would not change in the future, which is a strong assumption. Outputs Table 9: Simulation output showing processing time and utilizations MVN MedEquip Current Future Current Future Average Processing Time(Min) Average Utilization Conclusions The results depicted above gave several insights into the referrals processing procedures at MVN, HomeMed, and MVN. The team was able to identify several inefficiencies and areas for improvement for each unit of Home Care Services. Across all three units, the largest inefficiencies arose from processing waste and the lack of standardized work. Each of the three units devotes a large portion of their time to data entry, which is nonvalue-added time. Extra communication occurs between internal staff members as well as between staff members and the hospital, leading to increased processing time. MVN The beeper study results for MVN showed that entering data into McKesson accounted for approximately 10% of employees time. The process entails printing an ECIN ticket (which typically arrives electronically) and copying the data on the sheet into the McKesson system. Essentially, the person performing this task is manually copying data from one electronic system into another electronic system. Communicating with Discharge Planning was also identified as one of the key non valueadded activities that MVN intake staff perform. According to the ladder logs, this activity was approximately 45% of the time required to process a new referral. The need for this extra communication arises because most of the incoming referrals are incomplete or need further clarification. The intake staff therefore need to call the discharge planners to identify missing data (e.g.. lack of following physician, no prescription, etc.), clarify illegible handwriting, and clarify instructions. During the team s initial interviews with MVN staff, the incompleteness of referrals was stressed as the root issue for most delays in referral processing. After completing a referral, the MVN intake staff sends an alert to the scheduling department, marking the end of the referral intake process. When the referral is complete, an intake staff member has to physically deliver a form to the scheduling department. Due to the nature of this processing step, the data showed that sending an alert to scheduling takes up 15% of the time during the period between 2:00 pm 5:00 pm, but is not one of the ten most frequent tasks during the two periods before that. The MVN staff 33
34 accumulates completed referrals and sends them to scheduling in large batches towards the end of the day, resulting in inventory waste. HomeMed The beeper study results showed two key elements of waste in HomeMed, both pertaining to non-value-added processing. Similarly to the other two units, HomeMed intake staff has to enter patient data into HcN, a software system particular to HomeMed. The data typically arrives in electronic format (via ECIN) and has to be entered into another electronic system by an employee. The other element of waste pertains to the documentation tasks that HomeMed employees perform. MedEQUIP/CPAP The results from the ladder log study revealed that MedEQUIP's referrals took the longest time to process, which was 35 minutes. This is 9 minutes above the time it took to complete a referral for MVN, which has a third of the staff members compared to MedEQUIP. As mentioned before, a reason why MedEQUIP's referrals tend to take longer is because of the complexity of care involved. The beeper study showed that MedEQUIP staff members spend the bulk of their time performing extra communication with the patient, entering data, and checking . These three tasks combined make up 31% of their work. Considering the fact that data was collected for 29 different tasks, this is a major finding. The ladder log also confirmed the excessive data entry as it composed about 11 minutes of a 35 minute process. The results of the beeper study for CPAP revealed that the staff spends the majority of their time verifying insurance, communicating with the patient, and entering patient information into the electronic system. These three tasks make up 32% of the staff's work. This is also a striking finding, considering the 30 tasks on which the data was collected. Recommendations/Action Plan The following are the team s recommendations regarding process improvements for all departments of Home Care Services. It has been communicated that the future state of Home Care Services will be a centralized intake process where all units act as cross functional teams. This plan has its obvious efficiency gains, specifically when a patient requires multiple provider s care as currently a separate referral is sent to each MVN, HomeMed, and MedEQUIP which are processed individually under this circumstance. This also includes cross trained staff that are able to handle referrals of any type, however, before this can be done there are improvements that must be made to ensure an efficient and successful transition. An overarching process metric must be established for the referral processing system as staff are currently oblivious to the current state of the system; are they behind, on queue, or ahead of demand, etc. This metric should be customer centered (with the patient being considered the ultimate end customer) and numeric. This metric should be the basis for daily analysis of team productivity and the metric should be easy to collect and easy to understand. 34
35 A standardized approach must be agreed upon as to how to process any referral. In general, all staff perform the same tasks for each referral, but in totally different manners and sequences. Without a controlled standardized approach, new proposed improvements have no basis for validation as to whether or not referral processing is better. Although a standardized approach should be the goal, staff should be encouraged to experiment with processing improvements and validate them against the standardized approach. If these experiments show results, a new standard should be implemented. Standardization in general clarifies expectations, reduces variability and overburdening, and improves the quality of work. Visual management is also a key recommendation for continuous process improvements. The aforementioned process metrics must be visible and clear to all staff at any time. Other valuable metrics should also be visible such as the frequency of certain issues such as incomplete referrals. These visible metrics must be clear so that when management makes use of gemba walks, they can identify the issues and work to solve any issues immediately. Although staff is involved with the process, they are often busy doing work arounds for problems arising on the floor instead of seeing issues as they arise and solving root causes. A management staff is that is more often physically closer to the process will be able to support staff in their problem solving efforts as well as be able to solve issues outside of their employees control as they arise. The extra communication issues must be resolved. Total elimination of extra communication may not be feasible, but marginalizing a very large majority of it is feasible. Staff and leaders must work with discharge planning to solve this issue because it is a waste on both the perspective of the intake staff and the discharge planners. Home Care Services needs to clearly set the expectations to discharge planning of what information they require to process referrals efficiently and properly. These expectations can be used as a communication tool to further develop a new interaction process whether that means changing the organization of what is on the referrals or adding and subtracting sections that are unneeded. Data entry is also a non-valued added task taking much of the referral processing time. Much of the records being dealt with are electronic in nature so there exists mechanisms from which information can be translated from one database package to another. Specifically, ECIN referrals are electronic records, however staff have been observed printing off the referral and manually entering the information into their respective clinical databases. Similar to the extra communication, it may not be feasible to autotranslate all useful information from the ECIN scripts to the clinical database, however this can be done for a large majority of the information. Home Care Services can work with their IT staff to explore potential solutions to these issues as they have a large impact on referral processing. Specifically concerning the MVN and CPAP intake staff, they have developed an assembly line system for processing referrals. Two staff handle initial information gathering and extra communications. The referral is then handed off to the third staff 35
36 person for a data entry. Finally, the data entry staff passes this referral onto the fourth staff person who does the insurance verification. This process creates a bottle neck between the first two staff and the data entry staff. Queues begin to build up here. This is not a very effective utilization of staff persons. The team recommends that each staff member handles the referral from start to finish. Expected Outcome After the action plan stated above and the elimination of extra communication between intake staff and discharge planners (T2), UMHCS will be able to handle over 20% more referrals than before. This number was calculated using the following equation: [(MVN T2 * #MVN Referrals/year) + (MedEQUIP T2 * #MedEQUIP Referrals/year) + (HomeMed T2 * #HomeMed Referrals/year)] * % Incomplete Referrals / 265 days/year [(7.68 x 4120) + (5.59 x 2052) + (6.63 x 2390)] x (47%) = hr/8hr work day = days saved / 265 days/year =.21 = 21% The results of the simulation also illustrate that after the reduction or elimination of T2, staff members will only be a little over 50% utilized, which means that UMHCS will be able to handle the expected increase in referral demand. After intake staff have implemented a system to measure performance and supervisors review these metrics weekly, UMHCS will always know the current state of their intake process and be able to make improvements accordingly. 36

37 Appendix A: Beeper Study Example 37
38 Appendix B.1: Ladder Log Example Task Time Data Collection Sheet: MVN Staff Level (Circle One) PSA RN Other: Start Shift End Shift Ladder Log for (name): Date: Time Task P# Time Task P# Time Task P# Time Task P# 8: : : : : : : : : : : : : : : : : : : : : : : : : :00 0 3:00 0 6: : : : : : : : : : : : : : : : : : : : : :00 0 1:00 0 4:00 0 7: : : : : : : : : : : : : : : : : : : : : :00 0 2:00 0 5:00 0 8:
39 Appendix B.2: Ladder Log Example Patient Info: Patient Name Expected D/C Referral Type Restart New Same Day Next Day SSP OB HIT Prior Auth Obtained By: Ex. Susan B. Anthony 2/24/2010 X X X web-denis P1 P2 P3 P4 P5 P6 P7 P8 P9 P10 P11 P12 P13 P14 P15 P16 P17 P18 P19 P20 P21 P22 P23 P24 P25 P26 P27 P28 P29 P30 P31 P32 P33 P34 P35 P36 P37 P38 P39 P40 P41 P42 P43 P44 P45 P46 P47 P48 P49 P50 List of Therapies/Services: CPAP Insurance Providor BCN Instructions For Using This Ladder Log: Example: Time Task P# Time Task P# This Log is intended to show when and how long it takes to receive, investigate, and respond to a referral sent by any referral source for different patients. On the sheet you will see only 2 major columns, 1 for the task length, 1 for the patient number. 7:00 0 7: Interruption Example T1 T2 T3 ECIN Screening - Any work related to scanning ECIN, checking demographics, service area, insurance, following physician, diagnosis, care service Extra Communication - Any extra communication with any internal or external entities regarding the referral such as communication with DCPs, clinicians, scheduling, other staff, responing to commentary (!), etc. Data Entry - Any work related to entering patient information into McKessen, new or existing patients, OB, Lack of Following Physician : :40 40 T1 P Insurance Verification - Any work related to verifying insurance of the patient, creating EOC, phone calls regarding insurance, phone calls to patients, any required additional T4 insurance information Misc Activities - personal time, checking , administrative/staff meetings, bathroom, T5 lunch breaks 7: :50 50 X Interruptions - minute or less interruptions in current task T1 P2 Patient Number - in order to track how much time is spent on referrals regarding the P# same patient T2 x T4 T2 T3 T2 P2 Bathroom P1 P3 P3 39
40 Appendix C: Beeper Study Results Table 1: Proportion of time spent on each task for MVN staff Task % of Total Time Enter Data Into McKesson for New Patient 17.1% Checking 9.8% Communicate with D/C Planning/Practice Management 8.9% Review and Print Order & ECIN (Supporting Documents) 8.1% Complete Additional Insurance Documentation/Verification 8.1% Fill Out Referral Log and Hand Off to Data Entry 6.5% Scan ECIN for Initial Referals or Alert Messages/Updates 5.7% Send Alert to Scheduling 5.7% Create Estimate of Cost (EOC) 5.7% Distribute Referral to Scheduling 4.1% Communication/issue w/ staff 4.1% Data Enter O.B. Information 3.3% Bathroom Breaks 3.3% Enter Data Into McKesson for Existing Patient 2.4% Other 2.4% Create Patient labels for Patient Files 1.6% Communicate with Patient: Verify Address/Contact Info 1.6% Assign Referral to Self 0.8% Perform Initial Screening 0.8% Table 2: Proportion of time spent on each referral intake task for HomeMed staff Task % of Total Time Other 21.8% Initial Questioning (What, where, when, who will pay) 13.0% Verify Insurance 10.9% Checking 10.6% Enter Patient Into HcN 8.8% Performing Eligibility Screen 4.5% Staff Meetings 4.5% Set Up Nursing 4.2% Hand Off to Team 3.6% Walk-In Visit 3.6% Bathroom Breaks 3.6% Obtaining Demographics 2.7% Contact Patient (Communicate Information) 2.4% Create Estimate of Cost (EOC) 2.1% Fax 1.5% Manage/Communicate Order Changes 1.2% Complete Clinic Rationale 0.6% 40
41 Table 3: Proportion of time spent on each documentation task for HomeMed staff Task % of Total Time Work Related to CMN or PA (Medicaid) Create CMN > 14 Days Out (Manually) 10.9% Obtaining Documentation for PA 8.1% Create CMN < 14 Days Out (Electronically) 5.0% Communicate w/ Physician to Obtain Additional Info for PA 3.2% Submitting Documentation for PA 2.7% Process PA Approval (Enter into HcN, etc.) 2.7% Resubmit Documentation for PA 0.9% Work Related to CMN or PA (All Other Insurances) Create CMN < 14 Days Out (Electronically) 18.1% Create CMN > 14 Days Out (Manually) 5.4% Submitting Documentation for PA 3.2% Process PA Approval (Enter into HcN, etc.) 3.2% Communicate w/ Physicia. to Obtain Additional Info for PA 1.4% Resubmit Documentation for PA 1.4% Obtaining Documentation for PA 0.9% Work Related to Insurance Changes Process PA Approval (Enter into HcN, etc.) 3.6% Verify Insurance Change 2.7% Submitting Documentation for PA 2.3% Create CMN < 14 Days Out (Electronically) 1.8% Create CMN > 14 Days Out (Manually) 1.8% Communicate w/ Physician to Obtain Additional Info for PA 1.4% Resubmit Documentation for PA 0.9% Obtaining Documentation for PA 0.5% Administrative Responsibilities and Personal Time Bathroom Breaks 5.9% Staff Meetings 5.4% Checking 4.1% Training Sessions 2.3% 41
42 Table 4: Proportion of time spent on each task by MedEQUIP staff Task % of Total Time Other Patient Communication Not Related to Above Tasks 14.0% Enter Data Into Fastrack for New Patient 9.2% Checking 8.1% Communicate with Internal Employees 7.6% Scan ECIN for Initial Referals or Alert Messages/Updates 7.5% Insurance Verification (Gather Information via phone, CareWebb) 7.1% Enter Data Into Fastrack for Existing Patient 5.7% Review and Print Order to Dispatch 5.6% Perform Initial Screening 4.0% Staff Meetings 3.9% Extra Paper Work for Insurance Verification 3.5% Communicate with D/C Planning/Practice Management 3.1% Fill out Patient Order Forms 2.7% Walk-In Visit 2.4% Any Referral Processing AFTER Printing Ticket to Dispatch 2.3% Breaks 2.0% Look up New Patient information via MCIT 1.9% Communicating cost to D/C Planning or Patient 1.5% Gather Final Documents for Scanning 1.5% Taking Survey 1.3% Other 1.0% Change Alerts 0.9% Review Hold Report 0.8% Scan ECIN for Referral Distribution for Team 1 and 2 0.8% Extra Paper Work for Equipment (Oxygen, SSP, etc.) 0.6% Patient Complaint 0.5% Assign Referral to Other Staff 0.3% Training Sessions 0.3% Process Travel Patient Requests 0.1% 42
43 Table 5: Proportion of time spent on each task by CPAP staff Task % of Total Time Verify Insurance 15.9% Edit Ticket 13.2% On the phone w/ Patient (setting up appt. or discussing Rx) 12.6% Other 11.9% Print and Stamp Prescription 9.3% Enter Information Into Fastrack 8.6% Verify Prescription (on phone, faxing docs, etc.) 7.1% Staff Meetings 6.8% Send to CPAP Team/Tech 5.1% Patient Order Follow-up (post set-up status, supply needs, etc.) 3.8% Print Ticket 3.5% Handle Pending Authorizations 3.3% Check Prior Authorization (fax/call requests for authorization) 3.1% On the phone w/ referral source 2.9% Track down missing paperwork 2.6% Verify completeness of referral 2.2% Mail Patient Itinerary 2.2% Review baseline titration study or other documentation 1.8% Review Face Sheet 1.5% Checking 1.5% Verify Patient Information (DOB, address, phone) and physician 1.3% Determine if patient qualifies for care based on diagnosis: 1.3% Bathroom Breaks 1.1% Receive Referral (Patient calls, Physician Calls, fax, etc.) 0.9% OSA 0.9% Call Patient with EOC 0.9% CSA 0.7% Other 0.7% Forward Ticket to Confirmation 0.4% Walk-In Visit 0.4% Check Delivery Field 0.2% 43
44 Appendix D: Simulation Source Code ************************************************************************ ******** * * * Formatted Listing of Model: * * \\storage.adsroot.itcs.umich.edu\home\windat.v2\desktop\ioe 474 Project-Final.MOD * * * ************************************************************************ ******** Time Units: Distance Units: Minutes Feet ************************************************************************ ******** * Locations * ************************************************************************ ******** Name Cap Units Stats Rules Cost HomeMed_1 1 1 Time Series Oldest,, HomeMed_2 1 1 Time Series Oldest,, HomeMed_3 1 1 Time Series Oldest,, 44
45 HomeMed_4 1 1 Time Series Oldest,, MVN_1 1 1 Time Series Oldest,, MVN_2 1 1 Time Series Oldest,, MVN_3 1 1 Time Series Oldest,, MVN_4 1 1 Time Series Oldest,, MVN_Arrival INFINITE 1 Time Series Oldest, FIFO, HomeMed_Arrival INFINITE 1 Time Series Oldest, FIFO, CPAP_Queue INFINITE 1 Time Series Oldest, FIFO, CPAP_1 1 1 Time Series Oldest,, CPAP_2 1 1 Time Series Oldest,, CPAP_3 1 1 Time Series Oldest,, CPAP_4 1 1 Time Series Oldest,, CPAP_5 1 1 Time Series Oldest,, MVN3_Queue INFINITE 1 Time Series Oldest,, MVN4_Queue INFINITE 1 Time Series Oldest,, MedEquip_ECIN_Queue Infinite 1 Time Series Oldest,, MedEquip_1 1 1 Time Series Oldest,, MedEquip_2 1 1 Time Series Oldest,, MedEquip_3 1 1 Time Series Oldest,, MedEquip_4 1 1 Time Series Oldest,, MedEquip_5 1 1 Time Series Oldest,, MedEquip_6 1 1 Time Series Oldest,, MedEquip_7 1 1 Time Series Oldest,, 45
46 MedEquip_8 1 1 Time Series Oldest,, MedEquip_9 1 1 Time Series Oldest,, MedEquip_ Time Series Oldest,, MedEquip_Queue Inf 1 Time Series Oldest,, HCS_1 1 1 Time Series Oldest,, HCS_2 1 1 Time Series Oldest,, HCS_3 1 1 Time Series Oldest,, HCS_4 1 1 Time Series Oldest,, HCS_5 1 1 Time Series Oldest,, HCS_6 1 1 Time Series Oldest,, HCS_7 1 1 Time Series Oldest,, HCS_8 1 1 Time Series Oldest,, HCS_9 1 1 Time Series Oldest,, HCS_ Time Series Oldest,, HCS_ Time Series Oldest,, HCS_ Time Series Oldest,, HCS_ Time Series Oldest,, HCS_ Time Series Oldest,, HCS_ Time Series Oldest,, HCS_ Time Series Oldest,, HCS_ Time Series Oldest,, HCS_ Time Series Oldest,, HCS_ Time Series Oldest,, 46
47 HCS_ Time Series Oldest,, HCS_ Time Series Oldest,, HCS_ Time Series Oldest,, HCS_ Time Series Oldest,, HCS_Queue INFINITE 1 Time Series Oldest,, ************************************************************************ ******** * Entities * ************************************************************************ ******** Name Speed (fpm) Stats Cost Referral 150 Time Series ************************************************************************ ******** * Processing * ************************************************************************ ******** Process Routing 47
48 Entity Location Operation Blk Output Destination Rule Move Logic Referral HomeMed_Arrival 1 Referral HomeMed_1 EMPTY 1 Referral HomeMed_2 EMPTY Referral HomeMed_3 EMPTY Referral HomeMed_4 EMPTY Referral HomeMed_1 WAIT n(15,5) MIN 1 Referral EXIT FIRST 1 Referral HomeMed_2 WAIT n(15,5) MIN 1 Referral EXIT FIRST 1 Referral HomeMed_3 WAIT n(15,5) MIN 1 Referral EXIT FIRST 1 Referral HomeMed_4 WAIT n(15,5) MIN 1 Referral EXIT FIRST 1 Referral MVN_Arrival 1 Referral MVN_1 EMPTY 1 Referral MVN_2 EMPTY Referral MVN_1 WAIT n(13.52,6.45) MIN 1 Referral MVN3_Queue FIRST 1 Referral MVN_2 WAIT n(13.52,6.45) MIN 1 Referral MVN3_Queue FIRST 1 Referral MVN3_Queue 1 Referral MVN_3 EMPTY 1 Referral MVN_3 WAIT n(6.57,2.9) MIN 1 Referral MVN4_Queue FIRST 1 Referral MVN4_Queue 1 Referral MVN_4 FIRST 1 Referral MVN_4 WAIT n (5.91,4.24) MIN 48
49 1 Referral EXIT FIRST 1 INC MVN TS_MVN = Clock()- TS_MVN (Total_ATS_MVN + ATS_MVN)/MVN Total_ATS_MVN = Referral CPAP_Queue 1 Referral CPAP_1 FIRST 1 Referral CPAP_2 Referral CPAP_3 Referral CPAP_4 Referral CPAP_5 FIRST FIRST FIRST FIRST Referral CPAP_1 WAIT 15 MIN 1 Referral EXIT FIRST 1 Referral CPAP_2 WAIT 15 MIN 1 Referral EXIT FIRST 1 Referral CPAP_3 WAIT 15 MIN 1 Referral EXIT FIRST 1 Referral CPAP_4 WAIT 15 MIN 1 Referral EXIT FIRST 1 Referral CPAP_5 WAIT 15 MIN 1 Referral EXIT FIRST 1 Referral MedEquip_ECIN_Queue INC ECIN IF ECIN >= 2 THEN { Route 2 ECIN = ECIN - 1 } ELSE 49
50 { Route 1 ECIN = ECIN - 1 } 1 Referral MedEquip_1 FIRST 1 2 Referral MedEquip_2 FIRST 1 Referral MedEquip_4 FIRST Referral MedEquip_5 FIRST Referral MedEquip_6 FIRST Referral MedEquip_7 FIRST Referral MedEquip_8 FIRST Referral MedEquip_9 FIRST Referral MedEquip_10 FIRST Referral MedEquip_3 FIRST Referral MedEquip_Queue 1 Referral MedEquip_2 FIRST 1 Referral MedEquip_3 FIRST Referral MedEquip_4 FIRST Referral MedEquip_5 FIRST Referral MedEquip_6 FIRST Referral MedEquip_7 FIRST Referral MedEquip_8 FIRST Referral MedEquip_9 FIRST 50
51 Referral MedEquip_10 FIRST Referral MedEquip_1 Wait n(35.7,8.79) min 1 Referral EXIT FIRST 1 Referral MedEquip_2 wait n(35.7,8.79) min 1 Referral EXIT FIRST 1 Referral MedEquip_3 wait n(35.7,8.79) min 1 Referral EXIT FIRST 1 Referral MedEquip_4 wait n(35.7,8.79) min 1 Referral EXIT FIRST 1 Referral MedEquip_5 wait n(35.7,8.79) min 1 Referral EXIT FIRST 1 Referral MedEquip_6 wait n(35.7,8.79) min 1 Referral EXIT FIRST 1 Referral MedEquip_7 wait n(35.7,8.79) min 1 Referral EXIT FIRST 1 Referral MedEquip_8 wait n(35.7,8.79) min 1 Referral EXIT FIRST 1 Referral MedEquip_9 wait n(35.7,8.79) min 1 Referral EXIT FIRST 1 Referral MedEquip_10 wait n(35.7,8.79) min 1 Referral EXIT FIRST 1 Referral HCS_Queue 1 Referral HCS_1 EMPTY 1 Referral HCS_2 EMPTY 51
52 Referral HCS_3 Referral HCS_4 Referral HCS_5 Referral HCS_6 Referral HCS_7 Referral HCS_8 Referral HCS_9 Referral HCS_10 Referral HCS_11 Referral HCS_12 Referral HCS_13 Referral HCS_14 EMPTY EMPTY EMPTY EMPTY EMPTY EMPTY EMPTY EMPTY EMPTY EMPTY EMPTY EMPTY Referral HCS_1 Wait 0.39*n(35.7,8.79)+0.61*n(26.0,4.42) min 1 Referral EXIT FIRST 1 Referral HCS_2 Wait 0.39*n(35.7,8.79)+0.61*n(26.0,4.42) min 1 Referral EXIT FIRST 1 Referral HCS_3 Wait 0.39*n(35.7,8.79)+0.61*n(26.0,4.42) min 1 Referral EXIT FIRST 1 Referral HCS_4 Wait 0.39*n(35.7,8.79)+0.61*n(26.0,4.42) min 1 Referral EXIT FIRST 1 Referral HCS_5 Wait 0.39*n(35.7,8.79)+0.61*n(26.0,4.42) min 1 Referral EXIT FIRST 1 Referral HCS_6 Wait 0.39*n(35.7,8.79)+0.61*n(26.0,4.42) min 52
53 1 Referral EXIT FIRST 1 Referral HCS_7 Wait 0.39*n(35.7,8.79)+0.61*n(26.0,4.42) min 1 Referral EXIT FIRST 1 Referral HCS_8 Wait 0.39*n(35.7,8.79)+0.61*n(26.0,4.42) min 1 Referral EXIT FIRST 1 Referral HCS_9 Wait 0.39*n(35.7,8.79)+0.61*n(26.0,4.42) min 1 Referral EXIT FIRST 1 Referral HCS_10 Wait 0.39*n(35.7,8.79)+0.61*n(26.0,4.42) min 1 Referral EXIT FIRST 1 Referral HCS_11 Wait 0.39*n(35.7,8.79)+0.61*n(26.0,4.42) min 1 Referral EXIT FIRST 1 Referral HCS_12 Wait 0.39*n(35.7,8.79)+0.61*n(26.0,4.42) min 1 Referral EXIT FIRST 1 Referral HCS_13 Wait 0.39*n(35.7,8.79)+0.61*n(26.0,4.42) min 1 Referral EXIT FIRST 1 Referral HCS_14 Wait 0.39*n(35.7,8.79)+0.61*n(26.0,4.42) min 1 Referral EXIT FIRST 1 ************************************************************************ ******** * Arrivals * ************************************************************************ ******** 53
54 Entity Location Qty Each First Time Occurrences Frequency Logic Referral MVN_Arrival 1 INFinite E(26.4) ATS_MVN = Clock() Referral MedEquip_ECIN_Queue 1 INF E(42.4) Referral HCS_Queue 1 INF E(42.4)+e(26.4) ************************************************************************ ******** * Attributes * ************************************************************************ ******** ID Type Classification ECINS Integer Location ATS_MVN Real Entity ************************************************************************ ******** * Variables (global) * ************************************************************************ ******** 54
55 ID Type Initial value Stats ECIN Integer 0 Time Series MVN Integer 0 Time Series Total_ATS_MVN Real 0 Time Series TS_MVN Real 0 Time Series 55
56 Data, Logic, and/or Observations MedEQUIP = 35 min/referral MVN = 26 min/referral Beeper Study Task Volume Study Assembly Line System at MVN and CPAP Appendix E: Data-Findings-Conclusions-Recommendations Table Findings Conclusions Recommendations Action Plan & Implementation MedEQUIP has the longest referral processing time out of the three divisions Top ten tasks (w/ respect to proportion) common across all divisions are Data Entry, Insurance Verification, and Extra Communication with Patient and/or Discharge Planner 53% of referrals that come in electronically are complete 47% of referrals that come in electronically are incomplete MVN and CPAP staff divide work so that each staff member is specialized in a different part of the process MedEQUIP has a high referral volume as well as numerous orders in a single referral compared to other Home Care Divisions Largest proportion of time is spent in extra communication with Discharge Planners Many Referrals that come in Electronically from the Discharge Planners are incomplete and missing information such as Patient Demographics, Prescription, or Length of Stay The specialization of staff causes a bottleneck in the process, especially before the data entry process Standardize the Intake Referral Process for all three division of Home Care Increase the proximity of Intake Staff and Discharge Planning to reduce communication errors Increase the proximity of Intake Staff and Discharge Planning to reduce communication errors Do not use the assembly line system. Do not have specialized staff. Create one centralized Home Care Services department that is patient centered, as opposed to care centered (centering around the type of patient care needed) Move the Intake staff to the U of M Hospital onsite so that they have a direct communication line with Discharge Planning Move the Intake staff to the U of M Hospital onsite so that they have a direct communication line with Discharge Planning Cross train staff members to handle all referral tasks so that each staff member can handle a referral from beginning to end 56


57 Appendix F: Flowcharts of Intake Processes Figure 1: Michigan Visiting Nurses Figure 2: HomeMed 57


58 Figure 3: MedEQUIP Figure 4: CPAP 58
Analysis of Nursing Workload in Primary Care
 Analysis of Nursing Workload in Primary Care University of Michigan Health System Final Report Client: Candia B. Laughlin, MS, RN Director of Nursing Ambulatory Care Coordinator: Laura Mittendorf Management
University of Michigan Health System. Current State Analysis of the Main Adult Emergency Department
 University of Michigan Health System Program and Operations Analysis Current State Analysis of the Main Adult Emergency Department Final Report To: Jeff Desmond MD, Clinical Operations Manager Emergency
The University of Michigan Health System. Geriatrics Clinic Flow Analysis Final Report
 The University of Michigan Health System Geriatrics Clinic Flow Analysis Final Report To: CC: Renea Price, Clinic Manager, East Ann Arbor Geriatrics Center Jocelyn Wiggins, MD, Medical Director, East Ann
Neurosurgery Clinic Analysis: Increasing Patient Throughput and Enhancing Patient Experience
 University of Michigan Health System Program and Operations Analysis Neurosurgery Clinic Analysis: Increasing Patient Throughput and Enhancing Patient Experience Final Report To: Stephen Napolitan, Assistant
Analyzing Physician Task Allocation and Patient Flow at the Radiation Oncology Clinic. Final Report
 Analyzing Physician Task Allocation and Patient Flow at the Radiation Oncology Clinic Final Report Prepared for: Kathy Lash, Director of Operations University of Michigan Health System Radiation Oncology
EXECUTIVE SUMMARY. Introduction. Methods
 EXECUTIVE SUMMARY Introduction University of Michigan (UM) General Pediatrics offers health services to patients through nine outpatient clinics located throughout South Eastern Michigan. These clinics
University of Michigan Emergency Department
 University of Michigan Emergency Department Efficient Patient Placement in the Emergency Department Final Report To: Jon Fairchild, M.S., R.N. C.E.N, Nurse Manager, fairchil@med.umich.edu Samuel Clark,
University of Michigan Health System
 University of Michigan Health System Programs and Operations Analysis Analysis of the Discharge Process at Internal Medicine Unit B Department of Internal Medicine Final Report To: Dr. Christopher Kim,
Final Report. Karen Keast Director of Clinical Operations. Jacquelynn Lapinski Senior Management Engineer
 Assessment of Room Utilization of the Interventional Radiology Division at the University of Michigan Hospital Final Report University of Michigan Health Systems Karen Keast Director of Clinical Operations
University of Michigan Health System Analysis of Wait Times Through the Patient Preoperative Process. Final Report
 University of Michigan Health System Analysis of Wait Times Through the Patient Preoperative Process Final Report Submitted to: Ms. Angela Haley Ambulatory Care Manager, Department of Surgery 1540 E Medical
Michigan Medicine--Frankel Cardiovascular Center. Determining Direct Patient Utilization Costs in the Cardiovascular Clinic.
 Michigan Medicine--Frankel Cardiovascular Center Clinical Design and Innovation Determining Direct Patient Utilization Costs in the Cardiovascular Clinic Final Report Client: Mrs. Cathy Twu-Wong Project
University of Michigan Health System Programs and Operations Analysis. Order Entry Clerical Process Analysis Final Report
 University of Michigan Health System Programs and Operations Analysis Order Entry Clerical Process Analysis Final Report To: Richard J. Coffey: Director, Programs and Operations Analysis Bruce Chaffee:
Cost-Benefit Analysis of Medication Reconciliation Pharmacy Technician Pilot Final Report
 Team 10 Med-List University of Michigan Health System Program and Operations Analysis Cost-Benefit Analysis of Medication Reconciliation Pharmacy Technician Pilot Final Report To: John Clark, PharmD, MS,
University of Michigan Health System. Final Report
 University of Michigan Health System Program and Operations Analysis Analysis of Medication Turnaround in the 6 th Floor University Hospital Pharmacy Satellite Final Report To: Dr. Phil Brummond, Pharm.D,
Analysis of Cardiovascular Patient Data during Preoperative, Operative, and Postoperative Phases
 University of Michigan College of Engineering Practicum in Hospital Systems Program and Operations Analysis Analysis of Cardiovascular Patient Data during Preoperative, Operative, and Postoperative Phases
University of Michigan Health System Program and Operations Analysis. Analysis of Pre-Operation Process for UMHS Surgical Oncology Patients
 University of Michigan Health System Program and Operations Analysis Analysis of Pre-Operation Process for UMHS Surgical Oncology Patients Final Report Draft To: Roxanne Cross, Nurse Practitioner, UMHS
University of Michigan Comprehensive Stroke Center
 University of Michigan Comprehensive Stroke Center Improving the Discharge and Post-Discharge Process Flow Final Report Date: April 18, 2017 To: Jenevra Foley, Operating Director of Stroke Center, jenevra@med.umich.edu
University of Michigan Health System. Program and Operations Analysis. CSR Staffing Process. Final Report
 University of Michigan Health System Program and Operations Analysis CSR Staffing Process Final Report To: Jean Shlafer, Director, Central Staffing Resources, Admissions Bed Coordination Center Amanda
Executive Summary. This Project
 Executive Summary The Health Care Financing Administration (HCFA) has had a long-term commitment to work towards implementation of a per-episode prospective payment approach for Medicare home health services,
Analysis of 340B Disproportionate Share Hospital Services to Low- Income Patients
 Analysis of 340B Disproportionate Share Hospital Services to Low- Income Patients March 12, 2018 Prepared for: 340B Health Prepared by: L&M Policy Research, LLC 1743 Connecticut Ave NW, Suite 200 Washington,
Quality Management Building Blocks
 Quality Management Building Blocks Quality Management A way of doing business that ensures continuous improvement of products and services to achieve better performance. (General Definition) Quality Management
How to deal with Emergency at the Operating Room
 How to deal with Emergency at the Operating Room Research Paper Business Analytics Author: Freerk Alons Supervisor: Dr. R. Bekker VU University Amsterdam Faculty of Science Master Business Mathematics
Improving operating room efficiency through the use of lean six sigma methodologies. Teodora O. Nicolescu
 Improving operating room efficiency through the use of lean six sigma methodologies Teodora O. Nicolescu Author detail: Teodora O. Nicolescu, MD Associate Professor Department of Anesthesiology The University
A Publication for Hospital and Health System Professionals
 A Publication for Hospital and Health System Professionals S U M M E R 2 0 0 8 V O L U M E 6, I S S U E 2 Data for Healthcare Improvement Developing and Applying Avoidable Delay Tracking Working with Difficult
Engaging Students Using Mastery Level Assignments Leads To Positive Student Outcomes
 Lippincott NCLEX-RN PassPoint NCLEX SUCCESS L I P P I N C O T T F O R L I F E Case Study Engaging Students Using Mastery Level Assignments Leads To Positive Student Outcomes Senior BSN Students PassPoint
Population and Sampling Specifications
 Mat erial inside brac ket s ( [ and ] ) is new to t his Specific ati ons Manual versi on. Introduction Population Population and Sampling Specifications Defining the population is the first step to estimate
Validating Pilot Program to Improve Discharge Medication in 12 West at C.S. Mott Children s Hospital. Final Report. Submitted To:
 Validating Pilot Program to Improve Discharge Medication in 12 West at C.S. Mott Children s Hospital Final Report Submitted To: Cathy Lewis, MSN, RN Clinical Nurse Specialist and Adjunct Clinical Instructor
University of Michigan Health System. Analysis of the Patient Admission Process in The University of Michigan Hospital Final Report
 University of Michigan Health System Analysis of the Patient Admission Process in The University of Michigan Hospital Final Report Submitted to: Lori Lathers Training Specialist Senior UMHS, Central Staffing
HOW TO USE THE WARMBATHS NURSING OPTIMIZATION MODEL
 HOW TO USE THE WARMBATHS NURSING OPTIMIZATION MODEL Model created by Kelsey McCarty Massachussetts Insitute of Technology MIT Sloan School of Management January 2010 Organization of the Excel document
Hardwiring Processes to Improve Patient Outcomes
 Hardwiring Processes to Improve Patient Outcomes Barbara Adcock Mohr, Administrative Director, Rehabilitation Services Mark Prochazka, Assistant Director, Rehabilitation Services UNC Hospitals FIM, UDSMR,
THE USE OF SIMULATION TO DETERMINE MAXIMUM CAPACITY IN THE SURGICAL SUITE OPERATING ROOM. Sarah M. Ballard Michael E. Kuhl
 Proceedings of the 2006 Winter Simulation Conference L. F. Perrone, F. P. Wieland, J. Liu, B. G. Lawson, D. M. Nicol, and R. M. Fujimoto, eds. THE USE OF SIMULATION TO DETERMINE MAXIMUM CAPACITY IN THE
Decreasing Environmental Services Response Times
 Decreasing Environmental Services Response Times Murray J. Côté, Ph.D., Associate Professor, Department of Health Policy & Management, Texas A&M Health Science Center; Zach Robison, M.B.A., Administrative
University of Michigan Health System Program and Operations Analysis. Analysis of Problem Summary List and Medication Reconciliation Final Report
 University of Michigan Health System Program and Operations Analysis Analysis of Problem Summary List and Medication Reconciliation Final Report To: John Clark, PharmD, MS, University of Michigan Health
This policy shall apply to all directly-operated and contract network providers of the MCCMH Board.
 Chapter: Title: PROVIDER NETWORK MANAGEMENT Approved by: Executive Director Prior Approval Date: 7/30/02 Current Approval Date I. Abstract This policy establishes the standards and procedures of the Macomb
2013 Workplace and Equal Opportunity Survey of Active Duty Members. Nonresponse Bias Analysis Report
 2013 Workplace and Equal Opportunity Survey of Active Duty Members Nonresponse Bias Analysis Report Additional copies of this report may be obtained from: Defense Technical Information Center ATTN: DTIC-BRR
Workload Analysis of MVN Nurses Team 4 Final Report
 UNIVERSITY OF MICHIGAN Workload Analysis of MVN Nurses Team 4 Final Report Submitted to: Nancy Moran Rose, MPH, RN: Director of Home Care Nursing and MVN/MVC Operations Renee Curtis, RN: Vice-Chair UMPNC
A Comparison of Job Responsibility and Activities between Registered Dietitians with a Bachelor's Degree and Those with a Master's Degree
 Florida International University FIU Digital Commons FIU Electronic Theses and Dissertations University Graduate School 11-17-2010 A Comparison of Job Responsibility and Activities between Registered Dietitians
Exemplary Professional Practice: Staffing Scheduling and Budgeting Processes
 Exemplary Professional Practice: Staffing Scheduling and geting Processes EP10 Nurses use trended data in the budgeting process, with clinical nurse input, to redistribute existing nursing resources or
UNC2 Practice Test. Select the correct response and jot down your rationale for choosing the answer.
 UNC2 Practice Test Select the correct response and jot down your rationale for choosing the answer. 1. An MSN needs to assign a staff member to assist a medical director in the development of a quality
COMMUNITY HEALTH NEEDS ASSESSMENT HINDS, RANKIN, MADISON COUNTIES STATE OF MISSISSIPPI
 COMMUNITY HEALTH NEEDS ASSESSMENT HINDS, RANKIN, MADISON COUNTIES STATE OF MISSISSIPPI Sample CHNA. This document is intended to be used as a reference only. Some information and data has been altered
Occupation Description: Responsible for providing nursing care to residents.
 NOC: 3152 (2011 NOC is 3012) Occupation: Registered Nurse Occupation Description: Responsible for providing nursing care to residents. Key essential skills are: Document Use, Oral Communication, Problem
Driving Business Value for Healthcare Through Unified Communications
 Driving Business Value for Healthcare Through Unified Communications Even the healthcare sector is turning to technology to take a 'connected' approach, as organizations align technology and operational
A Qualitative Study of Master Patient Index (MPI) Record Challenges from Health Information Management Professionals Perspectives
 Record Challenges from Health Information Management Professionals Perspectives") A Qualitative Study of Master Patient Index (MPI) Record Challenges from Health Information Management Professionals Perspectives by Joe Lintz, MS, RHIA Abstract This study aimed gain a better understanding
A Qualitative Study of Master Patient Index (MPI) Record Challenges from Health Information Management Professionals Perspectives by Joe Lintz, MS, RHIA Abstract This study aimed gain a better understanding
Eliminating Common PACU Delays
 Eliminating Common PACU Delays Jamie Jenkins, MBA A B S T R A C T This article discusses how one hospital identified patient flow delays in its PACU. By using lean methods focused on eliminating waste,
University of Michigan Health System. Inpatient Cardiology Unit Analysis: Collect, Categorize and Quantify Delays for Procedures Final Report
 Project University of Michigan Health System Program and Operations Analysis Inpatient Cardiology Unit Analysis: Collect, Categorize and Quantify Delays for Procedures Final Report To: Dr. Robert Cody,
VA Compensation and Pension Capstone
 VA Compensation and Pension Capstone Design Team Carrie Abbamonto, Chelsey Bowman, Jeffrey Condon, Kevin Urso Design Advisor Prof. James Benneyan Abstract The United States government has made a promise
A Primer on Activity-Based Funding
 A Primer on Activity-Based Funding Introduction and Background Canada is ranked sixth among the richest countries in the world in terms of the proportion of gross domestic product (GDP) spent on health
Tehama County Health Services Agency Mental Health Division Quality Improvement Program
 Tehama County Health Services Agency Mental Health Division Quality Improvement Program The Mental Health Plan (MHP) shall have a written Quality Improvement (QI) Program Description in which structure
Managing Hospital Costs in an Era of Uncertain Reimbursement A Six Sigma Approach
 Managing Hospital Costs in an Era of Uncertain Reimbursement A Six Sigma Approach Prepared by: WO L December 8, 8 Define Problem Statement As healthcare costs continue to outpace inflation and rise over
Work Effort Analysis
 Coordinator: Dolorese Umar The University of Michigan, Ann Arbor Special Projects in Hospital Systems Client: Karolyn Brewer Industrial and Operations Engineering 481 Vivek Gupta Sonia Raheja Julie Simmons
Homework No. 2: Capacity Analysis. Little s Law.
 Service Engineering Winter 2010 Homework No. 2: Capacity Analysis. Little s Law. Submit questions: 1,3,9,11 and 12. 1. Consider an operation that processes two types of jobs, called type A and type B,
Lean Six Sigma DMAIC Project (Example)
") Lean Six Sigma DMAIC Project (Example) Green Belt Project Objective: To Reduce Clinic Cycle Time (Intake & Service Delivery) Last Updated: 1 15 14 Team: The Speeders Tom Jones (Team Leader) Steve Martin
Lean Six Sigma DMAIC Project (Example) Green Belt Project Objective: To Reduce Clinic Cycle Time (Intake & Service Delivery) Last Updated: 1 15 14 Team: The Speeders Tom Jones (Team Leader) Steve Martin
The Monthly Publication of the National Hospice and Palliative Care Organization
 The Monthly Publication of the National Hospice and Palliative Care Organization Print-friendly PDF From June 2013 Issue Determining Caseloads Gilchrist Hospice Care on Its Process By Regina Shannon Bodnar,
University of Michigan Health System. Inpatient Tracking Analysis and Process Standardization at. Mott Children s and Women s Hospital.
 University of Michigan Health System Program and Operations Analysis Inpatient Tracking Analysis and Process Standardization at Mott Children s and Women s Hospital Final Report Team 6 To: Perry Spencer,
Medido, a smart medication dispensing solution, shows high rates of medication adherence and potential to reduce cost of care.
 White Paper Medido, a smart medication dispensing solution, shows high rates of medication adherence and potential to reduce cost of care. A Philips Lifeline White Paper Tine Smits, Research Scientist,
Nursing and Personal Care: Funding Increase Survey
 Nursing and Personal Care: Funding Increase Survey Prepared for: Ministry of Health and Long-Term Care Long Term Care Facilities Branch 5 th Floor, Hepburn Block 80 Grosvenor Street Toronto, Ontario Prepared
Oklahoma Health Care Authority. ECHO Adult Behavioral Health Survey For SoonerCare Choice
 Oklahoma Health Care Authority ECHO Adult Behavioral Health Survey For SoonerCare Choice Executive Summary and Technical Specifications Report for Report Submitted June 2009 Submitted by: APS Healthcare
NCLEX PROGRAM REPORTS
 for the period of OCT 2014 - MAR 2015 NCLEX-RN REPORTS US48500300 000001 NRN001 04/30/15 TABLE OF CONTENTS Introduction Using and Interpreting the NCLEX Program Reports Glossary Summary Overview NCLEX-RN
Hospitals organize medications according to a formulary
 INNOVATIONS IN PHARMACY PRACTICE: CLINICAL PRACTICE Going through the Motions: A Time-and- Motion Study of Workload Associated with Nonformulary Medication Orders Elaine Chang, Angus Kinkade, Anthony C
NHS WALES INFORMATICS SERVICE DATA QUALITY STATUS REPORT ADMITTED PATIENT CARE DATA SET
 NHS WALES INFORMATICS SERVICE DATA QUALITY STATUS REPORT ADMITTED PATIENT CARE DATA SET Version: 1.0 Date: 17 th August 2017 Data Set Title Admitted Patient Care data set (APC ds) Sponsor Welsh Government
Proceedings of the 2016 Winter Simulation Conference T. M. K. Roeder, P. I. Frazier, R. Szechtman, E. Zhou, T. Huschka, and S. E. Chick, eds.
 Proceedings of the 2016 Winter Simulation Conference T. M. K. Roeder, P. I. Frazier, R. Szechtman, E. Zhou, T. Huschka, and S. E. Chick, eds. IDENTIFYING THE OPTIMAL CONFIGURATION OF AN EXPRESS CARE AREA
LEAN Transformation Storyboard 2015 to present
 LEAN Transformation Storyboard 2015 to present Rapid Improvement Event Med-Surg January 2015 Access to Supply Rooms Problem: Many staff do not have access to supply areas needed to complete their work,
2012 Report. Client Satisfaction Survey PSA 9 RICK SCOTT. Program Services, Direct Service Workers, and. Impact of Programs on Lives of Clients
 RICK SCOTT GOVERNOR 2012 Report CHARLES T. CORLEY SECRETARY Client Satisfaction Survey Program Services, Direct Service Workers, and Impact of Programs on Lives of Clients PSA 9 elderaffairs.state.fl.us
Begin Implementation. Train Your Team and Take Action
 Begin Implementation Train Your Team and Take Action These materials were developed by the Malnutrition Quality Improvement Initiative (MQii), a project of the Academy of Nutrition and Dietetics, Avalere
PATIENT ATTRIBUTION WHITE PAPER
 PATIENT ATTRIBUTION WHITE PAPER Comment Response Document Written by: Population-Based Payment Work Group Version Date: 05/13/2016 Contents Introduction... 2 Patient Engagement... 2 Incentives for Using
Simulering av industriella processer och logistiksystem MION40, HT Simulation Project. Improving Operations at County Hospital
 Simulering av industriella processer och logistiksystem MION40, HT 2012 Simulation Project Improving Operations at County Hospital County Hospital wishes to improve the service level of its regular X-ray
Improving Mott Hospital Post-Operative Processes
 Improving Mott Hospital Post-Operative Processes Program and Operation Analysis Submitted To: Sheila Trouten, Client Nurse Manager, PACU, Mott OR Jesse Wilson, Coordinator Administrative Manager of Surgical
Prepared for North Gunther Hospital Medicare ID August 06, 2012
 Prepared for North Gunther Hospital Medicare ID 000001 August 06, 2012 TABLE OF CONTENTS Introduction: Benchmarking Your Hospital 3 Section 1: Hospital Operating Costs 5 Section 2: Margins 10 Section 3:
2015 Lasting Change. Organizational Effectiveness Program. Outcomes and impact of organizational effectiveness grants one year after completion
 Organizational Effectiveness Program 2015 Lasting Change Written by: Outcomes and impact of organizational effectiveness grants one year after completion Jeff Jackson Maurice Monette Scott Rosenblum June
Appendix A Registered Nurse Nonresponse Analyses and Sample Weighting
 Appendix A Registered Nurse Nonresponse Analyses and Sample Weighting A formal nonresponse bias analysis was conducted following the close of the survey. Although response rates are a valuable indicator
PANELS AND PANEL EQUITY
 PANELS AND PANEL EQUITY Our patients are very clear about what they want: the opportunity to choose a primary care provider access to that PCP when they choose a quality healthcare experience a good value
Applying Critical ED Improvement Principles Jody Crane, MD, MBA Kevin Nolan, MStat, MA
 These presenters have nothing to disclose. Applying Critical ED Improvement Principles Jody Crane, MD, MBA Kevin Nolan, MStat, MA April 28, 2015 Cambridge, MA Session Objectives After this session, participants
New Jersey State Legislature Office of Legislative Services Office of the State Auditor. July 1, 2011 to September 7, 2016
 New Jersey State Legislature Office of Legislative Services Office of the State Auditor Department of Human Services Division of Mental Health and Addiction Services Integrated Case Management Services,
Appendix: Data Sources and Methodology
 Appendix: Data Sources and Methodology This document explains the data sources and methodology used in Patterns of Emergency Department Utilization in New York City, 2008 and in an accompanying issue brief,
practice standards CFP CERTIFIED FINANCIAL PLANNER Financial Planning Practice Standards
 practice standards CFP CERTIFIED FINANCIAL PLANNER Financial Planning Practice Standards CFP Practice Standards TABLE OF CONTENTS PREFACE TO THE CFP PRACTICE STANDARDS............................................................................
Employers are essential partners in monitoring the practice
 Innovation Canadian Nursing Supervisors Perceptions of Monitoring Discipline Orders: Opportunities for Regulator- Employer Collaboration Farah Ismail, MScN, LLB, RN, FRE, and Sean P. Clarke, PhD, RN, FAAN
University of Michigan Health System MiChart Department Improving Operating Room Case Time Accuracy Final Report
 University of Michigan Health System MiChart Department Improving Operating Room Case Time Accuracy Final Report Submitted To: Clients Jeffrey Terrell, MD: Associate Chief Medical Information Officer Deborah
Improving Patient Throughput in the Emergency Department
 University of Michigan Health System Program and Operations Analysis Improving Patient Throughput in the Emergency Department To: Jennifer Holmes, Director of Operations, Emergency Department Sam Clark,
* WELCOME TO THE GCRC CENSUS * * SYSTEM *
 MANAGING GENERAL CLINICAL RESEARCH CENTER (GCRC) IN/OUfPATIENT CENSUS DATA USING THE SAS SYSTEM AND DEC VAX VMS DCL Jacqueline A. Wendel, University Of Rochester The National Institutes of Health (NIH)
Report on Feasibility, Costs, and Potential Benefits of Scaling the Military Acuity Model
 Report on Feasibility, Costs, and Potential Benefits of Scaling the Military Acuity Model June 2017 Requested by: House Report 114-139, page 280, which accompanies H.R. 2685, the Department of Defense
Let s Talk Informatics
 Let s Talk Informatics Discrete-Event Simulation Daryl MacNeil P.Eng., MBA Terry Boudreau P.Eng., B.Sc. 28 Sept. 2017 Bethune Ballroom, Halifax, Nova Scotia Please be advised that we are currently in a
Guidelines For The Calculation Of Individual Psychiatric Residential Treatment Center (RTC) Per Diem Rates
 Per Diem Rates") Chapter 7 TRICARE Reimbursement Manual 6010.58-M, February 1, 2008 Mental Health Addendum B Guidelines For The Calculation Of Individual Psychiatric Residential Treatment Center (RTC) Per 1.0 DATA COLLECTION
Chapter 7 TRICARE Reimbursement Manual 6010.58-M, February 1, 2008 Mental Health Addendum B Guidelines For The Calculation Of Individual Psychiatric Residential Treatment Center (RTC) Per 1.0 DATA COLLECTION
Demographic Profile of the Officer, Enlisted, and Warrant Officer Populations of the National Guard September 2008 Snapshot
 Issue Paper #55 National Guard & Reserve MLDC Research Areas Definition of Diversity Legal Implications Outreach & Recruiting Leadership & Training Branching & Assignments Promotion Retention Implementation
Sample Exam Questions. Practice questions to prepare for the EDAC examination.
 Sample Exam Questions Practice questions to prepare for the EDAC examination. About EDAC EDAC (Evidence-based Design Accreditation and Certification) is an educational program. The goal of the program
University of Michigan Health System
 University of Michigan Health System Program and Operations Analysis Utilization Study of Linear Accelerators in the Radiation Oncology Department Project Report To: Kathy Lash: Director of Operations
NHS WALES INFORMATICS SERVICE DATA QUALITY STATUS REPORT ADMITTED PATIENT CARE DATA SET
 NHS WALES INFORMATICS SERVICE DATA QUALITY STATUS REPORT ADMITTED PATIENT CARE DATA SET Version: 1.0 Date: 1 st September 2016 Data Set Title Admitted Patient Care data set (APC ds) Sponsor Welsh Government
LV Prasad Eye Institute Annotated Bibliography
 Annotated Bibliography Finkler SA, Knickman JR, Hendrickson G, et al. A comparison of work-sampling and time-and-motion techniques for studies in health services research.... 2 Zheng K, Haftel HM, Hirschl
Improving Clinical Flow ECHO Collaborative Change Package
 Primary Drivers (driver diagram) Change Concepts Change Ideas Examples, Tips, and Resources Engaged Leadership Develop culture for transformation Use walk-arounds and attendance at team meetings to talk
MaRS 2017 Venture Client Annual Survey - Methodology
 MaRS 2017 Venture Client Annual Survey - Methodology JUNE 2018 TABLE OF CONTENTS Types of Data Collected... 2 Software and Logistics... 2 Extrapolation... 3 Response rates... 3 Item non-response... 4 Follow-up
(Signed original copy on file)
") CFOP 75-8 STATE OF FLORIDA DEPARTMENT OF CF OPERATING PROCEDURE CHILDREN AND FAMILIES NO. 75-8 TALLAHASSEE, September 2, 2015 Procurement and Contract Management POLICIES AND PROCEDURES OF CONTRACT OVERSIGHT
CFOP 75-8 STATE OF FLORIDA DEPARTMENT OF CF OPERATING PROCEDURE CHILDREN AND FAMILIES NO. 75-8 TALLAHASSEE, September 2, 2015 Procurement and Contract Management POLICIES AND PROCEDURES OF CONTRACT OVERSIGHT
Analysis and Optimization of Emergent & Urgent Response Nurses
 Analysis and Optimization of Emergent & Urgent Response Nurses Final Report The University of Michigan Health System The University Hospital, Nursing Department Submitted To: Kathleen Moore, Client Administrative
RETRIEVAL AND CRITICAL HEALTH INFORMATION SYSTEM
 RETRIEVAL AND CRITICAL HEALTH INFORMATION SYSTEM USER GUIDE November 2014 Contents Introduction... 4 Access to REACH... 4 Homepage... 4 Roles within REACH... 5 Hospital Administrator... 5 Hospital User...
The Pennsylvania State University. The Graduate School ROBUST DESIGN USING LOSS FUNCTION WITH MULTIPLE OBJECTIVES
 The Pennsylvania State University The Graduate School The Harold and Inge Marcus Department of Industrial and Manufacturing Engineering ROBUST DESIGN USING LOSS FUNCTION WITH MULTIPLE OBJECTIVES AND PATIENT
CHAPTER 5 AN ANALYSIS OF SERVICE QUALITY IN HOSPITALS
 CHAPTER 5 AN ANALYSIS OF SERVICE QUALITY IN HOSPITALS Fifth chapter forms the crux of the study. It presents analysis of data and findings by using SERVQUAL scale, statistical tests and graphs, for the
2016 Survey of Michigan Nurses
 2016 Survey of Michigan Nurses Survey Summary Report November 15, 2016 Office of Nursing Policy Michigan Department of Health and Human Services Prepared by the Michigan Public Health Institute Table of
Reference costs 2016/17: highlights, analysis and introduction to the data
 Reference s 2016/17: highlights, analysis and introduction to the data November 2017 We support providers to give patients safe, high quality, compassionate care within local health systems that are financially
Building a Lean Team. Using Lean Methodology to Develop a Collaborative Rounding Model. April 28 th, 2010
 Building a Lean Team Using Lean Methodology to Develop a Collaborative Rounding Model April 28 th, 2010 Faculty APD, Internal Medicine Residency Program Co-Sponsor, LEAN Improvement Team APD, Internal
uncovering key data points to improve OR profitability
 REPRINT March 2014 Robert A. Stiefel Howard Greenfield healthcare financial management association hfma.org uncovering key data points to improve OR profitability Hospital finance leaders can increase
Measuring the Cost of Patient Care in a Massachusetts Health Center Environment 2012 Financial Data
 Primary Care Provider Costs Measuring the Cost of Patient Care in a Massachusetts Health Center Environment 0 Financial Data Massachusetts Respondents Alexander, Aronson, Finning & Co., P.C. (AAF) was
Models and Insights for Hospital Inpatient Operations: Time-of-Day Congestion for ED Patients Awaiting Beds *
 Vol. 00, No. 0, Xxxxx 0000, pp. 000 000 issn 0000-0000 eissn 0000-0000 00 0000 0001 INFORMS doi 10.1287/xxxx.0000.0000 c 0000 INFORMS Models and Insights for Hospital Inpatient Operations: Time-of-Day