Community Health Needs Assessment
|
|
|
- Benedict Wade
- 5 years ago
- Views:
Transcription


1 Community Health Needs Assessment Presented By: Robeson County Health Department and Southeastern Health in partnership with the Healthy Robeson Task Force
2 Table of Contents Acknowledgements...2 Executive Summary...3 Value of the Community Health Assessment....4 Chapter 1 - Background and Introduction Community Health Assessment Process Community Health Assessment Team Chapter 2 - County Description Geographic History Demographics Chapter 3 - Health Data Process Health Resource Inventory Community Opinion Survey Chapter 4 Health Data Results Community Opinion Survey Results Demographics Preparedness & Response Data Community Listening Tours Chapter 5 - Secondary Data Results Mortality Morbidity Substance Abuse Health Care Determinants of Health Chapter 6 Prevention and Health Promotion Chapter 7 Priorities Chapter 8 Next Steps Appendices (A) Community Health Assessment Team (B) Resource Directory (C) Community Opinion Survey (D) Affordable Care Act Coverage for North Carolina...64 (E) Implementation Strategies (Action Plans) (F) Community Benefit Report

3 September 2014 Dear Robeson County Citizens, We are pleased to bring you this community health report as a snapshot of community health successes and challenges we currently face as a county. Now, more than ever, we recognize the value of partnerships for establishing strong public health improvements in our communities. As we work to improve overall health in Robeson County, we ask you to join us in our journey. Since the inception of the County Health Rankings in 2010, Robeson County has consistently ranked 100 th in Health Factors. However, over the past five years Robeson has slightly improved in Health Outcomes. In March 2014, Robeson was ranked the 97 th county in North Carolina. Although we have improved from 99 th in Health Outcomes, these rankings are evident that there are numerous opportunities to improve both Health Factors and Health Outcomes. This emphasizes the importance of our Community Health Needs Assessment, because it helps us identify and address factors that affect the health of our community. As our county continues to evolve and grow we, must make sure that we take the necessary steps to ensure that the needs of all our citizens are being addressed. We realize that when it comes to public health, the community itself is the patient, and the health of the community must be assessed by focusing on key areas such as behavioral and social health, the economy, education, environmental health, physical health and safety. Every three years, Robeson County conducts a comprehensive community examination through a process known as the Community Health Needs Assessment (CHNA). This year, the assessment process was a collaborative effort between Robeson County Health Department, Southeastern Health and Healthy Robeson Taskforce, which is inclusive of more than 40 non-profit, government, faith-based, education, media, and business organizations. The many hours volunteered by the Community Health Needs Assessment Team and the input provided by Robeson County residents has been invaluable to this process. Working with our partners, the assessment included collecting information from citizen opinion surveys, listening tours, and statistical data to identify community health needs and resources. We hope the findings of this CHNA will be used to develop strategies that address our community s priorities and promote the health of residents across Robeson County. We know that with all of us working together, we can create a healthier, safer community while having a better idea of where we need to focus our resources over the next few years. In Health, Joann Anderson President & CEO Southeastern Health 1

4 Acknowledgements The Robeson County Health Department, Southeastern Health, and the Healthy Robeson Task Force wish to thank all of the people and organizations that have made the 2014 Community Health Assessment report and process possible. Over 800 community residents and representatives from local organizations participated in the health assessment process. A complete list of contributors is included in Appendix A. Peace I ask of thee, O River Peace, peace, peace When I learn to live serenely Cares will cease. From the hills I gather courage Visions of the days to be Strength to lead and faith to follow All are given unto me Peace I ask of thee, O River Peace, peace, peace. The Lumber River The Lumber River name symbolizes the thriving lumber industry in the area and its use for transporting logs in the 18th century. 2
5 Executive Summary A Community Health Needs Assessment (CHNA) is a process by which community members gain an understanding of the health, concerns and health care systems of the community by identifying, collecting, analyzing, and disseminating information on community assets, strengths, resources and needs. There are four basic steps to the assessment process: (1) determine the health status of the community, (2) assess risk factors associated with identified health problems, (3) identify the health care resources available in our community to promote action directed toward the identified problems and (4) establish health priorities and the appropriate interventions. Every three years, local health departments across the state of North Carolina are mandated to complete a comprehensive Community Health Needs Assessment. It is a requirement of the consolidated agreement between the health departments and the NC Division of Public Health, but the project requires community involvement and collaboration. Although many hospitals were already partnering with health departments to complete this project, the Internal Revenue Service recently mandated that all not-for-profit hospitals participate in a community health assessment every three years. In the Spring of 2014, Robeson County Department of Public Health and Southeastern Health began the implementation of a Community Health Needs Assessment for Robeson County. The effort focused on assessing community health needs, local health resources, barriers to care, gaps in services and trends regarding health and healthy lifestyles. The resulting CHNA will be utilized to document community needs and link those needs to community benefit efforts. The needs assessment will be utilized to assist the health department and hospital in planning and prioritizing its community outreach and programs through action plans and strategic planning. Through this assessment, health concerns that affect our population, including available resources to address these concerns, have been identified. The assessment report serves as a basis for improving and promoting the health of Robeson County residents and will be used as a planning tool to determine the focus and direction in addressing health and community concerns through Results of Survey Summary (Top Five Responses) Leading Causes of Death Priority Health Issues Priority Risk Factors Leading Factors Affec ng Families Seeking Medical Treatment Barriers Impac ng Quality of Health Care Heart Disease, Cancer, Alzheimer s Disease, Diabetes & Cerebrovascular Disease Chronic Disease, Illegal Drug Use, Prescrip on Drug Abuse, Obesity & Gangs/ Violence Job Opportuni es, Healthier Food Choices, Addi onal Health Services, Wellness Recrea onal Facili es/ Safe Places to Walk and Play Lack of Insurance, Wait Too Long at Doctor s Office, Transporta on, Fear/ Not Ready to Face Problem and No Appointments Available Economic, Literacy, Age, Race and Language The Robeson County Community Health Assessment Survey was developed and distributed throughout the county to collect primary data from the community. Over 800 surveys were returned out of 1200 either distributed or answered via Survey Monkey. Following is data related to the survey. Action Steps Selection of Priority Areas based upon needs assessment results (Obesity and Substance Misuse & Abuse) Development of Action Plans to focus on enhancing walking trails and bicycle trails and reduce the use of prescription drugs in Robeson County Dissemination of Needs Assessment results throughout the community Implementation of Action Plans 3
6 Value of CHNA to the Community The CHNA allows communities and key stakeholders to: Share the findings and educate local residents, health care providers, and students regarding pressing health problems Empower others to take action Identify emerging issues, provide data for deciding programmatic/ organizational decisions, and plan effective, collaborative interventions to promote better health Advocate for community change with politicians and other local decision-makers Promote collaboration and partnership among community members and groups Furnish a baseline by which to monitor changes Provide as a reference point and a historical perspective for future county assessments Provide a resource for activities such as writing grant applications Serve as a model for other counties who are planning an assessment 4
7 Chapter 1: Background & Introduction Community Health Assessment Process The North Carolina Community Health Needs Assessment process engages communities in eight-phases, which are designed to encourage a systematic approach to involving residents in assessing problems and strategizing solutions. The eight phases are as follows: Phase 1 Establish a CHNA Team Phase 2 Collect Primary Data Phase 1: Establish a CHNA Team-The first step is to establish a Community Health Needs Assessment Team to lead the community assessment process. This group consists of motivated individuals who act as advocates for a broad range of community members and appropriately represent the concerns of various populations within the community. Phase 3 Collect Secondary Data Phase 4 Collect and Analyze Primary and Secondary Data Phase 2: Collect Primary Data- In this phase, the Community Health Assessment Team collects local data to discover residents viewpoints and concerns about life in the community, health concerns, and other issues important to the people. Community interests and concerns extend beyond the statistical information readily available to health organizations involved in conducting the assessment process. It is important to assess the status of the community according to the people. Methods of collecting primary data include interviews, listening sessions and focus groups. A process of asset mapping is also helpful. Through this process, residents assist the health assessment team in identifying the community s many positive aspects. Phase 5 Determine Health Priorities Phase 6 Create the CHNA Document Phase 7 Disseminate the CHNA Document Phase 8 Develop Community Health Action Plans 5
8 Phase 3: Collect Secondary Data - In this phase, the Community Health Assessment Team compares the local health statistics with those of the state and previous years to identify possible health problems in the community. Local data that other agencies or institutions have researched is often included in the analysis. Putting this information together provides a clearer picture of what is happening in the community. Phase 4: Analyze and Interpret County Data - In this phase, the Community Health Assessment Team reviews the data from Phases 2 and 3 in detail. By the end of this phase, the Team has obtained a general understanding of the community's major health issues. Phase 5: Determine Health Priorities - The Community Health Assessment Team reports the results of the assessment to the community and encourages the input of residents. Then, the Community Health Assessment Team, along with other community members, determines the priority health issues to be addressed. Phase 6: Create the Community Health Assessment Document - In this phase, the Community Health Assessment Team develops a stand alone report to document the process, as well as the findings, of the entire assessment effort. The purpose of this report is to share assessment results and plans with the entire community and other interested stakeholders. At the end of this phase, the community transitions from assessment to action by initiating the development of Community Health Action Plans. Phase 7: Disseminate the Community Health Assessment Document - In this phase, the Community Health Assessment Team informs the community of the assessment findings. Results are shared through a variety of approaches including the use of local media, website postings, and availability of copies through the public libraries, local community colleges and universities. Phase 8: Develop Community Health Action Plans - In this phase, the Community Health Assessment Team develops a plan of action for addressing the health issues deemed as priorities in Phase 5. Community Health Action Plans feature strategies for developing intervention and prevention activities. 6

9 Community Health Needs Assessment Team The first step in putting Robeson County s Community Health Assessment Team in motion was to designate the Co-Facilitators. The county s Public Health Education Director and the local hospital s Healthy Robeson Task Force Coordinator were selected to fulfill these roles. These two individuals were ultimately responsible for maintaining the overall flow of the community health needs assessment process and ensuring that others participating in the process were kept abreast of progress made, as well as tasks yet to be completed. Meetings of the Co-Facilitators began in the spring of Initial meetings included the review and re-evaluation of the 2011 community health assessment process and the resulting widely disseminated documentation of findings, priorities and action steps. Also discussed was the recruitment of potential CHNA 2014 team members. By June 2014, the CHNA Team was formed and subcommittees were established. Members of Healthy Robeson Task Force, formerly known as the Robeson County Partnership for Community Health, served as the Team s Advisory Group. The Advisory Group met for a defined period of time; reviewed the CHNA process materials, statistics, survey data, and other forms of pertinent information; and served as community advocates for the assessment process, which included identification of resources and support. The CHNA Team Work Group was a subset of the Advisory Group. The Work Group planned for collecting, analyzing, and interpreting the data. The Data Collection/Analysis Team met to discuss survey distribution; as well as data availability, collection and analysis. A wide variety of secondary data was reviewed, including local, state and national. When available, trend data was analyzed. The CHNA Team met in August 2014 to hear the findings of the assessment and to identity leading health problems. From left to right: Amanda Roberts, Carlotta Winston, Lori Dove, Lynn Wieties, Brandon Rivera, Elizabeth Wright, David Lee, Phillip Richardson, Lekisha Hammonds, Niakeya Jones. Not Pictured: Cynthia George, Bob Hollingsworth, and Montressa Smith 7
10 Assessment Team Structure Project Co- Facilitators Work Group 1: Community Health Survey Team 2014 Community Health Assessment Team Work Group 2: Data Collection and Analysis Team Advisory Group 8


11 Chapter 2: County Description Geographic Features Robeson County is bordered by the North Carolina counties of Bladen, Columbus, Cumberland, Hoke and Scotland, and the state of South Carolina. According to the U.S. Census Bureau, the county has a total area of 951 square miles making it the largest in North Carolina. Of that figure, 949 square miles are land and 2 are water (0.23%). Moreover, numerous swamps that generally flow in a northwest to southeast course characterize the area and eventually drain into the Lumber River. The highest densities of swamps are found in the areas of the county most widely populated by the Lumbee Indian Tribe 9

12 History Robeson County has a rich history that goes back farther than 1787 when it was carved out of Bladen County, the Mother County. It was created because the residents of the area felt that their center of government needed to be closer, and that the huge county of Bladen was simply too unwieldy. It was named for Colonel Thomas Robeson, hero of the Revolutionary War Battle of Elizabethtown. The courthouse was erected on land which formerly belonged to John Willis. A lottery was used to dispose of the lots and to establish the town. In 1788, Lumberton, which is the county seat, was established. The county is divided into twentynine townships: Alfordsville, Back Swamp, Britts, Burnt Swamp, East Howellsville, Fairmont, Gaddy, Lumber Bridge, Maxton, Orrum, Parkton, Pembroke, Philadelphus, Raft Swamp, Raynham, Red Springs, Rennert, Rowland, Saddletree, Shannon, Smiths, Smyrna, St. Pauls, Sterlings, Thompson, Union, West Howellsville, Whitehouse, and Wishart. The county is called The State of Robeson not only because of its size, but because of its fierce independence and self-reliance. It is unique in its large minority population. The county combines a rich heritage of the Native American Lumbee tribe (largest Native American tribe east of the Mississippi), the African American community, and many descendants of the numerous Scottish and European settlers who arrived before and during the Revolution. Over the centuries, these people have worked together to create a culturally diverse community. 10
13 Demographics According to the 2010 U.S. Census Robeson County s total population is 134,188. This is an 8.8% population change from 2000 when the total population was 123,339. Robeson is a rural county with over 65% of the total population living in farm and nonfarm areas. Robeson County s population is young. The largest percentage (30.2%) of the population is between the ages of 0-19 and the median age is 34, which increased by 2 years since the 2000 Census data. Population & Growth Population Annual Growth Rate 2010 Total Population 134, Total Population 123,339 Population Change, 2000 to , % Urban/Rural Representation Population Urban/Rural Percent 2010 Total Population: Urban 50, % 2000 Total Population: Urban 42, % 2010 Total Population: Rural 84, % 2000 Total Population: Rural 80, % Estimated Population by Age Population Population by Age, % Est Projected Median Age Median Age Median Age Total Pop , % 2010 Total Pop , % 2010 Total Pop , % 2010 Total Pop , % 2010 Total Pop , % 2010 Total Pop , % 11


14 Demographics Continued... Robeson County is one of the 10% of United States counties that are majority-minority; its combined population of American Indian, African American and Latino residents comprise over 70% of the total population. Health disparities are well documented in minority populations such as African Americans, Native Americans, Asian Americans, and Latinos. When compared to European Americans, these minority groups have a higher incidence of chronic diseases, poorer health outcomes and mortality. Graph: Population by Age and Race, 2000 Census - Robeson County, North Carolina 12
15 Chapter 3: Data Collection Process Given that the entire CHNA is centered upon listening and learning from the voices of the community, the CHNA Team collected data from a diverse representation of Robeson County residents. In order to ensure that data collected was representative of the county s entire population; surveys were geographically dispersed among Robeson County s cities and townships. The three types of data collection methods included an inventory of health resources, community opinion survey, and listening tours from the community. The collaboration of various community partners and the availability of data resources eliminated any information gaps that would have limited the hospital s ability to assess the needs of the community. Our primary data was obtained through the community opinion survey and community listening tours. Our secondary data came from various local agencies comprising the Healthy Robeson task force, as well as the State Center for Health Statistics (SCHS) and other state-level resources. Primary data is essentially what the community tells us and secondary statistics consists of what other resources show us. Health Resource Inventory An inventory of Health Resources was conducted by an intern working with the Healthy Robeson Task Force. The intern conducted interviews with over 40 county agencies to determine the types of programs they offered and the populations they serve. The information obtained from the interviews was compiled and findings were presented during a Healthy Robeson Task Force meeting. The Community Health Assessment Team further analyzed the resource data to determine (1) the current agencies and organizations that have some effect on health, and (2) the resources that are currently lacking. It was determined that Robeson County has several health agencies and organizations that impact the health of the population. However, access and utilization of these services are major concerns. Barriers include limited or no transportation, lack of health insurance, lack of knowledge, cultural norms and fear. 13
16 Community Opinion Survey The Community Health Survey Team was responsible for developing the assessment tool. In 2010, the team worked with hospitals and health departments on a regional level to develop a survey template that could be used in each county. For the current community health needs assessment, the team reviewed and revised the assessment tool to align with current issues and trends. The survey included 25 questions. Of that number, 12 were relevant to health and human service, 4 pertained to preparedness and response, and 9 were designed to capture the demographic makeup of persons completing the survey. This one page assessment tool was available in both English and Spanish. Location # of Surveys Distributed Lumberton 590 Red Springs 94 Pembroke 82 Fairmont 72 Maxton 67 St. Pauls 66 Rowland 28 The Community Health Survey Team targeted a return rate of 500 surveys; to guarantee that rate they opted to distribute 1,000. The surveys were distributed by zip codes and quantities were based upon the number of persons residing within the codes. For example, the zip codes for the Lumberton area comprise over 59% of Robeson s population. Therefore, over 590 surveys were distributed. The Community Survey Team followed this procedure for each zip code. This method helped to ensure that representation was received from communities throughout the county. In addition, 124 online surveys were distributed via link. The Survey team and the Data Collection/Analyst team consisted of individuals from various communities, agencies and organizations. The teams were responsible for distributing the survey, as well as tallying and analyzing the results. A total of 820 surveys were returned, thus surpassing the team s initial expectation. Survey data was analyzed by entering information into Survey Monkey, an online survey tool used to find trends and statistical significance. 14

17 Chapter 4: Health Data Results This chapter uses data summarized from the community health needs assessment process to describe the overall health status, opinions, and needs of county residents. Results of the primary data collected using the Community Opinion Survey are included, as well secondary data obtained from various other local and state-level resources. Mortality data pertaining to the county s leading causes of death are featured, and infant mortality rates are reviewed as well. Morbidity and substance misuse/abuse data are cited in an effort to portray the burden of disease among our residents. Health care data illustrate the county s needs and resources and how county residents view these needs and resources. Finally, determinants of health data provide an overview of the various factors influencing the health of our county s residents. The first three pages represent demographic information from survey respondents. The next sixteen respond to the health & service data responses. 15


18 Demographics This section of the survey included questions pertaining to the characteristics of the respondents. Of the surveys returned, 73% were completed by females and 27% by males. Surveys were received from all age groups with the majority of the respondents being between the ages of Additionally, there was representation from all areas in Robeson County. The majority of the surveys were completed in Lumberton. Female 563 Male % 27.26% % % % % Under % % Over % Lumberton 250 Pembroke % 13.22% Fairmont % St. Pauls % Maxton % Rowland % Other % Red Springs % Orrum % Parkton % 16


19 The race and ethnicity of respondents mirrors that of Robeson County. As indicated on page 13, Robeson County s racial and ethnic makeup consists of the following: Native American-37%, Caucasian-28%, African American-23%, and Hispanic-5%. Survey respondents included the following: Caucasian-35%, Native American-31%, African American-30%, and Hispanic 5%. Although the percentages do not exactly match those of the county, the Community Health Assessment Team felt they received a diverse representation of Robeson County s racial and ethnic makeup. No 703 Yes % 4.87% White/ Caucasian Na ve % % Two or % more races Other % American Black / African American % Asian % Pacific 0 0% Islander Live & Work % Live % Neither % Work % 17


20 Questions were asked to determine if the respondent had health insurance, which area hospital he/she visited when seeking care and where the survey was completed. The majority of persons completing the survey lives and works in Robeson County. Results also indicate that 16% of persons surveyed do not have health insurance and 33% seek hospital care outside of the county. As previously mentioned on page 10, Robeson County is bordered by the state of South Carolina, and the North Carolina counties of Bladen, Columbus, Cumberland, Hoke, and Scotland. Therefore, persons residing in the outlying areas are inclined to travel to neighboring counties for both emergency department visits and impatient care. Hospitals Yes % No % No, but had it prior % Southeastern % Health Scotland Healthcare System % McLeod Health % Cape Fear Valley Hospital First Health (Moore County) % % Other % 18 New Hanover Regional Medical Center Bladen County Hospital Columbus Regional Healthcare System % % %
21 Question 1: How do you rate your own health? (Check only one) Good 42.08% 2 Very Good 28.09% 3 Fair 16.96% Excellent 8.17% 5 Poor 3.84% 6 Don t Know/ Not Sure 0.87% Total Responses Good Very Good Fair Excellent Poor Don't know/ Not Sure Summary The graph and chart above show the number and percentage of the population surveyed who self reported their personal health. As shown, the majority of the respondents feel they are in good health. Caucasian Disparities African American Native American Trend Data This data is near identical from the responses from the 2011 Community Health Assessment. In 2011, good was the top response with 42.54%. Disparities This data reflects no racial disparities. Good 45.24% 42.20% 39.04% Very Good 29.96% 23.39% 31.58% Fair 12.45% 22.02% 16.23% Excellent 9.73% 7.80% 7.46% Impact on Community We feel, this data shows a sense of urgency to educate people in this community to better their own health & wellness. Poor 2.33% 4.13% 3.95% Don t Know/ Not Sure 0.39% 0.46% 1.75% Plan of Action To be finalized at the October 2014 Healthy Robeson Task Force Meeting. 19
22 Question 2: Have you ever been told by a doctor, nurse, or health care professional that you have any of the following? (Check all that apply) High Blood 35.86% Pressure 2 Overweight / 29.32% Obesity 3 High Cholesterol 25.0% None 22.51% 5 Arthri s 17.28% Diabetes 17.02% 7 Depression 11.52% 50 0 Asthma Depression Diabetes Arthritis None High Cholesterol Overweight/Obesity High Blood Pressure Osteoporosis Cancer Other Heart Disease / Angina 2 Dementia Lupus Lung Disease 8 Asthma 9.16% 9 Heart Disease / Angina 4.71% 10 Other 4.58% 11 Cancer 3.93% 12 Osteoporosis 3.14% 13 Lung Disease 1.57% Summary The graph and chart above show the number and percentage of the population surveyed who self reported what medical concerns they ve been told from their doctor. As shown, the majority of the respondents said high blood pressure. 14 Lupus 1.57% 15 Demen a 0.26% Total Responses 764 Trend Data This was a brand new question for No trend data. Disparities All races identify high blood pressure, obesity as their number one health concern, as self reported from their doctor. Impact on Community We feel, the obesity rates are higher in our community but maybe the doctors are not telling their patients its severity. We need to educate the doctors & provide more education. Plan of Action To be finalized at the October 2014 Healthy Robeson Task Force Meeting. High Blood Pressure Overweight/ Obesity High Cholesterol Caucasian Disparities African American Native American 32.65% 46.83% 32.56% 29.39% 25.85% 28.37% 30.61% 27.32% 16.28% None 22.04% 20.49% 24.19% Arthritis 19.18% 19.51% 13.95% Diabetes 17.14% 18.05% 15.81% 20
23 Question 3: What would keep you from seeking medical treatment? (Check only one) 1 None/No barriers 42.67% Lack of insurance/ Unable to pay for doctor s visit 3 Have to wait too long at the doctor s office 25.26% 7.20% 4 Transporta on 6.94% Fear (not ready to face the problem) 6 No appointments available 5.24% 3.93% 7 Other 3.66% 0 None/No Barriers Lack of insurance Long waiting times Fear Transportation Other No appointments available Lack of Knowledge Cultural/Health Beliefs Health Services too far Summary The graph and chart above show the number and percentage of the population surveyed who self reported their biggest barrier for seeking medical treatment. No barriers and Lack of insurance were the top two self reported reasons. Trend Data This question was altered from the 2011 Community Health Assessment. In 2011, we asked their thoughts for the community s barriers when seeking treatment. This year, we asked about their own personal barriers. Disparities Caucasians self reported higher rates of none / no barriers. 8 Lack of knowledge/ understanding the need 9 Cultural / Health beliefs 10 Health services too far away Total Responses 764 None / No barriers Lack of insurance Caucasian Disparities 2.36% 1.70% 1.05% African American Native American 50.80% 39.05% 37.62% 18.80% 26.19% 27.62% Wait too long 9.60% 6.19% 6.67% Transportation 3.60% 12.38% 7.62% Fear 4.00% 5.24% 6.67% Impact on Community We feel, this data shows the importance of health care coverage and affordability for all persons in this community. Plan of Action To be finalized at the October 2014 Healthy Robeson Task Force Meeting. 21 No appointments available 5.20% 3.81% 2.86% Other 4.40% 3.33% 3.33% Lack of knowledge Cultural/ Health beliefs 2.00% 1.43% 2.38% 1.20% 1.90% 2.86% Too far away 0.40% 0.48% 2.38%
24 Question 4: What do you feel most affects the quality of health care you receive? (Check only one) None 49.93% Economic (Low Income, No Insurance, etc.) 36.41% Ability to read & write / Educa on 5.20% Age 3.64% 5 Other 2.73% Race 0.91% None Economic Age Ability to read/write 21 Other Race Sex/Gender Language Barrier 7 Language Barrier/ Interpreter/ Translator Total Responses % 8 Sex/Gender 0.52% Summary The graph and chart above show the number and percentage of the population surveyed who self reported their quality of health care they receive. The majority answered none while the economic impact was their second choice. Caucasian Disparities African American Native American None 64.14% 43.98% 45.50% Trend Data This question was altered from the 2011 Community Health Assessment. In 2011, we asked their thoughts for the community s quality of received healthcare. This year, we asked their own personal beliefs and added none as a choice. Economic 21.91% 41.55% 41.23% Ability to read/write 5.58% 3.38% 8.06% Age 2.39% 6.76% 2.37% Disparities Native Americans and African Americans reported a higher economic influence on the quality of health care they receive. Other 5.18% 0.97% 1.42% Race 0.40% 1.93% 0.95% Impact on Community Rural healthcare is at the forefront of eliminating barriers. Plan of Action To be finalized at the October 2014 Healthy Robeson Task Force Meeting. 22 Language Barrier 0.40% 0.48% 0% Sex/Gender 0% 0.97% 0.47%
25 Question 5: Where do you and your family get most of your health information? (Check only one) Television Family or Friends Internet Doctor/Health Professional Newspaper/Magazines Health Department Radio Library Hospital Newsletter Health Education Center 1 Doctor/Health Professional 50.74% 2 Internet 20.38% 3 Family or Friends 10.53% 4 Television 5.13% 5 Health Department 4.86% 6 Newspaper/ Magazines Total Responses % 7 Health Educa on 2.83% Center 8 Hospital Newsle er 1.08% 9 Library 0.40% 10 Radio 0% Summary The graph and chart above show the number and percentage of the population surveyed who self reported where they get their health information. Doctors & Health Professionals are listened too the most. Followed by Internet and Family. Doctor/ Health Professional Caucasian Disparities African American Native American 54.66% 57.73% 43.94% Trend Data Getting health information from a Doctor/Health Professional almost doubled compared to the 2011 CHNA when it reported 26.52% of responses. The library & radio are not utilized. Internet 25.91% 14.93% 21.21% Family or Friends 10.12% 7.46% 14.65% Television 1.62% 8.96% 5.05% Disparities Native Americans talk with family & friends more than any other race in regards to health information; less with doctor. Impact on Community Educating the community, especially parents, can impact the whole family dynamic toward a healthier mindset & culture. Health Department Newspaper/ Magazines Health Education Center Hospital Newsletter 2.02% 5.47% 6..57% 3.64% 2.49% 5.05% 1.21% 3.98% 2.53% 0.81% 1.99% 1.01% Plan of Action To be finalized at the October 2014 Healthy Robeson Task Force Meeting. Library 0% 1.00% 0% Radio 0% 0% 0% 23
26 Question 6: What do you think most people die from in your community? (Check only one) Cancer 38.68% Heart Disease Cancer Diabetes Stroke Homicide/Violence Suicide Other Asthma/Lung Disease Motor Vehicle Deaths HIV/AIDS 2 Heart Disease 35.10% 3 Stroke/ 7.74% Cerebrovascular Disease 4 Diabetes 6.45% 5 Homicide/ 6.02% Violence 6 Motor Vehicle Deaths 3.30% 7 Asthma / Lung 1.29% Disease 8 Other 0.72% 9 Suicide 0.57% 10 HIV/AIDS 0.14% Total Responses 698 Summary The graph and chart above show the number and percentage of the population surveyed who self reported their opinion of what people die from in their community. The survey indicated that cancer, followed by heart disease, were the top responses. Disparities Caucasian African American Native American Trend Data The 2011 CHNA showed heart disease was the top self-reported perceptive cause of death with 34.61% of responses. In 2014, cancer was self-reported number one. However, the State Center of Health Statistics reports that heart disease is the number one cause of death in Robeson County. Disparities Caucasians were on target with reporting heart disease, rather than cancer, as the number one cause of death. Impact on Community The leading cause of death raises the perception vs. reality issue. Plan of Action The community will receive education to prevent and reduce the risks of heart disease, cancer, diabetes, and high blood pressure. 24 Cancer 29.20% 38.95% 48.45% Heart Disease 46.46% 25.79% 33.51% Stroke/ Cerebrovas cular Disease 10.18% 10.00% 4.12% Diabetes 4.87% 8.42% 6.19% Homicide/ Violence Motor Vehicle Deaths Asthma / Lung Disease 4.87% 11.05% 1.55% 2.65% 3.16% 3.09% 1.33% 0.53% 1.55% Other 0.44% 0.53% 0.52% Suicide 0% 1.05% 1.03% HIV/AIDS 0% 0.53% 0%
27 Question 7: What is the biggest health issue of concern in your community? (Check only one) Alcohol Abuse Gangs/Violence Obesity Prescription Drug Abuse Illegal Drug Use Chronic Disease Asthma Other Dental Health Mental Health Tobacco Use Teen Pregnancy Vehicle Crashes Child Abuse Summary The graph and chart above show the number and percentage of the population surveyed who self reported their biggest health issue of concern in the community. Chronic disease, illegal drug use, and prescription drug use were the top three. 1 Chronic Disease 32.72% (Cancer, Diabetes, Heart or Lung Disease) 2 Illegal Drug Use 16.57% 3 Prescrip on Drug 15.03% Abuse 4 Obesity 14.47% 5 Gangs/Violence 5.34% 6 Alcohol Abuse 4.63% 7 Teen Pregnancy 2.95% 8 Tobacco Use 2.67% 9 Mental Health 1.40% 10 Dental Health 1.26% 11 Other 0.98% 12 Asthma 0.84% 13 Child Abuse 0.70% 14 Vehicle Crashes 0.42% Total Responses 712 Disparities Caucasian African American Native American Trend Data The 2011 CHNA reported 45.01% of responses with chronic disease being the top health concern. This year, the drug abuse choice was separated into illegal & prescription drugs. Disparities Native Americans did not identify with gangs/violence or teen pregnancy, but high responses with prescription drug abuse. Impact on Community We will continue education for chronic disease. Work with the Substance Abuse Coalition, and target ethnic groups more. Plan of Action Initiate substance abuse programs targeted in the Native American communities. Chronic Disease 37.83% 28.28% 31.44% Illegal Drug Use 17.39% 15.66% 18.04% Prescription Drug Abuse 11.74% 12.12% 23.71% Obesity 16.96% 10.10% 14.95% Gangs/Violence 5.65% 10.61% 0% Alcohol Abuse 3.04% 7.07% 3.61% Teen Pregnancy 0.87% 7.58% 0% Tobacco Use 3.04% 1.52% 2.06% Mental Health 1.74% 1.52% 1.03% Dental Health 0.43% 2.02% 1.55% Other 0.43% 1.52% 1.03% Asthma 0.43% 1.01% 1.03% Child Abuse 0% 0.51% 1.03% Vehicle Crashes 0.43% 0.51% 0.52% 25
28 Question 8: What does your community need to improve the health of your family, friends, and neighbors? (Check only one) Job Opportuni es 30.79% 2 Healthier Food 12.15% Choices 3 Addi onal Health Services 10.88% Wellness Services 7.06% 5 Recrea on Facili es 6.50% Safe Places to Walk / Play 7 Substance Abuse Rehab Services 8 Programs for the Elderly 6.50% 5.93% 4.52% 0 9 Services for the Disabled 3.25% 10 A er School Programs 2.68% 11 Other 2.54% 12 Transporta on 2.12% Summary The graph and chart above show the number and percentage of the population surveyed who self reported the needs for their community. As shown, the majority of the respondents said job opportunities are the most desired. 13 Mental Health 2.12% Services 14 Access to Food 1.69% 15 Spec. Physicians 0.26% Total Responses 708 Trend Data Like 2011, job opportunities was on top with 17.63% majority. Caucasian Disparities African American Native American Disparities This data reflects no racial disparities. However, African Americans reported a lower desire for healthier food choices. Impact on Community While we cannot directly improve economic conditions, we recognize the job opportunities play a significant role as evident in previous CHNA s. However, we can shift a focus to nutrition education with highlighting healthier food choices. Plan of Action We will focus on nutrition education in the schools and play a larger role with hands-on nutrition in the community. 26 Job Opportunities Healthier Food Choices Additional Health Service Wellness Services Recreation Facilities Safe Places to Walk/Play Substance Abuse Service 23.93% 38.02% 34.34% 11.54% 8.33% 15.15% 9.40% 10.42% 11.11% 10.26% 3.65% 7.07% 8.12% 8.33% 3.54% 8.97% 4.69% 5.05% 5.13% 3.65% 9.60%
29 Question 9: What health screenings or education/information services are needed in your community? (Check only one) 1 Cancer 12.39% Mental Health Pregnancy Prevention Literacy Dental Screening HIV / STD Physical Activity Diabetes Substance Abuse Blood Pressure Nutrition Cancer Vaccinations Disease Outbreaks Car Safety Other Cholesterol Emergency Preparedness 5 2 Nutri on 11.54% 3 Blood Pressure 11.40% 4 Substance Abuse 10.40% 5 Diabetes 10.26% 6 Physical Ac vity 7.26% 7 HIV / STD 5.70% 8 Dental Screening 5.13% 9 Literacy 4.84% 10 Pregnancy 4.13% Preven on 11 Mental Health 3.99% 12 Emergency Preparedness 2.85% 13 Cholesterol 2.71% 14 Other 2.42% 15 Car Safety 2.28% 16 Disease Outbreaks 1.99% Summary The graph and chart above show the number and percentage of the population surveyed who self reported what screenings and/or education they would like to see in their community. Cancer, nutrition, and blood pressure were the top three. Trend Data The 2011 CHNA had cholesterol, blood pressure, and diabetes grouped together as one answer choice, which was identified as the top area of concern; this year they were separate answers. Disparities There is a theme with Native Americans desire for substance abuse education. African Americans request more HIV testing. Impact on Community With the wide answer range for health screenings and education there are many resources to provide for this community. Plan of Action We plan to host a variety of screenings and more educational sessions to focus on these areas of need and prevention Vaccina ons / Immuniza ons Total Responses 702 Caucasian 0.71% African American Native American Cancer 9.13% 13.09% 16.33% Nutrition 12.61% 8.38% 13.78% Blood Pressure 10.87% 15.71% 7.65% Substance Abuse 10.00% 8.38% 13.27% Diabetes 10.87% 13.61% 8.16% Physical Activity 7.83% 5.76% 8.16% HIV / STD 3.04% 9.42% 2.55% Dental Screens 6.52% 5.76% 3.57% Literacy 6.09% 5.76% 3.06% Pregnancy Prevention Disparities 4.35% 4.19% 3.57% Mental Health 4.78% 2.62% 5.10% Emergency Prep. 3.04% 1.01% 1.03% Cholesterol 2.17% 1.05% 2.55%
30 Question 10: Do you feel people in your community lack the funds for any of the following? (Check only one) Health Insurance 48.95% Medicine 20.20% Transporta on 7.71% 4 Home / Shelter 7.15% 5 Food 6.45% 6 U li es 6.45% Other 3.09% Total Responses Medicine Health Insurance Transportation Food Home/Shelter Utilities Other Summary The graph and chart above show the number and percentage of the population surveyed who self reported what resources they felt their community lacked. Health insurance was the largest area of need, followed by medicine. Caucasian Disparities African American Native American Trend Data With national attention focused on health insurance, this issue might skew higher responses 24% higher than 2011 data. Disparities This data reflects no racial disparities. Impact on Community As mentioned in trends, the high response rate could be linked to high attention of health care coverage in the United States. Plan of Action To be finalized at the October 2014 Healthy Robeson Task Force Meeting. 28 Health Insurance 51.29% 45.23% 49.49% Medicine 17.67% 21.11% 21.94% Transportation Home / Shelter 8.62% 10.55% 4.08% 3.45% 9.55% 8.16% Food 8.62% 4.02% 7.65% Utilities 5.60% 7.54% 7.14% Other 4.74% 2.01% 1.53%
31 Question 11: On average, how many days per week do you engage in physical activity for at least 30 minutes that makes you break a sweat? (Check only one) One to Two (1 2) Days a Week 2 Three to Four (3 4) Days a Week 40.75% 30.44% 3 Five (5) or more 15.97% Days a Week 4 Zero Days 12.83% Total Responses Days a Week 3-4 Days a Week 5 + Days a Week Zero Days Summary The graph and chart above show the number and percentage of the population surveyed who self reported the amount of time they spend working out per week. 1-2 days a week was the majority answer. Trend Data This was a brand new question for No trend data. Disparities Caucasian African American Native American Disparities This data reflects no major racial disparities. However, Native Americans report lower amounts of exercising. 1-2 Days a Week 3-4 Days a Week 32.56% 38.71% 45.66% 36.43% 29.49% 29.22% Impact on Community The lack of exercise among all individuals aligns with the high rates of obesity in Robeson County. Which can lead to many medical complications in the future. 5 or More Days a Week 17.83% 17.97% 13.24% Zero Days 13.18% 13.82% 11.87% Plan of Action TBA. 29
32 Question 12: On average, how often do you eat fruits or vegetables? (Check only one) Several Times a 32.37% Week 2 Several Times a 27.23% Day 3 Once a Day 24.47% Once a Week 12.67% 5 Never 0.50% Total Responses Several Times a Week Once a Day Several Times a Day Once a Week Never Summary The graph and chart above show the number and percentage of the population surveyed who self reported the amount of fruits and vegetables consumed in one week, on average. Several times a week was the majority answer. Caucasian Disparities African American Native American Trend Data This was a brand new question for No trend data. Several Times a Week Several Times a Day 30.86% 33.64% 33.33% 25.00% 28.11% 29.28% Disparities This data reflects no racial disparities. Impact on Community If more people consumed fruits and vegetables daily, the rates of preventable diseases could be lowered. Once a Day 31.25% 21.20% 22.07% One a Week 10.94% 13.36% 13.06% Never 0% 0.92% 0% Plan of Action Nutrition education in our schools in communities highlighting locally grown produce and its importance in our bodies. Host healthy cooking demonstrations in the community. 30
33 Question 13: Does your family have a basic emergency supply kit? (Check only one) 1 Yes 51.58% 2 No 44.99% No 407 Don't Know 27 3 Don t Know / Not Sure Total Responses % Yes 355 Summary The graph and chart above show the number and percentage of the population surveyed who self reported whether or not they have an emergency kit in their home. No, was the majority answer. Trend Data Like 2011, No was the majority answer with 53% of people reporting they owned an emergency kit and 41% do not. Disparities Caucasian African American Native American Disparities This data reflects no racial disparities. No 50.00% 49.06% 52.49% Yes 47.64% 46.23% 44.34% Impact on Community When disaster or crisis arrives, persons many not be prepared. Don t Know/ Not Sure 2.36% 4.72% 3.17% Plan of Action Community education must be conducted to better inform individuals and families on the importance of maintaining an emergency supply kit. Also essential in the education process are comprehensive instructions as to what contents should be included in the kit. 31
34 Question 14: What would be your main way of getting information from authorities in a large-scale disaster or emergency? (Check only one) Internet Radio Text Message Television Neighbors Don't Know/Not Sure Social Networking Site Other Print Media 1 Television 44.72% 2 Text Message 20.19% 3 Radio 13.55% 4 Internet 9.21% 5 Social Networking 3.93% Site 6 Don t Know/ 3.79% Not Sure 7 Neighbors 2.71% 8 Print Media 0.95% 9 Other 0.95% Total Responses 738 Summary The graph and chart above show the number and percentage of the population surveyed who self reported the best way they would get information during a large scale disaster. Television was the majority answer. Trend Data Just like 2011, Television was the majority answer with 42%. However, text message jumped to the second most popular. Caucasian African American Native American Television 37.66% 48.50% 53.17% Text Message Disparities 26.78% 15.00% 16.59% Radio 17.99% 14.00% 8.78% Internet 9.21% 7.50% 9.27% Disparities Native Americans prefer television over text messaging and the radio. Caucasians report higher rates of text messaging. Social Networking Site Don t Know/ Not Sure 2.51% 5.00% 2.93% 2.51% 4.00% 5.37% Impact on Community This information identifies the best avenue to deliver information to the community during emergency situations. Neighbors 2.51% 2.00% 2.44% Print Media 0.42% 3.00% 0.00% Other 0.42% 1.00% 1.46% Plan of Action To be finalized at the October 2014 Healthy Robeson Task Force Meeting. 32
35 Question 15: If public authorities announced a mandatory evacuation from your neighborhood or community due to a large-scale disaster or emergency, would you evacuate? (Check only one) 1 Yes 81.88% No 46 Don't Know 95 2 Don t Know / Not Sure 12.21% 3 No 5.91% Total Responses 778 Yes 637 Summary The graph and chart above show the number and percentage of the population surveyed who self reported whether or not they would evacuate in the likelihood of an emergency. Yes, was the overwhelming majority answer. Trend Data Like 2011, Yes was the majority answer with 69% of people reporting they would evacuate, 25% were not sure if they would evacuate, and 6% would not evacuate Disparities Caucasian African American Native American Yes 78.26% 85.51% 80.37% Disparities This data reflects no major racial disparities. Don t Know/ Not Sure 15.81% 8.70% 12.33% Impact on Community When disaster or crisis arrives, persons many not be prepared. No 5.93% 5.80% 7.31% Plan of Action 18% of respondents indicated they were either uncertain or would not evacuate during an emergency, thus providing an understanding that enhanced education about the severity of emergency preparedness and response is vital. 33
36 Question 16: What would be the main reason you might NOT evacuate if asked to do so? (Check only one) Family Safety I Would Evacuate Property Don't Know/ Not Sure Personal Safety Lack of Transportation Health Problems Traffic Jams Lack of Trust Other Leaving Pets 1 Not applicable, 40.82% I would evacuate 2 Concern about family safety 11.56% 3 Don t Know/Not Sure 11.02% 4 Concern about leaving property behind 9.12% 5 Lack of Transporta on 5.58% 6 Concern about personal 5.03% safety 7 Lack of trust in public 4.35% officials 8 Concern about traffic jams 3.67% and inability to get out 9 Health problems (could not 3.54% be moved) 10 Concern about leaving pets 3.40% 11 Other 1.90% Total Responses 735 Summary The graph and chart above show the number and percentage of the population surveyed who self reported the main reason they would not evacuate if asked to do so. The majority answered that they would evacuate in this situation. Trend Data Just like 2011, Evacuating was the majority answer with 46% Disparities This data reflects no racial disparities. Impact on Community This information identifies the importance of public awareness efforts during a large-scale evacuation. Plan of Action To be finalized at the October 2014 Healthy Robeson Task Force Meeting. 34 I would evacuate Caucasian African American Native American 38.30% 38.38% 45.71% Family safety 10.64% 9.60% 12.86% Don t Know/ Not Sure 12.77% 10.10% 9.52% Property 11.91% 4.55% 12.38% Lack of transportation Personal safety 1.28% 12.63% 3.81% 2.51% 7.58% 4.29% Lack of trust 4.26% 5.56% 2.86% Traffic jams 5.11% 4.55% 1.90% Health Problems Disparities 2.55% 4.55% 4.29% Leaving pets 7.66% 1.01% 1.43% Other 3.40% 1.52% 0.95%

37 Community Listening Tours The Community Listening Tour was designed to collect information from the community to assist Southeastern Health s Board of Trustees in setting priorities for the strategic planning process in Additionally, Southeastern Health was able to identify community partners who will help us lead our communities to better health. One system cannot change the health problems facing residents, but a strong partnership across many sections of the region can make significant improvements. Key Findings & Suggestions Increased education regarding all health categories is needed for multiple audiences given the prevalence and severity of the health issues. Specific strategies named as avenues for successful education included cooking classes and food demonstrations, walking groups and enhancing farmers markets. Transportation and financial need were both considered significant barriers to improved health and any strategies designed should assist community members with addressing these barriers. Access to services and increased operating hours for clinics was suggested at each community meeting. Building on existing efforts and assets within each community as a place for Southeastern Health to focus and begin a partnership was suggested at each community meeting. There were also unique suggestions and issues by individual communities including, diabetes prevention, substance abuse prevention, teen pregnancy prevention, reducing prevalence of obesity, and improving overall general health. 35
38 Chapter 5: Secondary Data Results Mortality Data According to data obtained from the State Center for Health Statistics, the ten leading causes of death for Robeson County are the following: (1) Diseases of the heart, (2) Cancer, (3) Alzheimer s disease, (4) Diabetes Mellitus, (5) Cerebrovascular disease, (6) Chronic lower respiratory diseases, (7) Other unintentional injuries, (8) Motor vehicle injuries, (9) Nephritis, Nephritic Syndrome, & Nephrosis, and (10) Homicide. As a whole, Robeson s rates for the leading causes of death exceed the state rates. In many instances, our rates are nearly double those of the state. For example, Robeson s diabetes mellitus rate is 47.8 per 100,000 population versus the state rate of 21.8 per 100,000. Our unintentional motor vehicle injury death rate is 31.9 per 100,000 population versus the state rate of 14.3 per 100,000. Lastly, our homicide rate is 20.9 per 100,000, compared to the state s rate of 6.0 per 100,000. The leading types of cancer-related deaths in Robeson County are cited below: 1.) Trachea, Bronchus, and Lung 59.4 death rate per 100,000 2.) Prostate 41.7 per 100,000 3.) Breast 28.0 per 100,000 4.) Colon, Rectum and Anus 16.3 per 100,000 5.) Pancreatic per 100,000 Lung cancer is also the leading cause of cancer death in the United States in both men and women. Like other cancers, lung cancer occurs after repeated insults to the genetic material of the cells. By far the most common source of these insults is tobacco smoke, which is responsible for about 85% of all lung cancer deaths occurring in the United States. According to data from the 2009 Behavioral Risk Factor Surveillance, Robeson County has the highest percentage of adults who currently smoke in the state. Robeson s percentage is 29.4 compared to the best county s percentage in the state of
39 Leading Cause of Death for Robeson County *Rates per 100,000 Population White African American Native American Robeson County North Carolina Cause of Death Male Female Male Female Male Female Overall Overall All Causes 1, , , ) Diseases of Heart Other Ischemic Heart Disease Acute Myocardial Infarction ) Cancer Trachea, Bronchus, and Lung Prostate 31.9 N/A 52.7 N/A 53.5 N/A Breast N/A 25.6 N/A 45.2 N/A Colon, Rectum, and Anus N/A 18.7 N/A N/A N/A N/A Pancreas N/A N/A N/A N/A N/A N/A ) Alzheimer's disease N/A 45.3 N/A ) Diabetes Mellitus ) Cerebrovascular Disease ) Chronic Lower Respiratory Diseases N/A N/A ) All Other Unintentional Injuries N/A ) Unintentional Motor Vehicle Injuries 9.) Nephritis, Nephrotic Syndrome, and Nephrosis 32.5 N/A 41.3 N/A N/A ) Homicide N/A N/A 54.2 N/A 45.3 N/A ) Septicemia N/A N/A N/A N/A N/A N/A ) Pneumonia and Influenza N/A 16.8 N/A N/A N/A N/A ) Suicide 21.4 N/A N/A N/A 17.5 N/A ) Chronic Liver Disease and Cirrhosis 15.) Acquired Immune Deficiency Syndrome 24.7 N/A N/A N/A N/A N/A N/A N/A N/A N/A N/A N/A Source: State Center for Health Statistics 37

40 Leading Causes of Death for Robeson (Rates per 100,000 Population) Peer County and Racial Comparison Overall, Robeson County s minority residents tend to have higher mortality rates than the state of North Carolina. The graphs on this page illustrate the rates by race for the county s five leading causes of death. As shown, African Americans have higher cancer, diabetes, and cerebrovascular disease death rates than other races & ethnic groups in the county. Caucasians report higher heart disease rates. New to the list, American Indians report the highest rates of Alzheimer s disease. This data clearly indicates that we must continue our interventions targeting diverse populations. 1 Heart Disease North Peer Robeson Caucasian African Native Carolina Counties County American American Cancer Alzheimer's Disease 4 Diabetes Mellitus 5 Cerebrovascular Disease Source: Data from the NC State Center for Health Statistics 38

41 Health Rankings The County Health Rankings measure the health of nearly every county in the nation. Published online at countyhealthrankings.org, the Rankings help counties understand what influences how healthy residents are and how long they will live. The Rankings look at a variety of measures that affect health, such as high school graduation rates, access to healthy foods, rates of smoking, obesity, and teen births. Based on data available for each county, the Rankings are unique in their ability to measure the overall health of each county in all 50 states. Counties receive two ranks: Health Outcomes Health Factors Health outcomes rankings are based on an equal weighting of mortality and morbidity measures. Health factors rankings are based on weighted scores of four types of factors: behavioral, clinical, social and economic, and environmental. Since the inception of the County Health Rankings in 2010, Robeson County has consistently ranked 100 in Health factors. However, over the past five years Robeson has slightly improved in health outcomes & th th 2013 & th These rankings are evident that there are numerous opportunities to improve both health factors and health outcomes. 39
 for 8 7.5 8.")
42 Infant Mortality Infant Deaths per 1,000 live births According to the State Center 18 for Health Statistics, Robeson 16.2 County s infant mortality rates have decreased since The 2006 rate was 16.2 per 12 1,000 live births and the rate was 9.8. The five year average rate ( ) for Robeson was 14.5 per 1, live births. Although rates 4 have slightly improved, they remain higher than the state s. Our minority infant 2 0 mortality rate is consistently higher than the white rate. The 2012 infant death rate for Source: NC State Center for Health Sta s cs whites was 9.5 per 1,000 live births and the minority rates were as follows: Robeson NC African Americans (14.7) and other races (11.8). The infant mortality rate among persons of Hispanic ethnicity was 11.2 per 1,000 live births. Local infant mortality reduction efforts include the following programs: Pregnancy Care Management, Nurse Family Partnership, Healthy Start, and Newborn Postpartum Home Assessment. Additionally, the public health department and Southeastern Regional Medical Center provide SIDS education to both patients and the community at large

43 Morbidity / Disease Data Sexually transmitted diseases (STDs), including human immunodeficiency virus (HIV) infection, affect tens of thousands of North Carolinians every year. These preventable conditions can lead to reduced quality of life, premature disability and death, as well as result in millions of dollars in preventable health expenditures annually. As with many diseases and health conditions; the burden of STDs falls disproportionately on disadvantaged populations, young people, and minorities. Report Area Total Population Population with HIV / AIDS Population with HIV / AIDS, Rate (Per 100,000 Pop.) Robeson County, NC 108, North Carolina 7,908,946 24, United States 509,288,471 1,733, The above chart shows the prevalence rate of HIV per 100,000 population. Source: Centers for Disease Control and Prevention, National Center for HIV/AIDS, Viral Hepatitis, STD, and TB Prevention: 2010 Report Area Non-Hispanic White Non-Hispanic Black Hispanic / Latino Robeson County, NC North Carolina United States , The above chart & graph shows the racial & ethnic disparities in HIV per 100,000 population. Source: Centers for Disease Control and Prevention, National Center for HIV/AIDS, Viral Hepatitis, STD, and TB Prevention:


44 Substance Abuse Substance use and abuse are major contributors to death and disability in North Carolina, as well as Robeson County. Addiction to drugs and/or alcohol is a chronic health problem and people who suffer from abuse or dependence are at risk for injuries and disability, co-morbid health conditions and premature death. Substance abuse has adverse consequences for families, communities and society. It contributes to family upheaval. Furthermore, it impacts both local and state crime rates, as well as motor vehicle fatality rates. Obviously, prevention of misuse and abuse of substances is critical. Substance abuse was identified as the leading health concern during the 2003 and 2007 Community Health Assessment processes and the number two health concern on the 2011 Community Opinion Survey. This year, illegal drug use was the number two concern, and prescription drug abuse, number three. The graphs to the right show the rank of unintentional poisoning mortality rates, broken down by specific narcotic, in North Carolina between The graph below highlights Robeson County s drug-related overdose deaths each year from The rates were highest in 2011 and 2012, showing a sense of urgency to educate the community about the harmful effects of these drugs and the high mortality rates as a cause for concern. The Substance Abuse Coalition is currently working to modify/change policies, change the physical design of the environment, change consequences (incentives/ disincentives), enhance access/ reduce barriers, provide support, build skills and provide information. 42

45 Obesity Obesity is a common, serious and costly epidemic in the United States. More than one-third (or 78.6 million) of U.S. adults are obese. Obesityrelated conditions include heart disease, stroke, type 2 diabetes and certain types of cancer, some of the leading causes of preventable death. The estimated annual medical cost of obesity in the U.S. was $161 billion in 2010, according to the Centers for Disease Control % of adults aged 20 and older self-report that they have a Body Mass Index (BMI) greater than 30.0 (obese) in Robeson County. Excess weight may indicate an unhealthy lifestyle and puts individuals at risk for further health issues. Report Area Total Population (20 and older) Population with BMI > 30.0 (Obese levels) Percent of Population with BMI > 30.0 (Obese levels) Robeson County, NC 93,666 38, % North Carolina 7,004,384 2,028, % United States 226,126,076 62,144, % The above chart shows the rate of obese persons over 20 years old. Source: Centers for Disease Control and Prevention, National Center for Chronic Disease Prevention and Health Promotion, 2010 Report Area Total Males Obese Percent Males Obese Total Females Obese Percent Females Obese Robeson County, NC 19, % 21,647 North Carolina 1,934, % 2,115,976 United States 62,091, % 62,125, % 28.99% 26.45% The above chart shows the rate of obese persons with a BMI > 35.0, males and females. Source: Centers for Disease Control and Prevention, National Center for Chronic Disease Prevention and Health Promotion,
46 Health Care Differences in access to health care can have far-reaching consequences. Those denied access to basic health care may live more constrained and shorter lives. Access to health care is a broad concept that tries to capture accessibility to needed primary care, health care specialists, and emergency treatment. While having health insurance is a crucial step toward accessing the different aspects of the health care system, health insurance by itself does not ensure access. It is also necessary to have comprehensive coverage, providers that accept the individual s health insurance, relatively close proximity of providers to patients, and primary care providers in the community. Additional barriers to health care access include lack of transportation to providers offices, lack of knowledge about preventive care, long waiting times to secure an appointment, low health literacy, and inability to pay the high-deductibles of many insurance plans and/ or co-pays for receiving treatment. At 29.9%, Robeson County has the most uninsured adults ages 18 and over than any county in the state. Additionally, 13.9% of our children ages 0 to 18 lack health insurance coverage, which surpasses 1 % of Adults (age 18+) without any type of health care coverage, % of Adults (age 18+) who could not afford healthcare costs to see a doctor, % of Adults (age 18+) who have not seen a doctor for a routine checkup, in the LAST FIVE years, Dentists per 10,000 Population, 2011, (NCDHHS) 2 Physicians per 10,000 Population, 2011 (UNC Sheps Center for Health Services Research) 3 Primary Care Physicians per 10,000 Population, 2011 (UNC Sheps Center for Health Services Research) 4 Psychologists per 10,000 Population, 2011 North Carolina Peer Counties Robeson County N/A N/A N/A N/A 0.02 the state s average of 11.5%. Furthermore, over the past year, 23.4% of county residents ages 18 and over opted not to visit a physician for needed health care due to cost. Access to health professionals is also a major concern in Robeson County due do to the limited number of providers. Robeson County s rate of health care professionals per 10,000 population (which includes dentists, physicians and psychologists) is lower than the state s rate. 44

47 Health Status Indicators The County Health Rankings & Roadmaps program is a collaboration between the Robert Wood Johnson Foundation and the University of Wisconsin Population Health Institute. The annual County Health Rankings measure vital health factors, including high school graduation rates, obesity, smoking, unemployment, access to healthy foods, the quality of air and water, income, and teen births in nearly every county in America. The annual Rankings provide a revealing snapshot of how health is influenced by where we live, learn, work and play. Robeson County scored an overall score of 97 (out of a possible 100) counties. The two subcategories, Robeson County scored a 97 in Health Outcomes and a 100 in Health Factors. Health Rankings Indicator Robeson Health Outcomes 97 Length of Life 98 Quality of Life 87 Health Factors 100 Health Behaviors 99 Clinical Care 99 Social & Economic Factors 99 Physical Environment 36 45
48 Determinants of Health Poverty, education and housing are three important social determinants of health. These factors are strongly correlated with individual health. People with higher incomes, more years of education, and a healthy and safe environment to live in tend to have better health outcomes and generally have longer life expectancies. Although these factors affect health independently, they also have interactive effects on each other and thus health. For example, people in poverty are more likely to engage in risky health behaviors, and they are also less likely to have affordable housing. In turn, families with difficulties paying rent and utilities are more likely to report barriers to accessing health care, higher use of the emergency department, and more hospitalizations. Below is a chart of the economic indicators that impact the quality of life for Robeson s residents. Almost 30% of the population does not have a high school degree which is a major contributor to the other listed indicators. Robeson typically tops the state s list of poorest counties; however, recent data indicates that we have fallen to second place. The unemployment rate is greater than the state s rate and the need for state and federal resources is extremely high. Additionally, Robeson has the second highest teen pregnancy rates in the state. Teenage mothers and fathers tend to have less education and are more likely to live in poverty than their peers who are not teen parents. Economic Indicators Indicator Robeson NC. High school graduates, percent of persons 70.9% 84.5% age 25+, Persons below poverty level, less than 31.9% 16.8% 100 percent, Unemployment, July Median household income, $30,167 $46,450 % of WIC mothers, % of Residents Eligible for Medicaid, Children eligible for Free/Reduced Price 80.28% 50.30% Lunch, Rate of teen birth to women ages years old per 1,000 female popula on,
49 Risk Factors Chronic diseases such as heart disease, cancer, and diabetes are major causes of death and disability in North Carolina. Although genetics and other factors contribute to the development of these chronic conditions, individual behaviors play a key role. As much as 50% of individual health can be attributed to behavior alone. Physical inactivity, unhealthy eating, and smoking are behavioral risk factors underlying much of the burden caused by chronic disease. Robeson has some of the worst behavioral risks factors in the state. The percentages of adults who currently smoke and are physically inactive are the worst in the state. Results from the 2014 Community Health Needs Assessment indicated the community desires healthier food options and safer places to walk and play. 1 Percent of population with inadequate fruit and vegetable consumption 2 Percent of population with no leisure time physical activity 3 Percent of population self reporting regular smoking activity North Carolina Peer Counties Robeson County In the report area an estimated 532,647, or 80.81% of adults over the age of 18 are consuming less than 5 servings of fruits and vegetables each day. This indicator is relevant because current behaviors are determinants of future health, and because unhealthy eating habits may cause of significant health issues, such as obesity and diabetes. Sources 1. Behavioral Risk Factor Surveillance System, Diabetes Atlas, Behavioral Risk Factor Surveillance System, In the report area an estimated 164,237, or 23.79% of adults age 18 or older self-report currently smoking cigarettes some days or every day. This indicator is relevant because tobacco use is linked to leading causes of death such as cancer and cardiovascular disease. Within the report area, 196,601 or 28.90% of adults aged 20 and older self-report no leisure time for activity, based on the question: "During the past month, other than your regular job, did you participate in any physical activities or exercises such as running, calisthenics, golf, gardening, or walking for exercise?". This indicator is relevant because current behaviors are determinants of future health and this indicator may illustrate a cause of significant health issues, such as obesity and poor cardiovascular health. 47
50 Environmental Health Residents in Robeson County face challenges with accessible places to walk, exercise, and eat healthy. Their environmental health can shape their eating and exercising habits if a widespread variety of options are not available. Robeson County has an absence of parks and recreational fields, reporting less than half of the state average. If there are not places where residents can go to leisurely play, run, or walk, then a barrier is formed and may force people to stay inside. An environment with a plethora of outdoor parks encourages a message of a healthy community. In addition, Robeson County lacks the number of fitness facilities in comparison to the population of residents. People prefer the close proximity of fitness facilities to their homes or workplaces and do not desire driving far away to reach these areas. If more fitness facilities are accessible and in reasonable distances from residents, more physical activity can be encouraged. 1 Percentage of days exceeding standards of air quality particulate matter Percentage of days exceeding standards for ozone 3 Percent of population within one-half mile of a park 4 Recreation and Fitness Facilities per 100,000 population North Carolina Peer Counties Robeson County Sources 1. National Environmental Public Health Tracking Network, National Environmental Public Health Tracking Network, ESRI Map Gallery, 2013; Open Street Map, US Census Bureau, County Business Patterns, 2012 This indicator reports the percentage of days with particulate matter 2.5 levels above the National Ambient Air Quality Standard (35 micrograms per cubic meter) per year, calculated using data collected by monitoring stations and modeled to include counties where no monitoring stations occur. This indicator is relevant because poor air quality contributes to respiratory issues and overall poor health This indicator reports the percentage of days per year with Ozone (O3) levels above the National Ambient Air Quality Standard of 75 parts per billion (ppb). Figures are calculated using data collected by monitoring stations and modeled to include census tracts where no monitoring stations exist. This indicator reports the number per 100,000 population of recreation and fitness facilities as defined by North American Industry Classification System (NAICS) Code This indicator is relevant because access to recreation and fitness facilities encourages physical activity and other healthy behaviors. This indicator reports the percentage of population living within 1/2 mile of a park. This indicator is relevant because access to outdoor recreation encourages physical activity and other healthy behaviors. 48
51 Chapter 6: Prevention & Health Promotion Increasingly, there is clear evidence that the major chronic conditions that account for so much of the morbidity and mortality in the U.S., and the enormous direct and indirect costs associated with them, in large part are preventable-- and that to a considerable degree they stem from, and are worsened by, individual behaviors. In particular, overweight and obesity, lack of physical activity, and smoking greatly increase the risk of developing the most serious chronic disorders. Most of the dollars spent on health care in the United States, however, are for the direct care of medical conditions, while only a very small portion is targeted on preventing those conditions. As health care expenditures continue to increase, it is important to focus on strategies that reduce the prevalence and cost of preventable diseases. Chronic Disease Screening Source: Behavioral Risk Factor Surveillance System Indicator Robeson Peer NC % of Adults Without Any Regular Doctor, % of Adults Told By Doctor They Have Diabetes, 2010 % of Adults Who Ever Had Either a Sigmoidoscopy or Colonoscopy, % of Adults Who Have Received the Pneumonia Vaccine Ages 65+, % of Women Ages 18+ Who Had a Pap Smear in the last 3 Years, % of Adults Not Taking Blood Pressure Medication (When Needed), Included in the above chart are prevention indicators comparing Robeson County to its peer counties (Alamance, Gaston, Pitt, Rowan, Wayne) and the state of North Carolina. Screenings help individuals identify diseases early, thus enabling earlier intervention and management in the hope to reduce mortality and suffering from a disease. Education and promotional programs are also important because they provide individuals with the knowledge to understand the risk factors for chronic diseases and the behavior and lifestyle changes required to lower their risks. 49
52 Chapter 7: Robeson County s Priorities The Community Health Assessment Team met in July 2014 to hear the findings of the assessment and to identity leading community health problems. The CHNA Team contributed their thoughts and opinions; thus ensuring their say in the final decisions. The CHNA Team used the Problem Importance Sample Worksheet to list each health problem under consideration and to provide a brief summary of the data collected (i.e., how the community ranked their priorities, available secondary data, and any other relevant information). The following three criteria were used in rating the community health problems: (1) Magnitude: How many persons does the problem affect, either actually or potentially? (2) Seriousness of the Consequences: What degree of disability or premature death occurs because of the problem? What are the potential burdens to the community, such as economic or social burdens? and (3) Feasibility of Correcting: Is the problem amenable to interventions. Then CHNA Team agreed on a score of 1 to 10 for the criteria for each health problem. A problem with a score of 10 on each criteria indicated that it is of the greatest magnitude, has the most serious consequences, and is the most feasible to correct. In contrast, a score of 1 on each criterion indicated that it is of the least magnitude, has the least serious consequences, and is least feasible to correct. Next, the CHNA ranked the health problems by listing all of the problems according to their ranking on the Problem Prioritization Worksheet. The problem with the highest number was listed first and subsequent problems were listed in descending order. The CHNA Team reviewed the scoring for each of the problems and reached a consensus about the rankings. The CHNA Team agreed to work on the following two priority areas: (1) Obesity and (2) Substance Misuse/Abuse. These priority areas were selected because the community indicated that their number one health concern is chronic disease, number two is drugs/alcohol and number three is obesity. Secondary data shows that Robeson s number one cause of death is heart disease and the risk factors for chronic diseases are extremely high. Secondary data also proved that Robeson has a prescription drug abuse problem. After analyzing the primary and secondary data, the CHNA Team decided to select obesity as a priority because members hope to emphasize prevention first. 50
53 Robeson County s Priorities Focus: Chronic Disease Management & Prevention Priority 1: Obesity Priority 2: Substance Misuse & Abuse Nutrition Physical Activity Tobacco Alcohol Prescription Drugs Above is a diagram of Robeson County s selected priorities. 51

54 Chapter 8: Next Steps The CHNA (Community Health Needs Assessment) Document will be posted on the Southeastern Health website. The Robeson County Health Department will place the CHNA document on its website. The Robeson County Health Department and Southeastern Health will utilize their column spaces in the local Robesonian newspaper to report findings of the CHNA. Presentations will be made to Healthy Robeson Task Force, the Robeson County Board of Health Members, and the Southeastern Health Board of Trustees. Presentations will be conducted in the community. Towns and local libraries will be sent letters with guidance on how to retrieve the CHNA document. Action plans will be created for the selected priorities and subcommittees will be formed within the Healthy Robeson Task Force and Robeson County Substance Abuse Coalition. The subcommittees will use the action plans to develop, implement and evaluate strategies. (See Appendix for Action Plans) 52
55 Appendix A: Community Health Assessment Team 53
56 Name Agency/Community Title CHA Role Sara Allamadani University of North Carolina at Pembroke Intern Kim Ammons Fairmont Community Member Survey Data Input Community Health Survey Distribution Vicki Atkinson & Misty Stone Southeastern Health Home Care & Hospice Director & Manager, respectively Community Health Survey Distribution Brittany Bass, Joana Britt, Ashley Inman Lifestyle Fitness Center Lifestyle Fitness Center Receptionists Danny Becoats McDonald Community at Large Survey Data Input Community Health Survey Distribution Al Bishop, MSA Robeson Health Care Corporation HIV Program Manager Community Health Survey Distribution Dr. T. Shedrick Byrd and Ms. Linda Washington Sandy Grove Baptist Church, Lumberton Pastor & Secretary, respectively Community Health Survey Distribution Brittany Chavis Lifestyle Fitness Center Health Fitness Specialist Community Health Survey Distribution Valerie Comrie Robeson County Drug Court System Family Drug Treatment Court Coordinator Community Health Survey Distribution Tanisha Dixon East Carolina University Intern Survey Data Input Lori Dove, MSN, MHA, RN Southeastern Health Vice President Post Acute Care Administrative Support Noelle Fields Lifestyle Fitness Center Coordinator Community Health Survey Distribution Carole Gavaghan Southeastern Health Community Health Education Center Health Information Specialist Resource Directory Lekisha Hammonds, MS, MCHES, RHed Southeastern Health Community Health Services Community Health Director/ Healthy Robeson Task Force Coordinator Co-Facilitator CHNA Document Katie Huneycutt Robeson County Public Library Director Community Health Survey Distribution 54
57 Name Agency/Community Title CHA Role Niakeya Jones, MS David Lee Robeson County Health Department Southeastern Health Information Technology Health Education Director Co-Facilitator CHNA Document Strategic Analyst Data Collection / Analysis Kathryn McDaniel, RN, BSN, NCSN Public Schools of Robeson County School Health Services Supervisor Community Health Survey Distribution Whitney McFarland, RHEd Robeson County Health Department Health Promotion Coordinator Community Health Survey Distribution Pat McRae Southeastern Health Community Relations Specialist Britney Melvin Robeson County Health Department Public Health Educator Community Health Survey Distribution Community Health Survey Distribution Dominique Mitchell Robeson County Health Department Teen Outreach Program Coordinator Community Health Survey Distribution Ricardo Mojica Robeson County Health Department WIC Clerk Spanish Translator Katie Oxendine University of North Carolina at Pembroke Intern Survey Data Input Melissa Packer Robeson County Health Department Assistant Health Director Community Health Survey Distribution & Editor Dr. Robin Peace Robeson Health Care Corporation Health Care Provider Community Health Survey Distribution Ivan Pride, MBA RHA Behavioral Health Services Program Manager Community Health Survey Distribution Phillip Richardson Southeastern Health Community Health Services Community Health Supervisor Community Health Survey and Data Collection / Analysis 55

58 Name Agency/Community Title CHA Role Brandon Rivera, MA Southeastern Health Community Health Services Healthy Robeson Project Specialist Community Health Survey, Data Collection/ Analysis, & Primary Writer Amanda Roberts, MS, CWWS, CWWPM, CLYL Southeastern Health Employee Health & Wellness Employee Health Coordinator Community Health Survey Team Montressa Smith Southeastern Health Lifestyle Fitness Center Lifestyle Fitness Center Director Community Health Survey Team Mary Stone Lifestyle Fitness Center Billing Clerk Community Health Survey Distribution Roger Taylor Lumberton Rescue & EMS Deputy Commander Community Health Survey Distribution Lynn Wieties, MSN, CMPE Southeastern Health Vice President Provider Network Administrative Support Carlotta Winston Southeastern Health Community Health Services Health Promotion Specialist Community Health Survey Team Karen Woodell Robeson County Health Department Syphilis Eliminate Coordinator Community Health Survey Distribution Elizabeth Wright Southeastern Health Behavioral Health Substance Abuse Coalition Coordinator Community Health Survey Distribution Coverage Another resource for Robeson County is 2-1-1, an easy-toremember number that helps people cut through what can be a confusing and overwhelming maze of information helps people assess their needs and links them directly to the available resources. This service is free and multilingual Coverage Map 56
59 Appendix b: Resource Directory 57
60 Alcohol and Drug Abuse Southeastern Recovery Alternatives Palmer Drug Prevention Program Robeson Health Care Corp. Substance Abuse Service ext.119 Southeastern Regional Mental Health Center Crisis Line: Children and Youth Boys and Girls Club of Lumberton/Robeson County Child Protective Services (Dept. of Social Services) Communities in Schools of Robeson County First Baptist Home Four-H, Robeson County Girl Scout Council, Pines of Carolina Guardian Ad Litem Health Check (Medicaid, birth to 21 years) Health Choice (Health insurance for children) Immunizations (Robeson County Health Dept.) Indian Education Resource Center Odum Baptist Home for Children Robeson Child Health Robeson County Partnership for Children (Smart Start) Shining Stars Preschool Juvenile Justice & Delinquency Prevention Smart Start Emergency Services: Food, Shelter, Clothing American Red Cross (Robeson County Chapter) Lumberton Christian Care Center Rape Crisis Center Robeson County Church and Community Center or Second Harvest Food Bank Southeastern Family Violence Center Financial Assistance Department of Social Services Food stamps (Dept. of Social Services) Social Security Administration SeHealth financial assistance inquiry Health Services AIDS (BARTS - Border Belt AIDS Resource Team) Cardiopulmonary Rehabilitation Services Carolina Access (Medicaid recipients)... (919) Child Health Plus Clinic (Robeson County Health Dept) Child services coordination (Special needs, birth to 5 years) Diabetes Community Center Home health services (listing) Hospice services (listing) Maternity care Medical equipment / supplies (listing) Nursing homes and long term care (listing) Rest homes (listing) Robeson County Health Department Housing Fairmont Housing Authority First Baptist Home Maxton Housing Authority Lumberton Housing Authority Pembroke Housing Authority Providence Place at Red Springs Robeson County Housing Authority Rural Development In-Home Services Community Alternatives Program (CAP) Home Health / Personal Care Services (listing) Information and Referral Advance Directives (Living Wills, etc.) American Cancer Society American Diabetes Association American Heart Association Carolina Donor Services Center for Community Action or Cooperative Extension Service Center Committee for the Disabled Community Health Education Center (CHEC) Four-County Community Services, Inc. (Lumberton, Fairmont & St. Pauls Neighborhood Service Center) Lumbee Regional Development Association Lumbee Tribal Government Lumber River Council of Governments N.C. Services for the Blind Robeson Job Link Career Center Vocational Rehabilitation Services
61 Legal Services Lumbee River Legal Service (Legal Aid of N.C.) Maternal/Child Health Prepared Childbirth Classes (SRMC) Breastfeeding information (SRMC) Breastfeeding equipment (SRMC) Homespun Nurturing Breastfeeding Program (Ro. Co. Health Dept) Maternity care (Robeson County Health Dept.) WIC (Women, Infant, Children) Nutrition Services Women's Preventive Health (contraception) Mental Health/Mental Retardation Services Southeastern Regional Mental Health Center Crisis Line: Robeson Family Counseling Center Pain Management Southeastern Pain Management Clinic Recreation/Activities Lumberton Recreation and Parks Commission Pine Street Senior Center Robeson County Recreation and Parks Commission Senior Services Adult Protective Services (Dept. of Social Services) Meals on Wheels (Lumber River COG) Pine Street Senior Center PrivilegesPlus Social Security Administration Veteran s Service, Robeson County Support Groups Alcoholics Anonymous Alzheimer's disease Bereavement Cancer (Breast & Reproductive) or Cancer (Prostate) or Diabetes Heart disease ext Lung disease Narcotics Anonymous Transportation Southeastern Area Transit System (SEATS)
62 Appendix C: Community Opinion Survey 60
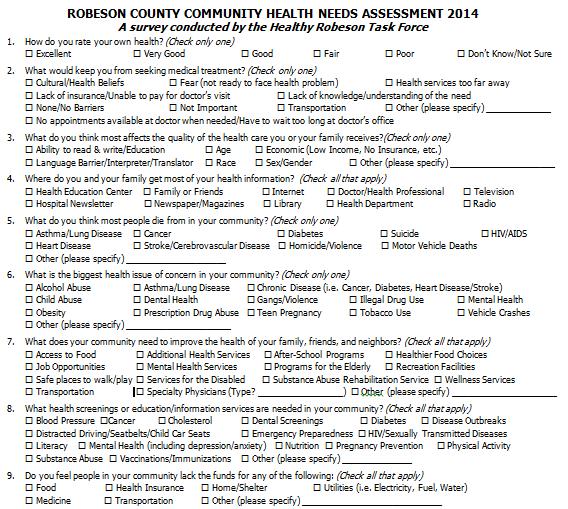
63 61
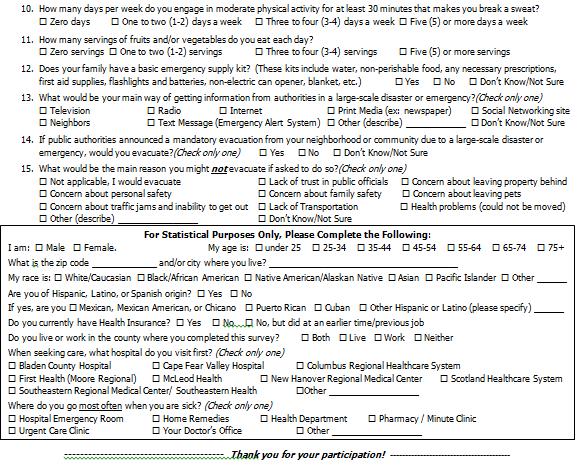
64 62
65 Appendix D: Affordable Care Act Coverage for North Carolina 63
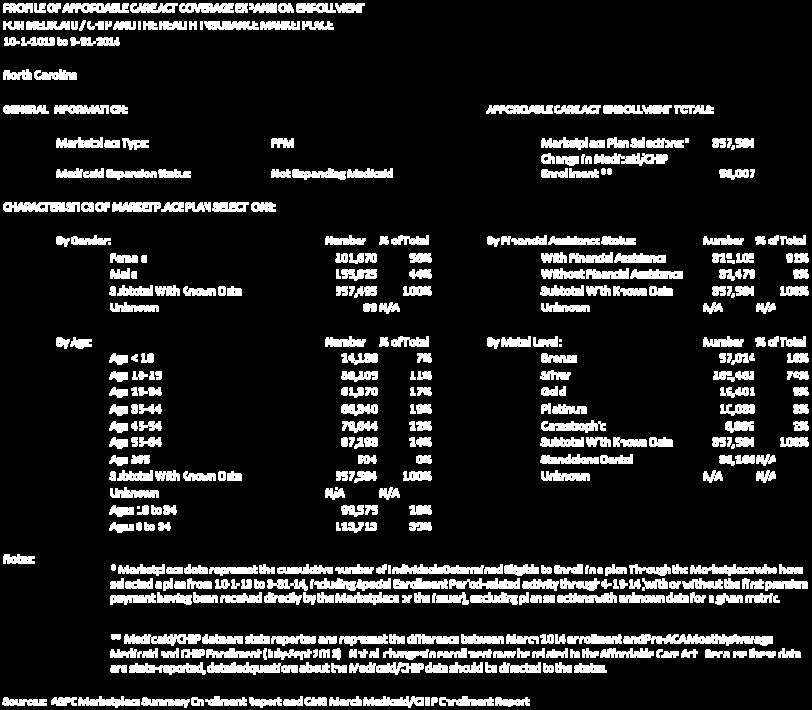
66 64
67 Appendix E: Implementation Strategies (Action Plans) 65
68 Community Health Action Plan 2014 Designed to address Community Health Assessment priorities County: Robeson Partnership, if applicable: Healthy Robeson Taskforce Period Covered: LOCAL PRIORITY ISSUE Priority issue: Obesity Was this issue identified as a priority in your county s most recent CHA? X Yes No LOCAL COMMUNITY OBJECTIVE Please check one: _ New _X_ Ongoing (was addressed in previous Action Plan) By (year): 2017 Objective: By 2017, increase the percentage of adults in Robeson County that participate in any physical activity or exercise from 63.5 % to 67.8%. (BRFSS, NC State Center for Health Statistics, 2011) Original Baseline: Increase the percentage of adults in Robeson County getting the recommended amount of physical activity from 31.9 % to 36.16%. Date and source of original baseline data: BRFSS, NC State Center for Health Statistics, 2009 Updated information (For continuing objective only): Note: Due to changes in the weighting methodology and other factors, results from 2011 are not comparable to 2010 and earlier years. Date and source of updated information: BRFSS, NC State Center for Health Statistics, 2011 POPULATION(S) Describe the local population(s) experiencing disparities related to this local community objective: An average of 41.15% of individuals with high school/ GED or less education compared to 51.2 % college graduates indicated they received the recommended amount of physical activity (BRFSS, NC State Center for Health Statistics, 2009) Total number of persons in the local disparity population(s): There are 70.9% (95,602) of high school graduates or higher ( ) in Robeson County. We plan to impact 4.26 % of the population which is 4,072 individuals. Source: 2013 US Census Fact Finder Check one Healthy NC 2020 focus area: (Which objective below most closely aligns with your local community objective?) List HEALTHY NC 2020 Objective: (Detailed information can be found at website) HEALTHY NC 2020 FOCUS AREA ADDRESSED Tobacco Use X Physical Activity and Nutrition Substance Abuse STDs/Unintended Pregnancy Environmental Health Social Determinants of Health (Poverty, Education, Housing) Maternal and Infant Health Injury Mental Health Oral Health Infectious Diseases/ Food-Borne Illness Chronic Disease (Diabetes, Colorectal Cancer, Cardiovascular Disease) Cross-cutting (Life Expectancy, Uninsured, Adult Obesity) RESEARCH RE. WHAT HAS WORKED ELSEWHERE*List the 3-5 evidence-based interventions (proven to effectively address this priority issue) that seem the most suitable for your community and/or target group. *Training and information are available from DPH. Contact your regional consultant about how to access them. 66
69 Intervention Describe the evidence of effectiveness (type of evaluation, outcomes) Source Communities should participate in community coalitions or partnerships to address obesity. Communities Should Enhance Personal Safety in Areas Where Persons Are or Could Be Physically Active Communities Should Enhance Infrastructure Supporting Bicycling Little evidence is available to determine the impact of community coalitions on obesity prevention. However, tobacco-control literature demonstrates that the presence of antismoking community coalitions is associated with lower rates of tobacco consumption. One study indicated that states with a greater number of anti-tobacco coalitions had lower per capita cigarette consumption than states with a lower number of coalitions. Cross-sectional studies have demonstrated a negative relationship between crime rates and/or perceived safety and physical activity in neighborhoods, particularly among adolescents. A systematic review indicated that observational measurements of safety (e.g., crime incidence) were negatively associated with physical activity, but subjective measurements (self-reported safety) were not correlated with physical activity. Few intervention studies have evaluated the impact of policies and practices to improve personal safety on physical activity. However, one study indicated that improved street lighting in London led to reduced crime rates, less fear of crime, and more pedestrian street use. Some studies suggest that the relationship between safety and physical activity might vary by gender and/or other individual-level characteristics. For example, one study indicated that incidence rates of violent crimes were associated with lower physical activity in adolescent girls, but not in boys. Persons of lower socioeconomic status depend more on walking as a means of transportation as compared with those of higher socioeconomic status, and they also are more likely to live in neighborhoods that are unsafe. This could explain why some studies do not find a positive association between perceived safety and physical activity. Reducing crime levels might require complex, multisectoral, and long-term efforts, which might go beyond the authority and capacity of local communities. Enhancing infrastructure supporting bicycling includes creating bike lanes, shared-use paths, and routes on existing and new roads; and providing bike racks in the vicinity of commercial and other public spaces. Improving bicycling infrastructure can be effective in increasing frequency of cycling for utilitarian purposes (e.g., commuting to work and school, bicycling for errands). Research demonstrates a strong association between bicycling infrastructure and frequency of bicycling. Longitudinal intervention studies have demonstrated that improving bicycling infrastructure is associated with increased frequency of bicycling (104,105). Cross-sectional studies indicated a significant association between bicycling infrastructure and frequency of biking (p<0.001) (103,106,107). CDC MMWR Recommendations and Reports, July 24, 2009 / 58(RR07);1-26: Recommended Community Strategies and Measurements to Prevent Obesity in the United States CDC MMWR Recommendations and Reports, July 24, 2009 / 58(RR07);1-26: Recommended Community Strategies and Measurements to Prevent Obesity in the United States CDC MMWR Recommendations and Reports, July 24, 2009 / 58(RR07);1-26: Recommended Community Strategies and Measurements to Prevent Obesity in the United States 67
70 Communities Should Improve Access to Outdoor Recreational Facilities Communities Should Enhance Infrastructure Supporting Walking In a review based on 10 studies, the Community Guide concluded that efforts to increase access to places for physical activity, when combined with informational outreach, can be effective in increasing physical activity (100). The studies reviewed by the Community Guide included interventions such as creating walking trails, building exercise facilities, and providing access to existing facilities. However, it was not possible to separate the benefits of improved access to places for physical activity from health education and services that were provided concurrently. A comprehensive review of 108 studies indicated that access to facilities and programs for recreation near their homes, and time spent outdoors, correlated positively with increased physical activity among children and adolescents. A study that analyzed data from a longitudinal survey of 17,766 adolescents indicated that those who used community recreation centers were significantly more likely to engage in moderate to vigorous physical activity (p ). A multivariate analysis indicated that self-reported access to a park, and the perception that footpaths are safe for walking were significantly associated with adult respondents being classified as physically active at a level sufficient for health benefits. Another study that used selfreport and GIS data concluded that longer distances and the presence of barriers (e.g., busy streets and steep hills) between individuals and bike paths were associated with non-use of bike paths. Infrastructure that supports walking includes but is not limited to sidewalks, footpaths, walking trails, and pedestrian crossings. Walking is a regular, moderate-intensity physical activity in which relatively large numbers of persons can engage. Well-developed infrastructure supporting walking is an important element of the built environment and has been demonstrated to be associated with physical activity in adults and children. Interventions aimed at supporting infrastructure for walking are included in street-scale urban design and land use interventions that support physical activity in small geographic areas. These interventions can include improved street lighting, infrastructure projects to increase the safety of street crossings, use of traffic calming approaches (e.g., speed humps and traffic circles), and enhancing street landscaping (108). The Community Guide reports sufficient evidence that street-scale urban design and land use policies that support walking are effective in increasing levels of physical activity (108). Reviews of cross-sectional studies of environmental correlates of physical activity and walking generally find a positive association between infrastructure supportive of walking and physical activity (109,110). However, some systematic reviews indicated no evidence of an association between the presence of sidewalks and physical activity (111). Other reviews indicated associations, but only for certain subgroups of subjects (e.g., men and users of longer walking trails) (108,109). Intervention studies demonstrate effectiveness of enhanced walking infrastructure when combined with other strategies. For example, evaluation of the Marin County Safe Routes to School program indicated that identifying and creating safe routes to school, together with educational components, increased the number of students walking to school (105). When CDC MMWR Recommendations and Reports, July 24, 2009 / 58(RR07);1-26: Recommended Community Strategies and Measurements to Prevent Obesity in the United States CDC MMWR Recommendations and Reports, July 24, 2009 / 58(RR07);1-26: Recommended Community Strategies and Measurements to Prevent Obesity in the United States 68
71 considering the evidence for this strategy, planners should note that physically active individuals might be more likely to locate in communities that have an existing infrastructure for walking, which might produce spurious correlations in cross-sectional studies (109). Suggested measurement Total miles of paved sidewalks relative to the total street miles (excluding limited access highways) that are maintained by a local jurisdiction. This measurement captures the availability of sidewalks in a local jurisdiction relative to the total miles of streets. The measurement does not take into account the continuity of sidewalks between locations. In this measurement total non-highway street miles are limited to paved streets maintained by and paid for by local government and excludes limited access highways. Although no estimated standard exists for this measurement, data collected from local governments reporting on this measurement can lead to establishment of a standard. 69
72 WHAT INTERVENTIONS ARE ALREADY ADDRESSING THIS ISSUE IN YOUR COMMUNITY? Are any interventions/organizations currently addressing this issue? X Yes No If so, please list below. Intervention Lead Agency Progress to Date 1. Community Transformation Grant Project 1. Robeson County Health Department 2. Healthy Town Initiative/ Public Schools of Robeson County 3. Faithful Families 2. Southeastern Health 3. Robeson County Health Department and Cooperative Extension 1. Community Transformation Grant (CTG) Project worked with to establish a land usage plan for Robeson County. Currently seeking funding to continue Community Transformation Grant (CTG) Project initiatives. 2. Southeastern Health established walking trails in the Town of Red Springs (within Robeson County) and all 23 Public Elementary Schools in Robeson County. All signage along the trail was inclusive of physical activity and/or healthy eating messages. 3. Faithful Families established walking trails in area churches in Robeson County (Robeson County Health & Cooperative Extension) WHAT RELEVANT COMMUNITY STRENGTHS AND ASSETS MIGHT HELP ADDRESS THIS PRIORITY ISSUE? Community, neighborhood, and/or demographic group The Healthy Robeson Taskforce Individual, civic group, organization, business, facility, etc. connected to this group There are over 40 Individuals, civic groups, organizations, business, and resources connected to this group How this asset might help The Healthy Robeson Taskforce members were activity involved in the 2014 CHA process and helped select the priorities for this action plan. They have a vested interest in the plan and want to see a change in the health status of Robeson residents. These organizations will help gain support for the interventions; assist with making changes in their agencies and community and offer their time and resources. 70
73 INTERVENTIONS SPECIFICALLY TARGETING HEALTH DISPARITIES INCLUSIVE OF SETTING & TIME FRAME Intervention: Diversify the Healthy Robeson Task to include representation from our selected target population (individuals with an education that is high school or less) or representatives from agencies that work with these individuals. Intervention: _x_ new ongoing completed Setting: Community Start Date End Date: October October 2017 Level of Intervention - change in: _x_ Individuals _ Policy &/or Environment INDIVIDUAL CHANGE INTERVENTIONS Intervention: Community-wide Campaign to promote physical activity. Intervention: COMMUNITY PARTNERS ROLES & RESPONSIBILITIES Lead Agency: Healthy Robeson Task Force Role: Task Force members will diversify its committee by conducting a GAP analysis to assess the current membership list and determine the key partners and community members that should be represented. Additionally, the taskforce will recruit and retain individuals by continuously engaging them, discussing the relevant benefits & expected results. Partners: Robeson County Housing Authority, Robeson Community College Adult Education Program. Robeson County DSS, Local Government, Healthy Robeson Task Force Role: Robeson County Housing Authority, Robeson Community College and Robeson County DSS will help identify members of our selected target population. Include how you re marketing the intervention: We will market through media channels from the interventions developed which specifically target health disparities. This will be inclusive of utilizing column space that the Robeson County Health Department and Southeastern Health (hospital) has in the local newspaper; The Robesonian to make the community aware of the Healthy Robeson Task Force and its initiatives. COMMUNITY PARTNERS ROLES & RESPONSIBILITIES Lead Agency: Healthy Robeson Task Force Role: Healthy Robeson Taskforce will be responsible 71 PLAN HOW YOU WILL EVALUATE EFFECTIVENESS Quantify what you will do Overview: Healthy Robeson Task Force will initiate and/or coordinate interventions to increase opportunities for community members to become physically active. We will ensure the Task Force develops interventions that specifically target health disparities. This will be done by requiring our membership have proper representation from our selected target population (individuals with an education that is high school or less). Measurement: # of Healthy Robeson Task Force members that are from the selected target population & the number of agencies that works with the selected population. Expected outcomes: A diverse Task Force that includes representation from our selected target population and programs that specially target health disparities. Evidence: Local Physical Activity & Nutrition Coalition Manual Guide for Community Action PLAN HOW YOU WILL EVALUATE EFFECTIVENESS Quantify what you will do Overview: Traditional prevention efforts focus on educating and motivating people to help them
74 X_new ongoing completed Setting: Community Start Date End Date: October 2014-October 2017 Level of Intervention- change in: _x_ Individuals _ Policy &/or Environment engaging the community, developing messages, planning and evaluating interventions, and creating policy and environmental actions that supports individual change. Partners: Robeson Community College Adult Basic Education Program, Robeson Road Runners, Department of Social Services, Housing Authority, Robesonian, Robeson County Health Department and Southeastern Health (Public Relations Officers) Role: Partners will assist with tailoring messages to reach the intended target population. Additionally, they will promote interventions via various media outlets within and outside of their respective agencies. Include how you re marketing the intervention television, radio, newspaper, News promotions in addition to paid media spots and presentations throughout the county. increase their physical activity. Community-wide campaigns address multiple levels of influence, including individual, interpersonal, institutional, and community levels. These types of socioecological, multipronged efforts are designed to promote and eliminate barriers which have been found to be more effective than single components. Action Steps 1. Build partnerships that include local agencies and organizations and implement initiatives that promote physical activity. Access to determine if Task Force members may be able to offer activities and events as part of the marketing campaign. 2. Development of Healthy Robeson Task Force speaker s bureau. 3. Talk to key individuals and organizations in the community. 4. Identify the intended audiences and conduct the campaign on the basis of formative research. 5. Development of walking programs that target our selected target population. 6. Develop a program logic model that illustrates the program s theory of action and how community activities conducted by others relate to the Task Force s program. Measurement: The number of television, radio, newspaper, news promotions in addition to paid media spots and presentations throughout the county. Expected outcomes: Improve community capacity by developing or strengthening social networks and by improving community members sense of cohesion and collective ability to bring about change. 72
75 POLICY OR ENVIRONMENTAL CHANGE INTERVENTIONS Intervention: Development of community trails (walking and bicycling) and promoting its use to increase physical activity among adults. _x_ new ongoing completed Setting: Community Start Date End Date: October October 2017 Level of Intervention - change in: Individuals X_ Policy &/or Environment COMMUNITY PARTNERS ROLES & RESPONSIBILITIES Lead Agency: Healthy Robeson Taskforce Role: Bring together committed partners and stakeholders in the form of a working group to facilitate trail development and promotional activities, and begin planning for the evaluation component. Partners: Community Residents, Community organizations and citizen groups (e.g., walking groups; bicycling, running, and outdoor clubs), Robeson Road Runners, Public and Private land owners, community leaders, local business, local media, health care providers, Robeson County Health Department, Parks and Recreation, Department of Transportation, government agencies, law enforcement agencies, trail planning design and construction experts, local and state policy makers. Role: Assist with fundraising activities, build support for trail through fundraising and informational outreach activities, grant permission for land use, provide resources to support trail, help to promote trail, organize and host events involving trail use, inform public about trail progress, encourage trail use among patients as healthy activity, provide 73 Evidence: Centers for Disease Control and Prevention. Strategies to Prevent Obesity and Other Chronic Diseases: The CDC Guide to Strategies to Increase Physical Activity in the Community. Atlanta: U.S. Department of Health and Human Services; PLAN HOW YOU WILL EVALUATE EFFECTIVENESS Quantify what you will do: Overview: Research has shown that modifying the living and working environment by creating or enhancing access to places where people can be physically active, along with providing related informational outreach activities, is an effective intervention to help people incorporate healthier behaviors into their daily lives. Interventions of this type affect entire populations by targeting physical structures in the community. Public health coalitions, businesses, departments of parks/ recreation/ transportation and planning, community agencies/ organizations and legislators can facilitate implementation of environmental change(s) to increase opportunities for physical activity. 1. Collect information and identify available resources that will help facilitate community trail development and promotion. 2. Organize human material, and financial resources needed for trail development and promotional activities. 3. Engage existing partners and key stakeholders by informing them of plans to develop community trail(s) and educating them about its benefits. 4. Bring together committed
76 resources and leadership, facilitate trail maintenance, identify suitable trail locations, construct trail, offer guidance on safety issues related to trail use, ensure safety of trail. Include how you re marketing the intervention: 1. Host a kick-off event to celebrate the opening of the trail to the public and to highlight its multiple uses. 2. Promote the event through flyers and media announcements. To encourage attendance among multiple user groups. 3. Host individual types of races (e.g., bike race, running race) to entice a variety of trail users. 4. Host events that give exercise tips for the types of physical activity that are associated with the trail. 5. Contact established walking groups, bicycling and running clubs and other outdoor organizations to inform them of the trail s features and to encourage its use as a primary or alternate route. partners and stakeholders in the form of a working group to facilitate trail development and promotional activities and begin planning for the evaluation component. 5. Promote the project to build community support. 6. Identify trail locations the working group will consider and establish criteria by which final selection criteria will be utilized. 7. Approach public agencies within Robeson County to determine which agency/agencies is/are interested in sponsoring the project. 8. Determine staff members to serve as points of contact for the remainder of the project; afterwards and discuss key issues with them. 9. Estimate the costs of trail development for each potential trail location. 10. Analyze trail location(s) and funding options to select the best location and to determine which funding source to apply for trail funding; continue to build community support. 11. Collaborate with the working group to review and refine project evaluation activities. 12. Plan a groundbreaking event. 13. Remain connected with individuals responsible for trail construction throughout the entire construction process. 14. Conduct promotional activities within the community during trail construction to keep residents engaged and to encourage future trail use 15. Once construction is complete, organize a kick-off event and ongoing promotional activities to further encourage trail use. 74
77 Measurement: # of walking trails created, total miles of designated shared-use paths and bike lanes relative to the total street miles (excluding limited access highways) that are maintained by a local jurisdiction and total miles of paved sidewalks relative to the total street miles (excluding limited access highways) that are maintained by a local jurisdiction. Expected outcomes The environmental improvements achieved by the community trail will reduce existing barriers to physical activity. Informational outreach activities will promote community usage of the trail. Frequency of physical activity and general physical fitness will increase. Evidence: Partnership for Prevention. Places for Physical Activity: Facilitating Development of a Community Trail and Promoting Its Use to Increase Physical Activity Among Youth and Adults An Action Guide. The Community Health Promotion Handbook: Action Guides to Improve Community Health. Washington, DC: Partnership for Prevention;
78 Community Health Action Plan 2014 Designed to address Community Health Assessment priorities County: Robeson Partnership, if applicable: Healthy Robeson Taskforce Period Covered: LOCAL PRIORITY ISSUE Priority issue: Substance Misuse & Abuse Was this issue identified as a priority in your county s most recent CHA? X Yes No LOCAL COMMUNITY OBJECTIVE Please check one: New _X_ Ongoing (was addressed in previous Action Plan) By (year): 2017 Objective: To reduce by 5% the abuse of prescription drugs in Robeson County. Original Baseline: 1. In Robeson County, 23 unintentional overdoses in County ( ), of which 15 had an underlying cause of death associated with narcotics. Source: NC State Center for Health Statistics. 2. In Robeson County, 145 out of 286 Providers (dentists, physicians & mid-levels) are registered with the NC Controlled Substances Reporting System. Source: NC Controlled Substance Reporting System 3. In Robeson County, 66 out of at least 98 licensed pharmacists dispensing in Robeson County use the CSRS database. Source: NC CSRS & NC Board of Pharmacy Date and source of original baseline data: See above Updated information (For continuing objective only) Date and source of updated information: March 2014 NC Department of Health & Human Services; Drug Control Unit POPULATION(S) Describe the local population(s) experiencing disparities related to this local community objective: 1. Illicit Drug Use: Young adults aged years are more likely to report illicit drug use than people of other ages (19.5 % versus 9.8 % for those aged and 5.6% for those aged 26 and older in ). Total number of persons in the local disparity population(s): 1. Number of individuals in Robeson County with age is 24,865 out of a total population of 139,942. Source: 2013 Census Bureau Quick Facts & Log Into North Carolina (LINC) 1. Number you plan to reach with the interventions in this action plan: Total = 2,557 ( 5% of youth in Robeson County 51,145) HEALTHY NC 2020 FOCUS AREA ADDRESSED Tobacco Use Physical Activity and Nutrition X_ Substance Abuse STDs/Unintended Pregnancy Environmental Health Social Determinants of Health (Poverty, Education, Housing) Maternal and Infant Health Injury Mental Health Oral Health Infectious Diseases/ Food-Borne Illness Chronic Disease (Diabetes, Colorectal Cancer, Cardiovascular Disease) Cross-cutting (Life Expectancy, Uninsured, Adult Obesity) Check one Healthy NC 2020 focus area: (Which objective below most closely aligns with your local community objective?) List HEALTHY NC 2020 Objective: (Detailed information can be found at website) 1. Reduce the percentage of individuals aged 12 years and older reporting any illicit drug use in the past 30 days. 76 Revised January 2011
79 RESEARCH RE. WHAT HAS WORKED ELSEWHERE*List the 3-5 evidence-based interventions (proven to effectively address this priority issue) that seem the most suitable for your community and/or target group. *Training and information are available from DPH. Contact your regional consultant about how to access them. Intervention Describe the evidence of effectiveness (type of evaluation, outcomes) Source Utilization of prescription data combined with insurance restrictions to prevent "doctor shopping" and reduce inappropriate use of opioids Improving legislation and enforcement of existing laws. Improve medical practice in prescribing opioids. Users of multiple providers for the same drug, people routinely obtaining early refills, and persons engaged in other inappropriate behaviors can be tracked with state prescription drug monitoring programs or insurance claim information. Public and private insurers can limit the reimbursement of claims for opioid prescriptions to a designated doctor and a designated pharmacy. This action is especially important for public insurers because Medicaid recipients and other low-income populations are at high risk for prescription drug overdose. Insurers also can identify inappropriate use of certain opioids for certain diagnoses (e.g., the use of extended-release or long-acting opioids like transdermal fentanyl or methadone for short-term pain). Most states now have laws against doctor shopping, but they are not enforced uniformly. Only a few states have laws regulating for-profit clinics that distribute controlled prescription drugs with minimal medical evaluation. Laws against such "pill mills" as well as laws that require physical examinations before prescribing might help reduce the diversion of these drugs for nonmedical use. In addition, a variety of other state controls on prescription fraud are being employed. For example, according to the National Alliance for Model State Drug Laws, 15 states required or permitted pharmacists to request identification from persons obtaining controlled substances as of March 2009.* Care for patients with complex chronic pain problems is challenging, and many prescribers receive little education on this topic. As a result, prescribers too often start patients on opioids and expect unreasonable benefits from the treatment. In a prospective, population-based study of injured workers with compensable low back pain, 38% of the workers received an opioid early in their care, most at the first doctor visit (14). Among the 6% who went on to receive opioids for chronic pain for 1 year, most did not report clinically meaningful improvement in pain and function, even though their opioid dose rose significantly over the year.. CDC Morbidity & Mortality Weekly Report (MMWR) CDC Grand Rounds: Prescription Drug Overdoses- A U.S. Epidemic; January 13, (01);10-13: Prescription Drug Overdoses- A U.S. Epidemic CDC Morbidity & Mortality Weekly Report (MMWR) CDC Grand Rounds: Prescription Drug Overdoses- A U.S. Epidemic; January 13, (01);10-13: Prescription Drug Overdoses- A U.S. Epidemic CDC Morbidity & Mortality Weekly Report (MMWR) CDC Grand Rounds: Prescription Drug Overdoses- A U.S. Epidemic; January 13, (01);10-13: Prescription Drug Overdoses- A U.S. Epidemic 77
80 WHAT INTERVENTIONS ARE ALREADY ADDRESSING THIS ISSUE IN YOUR COMMUNITY? Are any interventions/organizations currently addressing this issue? Yes X No If so, please list below. Intervention Lead Agency Progress to Date 1. Robeson County Substance Abuse Coalition 2. Safe Kids Coalition (Insert rows as needed) 1. Southeastern Regional Medical Center (SRMC) 2. Robeson County Health Department (RCHD) 1. Currently working on policy and environmental strategies (i.e, doctors and pharmacists utilizing control substance reporting system ( CSRS), permanent drop box locations at Robeson County Sheriff s Department). Initiatives with local high schools to increase knowledge regarding the consequences of prescription drug abuse & driving while impaired. 2. Collaboration with RC Substance Abuse Coalition with Operation Medicine Drop events & permanent drop box locations at Robeson County Sheriff s Department WHAT RELEVANT COMMUNITY STRENGTHS AND ASSETS MIGHT HELP ADDRESS THIS PRIORITY ISSUE? Community, neighborhood, and/or demographic group The Healthy Robeson Taskforce (Insert rows as needed) INTERVENTIONS: SETTING, & TIMEFRAME INTERVENTIONS SPECIFICALLY TARGETING HEALTH DISPARITIES Intervention: Enhance knowledge via a youth rally regarding prescription & illicit drug overdose and the associated risks. Intervention: new x _ ongoing completed Setting: community Start Date End Date: Ongoing Level of Intervention - change in: _x_ Individuals Policy &/or Environment Individual, civic group, organization, business, facility, etc. connected to this group There are over 40 Individuals, civic groups, organizations, business, and resources connected to this group COMMUNITY PARTNERS Roles and Responsibilities Lead Agency: Southeastern Regional Medical Center Role: Substance Abuse Coalition Specialist Partners: Robeson County Substance Abuse Coalition, Robeson County Sherriff s Department, Lumberton Police Department, Safe Kids Coalition + Public Schools of Robeson County (PSRC) Role: To provide basic information regarding the statistics pertaining to prescription and illicit drug abuse. Information will include signs and symptoms. Include how you re marketing the intervention: Local Newspaper, Awareness campaigns in the Public 78 How this asset might help The Healthy Robeson Taskforce members were activity involved in the 2014 CHNA process and helped select the priorities for this action plan. They have a vested interest in the plan and want to see a change in the health status of Robeson residents. These organizations will help gain support for the interventions; assist with making changes in their agencies and community and offer resources and time. PLAN HOW YOU WILL EVALUATE EFFECTIVENESS 1. Quantify what you will do Overview: Provide Youth Rally at Farmer s Market Pavilion. Youth from all PSRC High Schools will be invited to participate. Activities will be aimed toward increasing the knowledge of the consequences associated with illicit/prescription drug abuse. Measurement: Pre and posttest evaluation at event. 2. Expected outcomes: Youth will become increasing aware of prescription & illicit drug. Evidence: Erik Rowels (Leading to Change). National presenter that utilizes various strategies to work on creating change in youth. Eric is currently providing these trainings to Revised January 2011
81 INDIVIDUAL CHANGE INTERVENTIONS Intervention: Enhance the communication skills of providers and pharmacists to encourage discussions about prescription drug abuse with patients during routine office visits through training opportunities. Intervention: new X_ ongoing completed Setting: community Start Date End Date: Ongoing Level of Intervention - change in: _x_ Individuals _ Policy &/or Environment POLICY OR ENVIRONMENTAL CHANGE INTERVENTIONS Intervention: To focus on a campaign of properly storing and disposing of medications (prescription and nonprescription). Intervention: new x _ ongoing completed Setting: community Start Date End Date: Ongoing Level of Intervention - change in: _x_ Individuals _x_ Policy &/or Environment Schools, committee events, use of committee logo on promotional items and print materials. Lead Agency: Southeastern Regional Medical Center Role: Substance Abuse Coalition Specialist Partners: Robeson County Substance Abuse Coalition and Project Lazarus Role: To help implement and evaluate interventions in the substance abuse action plan. Include how you re marketing the intervention: Local Newspaper, committee events, use of committee logo on promotional items and print materials. Lead Agency: Southeastern Regional Medical Center Role: Substance Abuse Coalition Specialist Partners: Robeson County Substance Abuse Coalition, Robeson County Safe Kids Coalition, Lumberton Police Department Role: To implement a campaign of proper storage and disposal of medications. Include how you re marketing the intervention: Local Newspaper, committee events, use of committee logo on promotional items and print materials. members of the coalition. To date; coalition has participated in 2 of 3 trainings. 3 rd training to be held September Will know if intervention was successful via information obtained via pre and posttest results. 1. Quantify what you will do Overview: Communication skills of medical providers & pharmacists will be enhanced via discussions regarding prescription drug abuse with patients. Measurement: Will determine drug risks; interactions; importance of not sharing and properly securing prescription drugs; break down barriers; relay coping mechanisms and pain management. 2. Expected outcomes: Doctors and pharmacists are more easily able to communicate with patients Evidence: Project Lazarus is the evidenced-based initiative referenced for this action plan. The Robeson County Substance Abuse Coalition is closely working with Fred Branson. Will know if intervention is successful via feedback obtained through providers and pharmacists at the end of training opportunities. 1. Quantify what you will do Overview: Robeson County Substance Abuse Coalition Specialist and Robeson County Safe Kids Coordinator will spearhead campaign/initiative of proper storage and disposal of medications. Measurement: Track & report number of requests for home medication lock boxes in addition to tracking number of pills returned at take-back events and disposed of in permanent drop box at Robeson County Sheriff s department. 2. Expected outcomes: Increase in number of medications properly stored in homes. Increase of medications properly disposed of. Evidence: Intervention will be noted as successful based upon tracking and reporting information outlined in measurement section above. 79
82 POLICY OR ENVIRONMENTAL CHANGE INTERVENTIONS Intervention: To implement a policy requiring all Robeson County providers & pharmacists to utilize the CSRS (controlled substance reporting system) when requiring controlled substances (schedule 2-5) Intervention: new x _ ongoing completed Setting: community Start Date End Date: Ongoing Level of Intervention - change in: _x_ Individuals _x_ Policy &/or Environment Lead Agency: Southeastern Regional Medical Center Role: Substance Abuse Coalition Specialist Partners: Robeson County Substance Abuse Coalition and Project Lazarus Role: To help implement and evaluate interventions in the substance abuse action plan. Include how you re marketing the intervention: Local Newspaper, committee events, use of committee logo on promotional items and print materials. 3. Quantify what you will do Overview: Robeson County Substance Abuse Coalition Specialist will provide certificate of recognition to providers for registering with CSRS Measurement: Track & report individual usage of the CSRS system; share ranking and best practice process with peer medical providers. 4. Expected outcomes: Public and private insurers can limit the reimbursement of claims for opioid prescriptions to a designated doctor and a designated pharmacy. This action is especially important for public insurers because Medicaid recipients and other low-income populations are at high risk for prescription drug overdose. Insurers also can identify inappropriate use of certain opioids for certain diagnoses (e.g., the use of extended-release or long-acting opioids like transdermal fentanyl or methadone for short-term pain). Evidence: Project Lazarus is the evidenced-based initiative referenced for this action plan. The Robeson County Substance Abuse Coalition is closely working with Fred Braison. Intervention will be monitored by obtaining statistical information via Fred Braison/staff of Project Lazarus. Updates are made to the Robeson County Substance Abuse Coalition and Healthy Robeson Task Force at least 2 x s per year. 80 Revised January 2011
83 Appendix F: Community Benefit Report 81


84 B E N E F I T R E P O R T Compiled by Southeastern Health Community Health Services 82
85 83
86 B E N E F I T R E P O R T Table of Contents 1.Annual Filing Page 1 2.Community Health Services Programming Page 7 3.Other Southeastern Health Programming Page 24 4.Summary & Staffing Page 41 5.Strategic Plan Page 44 6.Grant Assistance Page 46 84
87 B E N E F I T R E P O R T Annual Filing 85 1
88 North Carolina Medical Care Commission Executive Summary: Community Health Improvement Plan (Hospitals) Organization: Southeastern Health Date: April 07, Statement of organization s mission and commitment to community health improvement: For the past seventeen years, Southeastern Health has demonstrated a strong commitment to improving the health of the community it serves. Our mission is: to provide quality regional health care in a safe, compassionate and efficient environment. In view of this mission, our medical center and the Robeson County Health Department convened a group of health and human service agencies to form a local Healthy Carolinians Task Force in February of Southeastern Health has served as the lead agency of the task force since its inception. This task force, known as the Healthy Robeson Task Force, first became a certified Healthy Carolinians Task Force in Since then, the task force has completed all requirements for recertification in 2000, 2004 and The dissolution of the North Carolina Healthy Carolinians Office at the state level was due to state budget cuts and therefore no other certification process was available. We maintained certification by the state office through Our Healthy Robeson Task Force continues to meet on a regular basis. The mission of the Healthy Robeson Task Force (commonly referred to as the Partnership) is: to improve population health in Robeson County. Membership consists of a group of concerned citizens from at least 30+ agencies representing health care, human services, the public schools, local businesses, the faith community and the community at large. The vision of the group is to establish Robeson County as the healthiest county in North Carolina. 2. Describe geographic service area and target populations for community initiatives: The mission of Southeastern Health clearly states the target population includes all residents of Robeson County and the surrounding region. However, the Healthy Robeson Task Force is charged with targeting the underserved populations experiencing health disparities. Examples of our targeted populations are noted below: Native American adults in rural areas of the county where transportation is a barrier in accessing preventive health services. Uninsured African American and Native American males at high risk for prostate cancer are encouraged to participate in a free prostate cancer screen each year. Schools with a high percentage of students receiving free and reduced lunches are targeted to receive nutrition and physical activity education. All residents with any type of diabetes and their families who need disease management education to prevent the complications stemming from poor diabetes control. A diabetes education program is offered to such individuals (with or without health insurance) when referred by a medical provider. 86 2
89 N. C. Medical Care - Community Benefits Report (Hospitals) 3. How are the programs in which you are involved funded? In 1995, SRMC s Board of Trustees established a Community Benefit Fund by tithing a percentage of the medical center s annual revenue. These funds were earmarked for the sole purpose of addressing the needs of underserved populations. The Community Health Services department was established and Community Health improvement projects began. Given the current economic conditions that adversely impact all hospital budgets, the Community Health Services department utilizes grant monies for programs whenever possible to help ease the departmental budget. See Grant Assistance section for a list of grant monies utilized for past and current projects. 4. Describe your methodology for determining community priorities and how you collaborate with others: All Healthy Robeson Task Force members play an active role in conducting a countywide needs assessment every four years. The most recent assessment was completed in December Morbidity and mortality data from the needs assessment assists the members in selecting health priorities of concern to be addressed. Other information considered in selecting health priorities include: Results from a community needs assessment survey designed to obtain the community perspective on health issues of concern. Current funding available to address a health issue of concern. Current staff available to carry out an initiative. Ability to sustain an intervention designed to address a specific health issue of concern. Target populations are selected based on the population experiencing the greatest health disparity. All projects conducted by Southeastern Health s Community Health Services department are conducted in collaboration with one or more member agencies involved in the Healthy Robeson Task Force. 5. List current community service programs sponsored or co-sponsored: See Community Partnership section for a brief overview of the community programs conducted throughout FY 13. See Strategic Plan section for a schematic diagram of the 2013 strategic plan designed by the Healthy Robeson Task Force. 87 3
90 88 4
91 Community Benefit Report Itemized Supplement Time Period FY 2013 Southeastern Health Costs Offsetting Revenues/ Grants Net Community Benefit K. Community Health Improvement Services & Community Benefit Operations $489,073 Community Health Services Budget $489,073 - $0 = $489,073 L. Health Professions Education $378,490 Educational Stipends - Reported by SEHealth Finance $382,654 - $4,164 = $378,490 M. Subsidized Health Services $34,730 Southeastern Radiological Associates BCCCP Program $64,630 - $29,900 = $34,730 N. Research Costs $0 Campbell University - None in Fiscal Year 2013 $0 - $0 = $0 O. Cash and In-kind Contributions to Community Groups $3,801,519 Athletic Training Program including ImPact & Camps $267,708 - $46,248 = $221,460 Camp Care $5,492 - $0 = $5,492 Cancer Survivor's Day $6,000 - $0 = $6,000 Community Listening Tours $4,329 $0 $4,329 Compassion for U Congregational Wellness Network - Planning Conference $1,277 $0 $1,277 Festival of Trees $19,213 - $0 = $19,213 Lily Oncology on Canvas - Rental Space for 5 days at $200 per day $1,000 $0 $1,000 Medication Assistance Program $3,527,748 - $25,000 = $3,502,748 PrivelegesPlus $40,000 - $0 = $40,000 P. Community Building Activities $2,200 Substance Abuse Coalition (June Sept 30, 2013) $2,200 - $0 = $2,
92 B E N E F I T R E P O R T Community Partnership 90 6
93 B E N E F I T R E P O R T Programming 91 7
 is sponsoring Breakfast at")


94 Breakfast at Biggs Park Southeastern Health s Community Health Education Center (CHEC) is sponsoring Breakfast at Biggs Park, a new event promoting healthy eating and active lifestyles. Occurring monthly, Breakfast at Biggs Park hosts a healthy breakfast to anyone who attends and features a guest speaker. The guests have varied from a farmer speaking about locally grown foods, to task force members speaking about home/fire safety, and even a doctor talking about cancer and heart health. 92 8


95 Chevy to the Levee The Chevy to the Levee is sponsored by Lumberton Chevrolet, the Robeson Road Runners Club, Southeastern Regional Medical Center (SRMC), the City of Lumberton, The Robesonian and others. This outdoor fundraising event, which includes a 5K race and SRMC s Family Fun Mile, is held on a fall Saturday afternoon at Luther Britt Park. SRMC sponsors and Project H.E.A.L.T.H. coordinates the free Family Fun Mile Run/Walk. In 2012, approximately 428 youth and family members participated. All proceeds from the 5K race are donated to a local charity. K-8 grade participants receive a free SRMC Family Fun Mile t-shirt and all Fun Mile finishers receive a free medal. A snack booth offers a variety of healthy options including apples and other baked snacks. 93 9


96 Southeastern Health s Community Health Education Center (CHEC) is a consumer health library located inside Biggs Park Mall. Health related pamphlets, brochures, books and videos are offered to the public free of charge. Many patrons visit CHEC to learn about their special medical condition(s). Additionally, CHEC offers the use of a blood pressure/weight machine to all patrons and Mall Walker participants. During National Hospital Week in May, CHEC hosted a Lunch & Learn series for its patrons featuring local doctors each day of the week. CHEC Statistics: 13,892 Patron Visits 19,791 Blood Pressure/Weight/BMI Checks 7,312 Free Pamphlets/Brochures Provided 4,918 Health Information Pages Printed or Copied 12 Health Related Books & Videos Checked Out 12,451 Other Related Inquiries or Aid 10 94


97 Community Health Screens Our free community health screens focus on identifying the risk factors for diabetes & heart disease. Screen participants receive individualized interpretation of their blood pressure, total cholesterol, HDLcholesterol, glucose, and risk factor test results. In an effort to reach out to our outlying communities, screens are held in neighborhood fire stations, schools and community centers


98 Healthy Robeson A-Z Healthy Robeson A-Z launched in February 2012 as an initiative to improve the health and well-being of the residents in Robeson County. This initiative spurred from the Healthy Robeson Task Force to focus on three main areas of need, obesity, nutrition, and substance abuse. The healthy habits program uses the 26 letters from the alphabet, to align with healthy behaviors. Ex. A-Add Physical Activity; B-Bake or Grill my Foods; etc. This program was first used by the Robeson County Government employees and will be expanding into other worksites and churches across the county

 held numerous steering committee and program development meetings and activities involving a total of 176")
99 Healthy Robeson Task Force The Healthy Robeson Task Force, formerly known as the Robeson County Partnership for Community Health, initially convened in 1997 and is our local state-certified Health Carolinians Task Force. Our newly adopted vision is to establish Robeson County as the healthiest county in North Carolina and our mission is to improve population health in Robeson County. This collaborative group (70 members representing 40 different agencies) held numerous steering committee and program development meetings and activities involving a total of 176 participants. Certified as a Healthy Carolinians Task Force since 1998 This year the Partnership celebrated its 16 th year as a Certified Healthy Carolinians Task Force


100 International Walk to School Day The International Walk to School Day is an annual event to raise worldwide awareness of walking issues and encourage physical activity among school children and their parents. This year s event incorporated all K-8 schools throughout the county on multiple days. Nearly 1,250 students, parents and teachers participated in their school s activities. At the left, a walking trail sign at a local elementary school


101 Project H.E.A.L.T.H. Project H.E.A.L.T.H. (Healthy Eating and Active Lifestyles for Tomorrow s Health) is a youth obesity prevention program that was initially funded throughout the state by the NC Health & Wellness Trust Fund. The project now continues to function under SRMC s Community Health Services. Project H.E.A.L.T.H. has provided nutrition education to Green Gove Elementary, Peterson and West Lumberton schools and at various community events. Nutrition education has been expanded to include those schools receiving the Fruit and Vegetable grant. Developing on site school walking trails has provided increased opportunity for physical activity for both students and teachers. This year Project H.E.A.L.T.H. reached 40,145 students, parents, teachers and community members. Project H.E.A.L.T.H. staff serve as change agents in the schools and community by establishing strong working partnerships with schools and other community partners


102 Project H.E.A.L.T.H. In the Community Project H.E.A.L.T.H. offers fun and innovative ways to teach nutrition. Participants from the Bill Sapp Summer recreation program enjoyed a field trip to the downtown Farmer s Market which provided the opportunity for the children to talk with the growers and sample some delicious local grown fruits and vegetables. Local chefs worked with the children to have a hands on cooking experience. The Robeson County Boys and Girls Club participants enjoyed the taste of easy to prepare healthy snacks


103 Project H.E.A.L.T.H. In the Walking a mile for a T-shirt Project H.E.A.L.T.H. works within the schools, after school and summer camp programs and community events that focus on children. Students are provided nutrition education on the components of MyPlate, Eat Smart and Move More for Healthy Bones, Rethink Your Drink, and Eat More Fruits & Veggies. Walking trails are a new additional project to help facilitate being active at school. Schools & Summer School Programs We know all about food groups Eating fresh vegetables

 blood test and a Digital Rectal Exam (DRE) for men")

104 Prostate Cancer Screens Every September is National Prostate Cancer Awareness Month. In observance, Southeastern Health, along with local urologists and other medical provider volunteers, conducts a Prostate Cancer Screen. This two-part screen involves a Prostate Specific Antigen (PSA) blood test and a Digital Rectal Exam (DRE) for men age This year the PSA screen was offered in multiple Southeastern Health clinics including the Southeastern Express Lab. The DRE was conducted at AJ Robinson Medical Clinic, Southeastern Medical Clinic Fairmont and Southeastern Medical Clinic Red Springs. At this year s event there were 167 PSAs and 156 DREs provided free of charge to the community
, BB&T, Southeastern Health and numerous other agencies.")

105 Rumba on the Lumber Rumba on the Lumber 5K Run/Walk, Chili and Blues Festival is the largest festival in Robeson County. This festival of food, movement, music and the arts is sponsored by the City of Lumberton, Lumberton Radiological Associates (LRA), BB&T, Southeastern Health and numerous other agencies. The Robeson Road Runners Club coordinates the event held each year in the early spring in historic downtown Lumberton. Like the Chevy to the Levee event, Project HEALTH staff coordinates the Southeastern Health Family Fun Mile Run/Walk. To encourage youth participation, PE teachers are asked to encourage students to train to run the mile prior to the event. Free Family Fun Mile t-shirts were given to students in grades K-8 and all participants received a medal as they came across the finish line. This year s event brought out 570 participants


106 Southeastern Health Food Drive Employees from Southeastern Regional Medical Center and other community members donated various healthy food items in support of Southeastern Regional Medical Center s annual holiday food drive. Community Health Services coordinated and sorted the food collection, which was donated to the Robeson County Church and Community Center to help feed families in Robeson County during the holiday season. As a result of this collaboration, 4,400 pounds of food items were delivered to the food shelves of the Robeson County Church and Community Center


107 The Diabetes Community Center (DCC) offers a comprehensive diabetes education program for all types of diabetes (Type 1, Type 2, gestational and pre-diabetes). The program is taught by nurses and dietitians highly trained as Certified Diabetes Educators. A Retinal Camera at the center allows clinicians to scan for diabetic retinopathy without dilating the patient s eyes. This year the Diabetes Community Center had 4,215 total patient visits

108 Diabetes Community Center of Robeson County Expansion Sites In order to reach more diabetes patients, the Diabetes Community Center (DCC) began to offer comprehensive diabetes education classes in other locations. This option requires less travel for patients to receive our services and provides diabetes education for people with travel barriers. These locations are currently inside A.J. Robinson Medical Clinic in South Lumberton, Southeastern Urgent Care Pembroke, Southeastern Medical Clinic Red Springs, Southeastern Health Center Clarkton, Southeastern Medical Clinic St. Pauls, and Southeastern Medical Clinic Maxton, Southeastern Medical Clinic Fairmont


109 Diabetes Support Group The Diabetes Support Group exists to overcome the barriers in awareness, detection, prevention and self-care of all types of diabetes. It also strives to develop, implement, and support culturally diverse education initiatives at the local, state and regional level. This year the Diabetes Community Network held 12 events and included 102 attendees
110 B E N E F I T R E P O R T Other Southeastern Health Programming


111 Blood Drive hosted by Southeastern Health Events: June 20, 2013 August 22, units 38 units collected collected Did you know?


112 Camp Care Bereavement Weekend Experience for Children "Camp Care Bereavement Weekend Experience for Children provides grief education and bereavement care for children and youth ages 8-16 who have suffered the loss by death of a significant person. This provides children a chance to get away from the realities of losing a loved one and a chance to share their thoughts and grief with trained adult counselors and other children who are grieving. On May 17-19, 2013, 56 adult volunteers hosted 26 bereaved children. At Camp Care, feelings shared about grief are depicted as acceptable, normal and healthy. Three days and two nights are scheduled full of activities; like arts and crafts, drawing, clay sculpting, small group support work, confidence building games, canoeing, journaling, making a memory box, a candlelight memorial service and a live butterfly release Letting Go ceremony. Participants find encouragement and reassurance not only through the volunteer staff, but also through the sharing of other children with similar grief experiences. The camp is open to families served by Southeastern Hospice as well as any child in our community


113 Community Listening Tours The Community Listening Tour was designed to collect information from the community to assist the Board of Trustees of Southeastern Health in setting priorities for the strategic planning process in Additionally, Southeastern Health was able to identify community partners who will help us lead our communities to better health. One system cannot change the health problems facing residents of the Southeastern Health service area alone, but a strong partnership across many sections of a region can make significant improvements. Bladenboro Fairmont State and county level statistical information was shared with community members to help guide and launch a discussing about improving the health Red Springs
 that would substantially change the culture of Emergency Department usage as the Primary Care Provider.")
114 Congressional Wellness Network: Compassion for U Compassion for U Congregational Wellness Network is a faith-based initiative within the concept of Ucare (Southeastern Health s fundamental shift in providing care to improve community health in the region of Southeastern North Carolina) that would substantially change the culture of Emergency Department usage as the Primary Care Provider. Compassion for U would be comprised of a Congregational Wellness Network Director (Director of Pastoral Care in the Memphis Model) and 2 Nurse Liaisons as paid staff. Contact would be made to Pastors and Churches who would enter a covenant relationship with Southeastern Health for the management of chronic diseases through community wellness and coordination of clinic visits and various other local health needs. In this model, Southeastern Regional Medical Center remains available as the appropriate level of care for critical and acute care needs while the community and congregation assume responsibility as their own healthcare and wellness managers. The model puts in proper perspective the practical nature of faith involvement alongside clinical skill contributions to bring about better health and quality of life through shared responsibility


115 Gibson Cancer Center Established in 1995, Gibson Cancer Center is the only outpatient cancer treatment facility in Robeson County. Named in honor of Alice and Monroe Carr Gibson, Gibson Cancer Center is accredited by the American College of Surgeons Commission on Cancer. Gibson Cancer Center provides vital services to the citizens of Robeson and surrounding counties. Affiliations with the Duke Oncology Network and Southeastern Radiation Oncology ensure those citizens get the absolute best care possible

116 Cancer Survivor s Day Hosted by: Gibson Cancer Center June 7, 2013 Holiday Inn Lumberton National Cancer Survivors Day is a celebration that honors the 14 million Americans who have been diagnosed with cancer and are alive today. The Robeson County Board of Commissioners proclaimed June 5, 2009 as Celebration of Cancer Survivors Day. Survivor Day is also a special time for survivors, families, friends and healthcare providers. This special event is celebrated in June with more than 700 communities participating in the United States and Canada. This symbolic event shows the world that life after a cancer diagnosis can be a reality. There are over 4,070 cancer survivors in Robeson County. Educational session that included; Art therapy, Chair Yoga, Look Good..Feel Better and Nutrition During and after treatment were provided to survivors and their caregivers. A licensed cosmetologist was available to cut hair for free to submit hair donations to Locks of Love. Locks of Love provide hair pieces for financially disadvantaged children in the United States. Face painting and a delicious lunch was provided. Happy Feet Line Dancing Group from Southeastern Lifestyle Fitness Center provided special entertainment. Over 175 people attended this event. The Gibson Cancer Center has celebrated National Cancer Survivors Day since June 9,


117 Lilly Oncology on Canvas The Gibson Cancer Center provided the Lilly Oncology on Canvas: Expression of a Cancer Journey to Robeson and surrounding counties. The art work was featured in the Obbie Lee room at the Gibson Cancer Center from June 10, 2013-June 14, The art exhibition honors the physical and emotional journeys people face when confronted by a cancer diagnosis. The free exhibit tours communities nationwide. The showcase displayed 25 pieces of art from the 2012 Lilly Oncology On Canvas competition. Launched in 2004, Oncology On Canvas is a biennial art competition that invites people from the U.S. and Puerto Rico who are diagnosed with any type of cancer, as well as their families, friends, caregivers and healthcare providers are also invited, to express, through art and narrative, the life-affirming changes that give the cancer journey meaning. For more information please visit Lilly Oncology On Canvas is presented by Lilly USA, LLC, a world leader in cancer research and treatment, in partnership with the National Coalition for Cancer Survivorship (NCCS), the oldest survivor-led cancer advocacy organization in the U.S


118 SOUTHEASTERN HEALTH S ATHLETIC TRAINING PROGRAM Southeastern Health provides athletic trainers to the Public Schools of Robeson County s six area high schools. Southeastern Health recognized the importance of providing quality health care to the student-athletes and this was a vital step in improving the health and well being of the students and student-athletes. The athletic trainers oversee the care of over 1,600 athletes for the PSRC. The athletic trainers have specialized training in the following areas: Acute Care of Injury and Illness, Injury Prevention, Assessment and Evaluation, Rehabilitation of Injuries, Nutritional Aspects, and Health Care Administration


119 Sports Physicals The athletic trainers also setup and organize pre-participation physicals for each of the area high schools. They work in conjunction with physician practices to arrange for Southeastern Health providers to perform the physicals to ensure that every athlete is medically cleared to participate in athletics. As a result of this collaboration, over 600 athletes receive physicals that our athletic trainers arrange at each high school. The Vonta Leach Foundation has also worked collaboratively with our athletic trainers to provide sports physicals to area athletes. Through this effort an additional 75 athletes received their preparticipation sports physical at no cost to them. Sports Medicine Camp Southeastern Health s athletic trainers also offer a Sports Medicine Camp. Under the guidance of the Certified Athletic Trainers, campers learned the basics of athletic training and first aid to better serve their high school sports teams. The camp prepares students to become student trainers through lectures, taping techniques and emergency procedures. With the info campers take away from the camp, they have the tools & skills to hit the ground running when the sports season at their school begins. The camp also gives them a wonderful blueprint for a possible career in athletic training or some sports medicine field
 is the first, most-widely used, and most scientifically validated computerized concussion evaluation system.")
120 ImPACT Funding On April 29 th, 2013 the Athletic Training department received funding form Southeastern Health s Foundation to purchase the ImPACT software program. ImPACT (Immediate Post- Concussion Assessment and Cognitive Testing) is the first, most-widely used, and most scientifically validated computerized concussion evaluation system. ImPACT provides useful information to assist qualified practitioners in making sound return to play decisions following concussions. This program has assisted the athletic trainers in the management of concussions and assisting in returning the athletes safely back to participation. ImPACT Test : Measures player symptoms Measures verbal and visual memory, processing speed and reaction time Assists clinicians and athletic trainers in making difficult return-to-play decisions Provides reliable baseline test information Produces a comprehensive report of test results which are presented as PDF files Automatically stores data from repeat testing; Testing is administered online for individuals or groups
121 PrivilegesPlus is a health and wellness program that offers an array of educational and social activities for adults age 50 and older. PrivilegesPlus is a valuable tool for adults to learn new information and skills; benefit from discounts and unique program opportunities; participate in a wide range of special events; and partner with Southeastern for their health care needs. PrivilegesPlus overview By the end of Fiscal Year 2013, PrivilegesPlus had 476 total members and gained 94 new memberships. More than 50 programs were scheduled on a variety of topics and were promoted to PrivilegesPlus members as well as the community. Programs focused on educational sessions, such as healthy aging, heart health, nutrition, fitness, stroke, and cancer; life lesson skills and computer classes; and social events including Bunco, bowling and lunch & learns. This year s annual Hooray for Hollywood dance was held Saturday, September 14 and drew around a hundred participants for an evening of dinner, dancing, music and fun


122 Festival of Trees Southeastern Hospice s 28 th Festival of Trees event raised $32,300 for the non-profit which provides in-home and in-patient end-of-life care as well as for a bereavement camp for youth. The event, with its Traditions of the Season theme, featured 26 exquisitelydecorated Christmas trees and a Unique Boutique gift shop. The annual lighting ceremony for the Tree of Honor atop Southeastern Regional Medical Center kicked of the event in honor or memory of loved ones. The annual holiday benefit supports Southeastern Hospice and Camp Care


123 In the community Southeastern Regional Medical Center s Physician Services operates more than 40 primary care, specialty and urgent care clinics throughout Robeson County and in Bladen, Cumberland and Scotland counties. Highly skilled physicians, physician assistants and family nurse practitioners are available in communities across the region to improve the health of the patients we serve. Let us be your partner in better health


124 Southeastern Radiology Associates is proud to partner with Robeson Health Care Corporation to improve the health status of our community. Over the past fiscal year we have offered over 232 Services to our residents that meet the BCCCP criteria. These grants are renewed with The NC Department of Health and Human Services each year. The North Carolina Breast and Cervical Cancer Control Program (NC BCCCP) provides free or low-cost breast and cervical cancer screenings and follow-up care to eligible women in Robeson and surrounding counties. Women screened through this program and diagnosed with breast and cervical cancer may be eligible for free health coverage through Medicaid which extends throughout the duration of the treatment. In order to be eligible for screening through the BCCCP, you must meet age and income guidelines and insurance requirements. You must be between the ages of 18 and 64 for cervical cancer screening, and 40 and 64 for mammograms, and you must have an income at or below 200% of the federal poverty level. Additionally, you must be uninsured or underinsured and must not have Medicare Part B or Medicaid. Services include: Clinical breast exams Screening mammograms Pap tests Diagnostic procedures, as indicated (diagnostic mammograms, ultrasounds, colposcopies, breast and cervical biopsies) Medical consultations
 Permanent Medicine Drop Boxes")


 26,702 pills Spring 2012 Medicine Drop (March 24, 2012) 29,153 pills")
125 Substance Abuse Coalition Outreach in the Community on Prescription Drug Abuse Keys to life for High schools Working with SBI and other Law Enforcement Agencies Purchased (2) Permanent Medicine Drop Boxes and placed at Sheriff s Dept. Purchased (4) more boxes to be distributed out at other Police Depts. Working with Physicians and Pharmacist to make sure that they are using the North Carolina Control Reporting System Medicine Drop Numbers have increased since the Coalition has been part of the take back event twice a year. Take Back Program To Date 8,984 Pills Spring 2011 Medicine Drop (April 2, 2011) 19,737 pills Fall 2011 Medicine Drop (October 29, 2011) 26,702 pills Spring 2012 Medicine Drop (March 24, 2012) 29,153 pills Fall 2012 Medicine Drop (September 29, 2012) ,952 pills Spring 2013 Medicine Drop (March 23, 2013)


126 Take It To Heart: A Red Dress Luncheon In celebration of women s heart health, Southeastern Health held its annual Red Dress Luncheon on February 9, The event was designed to inform women about heart disease and ways to live healthy lifestyles through guest speaker presentations and many educational booths complete with giveaways. The event also included a Red Dress fashion show featuring former patients of Southeastern Heart Center
Community Health Assessment
 R O B E S O N 2011 Community Health Assessment C O U N T Y Presented By: Robeson County Health Department and Southeastern Regional Medical Center in Partnership with Healthy Robeson Task Force Robeson
Community Health Needs Assessment
 Community Health Needs Assessment Bollinger County, Missouri This assessment will identify the health needs of the residents of Bollinger County, Missouri, and those needs will be prioritized and recommendations
BARNES-JEWISH HOSPITAL 2016 COMMUNITY HEALTH NEEDS ASSESSMENT & IMPLEMENTATION PLAN
 BARNES-JEWISH HOSPITAL 2016 COMMUNITY HEALTH NEEDS ASSESSMENT & IMPLEMENTATION PLAN 1 TABLE OF CONTENTS Executive Summary... 3 Community Description... 4 Geography... 4 Population Trends... 5 Income...
2015 DUPLIN COUNTY SOTCH REPORT
 2015 DUPLIN COUNTY SOTCH REPORT Reported March 2016 State of the County Health Report The State of the County Health Report provides a review of the current county health statistics and compares them to
COMMUNITY HEALTH NEEDS ASSESSMENT HINDS, RANKIN, MADISON COUNTIES STATE OF MISSISSIPPI
 COMMUNITY HEALTH NEEDS ASSESSMENT HINDS, RANKIN, MADISON COUNTIES STATE OF MISSISSIPPI Sample CHNA. This document is intended to be used as a reference only. Some information and data has been altered
Sanford Medical Center Mayville Community Health Needs Assessment Implementation Strategy
 Sanford Medical Center Mayville Community Health Needs Assessment Implementation Strategy 2017-2019 dba Sanford Mayville Medical Center EIN # 45-0228899 Dear Community Members, Sanford Mayville is pleased
Community Health Needs Assessment for Corning Hospital: Schuyler, NY and Steuben, NY:
 Community Health Needs Assessment for Corning Hospital: Schuyler, NY and Steuben, NY: November 2012 Approved February 20, 2013 One Guthrie Square Sayre, PA 18840 www.guthrie.org Page 1 of 18 Table of Contents
MINERAL COUNTY MONTANA. Community Health Assessment
 MINERAL COUNTY MONTANA Community Health Assessment Respondents by Gender 30% Female Male 70% Respondents by Race/Ethnicity 1% 1% 0% 0% 1% White or Caucasian American Indian or Alaska Native Asian Black
North Shore Community Health Priority Assessment
 North Shore Community Health Priority Assessment 2017-2021 1 Letter from the Health Director/Officer In 2017, the North Shore Health Department began the process of creating a North Shore Community Health
Community Health Needs Assessment Supplement
 2016 Community Health Needs Assessment Supplement June 30, 2016 Mission Statement, Core Values, and Guiding Social Teachings We, St. Francis Medical Center and Trinity Health, serve together in the spirit
COMMUNITY HEALTH NEEDS ASSESSMENT. TMC Hospital Hill
 COMMUNITY HEALTH NEEDS ASSESSMENT TMC Hospital Hill TABLE OF CONTENTS 1 2 Letter from CEO 3 Purpose of the Report 4 Mission and Vision of Organization 5 Service Area 7 Process to Determine Priority Needs
Wake Forest Baptist Health Lexington Medical Center. CHNA Implementation Strategy
 Wake Forest Baptist Health Lexington Medical Center CHNA Implementation Strategy Background Wake Forest Baptist Health - Lexington Medical Center (LMC) is committed to understanding, anticipating, assessing,
2012 Community Health Needs Assessment
 2012 Community Health Needs Assessment University Hospitals (UH) long-standing commitment to the community spans more than 145 years. This commitment has grown and evolved through significant thought and
Community Health Needs Assessment and Implementation Plan
 St. Joseph Hospital Community Health Needs Assessment and Implementation Plan Year One Update Approved by the Board of Trustees on September 8, 2014 4295 Hempstead Turnpike Bethpage, NY 11714 516-579-6000
Southwest General Health Center
 Southwest General Health Center Community Health Needs Assessment Executive Summary July 2016 Southwest General Health Center CHNA Executive Summary Introduction Southwest General Health Center, a 358-bed
2015 Community Health Needs Assessment Saint Joseph Hospital Denver, Colorado
 2015 Community Health Needs Assessment Saint Joseph Hospital Denver, Colorado December 11, 2015 [Type text] Page 1 Contributors Denver County Public Health Dr. Bill Burman, Director, and the team from
Community Health Implementation Plan Swedish Health Services First Hill and Cherry Hill Seattle Campus
 Community Health Implementation Plan 2016-2018 Swedish Health Services First Hill and Cherry Hill Seattle Campus Table of contents Community Health Implementation Plan 2016-2018 Executive summary... page
Community Service Plan
 Mercy Medical Center Community Service Plan 2016-2018 Approved by the Board of Trustees on October 4, 2016 1000 North Village Avenue Rockville Centre, NY 11570 (516) 705-2525 http://mercymedicalcenter.chsli.org/
Healthy Gallatin Community Health Improvement Plan Report
 Healthy Gallatin Community Health Improvement Plan Report Year One, Ending December, 2013 Introduction: Gallatin County community partners, led by staff at Gallatin City-County Health Department in collaboration
St. Jude Medical Center St. Jude Heritage Healthcare. FY 09 FY 11 Community Benefit Plan
 St. Jude Medical Center St. Jude Heritage Healthcare FY 09 FY 11 Community Benefit Plan 1 St. Jude Medical Center FY 09 - FY 11 Community Benefit Plan TABLE OF CONTENTS Executive Summary 3 A. Community
Patient Protection and Affordable Care Act Selected Prevention Provisions 11/19
 Patient Protection and Affordable Care Act Selected Prevention Provisions 11/19 Coverage of Preventive Health Services (Sec. 2708) Stipulates that a group health plan and a health insurance issuer offering
Overlake Medical Center. Implementation Strategy
 2015 Overlake Medical Center Implementation Strategy Table of Contents Introduction... 2 Addressing the Health Needs... 4 Access to Care and Preventive Health Care... 5 Cancer... 6 Cardiovascular Disease...
Community Health Needs Assessment 2016
 Community Health Needs Assessment 2016 OSF ST. FRANCIS HOSPITAL & MEDICAL GROUP DELTA COUNTY CHNA 2016 Delta County 2 TABLE OF CONTENTS Executive Summary... 3 Introduction... 5 Methods... 6 Chapter 1.
Sutter Health Novato Community Hospital
 Sutter Health Novato Community Hospital 2016 2018 Implementation Strategy Responding to the 2016 Community Health Needs Assessment 180 Rowland Way, Novato CA 94945 FACILITY LICENSE #110000375 www.sutterhealth.org
Community Health Action Plan 2016 (year)
") Community Health Action Plan 2016 (year) Designed to address Community Health Assessment priorities (Form updated Jan. 2016) Three priorities identified during the 2015 CHA process are required to be addressed.
Community Health Action Plan 2016 (year) Designed to address Community Health Assessment priorities (Form updated Jan. 2016) Three priorities identified during the 2015 CHA process are required to be addressed.
How Wheaton Franciscan is meeting the NEEDS of our community. NSWERING HE CALL
 ANSWERING THE CALL MEETING OUR COMMUNITY NEEDS S July 1, 2013 June 30, 2016 S How Wheaton Franciscan is meeting the NEEDS of our community. NSWERING HE CALL COMMUNITY HEALTH NEEDS IMPLEMENTATION PLAN:
addressing racial and ethnic health care disparities
 addressing racial and ethnic health care disparities where do we go from here? racial and ethnic health care disparities: how much progress have we made? Former U.S. Surgeon General David Satcher, MD,
King County City Health Profile Seattle
 King County City Health Profile Seattle Shoreline Kenmore/LFP Bothell/Woodinville NW Seattle North Seattle Kirkland North Ballard Fremont/Greenlake NE Seattle Kirkland Redmond QA/Magnolia Capitol Hill/E.lake
Model Community Health Needs Assessment and Implementation Strategy Summaries
 The Catholic Health Association of the United States 1 Model Community Health Needs Assessment and Implementation Strategy Summaries These model summaries of a community health needs assessment and an
COMMUNITY HEALTH IMPLEMENTATION STRATEGY. Fiscal Year
 COMMUNITY HEALTH IMPLEMENTATION STRATEGY Fiscal Year 2016-2018 5 Overall Goal for the Implementation Strategy Munson Healthcare Charlevoix Hospital (MHCH) is a 25-bed critical access hospital that primarily
2016 Keck Hospital of USC Implementation Strategy
 2016 Keck Hospital of USC Implementation Strategy INTRODUCTION Keck Hospital of USC is a private, nonprofit 411-bed acute care hospital staffed by the faculty at the Keck School of Medicine of the University
1. What is your ethnic origin? (Check one) 2. What is your gender? 3. What is your age? Page 1. nmlkj. nmlkj. nmlkj. nmlkj. nmlkj. nmlkj. nmlkj.
 2. What is your gender? 3. What is your age? Page 1. nmlkj. nmlkj. nmlkj. nmlkj. nmlkj. nmlkj. nmlkj.") 1. What is your ethnic origin? (Check one) White Asian/Pacfic Island American Indian Black Hispanic 2. What is your gender? Female Male 3. What is your age? 18 to 24 55 to 64 25 to 34 65 to 74 35 to 44
1. What is your ethnic origin? (Check one) White Asian/Pacfic Island American Indian Black Hispanic 2. What is your gender? Female Male 3. What is your age? 18 to 24 55 to 64 25 to 34 65 to 74 35 to 44
Implementation Strategy
 Implementation Strategy Community Health Improvement Plan Community Memorial Hospital Fiscal Year 2016-2018 Plan Approved by Community Outreach Steering Committee on 12/11/2015 Plan last reviewed on 12/8/2017
Minnesota CHW Curriculum
 Minnesota CHW Curriculum The Minnesota Community Health Worker curriculum is based on the core competencies that are identified in Minnesota s CHW "Scope of Practice." The curriculum also incorporates
Implementation Plan for Needs Identified in Community Health Needs Assessment for
 Implementation Plan for Needs Identified in Community Health Needs Assessment for Spectrum Health Kelsey d/b/a Spectrum Health Kelsey Hospital FY 2013-2015 Covered Facilities: Spectrum Health Kelsey d/b/a
Community Health Needs Assessment: St. John Owasso
 Community Health Needs Assessment: St. John Owasso IRC Section 501(r) requires healthcare organizations to assess the health needs of their communities and adopt implementation strategies to address identified
Community Service Plan
 St. Joseph Hospital Community Service Plan 2016-2018 Approved by the Board of Trustees on October 4, 2016 4295 Hempstead Turnpike Bethpage, NY 11714 516-579-6000 www.stjosephhospital.chsli.org Mission
Logan County Community Health Risk and Needs Assessment PLAN OF ACTION MARY RUTAN HOSPITAL
 Logan County Community Health Risk and Needs Assessment PLAN OF ACTION MARY RUTAN HOSPITAL The Board of Directors of Mary Rutan Hospital have reviewed the findings of the Logan County Community Health
Community Health Needs Assessment & Implementation Strategy
 Community Health Needs Assessment & Implementation Strategy Fiscal Years 2014 2016 for Beth Israel Deaconess Hospital - Milton This report was prepared by: 95 Berkeley Street, Suite 208 Boston, MA 02116
Implementation Plan Community Health Needs Assessment ADOPTED BY THE MARKET PARENT BOARD OF TRUSTEES, OCTOBER 2016
 2017 2019 Community Health Needs Assessment Implementation Plan ADOPTED BY THE MARKET PARENT BOARD OF TRUSTEES, OCTOBER 2016 MERCY HEALTH LOURDES HOSPITAL 1530 Lone Oak Rd., Paducah, KY 42003 A Catholic
Providence Hood River Memorial Hospital 2010 Community Assets and Needs Assessment Report
 Providence Hood River Memorial Hospital 2010 Community Assets and Needs Assessment Report Produced by Lauren M. Fein, M.P.H. How the study was conducted Every three years, Providence Hood River Memorial
Implementation Strategy For the 2016 Community Health Needs Assessment North Texas Zone 2
 For the 2016 Community Health Needs Assessment North Texas Zone 2 Baylor Emergency Medical Center at Murphy Baylor Emergency Medical Center at Aubrey Baylor Emergency Medical Center at Colleyville Baylor
Community Health Needs Assessment 2016
 Community Health Needs Assessment 2016 SAINT JAMES HOSPITAL known as OSF SAINT JAMES - JOHN W. ALBRECHT MEDICAL CENTER LIVINGSTON COUNTY CHNA 2016 Livingston County 2 TABLE OF CONTENTS Executive Summary...
Implementation Strategy
 2017-2019 Implementation Strategy 1 Table of Contents Introduction... 3 Community Health Needs Assessment... 3 Significant Health Needs the Hospital will Address... 4 Access to Care... 5 Chronic Diseases...
Excellence: As a team, we pursue exceptional performance with passion. Accountability: We take personal responsibility for delivering results
 2010-2012 Community Service Plan September 14, 2009 1 ACKNOWLEDGEMENTS This report was developed by two joint planning committees which included hospital and local health department representatives in
Sage Medical Center New Patient Forms
 Sage Medical Center New Patient Forms Patient Name: DOB: Providers and Suppliers of Your Medical Care: Please list all providers and suppliers of your medical care such as primary care physicians, specialty
Good Samaritan Medical Center Community Benefits Plan 2014
 Good Samaritan Medical Center Community Benefits Plan 2014 This Addendum to the Community Benefits Plan 2014 is an addendum to the Community Benefits Plan approved by the Community Benefits Council on
Dear Kaniksu Patient,
 Dear Kaniksu Patient, Welcome to Kaniksu Health Services (KHS), a Community Health Center that provides quality and affordable medical, pediatric, dental, behavioral health and veteran care, regardless
Washington County Public Health
 Washington County Public Health Strategic Plan 2012-2016 Message from the Division Manager I am pleased to present the Washington County Public Health Division s strategic plan for fiscal years 2012 to
Community Health Needs Assessment & Implementation Strategy
 2014-2016 Community Health Needs Assessment & Implementation Strategy Holy Family Memorial 2300 Western Avenue Manitowoc, WI 54220 Sister Rochelle Kerkhof, Director - Mission & Pastoral Care Email: rkerkhof@hfmhealth.org
San Francisco is not exempt from the hypertension crisis, nor from the health disparities reflected in the African-American community.
 September 2017 San Francisco Health Network Heart Health Patient Communications and Community Events Project Brief and Request for Proposals I. Background Heart disease is the leading cause of death in
Union County Governance Public Health Partnership
 Union County Governance Public Health Partnership Community Health Improvement Plan 2013 Revisions CHIP PRIORITIES Contents Table of contents Table of contents.1 The Union County Governmental Public Health
Hi, my name is. I am working with the Community Committee for Health
 Public Housing Community Readiness Assessment: Interview Guide Date: Development: Interviewee Name: Introduction Hi, my name is. I am working with the Community Committee for Health Promotion at the Prevention
Hamilton Medical Center. Implementation Strategy
 2016 Hamilton Medical Center Implementation Strategy 0 2016 Hamilton Medical Center Hamilton Medical Center For FY2017-2019 Summary Hamilton Medical Center is regional, acute-care hospital with 282 beds.
Community Analysis Summary Report for Clinical Care
 Community Analysis Summary Report for Clinical Care BACKGROUND ABOUT THE HEALTHY COMMUNITY STUDY The Rockford Health Council (RHC) exists to build and improve community health in the region. To address
Community Health Needs Assessment Implementation Strategy Adopted by St. Vincent Charity Medical Center Board of Directors on April 5, 2017
 St. Vincent Charity Medical Center Community Health Needs Assessment Implementation Strategy Adopted by St. Vincent Charity Medical Center Board of Directors on April 5, 2017 Introduction In 2016, St.
Enhancing Diversity in the Wisconsin Nursing Workforce
 Enhancing Diversity in the Wisconsin Nursing Workforce A presentation to promote nursing diversity by the Wisconsin Center for Nursing, Inc., as a product of State Implementation Program (SiP) grant #70696,
Mary Free Bed Rehabilitation Hospital: COMMUNITY HEALTH NEEDS ASSESSMENT
 Mary Free Bed Rehabilitation Hospital: COMMUNITY HEALTH NEEDS ASSESSMENT 2016-2018 Acknowledgements PAGE 1 Executive Summary Mary Free Bed Rehabilitation Hospital is a non-for-profit, nationally-accredited,
Community Health Needs Assessment July 2015
 Community Health Needs Assessment July 2015 1 Executive Summary UNM Hospitals is committed to meeting the healthcare needs of our community. As a part of this commitment, UNM Hospitals has attended forums
Public Health Accreditation Board STANDARDS. Measures VERSION 1.0 APPLICATION PERIOD 2011-JULY 2014 APPROVED MAY 2011
 Public Health Accreditation Board STANDARDS & Measures VERSION 1.0 APPLICATION PERIOD 2011-JULY 2014 APPROVED MAY 2011 Introduction The Public Health Accreditation Board (PHAB) Standards and Measures document
Implementation Strategy Report for Community Health Needs
 2013 Implementation Strategy Report for Community Health Needs Kaiser Foundation Hospital WALNUT CREEK License #140000290 Kaiser Foundation Hospitals Community Health Needs Assessment (CHNA) Implementation
Norton Hospital Norton Audubon Hospital Norton Women s and Children s Hospital Norton Brownsboro Hospital Norton Children s Hospital
 Norton Hospital Norton Audubon Hospital Norton Women s and Children s Hospital Norton Brownsboro Hospital Norton Children s Hospital Community Health Needs Assessment 2016 Community Health Needs Assessment
Public Health Nursing Assessment Tool
 Public Health Nursing Assessment Tool Designed by Sandra B. Lewenson and Marie Truglio-Londrigan Appendix 67 68 Chapter 3 Appendix: Public Health Nursing Assessment Tool Suggestions for Table Use: 1. Read
Navigating Standard 3.1
 Navigating Standard 3.1 Annette Mercurio, MPH, MCHES City of Hope Duarte, CA Close Up is One Way to View It It s Helpful to Enlarge Perspective Standard 3.1 Patient Navigation Process A patient navigation
Community Health Needs Assessment IMPLEMENTATION STRATEGY. and
 2015-2018 Community Health Needs Assessment IMPLEMENTATION STRATEGY and Collaborative Health Improvement Plan Palisades Medical Center Implementation Strategy - 1- Introduction: Palisades Medical Center
Community Health Needs Assessment Implementation Strategy Tallahassee Memorial HealthCare 1300 Miccosukee Road FY 2016
 Community Health Needs Assessment Implementation Strategy Tallahassee Memorial HealthCare 1300 Miccosukee Road FY 2016 I. General Information Contact Person : Warren Jones Date of Written Report: September
Outline 11/17/2014. Overview of the Issue Program Overview Program Components Program Implementation
 Physical Health Integration in a Behavioral Health Setting Robin Reed, MD, MPH Rupal Yu, MD, MPH Acknowledgements The Duke Endowment Piedmont Health Services Carolina Advanced Health Community Care of
Aetna Foundation Announces 2006 Regional Grants
 Aetna Foundation Announces 2006 Regional Grants Aetna and the Aetna Foundation have awarded 83 grants totaling $2.9 million to community organizations across the country through its 2006 Regional Community
CALIFORNIA HEALTHCARE FOUNDATION. Medi-Cal Versus Employer- Based Coverage: Comparing Access to Care JULY 2015 (REVISED JANUARY 2016)
") CALIFORNIA HEALTHCARE FOUNDATION Medi-Cal Versus Employer- Based Coverage: Comparing Access to Care JULY 2015 (REVISED JANUARY 2016) Contents About the Authors Tara Becker, PhD, is a statistician at the
CALIFORNIA HEALTHCARE FOUNDATION Medi-Cal Versus Employer- Based Coverage: Comparing Access to Care JULY 2015 (REVISED JANUARY 2016) Contents About the Authors Tara Becker, PhD, is a statistician at the
Community Health Plan. (Implementation Strategies)
") -2019 Community Health Plan (Implementation Strategies) May 15, Community Health Needs Assessment Process Florida Hospital at Connerton Long Term Acute Care Facility (LTAC or the Hospital) is a long-term
-2019 Community Health Plan (Implementation Strategies) May 15, Community Health Needs Assessment Process Florida Hospital at Connerton Long Term Acute Care Facility (LTAC or the Hospital) is a long-term
Application for Training and Technical Assistance to Implement the Lethality Assessment Program Maryland Model (LAP) INSTRUCTIONS. Project Description
 INSTRUCTIONS. Project Description") INSTRUCTIONS Project Description Application for Training and Technical Assistance to Implement the Lethality Assessment Program Maryland Model (LAP) Page 1 of 23 INSTRUCTIONS This project was supported
INSTRUCTIONS Project Description Application for Training and Technical Assistance to Implement the Lethality Assessment Program Maryland Model (LAP) Page 1 of 23 INSTRUCTIONS This project was supported
Implementation Strategy
 2017-2019 Implementation Strategy Table of Contents Introduction... 2 2016 Community Health Needs Assessment Summary... 2 Definition of the Community Service Area... 3 Significant Health Needs the Hospital
Devereux Advanced Behavioral Health Devereux Pennsylvania Children s Behavioral Health Center: Community Health Needs Assessment
 1 Devereux Advanced Behavioral Health Devereux Pennsylvania Children s Behavioral Health Center: Community Health Needs Assessment and Implementation Strategy 2014-2016 Table of Contents Executive Summary
Summit Healthcare Regional Medical Center Implementation Strategy Community Health Needs Assessment Updated February 2016
 Summit Healthcare Regional Medical Center 2013-2016 Implementation Strategy Community Health Needs Assessment Updated February 2016 Overview Summit Healthcare Regional Medical Center conducted its first
PHYSICAL ACTIVITY IN ADULTS A LOOK INTO THE LONG ISLAND REGION
 PHYSICAL ACTIVITY IN ADULTS A LOOK INTO THE LONG ISLAND REGION First in a series of quarterly data reports examining trends and patterns of selected health topics Published by the Long Island Health Collaborative
Nevada County Health and Human Services FY14 Rural Health Care Services Outreach Grant Project Evaluation Report June 30, 2015
 Nevada County Health and Human Services FY14 Rural Health Care Services Outreach Grant Project Evaluation Report June 30, 2015 I. Executive Summary The vision of Nevada County Behavioral Health (NCBH)
Racial and Ethnic Health Disparities in Health and Health Care St. Louis Regional Data
 Racial and Ethnic Health Disparities in Health and Health Care St. Louis Regional Data By Debbie Chase, MPA Consultant, Center for Health Policy University of Missouri -- Columbia 1 Quantitative Data Overview
Community Health Needs Assessment Revised November 2013
 Community Health Needs Assessment Revised November 2013 INTRODUCTION The purpose of this Community Health Needs Assessment is to study the needs of the Wilmington area in healthcare, and to develop a plan
Throughout the 20th century, Americans experienced. Health-Related Services Provided by Public Health Educators
 Health-Related Services Provided by Public Health Educators Hans H. Johnson, EdD 1 Craig M. Becker, PhD 1 This study identifies the health-related services provided by public health educators. The investigators,
MEDICARE ENROLLMENT, HEALTH STATUS, SERVICE USE AND PAYMENT DATA FOR AMERICAN INDIANS & ALASKA NATIVES
 American Indian & Alaska Native Data Project of the Centers for Medicare and Medicaid Services Tribal Technical Advisory Group MEDICARE ENROLLMENT, HEALTH STATUS, SERVICE USE AND PAYMENT DATA FOR AMERICAN
St. Lawrence County Community Health Improvement Plan
 St. Lawrence County Community Health Improvement Plan November 1, 2013 Contents Executive Summary... 3 What are the health priorities facing St. Lawrence County?... 3 Prevent Chronic Disease... 3 Promote
Central Iowa Healthcare. Community Health Needs Assessment
 Central Iowa Healthcare Community Health Needs Assessment October 20, 2016 Table of Contents Executive Summary 1 Introduction 3 Summary Observations from Current CHNA 5 Information Sources and Data Collection
Draft. Public Health Strategic Plan. Douglas County, Oregon
 Public Health Strategic Plan Douglas County, Oregon Douglas County 2014 Letter from the Director Dear Colleagues It is with great enthusiasm that I present the Public Health Strategic Plan for 2014-2015.
Community Health Needs Assessment FY
 Community Health Needs Assessment FY 2016-2018 Community Health Needs Assessment FY 2016-2018 1 MERCY MEDICAL CENTER-CLINTON COMMUNITY HEALTH NEEDS ASSESSMENT FY 2016-2018 I. Introduction The Community
FY2019 President s Budget Proposal NACCHO Priority Public Health Program Funding - February 2018
 FY2019 President s Budget Proposal NACCHO Priority Public Health Program Funding - February 2018 The President has released his FY2019 budget proposal, An American Budget. Below is NACCHO s analysis of
Primary care patient experience survey April 2016
 Primary care patient experience survey April 2016 Survey overview 1. This version of the survey does not show the logic that skips people to appropriate questions based on their answers. Not all people
A Comparison of Closed Rural Hospitals and Perceived Impact
 A Comparison of Closed Rural Hospitals and Perceived Impact Sharita R. Thomas, MPP; Brystana G. Kaufman, BA; Randy K. Randolph, MRP; Kristie Thompson, MA; Julie R. Perry; George H. Pink, PhD BACKGROUND
Grande Ronde Hospital, Inc. Community Needs Health Assessment Implementation Strategy Fiscal Years
 Grande Ronde Hospital, Inc. Community Needs Health Assessment Implementation Strategy Fiscal Years 2016-2018 In 2015, Grande Ronde Hospital (GRH) completed a wide-ranging, regionally inclusive Community
Intermountain Fillmore Community Hospital Community Health Needs Assessment 2016
 Intermountain Fillmore Community Hospital Community Health Needs Assessment 2016 Fillmore Community Hospital 674 South Highway 99 Fillmore, Utah 84631 Intermountain Fillmore Community Hospital 2016 Community
Bon Secours Richmond St. Mary s Hospital
 Bon Secours Richmond St. Mary s Hospital Table of Contents Executive Summary 3 Description and Vision 5 Section I: Service Area and Description of Community Served 6 Section II: Process and Methods Used
MONROE COUNTY HEALTH PROFILE. Finger Lakes Health Systems Agency, 2017
 MONROE COUNTY HEALTH PROFILE Finger Lakes Health Systems Agency, 2017 About the Report The purpose of this report is to provide a summary of health data specific to Monroe County. Where possible, benchmarks
Chicago Department of Public Health
 Annual Report 2010 Message from the Mayor Throughout Chicago s history, public health challenges have been faced and met- starting in 1835, when leaders of the Town of Chicago formed a Board of Health
Virginia registered voters age 50+ support dedicating a larger proportion of Medicaid funding to home and community-based care.
 2013 AARP Survey of Virginia Registered Voters Age 50+ on Long-Term Care Virginia registered voters age 50+ support dedicating a larger proportion of Medicaid funding to home and community-based care.
Hendry County & Glades County, Florida. Hendry and Glades Rural Health Planning Council Strategic Plan
 The Health Planning Council of Southwest Florida Hendry and Glades Rural Health Planning Council Strategic Plan 2016-2019 Hendry County & Glades County, Florida Table of Contents Introduction......3 Methodology...
SURVEY Being Patient. Accessibility, Primary Health and Emergency Rooms
 SURVEY 2017 Being Patient Accessibility, Primary Health and Emergency Rooms Being Patient: Accessibility, Primary Health and Emergency Rooms New Brunswick Health Council Who we are New Brunswickers have
March of Dimes Washington State Community Grants Program. Community Award Application
 March of Dimes Washington State Community Grants Program March of Dimes Washington Kasey Rivas, MPH Maternal & Child Health Director 1904 Third Ave, Suite 230 Seattle, WA 98101 206-452-6631 krivas@marchofdimes.org
Haywood Regional Medical Center. Implementation Strategy. To Address Significant Community Health Needs. myhaywoodregional.com.
 2016 Haywood Regional Medical Center Implementation Strategy To Address Significant Community Health Needs Paper copies of this document may be obtained at Haywood Regional Medical Center, 262 Leroy George
Scott & White Hospital - Taylor 2013 Implementation Strategy. Addressing Community Health Needs
 Addressing Community Health Needs Scott & White Hospital-Taylor 2013 Community Health Needs Assessment Implementation Strategy Adopted by the Scott & White Hospital - Taylor Board of Directors on July
Addressing Low Health Literacy to Achieve Racial and Ethnic Health Equity
 Hedge Health Funds 2/28/04 October 2009 Addressing Low Health to Achieve Racial and Ethnic Health Equity Anne Beal, MD, MPH President Aetna Foundation, Inc. Minorities Are More Likely to Have Diabetes
Community Needs Assessment. Swedish/Ballard September 2013
 Community Needs Assessment Swedish/Ballard September 2013 Why Do This? Health Care Reform Act requirement Support our mission to give back to community while targeting its specific health needs Strategically