A project of the Office of Nursing Workforce Research, Planning, and Development University of Vermont College of Nursing and Health Sciences Funded
|
|
|
- Ralf Grant
- 6 years ago
- Views:
Transcription
1


2 A project of the Office of Nursing Workforce Research, Planning, and Development University of Vermont College of Nursing and Health Sciences Funded by the Vermont Department of Health
3 Health Workforce Assessment Pilot Study Report Prepared by: Office of Nursing Workforce Research, Planning and Development University of Vermont College of Nursing and Health Sciences June 2003 Table of Contents I. Executive Summary 2 II. Introduction 3 III. Methodology... 6 IV. Results: A picture of the nursing workforce across settings V. Nursing workforce needs..13 VI. Other healthcare workforce needs.. 18 VII. Recommendations for Vermont Health Workforce Assessment...22 VIII. Conclusion...25 IX. Appendices.29 a. Cover letter example b. Survey instruments 31 c. One page summaries.59 d. Poster on methods...back cover Funded by: Vermont Department of Health State Office of Rural Health Award CSHO July June
4 I. Executive Summary Background In June 2002, the Office of Nursing Workforce Research, Planning and Development received funding from the Vermont Department of Health to develop a new system for assessing the status of Vermont s healthcare workforce. The proposal for this project noted the lack of consistency in the process of data-gathering in previous surveys, and questioned if the number of vacancies in currently budgeted positions accurately reflects the need for healthcare workers. With the continued scarcity of healthcare workers and the necessitate to use recruitment dollars wisely, more exact and reliable data are clearly needed. The purpose of this project was to develop an accurate system to assess the need for nurses and other health care professionals in Vermont. Methods The Office of Nursing Workforce Research, Planning and Development created the Health Workforce Assessment Team (HWAT) with members from the University of Vermont College of Nursing and Health Sciences, the School of Business Administration, Department of Community Development and Applied Economics, Department of Bioinformatics, the College of Medicine Area Health Education Center, and Fletcher Allen Health Care. This team was charged to redesign a system to assess Vermont s healthcare workforce, including new ways to measure the state s need for various healthcare positions. The team obtained surveys from a number of states including Illinois, Maine, Maryland, New Jersey, North Carolina, and Washington. Surveys were reviewed to compare various approaches used to gather health workforce data including survey methodology. A new survey instrument was then developed, and a pilot test of the surveys was conducted in all hospitals, long term care facilities, home health agencies, and outpatient provider offices in February, The survey included questions that made computing vacancy and turnover rates possible. Questions about how workplaces use full-time vs. part-time staff, per diem workers, and agency / traveling staff, and how difficult it is for workplaces to fill various positions were also included. In addition, information was gathered about the need for nurses and healthcare workers with specialized skills, the perceived impact of salaries on hiring and retaining nurses, and the perceived impact of any workforce shortages. 2
5 II. Introduction Results Seven survey instruments were developed for assessing the need for nurses and other health care professionals in 4 different settings: hospitals, home health agencies, long term care facilities, and outpatient provider offices. Surveys were mailed to one contact person (chief nursing officer, executive director, director of nursing, or office manager) who was asked to oversee the completion of the survey in their setting. The response rate varied by setting: hospitals (94%), home health agencies (92%), long term care facilities (59%) and outpatient provider offices (56%). Due to respondent confusion about the meaning of the term budgeted FTE s, some data from the long term care setting were invalid and not useable. Registered nurse vacancy rates ranged from 6% in the office setting to 19% in long term care facilities, with hospitals and home health agencies reporting a 12% RN vacancy rate. The vacancy rates of the following health care professionals are more severe: speech therapists (50% in home health agencies and 25% in long term care facilities), pharmacy technicians (35% in hospitals), pharmacists (23% in hospitals), and respiratory therapists (18%). Turnover of RN s was highest in long term care settings (35%) followed by home health agencies (24%), hospitals (13%), and outpatient office settings (8%). The highest turnover was seen in personal care attendants (270%) in the home health setting. Valuable information on recruitment, adequacy of budgeted positions, systems used to determine nurse staffing patterns, and impact of workforce shortages was also obtained and will be summarized in this report. Based on this pilot study, recommendations have been made to further improve the survey. Given adequate resources for mailing, follow up, and analysis, a dependable system for an ongoing assessment of Vermont s health workforce is possible. The nursing shortage nationwide and in Vermont Much has been published about the nursing shortage nationwide. The American Association of Colleges of Nursing (AACN, 2002) reports that the number of U.S. educated nursing school graduates who sat for the national licensure examination for entrylevel nurses decreased 28.7% from 1995 to 2001, and that the number of nurses needed 3
6 nationwide will increase 21% from 1998 to The AACN (2002) also reports that the annual nurse vacancy rate in U.S. hospitals is 13%, and that one in seven hospitals has an RN vacancy rate over 20%. There is evidence that nursing staffing levels affect patient outcomes. For example, Kovner & Gergen (1998) found that nurse staffing levels were inversely associated with thrombosis, urinary tract infections, pneumonia, and pulmonary compromise following surgery. In medical patients, a higher proportion of care provided by RNs was associated with shorter lengths of stay, and lower rates of UTI s, upper GI bleeding, pneumonia, shock or cardiac arrest and failure to rescue (Needleman, Buerhaus, Mattke, Stewart, & Zelevinsky, 2002). Aiken et al (2002) also made an association between low nurse to patient and high 30 day mortality, and failure to rescue rates. This same study also showed an increased nurse burnout and job dissatisfaction with each additional patient per nurse. In Vermont, the Blue Ribbon Nursing Commission was appointed by the Vermont Secretary of Human Services and charged to develop recommendations to ensure an adequate nursing workforce to meet the state s health care needs. In its final report (Welz & Kaeding, 2001), the Commission concluded that factors contributing to Vermont s nursing shortage included a decreased supply and an increased demand for nurses. According to this report, the supply of nurses has decreased because of smaller numbers of students enrolling in nurse education programs, stagnant wages, and an aging workforce. Increased demand for nurses, the Commission concluded, is driven by increased utilization of nurses in hospitals, home health agencies, and nursing homes; more critically ill patients in hospitals; and an aging population. The report also cited other reasons for the nursing shortage, including an increased need for on-the-job training to learn new technologies, and a chronic high-stress and hazardous work environment. Among a number of recommendations, the Commission recommended the creation of a Center for Nursing to study shortages of RNs, LPNs, and LNAs and propose long-term strategies to prevent future shortages. Health workforce surveys in Vermont State-level health manpower databases provide more reliable information than national databases about supply, distribution, and use of health personnel (Bamberg, 1994). For the past 13 years (1988 to 2001), the Vermont Association of Hospitals and Health Systems (VAHHS) conducted vacancy surveys of all hospitals, nursing homes, and home health agencies in Vermont, and a selected number of physicians offices (VAHHS, 4
7 February, 2001). A survey was sent to each facility on an annual or semi-annual basis, with questions about the number of full-time equivalent (FTE) positions on staff and the number of FTE vacancies for various occupations in these facilities. The surveys were mailed to hospital human resource executives, to nursing home administrators via the Vermont Health Care Association, and to the Vermont Assembly of Home Health Agencies. In 2001 (and in previous years), a report was generated to summarize the results of the survey. At least two other organizations in Vermont also conduct health workforce surveys. The Northeastern Vermont Area Health Education Center (AHEC) in St. Johnsbury conducts an annual survey of primary care practices in Orange, Lamoille, Caledonia, Orleans, Essex, and Washington Counties (AHEC, 2001). The reported FTEs for family practice, internal medicine, pediatrics, and OB/GYN specialties are compared to the Vermont Department of Health s recommended FTEs. FTEs for physicians were computed by multiplying reported office hours by an adjustment factor between 1.4 and 1.9 depending on type of specialty, based on a formula provided by the federal Department of Health and Human Services. The report also includes information about the number of physicians who have closed their practices to new patients (as a measure of access to services), and includes FTEs for physician assistants, nurse practitioners, and certified nurse midwives. The Board of Medical Practice and the Vermont Department of Health survey Vermont physicians every two years as part of license renewal. The Vermont Department of Health published the results of the 1996,1998, and 2000 surveys (1996 Physician Survey: Vermont Health Care Provider Profiles, June 1998). The report includes information on the number of physicians (per 100,000 population) by y and health care area, and describes physicians by age, gender, and number of patient hours per week. Advanced practice nurses, physician assistants, and dentists are also surveyed by the Department of Health to determine distribution, specialty, activities, and setting. Health workforce surveys in other states To compare Vermont s survey to approaches used elsewhere, surveys were obtained from the following states: Illinois, Maine, Maryland, New Jersey, North Carolina, and Washington. Two nationwide surveys were also obtained and reviewed from the American Hospital Association and the American Health Care Association. 5
8 III. Methodology The surveys used in other states were sent by mail, , or fax, and had response rates ranging from under 20% to over 80%. Generally, the surveys were sent to CEOs or HR directors. Many of these surveys gathered information about various health care positions, while others asked only about a limited number of positions such as RNs, LPNs, and nursing assistants. The most common measures included on the surveys were budgeted and filled (or vacant) FTEs. Less commonly, information was gathered about the number of terminations and separations, length of time to fill vacant positions, difficulty of recruitment, hours of agency pool use, and average years of tenure. The most commonly reported information from these surveys was vacancy rates and turnover rates. Need for improvement in health workforce data in Vermont In June 2002, the Office of Nursing Workforce Research, Planning, and Development proposed to develop a new system for assessing the status of Vermont s healthcare workforce. This proposal noted the lack of consistency in the process of datagathering in the VAHHS surveys, and noted that the number of vacancies in currently budgeted positions does not necessarily reflect the need for healthcare workers. To this end, the Office of Nursing Workforce Research, Planning, and Development created the Health Workforce Assessment Team (HWAT), with members from the University of Vermont College of Nursing and Health Sciences, the School of Business Administration, Department of Community and Economic Development, the College of Medicine Area Health Education Center and Department of Medical Biostatistics, and Fletcher Allen Health Care. This team was charged to develop a new system to assess Vermont s healthcare workforce, including new ways to measure the state s need for various healthcare positions. Survey Development and Data Collection The survey instruments were developed by the team, with input from nurse leaders and human resource directors across the state. Over a period of six months, the surveys went through ten drafts and were reviewed by five experts in the field. Linda Lacey, Associate Director for Research at the North Carolina Center for Nursing, reviewed the 6
9 Vermont Health Workforce Assessment survey before it was finalized. Edward Salsberg, Director of the Center for Health Workforce Studies at SUNY, Albany also was consulted during the development of the survey. Seven separate surveys were mailed depending on the type of provider organization. Data were collected in February and March of The details are as follows: 1. Two different surveys, Hospital Nursing Positions and Hospital Health Employee Positions, were mailed to the population of sixteen Vermont hospitals. Fifteen (15) returned the nursing position survey and 13 returned the health employee position survey (response rate = 94%). 2. Two different surveys, Home Health Nursing Positions, and Home Health Employee Positions, were mailed to 12 home health agencies in Vermont. Eleven (11) agencies returned both surveys (response rate = 92%). 3. Two different surveys, Long Term Care Nursing Positions, and Long Care Term Health Employees Positions, were mailed to 44 long term care facilities. Twenty-six (26) returned the nursing positions survey and 24 returned the health employees positions survey (response rate = 59%) 4. One survey, Outpatient Provider Office Nursing and Health Employee Positions, was mailed to 252 operating outpatient provider offices. Onehundred forty one (141) were returned completed (response rate = 56%). Standard mail survey data collection procedures were followed. A detailed cover letter accompanied the survey. Contacts in the various settings were as follows:! For hospital facilities, the chief nursing officer! For home health agencies, the executive director! For long term care facilities, the director of nursing! For outpatient facilities, the office manager. All contacts were asked to participate in data collection, with assistance from human resources and other departments as needed. A return postage-paid envelope was included. A post card reminder was sent two weeks later, along with a letter to the chief executive officer (in hospitals) and administrators (in long term care facilities). A telephone call was made to non-respondents after three weeks. Finally, a replacement questionnaire was mailed to all non-respondents after 5 to 6 weeks. Response rates were high for hospitals (94%) and home health agencies (92%) and moderate for long term care facilities (59%) and outpatient provider offices (56%). The surveys were designed to collect detailed information that enabled the calculation of vacancy rates for specific positions, turnover rates for specific positions, workers leaving an institution between the period of 2/15/02 2/15/03, and length of 7
10 time to fill a position. In addition, more subjective information, including the impact of position shortages, factors that influence hiring and retention, and perceptions of positions most needed, was collected. Variable measurement The number of budgeted FTE s and actual FTE s on staff were reported for each position. 1.Vacancy rates for each position in each setting were calculated as follows: 1 (Total actual FTEs from all responding institutions divided by Total budgeted FTEs from all responding institutions) X 100%. An FTE (Full-Time Equivalent) can represent one full-time worker or a combination of part-time workers whose hours add to the equivalent of a full-time worker. Traveling staff were not included in FTEs reported. This report presents position vacancy rates, which are a statewide aggregate of the number of positions vacant in all employing agencies of one type. A more standard method to calculate vacancy rates is to divide the number of FTE positions currently vacant and for which an institution is recruiting by the sum of the FTEs vacant and the FTEs currently on staff (Interagency Conference on Nursing Statistics 1997). The choice was made to gather information about budgeted and currently FTEs. It was hypothesized that actual FTEs might exceed budgeted FTEs in some institutions, since the budgeted FTEs may not always indicate need for positions. In a review of surveys used by other states, some used a similar calculation method, while others used the more standard approach. 2. Turnover rates were calculated as follows: (Total workers leaving institution between 2/15/02 2/15/03 divided by Total part-time + full-time workers as of 2/15/03) X 100% A more precise estimate of the turnover rate results when the denominator is an average of the total number of workers during the time period for which separations are reported rather than a total for one point in time, as above. This approach, however, would have required respondents to provide data about the number of workers at the beginning and end of the year. It was decided not to burden respondents for the additional precision due to concerns about impacting response rates. The above method is only problematic if there is a large change in the number of workers on staff from the first to last day of the 8
11 year. Furthermore, if this survey is given in successive years, data from this year can be used with next year s data to obtain an average total number of workers over the year. 3. Workers leaving the institution was indicated specifically by the respondent. 4. Length of time to fill a position was indicated specifically by the respondent. 5. Difficulty of recruitment was indicated by the respondent. 6. The impact of position shortages was measured using a five point scale: never, several times a year, monthly, weekly, and daily. Information about the impact of shortages included: a. Reduced number of beds; b. Delayed or diverted services; c. Mandatory staff overtime; d. Decreased patient satisfaction; e. Increased patient complaints; f. Decreased staff satisfaction; g. Curtailed plans for facility expansion; and h. Discontinued clinical programs. 7. Factors that influence hiring included impact of starting salaries, differential pay scales for educational preparation, and differential pay scales for credentialed RNs. 8. The need for each position was rated subjectively by respondents as greater than, equal to or less than budgeted FTE s. 9. Perceptions of specialized skills needed was an open ended question in which the respondent could specifically identify the most needed, but currently unavailable specialized skills needed at their facility. A question about the number of minutes required to complete the survey was included to evaluate the time burden on respondents. Hospitals required the most time to complete the survey, with a mean of just over two hours (122 minutes) on the nursing survey and 74 minutes on the health employee survey. Home health agencies spent an average of 48 minutes on the nursing survey and 38 minutes on the health employee survey. Long term care facilities spent 36 and 19 minutes on the nursing and health employee surveys, respectively. Outpatient provider office manager s spent only a mean of 10 minutes on the survey that included both nurses and other employees. 9
12 IV. Results: A picture of the nursing workforce across settings Hospitals Statewide, staff Registered Nurse (RN) Full-Time Equivalents (FTEs) are in 15 Vermont hospitals.* These FTEs are filled by nearly 2,000 nurses, split almost evenly between full-time and part-time workers (910 and 1024 respectively). In addition, the 15 hospitals 645 per diem RNs and 119 traveling nurses. In the same 15 hospitals, Licensed Practical Nurse (LPN) FTEs, Licensed Nurse Assistant (LNA) FTEs, and nurse manager FTEs were statewide. (*Number of workers available from 15 of 16 hospitals surveyed; FTE data available for 14 of 16.) Home health agencies Home health agencies staff RN FTEs, with almost equal numbers working full-time and part-time (135 and 127).** The home health setting relatively more per diem RNs than hospitals, with 178 of all RNs working in the home health setting, 40% were per diem, compared to 25% in the hospital setting. LNAs were the most common nursing position in the home health setting, with LNA FTEs (180 full-time, 118 part-time, and 71 per diem). Fewer than 20 LPN FTEs were in home health agencies, and there were no traveling nurses in Vermont home health agencies. (** Number of workers available for 11 of 12 agencies surveyed; FTE data available for 10 of 12.) Long term care facilities and outpatient provider offices Data from long term care facilities and from outpatient provider offices were not adequate to estimate the total number of FTEs in the main nursing positions. Although response rates were approximately 60% for long term care facilities and outpatient provider offices, due to missing data and incorrect reporting of FTE positions nearly half of the data for some positions was invalid. However, it appeared that in the long term care setting, LNA FTE s outnumbered LPN FTE s by approximately 3 to 1, and outnumbered RN FTE s by approximately 7 to 1. Vacancy Rates by Setting For this report, the vacancy rate was defined as 100% % FTEs filled for each position statewide, aggregated over all workplaces of a certain type. For example, in 2003, Vermont hospitals reported that of staff RN positions budgeted, (88%) were filled. The statewide staff RN vacancy rate was thus 100% 88%, or 12%. This 10
13 vacancy rate for staff RNs, as of February 2003, is quite similar to the national vacancy rate for RNs of 13% reported in 2002 by the American Association of Colleges of Nursing (2002). The statewide vacancy rates, plus the range of vacancy rates specific to individual workplaces, are presented below: 11
14 Hospitals! Staff RNs 12% (0 24%)! LPNs 8% (0 50%)! LNAs 1% (0 34%) The mean vacancy rate for staff RNs at hospitals with more than 100 licensed beds was 11.5%, compared to 8.8% for hospitals with fewer than 100 beds. However, there was a great deal of variability in vacancy rates among smaller hospitals, with the highest reported vacancy rate of 24% reported in a small hospital. Home health agencies! Staff RNs 12% (0 40%)! LPNs 24% (0 56%)! LNAs 8% (0 31%) Long term care facilities Estimated statewide vacancy rates for long term care facilities were slightly higher than those in hospitals, at 19% (0 100%) for staff RNs, 9% (0 60%) for LPNs, and 0% (0 22%) for LNAs. These estimates should be interpreted with caution, however, because they are based on data from the small number of institutions that responded and provided valid data (data were available from 12 to 26 facilities, depending on type of position). Outpatient Provider Offices Vacancy rates for staff RNs and LPNs working in outpatient provider offices were 6% and 3% respectively. These estimates should also be viewed with caution because of the relatively low participation rate and the high proportion of missing information on the number of budgeted positions. Turnover rates by setting Statewide turnover rates were defined as the total number of workers leaving their jobs in the past year divided by the total number of workers currently on staff. It should be noted that for positions with relatively few employees statewide, the turnover rate can be strongly influenced by the departure of even a few individuals. Hospitals! Staff RNs 13% (range 0 26%)! LPNs 16% (0 40%)! LNAs 29% (0 55%) 12
15 Staff RN turnover rates were slightly higher at hospitals with more than 100 beds, at an average of 16% vs. 13% at smaller hospitals. Home health agencies! Staff RNs 24% (0 73%)! LPNs 38% (0 100%)! LNAs 32% (13 64%) Long term care facilities Turnover rates in long term facilities were estimated at 35% (0 80%) for staff RNs, 30% (0 115%) for LPNs, and 56% (0 128%) for LNAs. The interpretation of a turnover rate above 100% is that the number of workers leaving the facility in the past year is greater than the total number, indicating a very unstable workforce. Outpatient provider offices Turnover rates were low in this setting, at 8% for RNs and 10% for LPNs. Although these estimates should be viewed with caution given the large amount of missing data, it appears that nurses in outpatient provider offices are a more stable workforce than in other settings. Cost of high vacancy and turnover Institutions with high RN turnover tended to have high RN vacancy rates. For hospital RN positions, the correlation between the turnover and vacancy rates was significant (Spearman r = 0.55, p = 0.04). Given the high costs of recruitment and training, efforts should be made to decrease both vacancy rates and turnover. Advanced practice nurses Nurse practitioners, clinical nurse specialists, certified nurse midwives, and nurse anesthetists currently require master s degrees for entry into practice and are licensed as advanced practice nurses in Vermont. In some cases, nurse managers are also required to be master s degree prepared. Since Vermont has only one graduate program in nursing, information about the demand for master s prepared nurses in clinical practice is important. In many cases, the numbers of advanced practice nurses in individual settings are low; therefore, vacancy and turnover data should be carefully examined. For example, only seven hospitals reported using nurse practitioners and two hospitals reported vacant NP positions. The vacancy rates for NP s at the 2 hospitals were 12% and 31% for a 13
16 statewide average vacancy rate of 21% which is largely due the high vacancy at one hospital. The hospital NP turnover rate was 12%. Nurse practitioners who are working in the office setting have a vacancy rate of 6%, a turnover rate of 7% and 5 weeks to fill a position when it was reported as difficult to fill. This may indicate a higher need for acute care nurse practitioners; however only 1 hospital reported a need for NP s greater than budgeted FTE s. Certified nurse midwives are also by six hospitals which report no vacancies and 9% turnover. The clinical nurse specialist (CNS) vacancy rate is 16% with a 0% turnover in the four hospitals that employ CNS s. Two hospitals report a mean of 30 weeks to recruit a CNS. Four home health agencies also employ CNS s and report a 3% vacancy rate and a 43% turnover rate. Nurse anesthetists are by six hospitals and a 14% vacancy rate and 18% turnover rate have been determined statewide for this position. Five hospitals report a mean of 27 weeks to recruit a nurse anesthetist. Nurse managers in the hospital and home health setting have low vacancy rates (8% and 0% respectively) and low turnover rates (9% and 5% respectively). Five hospitals reported a mean of 20 weeks to fill this position. V. Nursing Subjective ratings of need for positions Respondents were asked to rate subjectively whether the actual need for each type of position was greater than, equal to, or less than the budgeted FTEs for that position. In hospitals, 55% of respondents (6 hospitals) rated the need for staff RNs as greater than budgeted. For clinical nurse specialists, 3 hospitals rated the need as greater than budgeted. In contrast, no more than 25% of respondents rated the need as greater than the budgeted FTEs for other nursing positions. The need for nurse anesthetists is perceived as equal to (5 hospitals) or less than (2 hospitals) budgeted FTE s. In home health agencies, long term care facilities, and outpatient provider offices, there were no nursing positions for which the majority of respondents reported that actual need was greater than budgeted FTEs. For staff RN positions, the hospitals that perceived need to be greater than budgeted FTEs compared to the hospitals that perceived need to be equal to or less than budgeted had a higher mean vacancy rate (11% vacancy vs. 9.2% vacancy) and higher mean turnover rate (15.8% turnover vs. 11.6% turnover). However, these differences were not statistically 14
17 significant. It is intriguing that the only positions rated as having a need greater than budgeted FTE positions by the majority of respondents were staff RNs, and possibly CNS positions, in hospitals. This may reflect the distinction between demand for nurses, which is an economic indicator of what employers are willing to pay for, and need, which is more difficult to measure. Respondents in all settings were also asked whether their organization needed nurses with specialized skills that were currently not available. Eighty percent of hospitals responded affirmatively, citing a need for nurses with training in intensive care, emergency room, operating room, obstetrics, and management. In home health agencies, 40% reported an unmet need, and cited nurses with training in psychiatry and high technology. Thirtysix percent of long term care facilities reported needing nurses with specialized skills, and noted a need for nurses with experience with IVs, wound care, management, Alzheimer s units, and acute/skilled care. Only 20% of outpatient provider offices reported a need for nurses with specialized skills that were currently unavailable. Recruitment of nurses At least 50% of hospitals surveyed reported that in the past year, it was difficult to fill RN positions in critical/intensive care, the operating room, the emergency room, and in obstetrics. For hospitals reporting difficulty filling these positions, the average number of weeks to fill the position ranged from 15 weeks for operating room positions to 22 weeks for intensive care unit positions. For 60% of home health agencies, LNA recruitment in the past year was reported as difficult. However, for agencies reporting difficulty, the average time to fill an LNA position was 5.3 weeks. At least 64% of long term care respondents reported difficulty filling evening and night RN/LPN and LNA shifts. For facilities that reported difficulty, RN/LPN evening and night shifts were filled in an average of 36 and 32 weeks respectively, while LNA evening and night shifts were filled in an average of 10 and 18 weeks. Day shifts for these positions, in contrast, were reported as difficult to fill by 36% or fewer respondents. Sixty percent of respondents from outpatient provider offices were unable to assess difficulty in recruitment because there were no vacancies in nursing positions in their offices in the past year. For those that did report difficulty, the average number of weeks to fill RN positions was 13 weeks, LPN positions 11 weeks, and nurse practitioners 5 weeks. 15
18 Recruitment tools Approximately half of respondents in hospitals, home health agencies, and long term care facilities reported that starting salaries had a positive impact on recruitment of nurses. However, 33% of hospitals, 18% of home health agencies, 48% of long term care facilities, and 53% of outpatient provider offices reported that starting salaries had a negative impact on recruitment of nurses. Thirty-three percent of hospitals, 45% of home health agencies, 58% of long term care facilities, and 28% of outpatient provider offices reported that salaries impact retention of long-term nursing staff to a great extent. Home health agencies were the only setting in which the majority (64%) of respondents reported a pay differential for educational preparation (for example, a bachelor s degree in nursing vs. an associate s degree) and for credentialed nurses. Pay differentials for educational preparation were offered by 26% of hospitals, 12% of long term care facilities, and 22% of outpatient provider offices. Similarly, pay differentials for credentialed nurses were reported by 26% of hospitals, 4% of long term care facilities, and 27% of outpatient provider offices. Data on the magnitude of the differential were not included. How nursing need is determined Respondents were asked to indicate the system used by their hospital to determine nursing staffing patterns. Of the 15 respondents:! 3 use nursing hours per patient day.! 1 uses a patient acuity system.! 3 use nurse to patient ratios.! 3 use other systems.! 2 use a combination of nursing hours per patient day and nurse to patient ratio.! 1 uses a patient acuity system and other.! 1 uses nursing hours per patient day, a patient acuity system and nurse to patient ratio.! 1 uses nursing hours per patient day, patient acuity system, nurse to patient ratio and other. Therefore, the most commonly used systems are the nursing hours per patient day and nurse to patient ratios, which are used alone or in combination in 50% of the hospitals. 16
19 Schullanberger (2000) reported a lack of consensus in the U.S. about how best to determine nurse staffing requirements in various health care settings, primarily in hospitals. This suggests that budgeted positions may be quite different between hospitals depending on the tools used to estimate the number of budgeted positions needed. Cockerill, O Brien Pallas, Bolley and Pink (1993) noted that facilities using different workload measurement systems will calculate very different reimbursement rates. These authors set out to compare the equivalence of nursing workload estimates using four commonly-used nursing patient classification systems, and to examine the effect of variability on determining costs per patient. Since California passed legislation requiring minimum, specific, and numerical licensed nurse-to patient ratios by licensed nurse classification and hospital unit (Seago, 2002) debate has intensified about whether this is an important safeguard for other states to adopt. Seago argues that the Institute of Medicine and the American Nurses Association have reported that there is inadequate scientific evidence to recommend specific nurse-topatient ratios. Furthermore, hospitals use patient classification systems (PCSs) that are not standardized, as the Vermont Health Workforce Survey has confirmed. In a study of acute care hospitals in California, 64.3% of rural hospitals and 57.6% of non-rural hospitals used a hospital-developed PCS, so it is difficult to compare PCS scores across hospitals (Seago, 2002). The standardization of determining nurse workload is suggested by Seago (2002) as an alterative to patient classification systems. Staff mix RNs outnumbered LPNs and LNAs at all hospitals. Statewide, 79% of total nursing FTEs (RNs, LPNs, and LNAs) were filled by RNs. In individual hospitals, the RN mix ranged from 48% to 95%. Hospitals with more than 100 licensed beds tended to have a richer RN mix (RNs made up 82% of total nurse FTEs, range 77-83%) than hospitals with fewer than 100 beds (RNs made up 75% of total nurse FTEs, range 48-95%). In all but three hospitals, the number of LPNs was greater than the number of LNAs. Traveling nurses and health professionals as an indication of need The survey collected information about traveling nurses (also called agency nurses) and other health professionals who are hired on a temporary basis to fill open positions. This information is of interest because the fees paid to traveling nurse agencies per nurse can exceed the cost of hiring a full-time nurse with benefits, and a large number of 17
20 traveling employees who are not as familiar with a workplace s practices may require additional supervision. In Vermont, as of February 15, 2003, twelve hospitals traveling staff RNs, although only four hospitals more than five traveling RN FTEs. One hospital also traveling nurses for nurse anesthetist positions. As a percentage of budgeted FTEs statewide, traveling nurses filled:! 7% of staff RN positions! 7% of nurse anesthetist positions Eight hospitals reported the amount of money spent on traveling nurses in the past fiscal year. For these eight, the statewide total was $9.4 million dollars, an average of $1.18 million per hospital for the eight reporting (with a range of under $4,000 per year to over $5 million). What if actual FTEs exceed budgeted FTEs? In this pilot survey, information was obtained about both budgeted and actual FTE positions in order to determine whether the actual number of FTEs would be greater than budgeted FTEs for some settings and positions. In 3-5 hospitals (depending on position), the number of FTEs exceeded budgeted FTEs for the following positions:! Staff RNs by 3% 7%! LPNs by 3% 42%! LNAs by 5% 39% In 3 home health agencies, the number of FTEs exceeded budgeted FTEs for:! Staff RNs by 2% 11%! Personal care attendants by 6% 28% In 3-5 long term care facilities (depending on position), the number of FTEs exceeded budgeted for:! RNs by 5% 21%! LNAs by 2% 53%! LPNs by 1% 80% One consequence of measuring the workforce in this manner is that the statewide vacancy rates for these positions were slightly underestimated, because the number of actual FTEs was inflated in relation to the number of budgeted FTEs for these institutions, thus erbalancing the vacancies reported by hospitals in which the FTEs were less than budgeted. 18
21 Impact of nursing vacancy and turnover Respondents were asked to report whether their institution had experienced any of a series of impacts as a result of a workforce shortage. The most commonly reported impacts in all settings were:! decreased patient satisfaction! increased patient complaints! decreased staff satisfaction! mandatory staff overtime. Hospitals were more likely than other workplace settings to experience these impacts, with 34% of hospitals reporting decreased staff satisfaction at least monthly, 40% reporting decreased patient satisfaction and increased patient complaints at least monthly, 20% reporting mandatory staff overtime at least monthly. The other most commonly reported impacts were decreased staff satisfaction at least monthly in 30% of long term care facilities and 20% of outpatient provider offices; and mandatory overtime at least monthly in 18% of home health agencies, 18% of outpatient provider offices, and 16% of long term care facilities. Hospitals were also asked about impacts specific to the hospital setting. Impacts that were experienced at least monthly by hospitals were emergency room overcrowding (by 33% of hospitals), delayed or diverted admissions (by 27% of hospitals), delayed hospital discharges (by 26% of hospitals), and a reduced number of staffed beds (by 14% of hospitals). These impacts may have a detrimental effect on the quality of health care provided to Vermonters, and merit further attention. In addition, decreased staff satisfaction may be related to turnover rates, which in turn may impact the quality of healthcare Vermont is able to provide its citizens. VI. Other Healthcare workforce needs The nursing shortage has received the most attention because the number of nurses exceeds any other healthcare profession and historical trends are available to predict nursing shortages. However, nurses are only a part of the Vermont health workforce assessment picture. Several state surveys (AHEC and VT Department of Health) currently focus on physicians, physician assistants, and nurse practitioners. 19
22 Bamberg (1994) found almost half of the health workforce is allied health personnel. Emerging needs in new specialty areas are important to identify for recruiting and educational programming purposes. All respondents were asked the following question for each position: In your opinion, is actual need greater than, equal to, or less than budgeted FTEs for this position? A limitation to this pilot study is that the respondent may or may not have been the most informed individual to answer this question (i.e. human resource personnel versus department head). The need for the majority of positions was considered equal to the budgeted positions across all settings with the exception of the following:! The need for pharmacists was considered as greater than the budgeted positions in 5 out of 15 hospitals.! The need for speech therapists was considered as greater than the budgeted positions in 4 out of 15 hospitals. In order to get an impression about emerging needs, respondents were asked the following: How difficult is current recruitment for this position compared to recruitment in 2002?,, difficult,. The majority of respondents across all settings found recruitment to be the same as the previous year or didn t know, with the exception of the following:! The recruitment of radiation therapists was considered more difficult compared to the previous year by 7 hospitals.! The recruitment of laboratory technicians was considered more difficult compared to the previous year by 5 hospitals.! The recruitment of speech therapists was considered more difficult compared to the previous year by 4 hospitals and 8 long term care facilities.! The recruitment of pharmacists was considered more difficult compared to the previous year by 5 hospitals Respondents were also asked Does your organization need health care professionals with specialized skills who are currently not available? If yes, please list up to 3 types of skilled professionals who are needed but not currently available. These are the non-nursing positions identified by at least one respondent except where indicated:! In the hospital setting pharmacist(4), radiology technologists(7), medical laboratory technician(3), radiation therapist, MRI technician, sonographer, 20
23 child psychiatrist, CT scan technician, nuclear medicine technician, respiratory therapist.! In the home health setting speech therapist (2), physical therapy manager.! In the long term care setting recreational therapist, geriatric psychologist, wound specialist, podiatry services, and speech therapist.! In the office setting physician assistant (5), medical assistant (4), receptionist (3), MD (2), medical bookkeeper (2), ultrasound technician, manager, dietitian research knowledge, PA with abortion skills. Many healthcare professionals are contracted for their services as needed in the long term care and home health settings. These include physical therapists, speech therapists and occupational therapists. In the hospital setting, travelers fill 10% of OR technician, 9% of respiratory therapy, and 8% of radiologic technicians budgeted FTE s. The use of part time contracted and temporary (traveling) workers makes the assessment of the need for these positions harder to judge. Tracking of the use of these professionals in this way over time will provide important information. Travelers Hospitals also travelers to fill the following positions, as a percentage of budgeted FTEs statewide:! 10% of operating room technician positions! 9% of budgeted respiratory therapist positions! 8% of budgeted FTEs radiology technologist positions! 3% of budgeted ultrasound technician positions Home health agencies did not employ any traveling nurses, but used travelers to fill 6% of budgeted physical therapist positions and 13% of speech therapist positions. Long term care facilities and outpatient provider offices a small number of traveling nurses and other health employees, generally less than three traveler FTEs per position statewide. Contracted Workers Although this survey was not designed to obtain information about the number of workers contracted by healthcare workplaces, several survey respondents indicated that their institution contracted for certain positions. Their answers suggest that for certain 21
24 positions, data on health professionals may not be available from the workplaces themselves, but from the contracting agencies. Long term care facilities were the most likely to contract for health professionals. The following list includes the most commonly contracted positions, and the percent of long term care facilities contracting for these services (note this is not the percent of workers or FTEs):! Speech therapist 29%! Physical therapist..21%! Dietician 21%! Occupational therapist..17%! Physical therapy assistant.13% Speech therapists were also contracted by 20% (3) of the hospitals, and dieticians were contracted by 7% (1) of the hospitals. In home health agencies, occupational therapists, speech therapists, social workers, and dieticians were contracted by 9% (1) of the agencies (one each). Vacancy rates vary significantly across the settings. Long term care facilities reported the lowest vacancy rates for non-nursing employees with 50% of the positions reporting no vacancy, 25% of the positions reported being less than 5% vacant, the remaining 25% of positions reported are as follows: Speech therapist 25% vacant, certified occupational therapy assistant 8% vacant, and physical therapist 8% vacant. In the office setting, non-nursing positions had less than 4% vacancy rates. Vacancy rates increased in the home health setting with the limitation that these rates are based on less than 20 FTE s statewide: Speech therapist 50% vacant, waiver coordinator 23% vacant, and homemaker coordinator 13% vacant. In the hospital setting, the following positions were greater than 10% vacant: pharmacy technician 35%, pharmacist 23%, respiratory therapist 18%, dietetic technician 18%, OR technician 16%, radiologic technologist 13%, and clinical laboratory medical technologist 11%. Turnover rates are lowest in the long term care non-nurse employees with 8 out of 12 positions reported having a less than 10% turnover. The highest reported turnover in the long term care setting was for physical therapists (25%), followed by occupational therapist and activity staff (17%), and therapy managers (14%). The office setting reported turning over medical assistant at a rate of 18% and schedulers at a rate of 14%. In comparison, all non-nursing positions in home health had a greater than 12% turnover rate. The highest turnover rate was reported as 270% for the personal care 22
25 attendants. This was followed by 67% for speech therapists; however, a very small number of speech therapists are. The turnover rates for occupational therapist (31%), social workers (21%), and homemaker coordinator (20%) were followed by the lower rates for waiver coordinator (15%), managers (13%) and physical therapists (12%). In the hospitals, the highest turnover was reported for the position of dietetic technician at 70%. Moderate turnover rates were reported for occupational therapists (38%), radiation therapists (27%), ultrasound technician/sonographers (24%), pharmacists (23%), respiratory therapists (23%), and sterile reprocessor technicians (20%). Lower turnover rates were reported for physical therapy assistants (18%), dietician/nutritionists and speech therapists (17%), radiologic technologists (16%), OR technicians and physical therapists (15%), pharmacy technicians (14%) and clinical laboratory medical technicians (11%). The lowest turnover rates (0-9%) were reported for clinical laboratory medical technologists, nuclear medicine technologists, social workers, and certified occupational therapy assistants. VII. Recommendations for the Vermont Health Workforce Survey The following are specific recommendations to improve the survey instrument and methodology. The major problem in this pilot was that survey respondents, particularly in the long term care setting, were not always able to report budgeted and actual FTEs. This may be explained by a lack of familiarity with the definition of an FTE, and may also be because respondents did not have access to information about the number of budgeted positions. Recommendations to improve the survey instrument! Collect the following information to calculate vacancy rates: o FTEs currently on staff. o FTEs vacancies currently being recruited.! Define FTE explicitly, with an example. Two definitions used on other states surveys that could be used are: o FTEs (full-time equivalents) = the number of hours per week for that job category, divided by the number of hours in a standard fulltime work week. For example, if there are 90 RN hours and an FTE 23
26 in your facility is 40 hours, the 90 hours is 2.25 FTEs (90 hours divided by 40 hours). o One FTE, the number of hours per week worked by one full-time worker, is indicated by 1.0 FTE. Part-time positions should be indicated as follows: a half-time position = 0.5 FTE; a quarter-time position = 0.25 FTE.! Show an example row for one position in the staffing table, with fictional data showing how to report FTEs and numbers of workers.! Define specifically who should be included in reported FTEs. Two possibilities are: (1) Limit FTEs to include full-time and part-time staff but not per diem or travelers, or (2) Allow respondents to check a box if per diem workers are included in FTEs reported.! Add an open-ended question about how institutions cover for current vacancies.! Define specifically whether per diem workers should be included when reporting the number of workers leaving the organization in the past year. Then it will be clear whether per diem workers should be used in the denominator when calculating a turnover rate.! Consider obtaining information about retention in addition to (or instead of) turnover.! Instruct respondents to enter 0 or a dash for staffing information when the answer is zero, rather than to leave blanks.! Eliminate the question about number of workers on leave of absence.! Provide a place for respondents to report that they contract for positions.! Rewrite the questions about the impact of starting salaries on recruitment and retention (Recruitment Section, questions 2 and 3) to clarify their interpretation.! The question about difficulty filling positions should be made the same on the nurse and health employees surveys.! Ask about the number of weeks to fill a position for all respondents rather than just those that report difficulty. Or include categories instead of a subjective rating of difficulty. (0-4 weeks, 1-3 months, 3-6 months, 6 months 1 year, > 1 year). 24
27 ! Add a N/A option for the impact of health workforce shortage.! Combine waiver attendant and personal care attendant positions in the home health employee survey, as they are the same position in most home health agencies. Also, consider differentiating between master s and baccalaureate degree prepared social workers. Recommendations to improve survey methodology! Include Vermont State Hospital in Waterbury in the survey.! Request the name of individuals(s) who completed survey so that follow-up calls are possible to clarify data.! Leave time for data cleaning and call-backs before data entry.! Consider mailing the nursing and other health professionals surveys to different individuals within each institution or at different times. Health Workforce Assessment Pilot Study expenses incurred Category Justification Expense Salaries 50% FTE (combined for 3 $23, researchers, plus inkind) Benefits Fringe rate 37.3% $8, Indirect cost UVM rate of 27.3% $10, Postage Mailing surveys & followup $ postcards, letters Poster Conference presentation $ Printing Copy of surveys $ Report publishing Final report publishing $ Statistical support Biometry facility $ Supplies Office supplies for mailing $ Travel To conference $ Conference fees Conference fee $50.00 Telephone Toll calls $ Total expenses $48, The expense of an ongoing survey would be about equal to this because the salary of the principal investigator and office secretary (which were in-kind in this pilot survey) would equal the expense of the research team used to develop the instrument. 25
28 IX. Conclusions based on this pilot survey Impact of Nursing Shortage in Vermont. The information provided by this pilot study, in combination with the Board of Nursing Relicensure Surveys for RN s, LPN s, and LNA s, provides a picture of the supply and demand for nurses in the state of Vermont. Even before the senescence of the Baby Boom generation, the demand for registered nurses is exceeding the supply. Vermont s vacancy rate mirrors the national average of 13% and in addition, 55% of respondents (6 hospitals) rated the need for registered nurses as greater than the budgeted positions. As a result, staff and patient dissatisfaction are reported as a common impact of the nursing shortage. At this time, more serious indicators of a nursing shortage such as diverted admissions, delayed discharges, emergency room overcrowding, and reduction in the number of staff beds, are not reported as a daily experience by any hospitals in Vermont. Rather, noteworthy consequences of the nursing shortage are present to varying degrees throughout the Vermont s health care system. Nursing shortage varies by setting and specialty. The highest RN vacancy rates and the longest time to fill vacant positions are reported in the long term care setting. Other sectors of the nursing workforce, outpatient provider offices for example, currently appear to be stable. Positions for nurses with specialized skills such as those with experience in intensive or critical care, emergency room, operating room and obstetrics are reported as difficult to fill by 50% of Vermont s hospitals. With positions taking an average of weeks to fill, traveling nurses are likely to continue to be to fill the gaps. This will mean a continued expense (nine million dollars reported in this survey) for Vermont s hospitals to absorb and probably pass on to consumers and insurers. Nursing recruitment issues. The impact of salary on recruitment of nurses was reported to be neither negative nor positive by a majority of respondents. This may indicated that salaries are slowly improving as nurse demand exceeds supply. Because highly skilled nursing positions are the most difficult to fill, the lack of differentiated salary for certification and educational preparation in 74% of Vermont hospitals is troubling. Support for career advancement and continued education has been linked to the creation of the desirable professional environment in Magnet hospitals (McClure & Hinshaw, 2002). Moreover, in order to ease the nursing faculty shortage, recruits can only be drawn from those who are educationally prepared. 26
29 Nursing retention issues. Turnover rates should be closely monitored for indications of nurse dissatisfaction as the nursing shortage intensifies. This survey suggests that higher vacancy rate is associated with a higher turnover rate. Benchmark data are available from the Magnet Hospitals, which have been recognized for their ability to attract and retain professional nurses: Magnet Hospitals (n=16) (n=14) Vacancy Rate Range 1-22% % Median 6% 9.6% Turnover Rate Range 2-27% 6-23% Median 9% 15.5% (p.46 McClure & Hinshaw, 2002) In comparison, statewide turnover of the registered nurse in this study ranges from 8% in the office setting to 35% in long term care. The advanced practice nurse turnover ranges from 0% (certified nurse midwife) to 43% (home health clinical nurse specialist). The American Hospital Association (2002) suggested that hospitals track their own employee stability using retention rates, unit by unit, rather than turnover. Adaptation of this suggestion would sensitize management to turnover in addition to identifying its cause. Higher turnover is expected in the positions licensed nurse assistant and licensed practical nurse, yet vacancy rates appear to have decreased in both these positions when compared to the last three years reported in the VAHHS vacancy survey. The influence of an economic downturn may be a contributing factor to the increased stability in the LNA and LPN positions. Health workforce issues. The fact that six non-nursing healthcare professions have vacancy rates that exceed 12%, as found in this pilot survey, is noteworthy. Despite the smaller numbers of non-nurse hospital health employees, in the aggregate, these other health professions represent a sizable portion of the total health workforce. Shortages in these occupations also impact all other positions in the organizations in terms of quality and continuity of care. The non-nursing hospital health workforce remains challenging to measure. The results of this survey differ from a similar in-state vacancy survey done in 2003, perhaps 27
30 due to different key informants. The necessary information about adequacy of budgeted positions, recruitment difficulties, and demand for services should ideally come from department heads. Yet the number of departments and the variety of health care disciplines make it difficult to locate and survey these individuals. Therefore, the human resources department is usually contacted for the information. The expense of telephone interviews to all department heads may be justified in order to gain the most accurate information. In the home health and long term care settings, many professionals are contracted by several employers rather than by one. Furthermore, the small numbers of these professionals make calculation of statewide vacancy and turnover rates difficult. Unambiguous data is needed for educational and policy planning purposes. Ongoing data needs. This pilot study has provided valuable baseline data on the impact of healthcare workforce shortages through the analysis of the need for health care professionals, vacancy rates, and turnover rates. It has also been helpful to estimate the resources necessary for ongoing assessment of the Vermont health workforce. The survey instrument has been tested and future studies can incorporate these modifications to assure greater reliability. The use of follow-up postcards, letters and phone calls proved successful in assuring a high response rate in most settings. This study s strength includes a grounding in literature, content review by experts, and comparison to similar analyses in other states. Vermont is now in the position of embracing this system that will provide important health workforce data in order to help ensure informed health care policy making. With continued support, The Vermont Health Workforce Survey can provide vital information for the state health plan. 28
31 References AACN. (2002, September 30). Nursing Shortage Fact Sheet., from AHEC, Northwestern. (2001). Annual Survey of Promary Care Providers. Aiken, L. H., Clarke, S. P., Sloan, D. M., Sochalski, J., & Silber, J. H. (2002). Hospital nurse staffing and patient mortality, nurse burnout, and job dissatisfaction. Journal of the American Medical Association, 288(16), Bamberg, R., Malvey, D.M., Wainright, M.C., Fottler, M.D. & Joiner, C.L. (1994). The development of a state-level health manpower database using an employer-based survey: a pilot project. The Journal of Rural Health, 10(3), VT. Department of Health.1996 Physician Survey: Vermont Health Care Provider Profiles. (June 1998). Kovner, C., & Gergen, P. J. (1998). Nurse staffing levels and adverse events following surgery in U.s. hospitals. Image: Journal of Nursing Scholarship, 30(4), McClure, M.L., & Hinshaw, A.S. (2002). Magnet Hospitals Revisited Attraction and Retention of Professional Nurses. Washington, D. C.: American Nurses Publishing. Needleman, J., Buerhaus, P. I., Needleman, J., Mattke, S., Stewart, M., Mattke, S., Stewart, B. A., & Zelevinsky, K. (2002). Nurse-staffing levels and the quality of care in hospitals. New England Journal of Medicine, 346(22), VAHHS. (February, 2001). Survey of Vacant Personnel Positions at Vermont's Health Care Organizations. Welz, M., & Kaeding, T. (2001). A call to action: Addressing Vermont's nursing shortage: Blue Ribbon Commission. 29
32 XI. Appendices a. Cover letter (hospital example) b. Survey instruments c. One page summaries d. Poster Redesigning Health Workforce Assessment in Vermont Presented at: Taking the Long View, A Gathering of State Nursing Workforce Centers. 4/03, Raleigh, North Carolina 30
33 February 15, 2003 Name Chief Nursing Officer / Administrator / Nurse Executive Facility Name Address We are writing to ask for your help in an effort to collect reliable information about nurses and allied health workers in our state. The Vermont Health Workforce Survey is being sent to all hospitals in Vermont to ask about staffing issues for a variety of nursing and allied health jobs. Our survey is unique because we are requesting this information from nurse executives. We realize that you alone may not have all the answers to the questions on the survey, and encourage you to work with human resources or other personnel if you need additional information to complete the survey. Results from this survey will help state and local government and nurse education programs plan for the health workforce needs of Vermont. Results may also help hospitals better plan for staffing needs by identifying the types of jobs most difficult to fill. Your answers are completely confidential and will be disseminated only as part of summary data in which no individual s answers can be identified. Confidentiality will be continuously maintained to the maximum extent allowable by law. This survey is voluntary and there are no known risks. However, you can help Vermont gain a better understanding of its health workforce by taking the time to participate. If for some reason you prefer not to respond, please let us know by returning the blank survey in the enclosed stamped envelope. If you have any questions or comments about this study, I would be happy to talk with you. My phone number is and my address is mpalumbo@zoo.uvm.edu. You may also write to us at the address on the letterhead. Thank you very much for helping us with this important study. Sincerely, Mary Val Palumbo, MSN, APRN Manager, Office of Nursing Workforce Research, Planning and Development 31
34 Vermont Health Workforce Survey Hospital Nursing Positions A project of the Office of Nursing Workforce Research, Planning, and Development Project funded by the Vermont Department of Health Information provided on this survey will be kept confidential If you have questions about the survey, please contact Mary Val Palumbo, Manager, Office of Nursing Workforce Research, Planning, and Development at (802) , or at mary.palumbo@uvm.edu 32
35 STAFFING START HERE: How many hours per week is considered 1 FTE (Full-Time Equivalent) at your organization? hours (e.g hours) OR to hours (e.g. a range of 32 to 40 hours) Please fill in the following information as of February 15, 2003 except when directed otherwise. This form relates to hospital personnel only. Do not include staff working in long term care, home health, or outpatient provider offices. Positio n Staff RNs LPN LNA NP / PA (inpatie nt only) CNS CNM CRNA Nurse Manag er Other nursing position Budgeted FTEs 1 0 if no budgeted FTEs Actual FTEs Do not include travelers Actual full-time workers Actual part-time 2 workers Per diem 3 workers Agency / traveling FTEs 0 if none Workers on leave of absence 4 Workers leaving 5 your organizatio n between 2/15/02 2/15/03 1. Budgeted FTEs refer to the total number of FTE positions authorized by management to fulfill staffing requirements for the year. 2. Part-time is any position less than 1 FTE 3. Per diem: on call or not regularly scheduled, no benefits included 4. Leave of absence: family leave, workers compensation, short-term disability 5. Number of workers leaving is the number of people (head ). Include voluntary and involuntary terminations or separations. Do not contract/temporary labor that left as a termination or separation. In your opinion, is actual need greater than, equal to, or less than budgeted FTEs for this position? 33
36 RECRUITMENT 1. Does your organization need nurses with specialized skills who are currently not available? Yes No If yes, please list up to 3 types of nurses with specialized skills who are needed but not currently available. (a) (b) (c) 2. In your organization (a) In your opinion, what is the impact of starting salaries on recruitment of nurses? Negative impact No impact Positive impact (b) In your opinion, to what extent do salaries impact retention of long-term nursing staff? Not at all Somewhat To a great extent (c) Is there a pay differential for educational preparation (A.D.N. vs. B.S.N.)? Yes No (d) Is there a pay differential for credentialed nurses (e.g. RNC)? Yes No (e) In the last fiscal year, what dollar amount was spent on agency or traveling nurses? dollars 3. In the last year (Feb. 15, 2002 to Feb. 15, 2003), was it difficult to fill each of these full-time positions? Not Difficult Difficult No vacancies in last year RN (Med/Surg Dept.) " weeks to fill RN (OR Dept.) " weeks to fill RN (ER Dept.) " weeks to fill RN (OB Dept.) " weeks to fill RN (Pediatrics Dept.) " weeks to fill RN (Adult ICU Dept.) " weeks to fill RN (NICU/PICU Dept.) " weeks to fill RN (Psych Dept.) " weeks to fill Nurse Manager " weeks to fill NP / PA " weeks to fill CNS " weeks to fill CNM " weeks to fill CRNA " weeks to fill LPN " weeks to fill 34
37 LNA " weeks to fill 35
38 4. What system does your hospital use to determine nursing staffing patterns? Nursing Hours per Patient Day Patient Acuity System Nurse-to-Patient Ratio No specific system Other (please specify): IMPACT OF HEALTH WORKFORCE SHORTAGE 1. In the last year, have you experienced any of the following impacts as a result of a workforce shortage? Please circle the number corresponding to the frequency that best fits your organization. Experienced due to workforce shortage? Several Never times a Monthly Weekly Daily year Curtailed plans for acquiring new technology Reduced number of staffed beds Emergency department overcrowding Diverted emergency department patients Delayed or diverted admissions Reduced service hours Increased wait times to surgery Cancelled surgeries Delayed hospital discharges Shortened lengths of stay Mandatory staff overtime Decreased patient satisfaction Increased patient complaints Decreased staff satisfaction Other: (Please specify) Curtailed plans for facility expansion Yes No Discontinued clinical programs Yes No Do you have any additional comments regarding nursing staffing or about this survey? How many minutes did it take you to fill out this survey? Thank you very much for your time! The Office of Nursing Workforce Research, Planning, and Development is funded by the Vermont Agency of Human Services, and is located at the University of Vermont's College of Nursing and Health Sciences 36
39 Vermont Health Workforce Survey Hospital Health Employees A project of the Office of Nursing Workforce Research, Planning, and Development Project funded by the Vermont Department of Health Information provided on this survey will be kept confidential If you have questions about the survey, please contact Mary Val Palumbo, Manager, Office of Nursing Workforce Research, Planning, and Development at (802) , or at mary.palumbo@uvm.edu 37
40 STAFFING START HERE Please fill in the following information as of February 15, 2003 except when directed otherwise. This form relates to hospital personnel only. Do not include staff working in long term care, home health, or outpatient provider offices. Positio n Budgeted FTEs 1 0 if no budgeted FTEs Clinical Laboratory Medical Technologist Medical Lab Tech Radiology Staff Radiolo gic Technologist Radiatio n Therapis t Nuclear Medicin e Tech Ultrasound Tech / Sonographer Therapeutic Services Occupational Therapis t Certified Occupational Therapis t Assistan t Actual FTEs Do not include traveler s Actual full-time workers Actual parttime 2 workers Per diem 3 workers Agency / travelin g FTEs 38 0 if none Workers on leave of absence 4 Workers leaving 5 your organization between 2/15/02 2/15/03 How difficult is current recruitment for this position compared to recruitment in 2002? difficult difficult difficult difficult difficult difficult difficult difficult 1. Budgeted FTEs refer to the total number of FTE positions authorized by management to fulfill staffing requirements for the year. 2. Part-time is any position less than 1 FTE 3. Per diem: on call or not regularly scheduled, no benefits included 4. Leave of absence: family leave, workers compensation, short-term disability In your opinion, is actual need greater than, equal to, or less than budgeted FTEs for this position?
41 5. Number of workers leaving is the number of people (head ). Include voluntary and involuntary terminations or separations. Do not contract/temporary labor that left as a termination or separation. 39
42 Position Physical Therapist Physical Therapy Assistant Speech Therapist Respiratory Therapist Other Operating Room Tech Central Sterile Reprocessor Tech Pharmacist Pharmacy Tech Social Worker Dietician / Nutritionist Dietetic Technician Other position Budgeted FTEs 1 0 if no budgeted FTEs Actual FTEs Do not include traveler s Actual full-time workers Actual parttime 2 workers Per diem workers Agency / travelin g FTEs 0 if none Workers on leave of absence 3 Workers leaving 4 your organization between 2/15/02 2/15/03 How difficult is current recruitment for this position compared to recruitment in 2002? difficult difficult difficult difficult difficult difficult difficult difficult difficult difficult difficult difficult In your opinion, is actual need greater than, equal to, or less than budgeted FTEs for this position? 40 Please turn to the last page.
43 1. Does your organization need health care professionals with specialized skills who are currently not available? Yes No If yes, please list up to 3 types of skilled professionals who are needed but not currently available. (a) (b) (c) 2. Do you have any additional comments regarding health professional staffing or about this survey? How many minutes did it take you to fill out this survey? Thank you very much for your time! The Office of Nursing Workforce Research, Planning, and Development is funded by the Vermont Agency of Human Services, and is located at the University of Vermont's College of Nursing and Health Sciences 41
44 Vermont Health Workforce Survey Home Health Nursing Positions A project of the Office of Nursing Workforce Research, Planning, and Development Project funded by the Vermont Department of Health Information provided on this survey will be kept confidential If you have questions about the survey, please contact Mary Val Palumbo, Manager, Office of Nursing Workforce Research, Planning, and Development at (802) , or at mary.palumbo@uvm.edu 42
45 STAFFING START HERE: How many hours per week is considered 1 FTE (Full-Time Equivalent) at your organization? hours (e.g hours) OR 32 to 40 hours) to hours (e.g. a range of Please fill in the following information as of February 15, 2003 except when directed otherwise. This form relates to home health personnel only. Position Staff RNs LPN LNA Clinical Nurse Specialist Clinical Managers Other nursing position Budgeted FTEs 1 0 if no budgeted FTEs Actual FTEs Do not include travelers Actual full-time workers Actual part-time 2 workers Per diem 3 workers Agency / traveling FTEs 0 if none Workers on leave of absence 4 Workers leaving 5 your organizatio n between 2/15/02 2/15/03 In your opinion, is actual need greater than, equal to, or less than budgeted FTEs for this position? Other nursing position 1. Budgeted FTEs refer to the total number of FTE positions authorized by management to fulfill staffing requirements for the year. 2. Part-time is any position less than 1 FTE 3. Per diem: on call or not regularly scheduled, no benefits included 4. Leave of absence: family leave, workers compensation, short-term disability 5. Number of workers leaving is the number of people (head ). Include voluntary and involuntary terminations or separations. Do not contract/temporary labor that left as a termination or separation. 43
46 RECRUITMENT 1. Does your organization need nurses with specialized skills who are currently not available? Yes No If yes, please list up to 3 types of nurses with specialized skills who are needed but not currently available. (a) (b) (c) 2. In your organization (a) In your opinion, what is the impact of starting salaries on recruitment of nurses? Negative impact No impact Positive impact (b) In your opinion, to what extent do salaries impact retention of long-term nursing staff? Not at all Somewhat To a great extent (c) Is there a pay differential for educational preparation (A.D.N. vs. B.S.N.)? Yes No (d) Is there a pay differential for credentialed nurses (e.g. RNC)? Yes No (e) In the last fiscal year, what dollar amount was spent on traveling or contracted nurses? dollars 3. In the last year (Feb. 15, 2002 to Feb. 15, 2003), was it difficult to fill each of these full-time positions? Not Difficult Difficult No vacancies in last year RN " weeks to fill Clinical Nurse Specialist " weeks to fill LPN " weeks to fill LNA " weeks to fill 44 Please turn to the last page.
47 IMPACT OF HEALTH WORKFORCE SHORTAGE 1. In the last year, have you experienced any of the following impacts as a result of a workforce shortage? Please circle the number corresponding to the frequency that best fits your organization. Experienced due to workforce shortage? Several Never times a Monthly Weekly Daily year Curtailed plans for acquiring new technology Delayed or diverted admissions Reduced service hours Mandatory staff overtime Decreased patient satisfaction Increased patient complaints Decreased staff satisfaction Other: (Please specify) Curtailed plans for facility expansion Yes No Discontinued clinical programs Yes No Do you have any additional comments regarding nursing staffing or about this survey? How many minutes did it take you to fill out this survey? Thank you very much for your time! The Office of Nursing Workforce Research, Planning, and Development is funded by the Vermont Agency of Human Services, and is located at the University of Vermont's College of Nursing and Health Sciences 45
48 Vermont Health Workforce Survey Home Health Employees A project of the Office of Nursing Workforce Research, Planning, and Development Project funded by the Vermont Department of Health Information provided on this survey will be kept confidential If you have questions about the survey, please contact Mary Val Palumbo, Manager, Office of Nursing Workforce Research, Planning, and Development at (802) , or at mary.palumbo@uvm.edu 46
49 STAFFING START HERE Please fill in the following information as of February 15, 2003 except when directed otherwise. This form relates to home health personnel only. Position Budgeted FTEs 1 0 if no budgeted FTEs Therapeutic Services Occupational Therapist Certified Occupational Therapist Assistant Physical Therapist Physical Therapy Assistant Speech Therapist Managers of above positions Medical Records Waiver Attendant Waiver Coordinator Actual FTEs Do not include traveler s Actual full-time workers Actual parttime 2 workers Per diem 3 workers Agency / travelin g FTEs 0 if none Workers on leave of absence 4 Workers leaving 5 your organization between 2/15/02 2/15/03 How difficult is current recruitment for this position compared to recruitment in 2002? difficult difficult difficult difficult difficult difficult difficult difficult In your opinion, is actual need greater than, equal to, or less than budgeted FTEs for this position? 1. Budgeted FTEs refer to the total number of FTE positions authorized by management to fulfill staffing requirements for the year. 2. Part-time is any position less than 1 FTE 3. Per diem: on call or not regularly scheduled, no benefits included 4. Leave of absence: family leave, workers compensation, short-term disability 5. Number of workers leaving is the number of people (head ). Include voluntary and involuntary terminations or separations. Do not contract/temporary labor that left as a termination or separation. 47
50 Position Budgeted FTEs 1 0 if no budgeted FTEs Social Services Social Worker Other Dietician Personal Care Attendant Homemaker Homemaker Coordinator Companion Other position Other position Other position Actual FTEs Do not include traveler s Actual full-time workers Actual parttime 2 workers Per diem workers Agency / travelin g FTEs 0 if none Workers on leave of absence 3 Workers leaving 4 your organization between 2/15/02 2/15/03 How difficult is current recruitment for this position compared to recruitment in 2002? difficult difficult difficult difficult difficult difficult difficult difficult difficult In your opinion, is actual need greater than, equal to, or less than budgeted FTEs for this position? Please turn to the last page. 48
51 1. Does your organization need health care professionals with specialized skills who are currently not available? Yes No If yes, please list up to 3 types of skilled professionals who are needed but not currently available. (a) (b) (c) 2. Do you have any additional comments regarding health professional staffing or about this survey? How many minutes did it take you to fill out this survey? Thank you very much for your time! The Office of Nursing Workforce Research, Planning, and Development is funded by the Vermont Agency of Human Services, and is located at the University of Vermont's College of Nursing and Health Sciences 49
52 Vermont Health Workforce Survey Long Term Care Nursing Positions A project of the Office of Nursing Workforce Research, Planning, and Development Project funded by the Vermont Department of Health Information provided on this survey will be kept confidential If you have questions about the survey, please contact Mary Val Palumbo, Manager, Office of Nursing Workforce Research, Planning, and Development at (802) , or at mary.palumbo@uvm.edu 50
53 STAFFING START HERE: How many hours per week is considered 1 FTE (Full-Time Equivalent) at your organization? hours (e.g hours) OR to hours (e.g. a range of 32 to 40 hours) Please fill in the following information as of February 15, 2003 except when directed otherwise. This form relates to staff in long term care facilities only. Include skilled nursing staff only; do not include residential care staff. Position LNA Nurse manager / supervisor Budgeted FTEs 1 0 if no budgeted FTEs Actual FTEs Do not include travelers Actual full-time workers Actual part-time 2 workers Per diem 3 workers Agency / traveling FTEs 0 if none Workers on leave of absence 4 Workers leaving 5 your organizatio n between 2/15/02 2/15/03 In your opinion, is actual need greater than, equal to, or less than budgeted FTEs for this position? Staff nurses (RN)* Staff nurses (LPN)* Quality assurance or staff development MDS Coordinator / Staff Other nursing position * If it is not possible to report budgeted staff nurse FTE positions separately for RNs and LPNs, please report the total staff nurse FTEs here: FTEs (RN and LPN combined) 1. Budgeted FTEs refer to the total number of FTE positions authorized by management to fulfill staffing requirements for the year. 2. Part-time is any position less than 1 FTE 3. Per diem: on call or not regularly scheduled, no benefits included 4. Leave of absence: family leave, workers compensation, short-term disability 5. Number of workers leaving is the number of people (head ). Include voluntary and involuntary terminations or separations. Do not contract/temporary labor that left as a termination or separation. 51
54 RECRUITMENT 1. Does your organization need nurses with specialized skills who are currently not available? Yes No If yes, please list up to 3 types of nurses with specialized skills who are needed but not currently available. (a) (b) (c) 2. In your organization (a) In your opinion, what is the impact of starting salaries on recruitment of nurses? Negative impact No impact Positive impact (b) In your opinion, to what extent do salaries impact retention of long-term nursing staff? Not at all Somewhat To a great extent (c) Is there a pay differential for educational preparation (A.D.N. vs. B.S.N.)? Yes No (d) Is there a pay differential for credentialed nurses (e.g. RNC)? Yes No (e) In the last fiscal year, what dollar amount was spent on agency or traveling nurses? dollars 3. In the last year (Feb. 15, 2002 to Feb. 15, 2003), was it difficult to fill each of these full-time positions? Not Difficult Difficult No vacancies in last year LNA (Day shift) " weeks to fill LNA (Evening shift) " weeks to fill LNA (Night shift) " weeks to fill RN (Day shift) " weeks to fill LPN (Day shift) " weeks to fill RN / LPN Nursing staff (Evening shift) " weeks to fill RN / LPN Nursing staff (Night shift) " weeks to fill Nurse manager / supervisor " weeks to fill 52 Please turn to the last page.
55 IMPACT OF HEALTH WORKFORCE SHORTAGE 1. In the last year, have you experienced any of the following impacts as a result of a workforce shortage? Please circle the number corresponding to the frequency that best fits your organization. Experienced due to workforce shortage? Several Never times a Monthly Weekly Daily year Reduced number of staffed beds Delayed or diverted admissions Mandatory staff overtime Decreased patient satisfaction Increased patient complaints Decreased staff satisfaction Other: (Please specify) Curtailed plans for facility expansion Yes No Discontinued clinical programs Yes No Do you have any additional comments regarding nursing staffing or about this survey? How many minutes did it take you to fill out this survey? Thank you very much for your time! The Office of Nursing Workforce Research, Planning, and Development is funded by the Vermont Agency of Human Services, and is located at the University of Vermont's College of Nursing and Health Sciences 53
56 Vermont Health Workforce Survey Long Term Care Health Employees A project of the Office of Nursing Workforce Research, Planning, and Development Project funded by the Vermont Department of Health Information provided on this survey will be kept confidential If you have questions about the survey, please contact Mary Val Palumbo, Manager, Office of Nursing Workforce Research, Planning, and Development at (802) , or at mary.palumbo@uvm.edu 54
57 STAFFING START HERE Please fill in the following information as of February 15, 2003 except when directed otherwise. This form relates to staff in long term care facilities only. Include skilled nursing staff only; do not include residential care staff. Position Budgeted FTEs 1 0 if no budgeted FTEs Therapeutic Services Occupational Therapist Certified Occupational Therapist Assistant Physical Therapist Physical Therapy Assistant Speech Therapist Managers of above positions Social Services Social Worker Actual FTEs Do not include traveler s Actual full-time workers Actual parttime 2 workers Per diem 3 workers Agency / travelin g FTEs 0 if none Workers on leave of absence 4 Workers leaving 5 your organization between 2/15/02 2/15/03 How difficult is current recruitment for this position compared to recruitment in 2002? difficult difficult difficult difficult difficult difficult difficult In your opinion, is actual need greater than, equal to, or less than budgeted FTEs for this position? 1. Budgeted FTEs refer to the total number of FTE positions authorized by management to fulfill staffing requirements for the year. 2. Part-time is any position less than 1 FTE 3. Per diem: on call or not regularly scheduled, no benefits included 4. Leave of absence: family leave, workers compensation, short-term disability 5. Number of workers leaving is the number of people (head ). Include voluntary and involuntary terminations or separations. Do not contract/temporary labor that left as a termination or separation. 55
58 Position Other Dietician Food Service Manager Activity Director Activity Staff Housekeeping Director Other position Other position Other position Budgeted FTEs 1 0 if no budgeted FTEs Actual FTEs Do not include traveler s Actual full-time workers Actual parttime 2 workers Per diem workers Agency / travelin g FTEs 0 if none Workers on leave of absence 3 Workers leaving 4 your organization between 2/15/02 2/15/03 How difficult is current recruitment for this position compared to recruitment in 2002? difficult difficult difficult difficult difficult difficult difficult difficult In your opinion, is actual need greater than, equal to, or less than budgeted FTEs for this position? Please turn to the last page. 56
59 1. Does your organization need health care professionals with specialized skills who are currently not available? Yes No If yes, please list up to 3 types of skilled professionals who are needed but not currently available. (a) (b) (c) 2. Do you have any additional comments regarding health professional staffing or about this survey? How many minutes did it take you to fill out this survey? Thank you very much for your time! The Office of Nursing Workforce Research, Planning, and Development is funded by the Vermont Agency of Human Services, and is located at the University of Vermont's College of Nursing and Health Sciences 57
60 Vermont Health Workforce Survey Outpatient Provider Office Nursing and Health Employees A project of the Office of Nursing Workforce Research, Planning, and Development Project funded by the Vermont Department of Health Information provided on this survey will be kept confidential If you have questions about the survey, please contact Mary Val Palumbo, Manager, Office of Nursing Workforce Research, Planning, and Development at (802) , or at mary.palumbo@uvm.edu 58
61 STAFFING START HERE: How many hours per week is considered 1 FTE (Full-Time Equivalent) at your organization? hours (e.g hours) OR to hours (e.g. a range of 32 to 40 hours) Please fill in the following information as of February 15, 2003 except when directed otherwise. This form relates to outpatient provider personnel only. Position Staff RNs LPN Medical Assistant NP / PA Schedulers / Medical records staff Other position: Other position: Budgeted FTEs 1 0 if no budgeted FTEs Actual FTEs Do not include travelers Actual full-time workers Actual part-time 2 workers Per diem 3 workers Agency / traveling FTEs 0 if none Workers on leave of absence 4 Workers leaving 5 your organizatio n between 2/15/02 2/15/03 In your opinion, is actual need greater than, equal to, or less than budgeted FTEs for this position? 1. Budgeted FTEs refer to the total number of FTE positions authorized by management to fulfill staffing requirements for the year. 2. Part-time is any position less than 1 FTE 3. Per diem: on call or not regularly scheduled, no benefits included 4. Leave of absence: family leave, workers compensation, short-term disability 5. Number of workers leaving is the number of people (head ). Include voluntary and involuntary terminations or separations. Do not contract/temporary labor that left as a termination or separation. 59
62 RECRUITMENT 1. Does your organization need nurses or other health professionals with specialized skills who are currently not available? Yes No If yes, please list up to 3 types of skilled professionals who are needed but not currently available. (a) (b) (c) 2. In your organization (a) In your opinion, what is the impact of starting salaries on recruitment of nurses? Negative impact No impact Positive impact (b) In your opinion, to what extent do salaries impact retention of long-term nursing staff? Not at all Somewhat To a great extent (c) Is there a pay differential for educational preparation (A.D.N. vs. B.S.N.)? Yes No (d) Is there a pay differential for credentialed nurses (e.g. RNC)? Yes No (e) In the last fiscal year, what dollar amount was spent on agency or traveling nurses? dollars 3. In the last year (Feb. 15, 2002 to Feb. 15, 2003), was it difficult to fill each of these full-time positions? Not Difficult Difficult No vacancies in last year RN " weeks to fill NP / PA " weeks to fill LPN " weeks to fill Medical Assistant " weeks to fill Please turn to the last page. 60
63 IMPACT OF HEALTH WORKFORCE SHORTAGE 1. In the last year, have you experienced any of the following impacts as a result of a workforce shortage? Please circle the number corresponding to the frequency that best fits your organization. Experienced due to workforce shortage? Several Never times a Monthly Weekly Daily year Curtailed plans for acquiring new technology Reduced service hours Increased wait times to surgery Cancelled surgeries Mandatory staff overtime Decreased patient satisfaction Increased patient complaints Decreased staff satisfaction Other: (Please specify) Curtailed plans for facility expansion Yes No Discontinued clinical programs Yes No Do you have any additional comments regarding nursing staffing or about this survey? How many minutes did it take you to fill out this survey? Thank you very much for your time! The Office of Nursing Workforce Research, Planning, and Development is funded by the Vermont Agency of Human Services, and is located at the University of Vermont's College of Nursing and Health Sciences 61
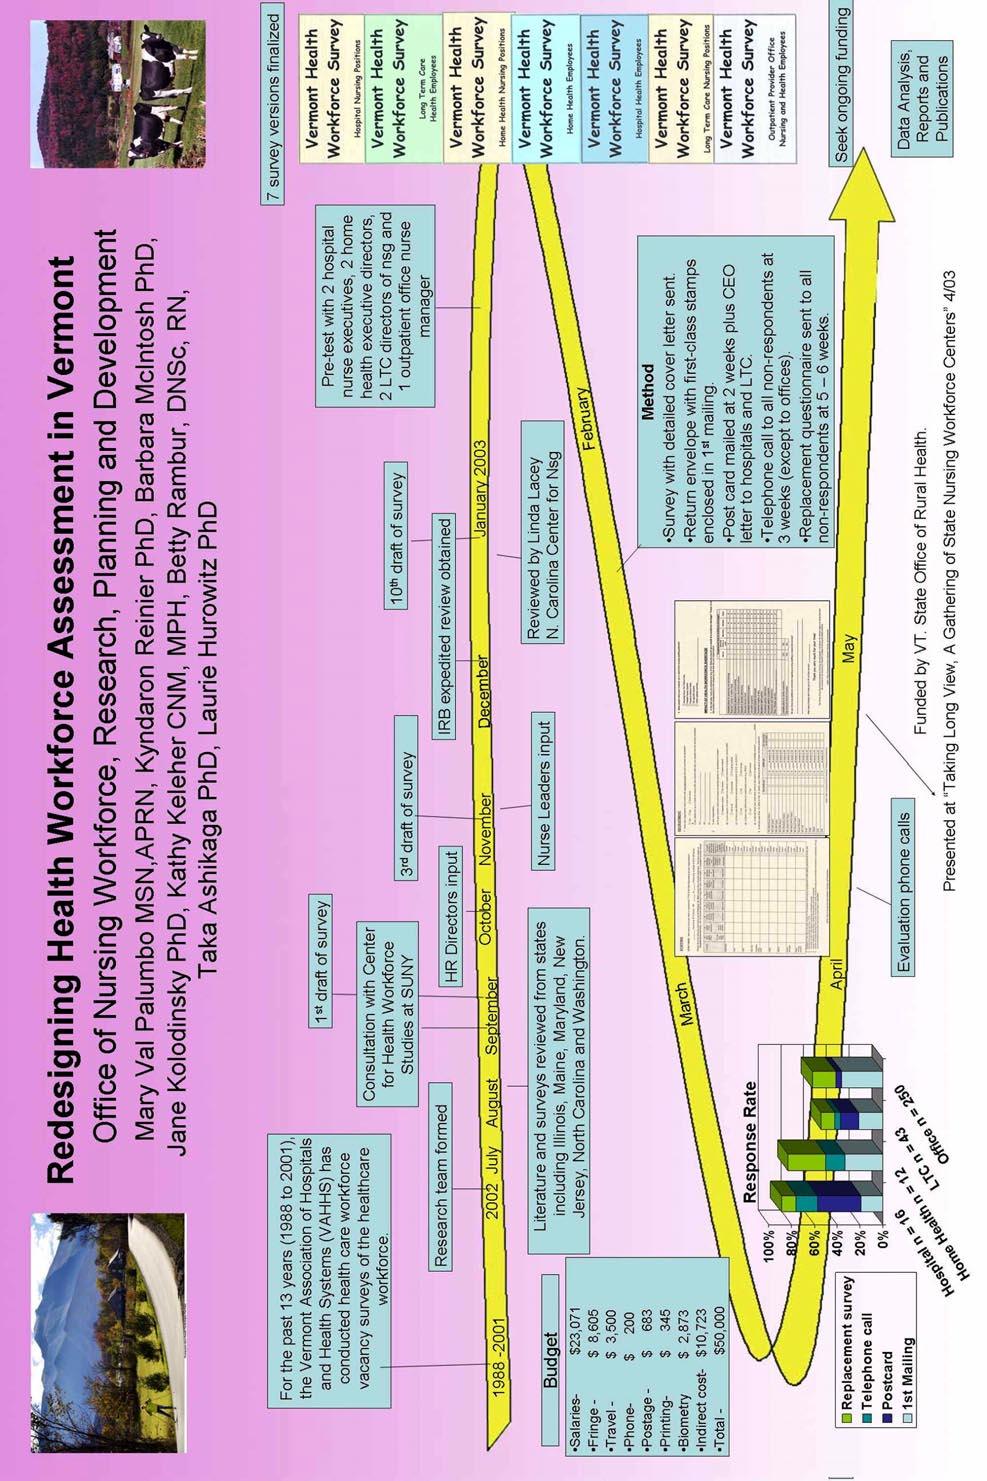
64
Full-time Equivalents and Financial Costs Associated with Absenteeism, Overtime, and Involuntary Part-time Employment in the Nursing Profession
 Full-time Equivalents and Financial Costs Associated with Absenteeism, Overtime, and Involuntary Part-time Employment in the Nursing Profession A Report prepared for the Canadian Nursing Advisory Committee
STAFFING: The Pivotal Role of RNs
 STAFFING: The Pivotal Role of RNs RN Staffing Standards: Medicare Requirements and the Joint Commission Standards November 16, 2007 Patients go to the hospital for an intervention and stay in the hospital
South Carolina Nursing Education Programs August, 2015 July 2016
 South Carolina Nursing Education Programs August, 2015 July 2016 Acknowledgments This document was produced by the South Carolina Office for Healthcare Workforce in the South Carolina Area Health Education
Chapter 39. Nurse Staffing, Models of Care Delivery, and Interventions
 Chapter 39. Nurse Staffing, Models of Care Delivery, and Interventions Jean Ann Seago, Ph.D., RN University of California, San Francisco School of Nursing Background Unlike the work of physicians, the
Survey of Nurse Employers in California 2014
 Survey of Nurse Employers in California 2014 Conducted by UCSF Philip R. Lee Institute for Health Policy Studies, California Institute for Nursing & Health Care, and the Hospital Association of Southern
Pathway to Excellence in Long Term Care Organization Demographic Form (ODF) Instructions
 Instructions") 8515 Georgia Ave., Suite 400 Silver Spring, MD 20910 1.800.284.2378 nursecredentialing.org INTRODUCTION Pathway to Excellence in Long Term Care Organization Demographic Form (ODF) Instructions The Pathway
8515 Georgia Ave., Suite 400 Silver Spring, MD 20910 1.800.284.2378 nursecredentialing.org INTRODUCTION Pathway to Excellence in Long Term Care Organization Demographic Form (ODF) Instructions The Pathway
Health Workforce Recruitment and Retention Survey 2014
 Health Workforce Recruitment and Retention Survey 2014 Preliminary Data from the Hospital Survey John Packham, PhD Director of Health Policy Research Office of Statewide Initiatives University of Nevada
Primary Care Workforce Survey Scotland 2017
 Primary Care Workforce Survey Scotland 2017 A Survey of Scottish General Practices and General Practice Out of Hours Services Publication date 06 March 2018 An Official Statistics publication for Scotland
The Vermont Primary Care Workforce
 The Vermont Primary Care Workforce 2013 SNAPSHOT workforce continues to show improvement but shortage in adult PRIMARY CARE persists Franklin Grand Isle Lamoille Orleans Essex Caledonia Chittenden Washington
How Does Payroll-Based Journal Reporting Impact Your Five Star? Don Feige, ezpbj
 How Does Payroll-Based Journal Reporting Impact Your Five Star? Don Feige, ezpbj About Our Speaker ezpbj provides easy-to-use software to manage all aspects of Payroll-Based Journal reporting ezpbj assembles,
Issue Brief. Maine s Health Care Workforce. January Maine s Unique Challenge. Current State of Maine s Health Care Workforce
 January 2009 Issue Brief Maine s Health Care Workforce Affordable, quality health care is critical to Maine s continued economic development and quality of life. Yet substantial shortages exist at almost
Chapter F - Human Resources
 F - HUMAN RESOURCES MICHELE BABICH Human resource shortages are perhaps the most serious challenge fac Canada s healthcare system. In fact, the Health Council of Canada has stated without an appropriate
Survey of Health Care Employers in Arizona: Long-Term Care Facilities, 2015
 Survey of Health Care Employers in Arizona: Long-Term Care Facilities, 2015 June 22, 2016 Prepared by: Lela Chu Joanne Spetz, PhD University of California, San Francisco 3333 California Street, Suite 265
Registered Nurses. Population
 The Registered Nurse Population Findings from the 2008 National Sample Survey of Registered Nurses September 2010 U.S. Department of Health and Human Services Health Resources and Services Administration
2017 LeadingAge Illinois Annual Salary and Benefits Survey
 2017 LeadingAge Illinois Annual Salary and Benefits Survey Welcome to the LeadingAge Illinois 2017 Salary and Benefits Survey! For your convenience, please use this worksheet to collect and prepare your
The Northwest Minnesota Health Professions Study: An Analysis
 The Northwest Minnesota Health Professions Study: An Analysis The Northwest Minnesota Health Professions Study: An Analysis - Development and publication of this analysis sponsored by: University of Minnesota
RURAL HEALTH RESEARCH POLICY ANALYSIS CENTER. A Primer on the Occupational Mix Adjustment to the. Medicare Hospital Wage Index. Working Paper No.
 N C RURAL HEALTH RESEARCH & POLICY ANALYSIS CENTER A Primer on the Occupational Mix to the Medicare Hospital Wage Index Working Paper No. 86 September, 2006 725 MARTIN LUTHER KING JR. BLVD. CB #7590 THE
Will PBJ erase your star rating?
 Will PBJ erase your star rating? How Payroll-Based Journal reporting impacts your Five-Star Carl Moellenkamp, CPA, CliftonLarsonAllen Don Feige, ezpbj Housekeeping 1. If you are experiencing technical
Staffing and Scheduling
 Staffing and Scheduling 1 One of the most critical issues confronting nurse executives today is nurse staffing. The major goal of staffing and scheduling systems is to identify the need for and provide
ALLIED HEALTH VACANCY REPORT
 May 2005 ALLIED HEALTH VACANCY REPORT by Rebecca Livengood, MSPH; Erin Fraher, MPP; and Susan Dyson, MHA INTRODUCTION One of the primary goals of the Council for Allied Health in North Carolina is to ensure
State of Kansas Department of Social and Rehabilitation Services Department on Aging Kansas Health Policy Authority
 State of Kansas Department of Social and Rehabilitation Services Department on Aging Kansas Health Policy Authority Notice of Proposed Nursing Facility Medicaid Rates for State Fiscal Year 2010; Methodology
RADIATION THERAPISTS
 RADIATION THERAPISTS Recruiting in the continental U.S. for Experienced Allied Health Professionals, as YOUR employees AHP is is NOT a Foreign Recruiter NOR a Travel or Temporary Agency. AHP ALLIED HEALTH
School of Public Health University at Albany, State University of New York
 2017 A Profile of New York State Nurse Practitioners, 2017 School of Public Health University at Albany, State University of New York A Profile of New York State Nurse Practitioners, 2017 October 2017
2016 GEORGIA WORKFORCE REPORT. Published by Compdata Surveys & Consulting on behalf of the Georgia Hospital Association
 2016 GEORGIA WORKFORCE REPORT Published by Compdata Surveys & Consulting on behalf of the Georgia Hospital Association TABLE OF CONTENTS Introduction...1 Labor Force & Employment Levels...2 & Rates by
The State of the Allied Health Workforce in North Carolina
 The State of the Allied Health Workforce in North Carolina Erin Fraher, MPP Director, NC HPDS Phillip Summers, MPH Research Assistant Katie Gaul, MA Research Associate Stephen Rutledge Research Assistant
2015 Georgia Workforce Report. Published by Compdata Surveys on behalf of the Georgia Hospital Association
 2015 Georgia Workforce Report Published by Compdata Surveys on behalf of the Georgia Hospital Association TABLE OF CONTENTS Introduction...1 Labor Force & Employment Levels...2 & Rates by Position...5
THE CENTER FOR RURAL HEALTH
 P a g e 1 THE CENTER FOR RURAL HEALTH The Center for Rural Health (CRH), established in 198, is one of the nation s most experienced organizations committed to providing leadership in rural health. Their
Electronic Staffing Data Submission Payroll-Based Journal
 Centers for Medicare & Medicaid Services Electronic Staffing Data Submission Payroll-Based Journal Long-Term Care Facility Policy Manual Version 1.0 April 2015 TABLE OF CONTENTS Chapter 1: Overview 1.1
HSU RN-BSN Program Proposal
 HSU RN-BSN Program Proposal Background: Former generic HSU nursing program was prelicensure students take licensing exam after graduation, regardless of degree earned. CR nursing program is also pre-licensure
Survey of Health Care Employers in Arizona: Home Health Agencies, 2015
 Survey of Health Care Employers in Arizona: Home Health Agencies, 2015 July 15, 2016 Prepared by: Lela Chu Joanne Spetz, PhD University of California, San Francisco 3333 California Street, Suite 265 San
2018 GEORGIA WORKFORCE REPORT. Published by Compdata Surveys & Consulting on behalf of the Georgia Hospital Association
 2018 GEORGIA WORKFORCE REPORT Published by Compdata Surveys & Consulting on behalf of the Georgia Hospital Association TABLE OF CONTENTS Introduction... 1 Labor Force & Employment Levels... 2 Vacancy &
Supply and Demand of Health Care Workers in Minnesota. Speaker: Teri Fritsma Wednesday, March 8, :35 3:20 p.m.
 Supply and Demand of Health Care Workers in Minnesota Speaker: Teri Fritsma Wednesday, March 8, 2017 2:35 3:20 p.m. Teri Fritsma Teri Fritsma is a senior research analyst for the Minnesota Department of
Licensed Nurses in Florida: Trends and Longitudinal Analysis
 Licensed Nurses in Florida: 2007-2009 Trends and Longitudinal Analysis March 2009 Addressing Nurse Workforce Issues for the Health of Florida www.flcenterfornursing.org March 2009 2007-2009 Licensure Trends
Current policy context of safe staffing in A&E Departments
 Current policy context of safe staffing in A&E Departments Howard Catton, Head of Policy and International Affairs Hallam Conference Centre, London -18 th May 2015 Why is safe staffing so important? Right
Industry Profiles Health Care
 Industry Profiles Health Care The Health Care cluster includes industries that provide for the health and well-being of Pennsylvania residents. Direct patient care forms the cornerstone of this cluster.
RADIATION THERAPY STAFFING SURVEY 2007
 RADIATION THERAPY STAFFING SURVEY 2007 A Nationwide Survey of Radiation Therapy Facility Managers and Directors Conducted by The American Society of Radiologic Technologists Reported October 2007 Copyright
7/02 New Hampshire Nursing Workforce Initiative Executive Summary Report
 7/02 New Hampshire Nursing Workforce Initiative Executive Summary Report Authors Kathy Bizarro, BS, Foundation for Healthy Communities Shawn LaFrance, MS, MPH, (Project Director), Foundation for Healthy
Nursing and Personal Care: Funding Increase Survey
 Nursing and Personal Care: Funding Increase Survey Prepared for: Ministry of Health and Long-Term Care Long Term Care Facilities Branch 5 th Floor, Hepburn Block 80 Grosvenor Street Toronto, Ontario Prepared
"Nurse Staffing" Introduction Nurse Staffing and Patient Outcomes
 "Nurse Staffing" A Position Statement of the Virginia Hospital and Healthcare Association, Virginia Nurses Association and Virginia Organization of Nurse Executives Introduction The profession of nursing
F-999 Health Professional Shortage Areas (HPSAs) and Physician Scarcity Areas (PSAs): Bonus Payments for Health Care Professionals
 and Physician Scarcity Areas (PSAs): Bonus Payments for Health Care Professionals") Oklahoma Cooperative Extension Service F-999 Health Professional Shortage Areas (HPSAs) and Physician Scarcity Areas (PSAs): Bonus Payments for Health Care Professionals Brian Whitacre, Ph.D. Assistant
Oklahoma Cooperative Extension Service F-999 Health Professional Shortage Areas (HPSAs) and Physician Scarcity Areas (PSAs): Bonus Payments for Health Care Professionals Brian Whitacre, Ph.D. Assistant
Mandatory Nurse Staffing Models for Patient Safety Linda Silas Canadian Federation of Nurses Unions
 Mandatory Nurse Staffing Models for Patient Safety Linda Silas Canadian Federation of Nurses Unions April 13, 2013 Honor Society of Nursing, Sigma Theta Tau International Health care institutions are running
Working Paper Series
 The Financial Benefits of Critical Access Hospital Conversion for FY 1999 and FY 2000 Converters Working Paper Series Jeffrey Stensland, Ph.D. Project HOPE (and currently MedPAC) Gestur Davidson, Ph.D.
Forecasts of the Registered Nurse Workforce in California. June 7, 2005
 Forecasts of the Registered Nurse Workforce in California June 7, 2005 Conducted for the California Board of Registered Nursing Joanne Spetz, PhD Wendy Dyer, MS Center for California Health Workforce Studies
Florida Post-Licensure Registered Nurse Education: Academic Year
 Florida Post-Licensure Registered Nurse Education: Academic Year 2016-2017 The information below represents the key findings regarding the post-licensure (RN-BSN, Master s, Doctorate) nursing education
Nursing Resources, Workload, the Work Environment and Patient Outcomes
 Nursing Resources, Workload, the Work Environment and Patient Outcomes NDNQI Conference 2010 Christine Duffield, Michael Roche, Donna Diers Study Team Professor Christine Duffield Michael Roche Professor
Models of Support in the Teacher Induction Scheme in Scotland: The Views of Head Teachers and Supporters
 Models of Support in the Teacher Induction Scheme in Scotland: The Views of Head Teachers and Supporters Ron Clarke, Ian Matheson and Patricia Morris The General Teaching Council for Scotland, U.K. Dean
2017 Louisiana Nursing Education Capacity Report and 2016 Nurse Supply Addendum Report
 217 Louisiana Education Capacity Report and 216 Nurse Supply Addendum Report Louisiana State Board of Center for 217 Louisiana Education Capacity Report and 216 Nurse Supply Addendum Report Executive Summary
Nurse-to-Patient Ratios
 N U R S I N G M A T T E R S Nursing Matters fact sheets provide quick reference information and international perspectives from the nursing profession on current health and social issues. Nurse-to-Patient
DIRECT CARE STAFF ADJUSTMENT REPORT MEDICAID-PARTICIPATING NURSING HOMES
 DIRECT CARE STAFF ADJUSTMENT REPORT MEDICAID-PARTICIPATING NURSING HOMES Division of Medicaid Agency for Health Care Administration March 2001 TABLE OF CONTENTS Background... 1 Implementation... 1 Methodology...
2016 National Healthcare Retention & RN Staffing Report
 Permanent Nurses, Permanent Solutions! 2016 National Healthcare Retention & RN Staffing Report Published by: NSI www.nsinursingsolutions.com. Preface We are proud to present the annual National Healthcare
Bell Work. Fill out the Career/Personality Survey
 Bell Work Fill out the Career/Personality Survey Medical Therapeutics- Careers Christy Cook, R. T. (R) Standards (1) Differentiate career pathways within the Therapeutic cluster. Using supporting evidence
Health Workforce Demand in Nevada Presented to the Western Interstate Commission for Higher Education (WICHE)
") Health Workforce Demand in Nevada Presented to the Western Interstate Commission for Higher Education (WICHE) Tabor Griswold, PhD Office of Statewide Initiatives University of Nevada School of Medicine
Health Workforce Demand in Nevada Presented to the Western Interstate Commission for Higher Education (WICHE) Tabor Griswold, PhD Office of Statewide Initiatives University of Nevada School of Medicine
Detailed Charts From The North Dakota Hospital Survey Results:
 1/28/1 Detailed Charts From The North Dakota Hospital Survey Results: Workforce Gary Hart, PhD Shawnda Schroeder, PhD September 214 Center for Health School of Medicine and Health Sciences University of
Final Report No. 101 April Trends in Skilled Nursing Facility and Swing Bed Use in Rural Areas Following the Medicare Modernization Act of 2003
 Final Report No. 101 April 2011 Trends in Skilled Nursing Facility and Swing Bed Use in Rural Areas Following the Medicare Modernization Act of 2003 The North Carolina Rural Health Research & Policy Analysis
The adult social care sector and workforce in. North East
 The adult social care sector and workforce in 2015 Published by Skills for Care, West Gate, 6 Grace Street, Leeds LS1 2RP www.skillsforcare.org.uk Skills for Care 2016 Copies of this work may be made for
Wisconsin Hospital Association 2014 Workforce Report. Wisconsin Health Care Workforce 2014 Report
 Wisconsin Hospital Association 2014 Workforce Report Wisconsin Health Care Workforce 2014 Report Front cover photo courtesy of Stoughton Hospital Stoughton Hospital rehab staff Robert Komes and April Swenson
North Dakota Nursing Needs Study: Year Four Results and Comparisons
 North Dakota Nursing Needs Study: Year Four Results and Comparisons Patricia Moulton, Ph.D. Presentation for the North Dakota State Board of Nursing July 21, 2006 C H R Overview of the North Dakota Nursing
Labor Availability and Health Care Costs
 Labor Availability and Health Care Costs Minnesota Department of Health Report to the Minnesota Legislature October, 2002 Health Policy and Systems Compliance Division Health Economics Program PO Box 64975
Table of Contents. Overview. Demographics Section One
 Table of Contents Overview Introduction Purpose... x Description... x What s New?... x Data Collection... x Response Rate... x How to Use This Report Report Organization... xi Appendices... xi Additional
HEALTH PROFESSIONAL WORKFORCE
 HEALTH PROFESSIONAL WORKFORCE (SECTION-BY-SECTION ANALYSIS) (Information compiled from the Democratic Policy Committee (DPC) Report on The Patient Protection and Affordable Care Act and the Health Care
Trends in the Use of Contract Labor among Hospitals
 Trends in the Use of among Hospitals A study by: Paul Shoemaker President and CEO American Hospital Directory, Inc. www.ahd.com Douglas H. Howell Senior Vice President, Organization and Performance Norton
All Health Care Salary Survey
 2014 All Health Care Salary Survey Executive Summary 8575 164 th Ave NE, Suite 100 Redmond, WA 98052 USA Telephone: 877.210.6563 Fax: 877.239.2457 Email: survey.sales@erieri.com www.salary surveys.erieri.com
Nurse Staffing at North Carolina State Prisons Plans to Attract and Retain
 North Carolina Department of Public Safety Prevent. Protect. Prepare. Nurse Staffing at North Carolina State Prisons Plans to Attract and Retain Presentation to the Joint Legislative Oversight Committee
CONTRA COSTA COUNTY CIVIL GRAND JURY REPORT NO "Mental Health Services for At-Risk Children in Contra Costa County
 CONTRA COSTA COUNTY CIVIL GRAND JURY REPORT NO. 1703 "Mental Health Services for At-Risk Children in Contra Costa County BOARD OF SUPERVISORS RESPONSE FINDINGS California Penal Code Section 933.05(a) requires
Health Workforce Data Collection: Findings from a Survey of States
 Health Workforce Data Collection: Findings from a Survey of States Morgan Clifford Research Support Specialist Health Workforce Technical Assistance Center School of Public Health University at Albany,
2012 SURVEY OF REGISTERED NURSES AMN HEALTHCARE, INC., 2012 JOB SATISFACTION, CAREER PATTERNS AND TRAJECTORIES
 We ve earned The Joint Commission s Gold Seal of Approval 2012 SURVEY OF REGISTERED NURSES AMN HEALTHCARE, INC., 2012 12400 High Bluff Drive, San Diego, CA 92130 JOB SATISFACTION, CAREER PATTERNS AND TRAJECTORIES
Child Protective Investigator and Child Protective Investigator Supervisor Educational Qualifications, Turnover, and Working Conditions Status Report
 and Supervisor Educational Qualifications, Turnover, and Working Conditions Status Report ANNUAL REPORT Department of ren and Families Office of Welfare Mike Carroll Secretary Rick Scott Governor Contents
2018 National Health Care Retention & RN Staffing Report
 Permanent Nurses, Permanent Solutions! 2018 National Health Care Retention & RN Staffing Report Published by: NSI www.nsinursingsolutions.com. Preface We are proud to present the annual National Health
Worsening Shortages and Growing Consequences: CNO Survey on Nurse Supply and Demand
 Worsening Shortages and Growing Consequences: CNO Survey on Nurse Supply and Demand INTRODUCTION Healthcare organizations face growing challenges in finding the nurses they need, according to nurse leaders,
Healthcare- Associated Infections in North Carolina
 2018 Healthcare- Associated Infections in North Carolina Reference Document Revised June 2018 NC Surveillance for Healthcare-Associated and Resistant Pathogens Patient Safety Program NC Department of Health
Analysis of Nursing Workload in Primary Care
 Analysis of Nursing Workload in Primary Care University of Michigan Health System Final Report Client: Candia B. Laughlin, MS, RN Director of Nursing Ambulatory Care Coordinator: Laura Mittendorf Management
Inventory of State Health Workforce Data Collection
 2016 Inventory of State Health Workforce Data Collection Center for Health Workforce Studies School of Public Health University at Albany, State University of New York Inventory of State Health Workforce
Alberta Ministry of Labour 2017 Alberta Wage and Salary Survey
 Alberta Ministry of Labour 2017 Alberta Wage and Salary Survey The Alberta Wage and Salary Survey is undertaken by the Alberta Ministry of Labour to provide current wage rates and skill shortage information
Health Care Degrees and Certificate Programs Flexible and affordable degree programs for health care careers
 ONLINE HEALTH CARE DEGREE PROGRAMS Health Care Degrees and Certificate Programs Flexible and affordable degree programs for health care careers Quality Online, Accredited Educational Programs for Health
Psychological Specialist
 Job Code: 067 Psychological Specialist Overtime Pay: Ineligible This is work performing psychological assessments or counseling students. Administers intelligence and personality tests. Provides consultation
INCREASE ACCESS TO PRIMARY CARE SERVICES BY ALLOWING ADVANCED PRACTICE REGISTERED NURSES TO PRESCRIBE
 INCREASE ACCESS TO PRIMARY CARE SERVICES BY ALLOWING ADVANCED PRACTICE REGISTERED NURSES TO PRESCRIBE Both nationally and in Texas, advanced practice registered nurses have helped mitigate the effects
Nursing Education Capacity and Nursing Supply in Louisiana Louisiana State Board of Nursing Center for Nursing
 Nursing Education Capacity and Nursing Supply in Louisiana Louisiana State Board of Nursing Center for Nursing 2011 Executive Summary Nursing Education Capacity and Supply in Louisiana 2010-2011 This report
PA Education Worldwide
 Physician Assistants: Past and Future Roderick S. Hooker, PhD, MBA, PA October 205 Oregon Society of Physician Assistants PA Education Worldwide Health Workforce North America 204 US Canada Population
2013 Physician Inpatient/ Outpatient Revenue Survey
 Physician Inpatient/ Outpatient Revenue Survey A survey showing net annual inpatient and outpatient revenue generated by physicians in various specialties on behalf of their affiliated hospitals Merritt
California Health Workforce Alliance Presentation
 California Health Workforce Alliance Presentation May 15, 2015 Andrea Perry Workforce Planning Specialist Cedars-Sinai Health System Laura Long, Committee Chair Director, National Workforce Planning and
SENATE, No. 989 STATE OF NEW JERSEY. 218th LEGISLATURE INTRODUCED JANUARY 16, 2018
 SENATE, No. STATE OF NEW JERSEY th LEGISLATURE INTRODUCED JANUARY, 0 Sponsored by: Senator JOSEPH F. VITALE District (Middlesex) Senator LORETTA WEINBERG District (Bergen) Co-Sponsored by: Senator Gordon
STATE OF KANSAS DEPARTMENT FOR AGING AND DISABILITY SERVICES OSAWATOMIE STATE HOSPITAL OPERATIONS ASSESSMENT EXECUTIVE SUMMARY
 STATE OF KANSAS DEPARTMENT FOR AGING AND DISABILITY SERVICES OSAWATOMIE STATE HOSPITAL OPERATIONS ASSESSMENT Prepared by: THE BUCKLEY GROUP, L.L.C. OVERVIEW The Osawatomie State Hospital (OSH) in Osawatomie
Practice nurses in 2009
 Practice nurses in 2009 Results from the RCN annual employment surveys 2009 and 2003 Jane Ball Geoff Pike Employment Research Ltd Acknowledgements This report was commissioned by the Royal College of Nursing
Quality Management Building Blocks
 Quality Management Building Blocks Quality Management A way of doing business that ensures continuous improvement of products and services to achieve better performance. (General Definition) Quality Management
INDUSTRY PERSPECTIVES
 INDUSTRY PERSPECTIVES 5 Reasons Clients Are Frustrated with Locums Agencies Stasi Crump, Marketing Consultant, Delta Locum Tenens WHAT MAKES ONE LOCUMS AGENCY MORE SUCCESSFUL THAN ANOTHER? WHAT DO IN-HOUSE
The adult social care sector and workforce in. Yorkshire and The Humber
 The adult social care sector and workforce in Yorkshire and The Humber 2015 Published by Skills for Care, West Gate, 6 Grace Street, Leeds LS1 2RP www.skillsforcare.org.uk Skills for Care 2016 Copies of
NURSING WORKLOAD AND WORKFORCE PLANNING PAEDIATRIC QUESTIONNAIRE
 NURSING WORKLOAD AND WORKFORCE PLANNING PAEDIATRIC QUESTIONNAIRE INSTRUCTIONS FOR COMPLETION IN EXCEL Please complete this questionnaire electronically. Questions should be answered by either entering
An Assessment of Community Health Centers Involvement in Health Professions and Residency Training: A Chartbook
 An Assessment of Community Health Centers Involvement in Health Professions and Residency Training: A Chartbook National Association of Community Health Centers, 2011 For more information, email research@nachc.com.
How Are Washington State s Hospitals Affected by the Nursing Shortage? Results of a 2001 Survey
 May 2002 Working Paper #68 How Are Washington State s Hospitals Affected by the Nursing Shortage? Results of a 2001 Survey by Susan M. Skillman, M.S. Troy Hutson, R.N., J.D. C. Holly A. Andrilla, M.S.
DELAWARE FACTBOOK EXECUTIVE SUMMARY
 DELAWARE FACTBOOK EXECUTIVE SUMMARY DaimlerChrysler and the International Union, United Auto Workers (UAW) launched a Community Health Initiative in Delaware to encourage continued improvement in the state
BENCHMARKING FOR ORGANIZATIONAL EXCELLENCE IN ADDICTION TREATMENT
 BENCHMARKING FOR ORGANIZATIONAL EXCELLENCE IN ADDICTION TREATMENT Operational Benchmarks 1. Initial Access Initial Access Average number of calendar days between date of first contact and date of initial
BAPTIST HEALTH SCHOOLS LITTLE ROCK-SCHOOL OF NURSING NSG 4027: PROFESSIONAL ROLES IN NURSING PRACTICE
 BAPTIST HEALTH SCHOOLS LITTLE ROCK-SCHOOL OF NURSING NSG 4027: PROFESSIONAL ROLES IN NURSING PRACTICE M1 ORGANIZATION PROCESSES AND DIVERSIFIED HEALTHCARE DELIVERY 2007 LECTURE OBJECTIVES: 1. Analyze economic,
Trends in the Supply and Distribution of the Health Workforce in North Carolina
 Trends in the Supply and Distribution of the Health Workforce in North Carolina Erin Fraher, PhD MPP Director Program on Health Workforce Research & Policy Cecil G. Sheps Center for Health Services Research,
Long Term Care Briefing Virginia Health Care Association August 2009
 Long Term Care Briefing Virginia Health Care Association August 2009 2112 West Laburnum Avenue Suite 206 Richmond, Virginia 23227 www.vhca.org The Economic Impact of Virginia Long Term Care Facilities
New Brunswick Nurses Union Text for all changes proposed in Tentative Agreement January 2013
 New Brunswick Nurses Union Text for all changes proposed in Tentative Agreement January 2013 Changes are only those that are underlined or crossed out. Article 3 Definitions 3.13 Seniority is a measurement
Wisconsin s Health Care Workforce Report 2008
 Wisconsin s Health Care Workforce Report 2008 A report by the Wisconsin Hospital Association Wisconsin s Health Care Workforce Report 2008 A report by the Wisconsin Hospital Association Table of Contents
2018 MGMA Practice Operations Survey Guide
 2018 MGMA Practice Operations Survey Guide Due Date: April 13, 2018 This document is intended to serve as a guide for completing the 2018 MGMA Practice Operations Survey. An explanation of each survey
Minnesota s Respiratory Therapist Workforce, 2016
 OFFICE OF RURAL HEALTH AND PRIMARY CARE Minnesota s Respiratory Therapist Workforce, 2016 HIGHLIGHTS FROM THE 2016 RESPIRATORY THERAPIST SURVEY Table of Contents Minnesota s Respiratory Therapist Workforce,
EMERGENCY DEPARTMENT DIVERSIONS, WAIT TIMES: UNDERSTANDING THE CAUSES
 EMERGENCY DEPARTMENT DIVERSIONS, WAIT TIMES: UNDERSTANDING THE CAUSES Introduction In 2016, the Maryland Hospital Association began to examine a recent upward trend in the number of emergency department
The Nursing Workforce: Challenges for Community Health Centers and the Nation s Well-being
 The Nursing Workforce: Challenges for Community Health Centers and the Nation s Well-being Jane K Kadohiro, DrPH, APRN, CDE University of Hawaii at Manoa Overview Today s nursing workforce Determinants