OHE guide to uk HEaltH and HEaltH CarE StatiStiCS
|
|
|
- Frank Riley
- 6 years ago
- Views:
Transcription
1 OHE guide to uk HEaltH and HEaltH CarE StatiStiCS JULY 2011 BY EMMA HAWE, PETER YUEN AND LESLEY BAILLIE
2 British Library Cataloguing in Publication Data A catalogue record for this book is available from the British Library. ISBN-13: Acknowledgements - Office of Health Economics All rights reserved. Unless where stated as information licensed to be reproduced by OHE belonging to a third party. No part of the to UK Health and Health Care Statistics may be reproduced, resold, stored in a retrieval system, or transmitted in any form or by any means electronic or mechanical, including photocopying, scanning and recording for any purpose other than the purchaser s personal use, without the written permission of the Office of Health Economics. Where we have identified any third party copyright material you will need to obtain permission from the copyright holders concerned. OHE uses its best endeavours to ensure that the contains fair and accurate representation or interpretation of the original material from which the is drawn, but OHE shall not, for any reason whatsoever, be responsible for any damage, loss, cost, claim or expense incurred by a user as a result of its use or interpretation of, or reliance upon, any material contained in the. Copyright 2011 Office of Health Economics (OHE).
3 Contents List of tables and figures Introduction... i 1 Population Population statistics Population estimates Population projections... 5 Population Key sources and information Mortality statistics Mortality Key sources and information Life expectancy Life expectancy Key sources and information Morbidity Primary and secondary care health information Health surveys Healthy life expectancy Morbidity Key sources and information Lifestyle factors Lifestyle factors Key sources and information Health care expenditure Total health care expenditure Total health care expenditure in the UK International health care expenditure International Key sources and information NHS expenditure NHS structure Reporting NHS expenditure NHS funding Components of NHS expenditure Cost of hospital services Payment by Results and national tariff (England) NHS Reference Costs... 54
4 2.2.8 Healthcare Resource Groups (HRGs) Cost of the Family Health Services NHS expenditure Key sources and information Private health care expenditure Private health expenditure Key sources and information Hospital activity and workforce NHS hospital services statistics Health services information collection NHS workforce statistics NHS workforce classification HCHS medical and dental staff HCHS non-medical staff Hospital workforce Key sources and information NHS Hospital and Community Health Services (HCHS) activity Hospital activity data Hospital admitted patient care (APC) patient-level information Hospital Episode Statistics (HES) Hospital inpatient activity Key sources and information NHS available and occupied hospital beds Hospital beds data Key sources and information Day cases Outpatient attendances and other hospital activities Hospital outpatient and day cases Key sources and information Hospital waiting times Outpatient waiting times Inpatient waiting times Total waiting times Hospital waiting times Key sources and information Community care Community care Key sources and information Family Health Services activity and workforce Family Health Services (FHS) statistics FHS Key sources and information General Medical Services (GMS)
5 4.2.1 GMS data sources GMS workforce statistics The new GMS contract Quality and Outcomes Framework Estimating the number of GP consultations GMS Key sources and information General Pharmaceutical Services (GPS) The Drug Tariff The NHS medicines bill Community pharmacy Prescribing in the community Prescription charges Prescription statistics NHS Prescription Services system Prescription Analysis and Cost Tabulation (PACT) Prescription Cost Analysis (PCA) Branded and generic prescribing GPS Key sources and information General Dental Services (GDS) Dental and dentistry statistics GDS Key sources and information General Ophthalmic Services (GOS) Ophthalmic statistics GOS Key sources and information Glossary References Index
6 List of tables and figures Section 1 Population Population Table 1.1 UK resident population and projections by age group, Table 1.2 UK resident population and projections by sex and country, Figure 1.1 Natural change in the UK population 2001/ /09 6 Figure 1.2 Trends and projections for characteristics of the UK population, Table 1.3 Total and projected population of OECD and EU countries, Mortality Table 1.4 Number of deaths by main cause, sex and country, UK, Table 1.5 Table 1.6 Crude death rates per 100,000 population for leading causes of death, UK, Age standardised mortality rates (per 100,000 population) for all causes, by sex and country, Table 1.7 Age specific mortality rates per 1,000 population, UK, Morbidity Table 1.8 Life expectancy at birth and at age 65, by sex, by country, UK, Table 1.9 Longstanding illness by age and sex, Great Britain, Table 1.10 Residual healthy life expectancy in years at birth and at age 65, by country, UK, Lifestyle factors Table 1.11 Prevalence of cigarette smoking by sex and age, Great Britain, Figure 1.3 Percentage who drank more than 3 or 4 units of alcohol on a least one day in the last week, by sex and country, Figure 1.4 Trends in overweight and obesity prevalence, England, Section 2 Health care expenditure Total health care expenditure in the UK Table 2.1 Total health care expenditure, UK, 1973/ /11 31
7 Figure 2.1 NHS pay and prices index and GDP deflator index, 1975/ /10 33 Figure 2.2 Figure 2.3 Relationship between total UK health care expenditure and GDP, 1973/ /10 34 Total health care expenditure per capita and public and private health care expenditure as a percentage of GDP in OECD and EU countries, circa NHS expenditure Table 2.2 GDP and NHS expenditure, and per capita, UK, 1949/ /11 41 Table 2.3 Table 2.4 NHS net expenditure (revenue and capital) per capita and per household, UK, 1975/ /11 43 Gross NHS expenditure by Programme Budget categories, 2006/ /09 45 Table 2.5 NHS sources of finance, Figure 2.4 NHS patient charges, UK, 2009/10 48 Figure 2.5 UK NHS gross expenditure by service, 1990/ /07 51 Table 2.6 NHS hospital and community gross expenditure (revenue and capital) per capita, UK, 1991/ /09 53 Table 2.7 Reference costs per FCE and average length of stay of top 10 Healthcare Resource Groups (HRGs) ranked by total cost, elective inpatients, England, NHS and non-nhs providers, 2008/09 57 Table 2.8 Reference costs per FCE and average length of stay of top 10 Healthcare Resource Groups (HRGs) ranked by total cost, NHS Trusts, non-elective inpatients, England, 2008/09 58 Table 2.9 Table 2.10 Table 2.11 Reference costs per case of top 10 Healthcare Resource Groups (HRGs) ranked by total cost, day cases, England, 2008/09 Cost of Family Health Services (FHS) at 2008/09 prices, UK, 1949/ /09 61 Cost of General Medical Services (GMS), General Pharmaceutical Services (GPS), General Dental Services (GDS) and General Ophthalmic Services (GOS) per capita, UK, 1988/ /09 65 Private health care Table 2.12 Private health care and gross NHS expenditure per household, UK, Table 2.13 Number of private medical insurance subscribers, people covered and payments, UK,
8 Section 3 Hospital activity and workforce Figure 3.1 NHS data collection and dissemination process 73 Hospital workforce Table 3.1 Number of full-time equivalent staff employed in NHS hospitals and community services by category, UK, Table 3.2 Table 3.3 Table 3.4 Table 3.5 Medical and dental staff (full-time equivalents) employed in NHS hospitals, UK, Number of hospital and community medical and dental staff (full-time equivalents), by grade, England, Full-time equivalent hospital and community medical staff and consultants by selected specialty, by country, Great Britain, NHS hospital and community nursing and midwifery staff, and per 100,000 population, UK, HCHS activity Figure 3.2 Patient pathways to inpatient or day case treatment 84 Figure 3.3 Continuous inpatient spell 87 Table 3.6 Number of NHS hospital finished consultant episodes (FCEs)/ discharges and deaths, UK, /10 88 Table 3.7 Table 3.8 Table 3.9 Table 3.10 Table 3.11 Table 3.12 Inpatient finished consultant episodes (FCEs), discharges and deaths in NHS hospitals, by selected specialties, Great Britain, /10 89 Average daily number of available NHS hospital beds, UK, /10 93 Average daily occupied beds in NHS hospitals, by country, UK, /10 94 Number of hospital day cases by selected main specialty, England, 1999/ /10 98 Hospital outpatient clinics: total attendances and new cases, by country, UK, /10 99 RTT admitted (adjusted) pathways and incomplete pathways percentage of patients treated within 18 weeks, England, Section 4 Family Health Services activity and workforce Table 4.1 Family Health Services workforce (GPs, pharmacists, dentists and opticians), UK,
9 General Medical Services Table 4.2 Number of general medical practitioners (GPs including registrars) in general practice, and per 100,000 population, by country, UK, Table 4.3 Table 4.4 Average patient list size of medical practitioners (excluding GP registrars and retainers) in general practice, by country, UK, Distribution of medical practitioners (excluding GP registrars and retainers) in general practice by size of practice, UK, Table 4.5(a) Number of dispensing doctors by country, UK, Table 4.5(b) Number of NHS prescription items dispensed by dispensing doctors by country, UK, Table 4.6 Quality and Outcomes Framework indicators 119 Table 4.7 Average number of NHS GP consultations per person per year by age of patient; GB, General Pharmaceutical Services Table 4.8 Estimated total NHS expenditure on pharmaceuticals at manufacturers' prices, UK, Figure 4.1 Table Proportion of NHS prescriptions exempt from the prescription charge, England, Number of NHS prescriptions (based on fees) dispensed by community pharmacists and appliance contractors and per capita, UK, Table 4.11 Total cost of NHS prescriptions dispensed, UK, Table 4.12 Number and net ingredient cost (NIC) of prescriptions by therapeutic group, UK, Figure 4.2 Figure 4.3 Market share of branded and generic prescription items dispensed by community pharmacists, England, Relationship between generic prescribing and generic dispensing, England, General Dental Services Figure 4.4 Patient dental charges and as a percentage of the gross cost of General Dental Services (GDS), UK, 1951/ / Table 4.13 Number of NHS dental practitioners, UK, Figure 4.5 Courses of dental treatment and per 1,000 people, UK, /09 148
10 General Ophthalmic Services Table 4.14 Number of opticians and per 100,000 population, UK, / Figure 4.6 Numbers of NHS sight tests and pairs of glasses supplied per 1,000 population, UK, /10 153
11 Introduction Health statistics, broadly defined, concern the health of the population and the health care services provided for them. They cover a wide range of topics ranging from statistical information about births, deaths and morbidity to health care provision in primary care and hospital treatment and the costs of providing these services. With such a diversity of information collected and disseminated by different agencies and government departments, it is not surprising to find a maze of official statistical information available in a variety of formats from different sources. Coupled with unofficial statistical publications from the voluntary or private sectors, users of health statistics can face a daunting task to find the information they are seeking. The main purpose of this is to provide up to date statistics together with a detailed description of health and health care statistics in the UK and to some extent the OECD countries. The publication is not a critique of health statistics. It serves as a guide to health information gathering, access to health care data sources and reports and the interpretation and presentation of some standard statistical measures/indicators and selected issues as well as the methodology involved in deriving them. The helps to answer the questions: Where do I look? What sorts of statistics do government and non-government bodies produce? What do they cover? How/where do I find them? If I find them, how do I use them or where do I get help and advice? The consists of four sections plus a glossary and references: Population provides a description of demographic issues covering the population Census; population estimates and projections; mortality statistics and summary measures, including life expectancy and standardisation techniques; and the collection and use of morbidity statistics and lifestyle statistics; Health care expenditure: describes total expenditure in the UK on health care, public and private; the structure and financing of the UK s National Health Service (NHS); and the costs of various activities; Hospital activity and workforce provides a detailed account of NHS data collection concentrating mainly on hospital activities, waiting times and workforce ; Family Health Services : gives details of the NHS Family Health Services, i.e. primary care services, covering general medical, pharmaceutical, dental and ophthalmic services. The tables and figures can be used on their own as up to date statistics or along with the text as a key reference guide. Each section of the publication includes: key facts and figures shown at the start of the section; and issues and points of interest, which i
12 are highlighted in boxes. Other boxes highlight selected methods. Key sources of information are summarised at the end of each section in a shaded box. However, this Guide does not provide statistical methods such as significance testing and the construction of confidence intervals. Nor does it describe graphical presentation of statistics. Readers seeking this kind of information should consult a standard textbook on statistics. It is difficult to provide a comprehensive view of health statistics in the UK. The frequent organisational changes in the NHS in recent years, coupled with the devolution of powers to the four countries of the UK, make it a challenging task to keep track of revisions related to official health statistics. As printed versions of official and unofficial reports are increasingly being phased out to be available only on the internet as downloadable documents, it is also important to keep track of the changes in web site addresses. For example in 2004 the Department of Health (DH) in England changed its internet address from to Even apparently minor changes such as this can be problematic and result in broken links. The situation was exacerbated by the introduction of the Information Centre for Health and Social Care (the Information Centre) for England in 2005, which has taken over the statistical functions of the DH. We have endeavoured to include in the the most up to date web page addresses available at the time of publication. 1. Statistical data relate mainly to the UK. Where figures are for Great Britain or for individual countries of the UK only, this is indicated in the relevant table or chart. 2. Rounding of numbers may lead to minor inconsistencies between the sum of constituent parts and the total in some tables. 3. Throughout the, billion means one thousand million. 4. Symbols and abbreviations used: - ii
13 Further reading Kerrison S et al. (2000) Official Health Statistics: An Unofficial Guide. London: Arnold. Merry P. Wellard s NHS Handbook. East Sussex: JMH Publishing; published annually. Office for National Statistics (ONS). (2000) Guide to Official Statistics. London: TSO. Office for National Statistics (ONS). (2001) UK Health Statistics. London: TSO. Office of Health Economics. Health Statistics website. iii
14 1 Population 1.1 Population statistics Population statistics relate to the structure and dynamics of a population, nationally and sub-nationally. Accurate and timely information on the number of people and their socioeconomic and socio-demographic mix is important for both central and local government to target their resources and to plan services such as health, social services and education. Statistics are often presented per 1000 population, because rates are often more easily interpretable (see Table 1.7 for an example of per capita rate). Surveys also make use of population statistics to create weightings and gross data up to a population level, thus attempting to ensure that the weighted results more closely represent the overall population rather than the sample taken from that population. Population estimates for the UK by age group since the NHS was established in 1948 are shown in Table 1.1. A short description of ONS population estimates can be found at: Population estimates Population Selected key facts and trends The population in the UK continues to rise, estimated at 62.6m in 2011 In per cent of the population is estimated to live in England, 5 per cent in Wales, with just over 8 per cent in Scotland and approaching 3 per cent in Northern Ireland, these proportions are expected to remain broadly similar over the coming decades The most recent estimates suggest that by 2051 the population in the UK will be 77.1million The Census of Population provides a population count only at ten-yearly intervals. Thus it is important to obtain estimates of the population size in the years between Censuses (the intercensal years). Annual mid-year population estimates by age and sex, both at national and sub-national (i.e. local) level, are published by the ONS in England and Wales, the Registrar General in Scotland and the Statistics Research Agency in Northern Ireland. After each Census, the Registrar Generals in England and Wales, Scotland and Northern Ireland publish a set of base mid-year (30 th June) population estimates which are derived from the Census Day (29 th April, for the 2001 Census) population counts, with adjustments made to allow for coverage, undercounting/underenumeration and for births, deaths and migration occurring between these two dates. Table 1.1 shows population estimates for the UK by age group, and Table 1.2 shows population estimates by constituent country of the UK, both of which are published on the ONS site. 1
15 Table 1.1 UK resident population and projections by age group, Millions Age group All Year <5 < =>75 =>85 ages Projections based on 2008 mid-year population estimates Notes: Sources: Mid-year population estimates from 1982 have been revised based on the results of the 2001 Census. Data from 2002 have been revised due to improved methodology on international migration. Annual Abstract of Statistics (ONS). Population Projections Database (GAD). Population Estimates and Projections (ONS). 2
16 Population Issues and points of interest Rebasing the population estimates When a new Census based population count is introduced into the population estimates process, it is necessary to revise (rebase) the previous Census based population estimates series. This is to ensure consistency in the methodology so that there is no break in the continuity of the series. In the light of the serious shortfall of the 1991 Census, the rebased population estimates for the 1990s following the 2001 Census differ significantly from the 1991 Census based estimates. In addition to the problems of under-coverage and inaccuracy as seen in the 1991 Census, one of the major sources of error in population estimates is inaccuracy in internal migration information. This significantly affects the estimates for subnational populations involving small areas. When making comparisons between the 1991 and 2001 Census, it is important to bear in mind there are a number of differences in between the two Censuses. These include, changes in definitions, such as students being required to list their termtime address as opposed to their parents address (as was the case for the 1991 Census) and changes in geographic boundaries, which may mean that results which appear to relate to the same geographic name actually relate to different areas. In addition, results from the 2001 Census have been adjusted to account for underremuneration; this was not the case in the 1991 Census. For the 2001 Census ONS established an initiative to produce full and un-biased population estimates through the One Number Census. However, there are some concerns over certain aspects of the population estimates, including where there are areas of transient populations (such as areas with high proportions of students or military personnel), areas with low response rates and the difficulty in separating the effects of non-response from emigration. Recent revisions by ONS to the calculation of population estimates utilising new methodology with regards to international migration, have resulted in updates to previously reported estimates. An overview of the work being conducted to improve population statistics is available at: 3
17 Table 1.2 UK resident population and projections by sex and country, Millions England Wales Scotland N Ireland Year Male Female Male Female Male Female Male Female Projections based on 2008 mid-year estimates Notes: Sources: Mid-year population estimates from 1982 have been revised based on the results of the 2001 Census. England and Wales mid-year population estimates from 1992 to 2002 have been further revised in light of the local authority population studies. Figures may not sum to totals due to rounding. Annual Abstract of Statistics (ONS). Population Projections Database (GAD). Population Estimates and Projections (ONS). 4
18 1.1.2 Population projections National and local government and local health organisations need population projections to plan for future provision of health services, housing, schools and pensions (Table 1.2). These national projections are published every second year. The 2004-based projections and earlier projections were produced by the Government Actuary s Department (GAD). National projections for 2006 and 2008 were produced by the National Statistics Centre for demography within ONS in consultation with the General Register Office for Scotland, the Northern Ireland Statistics and Research Agency and the Welsh Assembly Government Statistical Directorate. At present future projections are also expected to be produced by ONS. For the UK and its constituent countries, projections are made for the next 25 years, plus longer-term projections for 40 and 70 years ahead. Sub-national UK population projections at local and health area levels are produced separately by the constituent countries: in England by ONS, in Wales by the National Assembly for Wales, in Scotland by the General Register Office for Scotland and in Northern Ireland by the Statistics and Research Agency. Projections for all countries are available on the ONS website. Population projections are made for successive years using the cohort component method, (ONS 2010), in a process similar to that used to produce the population estimates for the years between Censuses that was described in Section However, to predict the size and structure of the population at different time points in the future requires assumptions about the future levels of fertility, mortality (thus life expectancy) and migration. The principal projections (also known as medium projections) are based on assumptions derived from the most recent demographic trends analysis. Estimates of the change in these factors over the past decade are shown in Figure 1.1. The aging of the UK population is shown in Figure 1.2. Other sources of population projections also exist, for example the United Nations (UN) produces international population projections, including the UK, in its publication World Population Prospects. These are calculated under a series of different assumptions. Table 1.3 shows international population projections under medium variant assumptions, see: 5
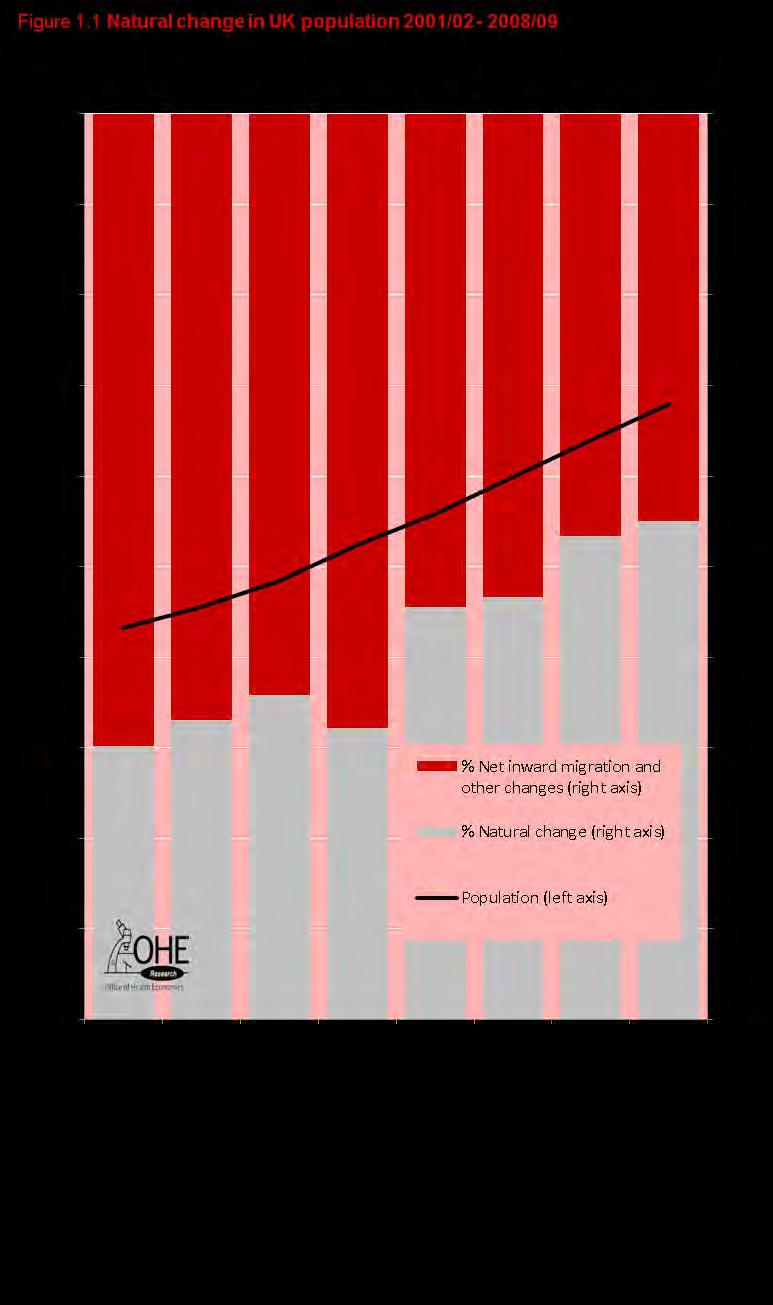
19 6
20 Figure 1.2 Trends and projections for characteristics of the UK population, Age/Per cent 100 Projections Dependency ratio (aged 0-14 and => 65 as per cent of working age 15-64) Median age (years) Older (aged 65 and over) people as per cent of UK population Notes: Data presented have been smoothed using b-splines (see Glossary). 1 Projections from 2008 are based on 2008 mid-year estimates. Sources: Annual Abstract of Statistics (ONS). Population Projections Database (GAD). Population Estimates and Projections (ONS). 7
21 Table 1.3 Total and projected populations of OECD and EU countries, Millions OECD ,049 1,133 1,174 1,211 1,270 1,308 EU Australia Austria Belgium Bulgaria Canada Cyprus Czech Republic Denmark Estonia Finland France Germany Greece Hungary Iceland Ireland Italy Japan Korea, Republic of Latvia Lithuania Luxembourg Malta Mexico Netherlands Mexico Norw ay Poland Portugal Romania Slovak Republic Slovenia Spain Sw eden Sw itzerland Turkey UK USA Notes: Sources: Figures for the years 2010, 2020 and 2030 are UN projections. UK data from 2010 are from World Population Prospects and may differ slightly from other tables, as future projections are based on calculations conducted by the United Nations, as opposed to the UK Office for National Statistics. 1 EU27 as constituted since 1st January Including Northern and Southern Cyprus. 3 Including former East Germany. World Population Prospects (United Nations). For sources of UK data for see Table
22 Population Key sources an information Population estimates for mid-2001 for UK and its constituent countries: England and Wales: National Report for England and Wales, Census Northern Ireland: Northern Ireland Census 2001 Key Statistics Scotland: Scotland Census 2001 Reference Volume Information on the 2011 Census is available at: England and Wales Northern Ireland Scotland ONS. Annual Abstract of Statistics. London: TSO; published annually. Contains statistics on the UK s economy, industry, society and demography. ONS. Key Population and Vital Statistics: Local Authority and Health Authority Areas (Series PP1). London: TSO; published annually. Gives summaries of population, births, conceptions, deaths, mortality and migration for local administrative areas for the whole of the UK and its constituent countries and includes local and health administrative areas. ONS. Health Statistics Quarterly London: TSO; published quarterly. Provides, in addition to current health findings, information on the most up to date population figures, key vital statistics and expectation of life. ONS. National Population Projections 2008-based. (Series PP2). London: TSO; published biannually. This report provides detailed results of the 2008-based population projections, for the UK and its constituent countries; prior to 2006 these were prepared by the GAD in consultation with the three Registrar Generals. It includes the principal and variant projections for each country, and a summary of the assumptions on which they are based (e.g. fertility and mortality rates, and net migration). ONS. Population Trends. London: TSO; published quarterly. Provides demographic information together with commentary on a range of topics and the latest updated population figures. ONS. Sub-national Population Projections (SNPP). London: TSO; published annually. Contains long-term population projections by gender and age for the government office regions, unitary authorities, counties, London boroughs, metropolitan districts, health authorities and health districts of England for the base year (2004) and 25 years ahead. 9
23 Mortality Selected key facts and trends Coronary heart disease and stroke continue to be leading causes of death in the UK Approximately 1 in 6 of all deaths in the UK in 2008 were due to coronary heart disease Deaths from strokes accounted for 1 in 14 of all UK deaths Crude death rates from liver disease continue to rise Death rates from cancer of the trachea, lung and bronchus have not changed much over the past decade and continue to be a leading cause of death 1.2 Mortality statistics In most industrial countries, it is compulsory for births, deaths and marriages to be registered as they occur. Information typically collected by a registration system for births includes: date and place of birth; name and sex of the child; names and occupations of the child s parents; and a description of the informant. For deaths, the information typically collected includes: date and place of death; cause of death; and a range of information relating to the deceased, including: name, sex, date and place of birth, last occupation and usual address; the name of the informant is also recorded. The well established death registration system in the UK provides readily available information on the health of the population. Mortality statistics such as mortality rates by specific cause of death have been widely used in monitoring the health of the population and in planning services. See Tables 1.4 and 1.5 for numbers of deaths in the UK and crude death rates per 100,000 population, by leading causes of death. As part of the Government s strategy for improving the health of the population, targets are set for reducing deaths from coronary heart disease and stroke, cancer, suicide and accidents. Progress made in these disease areas is constantly monitored through indicators derived from mortality data (see Mortality statistics provide a good starting point for describing a health problem, from which a more detailed investigation can begin. They provide the data for epidemiological studies to examine the pattern of causes of diseases across populations and places, for monitoring disease patterns (e.g. AIDS), for time trend analysis, and for different population groups such as occupation in the study of health inequalities (see 10
24 Mortality Issues Despite the fact that it is a legal requirement in the UK to register death and that the system of data collection is well established, the reliability of mortality statistics depends on the status of the informant who supplies the details of the deceased to the Registrar. There may be problems in providing the accurate date of birth and hence the age of the person, as well as the last occupation and economic status. The information on cause of death depends on the clinical judgement of a medical practitioner. The accuracy of the clinical cause of death that is recorded is especially affected by the age of the deceased and in some cases by undetermined causes. Adding to the problem is that prior to 1993 clinical coding in the UK was handled manually. Since then, coding has been carried out by automated computer system. This might cause some discrepancies in time trend analysis (see Rooney CIF and Smith SK (2000): Implementation of ICD10 for Mortality Data in England and Wales from January 2001, Office for National Statistics, Health Statistics Quarterly). Furthermore, the introduction of the ICD version 10 for coding the underlying cause of death in 2000 in Scotland and 2001 in England and Wales has caused some incompatibility between current and previous data on cause of death. This is particularly serious in conditions related to respiratory diseases and in particular pneumonia. When there are multiple causes listed on a death certificate, an underlying cause is chosen using standard definitions and procedures. However, it is often the case in statistical reporting and analysis that only this underlying cause is utilised, resulting in the loss of potentially useful information when several diseases or conditions are reported on a death certificate. There are limitations in using mortality statistics in describing the health of the population, especially in measuring the burden of a disease, as they say nothing about the health, and the illnesses, of those who are alive. To have a complete picture requires the collection of information on illness, i.e. morbidity, in the community as well (see Section 1.4 on morbidity statistics). 11
25 Table 1.4 Number of deaths by main cause, sex and country, UK, 2008 United England Northern Cause Scotland Kingdom and Wales Ireland All causes - Males 276, ,014 26,504 7,227 Infectious and parasitic diseases 3,376 2, All cancers 1 81,905 72,095 7,729 2,081 Stomach cancer 3,194 2, Colorectal cancer 8,777 7, Lung cancer 19,912 17,233 2, Prostate cancer 10,175 9, Diabetes Mellitus 3,107 2, Circulatory system 91,634 80,846 8,497 2,291 Hypertensive disease 1,990 1, Coronary heart disease 49,665 43,462 4,852 1,351 Cerebrovascular disease 20,357 17,805 2, Respiratory system 37,021 32,801 3, Pneumonia 12,802 11, BEA and COPD 3 15,071 13,342 1, Digestive system 14,174 12,305 1, Chronic liver disease and cirrhosis 5,646 4, External causes of injury and poisoning 13,012 11,023 1, Motor vehicle traffic accidents 2,308 1, Suicide and self-inflicted injury 3,301 2, All causes - Females 302, ,076 29,196 7,680 Infectious and parasitic diseases 4,242 3, All cancers 1 75,166 65,736 7,540 1,890 Stomach cancer 1,995 1, Colorectal cancer 7,524 6, Lung cancer 15,421 13,093 1, Breast cancer 2 12,072 10,717 1, Diabetes Mellitus 3,348 2, Circulatory system 99,205 87,392 9,352 2,461 Hypertensive disease 2,960 2, Coronary heart disease 38,571 33,523 3,989 1,059 Cerebrovascular disease 32,785 28,641 3, Respiratory system 44,269 38,950 4,167 1,152 Pneumonia 19,480 17,396 1, BEA and COPD 3 14,427 12,520 1, Digestive system 15,624 13,692 1, Chronic liver disease and cirrhosis 3,337 2, External causes of injury and poisoning 8,151 7, Motor vehicle traffic accidents Suicide and self-inflicted injury Notes: 1 All cancers relate to ICD code C00-C97. 2 Although deaths from breast cancer do occur in males, they are very rare and so are not shown. 3 Bronchitis, emphysema and asthma and other chronic obstructive pulmonary disease. Sources: M ortality Statistics Deaths registered 2008 DR_08 (ONS). Vital Events Reference Tables (General Register Office of Scotland). Demographic Statistics (Northern Ireland Statistics and Research Agency). Population Projections Database (GAD). 12
26 Table 1.5 Crude death rates per 100,000 population for leading causes of death, UK, All deaths 1,178 1,174 1,118 1, , From natural causes 1,131 1,131 1,075 1, Coronary heart disease Cerebrovascular disease Malignant neoplasm of trachea Pneumonia Bronchitis, emphysema and COPD Diseases of pulmonary circulation Malignant neoplasm of breast Chronic liver disease and cirrhosis Diabetes mellitus Malignant neoplasm of stomach Hypertensive disease Leukaemia Suicide and self-inflicted injury Nephritis, nephrotic syndrome Benign and unspecified neoplasms Malignant neoplasm of uterus Ulcer of stomach and duodenum Motor vehicle accidents Malignant neoplasm of cervix Asthma Chronic rheumatic heart disease Hernia of abdominal cavity Anaemias Tuberculosis Hyperplasia of prostate Meningitis Nutritional deficiencies Meningococcal infection Influenza Notes: Year - Not available. 0: <5 deaths per 10 million population. Prior to 1995, data are accurate only to 0 decimal places. 1 From 2001, and in Scotland from 2000, cause of death information is based on ICD10, the 10th version of the International Statistical Classification of Disease and Health Problems. As a result these figures, in particular pneumonia, are not strictly compatible with earlier years. 2 Including bronchus and lung. 3 COPD - chronic obstructive pulmonary disease. Data prior to 2001 related to bronchitis and emphysema only. 4 Including other forms of heart disease. 5 Per 100,000 female population. 6 Respiratory and other tuberculosis including late effects. Sources: Annual Abstract of Statistics (ONS). Population Projections Database (GAD). M ortality Statistics Series DH2 (ONS). M ortality Statistics Deaths Registered 2007 (ONS). M ortality Statistics Deaths Registered 2008 (ONS). Vital Events Reference Tables (General Register Office of Scotland). Demographic Statistics (Northern Ireland Statistics and Research Agency). 13
27 Methods Age standardisation In comparing mortality experience across different populations, the use of crude death rates makes no allowance for differences in the age structures of populations. Though age specific mortality rates can be used for such comparisons, it may be more desirable to use summary statistics that take into account the age structure of the populations. The age standardisation method can be used to control for such confounding age effects, allowing meaningful comparisons to be made between places or over time. There are two methods of standardisation: direct and indirect. Details of the calculations can be found in most standard textbooks on epidemiology (Rothman 2002). Both methods begin with choosing a standard population. Within this publication we have used the European Standard Population to produce direct age standardised mortality rates for a selected number of main causes of death. Table 1.6 shows age standardised rates for all causes for the constituent countries of the UK. Death rates for specific age groups are shown in Table 1.7, these rates can provide additional information, such as the considerable reduction in infant mortality over the last century. Table 1.6 Age standardised mortality rates (per 100,000 population) for all causes, by sex and country, All persons UK England and Wales Scotland Northern Ireland Males UK England and Wales Scotland 1, Northern Ireland Females UK England and Wales Scotland Northern Ireland Note: Sources: Year Data for 2001 are unavailable. M ortality Statistics Series DH2 (ONS). M ortality Statistics Deaths Registered (ONS). Vital Events Reference Tables (General Register Office of Scotland). Demographic Statistics (Northern Ireland Statistics and Research Agency). Population Projections Database (GAD). 14
28 Table 1.7 Age specific mortality rates per 1,000 population, UK, Year All ages < => / / / / / / / Notes: Sources: Age Group 1 Death rates per 1,000 live births. 2 Averages for the periods. Annual Abstract of Statistics (ONS). Population Trends (ONS). 15
Unmet health care needs statistics
 Unmet health care needs statistics Statistics Explained Data extracted in January 2018. Most recent data: Further Eurostat information, Main tables and Database. Planned article update: March 2019. An
O U T C O M E. record-based. measures HOSPITAL RE-ADMISSION RATES: APPROACH TO DIAGNOSIS-BASED MEASURES FULL REPORT
 HOSPITAL RE-ADMISSION RATES: APPROACH TO DIAGNOSIS-BASED MEASURES FULL REPORT record-based O U Michael Goldacre, David Yeates, Susan Flynn and Alastair Mason National Centre for Health Outcomes Development
Implementation of the System of Health Accounts in OECD countries
 Implementation of the System of Health Accounts in OECD countries David Morgan OECD Health Division 2 nd December 2005 1 Overview of presentation Main purposes of SHA work at OECD Why has A System of Health
2.1 Communicable and noncommunicable diseases, health risk factors and transition
 1. CONTEXT 1.1 Demographics In 2010, American Samoa had an estimated population of 65 896. Based on 2010 population estimates, around 35% of the population is below 15 years of age, while 4% is above 65
First quarter of 2014 Euro area job vacancy rate up to 1.7% EU28 up to 1.6%
 94/2014-17 June 2014 First quarter of 2014 Euro area job vacancy rate up to 1.7% EU28 up to 1.6% Today, Eurostat publishes for the first time a News Release with quarterly data on the job vacancy rate.
The Voice of Foreign Companies. Healthcare Policy Agenda. Bringing the Benefits of Innovative Practices to Denmark
 The Voice of Foreign Companies Healthcare Policy Agenda Bringing the Benefits of Innovative Practices to Denmark November 24, 2008 Background The Healthcare Ambition We are convinced that Denmark has the
The EU ICT Sector and its R&D Performance. Digital Economy and Society Index Report 2018 The EU ICT sector and its R&D performance
 The EU ICT Sector and its R&D Performance Digital Economy and Society Index Report 2018 The EU ICT sector and its R&D performance The ICT sector value added amounted to EUR 632 billion in 2015. ICT services
ITU Statistical Activities
 ITU Statistical Activities Korea National Statistical Office (NSO) and Ministry of Commerce, Industry & Energy (MOCIE) 16 June 2004, Geneva Esperanza C. Magpantay Market, Economics and Finance Unit (MEF)
Reference costs 2016/17: highlights, analysis and introduction to the data
 Reference s 2016/17: highlights, analysis and introduction to the data November 2017 We support providers to give patients safe, high quality, compassionate care within local health systems that are financially
HEALTH CARE NON EXPENDITURE STATISTICS
 EUROPEAN COMMISSION EUROSTAT Directorate F: Social statistics Unit F-5: Education, health and social protection DOC 2016-PH-08 HEALTH CARE NON EXPENDITURE STATISTICS 2016 AND 2017 DATA COLLECTIONS In 2010,
Our Future Health Secured?
 Our Future Health Secured? A REVIEW OF NHS FUNDING AND PERFORMANCE Derek Wanless John Appleby Anthony Harrison Darshan Patel King s Fund 2007 First published 2007 by the King s Fund Charity registration
Employment in Europe 2005: Statistical Annex
 Cornell University ILR School DigitalCommons@ILR International Publications Key Workplace Documents September 2005 Employment in Europe 2005: Statistical Annex European Commission Follow this and additional
TRENDS IN HEALTH WORKFORCE IN EUROPE. Gaétan Lafortune, OECD Health Division Conference, Brussels, 17 November 2017
 TRENDS IN HEALTH WORKFORCE IN EUROPE Gaétan Lafortune, OECD Health Division Conference, Brussels, 17 November 2017 Health and social workers account for a growing share of total employment in nearly all
PERFORMANCE OF THE BELGIUM HEALTH SYSTEM IN INTERNATIONAL COMPARISON
 PERFORMANCE OF THE BELGIUM HEALTH SYSTEM IN INTERNATIONAL COMPARISON Academic session: Looking back with an eye on the future 13 January 2017 Mark Pearson - Deputy Director Employment, Labour and Social
NHS Wiltshire PCT Programme Budgeting fact sheet /12 Contents
 PCT Programme Budgeting fact sheet - 2011/12 Contents Introduction... 2 Methodology and caveats... 3 Key facts... 4 Relative expenditure by programme... 6 Relative expenditure by setting... 7 The biggest
Primary Care Development in Hong Kong: Future Directions
 Primary Care Development in Hong Kong: Future Directions HA Convention 2014 8 May 2014 Professor Sophia CHAN PhD, MPH, MEd, RN, RSCN, FAAN, FFPH, JP Under Secretary for Food and Health, Government of the
Health Workforce Policies in OECD Countries
 Health Workforce Policies in OECD Countries Right Jobs, Right Skills, Right Places Gaetan Lafortune, OECD Health Division EU Joint Action Health Workforce Planning and Forecasting Closure Event, Belgium,
HEALTH WORKFORCE PLANNING AND MOBILITY IN OECD COUNTRIES. Gaetan Lafortune Senior Economist, OECD Health Division
 HEALTH WORKFORCE PLANNING AND MOBILITY IN OECD COUNTRIES Gaetan Lafortune Senior Economist, OECD Health Division EU Joint Action Health Workforce Planning and Forecasting Bratislava, 28-29 January 2014
REPORT FROM THE COMMISSION TO THE EUROPEAN PARLIAMENT AND THE COUNCIL
 EUROPEAN COMMISSION Brussels, 8.7.2016 COM(2016) 449 final REPORT FROM THE COMMISSION TO THE EUROPEAN PARLIAMENT AND THE COUNCIL on implementation of Regulation (EC) No 453/2008 of the European Parliament
FACULTY OF PUBLIC HEALTH DEPARTMENT OF PUBLIC HEALTH SCIENCIES
 SYNOPSIS Page 1 of 7 FACULTY OF PUBLIC HEALTH DEPARTMENT OF PUBLIC HEALTH SCIENCIES EXAMINATION SYNOPSIS IN SOCIAL MEDICINE 2015/2016 Specialty Medicine, Second year students (January 2016 examination
Neighbourhood HEALTH PROFILE A PEEL HEALTH STATUS REPORT. M. Prentice, Mississauga Ward 3 Councillor
 Neighbourhood HEALTH PROFILE 2005 A PEEL HEALTH STATUS REPORT MISSISSAUGA WARD 3 M. Prentice, Mississauga Ward 3 Councillor Mississauga, Ward 3 This report provides an overview of the health status of
Erasmus Student Work Placement Guide
 Erasmus Student Work Placement Guide Introduction This Guide is intended to provide general information for students who are considering an Erasmus work placement. It must be stressed that the advice is
London CCG Neurology Profile
 CCG Neurology Profile November 214 Summary NHS Hammersmith And Fulham CCG Difference from Details Comments Admissions Neurology admissions per 1, 2,13 1,94 227 p.1 Emergency admissions per 1, 1,661 1,258
Outcomes benchmarking support packs: CCG level
 Outcomes benchmarking support packs: CCG level NHS South Devon and Torbay CCG Produced with input from: Public Health England Forward and Introduction Local decision making is at the heart of the NHS,
Mental health services in Estonia. Peeter Jaanson 14 th April 2011 Tartu
 Mental health services in Estonia Peeter Jaanson 14 th April 2011 Tartu General information Independence reestablished 1991 EU, NATO, Eurozone member state Population about 1,3 million, decreasing continiously
The EUREKA Initiative An Opportunity for Industrial Technology Cooperation between Europe and Japan
 EUREKA The EUREKA Initiative An Opportunity for Industrial Technology Cooperation between Europe and Japan Brussels, 12 March 2014 Susanne Madders Senior International Cooperation Advisor EUREKA Secretariat,
3. Q: What are the care programmes and diagnostic groups used in the new Formula?
 Frequently Asked Questions This document provides background information on the basic principles applied to Resource Allocation in Scotland plus additional detail on the methodology adopted for the new
ERASMUS+ INTERNSHIP MOBILITY?
 ERASMUS+ INTERNSHIP MOBILITY? Tuesday, March 21 5.20 pm Nador 13, 307/A WHAT IS ERASMUS+ Internship Mobility? 2 12 months many organizations in Programme Countries non-eligible receiving institutions:
Scottish Hospital Standardised Mortality Ratio (HSMR)
") ` 2016 Scottish Hospital Standardised Mortality Ratio (HSMR) Methodology & Specification Document Page 1 of 14 Document Control Version 0.1 Date Issued July 2016 Author(s) Quality Indicators Team Comments
` 2016 Scottish Hospital Standardised Mortality Ratio (HSMR) Methodology & Specification Document Page 1 of 14 Document Control Version 0.1 Date Issued July 2016 Author(s) Quality Indicators Team Comments
NHS Performance Statistics
 NHS Performance Statistics Published: 8 th March 218 Geography: England Official Statistics This monthly release aims to provide users with an overview of NHS performance statistics in key areas. Official
Making High Speed Broadband Available to Everyone in Finland
 Making High Speed Broadband Available to Everyone in Finland Juha Parantainen Ministry of Transport and Communications, Finland 1 Broadband operators in Finland 2 Goals for Broadband Deployment set by
ESSM Research Grants T&C
 European Society for Sexual Medicine (ESSM) Terms and Conditions for Research Grants A. INTRODUCTION 1) European Society for Sexual Medicine (ESSM) is a registered charity (charity registration number
Do quality improvements in primary care reduce secondary care costs?
 Evidence in brief: Do quality improvements in primary care reduce secondary care costs? Findings from primary research into the impact of the Quality and Outcomes Framework on hospital costs and mortality
Seafarers Statistics in the EU. Statistical review (2015 data STCW-IS)
") Seafarers Statistics in the EU Statistical review (2015 data STCW-IS) EMSA.2017.AJ7463 Date: 29 August 2017 Executive Summary The amendments to Directive 2008/106/EC introduced by Directive 2012/35/EU
Seafarers Statistics in the EU Statistical review (2015 data STCW-IS) EMSA.2017.AJ7463 Date: 29 August 2017 Executive Summary The amendments to Directive 2008/106/EC introduced by Directive 2012/35/EU
NHS performance statistics
 NHS performance statistics Published: 14 th December 217 Geography: England Official Statistics This monthly release aims to provide users with an overview of NHS performance statistics in key areas. Official
Supporting Syria and the region: Post-Brussels conference financial tracking
 Supporting Syria and the region: Post-Brussels conference financial tracking Report Four October 217 Contents On 5 April 217, representatives of over 7 countries, international organisations and civil
 A technical guide explaining the data sources and methods used in this profile, plus interactive spreadsheets providing the data in charts and tables, are available at: www.publichealthwalesobservatory.wales.nhs.uk/gpclusters
Case Study HEUTOWN DISTRICT: PLANNING AND RESOURCE ALLOCATION
 Case Study HEUTOWN DISTRICT: PLANNING AND RESOURCE ALLOCATION Di McIntyre Health Economics Unit, University of Cape Town, Cape Town, South Africa This case study may be copied and used in any formal academic
NHS performance statistics
 NHS performance statistics Published: 8 th February 218 Geography: England Official Statistics This monthly release aims to provide users with an overview of NHS performance statistics in key areas. Official
SOUTH AFRICA EUREKA INFORMATION SESSION 13 JUNE 2013 How to Get involved in EUROSTARS
 EUREKA SOUTH AFRICA EUREKA INFORMATION SESSION 13 JUNE 2013 How to Get involved in EUROSTARS Michel Andrieu Adviser to the Head of the EUREKA Secretariat Doing business through technology The Eurostars
INTERNATIONAL BENCHMARKING OF HOSPITAL UTILISATION: How does the South African private hospital sector compare? Final
 INTERNATIONAL BENCHMARKING OF HOSPITAL UTILISATION: How does the South African private hospital sector compare? Final 21 November 2014 Table of Contents 1 Introduction... 1 2 Background and context...
Supporting Syria and the region: Post-Brussels conference financial tracking
 Supporting Syria and the region: Post-Brussels conference financial tracking Report Five April 218 Supporting Syria and the region: Post-Brussels conference financial tracking, April 218 On 5 April 217,
Vienna Healthcare Lectures Primary health care in SLOVENIA. Vesna Kerstin Petrič, M.D. MsC Ministry of Health
 Vienna Healthcare Lectures 2016 Primary health care in SLOVENIA Vesna Kerstin Petrič, M.D. MsC Ministry of Health Vesna Kerstin Petrič A medical doctor since 1994 A specialist in clinical and public health
Overview of Vital Records and Public Health Informatics in CDPH
 Overview of Vital Records and Public Health Informatics in CDPH Este Geraghty, MD, MS, MPH/CPH, FACP, GISP Deputy Director, Center for Health Statistics and Informatics California Department of Public
Question 1 a) What is the Annual net expenditure on the NHS from 1997/98 to 2007/08 in Scotland? b) Per head of population
 What is the Annual net expenditure on the NHS from 1997/98 to 2007/08 in Scotland? b) Per head of population") NHS SPENDING - SCOTLAND Question 1 a) What is the Annual net expenditure on the NHS from 1997/98 to 2007/08 in Scotland? b) Per head of population Question 2 a) Annual real (GDP deflated) increase in net
NHS SPENDING - SCOTLAND Question 1 a) What is the Annual net expenditure on the NHS from 1997/98 to 2007/08 in Scotland? b) Per head of population Question 2 a) Annual real (GDP deflated) increase in net
BRIDGING GRANT PROGRAM GUIDELINES 2018
 BRIDGING GRANT PROGRAM GUIDELINES 2018 1. Introduction Bridging Grants are a program of assistance that target early stage proof of concept and knowledge transfer, product and services development and
RULES - Copernicus Masters 2017
 RULES - Copernicus Masters 2017 ORGANISER OF THE COPERNICUS MASTERS The Copernicus Masters is organised under an ESA contract by Anwendungszentrum GmbH Oberpfaffenhofen ( the Organiser ) and is supported
Waterloo Wellington Community Care Access Centre. Community Needs Assessment
 Waterloo Wellington Community Care Access Centre Community Needs Assessment Table of Contents 1. Geography & Demographics 2. Socio-Economic Status & Population Health Community Needs Assessment 3. Community
REPORT FROM THE COMMISSION TO THE EUROPEAN PARLIAMENT AND THE COUNCIL
 EUROPEAN COMMISSION Brussels, 6.8.2013 COM(2013) 571 final REPORT FROM THE COMMISSION TO THE EUROPEAN PARLIAMENT AND THE COUNCIL on implementation of the Regulation (EC) No 453/2008 of the European Parliament
Hospital Maternity Activity
 2005-06 2006-07 2007-08 2008-09 2009-10 2010-11 2011-12 2012-13 2013-14 2014-15 2015-16 Hospital Maternity Activity 2015-16 Published 09 November 2016 This is a report on maternity activity in NHS hospitals
TUITION FEE GUIDANCE FOR ERASMUS+ EXCHANGE STUDENTS Academic Year
 TUITION FEE GUIDANCE FOR ERASMUS+ EXCHANGE STUDENTS 2017-2018 Academic Year CONTENTS Page no. Summary 3 1 Introduction 4 2 UK/EU New Regime Fee Students 4 3 International Student Fees 5 4 Erasmus+ Grants
Q Manpower. Employment Outlook Survey Global. A Manpower Research Report
 Manpower Q3 211 Employment Outlook Survey Global A Manpower Research Report Manpower Employment Outlook Survey Global Contents Q3/11 Global Employment Outlook 1 International Comparisons Americas International
Healthcare Hotspotting: Delivering Better Care to the Most Complex Patients
 Healthcare Hotspotting: Delivering Better Care to the Most Complex Patients Jeffrey Brenner, MD Executive Director What do these patients have in common? Homeless patient in Trenton, NJ with 450 visits
HEALTH WORKFORCE PRIORITIES IN OECD COUNTRIES (WITH A FOCUS ON GEOGRAPHIC MAL-DISTRIBUTION)
") HEALTH WORKFORCE PRIORITIES IN OECD COUNTRIES (WITH A FOCUS ON GEOGRAPHIC MAL-DISTRIBUTION) Gaetan Lafortune Senior Economist, OECD Health Division International Health Workforce Collaborative Quebec City,
HEALTH WORKFORCE PRIORITIES IN OECD COUNTRIES (WITH A FOCUS ON GEOGRAPHIC MAL-DISTRIBUTION) Gaetan Lafortune Senior Economist, OECD Health Division International Health Workforce Collaborative Quebec City,
Healthcare Practice. Healthcare PanelBook 2017
 Healthcare Practice Healthcare PanelBook 2017 Access medical professionals, ailment sufferers and consumers all in one place. Toluna s Healthcare Practice has been providing healthcare and pharmaceutical
Prescribing & Medicines: Reimbursement and remuneration paid to dispensing contractors
 Publication Report Prescribing & Medicines: Reimbursement and remuneration paid to dispensing contractors Quarter Three of Financial Year 2015/16 Publication date 22 March 2016 A National Statistics Publication
EUREKA and Eurostars: Instruments for international R&D cooperation
 DLR-PT.de Chart 1 EUREKA / Eurostars Dr. Paul Racec 18 th May 2017 EUREKA and Eurostars: Instruments for international R&D cooperation DLR-PT - National Contact Point EUREKA/Eurostars Dr. Paul Racec DLR-PT.de
DELAWARE FACTBOOK EXECUTIVE SUMMARY
 DELAWARE FACTBOOK EXECUTIVE SUMMARY DaimlerChrysler and the International Union, United Auto Workers (UAW) launched a Community Health Initiative in Delaware to encourage continued improvement in the state
The ERC funding strategy
 The European Research Council ERC Grant Schemes FUNDING TOP RESEARCHERS http://erc.europa.eu The ERC funding strategy The European Research Council (ERC) is the first pan- European funding body designed
PATIENT SAFETY AND QUALITY OF CARE
 Special Eurobarometer 411 PATIENT SAFETY AND QUALITY OF CARE SUMMARY Fieldwork: November December 2013 Publication: June 2014 This survey has been requested by the European Commission, Directorate-General
State of Health in the EU Latvia Country Health Profile 2017
 State of Health in the Country Health Profile 2017 European on Health Systems and Policies a partnership hosted by WHO The Country Health Profile series The State of Health in the profiles provide a concise
ANCIEN THE SUPPLY OF INFORMAL CARE IN EUROPE
 ANCIEN Assessing Needs of Care in European Nations European Network of Economic Policy Research Institutes THE SUPPLY OF INFORMAL CARE IN EUROPE LINDA PICKARD WITH AN APPENDIX BY SERGI JIMÉNEZ-MARTIN,
Commentary for East Sussex
 Commentary for based on JSNA Scorecards, January 2013 This commentary is to be read alongside the JSNA scorecards. Scorecards and commentaries are available at both local authority and NHS geographies
Prescribing & Medicines: Reimbursement and remuneration paid to dispensing contractors
 Publication Report Prescribing & Medicines: Reimbursement and remuneration paid to dispensing contractors Financial Year 2014/15 Publication date 30 June 2015 A National Statistics Publication for Scotland
An action plan to boost research and innovation
 MEMO/05/66 Brussels, 1 October 005 An action plan to boost research and innovation The European Commission has tabled an integrated innovation and research action plan, which calls for a major upgrade
State of Health in the EU Slovak Republic
 State of Health in the Slovak Republic Country Health Profile 2017 European on Health Systems and Policies a partnership hosted by WHO b. Health in the The Country Health Profile series The State of Health
MEASURING R&D TAX INCENTIVES
 General notes OECD time-series estimates of implied marginal R&D tax subidy rates (1 minus B-index) This is an experimental indicator based on quantitative and qualitative information representing a notional
Capacity Building in the field of youth
 Capacity Building in the field of youth What are the aims of a Capacity-building project? Youth Capacity-building projects aim to: foster cooperation and exchanges in the field of youth between Programme
Equal Distribution of Health Care Resources: European Model
 Equal Distribution of Health Care Resources: European Model Beyond Theory to Social Justice in Health Care Children s Hospital of New Orleans Saturday, March 15, 2008 New Orleans, Louisiana Alfred Tenore
Digital Public Services. Digital Economy and Society Index Report 2018 Digital Public Services
 Digital Public Services Digital Economy and Society Index Report 18 Digital Public Services The Digital Economy and Society Index (DESI) is a composite index that summarises relevant indicators on Europe
ERC Grant Schemes. Horizon 2020 European Union funding for Research & Innovation
 ERC Grant Schemes Horizon 2020 European Union funding for Research & Innovation The ERC funding strategy The European Research Council (ERC) is the first pan- European funding body designed to support
ECHA Helpdesk Support to National Helpdesks
 ECHA Helpdesk Support to National Helpdesks 48 th Biocides CA meeting 19-21 September 2012 Brussels Dr. Henna Piha ECHA Helpdesk Unit A1 ECHA Helpdesk - Support to National Helpdesks What ECHA offers to
DATA Briefing. Emergency hospital admissions for ambulatory care-sensitive conditions: identifying the potential for reductions.
 DATA Briefing April 2012 Emergency hospital admissions for ambulatory care-sensitive conditions: identifying the potential for reductions Authors Yang Tian Anna Dixon Haiyan Gao Summary Ambulatory care-sensitive
General Practice trends in the UK to 2016
 General Practice trends in the UK to 2016 Published 19 September 2017 This paper collates information on General Practice trends in England, Wales, Scotland and Northern Ireland. The paper includes figures
APPLICATION FORM ERASMUS STAFF TRAINING (STT)
") APPLICATION FORM ERASMUS STAFF TRAINING (STT) Ansökan Erasmus Personalfortbildning 2017-2019 Funds are granted continuously throughout the year until all available funds have been allocated. The application
APPLICATION FORM ERASMUS STAFF TRAINING (STT) Ansökan Erasmus Personalfortbildning 2017-2019 Funds are granted continuously throughout the year until all available funds have been allocated. The application
Current Trends in Mental Health Services. Nick Bouras Professor Emeritus
 Current Trends in Mental Health Services Nick Bouras Professor Emeritus OUTLINE The Treatment Gap The evolution of MH services Balanced care model Current policies Outcomes Treatment gap: key facts 20-30%
EUROPEAN ASSOCIATION OF SENIOR HOSPITAL PHYSICIANS
 EUROPEAN ASSOCIATION OF SENIOR HOSPITAL PHYSICIANS PATIENT-ORIENTED HOSPITAL CARE IN THE FUTURE João de Deus President Quality Effectiveness Human Resources Patient Safety History Mainly of private nature
Basic Concepts of Data Analysis for Community Health Assessment Module 5: Data Available to Public Health Professionals
 Basic Concepts of Data Analysis for Community Assessment Module 5: Data Available to Public Professionals Data Available to Public Professionals in Washington State Welcome to Data Available to Public
Integrating mental health into primary health care across Europe
 Integrating mental health into primary health care across Europe Social Breakthroughs Symposium Friday, 26th june BMAG Porto Authors Tiago Vieira Pinto Registered Nurse Serpa Pinto Family Health Unit Family
Archimedes Distinctions for High-level Research Work
 European Commission Community Research Information Package Information Brochure Call Specific Archimedes Distinctions for High-level Research Work Edition September 2001 Call identifier: IHP-ARP-01-1 http://www.cordis.lu/improving
Skillsnet workshop. "Job vacancy Statistics"
 EUROPEAN COMMISSION EUROSTAT Directorate F: Social Statistics and Information Society Unit F-2: Labour market statistics Skillsnet workshop Bucarest, 21-22 June 2007 "Job vacancy Statistics" Eurostat contact:
EPSRC Care Life Cycle, Social Sciences, University of Southampton, SO17 1BJ, UK b
 Characteristics of and living arrangements amongst informal carers in England and Wales at the 2011 and 2001 Censuses: stability, change and transition James Robards a*, Maria Evandrou abc, Jane Falkingham
Commissioning for Value insight pack
 Commissioning for Value insight pack NHS England Gateway ref: 00525 Contents Introduction: the call to action The approach Where to look using indicative data Phase 2 & 3 Why act what benefits do the population
EU RESEARCH FUNDING Associated countries FUNDING 70% universities and research organisations. to SMEs throughout FP7
 10 KEY FACTS 1 BUDGET TOTAL 55 billion 82% 18% 4 specific programmes* Cooperation - 28.7bn Ideas - 7.7bn People - 4.8bn Capacities - 3.8bn Euratom, JRC direct actions, ITER, Risk Sharing Finance Facility
EUREKA Peter Lalvani Data & Impact Analyst NCP Academy CSIC Brussels 18/09/17
 peter.lalvani@eurekanetwork.org EUREKA Peter Lalvani Data & Impact Analyst NCP Academy CSIC Brussels 18/09/17 EUREKA is Leading platform for international cooperation Intergovernmental network Supporting
Summary of the National Reports. of NATO Member and Partner Nations to the NATO Committee on Gender Perspectives
 Summary of the National Reports of NATO Member and Partner Nations to the NATO Committee on Gender Perspectives 2016 TABLE OF CONTENTS Introduction..............................................................5
BELGIAN EU PRESIDENCY CONFERENCE ON RHEUMATIC AND MUSCULOSKELETAL DISEASES (RMD)
") BELGIAN EU PRESIDENCY CONFERENCE ON RHEUMATIC AND MUSCULOSKELETAL DISEASES (RMD) Brussels, 19 October 2010 Summary Report Background and Objectives of the conference The Conference on Rheumatic and Musculoskeletal
BELGIAN EU PRESIDENCY CONFERENCE ON RHEUMATIC AND MUSCULOSKELETAL DISEASES (RMD) Brussels, 19 October 2010 Summary Report Background and Objectives of the conference The Conference on Rheumatic and Musculoskeletal
DISTRICT BASED NORMATIVE COSTING MODEL
 DISTRICT BASED NORMATIVE COSTING MODEL Oxford Policy Management, University Gadjah Mada and GTZ Team 17 th April 2009 Contents Contents... 1 1 Introduction... 2 2 Part A: Need and Demand... 3 2.1 Epidemiology
Monthly and Quarterly Activity Returns Statistics Consultation
 Monthly and Quarterly Activity Returns Statistics Consultation Monthly and Quarterly Activity Returns Statistics Consultation Version number: 1 First published: 08/02/2018 Prepared by: Classification:
NHS WALES INFORMATICS SERVICE DATA QUALITY STATUS REPORT ADMITTED PATIENT CARE DATA SET
 NHS WALES INFORMATICS SERVICE DATA QUALITY STATUS REPORT ADMITTED PATIENT CARE DATA SET Version: 1.0 Date: 1 st September 2016 Data Set Title Admitted Patient Care data set (APC ds) Sponsor Welsh Government
Supporting Syria and the region: Post-London conference financial tracking
 Supporting Syria and the region: Post-London conference financial tracking Report Two February 2017 Contents One year ago, on 4 February 2016, 48 donors gathered in London for the Supporting Syria and
COURTENAY Local Health Area Profile 2015
 COURTENAY Local Health Area Profile 215 Courtenay Local Health Area (LHA) is one of 14 LHAs in Island Health and is located in Island Health s North Island Health Service Delivery Area (HSDA). Courtenay
The industrial competitiveness of Italian manufacturing
 Milan, 27 January 2015 Where do we stand? Global perspectives on the Industrial Competitiveness of Italian manufacturing International Conference The industrial competitiveness of Italian manufacturing
About London Economics. Authors
 About is one of Europe's leading specialist economics and policy consultancies. Based in London and with offices and associate offices in five other European capitals, we advise an international client
The G200 Youth Forum 2015 has 4 main platforms which will run in tandem with each other:
 Mr. Tong Shijun East China Normal University University Council Chairman 3663 Zhongshan Road (N.) 200062 Shanghai China Dear Mr. Tong Shijun, Geneva, 25 September 2014 The 10th G200 Youth Forum 2015 will
Indicator Specification:
 Indicator Specification: CCG OIS 3.2 (NHS OF 3b) Emergency readmissions within 30 days of discharge from hospital Indicator Reference: I00760 Version: 1.1 Date: March 2014 Author: Clinical Indicators Team
Overview on diabetes policy frameworks in the European Union and in other European countries
 Overview on policy frameworks in the European Union and in other European countries Countries plan Guidelines Belgium Guidelines for good medical practice type 2 The Belgian is limited to newly diagnosed
Type of intervention Secondary prevention of heart failure (HF)-related events in patients at risk of HF.
-related events in patients at risk of HF.") Emergency department observation of heart failure: preliminary analysis of safety and cost Storrow A B, Collins S P, Lyons M S, Wagoner L E, Gibler W B, Lindsell C J Record Status This is a critical abstract
Emergency department observation of heart failure: preliminary analysis of safety and cost Storrow A B, Collins S P, Lyons M S, Wagoner L E, Gibler W B, Lindsell C J Record Status This is a critical abstract
Are current primary health care funding arrangements getting us where we want to go?
 Are current primary health care funding arrangements getting us where we want to go? Jane Hall Research Excellence in Finance and Economics of Primary Care Centre for Health Economics Research and Evaluation
Defence Expenditure of NATO Countries ( )
") 15 March/mars 2018 COMMUNIQUE PR/CP(2018)16 Defence Expenditure of NATO Countries (2010-2017) NATO collects defence expenditure data from Allies on a regular basis and presents aggregates and subsets of
15 March/mars 2018 COMMUNIQUE PR/CP(2018)16 Defence Expenditure of NATO Countries (2010-2017) NATO collects defence expenditure data from Allies on a regular basis and presents aggregates and subsets of