Community Health Needs Assessment
|
|
|
- Marian Stevens
- 6 years ago
- Views:
Transcription
1 Community Health Needs Assessment 2016 Walton County, Florida Community Health Needs Assessment Page 0


2 2016 Community Health Needs Assessment Walton County, Florida Prepared by:
3 Table of Contents EXECUTIVE SUMMARY... 1 INTRODUCTION... 4 Collaborative Partners... 4 Community Definition... 5 METHODOLOGY... 8 Participants in the CHNA Process...8 Assessment Process - MAPP... 9 SUMMARY OF FINDINGS... 9 Community Themes and Strengths Assessment Forces of Change Assessment Local Public Health System Assessment Community Health Status Assessment Priority Setting Process Top Priority Health Issues for Walton County SUBSTANCE ABUSE AND MENTAL HEALTH HEALTHY WEIGHT PROVIDER AVAILABILITY AND ACCESS ADDITIONAL SIGNIFICANT HEALTH CONCERNS NEXT STEPS ATTACHMENTS: A. Health Status Indicators, Definitions and Sources B. Forces of Change Assessment C. Local Public Health System Assessment D. Community Themes and Strengths Assessment E. Community Health Status Assessment F. Hospital Facility Evaluation of Actions
4 Executive Summary In 2015, Sacred Heart Health System ( SHHS ) and the Florida Department of Health - Walton County ( FDOH-Walton ) worked together, in collaboration with other community organizations and agencies, to conduct a community health needs assessment ( CHNA ) for the approximately 59,000 residents of Walton County, Florida. Description of the Community The area of this needs assessment is defined as the population of Walton County. Walton County is situated in the Panhandle of Florida and encompasses 1,238 square miles. Approximately 15% of Walton County s land mass is water, and an additional 20% is federally owned as part of Eglin Air Force Base. The county seat is the City of DeFuniak Springs, and the City of Freeport and Town of Paxton are the only other incorporated areas. Historically, Walton County has been one of the fastest growing counties in the United States. The population grew more than 35% between 2000 and Between 2010 and 2014, Walton County population grew 11.4%, compared to total population growth in the State of 5.5% during that period. In spite of significant population growth, Walton County has a low population density of 50 people per square mile, and is designated as a statutory rural county by the State of Florida. Minorities represent about 13% of the total population in Walton County, compared to almost 24% of the population of the State. Only 5.7% of the population of Walton County is Hispanic, compared to 23.3% of the State s population. The median household income in Walton County is $43,640, significantly below that of the State. In 2013, the poverty rate was 33.4%, compared to 29.0% statewide. The unemployment rate as of August 2015 was 4.7%, lower than statewide and a significant improvement from the 9.4% rate reported for Participants in the CHNA Process The CHNA process was led by SHHS and FDOH-Walton, with active participation by community organizations and private and public agencies which collectively comprise the Walton Community Health Improvement Partnership (WCHIP). The CHNA process included WCHIP meetings, a survey of health and human service organizations, and a community survey distributed both on-line and in paper format. More than 50 people representing more than 30 different community agencies and organizations and the general public participated in various meetings throughout the process. In addition, 253 Walton County residents completed the community survey. Particular focus was placed on obtaining input from vulnerable population groups. How the Assessment Was Conducted The CHNA was developed using the Mobilization for Action through Planning and Partnership (MAPP) method, which was developed by the National Association of City and County Health Officials in concert with the U.S. Centers for Disease Control and Prevention. The MAPP process has four elements: Forces of Change Assessment Local Public Health System Assessment Community Health Status Assessment Community Themes and Strengths Assessment Walton County, Florida Community Health Needs Assessment Page 1
5 Quantitative and qualitative data was collected and aggregated in support of the four MAPP elements. Quantitative data were obtained from county, state, and national sources. Qualitative information was obtained through regular WCHIP meetings and workshops and a community survey distributed both on-line and in paper format. A summary of key findings from each MAPP Assessment is provided below. Community Health Status Assessment Unhealthy behaviors are a significant contributor to poor health status in Walton County, including: Substance abuse Excess weight/obesity Poor eating habits/nutrition Tobacco use Sedentary lifestyle/lack of exercise Not seeing doctor/dentist Mental health issues are of significant concern in the County Heart disease and stroke are of major concern Inadequate access to care is a recurring theme, based on a number of factors, including: Lack of availability of providers/services High cost/lack of insurance coverage Lack of awareness of available services, primarily for mental health services Local Public Health System Assessment The local public health system performs particularly well in the following areas: Contributing to public health policies by engaging in activities that inform the policy development process Establishing a community health improvement process, with broad- based diverse participation, that uses information from both the community health assessment and the perceptions of community members Connecting organizational strategic plans with the Community Health Improvement Plan Planning for Public Health Emergencies Assuring that all enforcement activities related to public health codes are done within the law Evaluating Personal Health Services The local public health system could improve performance in the following areas: Use of Technology Research and Innovations Community Themes & Strengths Assessment Recurring themes include: High rate of poverty/working poor; need for help with affordable housing and healthcare Education: schools overcrowded, need vocational education for available jobs Employment is strong, but many jobs are low pay or require more specialized skills Transportation is difficult; many don t have a car and public transportation is limited Need for more cultural diversity in healthcare Access to care is major issue; including lack of certain specialties, lack of insurance, & lack of providers who accept certain plans, Medicaid The following were identified as strengths: Good healthcare providers Environment/location/weather Sense of community/low crime rate Churches/faith-based organizations Forces of Change Assessment Forces of change were grouped into the following categories: Economic, e.g., Lack of insurance, low wages Environmental, e.g., flooding from storms Legal/political, e.g., no Medicaid expansion Social, e.g., insufficient healthcare services Technological/scientific, e.g., lack of fiber optics and cable providers Threats posed by these forces include: No or limited access to healthcare Insufficient infrastructure to handle growth Increase in drug/substance abuse Increase in untreated mental health disorders Poor eating habits and housing conditions Potential water shortages in outlying areas Walton County, Florida Community Health Needs Assessment Page 2
6 Based on the results of the assessments, a list of 50 indicators that were of greatest concern in Walton County was compiled. Using the County Health Ranking s model of population health as a framework, the top five (5) priority health issues facing Walton County were identified as the following: Provider Availability and Access Preventive Care Healthy Weight Tobacco Use Substance Abuse and Mental Health These top health issues were presented and discussed at a community meeting organized by WCHIP. Participants were asked to consider three criteria for prioritizing the top issues: Severity/Magnitude (of the health issue) Feasibility to Address (availability of resources, community will) Potential Impact (on community health status) After reviewing the results of the MAPP Assessments and taking into consideration these three prioritization criteria, participants used a hybrid multi-voting/nominal group technique to identify the top health issues facing Walton County. Top Priority Health Issues The top priority health issues identified for Walton County were: Substance Abuse and Mental Health Healthy Weight Provider Availability and Access Next Steps The next steps in the process will be the development of a community health improvement plan with specific goals, tactics, and evaluation metrics. Activities include: Organizing work groups to develop comprehensive action plans to address each priority Identifying successful health improvement initiatives to serve as best practices Establishing metrics for performance, including measurable outcome indicators Continuing to communicate progress and results to the Walton County community Walton County, Florida Community Health Needs Assessment Page 3
7 Introduction In 2015, Sacred Heart Health System ( SHHS ) and the Florida Department of Health - Walton County ( FDOH-Walton ) worked together, in collaboration with other community organizations and agencies, to conduct a community health needs assessment ( CHNA ) for the approximately 59,000 residents of Walton County, Florida. Collaborative Partners Sacred Heart Hospital on the Emerald Coast Sacred Heart Hospital on the Emerald Coast - SHHS operates a 58-bed acute care facility Sacred Heart Hospital on the Emerald Coast ( SHHEC ) in Miramar Beach, Walton County. SHHEC opened in 2003 and is the only hospital in South Walton County. Walton County residents comprise 43.1% of SHHEC s hospital discharges, with the remaining discharges coming from adjacent coastal zip codes in Okaloosa and Bay Counties and from out of area tourists. SHHEC is one of two acute care hospitals located in Walton County, but is the only nonprofit hospital for more than 50 miles in any direction. SHHEC was established at the request of hundreds of community residents and physicians to provide access to emergency and acute care services, regardless of ability to pay. This safety net role is consistent with the mission of SHHEC as a Catholic health ministry. As a Catholic health ministry, it is dedicated to spiritually centered, holistic care that sustains and improves the health of individuals and communities. SHHS serves as an advocate for a compassionate and just society through actions and words. SHHS guiding values are as follows: Service to the poor - Generosity of spirit, especially for persons most in need Reverence - Respect and compassion for the dignity and diversity of life Integrity - Inspiring trust through personal leadership Florida Department of Health in Walton County - Wisdom - Integrating excellence and stewardship Creativity - Courageous innovation Dedication - Affirming the hope and joy of our ministry The Florida Department of Health - Walton County and the Walton Community Health Center, Inc. ( FDOH-Walton ) provide public health and medical services in Walton County. FDOH-Walton began providing services from the upper floor of what is now the DeFuniak Springs Police Department in the early 1950 s. Today, FDOH-Walton has more than 100 employees in four locations in Walton County working to serve the needs of Walton County residents in areas that range from controlling infectious diseases to safe drinking water to disaster preparedness. FDOH-Walton works closely with the County Commissioners, the Emergency Response Division and other local and federal agencies to protect the health and welfare of Walton County residents and visitors. Its mission is to protect, promote, and improve the health of all people in Florida through integrated state, county, and community efforts. FDOH-Walton s vision is for Walton County to be the Healthiest County in the Healthiest State in the Nation. Its values (ICARE) are: Innovation - Searching for creative solutions and managing resources wisely Collaboration - Using teamwork to achieve common goals and solve problems Accountability - Performing with integrity and respect Responsiveness Achieving its mission by serving its customers and engaging its partners Excellence - Promoting quality outcomes through learning and continuous performance improvement Walton County, Florida Community Health Needs Assessment Page 4

8 Community Definition Walton County is situated in the Panhandle of Florida and encompasses 1,238 square miles. Approximately 15% of Walton County s land mass is water, and an additional 20% is federally owned as part of Eglin Air Force Base. The county seat is the City of DeFuniak Springs, and the City of Freeport and Town of Paxton are the only other incorporated areas. Because of extended coastline fronting the Gulf of Mexico, there are a number of unincorporated communities oriented toward tourism and seasonal visitors situated in South Walton County. Population In spite of significant population growth, Walton County has a low population density of 50 people per square mile, and is designated as a statutory rural county by the State of Florida. The majority of residents live outside the incorporated cities. Population concentrations are predominantly found in South Walton County along U.S. Route 98 and County Road 30-A, which hug the bay and coast. Historically, Walton County has been one of the fastest growing counties in the United States. The population grew more than 35% between 2000 and Between 2010 and 2014, Walton County population grew 11.4%, compared to total population growth in the State of 5.5% during that period. The population aged 65 and older represent 17.1% of the total population of Walton County, less than the 18.4% this same group represents statewide. Nevertheless, the population of Walton County is somewhat older than that of the State, with a median age of 43.5 compared to 41.8 for the State. Notably, 29.3% of the population of Walton County is between the ages of 45 and 64, compared to 27.0% of the State s population. Total Population Growth, Walton County and State of Florida % Change State of Florida 18,852,220 19,893, % Walton County 55,255 61, % Source: U.S. Census Bureau, Population Division, December 2014 and March Walton County, Florida Community Health Needs Assessment Page 5
9 Population Characteristics Population by Age Cohort 2014 Walton County and State of Florida Almost 21% of the population of Walton County is less than 18 years of age. The majority of Walton County residents are between the ages of 25 and 64, comparable to but more than the percentage of the population in that age bracket in the State. 17.1% of the population of Walton County is aged 65 or older; less than the State as a whole. Males represent 51% of the population of Walton County, compared to approximately 49% of the population Statewide. In the past year, the population aged in Walton County is growing Age Cohort County % of Total State % of Total o 17 12, % 4,098, % , % 1,789, % , % 2,448, % , % 2,345, % , % 2,699, % , % 2,574, % , % 3,591, % Total 59, % 19,548, % F, , % 3,622, % Male 30, % 9,555, % Female 29, % 9,992, % Median Age Source: Florida Charts, at the fastest rate (2.0%), followed by the population aged 65 and older (1.9%). These two age groups are also growing at the fastest rate in the State (2.4% and 2.2%, respectively). Population Growth by Age Cohort, Walton County and State of Florida Walton County State of Florida Age Cohort % Change % Change o ,109 12, % 4,064,864 4,098, % ,529 4, % 1,762,572 1,789, % ,348 7, % 2,403,341 2,448, % ,456 7, % 2,362,567 2,345, % ,646 8, % 2,697,200 2,699, % ,602 8, % 2,515,421 2,574, % 65+ 9,944 10, % 3,512,894 3,591, % Total 58,634 59, % 19,318,859 19,548, % F, ,735 9, % 3,596,432 3,622, % Source: Florida Charts, Population by Race and Ethnicity Minorities represent about 13% of the total population in Walton County, compared to almost 24% of the population of the State. Consistent with that differential, only 5.7% of the population of Walton County is Hispanic, compared to 23.3% of the State s population. Walton County, Florida Community Health Needs Assessment Page 6
10 Population by Race/Ethnicity Walton County and State of Florida Age Cohort County % of Total State % of Total White 50, % 14,747, % Black 3, % 3,114, % Asian/Pacific Islander % 502, % Native American % 59, % Two or More Races 1, % 453, % Other 1, % 484, % Total 57, % 19,361, % Hispanic 3, % 4,517, % Source: U.S. Census Bureau, American Community Survey 5-Year Estimates. Why are these characteristics important? Population growth can strain health care resources and other infrastructure, particularly where limited resources already exist The elderly (population aged 65 and older) utilize 3 to 4 times the healthcare services required by younger populations. Language and cultural differences create the need for different approaches to improving access to health services Socioeconomic Indicators The median household income in Walton County is $43,640, which is 7.1% below the median household income of the State. The percentage of the population living in poverty in Walton County (33.4%) is significantly greater than the percentage in the State (29.0%), as is the percentage of children living in poverty (28.5% versus 23.6%). In addition, a substantially greater percentage of the population over the age of 25 does not have a high school diploma in Walton County compared to the State (23.9% versus 17.3%). However, the unemployment rate in Walton County is only 4.7%, lower than the statewide unemployment rate of 5.6%. Socioeconomic Indicators Walton County and State of Florida Indicator County State Difference Median Household Income $43,640 $46, % Real Per Capita Income $37,976 $41, % Poverty Rate 33.4% 29.0% 4.4% Children in Poverty 28.5% 23.6% 4.9% Unemployment Rate 1 4.7% 5.6% 35.0% Population >25 w/o HS Diploma 23.9% 17.3% 6.6% Population with Limited English Proficiency 9.0% 6.9% 2.1% Note: 1 Data as of August 2015 Sources: U.S. Bureau of labor Statistics; U.S. Department of Commerce, Bureau of Economic Analysis; U.S. Census Bureau; Florida Charts, 2015 Walton County, Florida Community Health Needs Assessment Page 7
11 Why are these characteristics important? Socioeconomic status plays a major role in health and healthcare. It affects access to healthcare services as well as diet, housing conditions, and other environmental conditions that affect health. Generally, the higher your socioeconomic status, the better health care coverage you have, which allows you to get routine check-ups as well as surgery, if and when needed, at lower out-ofpocket cost. It also can enable better access to providers outside of health plan provider networks. The rate of employment is directly correlated with health insurance coverage, since most people still get health insurance through their employer. To some degree, this has changed under the Affordable Care Act through the creation of health insurance exchanges which provide access to health insurance to individuals and families outside of the work place. Even with the relatively low rate of unemployment in Walton County, access to health care services may still be problematic. Employers who do provide health insurance are shifting a greater share of the cost of such coverage to employees through plans with higher deductibles and co-pays. As a result, median household and per capita income are important indicators of access to care. The very low relative income levels of the population in Walton County suggest that access to care may be difficult for much of the population in Walton County. Additional demographic and socioeconomic data for Walton County are provided in Attachment A. Methodology Participants in the CHNA Process The CHNA process was led by SHHS and FDOH-Walton, with active participation by the following community organizations, and private and public agencies which collectively comprise the Walton Community Health Improvement Partnership (WCHIP): Sacred Heart Hospital on the Emerald Coast Sacred Heart Health System Florida Department of Health Walton County Panhandle Warrior Partnership COPE 211 Goodwill Easter Seals Legacy Corps. Florida Department of Children and Families NW Florida Health Council/PanCare Health Easy Mobile Labs Emerald Coast Children s Advocacy Center Walton County Housing Walton Okaloosa Council on Aging COPE Center - Disaster Case Management Program Walton County School District First Baptist Church of Mossy Head Walton County Prevention Coalition Friendship House City of Freeport Walton County Sherriff s Office Walton County Baptist Association Florida Department of Health Holmes/Washington Counties Walton County District 5 Board of County Commissioners West Florida AHEC Catholic Charities of NW Florida Tri-County Community Council/Head Start/Early Head Start Northwest Florida State College Early Learning Coalition of Okaloosa and Walton Counties Emerald Coast Hospice Keller Williams Realty University of Florida Institute of Food and Agricultural Sciences Synergy Community Development, Inc. Early Learning Coalition of Okaloosa and Walton Counties Walton County, Florida Community Health Needs Assessment Page 8
12 Individual members of these organizations and agencies that participated are listed on the sign-in sheets included in each related workshop reports included in Attachments B-E. The CHNA process included WCHIP meetings which occurred between June and December 2015 and continue into 2016, a survey of health and human service organizations, and a community survey distributed both on-line and in paper format. More than 50 people representing more than 30 different community agencies and organizations and the general public participated in various meetings throughout the process. In addition, 253 Walton County residents completed a community survey to provide information about perceptions of the health of the community, its residents, and the health care system. To ensure input was obtained from persons with a broad knowledge of the community, notifications and invitations were sent to numerous stakeholders and representatives of the public. In addition to soliciting input from the general population, special attention was given to obtaining input from vulnerable populations with targeted distribution to area churches, community service provider sites, community centers, and retail outlets. Vulnerable populations were defined to include people who met one of the following criteria: no health insurance; family income of $25,000 or less; or took the survey at site of service for low income populations, e.g., the Department of Health or faith-based health clinics. Assessment Process - MAPP The assessment was developed using the Mobilization for Action through Planning and Partnership (MAPP) method, which was developed by the National Association of City and County Health Officials in concert with the U.S. Centers for Disease Control and Prevention. MAPP is a community-driven strategic planning framework that assists communities in developing and implementing efforts around the prioritization of public health issues and the identification of resources to address them as defined by the Ten Essential Public Health Services. The MAPP process includes four assessment tools: Community Health Status Assessment Community Themes and Strengths Assessment Forces of Change Assessment Local Public Health System Assessment Each of these elements provided a platform for assessing multiple factors from lifestyle behaviors (e.g., diet and exercise) to clinical care (e.g., access to health care services) to social and economic factors (e.g., employment opportunities) to the physical environment. Summary of Findings Quantitative and qualitative data were collected and aggregated in support of the four MAPP elements. Quantitative data were obtained from county, state, and national sources in order to develop a social, economic, and health assessment of Walton County. Sources of data included, but were not limited to, the U.S. Census Bureau, U.S. Centers for Disease Control and Prevention, Florida Department of Law Enforcement, United States Department of Labor, Community Commons, U.S. Department of Commerce, County Health Rankings, Florida Department of Health CHARTS and Environmental Public Health Tracking Network, U.S. Department of Housing and urban Development, and Florida Agency for Health Care Administration. Types of data included public health surveillance data, such as deaths and births. Walton County, Florida Community Health Needs Assessment Page 9
13 Qualitative information was obtained through regular WCHIP meetings, a survey of health and human service organizations, and a community survey distributed both on-line and in paper format to perceptions of health status, concerns, and programs, services, or initiatives which would best address those concerns. While much data analysis was conducted throughout the assessment period, review of the data and information and community participation in development of the findings and conclusions of each MAPP Assessment occurred in a series of community workshops. These workshops encompassed the following topics: Forces of Change Assessment (detailed report, Attachment B) Local Public Health System Assessment (detailed report, Attachment C) Community Themes and Strengths Assessment (detailed report, Attachment D) Community Health Status Assessment (Attachment E) The work that was performed, findings reviewed, and conclusions reached in each of these assessments is summarize below. Community Themes and Strengths Assessment The purpose of the Community Themes and Strengths Assessment ( CTSA ) is to gain a better understanding of community perceptions about health and quality of life; to provide useful information for local programmatic and fiscal decision-making; and to inform the development of a strategic community health improvement plan. Surveys and focus groups were used to gather insight into issues of concern, as well as local assets and resources related to health and quality of life. In July and August 2015, SHHEC, FDOH-Walton, and WCHIP jointly conducted the CTSA. The survey was distributed to the general and vulnerable populations and was made available in paper and on-line formats. WCHIP members identified and distributed paper surveys to key populations based on geography, income, and race. In some cases, volunteers were made available to assist in completion of the survey. A Spanish version of the survey was also created and distributed. The survey focused on identifying respondent perceptions of the most important factors for a healthy community, most important health problems, and risky behaviors in Walton County. A separate but similar survey was distributed to Health and Human Services organizations covering similar topics. A focus group was also conducted to gather additional insights. Survey Results 253 community-wide surveys (160 on-line and 93 paper) and 30 surveys from Health and Human Services organizations were completed and used for the CTSA. A demographic breakdown of survey respondents compared to the overall population of Walton County is provided below. Survey Demographics Respondents Walton Population * Female 86% 49% Black/African American 7.5% 5.9% White/Caucasian 90% 84.2% Bachelor s Degree or Higher 36.4% 24.1% Unemployed 4.8% 4.4% Income Less Than $35,001/Year * Census Quick facts. 45% Median Income $43,640 Ages % Respondent Age Group Distribution Age 75+ 4% Ages % Ages % Ages % Ages % Walton County, Florida Community Health Needs Assessment Page 10
14 Responses from the community surveys were analyzed and compared to responses obtained from the survey of Health and Human Services organizations to understand areas of overlap and variance. The following are summaries of the top responses for each group for key survey questions: What are the most important features of a Healthy Community? Health & Human Services Organizations Access to health services, e.g., family doctor, hospitals Quality hospitals and urgent/emergency services Good employment opportunities Good schools Low alcohol and drug abuse Why is this important? Community Good employment opportunities Low crime/safe neighborhoods Access to healthcare services, e.g., family doctor, hospitals Good schools Quality of Life ( QOL ) reflects an overall sense of well-being when applied to an individual and a supportive environment when applied to a community While some dimensions of QOL can be quantified using indicators, research has shown QOL to be related to determinants of health and community wellbeing. Other valid dimensions of QOL include perceptions of community residents about aspects of their neighborhoods and communities that either enhance or diminish their quality of life. What are the most important heath issues in the County? Health & Human Services Organizations Heart Disease and Stroke Mental health problems Cancers Obesity/excess weight Aging problems, e.g., dementia, vision/hearing loss, loss of mobility Diabetes Why is this Important? Community Obesity/excess weight Mental health problems Child abuse/neglect Cancers Heart disease and stroke Diabetes This information leads to a portrait of the community as seen through the eyes of its residents. Perceptions about health problems that exist in Walton County correlate with county-specific data and help to pinpoint specific concerns. Which unhealthy behaviors in the County are of greatest concern? Health & Human Services Organizations Drug abuse Excess weight Poor eating habits/poor nutrition Not seeing a doctor or dentist Alcohol abuse Lack of exercise Tobacco use Why is this Important? Community Drug abuse Alcohol abuse Poor eating habits/poor nutrition Not seeing a doctor or dentist Excess weight Tobacco use Walton County, Florida Community Health Needs Assessment Page 11
15 High-risk behaviors, by definition, are lifestyle activities that place a person at increased risk of suffering a particular condition. Risky behaviors put people at risk for bad consequences, e.g., smoking puts one at risk for cancer and being overweight puts one at risk for a heart attack. Systematic change using evidence-based interventions to change high-risk behaviors is recommended by the Independent Task Force on Community Preventive Services. Which healthcare services are difficult to get in the County? Health & Human Services Organizations Specialty medical care (specialist doctors) Primary medical care (a primary care doctor/ clinic) Alcohol or drug abuse treatment Mental health services Services for the elderly Alternative therapies (acupuncture, herbals, etc.) Preventative healthcare (routine or wellness check-ups, etc.) Why is this Important? Community Specialty medical care (specialist doctors) Dental care including dentures Mental health services Primary medical care (a primary care doctor/ clinic) Alcohol or drug abuse treatment Perceptions of lack of access to healthcare services may arise for several reasons, including absence of resources or lack of sufficient resources, or lack of awareness of their existence or how to access them. Perceptions of lack of access to particular healthcare services can be correlated with health indicator status to increase resources in areas that may have the greatest impact on health status. In addition to understanding differences in perspectives between Health and Human Services organizations and the general public, the survey also sought to identify specific variances in access to and use of healthcare services between the general population and more vulnerable population groups. The comparison of their perspectives on two key issues is provided below. In the past 12 months, for what reasons have you delayed getting medical care? General Population Did not have a delay in getting care Could not get an appointment soon enough Provider was not taking new patients Could not afford Why is this Important? Vulnerable Population Did not have a delay in getting care Could not afford Insurance problems or lack of insurance Delayed medical care can result in worsening of conditions and the need for more urgent medical care, frequently in the most expensive setting, e.g., the emergency room. Identification of the causes of delays in obtaining care can provide insights into strategies to improve access and reduce cost. Where do you go for medical care when someone in the family is sick? General Population My family doctor Urgent care clinic Vulnerable Population My family doctor Hospital emergency room Health Department Walton County, Florida Community Health Needs Assessment Page 12
16 Why is this Important? Identifying where members of different population groups seek care can provide better focus for resource development and distribution and/or insights for strategies to steer people into more appropriate, less costly care settings. As borne out in the survey responses, vulnerable population groups tend to utilize the hospital emergency room for basic medical care, which creates a burden on the entire health system through higher costs. Where do you go for mental health services when someone in the family needs them? General Population Private psychologist, psychiatrist, or other mental health professional I do not know where to go for mental health care My family doctor Mental health clinic in Walton County Why is this Important? Vulnerable Population I do not know where to go for mental health care My family doctor Mental health clinic in Walton County There are many reasons people may not seek healthcare services in a timely manner. Probably the easiest reason to address is lack of awareness. While the general population appears to be very familiar and have access to multiple resources for mental health services, the number one response for vulnerable populations is lack of awareness of resources, which can be addressed through public awareness campaigns and other means. The fact that both populations identify their family doctor as one of the primary resources for mental health services highlights the need to assess the level of awareness of and comfort in handling mental health issues among primary care physicians in the area and to provide additional training and education, if necessary, to accommodate the needs of area residents. More detailed survey response data are provided in Attachment D. Focus Group Discussion On November 17, 2015, a focus group discussion was held to further explore perceptions of health and well-being along Walton County residents. The focus group covered seven questions: 1. Are you satisfied with the quality of life in our community? 2. Is this community a good place to raise children and grow older? 3. What do you believe are the 2 3 most important characteristics of a health community? 4. Do all individuals and groups have the opportunity to contribute to and participate in the community s quality of life? 5. What do you believe is keeping our community from doing what needs to be done to improve health and quality of life? 6. What do you believe are the 2 3 most important issues that must be addressed to improve the health and quality of life in our community? 7. What makes you most proud of our community? Walton County, Florida Community Health Needs Assessment Page 13
17 Following the focus group, the notes from the focus group were reviewed, responses to each question were coded and categorized to identify themes, finding for each question were summarized, and any patterns or connections between questions were identified. In general, participants discussed several areas where they felt change was needed. Similar issues were mentioned when participants were asked to focus on the most important issues affecting health and quality of life in Walton County. These recurring issues were aggregated into common themes and divided into two main categories; socioeconomic issues and health-related issues. The following is a summary of the themes that emerged from the focus group. Summary of Themes from Focus Group Socioeconomic Issues Health-Related issues Poverty Access to care Education Cultural diversity Employment Transportation A more detailed description of each category and its associated themes is provided in the complete Community Themes and Strengths Assessment, provided in Attachment D. Community Strengths and Weaknesses A summary of community strengths and weaknesses (opportunities for improvement) was developed based on the results of the community surveys, Health and Human Service organization surveys, and focus group discussion. The summary is provided below. Strengths Resources Volunteers/mentoring Faith-based organizations Safety Good mixture of income levels Future growth Collaboration Low pollution Technical training in high schools Future technical skilled jobs Boys & Girls Club Environment/location/weather County finances Recreational facilities Good healthcare providers Weaknesses (Opportunities for Improvement) Transportation Quick growth/infrastructure Jobs with thrive-able wage Substance abuse Lack of healthcare providers location Lack of insurance coverage Housing affordable/rentals Lack of specialty physicians Lack of empowerment programs Communication within the community Health issues: o Obesity/excess weight o Mental health problems o Cancers o Child abuse/neglect o Heart disease and stroke Health behaviors: o Drug abuse o Alcohol abuse o Poor eating habits/poor nutrition o Not seeing a doctor or dentist o Excess weight The complete Community Themes and Strengths Assessment is provided in Attachment D. Walton County, Florida Community Health Needs Assessment Page 14
18 Forces of Change Assessment On October 21, 2015, the Walton County MAPP Executive Committee convened to participate in Phase one of the Forces of Change Assessment ( FOCA ). The purpose of the FOCA is to identify forces such as trends, factors, or events that are or will be influencing the health and quality of life of the community and the work of the local public health system. Trends are patterns over time, such as migration in and out of a community or a growing disillusionment with government. Factors are discrete elements, such as a community s large ethnic population, an urban setting, or the jurisdiction s proximity to a major waterway. Events are one-time occurrences, such as a hospital closure, a natural disaster, or the passage of new legislation. Forces considered include the following categories of influence: (1) Social (2) Economic (3) Political (4) Legal Other categories of forces of change specific to the county were also considered. Forces of Change in Walton County New dental school in DeFuniak Springs Lack of health insurance Population & wages Transportation Business locations Inadequate education and training for jobs requiring higher skill set New business growth in unpopulated areas Technological/ Scientific (5) Environmental (6) Technological (7) Scientific Economic Environmental Legal/Political Social BP oil spill Flooding from Political elections 2014 storm Meaningful Use Availability (lack) of fiber optics and cable providers in Walton County Infrastructure concerns Growth in telehealth Increasing use of social media and smart phones Four lining project of Highway 331 Increasing ethnic population Limited water supply Large wetland areas Large protected areas (Eglin) Higher density of Cities New communities being created in rural areas Increased water use Increased sewage Providers retiring due to Affordable care Act ( ACA ) Legalization of medical marijuana Privatization of primary care (HMOs) Decrease in Low Income Pool ( LIP ) funding Increase in governmental revenue from BP settlement Implementation of ACA Immigration rules and regulations Lack of expansion of adult Medicaid Increased drug use Increased enforcement by DOH and law enforcement (due to increase in staff) Increase in provider education Growing disillusionment with Government Tobacco-free policies and E- cigarette use County Health Department shifting focus to core public health Uneven distribution of healthcare providers Lack of affordable housing Inadequate mental health care services Notable economist prediction of population spike north of the Bay Residential changes and needs Walton County, Florida Community Health Needs Assessment Page 15

19 Phase two of the FOCA was completed through use of an online survey in which the MAPP Executive Committee members responded to the following questions for each Force of Change identified in Phase one: When you think about public health and the health of our residents what is a Threat or Challenge as a result of? When you think about public health and the health of our residents what is an Opportunity as a result of? Following the collection of the surveys, notes from Phase one were added to the responses and a summary was created, which is provided in the full Forces of Change Assessment, provided in Attachment B. Local Public Health System Assessment The LPHS in Walton County is a diverse mix of organizations and institutions in both the public and private sector. The diagram displays the various relationships local entities have within the interconnected web of the LPHS. The LPHS Assessment conducted in January 2016 required participants to think about how well the collective LPHS meets the Ten Essential Public Health Services. Participants were asked to think about their personal experiences and knowledge of events over the past three years and answer a series of questions centering on the LPHS s community engagement as it relates to the Ten Essential Public Health Services. Each question started with At what level does the LPHS and was evaluated on the following scale: Optimal Significant Moderate Minimal No Activity greater than 75% 50 75% 26 50% 1 25% 0% I Don t Know The first set of questions polled all relate to the Essential Public Health Service #1 and answer the questions, What is going on in our community? and Do we know how healthy we are? The feedback conveyed satisfaction with the LPHS s level performance with an average overall score in the Significant range (62%). Eight (8) out of Ten (10) of the Essential Service poll scores ranked LPHS performance over 50% ( Significant ), with development of policies and plans scoring an Optimal score (77.1%), nearly 50% of participants responded that the LPHS is doing an optimal or significant job. Detailed results on these and all other polled questions related to the Ten Essential Public Health Services are provided in the full Workshop Report, provided in Attachment C. Walton County, Florida Community Health Needs Assessment Page 16
20 Community Health Status Assessment Health Status Indicators A review of health status assessments from the following organizations: Healthy People 2020, Community Commons, Florida CHARTS County Health Profile, University of Wisconsin and Robert Wood Johnson s County Health Rankings, and previous assessments revealed a cross section of many common indicators. From this cross section, state and county data for 140 health status indicators and 30 demographic indicators were collected. Between July and October 2015, WCHIP analyzed these health status indicators using County Health Ranking s model of population health as a framework. This model, depicted below, emphasizes that many factors, when addressed, can improve the overall health of a community. Framework for Analysis The Ten Essential Public Health Services 1. Monitor Health Status: What is going on in our community? Do we know how healthy we are? 2. Diagnose and Investigate: Are we ready to respond to healthy problems in our community? How quickly do we find about problems? How effective is our response? 3. Inform, Educate & Empower: How well do we keep all populations within our community well informed about health issues? 4. Mobilize Community Partnerships: How well do we truly engage people in local health issues? 5. Develop Polices & Plans: What local policies in both government and private sector promote health in our community? How well are we setting local health policies? 6. Enforce Laws: When we enforce health regulations, are we fair, competent and effective? 7. Link People: Are people in the community receiving the health services they need? 8. Assure: A Competent Workforce: Do you have competent healthcare staff? 9. Evaluate: Are we meeting the needs of the population we serve? Are we doing things right? Are we doing the right things? 10. Research: Are we discovering and doing new ways to get the job done? To identify the issues that hold the greatest priority for the community, the indicator results were evaluated within the framework of the County Health Rankings Model created by the University of Wisconsin Population Health and the Robert Wood Johnson Foundation. The framework emphasizes factors that, when improved, can help improve the overall health of a community. This model is comprised of three major components: Health Outcomes - This component evaluates the health of a community as measured by two types of outcomes: how long people live (Mortality / Length of Life) and how healthy people are when they are alive (Morbidity / Quality of Life). Health Factors - Factors that influence the health of a community including the activities and behavior of individuals (Health Behaviors), availability of and quality of health care services (Clinical Care), the socio-economic environment that people live and work in (Social and Economic Factors) and the attributes and physical conditions in which we live (Physical Environment). Although an individual s biology and genetics play a role in determining health, the community cannot influence or modify these conditions and therefore these factors are not included in the model. These factors are built from the concept of Social Determinants of Health (see inset). Programs and Policies - Policies and programs at the local, state and federal level have the potential to impact the health of a population as a whole (i.e. smoke free policies or laws mandating childhood immunization). As illustrated, Health Outcomes are improved when Policies & Programs are in place to improve Health Factors. Walton County, Florida Community Health Needs Assessment Page 17

21 Data sources included: Florida CHARTS, Florida Department of Health, Agency for Health Care Administration, County Health Rankings and Roadmaps, Florida Department of Children and Families, US Department of Health & Human Services, Feeding America, USDA Economic Research Service, Florida Department of Law Enforcement, US Census Bureau, Federal Bureau of Labor and Statistics, and US Department of Housing and Urban Development. Over the course of the four months, small committee meetings were held to review and assess the data. In these small committee meetings, over 140 health indicators for Walton County were compared and contrasted to those for the state and surrounding counties. In addition, the committee members also compared local data to previous years data from Walton County, highlighting improvements and statistical trends. Summary of Findings Of those approximately 140 health status indicators, the following 95 indicators performed worse than the State for Walton County. Health Outcomes Mortality Length of Life Alcohol-Related Motor Vehicle Traffic Crash Deaths Cancer Deaths Chronic Liver Disease, Cirrhosis Deaths Chronic Lower Respiratory Disease Deaths Colon, Rectal or Anus Cancer Deaths Deaths from Smoking-related Cancers Diabetes Deaths Heart Disease Deaths Infant Mortality Injury Deaths Lung Cancer Deaths Motor Vehicle Accident Deaths Neonatal Deaths (0-27 Days) Nephritis, Nephritic Syndrome, and Nephrosis Deaths Post Neonatal Deaths ( Days) Premature Death Prostate Cancer Deaths Suicide Deaths Walton County, Florida Community Health Needs Assessment Page 18
22 Morbidity Quality of Life Health Factors Health Behaviors Clinical Care Socioeconomic Physical Environment Average number of days where poor mental or physical health interfered with activities of daily living in the past 30 days Cervical Cancer Incidence Chicken Pox Heart Disease (Adult) High Cholesterol (Adult) Aggravated Assault Alcohol Consumption in Past 30 Days (Adolescents) Alcohol Consumption in Lifetime (Adolescents) Alcohol-Related Motor Vehicle Traffic Crashes Binge Drinking (Adolescents) Births to Mothers Ages Births to Mothers Ages Births to Mothers Ages Births to Obese Mother (Rate) Blacking Out from Drinking Alcohol (Adolescents) Breast feeding Initiation Cancer Screening: PSA in past 2 years (Men 50 and up) Cigarette Use (Adolescents) Acute Care Beds Adult Psychiatric Beds Adult substance abuse beds Cancer Screening Mammogram Cancer Screening Pap Test Child and Adolescent Psychiatric Beds Dental Care Access by Low Income Persons Dentists Diabetic Annual Foot Exam (Adults) Diabetic Semi-Annual A1C Testing (Adult) ED Visits - Avoidable Conditions - Dental ED Visits - Chronic Conditions - Angina ED Visits - Chronic Conditions - Congestive Heart Failure Children in Poverty (Based on Household) Food Access Low Low Income Population Air Quality Ozone Drinking Water Violations Lung Cancer Incidence Meningitis, Other Bacterial, Cryptococcal, or Mycotic Salmonellosis Tuberculosis Vaccine Preventable Disease for All Ages Whooping Cough (Pertussis) Diabetic monitoring Domestic Violence Offenses Exercise Opportunities Forcible Sex Offenses Fruits and Vegetables Consumption 5 Servings per Day Healthy Weight (Youth) Live Births Where Mother Smoked During Pregnancy Medicaid Birth Rate Middle and High School Students Who Are Overweight or Obese Never Smoked (Adult) Obesity (Adult) Secondhand Smoke Exposure (Youth) Sedentary Adults Smoked in Last 30 Days (Youth) Smokers (Adult) ED Visits - Chronic Conditions Diabetes ED Visits - Chronic Conditions Hypertension Family Practice Physicians Flu Vaccination in the Past Year (Adult) Flu Vaccination in the Past Year (Adult Age 65 and Older) Insurance Uninsured Adults Insurance Uninsured Children Internists Mental Health Providers OB/GYNs Pediatricians Physicians Pneumonia Vaccination (Adult) Prenatal Care Begun Late or No Prenatal Care Primary Care Access Rehabilitation Beds (per Population Poverty Rate Public Assistance Income Real Per Capita Income Unemployment Grocery Store Access Severe Housing Problems A detailed listing of the health status indicators, definitions and sources for the State and Walton County are provided in Attachment A. Walton County, Florida Community Health Needs Assessment Page 19
23 Priority Setting Process In November 2015, the Walton County MAPP Executive Committee formed a Data Committee which met to review the results of all of the data and Assessments that had been collected and developed todate. The Committee compiled a list of 50 indicators that were of greatest concern (where Walton County performed the worst compared to the State and to prior year results). Using this list of indicators and the County Health Ranking s model of population health depicted on page 10 as a framework, the Committee identified the top five (5) priority health issues facing Walton County. The top health issues identified were: Provider Availability and Access Preventive Care Healthy Weight Tobacco Use Substance Abuse and Mental Health On November 17, 2015, WCHIP held a community meeting to identify the top priority health issues for the County. The results of the MAPP Assessments were presented to the 26 participants representing health and human service providers in the community. In reviewing the identified top five health issues, the participants were asked to consider three criteria for prioritizing the top issues: 1. Severity/Magnitude (of the health issue) 2. Feasibility to Address (availability of resources, community will) 3. Potential Impact (on community health status) After reviewing the results of the MAPP Assessments and taking into consideration these prioritization criteria, participants used a hybrid multi-voting/nominal group technique to identify the top health issues facing Walton County. The complete Community Health Status Assessment is provided in Attachment E. Top Priority Health Issues for Walton County The top priority health issues identified were: Substance Abuse and Mental Health Healthy Weight Provider Availability and Access A synopsis of each of these issues is provided in the following sections. Walton County, Florida Community Health Needs Assessment Page 20
24 Substance Abuse and Mental Health Substance Abuse Substance abuse refers to a set of related conditions associated with the consumption of mind- and behavior-altering substances that have negative behavioral and health outcomes. Social attitudes and political and legal responses to the consumption of alcohol and illicit drugs make substance abuse one of the most complex public health issues. In Walton County, the primary substance abuse problem appears to be alcohol consumption, particularly among adolescents. Rates for adolescents in Walton County are higher than rates statewide for all alcohol-related health indicators. However, Walton County improved in all categories compared to the prior period. Poor performing indicators for Walton County (compared to the State or the prior year for the County) related to substance abuse are highlighted below. Indicator Walton County Most Recent Period Prior Period State of Florida Alcohol Consumption in Past 30 Days Adolescents (Rate) Alcohol Consumption in Lifetime Adolescents (Rate) Binge Drinking Adolescents (Rate) Blacking Out from Drinking Alcohol Adolescents (Rate) 23.4 N/A 18.9 Despite the high rate of adolescent alcohol use, there are currently no substance abuse beds located in Walton County, compared to 1.7 adult substance abuse beds per population in the State. The effects of substance abuse are cumulative and significantly contribute to costly social, physical, mental, and public health problems. These problems include, but are not limited to: Teenage pregnancy Human immunodeficiency virus/acquired immunodeficiency syndrome (HIV/AIDS) Other sexually transmitted diseases (STDs) Domestic violence Child abuse Motor vehicle crashes Crime Homicide Suicide Not surprisingly, given the prevalence of substance abuse in Walton County, particularly among adolescents, the County has a higher (and, in some cases, a substantially higher) rate of many of these problems than statewide. Of particular concern are the rates of alcohol-related motor vehicle traffic crashes and deaths which, although they have improved compared to the prior period, are almost double and triple, respectively, those rates statewide. The rate of teenage pregnancy is also of concern in Walton County, with rates substantially higher than statewide and higher than in the prior period. Walton County, Florida Community Health Needs Assessment Page 21
25 Poor performing indicators for Walton County (compared to the State or the prior year for the County) related to these negative outcomes are highlighted below. Indicator Walton County State of Most Recent Prior Florida Period Period Births to Mothers Age Resident (Rate) Births to Mothers Age Resident (Rate) Domestic Violence Offenses (Rate per 100,000) Alcohol-Related Motor Vehicle Traffic Crashes (Rate) Alcohol-Related Motor Vehicle Traffic Crash Deaths (Rate) Aggravated Assault (Rate per 100,000) Violent Crime (Rate per Population) Suicide Deaths (Rate) It should be noted that, despite the substance abuse problem in the County and the high rates of many of the problems associated with substance abuse, the rates of sexually transmitted diseases, including HIV/AIDS and infectious syphilis, are substantially lower in the County than they are statewide. Mental Health Mental health is a state of successful performance of mental function, resulting in productive activities, fulfilling relationships with other people, and the ability to adapt to change and to cope with challenges. Mental disorders are health conditions that are characterized by alterations in thinking, mood, and/or behavior that are associated with distress and/or impaired functioning. Mental illness is the term that refers, collectively, to all diagnosable mental disorders. Mental disorders contribute to a host of problems that may include disability, pain, or death. Mental disorders are among the most common causes of disability. The resulting disease burden of mental illness is among the highest of all diseases. In addition, mental health and physical health are closely connected. Mental health plays a major role in people s ability to maintain good physical health and participate in health-promoting behaviors. In turn, problems with physical health, such as chronic diseases, can have a serious impact on mental health and decrease a person s ability to participate in treatment and recovery. In Walton County, 29.6% of respondents to the Community Health Status Assessment survey indicated that they felt that mental health problems were one of the most important health issues facing the County, ranking it second only to obesity/excess weight as an area of concern to county residents. Social Service organizations also rated it second highest of the most important health issues facing the County (43.3% of responses). However, only 4.9% of respondents indicated that they had been told by a health professional that they had a mental health problem. Of course, this finding could be misleading due to the self-reported nature of the survey and self-selection, i.e., people suffering from mental health problems may be less likely to have completed the survey. The County performed relatively well compared to the State with regard to mental health-related health status indicators. For instance, although slightly higher than the prior year, there were ED visits per 1,000 visits for mental health issues in Walton County compared to per 1,000 ED visits in the State. The relatively high number of such visits in the County and the State suggests that mental health problems may be a significant problem statewide. In addition, Walton County experienced an average of 3.3 unhealthy mental health days, compared to 4.1 for the State. There are currently no adult or pediatric psychiatric beds located in Walton County, compared to 20.0 and 2.70 beds per population, respectively, in the State. In addition, there are many fewer mental health Walton County, Florida Community Health Needs Assessment Page 22
26 providers in the County to serve the population in need compared to the State. In Walton County, there is one mental health provider per 1,495 people compared to one per 744 people in the State. Resources in Walton County potentially available to address this priority include the following: ARC Area Agency on Aging Caring & Sharing Catholic Charities Children in Crisis Children s Volunteer Health Network COPE Center, Inc. Covenant Hospice Department of Children & Families Elder Affairs Emerald Coast Children s Advocacy Ctr. Families First Network Healthmark Regional Medical Center Lutheran Services Sacred Heart Health Systems Shelter House The Matrix Community Outreach Center Tri-County Community Council 211 Panhandle HelpLine United Way Walton County Prevention Coalition Walton County Sheriff s Office West Florida AHEC Mental Health and Substance Abuse, and related indicators Legend: County Performance County Trend: Worse than Florida Worsening: increasing or decreasing Better than Florida Improving: increasing or decreasing Same as Florida No Change Health Outcome - Mortality (Deaths) Walton County Indicator Latest Data Period Performance Trend Infant Mortality Neonatal Deaths (0-27 days) Post neonatal Deaths ( days) Chronic Liver Disease, Cirrhosis Deaths HIV/AIDS Deaths Suicide Deaths Motor Vehicle Accident Deaths Injury Deaths Homicide Health Outcome - Morbidity (Quality of Life) Walton County Indicator Latest Data Period Performance Trend Low birth weight Hepatitis C, Acute Walton County, Florida Community Health Needs Assessment Page 23
27 HIV AIDS Unhealthy mental days Average number of days where poor mental or physical health interfered with activities of daily living in the past 30 days Health Behavior - Alcohol / Substance Abuse Walton County Indicator Latest Data Period Performance Trend Alcohol-related Motor Vehicle Traffic Crash Deaths Alcohol-related Motor Vehicle Traffic Crashes Blacking out from drinking Alcohol (Adolescents) Marijuana or Hashish Use (Adolescents) Alcohol Consumption in past 30 days (Adolescents) Alcohol Consumption in Lifetime (Adolescents) Binge Drinking (Adolescents) Health Behavior - Sexual Activity Walton County Indicator Latest Data Period Performance Trend Births to Mothers under the age of Majority (10-14) Births to Mothers under the age of Majority (10-16) Clinical Care Access to Health Care Walton County Indicator Latest Data Period Performance Trend Adult psychiatric beds Adult substance abuse beds Pediatric psychiatric beds Walton County, Florida Community Health Needs Assessment Page 24
28 Clinical Care Quality of Care Walton County Indicator Latest Data Period Performance Trend ED Visits - Chronic Conditions - Mental Health Social and Economic Factors Walton County Indicator Latest Data Period Performance Trend Domestic Violence Offenses Forcible Sex Offenses Aggravated Assault Murder Property Crimes ,530 Violent Crime Walton County, Florida Community Health Needs Assessment Page 25
29 Healthy Weight Obesity is common, serious, and costly. According to the Florida Department of Health, the number one public health threat to Florida's future is unhealthy weight. The estimated annual medical cost for people who are obese is $1,429 higher than that for people of healthy weight. Currently, only 36 percent of Floridians are at healthy weight. With the current national trend, by 2030, almost 60 percent will be obese. Additionally, six out of ten children born today will be obese by the time they graduate high school. Walton County Weight Status - Body Mass Index (BMI) Adult Adolescents Healthy Weight Overweight Underweight Adults (21 and over) Obesity 30.0 or higher Overweight 25.0 and 29.9 Children & Adolescents (2-20 years) Obesity above the 95th percentile of the sexspecific CDC BMI for-age growth chart In Walton County, excess weight and obesity is a serious problem. 39.9% of respondents to the Community Health Status Assessment survey indicated that obesity/excess weight is one of the most important health issues facing the County, ranking it first as an area of concern to county residents. Among Social Service organizations, it tied for third highest ranked of the most important health issues facing the County (33.3% of responses). These perceptions are supported by the data. In most of the indicator categories directly related to weight, Walton County performs worse than the State overall and, in many, the problem has gotten worse compared to the prior period. In addition, despite the beautiful surroundings and environment in many parts of the County, Walton County residents are far less active than residents of the State overall. A lack of proper exercise habits contributes to making excess weight and obesity a priority health issue in Walton County. Walton County, Florida Community Health Needs Assessment Page 26
30 Poor performing indicators for Walton County (compared to the State or the prior year for the County) related to weight are highlighted below. Indicator Walton County Most Recent Period Prior Period State of Florida Healthy Weight (Adolescents) 66.3% 66.0% 67.6% Obesity (Adult) 29.2% 28.6% 26.4% Overweight and Obese (Adolescents) 30.0% 29.6% 28.2% Births to Obese Mothers 21., Fruits and vegetables Consumption (5 Servings) 15.1% 26.3% 18.3% Exercise Opportunities 66% 38% 93% Sedentary Adults 26.2% 28.1% 27.7% Obesity is a major contributor to many preventable chronic diseases and other poor health outcomes, including, but not limited to: Premature death Type 2 diabetes (noninsulin-dependent diabetes) Some cancers Heart disease High blood pressure (hypertension) High cholesterol (dyslipidemia) Osteoarthritis Complications during pregnancy Not surprisingly, given the prevalence of weight problems in Walton County, the rates of many of these diseases and poor health outcomes in Walton County are higher than statewide. The good news is that many of these rates have improved compared to the prior period in Walton County. Poor performing indicators for Walton County (compared to the State or the prior year for the County) related to these chronic diseases and outcomes are highlighted here. Unhealthy weight is a complicated issue to address. To insure the effectiveness of High Blood Pressure (Adult) interventions, it is important to understanding the personal, social, economic, and environmental barriers to and facilitators of changes in diet or physical activity including: Factors Influencing Diet Knowledge and attitudes Skills Social support Societal and cultural norms Food and agricultural policies Food assistance programs Economic price systems Marketing/advertising (which influences people s, particularly children s, food choices) Access to and availability of healthier foods Where people eat (at home or away from home), e.g., foods eaten away from home often have more calories and are of lower nutritional quality than foods prepared at home Indicator Factors Influencing Physical Activity Walton County Prior Period Most Recent Period State of Florida Premature Death (per Population) 7,712 9,002 6,893 Diabetes Deaths (per Population) ED Visits - Diabetes (per 1,000 Visits) Cancer Deaths (per Population) Heart Disease (Adult) Heart Disease Deaths (per Population) Low income Lack of time Low motivation Rural residency Lack of social support from peers, family, or spouse Overweight or obesity Age and/or Disabilities (inaccessibility) Physical environment: Presence of sidewalks Access to public transportation Access to neighborhood or school play area and/or recreational equipment Lack of transportation to facilities Fear of injury Walton County, Florida Community Health Needs Assessment Page 27
31 Resources in Walton County potentially available to address this priority include the following: COPE Center, Inc. Healthmark Regional Medical Center Department of Children & Families North West Florida State College Florida Department of Health, Walton Sacred Heart Health Systems County Walton Board of County Commissioners Early Learning Coalition Walton Community Health Center, Inc. Emerald Coast Children s Advocacy Ctr. Walton County School District Families First Network Healthy Weight and related indicators Legend: County Performance County Trend: Worse than Florida Worsening: increasing or decreasing Better than Florida Improving: increasing or decreasing Same as Florida No Change Health Outcome - Mortality (Deaths) Walton County Indicator Latest Data Period Performance Trend Premature Death ,712 Cancer Deaths Colon, Rectal or Anus Cancer Deaths Diabetes Deaths Heart Disease Deaths Stroke Deaths Health Outcome - Morbidity (Quality of Life) Walton County Indicator Latest Data Period Performance Trend Total Cancer Incidence Breast Cancer Incidence Colon and Rectum Cancer Incidence Diabetic monitoring Diabetes (Adult) High Blood Pressure (Adult) High Cholesterol (Adult) High Blood Pressure Controlled (Adult) Heart Disease (Adult) Low birth weight Poor or fair health Walton County, Florida Community Health Needs Assessment Page 28
32 Health Behavior - Diet and Exercise Walton County Indicator Latest Data Period Performance Trend Healthy Weight (Adult) Overweight (Adult) Obesity (Adult) Births to Obese Mothers Births to overweight mothers Breast feeding Initiation Overweight (Adolescents) Overweight or Obesity (Adolescents) Healthy Weight (Adolescents) Vigorous physical activity recommendations met (Adult) Exercise opportunities 2013 & Sedentary Adults Fruits and Vegetables Consumption 5 servings per day (Adult) Food Insecurity Grocery Store Access Food Access Low - Low Income Population Fast Food Restaurant Access SNAP Participants % Clinical Care - Access to Care Walton County Indicator Latest Data Period Performance Trend Diabetic Annual Foot Exam (Adults) Diabetic Semi-Annual A1C Testing (Adult) ED Visits - Acute Conditions - Hypoglycemia ED Visits - Chronic Conditions - Congestive Heart Failure ED Visits - Chronic Conditions - Diabetes ED Visits - Chronic Conditions Hypertension Admitted ED Visits Diabetes Physical Environment Walton County Indicator Latest Data Period Performance Trend Households with No Motor Vehicle % Driving alone to work % Use of Public Transportation % Walton County, Florida Community Health Needs Assessment Page 29
33 Provider Availability and Access Access to comprehensive, quality health care services is important for the achievement of health equity and for increasing the quality of a healthy life for everyone. Access to health care impacts: Overall physical, social, and mental health status Prevention of disease and disability Preventable hospitalization Detection and treatment of health conditions Quality of life Preventable death Life expectancy Access to health services encompasses four main components: Coverage Health insurance coverage helps patients get into the health care system. Uninsured (and underinsured) people are less likely to receive medical care, more likely to die early, and are more likely to have poor health status. The percentage of the population that is uninsured in Walton County is substantially lower than it is statewide. However, the percentage in Walton County increased slightly compared to the prior period. Of greater concern is the rate of uninsured among children, which is higher than statewide and increased in Walton compared to the prior period. In addition, these rates do not account for those who are underinsured or who have coverage in high deductible plans, which are becoming increasingly prevalent. As a result, median household and per capita income are important indicators of access to care. The low relative income levels of the population in Walton County suggest that access to care may be difficult due to coverage issues for an even larger percentage of the population. Poor performing indicators for Walton County (compared to the State or the prior year for the County) related to coverage issues are highlighted below. Services Indicator Walton County State of Most Recent Prior Florida Period Period Population Receiving Medicaid (Rate/100,000) 13,140 12,344 16,601 Insurance Uninsured Adults Insurance Uninsured Children Median Household Income $43,640 $44,254 $46,956 Real Per Capita Income $37,976 $38,072 $41,497 Improving health care services depends in part on ensuring that people have a usual and ongoing source of care. People with a usual source of care have better health outcomes and fewer disparities and costs. The Health Resources and Services Administration ( HRSA ) defines areas and populations as Medically Underserved based on four weighted variables - ratio of primary medical care physicians per 1,000 population, infant mortality rate, percentage of the population with incomes below the poverty level, and percentage of the population age 65 or over. In Walton County, only about 20% of the adult population does not have a personal doctor, compared to more than 25% statewide. However, this percentage increased in Walton County from the prior period. Despite the high percentage of adults who have a personal doctor, the County has far fewer primary care physicians per population than overall for the State, including family practitioners, Walton County, Florida Community Health Needs Assessment Page 30
34 internists, OB/GYN physicians, and pediatricians. Other services that are not available in Walton County include adult and pediatric psychiatric beds, adult substance abuse beds, and physical rehabilitation beds. These findings suggest that access to care may be limited in Walton County due to lack of available services. Poor performing indicators for Walton County (compared to the State or the prior year for the County) related to services are highlighted below. Timeliness Indicator Walton County State of Most Recent Prior Florida Period Period Adults who have a personal doctor Family Practice Physicians (per Population) Internists (per Population) Pediatricians (per Population) OB/GYN (per Population) Infant Mortality Poverty Rate 33.4% 29.8% 29.0% Percentage of Population Age 65 or Older 17.1% 17.0% 18.4% Timeliness is the health care system's ability to provide health care quickly after a need is recognized. Timeliness issues include the time between identifying a need for specific tests and treatments and actually receiving those services. Actual and perceived difficulties or delays in getting care when patients are ill or injured likely reflect significant barriers to care. One of the questions asked in the Community Health Status Assessment survey was, In the past 12 months, did you delay getting needed medical care for any of the following reasons. Respondents were told to check all answers that applied (to them). 42.6% of respondents said that they did not delay in getting care and 10.8% said they did not need medical care. The following reasons were given for delaying care: Reason for Delay Percent Responding Could not get an appointment soon enough 24.1% Could not afford 22.5% Insurance problems or lack of insurance 14.9% Provider was not taking new patients 14.9% Could not get a weekend or evening appointment 11.6% Provider did not take insurance 9.2% Lack of transportation 2.0% Probably related to the high percentage of adults who have a personal doctor, only 17.7% of Walton County adults could not see a doctor at least once in the past year due to cost, compared to 19.3% in the prior period and 20.8% statewide. Workforce Primary care physicians ( PCP ) play an important role in the general health of the communities they serve because they typically develop meaningful and sustained relationships with patients and provide integrated services while practicing in the context of family and community. However, adequate availability of specialty physicians also impacts the overall health of a community. Walton County, Florida Community Health Needs Assessment Page 31
 per population and fewer dentists per population than statewide.")
35 As noted above, Walton County has substantially fewer PCPs of all types per population than in the State as a whole. In addition, the County has substantially fewer physicians overall (of all specialties) per population and fewer dentists per population than statewide. Dental health has significant implications for overall health, so the relatively low number of dentists per population is particularly alarming. The lack of sufficient workforce is clearly an impediment to access to care in Walton County. The Health Resources & Services Administration (HRSA) has designated all of Walton County as a health professional shortage area (HPSA) for primary care, mental health and dental care. Poor performing indicators for Walton County (compared to the State or the prior year for the County) related to workforce are highlighted below. Indicator (Rate per Walton County Most Recent Period Prior Period State of Florida Population) Internists Pediatricians OB/GYN Physicians Dentists Health Resources & Services Administration (HRSA) - Health Professional Shortage Area Resources in Walton County potentially available to address this priority include the following: ARC Opportunity, Inc. Area Agency on Aging Sacred Heart Health Systems Caring & Sharing Shelter House Children s Volunteer Health Network South Walton Fire District COPE Center, Inc. Stanley House Covenant Hospice The Matrix Community Outreach Center Department of Children & Families Tri-County Community Council Florida Department of Health, Walton 211 Panhandle HelpLine County United Way Early Learning Coalition Walton Board of County Commissioners Elder Affairs Walton Community Health Center, Inc. Emerald Coast Children s Advocacy Ctr. Walton County Prevention Coalition Families First Network Walton County School District Healthmark Regional Medical Center Walton County Sheriff s Office Lutheran Services Walton-Okaloosa Council on Aging Muscogee Nation of Florida West Florida AHEC North West Florida State College West Florida Regional Planning Council Okaloosa Walton Healthy Start Coalition WZEP Walton County, Florida Community Health Needs Assessment Page 32
36 Provider Availability and Access, and related indicators Legend: County Performance County Trend: Worse than Florida Worsening: increasing or decreasing Better than Florida Improving: increasing or decreasing Same as Florida No Change Health Outcome - Mortality (Deaths) Indicator Latest Data Period Walton County Performance Premature Death ,712 Cancer Deaths Breast Cancer Deaths Prostate Cancer Deaths Lung Cancer Deaths Deaths from Smoking-related Cancers Colon, Rectal or Anus Cancer Deaths Diabetes Deaths Heart Disease Deaths Stroke Deaths Infant Mortality Neonatal Deaths (0-27 days) Post neonatal Deaths ( days) Chronic Liver Disease, Cirrhosis Deaths Chronic Lower Respiratory Disease Deaths Pneumonia, Influenza Deaths HIV/AIDS Deaths Health Outcome - Morbidity (Quality of Life) Indicator Latest Data Period Walton County Performance Diabetic monitoring Low birth weight Disability (Any) % Hepatitis C, Acute HIV AIDS Salmonellosis Meningitis, Other Bacterial, Cryptococcal, or Mycotic Tuberculosis Trend Trend Walton County, Florida Community Health Needs Assessment Page 33
37 Chicken Pox Whooping Cough Vaccine (selected) Preventable Disease for All Ages Unhealthy mental days Adults with good to excellent overall health Fast Food Restaurant Access SNAP Participants % Indicator Clinical Care Access to Health Care Latest Data Period Walton County Performance Trend Uninsured Adults Uninsured Children Adults who could not see a doctor at least once in the past year due to cost Population Receiving Medicaid ,140 Medicaid births Dental Care Access by Low Income Persons Primary Care Access Mental health providers ,495:1 FY 11/12 - FY Physicians 13/ FY 11/12 - FY Family Practice Physicians 13/ FY 11/12 - FY Internists 13/ FY 11/12 - FY Pediatricians 13/ FY 11/12 - FY OB/GYN 13/ FY 11/12 - FY Dentists 13/ Acute Care Beds Adult psychiatric beds Adult substance abuse beds Pediatric psychiatric beds Rehabilitation beds Nursing Home Beds Walton County, Florida Community Health Needs Assessment Page 34
38 Clinical Care Quality of Care Indicator Latest Data Period Walton County Performance Trend Lack of Prenatal Care Prenatal Care Begun Late or No Prenatal Care Prenatal Care Begun in First Trimester Adults who have a personal doctor Cancer Screening - Mammogram Cancer Screening in past two years - PSA (Men age 50 & older) Cancer Screening - Sigmoidoscopy or Colonoscopy Cancer Screening - Pap Test Diabetic Annual Foot Exam (Adults) Diabetic Semi-Annual A1C Testing (Adult) HIV Testing (Adult age 65 and over) Flu Vaccination in the Past Year (Adult age 65 and over) Flu Vaccination in the Past Year (Adult) Pneumonia Vaccination (Adult age 65 and over) Pneumonia Vaccination (Adult) Vaccination (kindergarteners) ED Visits - Acute Conditions - Hypoglycemia ED Visits - Avoidable Conditions - Dental ED Visits - Chronic Conditions - Angina ED Visits - Chronic Conditions - Asthma ED Visits - Chronic Conditions - Congestive Heart Failure ED Visits - Chronic Conditions - Diabetes ED Visits - Chronic Conditions - Mental Health ED Visits - Chronic Conditions - Hypertension ED Visits - STDs Preventable hospital stays Admitted ED Visits - All Ambulatory Care Sensitive Conditions Admitted ED Visits - Dental Admitted ED Visits - Diabetes Admitted ED Visits - STDs Walton County, Florida Community Health Needs Assessment Page 35
39 Social and Economic Factors Indicator Latest Data Period Walton County Performance Unemployment 2015 AUG 4.6 Poverty % Children in poverty (based on household) % Income - Public Assistance Income % Population with Limited English Proficiency % Indicator Physical Environment Latest Data Period Walton County Performance Households with No Motor Vehicle % Use of Public Transportation % Trend Trend Walton County, Florida Community Health Needs Assessment Page 36
40 Additional Significant Health Concerns Although not selected as one of the top three health priorities for Walton County, tobacco use was also identified as a significant health issue in Walton County. Although smoking is a problem statewide, Walton County rates for almost all smoking-related indicators is worse than statewide. Of particular concern is the rate of live births where the mother smoked during pregnancy, which is more than double the rate in the State overall. However, the County rates in most of these areas improved compared to the prior period. In addition, Walton County residents appear to be attempting to quit more frequently than Florida residents overall. Poor performing indicators for Walton County (compared to the State or the prior year for the County) related to tobacco use are highlighted below. Indicator Walton County State of Most Recent Prior Florida Period Period Never Smoked Adult (Rate) Tobacco Quit Attempt Adult (Rate) Smokers Adult (Rate) Smoked in Last 30 Days Adolescents (Rate) Live Births Where Mother Smoked During Pregnancy (Rate) Second-Hand Smoke Exposure Children (Rate) Lung Cancer Incidence (Rate) Cancer Deaths (Rate) Lung Cancer Deaths (Rate) Deaths from Smoking-Related Cancers (Rate) Next Steps The next step in the Walton County CHNA process will be the development of a community health improvement plan with specific goals, tactics, and evaluation metrics. Activities include: Organizing work groups to develop comprehensive action plans to address each priority Identifying successful health improvement initiatives to serve as best practices Establishing metrics for performance, including measurable outcome indicators Continuing to communicate progress and results to the Walton County community Walton County, Florida Community Health Needs Assessment Page 37
41 Attachment A - Health Status Indicators, Definitions and Sources Legend: County Performance County Trend: Worse than Florida Worsening increasing or decreasing Better than Florida Improving increasing or decreasing Same as Florida No Change Health Outcome - Mortality (Deaths) Walton County Related Priorities Indicator Latest Data Period Performance Trend Healthy Weight Access to Care Mental Health / Substance Abuse Premature Death ,712 Cancer Deaths Breast Cancer Deaths Prostate Cancer Deaths Lung Cancer Deaths Deaths from Smoking-related Cancers Colon, Rectal or Anus Cancer Deaths Diabetes Deaths Heart Disease Deaths Stroke Deaths Infant Mortality Neonatal Deaths (0-27 days) Post neonatal Deaths ( days) Chronic Liver Disease, Cirrhosis Deaths Nephritis, Nephritic Syndrome, and Nephrosis Deaths Chronic Lower Respiratory Disease Deaths Pneumonia, Influenza Deaths HIV/AIDS Deaths Suicide Deaths Motor Vehicle Accident Deaths Injury Deaths Homicide
42 Health Outcome - Morbidity (Quality of Life) Walton County Related Priorities Indicator Latest Data Period Performance Trend Healthy Weight Access to Care Mental Health / Substance Abuse Total Cancer Incidence Breast Cancer Incidence Prostate Cancer Incidence Lung Cancer Incidence Colon and Rectum Cancer Incidence Melanoma Cancer Incidence Cervical Cancer Incidence Diabetic monitoring Diabetes (Adult) High Blood Pressure (Adult) High Cholesterol (Adult) High Blood Pressure Controlled (Adult) Heart Disease (Adult) Asthma (Adult) Low birth weight Disability (Any) % Hepatitis C, Acute HIV AIDS Salmonellosis Meningitis, Other Bacterial, Cryptococcal, or Mycotic Tuberculosis Chicken Pox Whooping Cough Vaccine (selected) Preventable Disease for All Ages Unhealthy mental days Average number of days where poor mental or physical health interfered with activities of daily living in the past 30 days Adults with good to excellent overall health Poor or fair health Attachment A - Health Status Indicators, Definitions and Sources 2
43 Health Behavior - Tobacco Use Walton County Related Priorities Indicator Latest Data Period Performance Trend Healthy Weight Access to Care Mental Health / Substance Abuse Smokers (Adult) Former Smokers (Adult) Never Smoked (Adult) Tobacco Quit Attempt (Adult) Smoked Cigarettes in last 30 days (Adolescents) Cigarette Use (Adolescents) Secondhand Smoke exposure (Children) Live births where mother smoked during pregnancy Health Behavior - Alcohol / Substance Abuse Walton County Related Priorities Indicator Alcohol-related Motor Vehicle Traffic Crash Deaths Alcohol-related Motor Vehicle Traffic Crashes Blacking out from drinking Alcohol (Adolescents) Marijuana or Hashish Use (Adolescents) Alcohol Consumption in past 30 days (Adolescents) Alcohol Consumption in Lifetime (Adolescents) Latest Data Period Performance Trend Healthy Weight Access to Care Mental Health / Substance Abuse Binge Drinking (Adolescents) Attachment A - Health Status Indicators, Definitions and Sources 3
44 Health Behavior - Diet and Exercise Walton County Related Priorities Indicator Latest Data Period Performance Trend Healthy Weight Healthy Weight (Adult) Overweight (Adult) Obesity (Adult) Births to Obese Mothers Births to overweight mothers Breast feeding Initiation Overweight (Adolescents) Overweight or Obesity (Adolescents) Healthy Weight (Adolescents) Vigorous physical activity recommendations met (Adult) Exercise opportunities 2013 & Sedentary Adults Fruits and Vegetables Consumption 5 servings per day (Adult) Food Insecurity Grocery Store Access Food Access Low - Low Income Population Fast Food Restaurant Access SNAP Participants % Health Behavior - Sexual Activity Access to Care Mental Health / Substance Abuse Walton County Related Priorities Indicator Latest Data Period Performance Trend Healthy Weight Access to Care Mental Health / Substance Abuse Infectious Syphilis Sexually transmitted infections Births to Mothers under the age of Majority (10-14) Births to Mothers under the age of Majority (10-16) Attachment A - Health Status Indicators, Definitions and Sources 4
45 Clinical Care Access to Health Care Walton County Related Priorities Indicator Latest Data Period Performance Trend Healthy Weight Access to Care Mental Health / Substance Abuse Uninsured Adults Uninsured Children Adults who could not see a doctor at least once in the past year due to cost Population Receiving Medicaid ,140 Medicaid births Dental Care Access by Low Income Persons Primary Care Access Mental health providers ,495:1 FY 11/12 - Physicians FY 13/ FY 11/12 - Family Practice Physicians FY 13/ FY 11/12 - Internists FY 13/ FY 11/12 - Pediatricians FY 13/ FY 11/12 - OB/GYN FY 13/ FY 11/12 - Dentists FY 13/ Acute Care Beds Adult psychiatric beds Adult substance abuse beds Pediatric psychiatric beds Rehabilitation beds Nursing Home Beds Clinical Care Quality of Care Walton County Related Priorities Indicator Latest Data Period Performance Trend Healthy Weight Access to Care Lack of Prenatal Care Prenatal Care Begun Late or No Prenatal Care Prenatal Care Begun in First Trimester Mental Health / Substance Abuse Attachment A - Health Status Indicators, Definitions and Sources 5
46 Adults who have a personal doctor Cancer Screening - Mammogram Cancer Screening in past two years - PSA (Men age 50 & older) Cancer Screening - Sigmoidoscopy or Colonoscopy Cancer Screening - Pap Test Diabetic Annual Foot Exam (Adults) Diabetic Semi-Annual A1C Testing (Adult) HIV Testing (Adult age 65 & over) Flu Vaccination in the Past Year (Adult age 65 and over) Flu Vaccination in the Past Year (Adult) Pneumonia Vaccination (Adult age 65 and over) Pneumonia Vaccination (Adult) Vaccination (kindergarteners) ED Visits - Acute Conditions - Hypoglycemia ED Visits - Avoidable Conditions - Dental ED Visits - Chronic Conditions - Angina ED Visits - Chronic Conditions - Asthma ED Visits - Chronic Conditions - Congestive Heart Failure ED Visits - Chronic Conditions - Diabetes ED Visits - Chronic Conditions - Mental Health ED Visits - Chronic Conditions - Hypertension ED Visits - STDs Preventable hospital stays Admitted ED Visits - All Ambulatory Care Sensitive Conditions Admitted ED Visits - Dental Admitted ED Visits - Diabetes Admitted ED Visits - STDs Attachment A - Health Status Indicators, Definitions and Sources 6
47 Social and Economic Factors Walton County Related Priorities Indicator Latest Data Period Performance Trend Healthy Weight Access to Care Mental Health / Substance Abuse High school graduation % Population without a high school diploma % Unemployment 2015 AUG 4.6 Real Per Capita Income ,976 Median Household Income ,640 Poverty % Children in poverty (based on household) % Children Eligible for Free/Reduced Price Lunch % Income - Public Assistance Income % Housing Cost Burden Children in single-parent households % Population with Limited English Proficiency % Domestic Violence Offenses Forcible Sex Offenses Aggravated Assault Murder Property Crimes ,530 Violent Crime Physical Environment Walton County Related Priorities Indicator Latest Data Period Performance Trend Healthy Weight Access to Care Air pollution - particulate matter Air Quality - Ozone Drinking water violations FY Severe housing problems % Households with No Motor Vehicle % Driving alone to work % Use of Public Transportation % Mental Health / Substance Abuse Attachment A - Health Status Indicators, Definitions and Sources 7
48 Indicator Population Characteristics Latest Data Period Walton County Performance Trend Median Age Population Under Age ,289 Population Age ,610 Population Age ,385 Population Age ,476 Population Age ,581 Population Age ,776 Population Age ,129 Total Population (ACS) ,590 Total Population (FL CHARTS) ,246 Female Population ,631 Female Population Age ,710 Female Population Age ,426 Female Population Age ,416 Male Population ,197 Male Population Age ,346 Families with Children % Births to Mothers Ages Births to Mothers Ages Total Births (resident) Population by Race - White ,055 Population by Race - Black ,033 Population by Race - Native American Population by Race Asian/Pacific Islander Population by Race - 2 or more ,365 races Population by Race - Other ,893 Veteran Population % Attachment A - Health Status Indicators, Definitions and Sources 8
49 Health Outcome - Mortality (Deaths) Indicator Data Definitions and Sources Premature Death - Years of Potential Life Lost (YPLL) - Years of potential life lost (YPLL) before age 75 per 100,000 population (age-adjusted) The YPLL measure is presented as a rate per 100,000 population and is age-adjusted to the 2000 US population. Weblink: Data collection period: Source Data type: Smallest geographic level: Desired Target Direction: Note: Source: 3-year rolling Rate County Low/Decrease Data collected is 3-year rolling average, must use 2015,2014 and 2012 for 3 data points CHR County Health Rankings. Original Data Source: National Center for Health Statistics - Mortality Files. Cancer Deaths - ICD-10 Code(s): C00-C97. Weblink: Breast Cancer Deaths - ICD-10 Code(s): C50. Weblink: Prostate Cancer Deaths - ICD-10 Code(s): C61. Weblink: Lung Cancer Deaths - ICD-10 Code(s): C33-C34. Weblink: Deaths from Smoking-related Cancers - Cancers include: Lip, Oral Cavity, Pharynx (C00-C14), Esophagus (C15), Larynx (C32), Trachea, Bronchus, Lung (C33-C34), Kidney & Renal Pelvis (C64-C65), Bladder (C67), Other/Unspecified Sites In Urinary Tract (C66, C68). Weblink: Colon, Rectal or Anus Cancer Deaths - Colorectal Cancer Deaths. Weblink: Diabetes Deaths - ICD-10 Code(s): E10-E14. Weblink: Heart Disease Deaths - ICD-10 Code(s): I00-I09, I11, I13, I20-I51. Weblink: Stroke Deaths - ICD-10 Code(s): I60-I69. Weblink: Infant Mortality - Deaths occurring within 364 days of birth. Weblink: mber=0053 Neonatal Deaths (0-27 days) - Deaths occurring within 27 days of birth. Beginning in 2004, the state total for the denominator in this calculation may be greater than the sum of county totals due to an unknown county of residence on some records. Weblink: Attachment A - Health Status Indicators, Definitions and Sources 9
50 Post neonatal Deaths ( days) - Deaths occurring 28 to 364 days from birth. Note: Beginning in 2004, the state total for the denominator in this calculation may be greater than the sum of county totals due to an unknown county of residence on some records. Count Available. Weblink: mber=0055 Chronic Liver Disease, Cirrhosis Deaths - Deaths from Chronic Liver Disease and Cirrhosis Deaths. Weblink: Nephritis, Nephritic Syndrome, and Nephrosis Deaths - Nephritis Deaths. ICD-10 Code(s): N17-N19. Weblink: Chronic Lower Respiratory Disease Deaths - ICD-10 Code(s): J40-J47. Weblink: Pneumonia, Influenza Deaths - CD-10 Code(s): J09-J18. Weblink: HIV/AIDS Deaths - ICD-10 Code(s): B20-B24. Weblink: Suicide Deaths - Suicide (All Means) Deaths. Weblink: Motor Vehicle Accident Deaths - Motor Vehicle Crashes Deaths. Weblink: Injury Deaths - Unintentional Injuries Deaths. Weblink: Homicide - Homicide (All Means) Deaths. Weblink: Data collection period: 3-year rolling Source Data type: Rate Smallest geographic level: County Desired Target Direction: Low/Decrease Note: Source: Counts Available FL DOH, Division of Public Health Statistics & Performance Management. Florida Charts. Original Data Source: FL DOH, Bureau of Vital Statistics Health Outcome - Morbidity (Quality of Life) Total Cancer Incidence - Cancer Incidence. Weblink: Breast Cancer Incidence - ICD-10 Code(s): C50. Weblink: Prostate Cancer Incidence - ICD-10 Code(s): C61. Weblink: Lung Cancer Incidence - ICD-10 Code(s): C33-C34. Weblink: Colon and Rectum Cancer Incidence - Colorectal Cancer Incidences. Weblink: Attachment A - Health Status Indicators, Definitions and Sources 10
51 Melanoma Cancer Incidence - New cases during time period. CD-10 Code(s): C43. Weblink: Cervical Cancer Incidence - New cases during time period. ICD-10 Code(s): C53. Weblink: Data collection period: Source Data type: Smallest geographic level: Desired Target Direction: Note: 3-year rolling Rate County Low/Decrease Rates are not displayed for fewer than 10 cases. Source: FL DOH, Division of Public Health Statistics & Performance Management. Florida Charts. Original Data Source: UM(FL) MS, Florida Cancer Data System Diabetic monitoring - Percentage of Diabetic Medicare patients ages whose blood sugar control was monitored in the past year using a test of their HbA1c levels. Weblink: Data collection period: Annual Source Data type: % Smallest geographic level: County Desired Target Direction: High/Increase Source: County Health Rankings and Roadmaps Dartmouth Atlas Project. Original Data Source: Dartmouth Atlas of Health Care; CMS. Diabetes (Adult) - Adults who have ever been told they had diabetes. Weblink: High Blood Pressure (Adult) - Adults who have ever been told they had hypertension. Weblink: High Cholesterol (Adult) - Adults who have ever been told they had high blood cholesterol. Weblink: High Blood Pressure Controlled (Adult) - Adults with hypertension who currently take high blood pressure medicine. Weblink: Heart Disease (Adult) - Adults who have ever been told they had coronary heart disease, heart attack, or stroke. Weblink: Asthma (Adult) - Adults who currently have asthma. Weblink: Data collection period: Triennial Source Data type: % Smallest geographic level: County Desired Target Direction: Low/Decrease Note: Caution should be taken when comparing 2013 data with previous years due to changes in survey methodology to include respondents via cellular phones in addition to land lines. Source: FL DOH, Division of Public Health Statistics & Performance Management. Florida Charts. Original Data Source: Florida BRFSS Attachment A - Health Status Indicators, Definitions and Sources 11
52 Low birth weight - Live Births under 2,500 Grams. Weblink: Data collection period: Source Data type: Smallest geographic level: Desired Target Direction: 3-year rolling Rate County Low/Decrease Source: FL DOH, Division of Public Health Statistics & Performance Management. Florida Charts. Original Data Source: Merlin. Disability (Any) - Disability Status. Weblink: Table name - s1810. Data collection period: Annual Source Data type: % Smallest geographic level: County Desired Target Direction: Neutral Source: US Census Fact Finder. Original Data Source: US Census. Hepatitis C, Acute - ICD Code(s): Cases are assigned to Florida counties based on the county of residence at the time of the disease identification, regardless of where they became ill or were hospitalized, diagnosed, or exposed. Counts and rates include confirmed and probable cases of Hepatitis C, Acute (Merlin code 07051). Weblink: Data collection period: Source Data type: Smallest geographic level: Desired Target Direction: 3-year rolling Rate County Low/Decrease Source: FL DOH, Division of Public Health Statistics & Performance Management. Florida Charts. Original Data Source: Merlin. HIV - Human immunodeficiency virus. HIV and AIDS cases by year of report are NOT mutually exclusive and should NOT be added together Weblink: AIDS - Acquired immunodeficiency syndrome. HIV and AIDS cases by year of report are NOT mutually exclusive and should NOT be added together. Weblink: Data collection period: Source Data type: Smallest geographic level: Desired Target Direction: Source: Annual Rate per Population County Low/Decrease FL DOH, Division of Public Health Statistics & Performance Management. Florida Charts. Original Data Source: FL DOH, Bureau of HIV/AIDS. Salmonellosis - ICD-9-CM: Counts and rates include confirmed and probable cases of Salmonellosis (Merlin code 00300). Weblink: Attachment A - Health Status Indicators, Definitions and Sources 12
53 Meningitis, Other Bacterial, Cryptococcal, or Mycotic - Includes the following types of Meningitis: group b strep, listeria monocytogenes, other meningitis, strep pneumoniae. beginning in 2007, data includes both probable and confirmed cases. Weblink: Tuberculosis - Tuberculosis ICD-10 Case Definitions. Weblink: Chicken Pox - Varicella. ICD-10 Case Definition. Weblink: Whooping Cough - Pertussis. ICD-9-CM: Weblink: Vaccine (selected) Preventable Disease for All Ages - Includes: diphtheria, acute hepatitis b, measles, mumps, pertussis, rubella, tetanus, and polio. Weblink: Data collection period: Source Data type: Smallest geographic level: Desired Target Direction: Annual Rate County Low/Decrease Source: FL DOH, Division of Public Health Statistics & Performance Management. Florida Charts. Original Data Source: Merlin. Unhealthy mental days - Average number of unhealthy mental days in the past 30 days. Survey Question: Now thinking about your mental health, which includes stress, depression, and problems with emotions, for how many days during the past 30 days was your mental health not good? Weblink: Average number of days where poor mental or physical health interfered with activities of daily living in the past 30 days - Among adults who responded that they have had at least one day of poor mental or physical health, the average number of days where poor mental or physical health interfered with activities of daily living in the past 30 days. Weblink: Data collection period: Source Data type: Smallest geographic level: Desired Target Direction: Note: Triennial Count (average) County Low/Decrease Caution should be taken when comparing 2013 data with previous years due to changes in survey methodology to include respondents via cellular phones in addition to land lines. Source: FL DOH, Division of Public Health Statistics & Performance Management. Florida Charts. Original Data Source: Florida BRFSS Adults with good to excellent overall health - Weblink: Data collection period: Source Data type: Smallest geographic level: Desired Target Direction: Note: Triennial Rate County High/Increase Caution should be taken when comparing 2013 data with previous years due to changes in survey methodology to include respondents via cellular phones in addition to land lines. Source: FL DOH, Division of Public Health Statistics & Performance Management. Florida Charts. Original Data Source: Florida BRFSS Attachment A - Health Status Indicators, Definitions and Sources 13
54 Poor or fair health - Adults who said their overall health was "fair" or "poor". Weblink: Data collection period: Source Data type: Smallest geographic level: Desired Target Direction: Note: Annual Rate County Low/Decrease Caution should be taken when comparing 2013 data with previous years due to changes in survey methodology to include respondents via cellular phones in addition to land lines. Source: FL DOH, Division of Public Health Statistics & Performance Management. Florida Charts. Original Data Source: Florida BRFSS Health Behavior - Tobacco Use Smokers (Adult) - Combination of everyday smoker and some day smoker. Weblink: Former Smokers (Adult) - Currently quit smoking. Weblink: Never Smoked (Adult) - Adults who reported smoking less than 100 cigarettes in their lifetime. Weblink: Tobacco Quit Attempt (Adult) - Adult current smokers who tried to quit smoking at least once in the past year. Weblink: Data collection period: Source Data type: Smallest geographic level: Desired Target Direction: Note: Triennial Rate County High/Increase Caution should be taken when comparing 2013 data with previous years due to changes in survey methodology to include respondents via cellular phones in addition to land lines. Source: FL DOH, Division of Public Health Statistics & Performance Management. Florida Charts. Original Data Source: Florida BRFSS Smoked in last 30 days (Adolescents) - Ages years, smoked cigarettes on one or more of the last 30 days. Weblink: Secondhand Smoke exposure (Children) - Middle school children exposed to secondhand smoke during the past 7 days. Weblink: Data collection period: Source Data type: Smallest geographic level: Desired Target Direction: Biennial Rate County Low/Decrease Source: FL DOH, Division of Public Health Statistics & Performance Management. Florida Charts. Original Data Source: FYTS. Attachment A - Health Status Indicators, Definitions and Sources 14
55 Live births where mother smoked during pregnancy - Resident live births. Weblink: Data collection period: Source Data type: Smallest geographic level: Desired Target Direction: Note: 3-year rolling Rate County Low/Decrease Race/ethnicity data also available Source: FL DOH, Division of Public Health Statistics & Performance Management. Florida Charts. Original Data Source: FL DOH, Bureau of Vital Statistics. Health Behavior - Alcohol / Substance Use Alcohol-related Motor Vehicle Traffic Crash Deaths - A crash involving a driver and/or pedestrian for whom alcohol use was reported (does not presume intoxication) that results in one or more fatalities within thirty days of occurrence. Any crash involving a driver or non-motorist for whom alcohol use was suspected, including those with a BAC greater than 0.00 and those refusing to submit to an alcohol test. Weblink: Alcohol-related Motor Vehicle Traffic Crashes - A crash involving a driver and/or pedestrian for whom alcohol use was reported (does not presume intoxication). Any crash involving a driver or nonmotorist for whom alcohol use was suspected, including those with a BAC greater than 0.00 and those refusing to submit to an alcohol test. Weblink: Data collection period: Source Data type: Smallest geographic level: Desired Target Direction: 3-year rolling rate County Low/Decrease Source: FL DOH, Division of Public Health Statistics & Performance Management. Florida Charts. Original Data Source: FDHSMV. Blacking out from drinking Alcohol (Adolescents) - Ages who reported on how many occasions in their lifetime they woke up after drinking and did not remember the things they did or the places they went. Weblink: Note: New for Indicator focuses toward negative consequence of behavior. Cigarette Use (Adolescents) - Ages who reported having used Cigarettes in the past 30 days. Weblink: Marijuana or Hashish Use (Adolescents) - Ages who reported having used alcohol in the past 30 days. Weblink: Alcohol Consumption in past 30 days (Adolescents) - Ages who reported having used alcohol in the past 30 days. Weblink: Alcohol Consumption in Lifetime (Adolescents) - Ages who reported having used alcohol or any illicit drug in their lifetimes. Weblink: Note: This indicator is helpful in understanding effectiveness of early intervention and education programs. Attachment A - Health Status Indicators, Definitions and Sources 15
56 Binge Drinking (Adolescents) - Aaes who reported having used alcohol in the past 30 days. Binge drinking is defined as having had five or more alcoholic drinks in a row in the past two weeks. Weblink: Data collection period: Source Data type: Smallest geographic level: Desired Target Direction: Note: Biennial Rate County Low/Decrease 30-day rates tend to be more indicative of regular or more frequent use. Lifetime usage captures experimentation as well as ongoing use. Source: FL DCF FYSAS - FL Department of Children and Families. Original Data Source: FYSAS - FL Department of Children and Families. Health Behavior - Diet and Exercise Healthy Weight (Adult) - Having a body mass index (BMI) ranging from 18.5 to 24.9; BMI is calculated using self-reported height and weight. Weblink: Data collection period: Triennial Source Data type: % Smallest geographic level: County Desired Target Direction: High/Increase Note: Caution should be taken when comparing 2013 data with previous years due to changes in survey methodology to include respondents via cellular phones in addition to land lines. Source: FL DOH, Division of Public Health Statistics & Performance Management. Florida Charts - Healthiest Weight Profile. Original Data Source: Florida BRFSS Overweight (Adult) - Body Mass Index (BMI) 25.0 to Weblink: Obesity (Adult) - Body Mass Index (BMI) 30.0 or higher. Weblink: Data collection period: Triennial Source Data type: % Smallest geographic level: County Desired Target Direction: Low/Decrease Note: Caution should be taken when comparing 2013 data with previous years due to changes in survey methodology to include respondents via cellular phones in addition to land lines. Source: FL DOH, Division of Public Health Statistics & Performance Management. Florida Charts - Healthiest Weight Profile. Original Data Source: Florida BRFSS Births to Obese Mothers - Births to obese mothers (BMI 30.0 or higher) at the time pregnancy occurred. Weblink: Attachment A - Health Status Indicators, Definitions and Sources 16
57 Births to overweight mothers - Births to overweight (BMI 25.0 to 29.9) mothers at the time pregnancy occurred. Weblink: Data collection period: Source Data type: Smallest geographic level: Desired Target Direction: 3-year rolling Rate County Low/Decrease Source: FL DOH, Division of Public Health Statistics & Performance Management. Florida Charts. Original Data Source: FL DOH, Bureau of Vital Statistics. Breast feeding Initiation - Infant was being breastfed at the time the birth certificate was completed. Weblink: Data collection period: Annual Source Data type: % Smallest geographic level: County Desired Target Direction: High/Increase Source: FL DOH, Division of Public Health Statistics & Performance Management. Florida Charts - Pregnancy and Young Child Profile. Original Data Source: FL DOH, Bureau of Vital Statistics. Overweight (Adolescents) - Middle and High School Students. Body Mass Index (BMI) 25.0 to Weblink: Obesity (Adolescents) - Middle and High School Students. Body Mass Index (BMI) 30.0 or higher. Weblink: Healthy Weight (Adolescents) - Middle and High School Students. Having a body mass index (BMI) ranging from 18.5 to Weblink: Data collection period: Biennial Source Data type: % Smallest geographic level: County Desired Target Direction: High/Increase Source: FL DOH, Division of Public Health Statistics & Performance Management. Florida Charts - Healthiest Weight Profile. Original Data Source: FYTS. Vigorous physical activity recommendations met (Adult) - 75 minutes of vigorous aerobic activity per week in the past 30 days. Weblink: Data collection period: Source Data type: Smallest geographic level: Desired Target Direction: Note: Triennial Rate County High/Increase Caution should be taken when comparing 2013 data with previous years due to changes in survey methodology to include respondents via cellular phones in addition to land lines. Source: FL DOH, Division of Public Health Statistics & Performance Management. Florida Charts. Original Data Source: Florida BRFSS Attachment A - Health Status Indicators, Definitions and Sources 17
58 Exercise opportunities - Percentage of population with adequate access to locations for physical activity. Locations for physical activity (parks or recreation facilities); Urban pop. resides within 1 mile and rural resides within 3 miles of recreational facility. Weblink: Data collection period: Annual Source Data type: % Smallest geographic level: County Desired Target Direction: High/Increase Source: CHR County Health Rankings. Original Data Source: Business Analyst, Delorme map data, ESRI, & US Census Tigerline files. Sedentary Adults - Participating in no leisure-time physical activity in the past 30 days. Weblink: Data collection period: Source Data type: Smallest geographic level: Desired Target Direction: Note: 5-year Rate County Low/Decrease Caution should be taken when comparing 2013 data with previous years due to changes in survey methodology to include respondents via cellular phones in addition to land lines. Source: FL DOH, Division of Public Health Statistics & Performance Management. Florida Charts - Healthiest Weight Profile. Original Data Source: Florida BRFSS Fruits and Vegetables Consumption 5 servings per day (Adult) Weblink: Data collection period: 5-year Source Data type: % Smallest geographic level: County Desired Target Direction: High/Increase Note: Caution should be taken when comparing 2013 data with previous years due to changes in survey methodology to include respondents via cellular phones in addition to land lines. Source: FL DOH, Division of Public Health Statistics & Performance Management. Florida Charts - Healthiest Weight Profile. Original Data Source: Florida BRFSS Food Insecurity - Lack of access, at times, to enough food for an active, healthy life for all household members, and limited or uncertain availability of nutritionally adequate foods. Weblink: Data collection period: Source Data type: Smallest geographic level: Desired Target Direction: Annual Rate County Low/Decrease Source: Feeding America Map the Meal Gap 2015: Food Insecurity and Child Food Insecurity Estimates at the County Level. Original Data Source: US Census. Attachment A - Health Status Indicators, Definitions and Sources 18
59 Grocery Store Access - Population that live within a 1/2 mile of a healthy good source, including grocery stores and produce stands/farmers' markets. Weblink: Data collection period: Source Data type: Smallest geographic level: Desired Target Direction: Annual Rate County High/Increase Source: FL DOH, Division of Public Health Statistics & Performance Management. Florida Charts. Original Data Source: Florida Department of Agriculture and Consumer Services, U.S. Census Bureau, FDOH, Environmental Public Health Tracking. Food Access - Low Income Population - Percentage of population who are low-income and do not live close to a grocery store. In rural areas, it means living less than 10 miles from a grocery store; in nonrural areas, less than 1 mile. Low income is defined as having an annual family income of less than or equal to 200 percent of the federal poverty threshold for the family size. Weblink: Data collection period: Annual Source Data type: % Smallest geographic level: County Desired Target Direction: Low/Decrease Source: CHR County Health Rankings. Original Data Source: US DoA. Fast Food Restaurant Access - Population that live within a 1/2 mile of a fast food restaurant. Weblink: Data collection period: Source Data type: Smallest geographic level: Desired Target Direction: Rate County Low/Decrease Source: FL DOH, Division of Public Health Statistics & Performance Management. Florida Charts - Healthiest Weight Profile. Original Data Source: Florida Department of Agriculture and Consumer Services, U.S. Census Bureau, FDOH, Environmental Public Health Tracking. SNAP Participants - Weblink: Data collection period: Source Data type: Smallest geographic level: Desired Target Direction: Annual Rate per Population County Low/Decrease Source: USDA Economic Research Service Food Environment Atlas. Original Data Source: US DoA. Health Behavior - Sexual Activity Infectious Syphilis - Weblink: Data collection period: 3-year rolling Source Data type: Rate per Population Smallest geographic level: County Desired Target Direction: Low/Decrease Source: FL DOH, Division of Public Health Statistics & Performance Management. Florida Charts. Original Data Source: FL DOH, Bureau of STD Prevention & Control. Attachment A - Health Status Indicators, Definitions and Sources 19
60 Sexually transmitted infections - Total gonorrhea, chlamydia, infectious syphilis cases. Weblink: Data collection period: Source Data type: Smallest geographic level: Desired Target Direction: Annual Rate County Low/Decrease Source: FL DOH, Division of Public Health Statistics & Performance Management. Florida Charts. Original Data Source: FL DOH, Bureau of STD Prevention & Control. Births to Mothers under age of majority (Resident) - Live Births. Does not include pregnancies that end with miscarriages, elective and spontaneous abortions or fetal deaths. Births to mothers in a specific age group divided by females in the same age group. Weblink: Data collection period: Source Data type: Desired Target Direction: Source: 3-year rolling Rate Low/Decrease FL DOH, Division of Public Health Statistics & Performance Management. Florida Charts. Original Data Source: FL DOH, Bureau of Vital Statistics Clinical Care Access to Health Care Uninsured Adults - Percent Uninsured (ages < 65). Weblink: Uninsured Children - Percent Uninsured (ages < 19). Weblink: Data collection period: Annual Source Data type: % Smallest geographic level: County Desired Target Direction: Low/Decrease Source: US Census SAHIE Interactive Data Tool. Original Data Source: US Census. Percentage of adults who could not see a doctor at least once in the past year due to cost Weblink: Data collection period: Triennial Source Data type: % Smallest geographic level: County Desired Target Direction: High/Increase Note: Caution should be taken when comparing 2013 data with previous years due to changes in survey methodology to include respondents via cellular phones in addition to land lines. Source: FL DOH, Division of Public Health Statistics & Performance Management. Florida Charts. Original Data Source: Florida BRFSS Attachment A - Health Status Indicators, Definitions and Sources 20
61 Population Receiving Medicaid - Medicaid Program Enrollment Totals (Including Medikids population). Weblink: Data collection period: Source Data type: Smallest geographic level: Desired Target Direction: Note: Monthly Rate County Low/Decrease Data is available through August 2015, but June 2013, June 2012 & 2011 was collected Source: FL AHCA (AHCA) Comprehensive Medicaid Managed Care Enrollment Reports. Original Data Source: FL AHCA (AHCA). Medicaid births - Births covered by Medicaid. Weblink: Data collection period: Source Data type: Smallest geographic level: Desired Target Direction: 3-year rolling Rate County Low/Decrease Source: FL DOH, Division of Public Health Statistics & Performance Management. Florida Charts. Original Data Source: FL DOH, Bureau of Vital Statistics. Dental Care Access by Low Income Persons - Access to Dental Care by Low Income Persons, Single Year. Weblink: Data collection period: Source Data type: Smallest geographic level: Desired Target Direction: Annual Rate County High/Increase Source: FL DOH, Division of Public Health Statistics & Performance Management. Florida Charts. Original Data Source: FL DOH, Public Health Dental Program. Primary Care Access - Primary care physicians per 100,000 population by year. This figure represents all primary care physicians practicing patient care, including hospital residents. Doctors classified as "primary care physicians" by the AMA include: General Family Medicine MDs and DOs, General Practice MDs and DOs, General Internal Medicine MDs and General Pediatrics MDs. Physicians age 75 and over and physicians practicing sub-specialties within the listed specialties are excluded. Weblink: Data collection period: Source Data type: Smallest geographic level: Desired Target Direction: Annual Rate County High/Increase Source: US DoHHS, Area Health Resource File. Area Health Resource File. Original Data Source: US DoHHS. Attachment A - Health Status Indicators, Definitions and Sources 21
62 Mental health providers - Mental Health Providers is the ratio of the county population to the number of mental health providers including psychiatrists, psychologists, licensed clinical social workers, counselors, marriage and family therapists and advanced practice nurses specializing in mental health care. In 2015, marriage and family therapists and mental health providers that treat alcohol and other drug abuse were added to this measure. Weblink: Data collection period: Source Data type: Smallest geographic level: Desired Target Direction: Annual Ratio County High/Increase Source: CHR County Health Rankings. Original Data Source: CMS (CMS), National Provider Identification. Physicians - Per population rate of people with active physician licenses only. Licensure data is for a fiscal year (July 1-June 30). Weblink: ewer.aspx?cid=0327 Family Practice Physicians - Per population rate of people with active physician licenses in Florida who report family practice as their specialty. Licensure data is for a fiscal year (July 1-June 30). Weblink: ewer.aspx?cid=0328 Internists - Per population rate of people with active physician licenses in Florida who report internal medicine as their specialty. Licensure data is for a fiscal year (July 1-June 30). Weblink: ewer.aspx?cid=0329. Pediatricians - Per population rate of people with active physician licenses in Florida who report pediatric medicine as their specialty. Licensure data is for a fiscal year (July 1-June 30). Weblink: OB/GYN (per population) - Per population rate of people with active physician licenses in Florida who report OB/GYN as their specialty. Licensure data is for a fiscal year (July 1-June 30). Weblink: ewer.aspx?cid=0330 Dentists - Per population rate of people with active licenses to practice dentistry in Florida. Weblink: Data collection period: Source Data type: Smallest geographic level: Desired Target Direction: Note: 3-year rolling Rate County High/Increase Source: FL DOH, Division of Public Health Statistics & Performance Management. Florida Charts. Original Data Source: FL DOH, Division of Medical Quality Assurance. Attachment A - Health Status Indicators, Definitions and Sources 22
63 Acute Care Beds - Acute care is necessary treatment of a disease for only a short period of time in which a patient is treated for a brief but severe episode of illness. The term is generally associated with care rendered in an emergency department, ambulatory care clinic, or other short-term stay facility. Weblink: Data collection period: 3-year rolling Source Data type: Rate Smallest geographic level: County Desired Target Direction: High/Increase Source: FL DOH, Division of Public Health Statistics & Performance Management. Florida Charts. Original Data Source: FL AHCA (AHCA), Certificate of Need Office. Adult psychiatric beds - The number of beds indicates the number of people who may receive adult psychiatric care on an inpatient basis. Weblink: Adult substance abuse beds - The number of beds indicates the number of people who may receive adult substance abuse treatment on an in-patient basis. Weblink: Pediatric psychiatric beds - Child and Adolescent Psychiatric Beds. Weblink: Rehabilitation beds - The number of rehabilitation beds indicates the number of people who may receive rehabilitative care in the hospital on an in-patient basis. Weblink: Nursing Home Beds - Skilled Nursing Unit Beds. A nursing home, skilled nursing facility (SNF), or skilled nursing unit (SNU), also known as a rest home, is a type of care of residents: it is a place of residence for people who require constant nursing care and have significant deficiencies with activities of daily living. Residents include the elderly and younger adults with physical or mental disabilities. Adults 18 or older can stay in a skilled nursing facility to receive physical, occupational, and other rehabilitative therapies following an accident or illness. Weblink: Data collection period: 3 year rolling Source Data type: Rate per 100,000 Smallest geographic level: County Desired Target Direction: High/Increase Source: FL DOH, Division of Public Health Statistics & Performance Management. Florida Charts. Original Data Source: FL AHCA (AHCA), Certificate of Need Office. Clinical Care Quality of Care Lack of Prenatal Care - Births to mothers with no prenatal care. Trimester prenatal care began is calculated as the time elapsed from the date of the last menstrual period to the date of the first prenatal care visit. Weblink: Prenatal Care Begun Late or No Prenatal Care - Births to Mothers with 3rd Trimester or No Prenatal Care. Weblink: Attachment A - Health Status Indicators, Definitions and Sources 23
64 Prenatal Care Begun in First Trimester - Births to Mothers with 1st Trimester Prenatal Care. Weblink: Data collection period: Source Data type: Smallest geographic level: Desired Target Direction: 3-year rolling Rate County Low/Decrease Source: FL DOH, Division of Public Health Statistics & Performance Management. Florida Charts. Original Data Source: FL DOH, Bureau of Vital Statistics. Adults who have a personal doctor - Weblink: Cancer Screening - Mammogram - Women 40 years of age and older who received a mammogram in the past year. Weblink: Cancer Screening in past two years - PSA (Men age 50 & older) - Men 50 years of age and older who received a PSA test in the past two years. Weblink: Cancer Screening - Sigmoidoscopy or Colonoscopy - Adults 50 years of age and older who received a sigmoidoscopy or colonoscopy in the past five years, Overall. Weblink: Cancer Screening - Pap Test - Women 18 years of age and older who received a Pap test in the past year. Weblink: Diabetic Annual Foot Exam (Adults) - Adults with diabetes who had an annual foot exam. Weblink: Diabetic Semi-Annual A1C Testing (Adult) - Adults with diabetes who had two A1C tests in the past year. Weblink: HIV Testing (Adult age 65 and over) - Adults less than 65 years of age who have ever been tested for HIV, Overall. Weblink: Flu Vaccination in the Past Year (Adult age 65 and over) - Adults 65 years of age and older who received a flu shot in the past year. Weblink: Flu Vaccination in the Past Year (Adult) - Adults who received a flu shot in the past year. Weblink: Pneumonia Vaccination (Adult age 65 and over) - Adults 65 years of age and older who have ever received a pneumococcal vaccination. Weblink: Pneumonia Vaccination (Adult) - Adults who have ever received a pneumococcal vaccination, Overall. Weblink: Data collection period: Triennial Source Data type: % Smallest geographic level: County Desired Target Direction: High/Increase Note: Caution should be taken when comparing 2013 data with previous years due to changes in survey methodology to include respondents via cellular phones in addition to land lines. Source: FL DOH, Division of Public Health Statistics & Performance Management. Florida Charts. Original Data Source: Florida BRFSS Attachment A - Health Status Indicators, Definitions and Sources 24
65 Vaccination (kindergarteners) - Fully immunized against diphtheria, tetanus, pertussis, polio, measles, mumps, rubella, haemophilus, influenzae type b, hepatitis B and varicella (chicken pox). Weblink: Data collection period: Source Data type: Smallest geographic level: Desired Target Direction: 3-year rolling Rate County High/Increase Source: FL DOH, Division of Public Health Statistics & Performance Management. Florida Charts. Original Data Source: FL DOH, Bureau of Immunization. ED Visits - Acute Conditions - Hypoglycemia - Hypoglycemia Primary ICD ED Visits - Avoidable Conditions - Dental - Dental Conditions Primary ICD ,525,528 ED Visits - Chronic Conditions - Angina - Angina Primary ICD , 411.8, 413. Excludes cases with a surgical procedure ED Visits - Chronic Conditions - Asthma - Asthma Primary ICD9 493 ED Visits - Chronic Conditions - Congestive Heart Failure - Congestive Heart Failure Primary ICD , , , 428, Excludes cases with the following surgical procedures: 36.01, 36.02, 36.05, 36.1, 37.5, or 37.7 ED Visits - Chronic Conditions - Diabetes - Diabetes Primary ICD , ED Visits - Chronic Conditions - Mental Health - ICD-9 Dx Group: Mental Disorders ED Visits - Chronic Conditions - Hyper Tension - Hypertension Primary ICD , 401.9, , , Data collection period: Source Data type: Smallest geographic level: Desired Target Direction: Quarterly Rate/1000 Visits Zip Low/Decrease Note: Ambulatory Care Sensitive Conditions: Source: AHCA IntelliMed - Export. Original Data Source: IntelliMed Custom Report Preventable hospital stays - Ambulatory Care Sensitive conditions such as asthma, diabetes or dehydration are hospitalization conditions where timely and effective ambulatory care can decrease hospitalizations by preventing the onset of an illness or condition, controlling an acute episode of an illness or managing a chronic disease or condition. High rates of Ambulatory Care Sensitive hospitalizations in a community may be an indicator of a lack of or failure of prevention efforts, a primary care resource shortage, poor performance of primary health care delivery systems, or other factors that create barriers to obtaining timely and effective care. Weblink: Data collection period: Source Data type: Smallest geographic level: Desired Target Direction: 3-year rolling Rate County Low/Decrease Source: FL DOH, Division of Public Health Statistics & Performance Management. Florida Charts. Original Data Source: FL AHCA (AHCA). Attachment A - Health Status Indicators, Definitions and Sources 25
66 Social and Economic Factors - Education High school graduation - Percentage of students who graduated within four years of their initial enrollment in ninth grade, not counting deceased students or students who transferred out to attend another public school outside the system, a private school, a home education program. Incoming transfer students are included in the appropriate cohort (the group whose progress is tracked) based on their grade level and year of entry. Data are for school years (September-June). Weblink: 52 Data collection period: Annual Source Data type: % Smallest geographic level: County Desired Target Direction: High/Increase Source: FL DOH, Division of Public Health Statistics & Performance Management. Florida Charts. Original Data Source: Florida Department of Education, Education Information and Accountability Services (EIAS). Population without a high school diploma - Population 18 to 24 years with educational attainment of less than high school graduate. (Target %, Total 18 to 24 population estimate)weblink: Table name - s1501. Data collection period: Annual Source Data type: % Smallest geographic level: County Desired Target Direction: Low/Decrease Source: Fact Finder. Original Data Source: US Census. Social and Economic Factors - Employment Unemployment - Number of unemployed people as a percentage of the civilian labor force (not seasonally adjusted). Weblink: Data collection period: Annual Source Data type: % Desired Target Direction: Low/Decrease Source: US DoL, Bureau of Labor Statistics. Original Data Source: US DoL, Bureau of Labor Statistics. Social and Economic Factors - Income Real Per Capita Income - Real per capita income represents the total GDP of the county, adjusted for inflation and divided by the population. Weblink: 20&7023=7&7024=non- ndustry&7033=1&7025=4&7026=12005,12033,12037,12043,12113,12131&7027=2013&7001=720&7028=- 1&7031=12000&7040=-1&7083=levels&7029=20&7090=7. Data collection period: Annual Source Data type: $ Desired Target Direction: High/Increase Source: US DoC, Bureau of Economic Analysis. Attachment A - Health Status Indicators, Definitions and Sources 26
67 Median Household Income - Weblink: Table name - S1903. Data collection period: Annual Source Data type: $ Desired Target Direction: High/Increase Source: US Census Fact Finder. Original Data Source: US Census. Poverty - Following the Office of Management and Budget's (OMB's) Directive 14, the Census Bureau uses a set of money income thresholds that vary by family size and composition to determine who is in poverty. If the total income for a family or unrelated individual falls below the relevant poverty threshold, then the family (and every individual in it) or unrelated individual is considered in poverty. Weblink: Table name - s1701. Data collection period: 5-year estimate Source Data type: % Desired Target Direction: Low/Decrease Source: US Census Fact Finder. Original Data Source: US Census. Children in poverty (based on household) - Number individuals below poverty under the age of 18 divided by the number of individuals under the age of 18, expressed as a percentage. Weblink: 95 Data collection period: Annual Source Data type: % Desired Target Direction: Low/Decrease Source: FL DOH, Division of Public Health Statistics & Performance Management. Florida Charts. Original Data Source: US Census. Children Eligible for Free/Reduced Price Lunch - Children from families with incomes at or below 130 percent of the poverty level are eligible for free meals. Those with incomes between 130 percent and 185 percent of the poverty level are eligible for reduced-price meals, for which students can be charge no more than 40 cents. Weblink: Data collection period: Annual Source Data type: % Desired Target Direction: Low/Decrease Source: Common Core of Data. Original Data Source: National Center for Education Statistics, NCES. Income - Public Assistance Income - Living in household with Supplemental Security Income (SSI), cash public assistance income, or Food Stamps/SNAP in the past 12 months. Weblink: Table name - B Data collection period: Source Data type: Desired Target Direction: Annual % calculated from ACS population estimates Low/Decrease Source: US Census Fact Finder. Original Data Source: US Census. Attachment A - Health Status Indicators, Definitions and Sources 27
68 Housing Cost Burden (30%) - Percentage of the households where housing costs exceed 30% of total household income. Weblink: Data collection period: 5-year estimate Source Data type: % Desired Target Direction: Low/Decrease Source: US Census ACS. Original Data Source: US Census. Social and Economic Factors - Family and Social Support Children in single-parent households - Excludes single parents living with unmarried partners. Weblink: Model Studer Institute: Table name - B09002 ("In Other Families"/"Total) Data collection period: Annual Source Data type: % Desired Target Direction: Low/Decrease Source: US Census Fact Finder. Original Data Source: US Census. Population with Limited English Proficiency - No one age 14 and over speaks English only or speaks English "very well" No one age 14 and over speaks English only. Weblink: Table name - S1602. Data collection period: Annual Source Data type: % Desired Target Direction: Neutral Source: US Census Fact Finder. Original Data Source: US Census. Social and Economic Factors - Community Safety Domestic Violence Offenses - Domestic Violence in Florida is tracked specifically for the following reported offenses: Murder, Manslaughter, Forcible Rape, Forcible Sodomy, Forcible Fondling, Aggravated Assault, Aggravated Stalking, Simple Assault, Threat/Intimidation, and Simple Stalking. Forcible Sex Offenses - Legacy (prior to 2013) UCR definition of rape: The carnal knowledge of a female forcibly and against her will. Revised (2013-forward) UCR definition of rape: Penetration, no matter how slight, of the vagina or anus with any body part or object, or oral penetration by a sex organ of another person, without the consent of the victim. Aggravated Assault - FBI s Uniform Crime Reporting (UCR) Program defines aggravated assault as an unlawful attack by one person upon another for the purpose of inflicting severe or aggravated bodily injury. The UCR Program further specifies that this type of assault is usually accompanied by the use of a weapon or by other means likely to produce death or great bodily harm. Attempted aggravated assault that involves the display of or threat to use a gun, knife, or other weapon is included in this crime category because serious personal injury would likely result if the assault were completed. When aggravated assault and larceny-theft occur together, the offense falls under the category of robbery. Attachment A - Health Status Indicators, Definitions and Sources 28
69 Murder - Murder and nonnegligent manslaughter. FBI s Uniform Crime Reporting (UCR) Program defines murder and nonnegligent manslaughter as the willful (nonnegligent) killing of one human being by another. The classification of this offense is based solely on police investigation as opposed to the determination of a court, medical examiner, coroner, jury, or other judicial body. The UCR Program does not include the following situations in this offense classification: deaths caused by negligence, suicide, or accident; justifiable homicides; and attempts to murder or assaults to murder, which are scored as aggravated assaults. Property Crimes - Property crime (burglary, larceny-theft, and motor vehicle theft) FBI s Uniform Crime Reporting (UCR) Program, property crime includes the offenses of burglary, larceny-theft, motor vehicle theft, and arson. The object of the theft-type offenses is the taking of money or property, but there is no force or threat of force against the victims. The property crime category includes arson because the offense involves the destruction of property; however, arson victims may be subjected to force. Violent Crime - FBI s Uniform Crime Reporting (UCR) Program, violent crime is composed of four offenses: murder and nonnegligent manslaughter, forcible rape, robbery, and aggravated assault. Violent crimes are defined in the UCR Program as those offenses which involve force or threat of force. Weblink: Statistics-(1)/UCR-Offense-Data.aspx Data collection period: Annual Source Data type: Rate per 100,000 Smallest geographic level: County Desired Target Direction: Low/Decrease Source: FDLE FDLE. Crime in Florida, Florida uniform crime report, 2014 [Computer program]. Tallahassee, FL: FDLE. Florida Statistical Analysis Center. Original Data Source: FDLE. Crime in Florida, Uniform Crime Reports Physical Environment - Environmental Quality Air pollution - particulate matter - Within the report area, 0, or 0% of days exceeded the emission standard of 75 parts per billion (ppb). This indicator reports the percentage of days per year with Ozone (O3) levels above the National Ambient Air Quality Standard of 75 parts per billion (ppb). Weblink: Data collection period: Annual Source Data type: % Smallest geographic level: County Desired Target Direction: Low/Decrease Source: EPA (EPA) National Environmental Public Health Tracking Network (NEPHTN) Air Quality Data web page. Original Data Source: CDC, National Environmental Public Health Tracking Network. Attachment A - Health Status Indicators, Definitions and Sources 29
70 Air Quality - Ozone - Percentage of days with particulate matter 2.5 levels above the National Ambient Air Quality Standard (35 micrograms per cubic meter) per year, calculated using data collected by monitoring stations and modeled to include counties where no monitoring statistics are collected. Weblink: Data collection period: Annual Source Data type: % Smallest geographic level: County Desired Target Direction: Low/Decrease Source: EPA (EPA) National Environmental Public Health Tracking Network (NEPHTN) Air Quality Data web page. Original Data Source: CDC, National Environmental Public Health Tracking Network. Drinking water violations - Percentage of population potentially exposed to water exceeding a violation limit during the past year. Weblink: Data collection period: Annual Source Data type: % Smallest geographic level: County Desired Target Direction: Low/Decrease Source: CHR County Health Rankings. Original Data Source: EPA (EPA): Safe Drinking Water Information System. Physical Environment - Built Environment Severe housing problems - The four severe housing problems are: incomplete kitchen facilities, incomplete plumbing facilities, more than 1 person per room, and cost burden greater than 50%. Weblink: Data collection period: 4-year Source Data type: % Smallest geographic level: County Desired Target Direction: Low/Decrease Source: US Department of Housing and Urban Development CHAS Data Query. Original Data Source: US Department of Housing and Urban Development. Households with No Motor Vehicle - Weblink: Table name - B08201: Household size by vehicles available Data collection period: Annual Source Data type: % Smallest geographic level: County Desired Target Direction: High/Increase Source: US Census Fact Finder. Original Data Source: US Census. Driving alone to work - Commuting (Journey to Work) refers to a worker s travel from home to work. Place of work refers to the geographic location of the worker s job. Workers 16 years and over. Table name - s0802. Data collection period: Source Data type: Smallest geographic level: Desired Target Direction: 5-year estimate % calculated on ACS population estimate County Low/Decrease Source: US Census ACS. Original Data Source: US Census. Attachment A - Health Status Indicators, Definitions and Sources 30
71 Use of Public Transportation - Public transportation includes workers who used a bus, trolley, streetcar, subway or elevated rail, railroad, or ferryboat. Weblink: Table name - s0802. Data collection period: Annual Source Data type: % Smallest geographic level: County Desired Target Direction: High/Increase Source: US Census Fact Finder. Original Data Source: US Census. Population Characteristics Median Age - Weblink: ESEX&prodType=table. Table name - PEPAGESEX. Data collection period: Annual Source: FL DOH, Office of Health Statistics and Assessment in consultation with the FL EDR. Total Population (ACS) - Weblink: Table name - PEPANNRES. Data collection period: Source Data type: Annual Count Source: US Census Fact Finder. Original Data Source: US Census. Total Population (FL CHARTS) Female / Male Population Weblink: Data collection period: Annual Source Data type: Count Source: FL DOH, Division of Public Health Statistics & Performance Management. Florida Charts. Original Data Source: FL DOH, Office of Health Statistics and Assessment in consultation with the FL EDR. Families with Children - Households with one or more people under 18 years. (%/total hhs). Weblink: 1&prodType=table. Table name - S1101 Data collection period: Annual Source Data type: % Source: US Census Fact Finder. Original Data Source: US Census. Attachment A - Health Status Indicators, Definitions and Sources 31
72 Births to Mothers by age group (Resident) - Live Births. Does not include pregnancies that end with miscarriages, elective and spontaneous abortions or fetal deaths. Births to mothers in a specific age group divided by females in the same age group. Weblink: Data collection period: 3-year rolling Source Data type: Source: Rate FL DOH, Division of Public Health Statistics & Performance Management. Florida Charts. Original Data Source: FL DOH, Bureau of Vital Statistics Total Births (resident) - Number of infants born to residents regardless of county of birth. Weblink: Population by Race - Weblink: Table name - B Veteran Population - Person 18 years old or over who has served (even for a short time), but is not now serving, on active duty in the U.S. Army, Navy, Air Force, Marine Corps, or the Coast Guard, or who served in the U.S. Merchant Marine during World War II. People who serve People who served in the National Guard or military Reserves are classified as veterans only if they were ever called or ordered to active duty, not counting the 4-6 months for initial training or yearly summer camps. Weblink: Table name - S2101. Data collection period: Source Data type: Annual Count Source: US Census Fact Finder. Original Data Source: US Census. Abbreviations and Acronyms ACSC ACS BRFSS CDC CHR-RWJ CMS EPA FDHSMV FDLE FL AHCA FL DCF FL DOE, EIAS FL DOH FL EDR FYSAS FYTS Ambulatory Care Sensitive Conditions - ICD-9-CM Codes ATE.pdf American Community Survey Florida Behavioral Risk Factor Surveillance System - county-level telephone survey conducted by the CDC and FL DOH Bureau of Epidemiology. Centers for Disease Control and Prevention County Health Rankings, Robert Wood Johnson Foundation Centers for Medicare and Medicaid Services Environmental Protection Agency Florida Department of Highway Safety and Motor Vehicles Florida Department of Law Enforcement Florida Agency for Health Care Administration Florida Department of Children and Families Florida Department of Education, Education Information and Accountability Services Florida Department of Health Florida Legislature's Office of Economic and Demographic Research Florida Youth Substance Abuse Survey Florida Youth Tobacco Survey Attachment A - Health Status Indicators, Definitions and Sources 32
73 Merlin NCES NCHS SAHIE UM(FL) MS US Census US DoA US DoC US DoHHS US DoHUD US DoL Merlin, FDOH Disease Surveillance and Reporting System National Center for Education Statistics National Center for Health Statistics Small Area Health Insurance Estimates (US Census) University of Miami (FL) Medical School US Census Bureau US Department of Agriculture, Food Environment Atlas US Department of Commerce US Department of Health & Human Services, Health Resources and Services Administration US Department of Housing and Urban Development US Department of Labor Attachment A - Health Status Indicators, Definitions and Sources 33
74 Walton Community Health Improvement Partnership (WCHIP) Forces of Change Assessment Mobilizing for Action through Planning and Partnerships (MAPP) Attachment B Page 1 of 17 Vision: Prepared by the Florida Department of Health in Walton County November 2015 For more information, contact Jamie.Carmichael@flhealth.gov x 1266 WCHIP Forces of Change 1
75 Attachment B Page 2 of 17 TABLE OF CONTENTS INTRODUCTION 3 ASSESSMENT METHODOLOGY.. 5 FORCES OF CHANGE. 6 Economic.. 6 Environmental.. 9 Legal/Political. 10 Social 14 Technological/Scientific.. 14 APPENDICES Appendix A 16 WCHIP Forces of Change 2
76 Attachment B Page 3 of 17 Introduction June of 2015, the Walton County MAPP Executive Committee (WCHIP Steering Committee) embarked on a journey to develop a Community Health Assessment (CHA) using the Mobilizing for Action through Planning and Partnerships (MAPP) process. MAPP is a community-driven strategic planning framework that assists communities in developing and implementing efforts around the prioritization of public health issues and the identification of resources to address them as defined by the Ten Essential Public Health Services. A community health needs assessment is a process that: Describes the state of health of the local population; Enables the identification of the major risk factors and causes of ill health; and Enables the identification of the actions needed to address these identified issues. The MAPP process includes four assessment tools, as shown in the graphic below. MAPP Model, Achieving Healthier Communities MAPP User s Handbook WCHIP Forces of Change 3
77 Within the MAPP process, there are four assessment tools. One of these assessment tools is the Forces of Change Assessment (FOCA). The FOCA is aimed at identifying forces such as trends, factors, or events that are or will be influencing the health and quality of life of the community and the work of the local public health system. Trends are patterns over time, such as migration in and out of a community or a growing disillusionment with government. Factors are discrete elements, such as a community s large ethnic population, an urban setting, or the jurisdiction s proximity to a major waterway. Events are one-time occurrences, such as a hospital closure, a natural disaster, or the passage of new legislation. During the FOCA, participants answer the following questions: What is occurring or might occur that affects the health of our community or the local public health system? What specific threats or opportunities are generated by these occurrences? Attachment B Page 4 of 17 Forces considered include the following categories of influence: (1) Social (2) Economic (3) Political (4) Legal (5) Environmental (6) Technological (7) Scientific The group also considered other categories of forces of change specific to the county. WCHIP Forces of Change 4
78 Attachment B Page 5 of 17 Assessment Methodology On October 21, 2015, the Walton County MAPP Executive Committee convened to participate in Phase one of the Forces of Change Assessment (FOCA). Participants were guided through the following process: 1. The definitions and components of the FOCA were reviewed. 2. Flip charts for each category of influence were placed around the room. 3. The participants in the room were divided into two small groups, each of which took half of the categories of influence. 4. Each group brainstormed and listed on post-it notes the relevant forces of influence (events, factors, trends) for the categories on their side of the room. 5. Participants were also encouraged to contribute to the categories on the other side of the room. 6. The post-it notes were placed on the flip charts by the participants for each category as an event, factor, or trend. 7. After a specified period of time, the groups collectively discussed each category of influence and the rationale for the selections. Notes were taken to be combined with results of Phase two at a later date. 8. The meeting convened, and the facilitator created a Forces of Change worksheet (Appendix A) to be used in the next phase of the process to identify the potential threats and opportunities presented by the forces. Phase two of the FOCA was completed through use of an online survey in which the MAPP Committee responded answering the following questions for each Force of Change provided in Phase one: When you think about public health and the health of our residents what is a Threat or Challenge as a result of? When you think about public health and the health of our residents what is an Opportunity as a result of? Following the collection of the surveys notes from Phase one were added to the responses and a summary was created. The forces identified on the following pages and the results of the other three assessments will serve as the foundation for identifying Strategic Issues, in the final MAPP process. WCHIP Forces of Change 5
79 Forces of Change in Walton County Included in the following table are the seven categories of forces that were identified by the Walton MAPP Committee as influencing Walton County s health system and community health, along with the associated threats and opportunities. BP oil spill Forces Threats Posed Opportunities Created Economic New Dental School opened in DeFuniak Negatively affected tourism resulting in loss of jobs and increased mental health issues. Unknown effect of chemicals in the ocean & the effect of these on the fish that we eat. Initially the oil spill affected tourism greatly and many people lost income, so mental health was a great threat. Also, what research is being done to prove or disprove the effect of the spill on the fish we eat from the gulf? The impact on the economy from the oil spill certainly caused harm in 2010 and 2011, but tourism numbers rebounded and surpassed pre-spill numbers, so hopefully any negative effects have been restored by now. I don't see a threat or challenge. Competition for local dentists. Although the pricing for having dental work completed there is still somewhat expensive, it is still not affordable for everyone. It is the only reduced rate resource for adults in our county. Enhance health care services to address mental health issues. New research that can be done. Millions spent by BP and given to groups like LPHI to assist FQHCs like ours. The settlement for the BP Oil Spill provides the opportunity for the community to build additional healthcare coordination and infrastructure to be developed. The oil spill brought national attention and a focused media campaign to our area, which generated new interest and tourists. A strong coastal economy impacts the whole county. There were jobs created from the BP monies Educate residents about the dental school and criteria for patients. Increase access to dental services that more people can afford. The new dental school provides residents with an increase in local availability of dentist services. It also brings in dental educations to the community who have highly skilled jobs, corresponding salaries, and families. Educated students are trained to become dentists and have the opportunities to practice and live in Walton County. New opportunity for provider training and increased access to free cleanings and screenings. Attachment B Page 6 of 17 WCHIP Forces of Change 6
80 Forces Threats Posed Opportunities Created Lack of health insurance Population & Wages Transportation Economic No or limited access to health care that does not require insurance. Without health insurance, the population will use hospital E.R.s for many health needs instead of finding a primary care doctor and using preventative services, which increased usage of the E.R. ends up costing the county, etc. Low wages result in not being able to afford healthcare so several will go without insurance. Poor access to health care, transportation to health care, not eating healthy due to lack of choices and cost, not being able to take the medication properly. Wages are very low in Walton County, which lends to lower levels for living, poor food choices, resistance to seek medical care, etc. Salary is low so they cannot afford insurance and living a healthy lifestyle. Lack of transportation and the distance that is required to travel for healthcare. Tri-county does what they can to provide for our residents, but they can only travel to certain locations on specific days of the week, limiting availability for travel to doctor appointments, etc. Educate residents on insurance coverage (Health Marketplace) - ACA. Educate residents re: healthcare choices. South Walton does have the tourist dollars to help support agencies county wide. The increase in local wages will increase the number of residents that qualify for health insurance. Increased wages will also empower residents to improve their health through purchasing more healthy food options which are often more costly than processed foods. Our population continues to increase, and new businesses are opening in Walton County, so that will have a positive impact on our community's health. The system that we have people know about. Having an existing public transportation system provides the opportunity to expand the service without having to build the initial infrastructure required for start-up. Staff members of the public transportation system area also already trained and versed in the available resources available throughout the county. Enhance transportation system. Attachment B Page 7 of 17 WCHIP Forces of Change 7
81 Forces Threats Posed Opportunities Created Where businesses are Higher required skill set for jobs, inadequate education and job training FedEx opened in Mossy Head & New Business growth in unpopulated areas Economic Too far in relation to the distance from where people live. Residents in the rural parts of the county (North) will pay more, drive more and sometimes go in to Alabama to spend their money. Residents in South Walton may actually spend more too because prices are driven by tourism. The majority of current business locations are spread out and do not encourage walking during the work day and throughout communities in which they are built. Not being able to bring jobs into the area. There are places to learn skills and institutions for higher education close by, but the cost of these will keep the population from learning. Companies need to fund educational opportunities for their employees to learn new skill sets. Shortage of healthcare professionals. Not enough health care services. Increase of use of the health care system. There will always be resistance to change, but hopefully the residents in Mossy Head view the new growth as an opportunity. It will bring more people to the area and there are not enough providers to service them. Expansion in North end. More options for health care & the Available to afford care. Increase health care services. Increase wages so more can afford health care. When people have jobs and increased wages, they may be able to added insurance and provider healthier options for their families i.e. healthier food, vacation time away from stress. Larger national businesses like FedEx provide the community the opportunity to have more families covered under adequate health insurance that includes preventable care benefits. New opportunities for jobs, career advancement, etc., lead to higher pay and better health choices. It will allow for more job opportunities for our residents. Attachment B Page 8 of 17 WCHIP Forces of Change 8
82 Forces Threats Posed Opportunities Created Flooding from storm Four lining project of Highway 331 Ethnic population increasing Limited water supply Large wetland areas Environmental Increase health issues that are just now showing up. People s homes were damaged and left unsanitary. Environmental health issues raised. Dealing with these issues will raise mental health issues as well. Homeless residents. There are more accidents from traffic issues. Evacuation pre/post storm. Lack of access/language barrier - need for interpreters. Different type of care needed. Many of the ethnic population are uninsured, which puts a strain on our citizens to pay for their healthcare. A challenge presented by increase in the number of Spanish speaking residents is ensuring that the health services available throughout the county are culturally competent and accessible. Wells running dry and not having access to clean water in outlying areas. Limited water supply can affect farmers who produce goods. Could eventually lead to shortage of water. Having to use chemicals to control pest in the areas. This can affect our cattle and food supply as well. Storm water run-off mitigation and waste water treatment are a challenge in wetland areas. Increase in mosquito borne viruses. New grants/funding to help residents effected. Educate residents on post-storm EH issues. More construction jobs which hopefully gives families mental stability and health insurance. The Highway lane project provides the opportunity to increase the development of the corridor and decrease the traffic backing up into the central portion of the county. This increase in development will allow for medical complexes that offer multiple services within a single location and increased service availability. Educate residents about evacuation pre/post storm. More care might be coming into the area. They are willing to do jobs that a lot of our population will not do. They help in rural areas (farmers) with jobs that may not otherwise be able to get completed. Hire more interpreters. Currently since it is good it allows people to continue to live in outlying areas. The limited water supply provides the opportunity to place value in water conservation efforts. Educate residents on rationing of water. Lack of building in those areas. Large wetland areas offer the opportunity to incorporate healthy nature and outdoor activities into communities. Educate residents on prevention of Mosquito borne viruses, i.e. West Nile Virus. Attachment B Page 9 of 17 WCHIP Forces of Change 9
83 Forces Threats Posed Opportunities Created Large protected areas (Eglin) Higher density of cities New communities being made in rural areas Increased water use Increased sewage Political Elections Providers retiring due to Affordable Care Act (ACA) Environmental Large swathes of protected land present a transportation challenge for residents who live on the edge of these areas and away from the county's available health services which cluster in the developed areas. Maybe more crime, drug use, etc. Higher populated areas may hold a higher threat of the spread of disease. Infrastructure. Too many people, not enough healthcare services. Running out of water and not having water tanks/holding tanks. Infrastructure. Could lead to shortage of water. More septic tanks, more need of treatment plants and placement of plants, what happen when flooding / other type of storms hits. Infrastructure. Could lead to pump failure resulting in raw sewage creating health hazard. Legal/Political Those elected may not be educated about the threats to our community, which may differ from other communities. Healthy policies can change. Lack of care. Lack of Family practice physicians. Decreased amount of healthcare providers (shortage). Large protected areas offer the opportunity to incorporate healthy nature and outdoor activities into family activities. Able to access other items without driving, more walking, and more options. Infrastructure. Increased density offers the opportunity to develop comprehensive health care service centers that are accessible to a larger number of residents. New communities being made in rural areas will provide the opportunity to expand the distribution of health care providers into areas that are not currently served by a local provider. Better housing opportunities. Increase healthcare services to all. Making cities using water systems instead of wells. Educate residents on water rationing. An increase in the amount of sewage needing to be treated provides an opportunity to develop sewer systems in areas that have a high potential for generating negative health impacts from waste water contamination. Educate residents, revise rules and regulations. Hopefully those elected will have interest in the uninsured and their health to make changes to the healthcare system. Educate elected officials on healthcare issues. New providers might be coming in with new ideas. Recruit medical students before graduating. Use staffing agencies. Attachment B Page 10 of 17 WCHIP Forces of Change 10
84 Forces Threats Posed Opportunities Created Legalization of Medical Marijuana Privatization of Primary Care (HMOs) Decrease in Low Income Pool (LIP) funding, i.e. less government funding for programs Increase in governmental revenue from BP settlement Implementation of ACA Immigration rules and regulations Did not expand adult Medicaid Legal/Political Not being able to control. Increased drug use. Fraud. The increase use of marijuana as a result of legalization increases the number of residents who are addicted to marijuana which increases the negative consequences associated with its use. Legalization of marijuana use has also been shown to increase your marijuana use rates, which could lead to the legalization of marijuana. Limit of access. Too many unknowns. Will the health of the patient be the highest priority? Privatization will hurt the economy overall. Have limited choices for healthcare. Less access for people that need these services. When hospitals and clinics loose funding of any type, programs disappear for those that need medical assistance. Decreased healthcare services. Where the funding can go. Just because you have been given the money, it has to be spent. Not always in the most sensible and logistical way. Spend revenue as appropriate on healthcare services. Paying more for insurance and getting less coverage. Some restrictions for medical benefits. Illegals going to ER. Lack of access of services. Still a great amount of residents that cannot afford health insurance. If Medicaid is expanded to include adults, the cost to the state would be significant. Some residents will not be able to obtain Medicaid (Insurance). Helping with pain and other items without drugs. If regulated properly, some economic impact for residents moving in to have access. Improving the health of those who truly need it. Education regarding medical marijuana. Healthcare for all? Educate residents on various managed care healthcare companies and the benefits. Less government can be good. It's just hard to start a program and then take it away. Look for other funding sources to replace LIP. Attachment B Page 11 of 17 More funding to other items so that maybe current funding can be used for services. If spent properly, it could assist in infrastructure to increase and sustain growth for our communities. Expand healthcare services. Coverage for children up to age 26, coverage for pre-existing conditions. Educate residents on ACA. Educate lawmakers on the effects of the rules and regulations on healthcare. More adults will have opportunities to seek health care on a regular basis. WCHIP Forces of Change 11
85 Forces Threats Posed Opportunities Created Increased drug use Increased enforcement by DOH & Law enforcement (more staff) Increase provider education Growing disillusionment with Government Tobacco free policies & E-cig use Legal/Political More use of the system. No affordable treatment centers. Increased drug use is linked to increases in domestic violence, child abuse, violent crime, property crime, accidental injuries, motor vehicle crashes, and the need for social services. Increase STD/STIs. Not enough substance abuse treatment facilities in county. Some people that really needed pain meds now cannot get them. Increased payroll for state and county government. Not enough employees / law enforcement. Education takes away from the provider seeing patients. Cost of education. Impacts time and cost. A continuous feeling that government controls too many aspects of our lives. Residents not obeying rules / regulations. Currently not be able to enforce use and not updating as fast as needed. Only to the economy, not the health of our residents. Residents switching to e-cigs thinking they are healthier. STD Education. Increase number of substance abuse treatment facilities in county. Taking meds off of the streets. Keeping everyone safer. Increased enforcement efforts by law enforcement provides the opportunity to raise awareness of these efforts to reduce drug use and it associated consequences. Hire more staff / law enforcement. Able to give out more information and to be able to keep current with all changes. Up to date of latest medical advances, medications, etc. Increasing provider education to the community will provide the opportunity to increase their awareness of available health services and effective self-care options. Find ways to educate at no cost to provider. Education. Including e-cigs in policies and getting the word out on health issues with e-cigs. Keeping our children from trying tobacco of any kind. Increasing the number of tobacco free policies that include e- cigarettes provides the opportunity to reduce the number of residents who start using tobacco products and encourages tobacco cessation by current tobacco users. Educate residents on the dangers of e-cigs. Attachment B Page 12 of 17 WCHIP Forces of Change 12
86 Forces Threats Posed Opportunities Created County Health Department moving to core public health Uneven distribution of health care providers Lack of affordable housing Inadequate mental health care Social Primary care in Walton county is very limited, the health department provides a much needed service to Walton Co. through its healthcare providers. Lack of primary care services. Not being able to get care where you live. Residents will travel out of area for providers. The lack of affordable housing threatens the overall health of the county by pushing low wage earning residents farther away from population centers that centralize medical services and other supports for developing healthy lifestyles. More people living in homes that have issues. Family forced to live together in housing that is too small or does not provide sanitary conditions. Homelessness. Untreated mental health disorders contribute to lower physical health for residents. People are not using the care when needed. There are not enough available resources or mental health providers to handle the amount of residents that need counseling. Need to educate families of resources that are available. Increase usage of ERs. Redirecting the majority of the county health department's expertise and resources into public health services will provide the opportunity to assist in developing the capacity within Walton County to prevent significant health issues by addressing the contributing community factors that drive these population level changes in health. Expand other services (core public health). Specialists should provide clinics at the north end of the county. Attachment B Page 13 of 17 Developing communities that offer affordable housing for residents increases the density of healthcare consumers which provides the opportunity to fund sustainable satellite health care service centers within these areas. Options to build decent housing & maybe funding from grants. County government could work with developers to assist with building affordable housing by offering incentives or tax breaks. Educate BOCC on the need for affordable housing due to public health issues. Including mental health treatment services into health care service centers will provide the opportunity for residents to receive additional treatment services at a convenient setting. WCHIP Forces of Change 13
87 Forces Threats Posed Opportunities Created Notable economist predicts population spike North of the Bay Residential changes and needs Meaningful Use Availability of fiber optics & cable providers county wide Infrastructure concerns Social It will be a challenge to expand sanitation services, and healthcare infrastructure to serve the proposed significant population increase in the population for the central and northern portions of Walton County. Lack of infrastructure, housing, medical providers. Limited healthcare services north of Bay. Infrastructure. Not enough healthcare services to meet the changes & needs. Technological/Scientific Some facilities may not have funding, even with incentives to implement HER and keep it sustained. Some patients do not have computers. Lack of. None Money and upkeep of the infrastructure. Attachment B Page 14 of 17 Expanding the population of communities in the central and northern areas of Walton County will provide the opportunity to increase the available healthcare resource capacity in these areas through the development of sustainable clinics and specialized service providers. Increase in economy, more jobs with better income opportunities and medical insurance availability through employers. Increase healthcare services north of Bay. Better housing opportunities. Increase healthcare services to meet needs. The idea of being able to have your health records available wherever you are is portable and convenient. Opportunities for better health care. Enhance primary care efficiency. Increasing the quality of local computer networking infrastructure will provide providers with the opportunity to implement Electronic Medical Record systems that improve their efficiency in record keeping, data sharing, and communicating with other community groups to improve health coordination efforts. None. Growing opportunities for Telemedicine and state of the art equipment. Enhance IT infrastructure. Improve communication. Growing opportunities for Telemedicine and state of the art equipment. Educating. WCHIP Forces of Change 14
88 Forces Threats Posed Opportunities Created Growing Telehealth Increasing use of Social Media and Smart Phones Technological/Scientific Access. Being able to provide maintenance to the system. Obtain funding for Telemedicine. Harder to police and disseminate fact from fiction. DOH-Walton communicates limited amounts of healthcare information via social media. Expanding telemedicine services provides an opportunity to increase access to medical expertise, improve responsiveness to medication adjustments, and expand the self-care strategies being implemented by residents to manage their own health. Access. Jobs and better health systems. To use telemedicine in our rural clinics. Increasing the use of social media to disseminate information about disease prevention, healthy lifestyles, and available healthcare services by providers will provide the opportunity to increase the number of informed health consumers. Most everyone has a smart phone, so information is easier to get to outlying areas. Increase communication of healthcare services and educational info via social media. Attachment B Page 15 of 17 WCHIP Forces of Change 15
89 Attachment B Page 16 of 17 APPENDIX A Forces of Change Worksheet Forces of Change Affecting Health in Walton County Events Factors Trends Economic FedEx opened in Mossy Head Population & Wages BP Road/transportation infrastructure, i.e. four laning project of Highway 331 New Dental School opened in DFS Flooding from storm Transportation Where businesses are BP oil spill Higher required skill set for jobs Lack of health insurance Environmental Four laning project of Highway 331 Ethnic population increasing Higher density of cities BP oil spill Limited water supply New communities being made in rural areas Flooding from storm Large wetland areas Increased water use Large protected areas (Eglin) Increased sewage Legal/Political Political Elections Immigration rules and regulations Growing disillusionment with Government Providers retiring due to Affordable Care Act (ACA) Did not expand adult Medicaid Tobacco free policies Legalization of Medical Marijuana Increased drug use Privatization of Primary Care (HMOs) Increased enforcement by DOH & Law enforcement (more staff) Decrease in Low Income Pool (LIP) funding, i.e. less government funding for programs Increase provider education Increase in governmental revenue from BP settlement Implementation of ACA Social BP oil spill Increase in ethnic population Notable economist predicts population spike North of the Bay County Health Department moving Uneven distribution of health care Residential changes and needs to core public health providers Inadequate education & job E-cigarette use training Lack of affordable housing New business growth in unpopulated areas Inadequate mental health care Technological/ Meaningful Use Availability of fiber optics county wide Growing Telehealth Scientific Availability of cable providers county wide Increasing use of Social Media Infrastructure concerns WCHIP Forces of Change 16
90 Attachment B Page 17 of 17

91 Local Assessment Report FDOH Walton 2/17/2016 Attachment C Page 1 of 31
92 Program Partner Organizations Attachment C Page 2 of 31 American Public Health Association Association of State and Territorial Health Officials Centers for Disease Control and Prevention National Association of County and City Health Officials National Association of Local Boards of Health National Network of Public Health Institutes Public Health Foundation The findings and conclusions stemming from the use of NPHPS tools are those of the end users. They are not provided or endorsed by the Centers for Disease Control and Prevention, nor do they represent CDC s views or policies. 2
93 Attachment C Page 3 of 31 Table of Contents Acknowledgements 4 Background 4 Introduction 5 Purpose 6 About the Report 6 Results 8 Overall Scores for Each Essential Public Health Service 8 Performance Scores by Essential Public Health Service for Each Model Standard 9 Performance Relative to Optimal Activity 12 Analysis and Discussion Questions 13 Next Steps Developing Your Action Plan 13 Monitoring and Evaluation 14 APPENDIX A: Individual Questions and Responses 15 APPENDIX B: Qualitative Assessment Data 24 APPENDIX C: Additional Resources 30 3
94 Acknowledgements Attachment C Page 4 of 31 The National Public Health Performance Standards (NPHPS) was developed collaboratively by the program s national partner organizations. The NPHPS partner organizations include: Centers for Disease Control and Prevention (CDC); American Public Health Association (APHA); Association of State and Territorial Health Officials (ASTHO); National Association of County and City Health Officials (NACCHO); National Association of Local Boards of Health (NALBOH); National Network of Public Health Institutes (NNPHI); and then Public Health Foundation (PHF). We thank the staff of these organizations for their time and expertise in the support of the NPHPS. Background The NPHPS is a partnership effort to improve the practice of public health and the performance of public health systems. The NPHPS assessment instruments guide state and local jurisdictions in evaluating their current performance against a set of optimal standards. Through these assessments, responding sites can consider the activities of all public health system partners, thus addressing the activities of all public, private and voluntary entities that contribute to public health within the community. The NPHPS assessments are intended to help users answer questions such as "What are the components, activities, competencies, and capacities of our public health system?" and "How well are the ten Essential Public Health Services being provided in our system?" The dialogue that occurs in the process of answering the questions in the assessment instrument can help to identify strengths and weaknesses, determine opportunities for immediate improvements, and establish priorities for long term investments for improving the public health system. Three assessment instruments have been designed to assist state and local partners in assessing and improving their public health systems or boards of health. These instruments are the: State Public Health System Performance Assessment Instrument, Local Public Health System Performance Assessment Instrument, and Public Health Governing Entity Performance Assessment Instrument. The information obtained from assessments may then be used to improve and better coordinate public health activities at state and local levels. In addition, the results gathered provide an understanding of how state and local public health systems and governing entities are performing. This information helps local, state and national partners make better and more effective policy and resource decisions to improve the nation s public health as a whole. 4

 standards.")
95 Attachment C Page 5 of 31 Introduction The NPHPS Local Public Health System Assessment Report is designed to help health departments and public health system partners create a snapshot of where they are relative to the National Public Health Performance Standards and to progressively move toward refining and improving outcomes for performance across the public health system. The NPHPS state, local, and governance instruments also offer opportunity and robust data to link to health departments, public health system partners and/or community-wide strategic planning processes, as well as to Public Health Accreditation Board (PHAB) standards. For example, assessment of the environment external to the public health organization is a key component of all strategic planning, and the NPHPS assessment readily provides a structured process and an evidence-base upon which key organizational decisions may be made and priorities established. The assessment may also be used as a component of community health improvement planning processes, such as Mobilizing for Action through Planning and Partnerships (MAPP) or other community-wide strategic planning efforts, including state health improvement planning and community health improvement planning. The NPHPS process also drives assessment and improvement activities that may be used to support a Health Department in meeting PHAB standards. Regardless of whether using MAPP or another health improvement process, partners should use the NPHPS results to support quality improvement. The self-assessment is structured around the Model Standards for each of the ten Essential Public Health Services, (EPHS), hereafter referred to as the Essential Services, which were developed through a comprehensive, collaborative process involving input from national, state and local experts in public health. Altogether, for the local assessment, 30 Model Standards serve as quality indicators that are organized into the ten essential public health service areas in the instrument and address the three core functions of public health. Figure 1 below shows how the ten Essential Services align with the three Core Functions of Public Health. Figure 1. The ten Essential Public Health Services and how they relate to the three Core Functions of Public Health. 5
96 Attachment C Page 6 of 31 Purpose The primary purpose of the NPHPS Local Public Health System Assessment Report is to promote continuous improvement that will result in positive outcomes for system performance. Local health departments and their public health system partners can use the Assessment Report as a working tool to: Better understand current system functioning and performance; Identify and prioritize areas of strengths, weaknesses, and opportunities for improvement; Articulate the value that quality improvement initiatives will bring to the public health system; Develop an initial work plan with specific quality improvement strategies to achieve goals; Begin taking action for achieving performance and quality improvement in one or more targeted areas; and Re-assess the progress of improvement efforts at regular intervals. This report is designed to facilitate communication and sharing among and within programs, partners, and organizations, based on a common understanding of how a high performing and effective public health system can operate. This shared frame of reference will help build commitment and focus for setting priorities and improving public health system performance. Outcomes for performance include delivery of all ten essential public health services at optimal levels. About the Report Calculating the Scores The NPHPS assessment instruments are constructed using the ten Essential Services as a framework. Within the Local Instrument, each Essential Service includes between 2-4 Model Standards that describe the key aspects of an optimally performing public health system. Each Model Standard is followed by assessment questions that serve as measures of performance. Responses to these questions indicate how well the Model Standard - which portrays the highest level of performance or "gold standard" - is being met. Table 1 below characterizes levels of activity for Essential Services and Model Standards. Using the responses to all of the assessment questions, a scoring process generates score for each Model Standard, Essential Service, and one overall assessment score. Table 1. Summary of Assessment Response Options Optimal Activity (76-100%) Greater than 75% of the activity described within the question is met. Significant Activity (51-75%) Greater than 50%, but no more than 75% of the activity described within the question is met. Moderate Activity (26-50%) Greater than 25%, but no more than 50% of the activity described within the question is met. Minimal Activity (1-25%) No Activity (0%) Greater than zero, but no more than 25% of the activity described within the question is met. 0% or absolutely no activity. 6
97 Attachment C Page 7 of 31 Understanding Data Limitations There are a number of limitations to the NPHPS assessment data due to self-report, wide variations in the breadth and knowledge of participants, the variety of assessment methods used, and differences in interpretation of assessment questions. Data and resultant information should not be interpreted to reflect the capacity or performance of any single agency or organization within the public health system or used for comparisons between jurisdictions or organizations. Use of NPHPS generated data and associated recommendations are limited to guiding an overall public health infrastructure and performance improvement process for the public health system as determined by organizations involved in the assessment. All performance scores are an average; Model Standard scores are an average of the question scores within that Model Standard, Essential Service scores are an average of the Model Standard scores within that Essential Service and the overall assessment score is the average of the Essential Service scores. The responses to the questions within the assessment are based upon processes that utilize input from diverse system participants with different experiences and perspectives. The gathering of these inputs and the development of a response for each question incorporates an element of subjectivity, which may be minimized through the use of particular assessment methods. Additionally, while certain assessment methods are recommended, processes differ among sites. The assessment methods are not fully standardized and these differences in administration of the self-assessment may introduce an element of measurement error. In addition, there are differences in knowledge about the public health system among assessment participants. This may lead to some interpretation differences and issues for some questions, potentially introducing a degree of random non-sampling error. Presentation of results The NPHPS has attempted to present results - through a variety of figures and tables - in a user-friendly and clear manner. For ease of use, many figures and tables use short titles to refer to Essential Services, Model Standards, and questions. If you are in doubt of these definitions, please refer to the full text in the assessment instruments. Sites may have chosen to complete two additional questionnaires, the Priority of Model Standards Questionnaire assesses how performance of each Model Standard compares with the priority rating and the Agency Contribution Questionnaire assesses the local health department's contribution to achieving the Model Standard. Sites that submitted responses for these questionnaires will see the results included as additional components of their report. 7


98 8 Attachment C Page 8 of 31


99 9 Attachment C Page 9 of 31

100 10 Attachment C Page 10 of 31

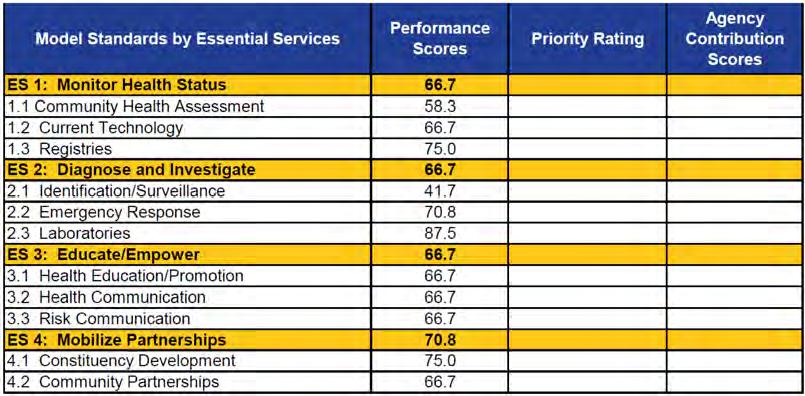

101 11 Attachment C Page 11 of 31

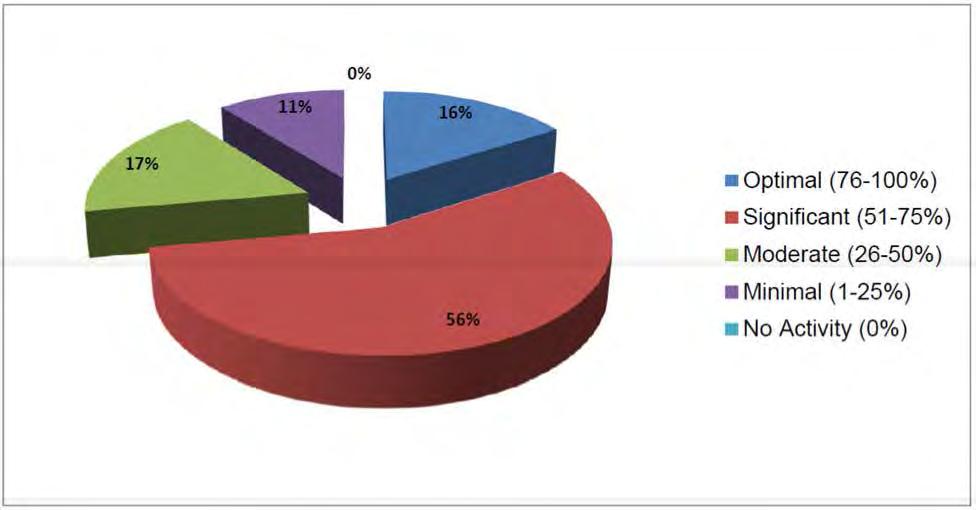
102 12 Attachment C Page 12 of 31
103 Analysis and Discussion Questions Attachment C Page 13 of 31 Having a standard way in which to analyze the data in this report is important. This process does not have to be difficult; however, drawing some initial conclusions from your data will prove invaluable as you move forward with your improvement efforts. It is crucial that participants fully discuss the performance assessment results. The bar graphs, charts, and summary information in the Results section of this report should be helpful in identifying high and low performing areas. Please refer to Appendix H of the Local Assessment Implementation Guide. This referenced set of discussion questions will to help guide you as you analyze the data found in the previous sections of this report. Using the results in this report will help you to generate priorities for improvement, as well as possible improvement projects. Your data analysis should be an interactive process, enabling everyone to participate. Do not be overwhelmed by the potential of many possibilities for QI projects the point is not that you have to address them all now. Consider this step as identifying possible opportunities to enhance your system performance. Keep in mind both your quantitative data (Appendix A) and the qualitative data that you collected during the assessment (Appendix B). Next Steps Congratulations on your participation in the local assessment process. A primary goal of the NPHPS is that data is used proactively to monitor, assess, and improve the quality of essential public health services. This report is an initial step to identifying immediate actions and activities to improve local initiatives. The results in this report may also be used to identify longer-term priorities for improvement, as well as possible improvement projects. As noted in the Introduction of this report, NPHPS data may be used to inform a variety of organization and/or systems planning and improvement processes. Plan to use both quantitative data (Appendix A) and qualitative data (Appendix B) from the assessment to identify improvement opportunities. While there may be many potential quality improvement projects, do not be overwhelmed the point is not that you have to address them all now. Rather, consider this step as a way to identify possible opportunities to enhance your system performance and plan to use the guidance provided in this section, along with the resources offered in Appendix C, to develop specific goals for improvement within your public health system and move from assessment and analysis toward action. Note: Communities implementing Mobilizing for Action through Planning and Partnerships (MAPP) may refer to the MAPP guidance for considering NPHPS data along with other assessment data in the Identifying Strategic Issues phase of MAPP. Action Planning In any systems improvement and planning process, it is important to involve all public health system partners in determining ways to improve the quality of essential public health services provided by the system. Participation in the improvement and planning activities included in your action plan is the responsibility of all partners within the public health system. Consider the following points as you build an Action Plan to address the priorities you have identified Each public health partner should be considered when approaching quality improvement for your system The success of your improvement activities are dependent upon the active participation and contribution of each and every member of the system An integral part of performance improvement is working consistently to have long-term effects A multi-disciplinary approach that employs measurement and analysis is key to accomplishing and sustaining improvements 13
104 You may find that using the simple acronym, FOCUS is a way to help you to move from assessment and analysis to action. Attachment C Page 14 of 31 F Find an opportunity for improvement using your results. O Organize a team of public health system partners to work on the improvement. Someone in the group should be identified as the team leader. Team members should represent the appropriate organizations that can make an impact. C Consider the current process, where simple improvements can be made and who should make the improvements. U Understand the problem further if necessary, how and why it is occurring, and the factors that contribute to it. Once you have identified priorities, finding solutions entails delving into possible reasons, or root causes, of the weakness or problem. Only when participants determine why performance problems (or successes!) have occurred will they be able to identify workable solutions that improve future performance. Most performance issues may be traced to well-defined system causes, such as policies, leadership, funding, incentives, information, personnel or coordination. Many QI tools are applicable. You may consider using a variety of basic QI tools such as brainstorming, 5-whys, prioritization, or cause and effect diagrams to better understand the problem (refer to Appendix C for resources). S Select the improvement strategies to be made. Consider using a table or chart to summarize your Action Plan. Many resources are available to assist you in putting your plan on paper, but in general you ll want to include the priority selected, the goal, the improvement activities to be conducted, who will carry them out, and the timeline for completing the improvement activities. When complete, your Action Plan should contain documentation on the indicators to be used, baseline performance levels and targets to be achieved, responsibilities for carrying out improvement activities and the collection and analysis of data to monitor progress. (Additional resources may be found in Appendix C.) Monitoring and Evaluation: Keys to Success Monitoring your action plan is a highly proactive and continuous process that is far more than simply taking an occasional "snap-shot" that produces additional data. Evaluation, in contrast to monitoring, provides ongoing structured information that focuses on why results are or are not being met, what unintended consequences may be, or on issues of efficiency, effectiveness, and/or sustainability. After your Action Plan is implemented, monitoring and evaluation continues to determine whether quality improvement occurred and whether the activities were effective. If the Essential Service performance does not improve within the expected time, additional evaluation must be conducted (an additional QI cycle) to determine why and how you can update your Action Plan to be more effective. The Action Plan can be adjusted as you continue to monitor and evaluate your efforts. 14
105 Attachment C Page 15 of 31 APPENDIX A: Individual Questions and Responses Performance Scores ESSENTIAL SERVICE 1: Monitor Health Status to Identify Community Health Problems 1.1 Model Standard: Population-Based Community Health Assessment (CHA) At what level does the local public health system: Conduct regular community health assessments? Continuously update the community health assessment with current information? Promote the use of the community health assessment among community members and partners? Model Standard: Current Technology to Manage and Communicate Population Health Data At what level does the local public health system: Use the best available technology and methods to display data on the public s health? Analyze health data, including geographic information, to see where health problems exist? Use computer software to create charts, graphs, and maps to display complex public health data (trends over time, sub-population analyses, etc.)? Model Standard: Maintenance of Population Health Registries At what level does the local public health system: Collect data on specific health concerns to provide the data to population health registries in a timely manner, consistent with current standards? Use information from population health registries in community health assessments or other analyses? ESSENTIAL SERVICE 2: Diagnose and Investigate Health Problems and Health Hazards Model Standard: Identification and Surveillance of Health Threats At what level does the local public health system: Participate in a comprehensive surveillance system with national, state and local partners to identify, monitor, share information, and understand emerging health problems and threats? Provide and collect timely and complete information on reportable diseases and potential disasters, emergencies and emerging threats (natural and manmade)? Assure that the best available resources are used to support surveillance systems and activities, including information technology, communication systems, and professional expertise?
106 2.2 Model Standard: Investigation and Response to Public Health Threats and Emergencies At what level does the local public health system: Attachment C Page 16 of Maintain written instructions on how to handle communicable disease outbreaks and toxic exposure incidents, including details about case finding, contact tracing, and source identification and containment? Develop written rules to follow in the immediate investigation of public health threats and emergencies, including natural and intentional disasters? Designate a jurisdictional Emergency Response Coordinator? Prepare to rapidly respond to public health emergencies according to emergency operations coordination guidelines? Identify personnel with the technical expertise to rapidly respond to possible biological, chemical, or and nuclear public health emergencies? Evaluate incidents for effectiveness and opportunities for improvement? Model Standard: Laboratory Support for Investigation of Health Threats At what level does the local public health system: Have ready access to laboratories that can meet routine public health needs for finding out what health problems are occurring? Maintain constant (24/7) access to laboratories that can meet public health needs during emergencies, threats, and other hazards? Use only licensed or credentialed laboratories? Maintain a written list of rules related to laboratories, for handling samples (collecting, labeling, storing, transporting, and delivering), for determining who is in charge of the samples at what point, and for reporting the results? 100 ESSENTIAL SERVICE 3: Inform, Educate, and Empower People about Health Issues Model Standard: Health Education and Promotion At what level does the local public health system: Provide policymakers, stakeholders, and the public with ongoing analyses of community health status and related recommendations for health promotion policies? Coordinate health promotion and health education activities to reach individual, interpersonal, community, and societal levels? Engage the community throughout the process of setting priorities, developing plans and implementing health education and health promotion activities? Model Standard: Health Communication At what level does the local public health system:
107 Develop health communication plans for relating to media and the public and for sharing information among LPHS organizations? Use relationships with different media providers (e.g. print, radio, television, and the internet) to share health information, matching the message with the target audience? Attachment C Page 17 of Identify and train spokespersons on public health issues? Model Standard: Risk Communication At what level does the local public health system: Develop an emergency communications plan for each stage of an emergency to allow for the effective dissemination of information? Make sure resources are available for a rapid emergency communication response? Provide risk communication training for employees and volunteers? 50 ESSENTIAL SERVICE 4: Mobilize Community Partnerships to Identify and Solve Health Problems 4.1 Model Standard: Constituency Development At what level does the local public health system: Maintain a complete and current directory of community organizations? Follow an established process for identifying key constituents related to overall public health interests and particular health concerns? Encourage constituents to participate in activities to improve community health? Create forums for communication of public health issues? Model Standard: Community Partnerships At what level does the local public health system: Establish community partnerships and strategic alliances to provide a comprehensive approach to improving health in the community? Establish a broad-based community health improvement committee? Assess how well community partnerships and strategic alliances are working to improve community health? 50 ESSENTIAL SERVICE 5: Develop Policies and Plans that Support Individual and Community Health Efforts Model Standard: Governmental Presence at the Local Level At what level does the local public health system: Support the work of a local health department dedicated to the public health to make sure the essential public health services are provided? 75 17
108 See that the local health department is accredited through the national voluntary accreditation program? Assure that the local health department has enough resources to do its part in providing essential public health services? Model Standard: Public Health Policy Development At what level does the local public health system: Contribute to public health policies by engaging in activities that inform the policy development process? Alert policymakers and the community of the possible public health impacts (both intended and unintended) from current and/or proposed policies? Attachment C Page 18 of Review existing policies at least every three to five years? Model Standard: Community Health Improvement Process and Strategic Planning At what level does the local public health system: Establish a community health improvement process, with broad- based diverse participation, that uses information from both the community health assessment and the perceptions of community members? Develop strategies to achieve community health improvement objectives, including a description of organizations accountable for specific steps? Connect organizational strategic plans with the Community Health Improvement Plan? Model Standard: Plan for Public Health Emergencies At what level does the local public health system: Support a workgroup to develop and maintain preparedness and response plans? Develop a plan that defines when it would be used, who would do what tasks, what standard operating procedures would be put in place, and what alert and evacuation protocols would be followed? Test the plan through regular drills and revise the plan as needed, at least every two years? ESSENTIAL SERVICE 6: Enforce Laws and Regulations that Protect Health and Ensure Safety Model Standard: Review and Evaluation of Laws, Regulations, and Ordinances At what level does the local public health system: Identify public health issues that can be addressed through laws, regulations, or ordinances? Stay up-to-date with current laws, regulations, and ordinances that prevent, promote, or protect public health on the federal, state, and local levels?
109 Review existing public health laws, regulations, and ordinances at least once every five years? Have access to legal counsel for technical assistance when reviewing laws, regulations, or ordinances? Attachment C Page 19 of Model Standard: Involvement in the Improvement of Laws, Regulations, and Ordinances At what level does the local public health system: Identify local public health issues that are inadequately addressed in existing laws, regulations, and ordinances? Participate in changing existing laws, regulations, and ordinances, and/or creating new laws, regulations, and ordinances to protect and promote the public health? Provide technical assistance in drafting the language for proposed changes or new laws, regulations, and ordinances? Model Standard: Enforcement of Laws, Regulations, and Ordinances At what level does the local public health system: Identify organizations that have the authority to enforce public health laws, regulations, and ordinances? Assure that a local health department (or other governmental public health entity) has the authority to act in public health emergencies? Assure that all enforcement activities related to public health codes are done within the law? Educate individuals and organizations about relevant laws, regulations, and ordinances? Evaluate how well local organizations comply with public health laws? 50 ESSENTIAL SERVICE 7: Link People to Needed Personal Health Services and Assure the Provision of Health Care when Otherwise Unavailable Model Standard: Identification of Personal Health Service Needs of Populations At what level does the local public health system: Identify groups of people in the community who have trouble accessing or connecting to personal health services? Identify all personal health service needs and unmet needs throughout the community? Defines partner roles and responsibilities to respond to the unmet needs of the community? Understand the reasons that people do not get the care they need? 50 19
110 Model Standard: Assuring the Linkage of People to Personal Health Services At what level does the local public health system: Connect (or link) people to organizations that can provide the personal health services they may need? Help people access personal health services, in a way that takes into account the unique needs of different populations? Help people sign up for public benefits that are available to them (e.g., Medicaid or medical and prescription assistance programs)? Coordinate the delivery of personal health and social services so that everyone has access to the care they need? Attachment C Page 20 of ESSENTIAL SERVICE 8: Assure a Competent Public and Personal Health Care Workforce Model Standard: Workforce Assessment, Planning, and Development At what level does the local public health system: Set up a process and a schedule to track the numbers and types of LPHS jobs and the knowledge, skills, and abilities that they require whether those jobs are in the public or private sector? Review the information from the workforce assessment and use it to find and address gaps in the local public health workforce? Provide information from the workforce assessment to other community organizations and groups, including governing bodies and public and private agencies, for use in their organizational planning? Model Standard: Public Health Workforce Standards At what level does the local public health system: Make sure that all members of the public health workforce have the required certificates, licenses, and education needed to fulfill their job duties and meet the law? Develop and maintain job standards and position descriptions based in the core knowledge, skills, and abilities needed to provide the essential public health services? Base the hiring and performance review of members of the public health workforce in public health competencies? Model Standard: Life-Long Learning through Continuing Education, Training, and Mentoring At what level does the local public health system: Identify education and training needs and encourage the workforce to participate in available education and training? Provide ways for workers to develop core skills related to essential public health services? Develop incentives for workforce training, such as tuition reimbursement, time off for class, and pay increases?
111 8.3.4 Create and support collaborations between organizations within the public health system for training and education? Attachment C Page 21 of Continually train the public health workforce to deliver services in a cultural competent manner and understand social determinants of health? Model Standard: Public Health Leadership Development At what level does the local public health system: Provide access to formal and informal leadership development opportunities for employees at all organizational levels? Create a shared vision of community health and the public health system, welcoming all leaders and community members to work together? Ensure that organizations and individuals have opportunities to provide leadership in areas where they have knowledge, skills, or access to resources? Provide opportunities for the development of leaders representative of the diversity within the community? ESSENTIAL SERVICE 9: Evaluate Effectiveness, Accessibility, and Quality of Personal and Population-Based Health Services Model Standard: Evaluation of Population-Based Health Services At what level does the local public health system: Evaluate how well population-based health services are working, including whether the goals that were set for programs were achieved? Assess whether community members, including those with a higher risk of having a health problem, are satisfied with the approaches to preventing disease, illness, and injury? Identify gaps in the provision of population-based health services? Use evaluation findings to improve plans and services? Model Standard: Evaluation of Personal Health Services At what level does the local public health system: Evaluate the accessibility, quality, and effectiveness of personal health services? Compare the quality of personal health services to established guidelines? Measure satisfaction with personal health services? Use technology, like the internet or electronic health records, to improve quality of care? Use evaluation findings to improve services and program delivery? 75 21
112 Model Standard: Evaluation of the Local Public Health System At what level does the local public health system: Identify all public, private, and voluntary organizations that provide essential public health services? Evaluate how well LPHS activities meet the needs of the community at least every five years, using guidelines that describe a model LPHS and involving all entities contributing to essential public health services? Assess how well the organizations in the LPHS are communicating, connecting, and coordinating services? Attachment C Page 22 of Use results from the evaluation process to improve the LPHS? 75 ESSENTIAL SERVICE 10: Research for New Insights and Innovative Solutions to Health Problems 10.1 Model Standard: Fostering Innovation At what level does the local public health system: Provide staff with the time and resources to pilot test or conduct studies to test new solutions to public health problems and see how well they actually work? Suggest ideas about what currently needs to be studied in public health to organizations that do research? Keep up with information from other agencies and organizations at the local, state, and national levels about current best practices in public health? Encourage community participation in research, including deciding what will be studied, conducting research, and in sharing results? Model Standard: Linkage with Institutions of Higher Learning and/or Research At what level does the local public health system: Develop relationships with colleges, universities, or other research organizations, with a free flow of information, to create formal and informal arrangements to work together? Partner with colleges, universities, or other research organizations to do public health research, including community-based participatory research? Encourage colleges, universities, and other research organizations to work together with LPHS organizations to develop projects, including field training and continuing education? Model Standard: Capacity to Initiate or Participate in Research At what level does the local public health system: Collaborate with researchers who offer the knowledge and skills to design and conduct health-related studies? Support research with the necessary infrastructure and resources, including facilities, equipment, databases, information technology, funding, and other resources?
113 Share findings with public health colleagues and the community broadly, through journals, websites, community meetings, etc.? Attachment C Page 23 of Evaluate public health systems research efforts throughout all stages of work from planning to impact on local public health practice? 0 23
114 Attachment C Page 24 of 31 APPENDIX B: Qualitative Assessment Data Summary Notes ESSENTIAL SERVICE 1: Monitor Health Status to Identify Community Health Problems STRENGTHS WEAKNESSES OPPORTUNITIES FOR IMMEDIATE IMPROVEMENT/ PARTNERSHIPS PRIORITIES OR LONGER TERM IMPROVEMENT OPPORTUNITIES 1.1 Model Standard: Population-Based Community Health Assessment (CHA) The CHA is ed to CHIP partners. Adequate time is given to complete CHA: 2 months Data is being compared to prior years There are posters in the community to promote completing the survey There are 17 Indicators identified There is prioritizing of data and indicators The CHA is based on community needs Identifies Accessibility and access to care, results to WCHIP partners, Florida charts: look for areas to help educate the community (example graphics to compare disease trends and averages), agency websites, availability of computers for public use Disseminating CHA: there is a breakdown in communication from CHIP partners to other agencies (example-school board), knowledge of state health priorities, knowledge of healthy people 2020, around 250 out of 360 WCHIP partners responded to survey Get goals from Healthy People 2020, DOH can look at goals, get surveys to hospital staff and doctors offices, get base data and compare to prior year or two continuous improvement (internal monitoring), sent via , available on website Providers look for benchmarks and goals for patient care. (example 10 year national goal), raise awareness of assessment survey, send information home with students and use incentives to increase completion of survey, mosquito control use door hangers, use property appraisers office and clerk s office to share the information 1.2 Model Standard: Current Technology to Manage and Communicate Population Health Data getting information to the Continuity of data sets between frontline and the community, too organizations, better much information sent out (too communication, GIS mapping many s), make data system, UWF has more software, available to the public, geocode Evaluation of data from other by zip code, census, or county organizations, pinpointing accessibility issues DOH, Healthy Start, MD offices and Hospitals, DCF, EOC, Standards: Confidentiality, Registries: Florida Shots, Epidemiology, STI Internal organization assessments (Customer satisfaction surveys), manual bubble sheets in doctor's offices so surveys can be scanned electronically organizations share data with DOH for more specific geographical locations, better communication on websites between organizations, information tailored to audience (community story boards and billboards) 1.3 Model Standard: Maintenance of Population Health Registries Processes are not always followed, Special needs shelter: export files timely reporting by doctors monthly to registries to qualify (communicable diseases), patients better (EOC) Confidentiality issues (depends on registry). Private providers not entering immunization records in Florida Shots. (This falls onto the schools and school health nurses), Communication of reportable diseases from DOH and providers to EOC for patients who are in special needs shelters, duplication of reporting from different agencies, breakdown of communication between agencies better communication between agencies of reporting to registries (child abuse and communicable diseases 24
115 ESSENTIAL SERVICE 2: Diagnose and Investigate Health Problems and Health Hazards Attachment C Page 25 of 31 STRENGTHS WEAKNESSES OPPORTUNITIES FOR IMMEDIATE IMPROVEMENT/ PARTNERSHIPS Existing Partnerships Knowledgeable Staff Reporting Systems (Merlin, Essence, State Warning Point, etc.) PRIORITIES OR LONGER TERM IMPROVEMENT OPPORTUNITIES 2.1 Model Standard: Identification and Surveillance of Health Threats Communication, Frequency of reporting, tobacco cessation, social media restrictions, education for the public (HIPPA-what to look for), Mental Health (emerging threats), Privacy vs Safety (HIPPA), Bioterrorism (no local team in county) more referrals, fb promotions, clarify policies on reporting, $ for updated equipment, need for local county team, more frequent hazmat drills more partnerships, more referrals, fb promotion, $ for specialized equipment and teams 2.2 Model Standard: Investigation and Response to Public Health Threats and Emergencies Developing written rules, maintaining written instructions/plans, practice, Incident Command Practice/Evaluate (communities come together), training, resources, new events (training historically developed from past occurrences) Need more review and/or follow up after incident none listed 2.3 Model Standard: Laboratory Support for Investigation of Health Threats credential labs, written closer local lab policies for handling samples public labs certified so state can use none listed ESSENTIAL SERVICE 3: Inform, Educate, and Empower People about Health Issues STRENGTHS WEAKNESSES OPPORTUNITIES FOR IMMEDIATE IMPROVEMENT/ PARTNERSHIPS 3.1 Model Standard: Health Education and Promotion Health Education: schools, community, churches, educating veterans. Classes: Smoking cessation, healthy cooking, Get well network for admissions to hospitals, Health promotion through CHIP partners, educating providers about disease outbreaks and prevention, community events: 5210 promotion, child abuse prevention, helping hands, world s greatest baby shower, backpacks, screenings, press the chest non mentioned none mentioned none mentioned PRIORITIES OR LONGER TERM IMPROVEMENT OPPORTUNITIES 25
116 3.2 Model Standard: Health Communication Healthy start, DOH, and DCF have communication plans, websites, brochures and educational materials. Social media used by agencies other than DOH. Epidemiology DOH has database of local providers for alerts, blast fax, media list, Incident Command, PIO talking points spelled out by Tallahassee for DOH, Healthy start has 1 hour to respond to media, DCF. Sheriff, County office and DOH have a PIO, DOH has a trained PIO, DCF has trained Administrators as PIO's Healthy Start has monthly PIO training meetings, Conference: Darkness to light by CAC, Drowning and Safe Sleep by DCF, Outcome based/theory based education, provide policy makers and public with analysis none listed non listed non listed Attachment C Page 26 of Model Standard: Risk Communication Incident Command: Ever bridge Serve Florida System, Updating emergency contacts, Voic messaging system, hand radios. Face to face meetings to discuss plans, texting, flipchart plan: emergencies, Ex. Active shooter plan, Reports to emergency management, established lines of authority, NIMS, Television/Media, Communications Committee, Phone emergency alerts, Safety Officers none listed sharing information about NIMS/Incident Command Structures, knowledge of situation reports to emergency management none listed ESSENTIAL SERVICE 4: Mobilize Community Partnerships to Identify and Solve Health Problems STRENGTHS WEAKNESSES OPPORTUNITIES FOR IMMEDIATE IMPROVEMENT/ PARTNERSHIPS 4.1 Model Standard: Constituency Development Getting info to community, reach Agency fair, county wide county wide engagement area engagement, 211 agency agencies, general population advertisement awareness of 211 (north end), south end awareness of WCHIP, address uniqueness in geographic areas, assumption community has electronic media access Zika Presentation, Immunization updates, WCHIP meetings, Coalition meetings (access), CAT, 211 system Directory, Provider Facebook page PRIORITIES OR LONGER TERM IMPROVEMENT OPPORTUNITIES getting information to community, electronic media accessible to community 26
117 4.2 Model Standard: Community Partnerships community involvement, broader distribution of transportation, gap between south wchip evaluations and north ends of the county WCHIP, BOCC, Animal Control, Healthy Start, COPE/DCF, Sacred Heart, Chamber of Commerce, Hospice, Mental, Jobs plus, Tricounty, Council on aging, Pancare, career source, law enforcement, 5210, surveys, re evaluations transportation, bridge north/south gap, media coverage ESSENTIAL SERVICE 5: Develop Policies and Plans that Support Individual and Community Health Efforts STRENGTHS WEAKNESSES OPPORTUNITIES FOR IMMEDIATE IMPROVEMENT/ PARTNERSHIPS PRIORITIES OR LONGER TERM IMPROVEMENT OPPORTUNITIES 5.1 Model Standard: Governmental Presence at the Local Level DCF, Birth Certificates, Death Certificates and nutrition, WIC, school health screenings, Healthy start, Tax collectors, Vital Statistics ID's, DCF has PSA's, Tax collectors has a TV channel or videos playing in waiting area, Healthy start does home visits, parenting classes, smoking cessation classes, breast feeding support, DOH extra hours and after hours clinics, statewide public health messages, taxpayers participation outside agencies, sharing information with the public, statutes accreditation boards, standards, audits, monitor to make sure meeting standards. Services: Ob, environmental immunizations dental safe water, healthy start, community health, staff availability none listed none listed none listed 5.2 Model Standard: Public Health Policy Development Tax collectors: updates of legislative changes, weekly meetings; DOH: Identify needs guidelines for dealing with hazards, School Health: reviewing policies every 3-5 years and updating policies; (DOH: Ex Tobacco policies) none listed none listed none listed 5.3 Model Standard: Community Health Improvement Process and Strategic Planning State plan and CHIP have some shared goals, DCF: Substance abuse/mental health efforts aligned none listed put state improvement plan and CHIP plan in alignment none listed 5.4 Model Standard: Plan for Public Health Emergencies coalition of community partners, emergency response plan revised every year, DCF: table tops, call downs, School: Fire Drills none listed none listed none listed Attachment C Page 27 of 31 27
118 ESSENTIAL SERVICE 6: Enforce Laws and Regulations that Protect Health and Ensure Safety STRENGTHS WEAKNESSES OPPORTUNITIES FOR IMMEDIATE IMPROVEMENT/ PRIORITIES OR LONGER PARTNERSHIPS TERM IMPROVEMENT OPPORTUNITIES 6.1 Model Standard: Review and Evaluation of Laws, Regulations, and Ordinances Keeping up with the laws EH has input into rules 7 reg with legislature look for new issues -get local collaboration, Communication (come county ordinances not passed along), laws aren't always current Better communication between providers with HIPPA issues. (what is required vs. what is actually provided), better interpretation of what services can be given (waivers), tap into using more social media news, own agency to keep up to date information none listed 6.2 Model Standard: Involvement in the Improvement of Laws, Regulations, and Ordinances not all organizations can participate none listed in changing laws use EH model to gain participation in legislature to change laws/regulations 6.3 Model Standard: Enforcement of Laws, Regulations, and Ordinances Organization staying within laws not all organizations know how to enforce laws, funding for more education has dropped, people overeducated via internet - often wrong information, time and man power none listed none listed ESSENTIAL SERVICE 7: Link People to Needed Personal Health Services and Assure the Provision of Health Care when Otherwise Unavailable STRENGTHS WEAKNESSES OPPORTUNITIES FOR IMMEDIATE IMPROVEMENT/ PARTNERSHIPS PRIORITIES OR LONGER TERM IMPROVEMENT OPPORTUNITIES 7.1 Model Standard: Identification of Personal Health Service Needs of Populations DOH, PanCare, Sacred Heart community health needs assessment tool, We Care surveys, BRFFS phone survey transportation, stigmatism, barriers to care, fear of health issues, providers accepting Medicaid for area, access surveys, funding (meeting needs advertising) Identify vulnerable population, go where target groups are, incentives process to identify barriers to personal healthcare 7.2 Model Standard: Assuring the Linkage of People to Personal Health Services Attachment C Page 28 of 31 navigators (ER diversions), WCHIP, Discharge planners, cope, 211 resource, DOH gives sheer with community resources, emergent care, insurance specialists gaps, no funding for referrals for abnormal results, follow up, tobacco referrals ensure services provided in correct location (example ER vs clinic) none ESSENTIAL SERVICE 8: Assure a Competent Public and Personal Health Care Workforce STRENGTHS WEAKNESSES OPPORTUNITIES FOR IMMEDIATE IMPROVEMENT/ PRIORITIES OR LONGER PARTNERSHIPS TERM IMPROVEMENT OPPORTUNITIES 8.1 Model Standard: Workforce Assessment, Planning, and Development none listed participation-laws require certain standards participation participation none listed none listed 8.2 Model Standard: Public Health Workforce Standards awareness of public health none listed none listed competencies, lack of qualified applicants and job location 8.3 Model Standard: Life-Long Learning through Continuing Education, Training, and Mentoring Quality of training provided (I.e. none listed none listed webinars, no hands on experience etc.) no incentive to continue education-no raise, but more 28
119 responsibilities, don't always relate training with 10 services Attachment C Page 29 of 31 none listed 8.4 Model Standard: Public Health Leadership Development Diverse leadership (weak on Incentives none listed recruitment), willingness to participate, create the atmosphere of collaboration, but not all leaders will come together ESSENTIAL SERVICE 9: Evaluate Effectiveness, Accessibility, and Quality of Personal and Population-Based Health Services STRENGTHS WEAKNESSES OPPORTUNITIES FOR IMMEDIATE IMPROVEMENT/ PARTNERSHIPS all ages/demographics, monthly review, DOH annual reviews (more often), County Health rankings, customer surveys, evaluating service delivery and adjusting accordingly PRIORITIES OR LONGER TERM IMPROVEMENT OPPORTUNITIES 9.1 Model Standard: Evaluation of Population-Based Health Services system abuse, SSI/Seniors benefits, look at internal process funding BRFFS, AHEC, LECOM,Pancare, CVHN, Physician portal, HEDIS/ FQHC, Patient advisory, Sacred Heart Council, Organizational survey's NACHO, local assessment process, WCHIP Involvement sufficient income for individuals to survive 9.2 Model Standard: Evaluation of Personal Health Services lack of providers for personal On line referral program for Quit healthcare, dental services, lack of Tobacco, Connectivity between connectivity between providers providers Providing input from users of services and possible future users, connectivity between providers 9.3 Model Standard: Evaluation of the Local Public Health System local partners participation, updated participants list, evaluate assumption everyone knows what relationships that comprise LPHS, everyone is doing, countywide Facebook page, ESF meetings, engagement survey why participants did not attend assessment evaluate relationships that comprise LPHS ESSENTIAL SERVICE 10: Research for New Insights and Innovative Solutions to Health Problems STRENGTHS WEAKNESSES OPPORTUNITIES FOR IMMEDIATE IMPROVEMENT/ PRIORITIES OR LONGER PARTNERSHIPS TERM IMPROVEMENT OPPORTUNITIES 10.1 Model Standard: Fostering Innovation School Health, Healthiest Weight/BMI class in high schools, diabetes A-1C, garden in a bucket, sacred heart get well project Sharing Best Practices none listed none listed 10.2 Model Standard: Linkage with Institutions of Higher Learning and/or Research best practices maternal fetal Sacred Heart, DOH LPN/Nurse Practitioners, DCT, Statewide program Smoking during pregnancy, Lecom Internship education only none listed none listed none listed 10.3 Model Standard: Capacity to Initiate or Participate in Research Clinical trials-dr Howell, Dr Chapman, Workforce training none listed none listed none listed 29
120 Attachment C Page 30 of 31 General APPENDIX C: Additional Resources Association of State and Territorial Health Officers (ASTHO) CDC/Office of State, Tribal, Local, and Territorial Support (OSTLTS) Guide to Clinical Preventive Services Guide to Community Preventive Services National Association of City and County Health Officers (NACCHO) National Association of Local Boards of Health (NALBOH) Being an Effective Local Board of Health Member: Your Role in the Local Public Health System Public Health 101 Curriculum for governing entities Accreditation ASTHO s Accreditation and Performance Improvement resources NACCHO Accreditation Preparation and Quality Improvement Public Health Accreditation Board Health Assessment and Planning (CHIP/ SHIP) Healthy People 2010 Toolkit: Communicating Health Goals and Objectives Setting Health Priorities and Establishing Health Objectives Healthy People 2020: MAP-IT: A Guide To Using Healthy People 2020 in Your Community Mobilizing for Action through Planning and Partnership: MAPP Clearinghouse MAPP 30
121 Framework Attachment C Page 31 of 31 National Public Health Performance Standards Program Performance Management /Quality Improvement American Society for Quality; Evaluation and Decision Making Tools: Multi-voting Improving Health in the Community: A Role for Performance Monitoring National Network of Public Health Institutes Public Health Performance Improvement Toolkit Public Health Foundation Performance Management and Quality Improvement Turning Point US Department of Health and Human Services Public Health System, Finance, and Quality Program Evaluation CDC Framework for Program Evaluation in Public Health Guide to Developing an Outcome Logic Model and Measurement Plan (United Way) National Resource for Evidence Based Programs and Practices W.K. Kellogg Foundation Evaluation Handbook W.K. Kellogg Foundation Logic Model Development Guide Development-Guide.aspx 31
122 Walton Community Health Improvement Partnership (WCHIP) Community Themes and Strengths Assessment Mobilizing for Action through Planning and Partnerships (MAPP) Attachment D Page 1 of 27 Vision: Prepared by the Florida Department of Health in Walton County November 2015 For more information, contact Jamie.Carmichael@flhealth.gov x 1266 WCHIP Community Themes and Strengths Page 1 of 25
123 Attachment D Page 2 of 27 TABLE OF CONTENTS INTRODUCTION 3 COMMUNITY SURVEY RESULTS.. 5 FOCUS GROUP DISCUSSION.. 11 COMMUNITY STRENGTHS AND WEAKNESSES.. 15 FINAL COMMENTS & NEXT STEPS. 15 APPENDICES Appendix A: Community Health Survey 16 Appendix B: Letter to Community Partners 23 WCHIP Community Themes and Strengths Page 2 of 25
124 Attachment D Page 3 of 27 Introduction June of 2015, the Walton County MAPP Executive Committee (WCHIP Steering Committee) embarked on a journey to develop a Community Health Assessment (CHA) using the Mobilizing for Action through Planning and Partnerships (MAPP) process. MAPP is a community driven strategic planning framework that assists communities in developing and implementing efforts around the prioritization of public health issues and the identification of resources to address them as defined by the Ten Essential Public Health Services. A community health needs assessment is a process that: Describes the state of health of the local population; Enables the identification of the major risk factors and causes of ill health; and Enables the identification of the actions needed to address these identified issues. The MAPP process includes four assessment tools, as shown in the graphic below. MAPP Model, Achieving Healthier Communities MAPP User s Handbook WCHIP Community Themes and Strengths Page 3 of 25
125 Within the MAPP process, there are four assessment tools. One of these assessment tools is the Community Themes and Strengths Assessment (CTSA). The purpose of the CTSA is to gain a better understanding of community perceptions about health and quality of life; to provide useful information for local programmatic and fiscal decision making; and to inform the development of a strategic community health improvement plan. Surveys and a focus group were used to gather insight into issues of concern, as well as local assets and resources related to health and quality of life. The report begins with an overall description of community members who participated in the assessment. A summary table of the identified themes is followed by sections highlighting the most frequent themes. The Community Themes and Strengths Assessment (CTSA) answers the questions: What is important to our community? How is quality of life perceived in our community? What assets do we have that can be used to improve community health? This assessment results in a stronger understanding of community issues and concerns, and perceptions about quality of life. In July and August of 2015, the Florida Department of Health in Walton County, WCHIP, and Sacred Heart Hospital jointly conducted a Community Health Assessment in Walton County. The survey was distributed to the general and vulnerable populations, and was made available in paper and online format. Recipients were encouraged to complete the survey and to forward to others. The survey focused on identifying respondent perceptions of the most important factors for a healthy community, most important health problems and risky behaviors in Walton County. CTSA Survey Results 253 community wide surveys were used for this assessment, along with 30 surveys from Health and Human Services organizations. Community health survey is included as Appendix A. Copy of the e mail and letter sent to community partners requesting participation in distributing the community surveys is also included as Appendix B. Demographic questions of the survey concentrated on age, ethnic group and race, educational level, gender, zip code of residence, number of people in household, household income level, and how respondents pay for health care. Attachment D Page 4 of 27 WCHIP Community Themes and Strengths Page 4 of 25
 o Health insurance (149) o Medicaid (40) o Medicare (23) o VA or Military (13) o Other (3) o Skipped question (5) WCHIP Community Themes and Strengths Page 5 of 25")
126 Attachment D Page 5 of 27 * Census Quick Facts What is your age? o (20) o (51) o (44) o (50) o (79) o 75+ (9) How do you pay for your healthcare? o Cash, i.e., no insurance (20) o Health insurance (149) o Medicaid (40) o Medicare (23) o VA or Military (13) o Other (3) o Skipped question (5) WCHIP Community Themes and Strengths Page 5 of 25

127 Attachment D Page 6 of 27 Community What do you think are the most important features of a "Healthy Community"? Good employment opportunities Access to health services( e.g. family doctor, hospitals) Quality hospitals and urgent / emergency services Low alcohol & drug abuse Quality education Family doctors and specialists Good place to raise children Healthy food options Social support services (such as Salvation Army, food Low tobacco use Low numbers of homeless Low percent of population that are obese 0.0% 5.0% 10.0% 15.0% 20.0% 25.0% 30.0% 11.5% 11.5% 9.9% 7.5% 6.7% 6.7% 6.3% 6.0% 3.2% 2.4% 2.0% 2.0% 23.0% 22.6% 20.6% 18.3% 17.9% 17.1% 16.7% 15.5% 15.5% 27.8% 27.4% Why is this important? Quality of Life (QOL) is a construct that connotes an overall sense of well-being when applied to an individual and a supportive environment when applied to a community (Moriarty, 1996). While some dimensions of Quality of Life can be quantified using indicators, research has shown QOL to be related to determinants of health and community wellbeing. Other valid dimensions of QOL include perceptions of community residents about aspects of their neighborhoods and communities that either enhance or diminish their quality of life. WCHIP Community Themes and Strengths Page 6 of 25

128 Attachment D Page 7 of 27 Community What do you think are the most important health issues in your County? Obesity / Excess weight Mental health problems Cancers Child abuse / neglect Diabetes Heart disease and stroke Aging problems (e.g. dementia, vision/hearing loss, Tobacco use Domestic violence Teenage pregnancy Motor vehicle crash injuries Dental problems Homelessness Rape / sexual assault Infectious diseases (e.g. hepatitis, TB, etc.) Respiratory / lung disease Sexually Transmitted Diseases (STDs) Accidental injuries (at work, home, school, farm) Infant death Suicide HIV / AIDS Fire arm related injuries Homicide 29.6% 24.9% 24.5% 22.9% 21.3% 20.2% 19.4% 17.4% 14.2% 10.3% 9.5% 9.1% 5.9% 5.5% 5.5% 4.7% 2.4% 2.0% 1.6% 1.2% 0.8% 39.9% Why is this important? This information leads to a portrait of the community as seen through the eyes of its residents. Perception about the health problems that exist in Walton County correlate with county-specific data and help to pinpoint specific concerns. WCHIP Community Themes and Strengths Page 7 of 25

129 Attachment D Page 8 of 27 Community Which of the following unhealthy behaviors in the County concern you the most? 0.0% 20.0% 40.0% 60.0% 80.0% Drug abuse 73.5% Alcohol abuse 41.5% Poor eating habits / poor nutrition Not seeing a doctor or dentist Excess weight Tobacco use Unprotected / unsafe sex Lack of exercise Homelessness Not using seat belts / child safety seats Not getting shots to prevent disease 32.0% 28.5% 25.3% 20.9% 20.2% 15.8% 14.6% 12.3% 9.5% Why is this important? High-risk behaviors, by definition, are lifestyle activities that place a person at increased risk of suffering a particular condition. Risky behaviors put you at risk for a bad consequence, i.e., smoking puts you at risk for cancer and being overweight puts you at risk for a heart attack. Systematic change using evidence-based interventions to change high-risk behaviors is recommended by the Independent Task Force on Community Preventive Services - WCHIP Community Themes and Strengths Page 8 of 25
 Dental care including dentures Mental Health services Primary medical care (a primary doctor/clinic) Alcohol or drug abuse treatment Do not know / None")
130 Attachment D Page 9 of 27 Community Which healthcare services are difficult to get in your County? Specialty medical care (specialist doctors) Dental care including dentures Mental Health services Primary medical care (a primary doctor/clinic) Alcohol or drug abuse treatment Do not know / None Services for the elderly Alternative therapies (acupuncture, herbals, etc.) Preventative healthcare (routine or wellness check Laboratory services Hospital care X Rays or mammograms Vision care (eye exams and glasses) Emergency medical care Physical Therapy / Rehabilitation Family Planning (including birth control) Prescriptions / Pharmacy services 24.9% 23.7% 23.3% 21.7% 19.0% 17.8% 14.2% 13.8% 13.0% 13.0% 12.6% 12.3% 9.9% 6.3% 4.0% 33.2% 32.0% WCHIP Community Themes and Strengths Page 9 of 25


131 Attachment D Page 10 of 27 Community In the past 12 months, did you delay getting needed medical care for any of the following reasons? No, I did not have a delay in getting care Could not get an appointment soon enough Could not afford Insurance problems or lack of insurance Provider was not taking new patients Could not get a weekend or evening appointment No, I did not need medical care Provider did not take your insurance Lack of transportation 2.0% 14.9% 14.9% 11.6% 10.8% 9.2% 24.1% 22.5% 42.6% Community When you or someone in your family is sick, where do you go for healthcare? 0.0% 10.0% 20.0% 30.0% 40.0% 50.0% 60.0% 70.0% My family doctor Hospital Emergency Room Urgent care clinic Health Department I usually go without care Any available doctor VA / Military facility Community health center 9.5% 7.5% 7.1% 4.0% 3.6% 2.8% 2.4% 63.2% WCHIP Community Themes and Strengths Page 10 of 25
132 CTSA Focus Group Discussion On November 17, 2015, the Walton County MAPP Executive Committee conducted a focus group discussion to explore perceptions of health and well being among Walton County residents. The focus group was conducted as part of a comprehensive community health assessment process that utilized the Mobilizing for Action through Planning and Partnerships (MAPP) framework as a guide. The focus group served to meet the intent of the Community Themes and Strengths Assessment (CTSA) from a partnership s perspective. The focus group lasted approximately 55 minutes and covered seven questions: 1. Are you satisfied with the quality of life in our community? 2. Is this community a good place to raise children and grow older? 3. What do you believe are the 2 3 most important characteristics of a healthy community? 4. Do all individuals and groups have the opportunity to contribute to and participate in the community s quality of life? 5. What do you believe is keeping our community from doing what needs to be done to improve health and quality of life? 6. What do you believe are the 2 3 most important issues that must be addressed to improve the health and quality of life in our community? 7. What makes you most proud of our community? The narrative summary for questions one, three, and six are combined due to similarity in responses across the three questions. Questions #1, #3, and #6: Are you satisfied with the quality of life in Walton County? What do you believe are the 2 3 most important characteristics of a healthy community? What do you believe are the 2 3 most important issues that must be addressed to improve the health and quality of life in our community? The focus group participants stated that they were not happy with the quality of life in Walton County. The poverty level is very concerning and does not seem to improve despite recent business developments that have brought jobs to the area. They are concerned about the availability of affordable housing for low income families and rental properties in general. The schools are overcrowded. There is a high number of single parent (mothers) families in the community. Medicaid providers have declined in the community as a result of the Medicaid program transitioning into managed care. Dental providers that accept Medicaid for children cannot meet the needs of the community. Participants agreed that the community s infrastructure is the backbone to providing a healthy community. Schools and educational opportunities are also imperative for a healthy community to be able to afford its residents the opportunities to have careers and thrive able wage incomes. Job opportunities are necessary for a healthy community and we are seeing some come as a result of the new growth. But many new job positions may be filled from Attachment D Page 11 of 27 WCHIP Community Themes and Strengths Page 11 of 25
133 outlying counties because our residents do not have the necessary education, technical training, or job skills. In order to have a healthy community, you need to have adequate access to healthcare. Walton County is considered a medically underserved county. Specialists are in short supply within the county and most are located outside of the county necessitating considerable amount of travel. In addition to location of the care, there is a shortage of providers accepting the medical insurance, Medicare, or Medicaid health plan that the residents have coverage with. Also mentioned was the need for a safe transportation system so that the residents can have access to all services available to them within the county. With a good transportation system, more of the county residents would feel empowered by having the ability to participate in community events and get to where they need to by using a reliable method. By addressing jobs, wages, and transportation the focus group participants felt we could improve the community s health and quality of life. Having a job helps eliminate stressors affecting mental health, and allows families to interact more socially. Improved wages also relieves some stressors and stimulates involvement within the community. It also affords residents opportunities to obtain insurance and utilize preventive health services. An affordable transit authority would benefit all citizens regardless of age or income. Affordable transportation would increase residents ability to access medical care, employment, education/job training, and even grocery shopping/access to healthy foods. Question #2: Is this community a good place to raise children and grow older? Participants indicated that they enjoy living in Walton County due to the atmosphere and its residents. Walton County has a low crime rate. There are a lot of churches and faith based organizations. There is a good sense of community and it is quiet. It is a great place to live if you have money. However, there is an issue with transportation. And if you can get a job, it is low paying causing stress to build up within the family and children suffer. Question #4: Do all individuals and groups have the opportunity to contribute to and participate in the community s quality of life? Groups provide too many services and government is part of the problem. There are too many free services. The culture of the population may keep people from asking for help. Educate low income population to manage their budgets. Budget management is not being taught in the schools. Question #5: What do you believe is keeping our community from doing what needs to be done to improve health and quality of life? Our community does step up when a need is identified. The lack of transportation deters residents from being as involved as they may would like. Residents have little input in increasing the availability of affordable housing. There is a lack of availability and participation in programs that residents can become invested in to improve their situation, i.e. Habitat for Attachment D Page 12 of 27 WCHIP Community Themes and Strengths Page 12 of 25
134 Humanity. We are ineffective in bridging the gap between cultures due to language barriers. Wages from jobs that are available fail to have what is referred to as a thrive able wage. Question #7: What makes you most proud of our community? The focus group participants agreed that the community steps up. Walton County is a working community and always looks out for the wellbeing of the residents within it. Data Analysis The following procedure was utilized for data analysis: Review the notes from the focus group; Code and categorize the responses for each question to identify themes; Summarize findings for each question; and Identify any patterns or connections between the questions. RESULTS This section provides a narrative summary of themes based upon the focus group discussion. The results are reported by question. Participants did not use one word answers to describe health and quality of life in Walton County. Participants discussed several areas where they felt change was needed. Similar issues were mentioned when participants were asked to focus on the most important issues affecting health and quality of life in Walton County. These recurring issues were themed and divided into two main categories, socioeconomic issues and health related issues. Table 1 summarizes the themes that emerged within each category. A narrative description of each category and its associated themes follows. Table 1: Summary of Themes Attachment D Page 13 of 27 Socioeconomic Issues Poverty Education Employment Transportation Health Related Issues Access to Care Cultural Diversity WCHIP Community Themes and Strengths Page 13 of 25
135 The SOCIOECONOMIC CATEGORY includes issues related to poverty, affordable housing, education, employment, and transportation. The focus group indicated that socioeconomic issues are more prevalent in the northern part of the county. Key issues related to the theme of POVERTY included: o A cycle of poverty exists among families in Walton County o More assistance is needed with affordable housing and health care; especially for working poor. Concerned with housing shortage o Residents need to empower themselves o The cycle of hopelessness if it is not broken it will continue o Increase in single mothers Key issues related to the theme of EDUCATION included: o Schools are overcrowded o Educate low income population on budget management children are not being taught budget management in schools o Need more opportunities for residents to become educated for jobs available in Walton County resulting from growth, i.e. vocational and technical. Key issues related to the theme of EMPLOYMENT included: o Quality of life is strongly related to quality of jobs within the county o There is a connection between education and employment; residents are currently limited by lack of education to be qualified for new jobs coming into area due to growth o The majority of the jobs in the county are of minimal scale and minimal pay If you can get a job, it is low paying causing stress to build up in family and children suffer o Residents seek better paying opportunities outside the county o Youth lack a strong work ethic Key issues related to the theme of TRANSPORTATION included: o Many residents do not have a vehicle, or their vehicle is unreliable o Public transportation is very limited and there is a lack of transportation for the disabled o Northern part of the county seeks services across state lines because it is closer to travel and they have no other option Common issues mentioned by the focus group in the HEALTH CATEGORY included access to care and cultural diversity (language barriers). Attachment D Page 14 of 27 Key issues related to the theme of ACCESS TO CARE included: o Lack of Medicaid providers for medical and dental services, forcing residents to go out of county for services or do without o The new dental school is not providing low cost pricing for services o Residents required to drive more than 20 miles for medical help o Many residents lack health care insurance o Walton County lacks specialty doctors WCHIP Community Themes and Strengths Page 14 of 25
136 o It is hard to recruit physicians to practice in a rural county o Community does not use the rural clinics available to them o Lack of providers accepting the Medicare Advantage plans o Residents required to drive more than 20 miles to see a provider who accepts their insurance plan Key issues related to the theme of CULTURAL DIVERSITY included: o More and more residents need interpreters when seeking healthcare services o Providers need to know how to treat residents from other ethnicities o The culture of the population may keep people from asking for help o Anticipated growth will lead to changes in health indicators driven by cultural differences COMMUNITY STRENGTHS AND WEAKNESSES (OPPORTUNITIES FOR IMPROVEMENT) created from community surveys, health and human service organization surveys, and focus group discussion: Table 2: Community Strengths and Weaknesses Attachment D Page 15 of 27 What are the greatest strengths of Walton County? (Strengths) What are some of our community weaknesses? (Opportunities for Improvement) Resources Transportation Volunteers/Mentoring Quick growth/infrastructure Faith Based Organizations Jobs with thrive able wage Safety Substance abuse Good mixture of income levels Lack healthcare providers location Future growth Lack of insurance coverage Collaboration Housing affordable/rentals Low pollution Lack of specialty physicians Technical training in high schools Lack of empowerment programs Future technical skilled jobs Communication within the community Boys & Girls Club Health Issues: *Obesity/Excess Weight, Mental Environment/Location/Weather health problems, Cancers, Child Abuse/Neglect, County Finances Heart disease and stroke Recreational facilities Health Behaviors: Drug abuse, Alcohol abuse, poor Good Healthcare providers eating habits/poor nutrition, not seeing a doctor or dentist, excess weight *Top choices from both the community and health/human service organization surveys FINAL COMMENTS & NEXT STEPS The information gathered from the focus group was compiled for consideration along with the other assessments being conducted as part of the overall community health assessment project. Connections between recipients perceptions of health and wellbeing will be cross referenced with health status indicator data in an effort to identify similar themes that may inform the development of the community health improvement plan. WCHIP Community Themes and Strengths Page 15 of 25
137 Community Health Survey Walton County APPENDIX A Attachment D Page 16 of 27 The purpose of the following survey is to get your opinions about community health issues in Walton County. The Florida Department of Health offices in Walton Counties will use the results of this survey to identify health priorities for community action. This survey will take about 5 10 minutes to complete. Your opinion is important. This survey is valid through August 28, 2015, so please respond by that date to have your opinions counted. Thank you for taking the time to provide it. If you have any questions, please contact Laura.Brazell@flhealth.gov 1. What do you think are the most important features of a Healthy Community? (Those factors that would most improve the quality of life in this community.) Check only THREE (3). Good race relations Low numbers of sexually transmitted disease (STDs) Good schools Low crime / safe neighborhoods Low tobacco use Low percent of population that are obese Religious or spiritual values Family doctors and specialists Low numbers of homeless Affordable housing Access to health services( e.g. family doctor, hospitals) Quality education Social support services (such as Salvation Army, food pantries, Catholic charities, Red Cross, etc.) Good transportation options Low alcohol & drug abuse Clean environment (clean water, air, etc.) Arts and cultural events Healthy food options Good employment opportunities Active lifestyles / outdoor activities Good place to raise children Mental health services Quality hospitals and urgent / emergency services Page 16 of 25 Page 1
138 Community Health Survey - Walton County VP 2. What do you think are the most important health issues in your County? (Those problems that have the greatest impact on overall community health.) Check only THREE (3). Attachment D Page 17 of 27 Heart disease and stroke Homelessness Obesity / Excess weight Teenage pregnancy HIV / AIDS Infectious diseases (e.g. hepatitis, TB, etc.) Mental health problems Dental problems Rape / sexual assault Child abuse / neglect Motor vehicle crash injuries Homicide Tobacco use Domestic violence Diabetes Infant death Cancers Accidental injuries (at work, home, school, farm) Sexually Transmitted Diseases (STDs) Aging problems (e.g. dementia, vision/hearing loss, loss of mobility) Fire arm related injuries Respiratory / lung disease Suicide 3. Which of the following unhealthy behaviors in the County concern you the most? (Those behaviors that have the greatest impact on overall community health.) Check only THREE (3). Drug abuse Not getting shots to prevent disease Poor eating habits / poor nutrition Excess weight Lack of exercise Alcohol abuse Homelessness Unprotected / unsafe sex Not seeing a doctor or dentist Not using seat belts / child safety seats Tobacco use 4. Overall, how would you rate the health of people who live in your County? Very Healthy Healthy Somewhat Healthy Unhealthy Very Unhealthy Page 17 of 25 Page 2
139 Community Health Survey - Walton County VP 5. Have you ever been told by a health professional that you have any of the following: (Check all that apply) Attachment D Page 18 of 27 High cholesterol High blood pressure Heart disease HIV / AIDS Mental health problem Alcohol or drug addiction Chronic Obstructive Pulmonary Disease (COPD) Diabetes Obesity Tuberculosis (TB) Depression Dementia / Alzheimer s disease Asthma None of the above 6. What is the primary source of your health care insurance coverage? Insurance from an employer or union Medicaid (such as Medipass, Medicaid HMO) Insurance that you pay for yourself (including "Obamacare" plans) Indian or Tribal Health Services Medicare TRICARE, military or VA benefits Other I do not have any health insurance 7. How long has it been since your last dental exam or cleaning? Within past 12 1 to 2 years ago 2 to 5 years ago 5 or more years ago Do not know / Not months sure 8. How long has it been since your last visit to a doctor for a wellness exam or routine check up? (Does not include an exam for a specific injury, illness or condition) Within past 12 1 to 2 years ago 2 to 5 years ago 5 or more years ago Do not know / Not months sure 9. When a doctor prescribes medicine for you or a family member, what do you do? Use leftover medicine already at home Use someone else s medicine Fill the prescription at a pharmacy Go without medicine Use herbal or natural therapies instead Buy an over the counter medicine Page 18 of 25 Page 3
140 Community Health Survey - Walton County VP 10. Which healthcare services are difficult to get in your County? Check all answers that apply. Attachment D Page 19 of 27 Alternative therapies (acupuncture, herbals, etc.) Prescriptions / Pharmacy services Dental care including dentures Primary medical care (a primary doctor/clinic) Emergency medical care Services for the elderly Family Planning (including birth control) Specialty medical care (specialist doctors) Hospital care Alcohol or drug abuse treatment Laboratory services Vision care (eye exams and glasses) Mental Health services X Rays or mammograms Physical Therapy / Rehabilitation Do not know / None Preventative healthcare (routine or wellness check ups, etc.) 11. In the past 12 months, did you delay getting needed medical care for any of the following reasons? Check all answers that apply. No, I did not have a delay in getting care Could not afford Could not get an appointment soon enough Insurance problems or lack of insurance No, I did not need medical care Could not get a weekend or evening appointment Provider did not take your insurance Language barriers or could not communicate Lack of transportation Provider was not taking new patients 12. When you or someone in your family is sick, where do you go for healthcare? Hospital Emergency Room Community health center My family doctor Free clinic Any available doctor VA / Military facility Urgent care clinic I usually go without care Health Department Page 19 of 25 Page 4
141 Community Health Survey - Walton County VP 13. If you felt that you or someone in your family needed mental health services, where would you go for care? Attachment D Page 20 of 27 Hospital Emergency Room in Walton County Mental health clinic in another County I do not know where to go for mental health care Mental health clinic in Walton County Hospital Emergency Room in another County VA / Military facility My family doctor Private psychologist, psychiatrist or other mental health professional 14. Overall, how would you rate the quality of healthcare services available in your County? Excellent Very Good Good Fair Poor Not sure / do not know 15. Do you currently use any tobacco products? Yes, I currently smoke cigarettes or cigars No, I quit 12 months ago or less Yes, I currently use chewing tobacco, snuff or snus No, I quit 1 or more years ago Yes I currently use e cigarettes No, I have never used tobacco products 16. How would you rate your own health today? Very Healthy Healthy Somewhat Healthy Unhealthy Very Unhealthy 17. Please indicate how strongly you agree or disagree with the following statement as it applies to you personally: I am confident that I can make and maintain lifestyle changes, like eating right, exercising, or not smoking. Strongly Agree Agree Disagreee Strongly Disagree Page 20 of 25 Page 5
142 Community Health Survey - Walton County VP 18. What are the top three (3) reasons that prevent you from eating healthier foods and being active? Check only three. Attachment D Page 21 of 27 I already eat healthy and am active Do not know how much more active I need to be I am happy the way I am Cannot afford exercise equipment / gym membership It is too expensive to cook / eat healthy foods Do not have time to be more active Fear of failure It is not safe to exercise in my neighborhood Do not have time to cook or shop for healthy foods Healthier food is not available in my neighborhood Do not want to change what I eat Do not want to be more active Tried before and failed to change Do not know how to change my diet 19. What is the zip code where you live? 20. Are you male or female? Male Female 21. What is your race? Black/African American, non Hispanic Asian Black/African American, Hispanic American Indian / Alaska Native White/Caucasian, non Hispanic Pacific Islander White/Caucasian, Hispanic Bi racial or multiple races 22. What is your age? Less than Page 21 of 25 Page 6
143 Community Health Survey - Walton County VP 23. What is the highest level of school you have completed or highest degree you have received? Attachment D Page 22 of 27 Grades 1 through 8 Some college Some high school (grades 9 through 11) 2 year college degree High school diploma / GED 4 year college degree Vocational/Tech School Graduate or professional degree 24. What is your current employment status? Disabled / unable to work Seasonal worker Employed full time Student Employed part time Self employed Homemaker Unemployed Retired 25. What is your annual family income? Less than $15,000/year $50,001 $75,000/year $15,001 $25,000/year $75,001 $100,000/year $25,001 $35,000/year $100,001 or more/year $35,001 $50,000/year 26. Where did you take this survey? Church WIC Health Clinic Health Fair Health Department COPE Center Other (please specify) Thank you for taking this survey. Page 22 of 25 Page 7
144 APPENDIX B Attachment D Page 23 of 27 Page 23 of 25

145 Page 24 of 25 Attachment D Page 24 of 27
146 Page 25 of 25 Attachment D Page 25 of 27
147 Attachment D Page 26 of 27
148 Attachment D Page 27 of 27

149 Walton Community Health Improvement Partnership (WCHIP) Attachment E Page 1 of 21 Community Health Status Assessment Mobilizing for Action through Planning and Partnerships (MAPP) Vision: Prepared by the Florida Department of Health in Walton County March 2016 For more information, contact Jamie.Carmichael@flhealth.gov x 1266 Walton_CHSA_2016 Page 1 of 21
150 TABLE OF CONTENTS Attachment E Page 2 of 21 INTRODUCTION 3 COMMUNITY HEALTH STATUS ASSESSMENT.. 4 HEALTH STATUS INDICATORS... 4 FRAMEWORK FOR ANALYSIS.. 4 SUMMARY OF FINDINGS PRIORITY SETTING PROCESS 7 TOP PRIORITY ISSUES.. 7 NEXT STEPS. 7 ATTACHMENTS Attachment A: Top 50 Health Issues 8 Attachment B: Participant Sign In 9 10 Attachment C: Power point presentation Attachment D: Voting results 21 Walton_CHSA_2016 Page 2 of 21
151 Introduction Attachment E Page 3 of 21 June of 2015, the Walton County MAPP Executive Committee (WCHIP Steering Committee) embarked on a journey to develop a Community Health Assessment (CHA) using the Mobilizing for Action through Planning and Partnerships (MAPP) process. MAPP is a community-driven strategic planning framework that assists communities in developing and implementing efforts around the prioritization of public health issues and the identification of resources to address them as defined by the Ten Essential Public Health Services. A community health needs assessment is a process that: Describes the state of health of the local population; Enables the identification of the major risk factors and causes of ill health; and Enables the identification of the actions needed to address these identified issues. The MAPP process includes four assessment tools, as shown in the graphic below. MAPP Model, Achieving Healthier Communities MAPP User s Handbook Within the MAPP process, there are four assessment tools. One of these assessment tools is the Community Health Status Assessment (CHSA). The CHSA provides quantitative information on community health conditions and answers the questions How healthy is the community? and What does the health status of the community look like? Walton_CHSA_2016 Page 3 of 21
152 Community Health Status Assessment Attachment E Page 4 of 21 Health Status Indicators A review of health status assessments from the following organizations: Healthy People 2020, Community Commons, Florida Charts County Health Profile, University of Wisconsin and Robert Wood Johnson s County Health Rankings, and previous assessments revealed a cross section of many common indicators. From this cross section, state and county data for 140 health status indicators and 30 demographic indicators were collected. Between July and October 2015, WCHIP analyzed these health status indicators using County Health Ranking s model of population health as a framework. This model, depicted below, emphasizes that many factors, when addressed, can improve the overall health of a community. Framework for Analysis To identify the issues that hold the greatest priority for the community, the indicator results were evaluated within the framework of the County Health Rankings Model created by the University of Wisconsin Population Health and the Robert Wood Johnson Foundation. The framework emphasizes factors that, when improved, can help improve the overall health of a community. This model is comprised of three major components: Health Outcomes - This component evaluates the health of a community as measured by two types of outcomes: how long people live (Mortality / Length of Life) and how healthy people are when they are alive (Morbidity / Quality of Life). Health Factors - Factors that influence the health of a community including the activities and behavior of individuals (Health Behaviors), availability of and quality of health care services (Clinical Care), the socio-economic environment that people live and work in (Social and Economic Factors) and the attributes and physical conditions in which we live (Physical Environment). Although an individual s biology and genetics play a role in determining health, the community cannot influence or modify these conditions and therefore these factors are not included in the model. These factors are built from the concept of Social Determinants of Health (see inset). Programs and Policies - Policies and programs at the local, state and federal level have the potential to impact the health of a population as a whole (i.e. smoke free policies or laws mandating childhood immunization). As illustrated, Health Outcomes are improved when Policies & Programs are in place to improve Health Factors. Data sources included: Florida Charts, Florida Department of Health, Agency for Health Care Administration, County Health Rankings and Roadmaps, Florida Department of Children and Families, US Department of Health & Human Services, Feeding America, USDA Economic Research Service, Florida Department of Law Enforcement, US Census Bureau, Federal Bureau of Labor and Statistics, and US Department of Housing and Urban Development. Over the course of the four months, small committee meetings were held to review and assess the data. In these small committee meetings, over 140 health indicators for Walton County were compared and contrasted to those for the state and surrounding counties. In addition, the committee members also compared local data to previous years data from Walton County, highlighting improvements and statistical trends. Walton_CHSA_2016 Page 4 of 21

153 Attachment E Page 5 of 21 Summary of Findings Of those approximately 140 health status indicators, the following 95 indicators performed worse than the State for Walton County. Health Outcomes Mortality Length of Life Morbidity Quality of Life Alcohol-Related Motor Vehicle Traffic Crash Deaths Cancer Deaths Chronic Liver Disease, Cirrhosis Deaths Chronic Lower Respiratory Disease Deaths Colon, Rectal or Anus Cancer Deaths Deaths from Smoking-related Cancers Diabetes Deaths Heart Disease Deaths Average number of days where poor mental or physical health interfered with activities of daily living in the past 30 days Cervical Cancer Incidence Chicken Pox Heart Disease (Adult) High Cholesterol (Adult) Infant Mortality Injury Deaths Lung Cancer Deaths Motor Vehicle Accident Deaths Neonatal Deaths (0-27 Days) Nephritis, Nephritic Syndrome, and Nephrosis Deaths Post Neonatal Deaths ( Days) Premature Death Prostate Cancer Deaths Suicide Deaths Lung Cancer Incidence Meningitis, Other Bacterial, Cryptococcal, or Mycotic Salmonellosis Tuberculosis Vaccine Preventable Disease for All Ages Whooping Cough (Pertussis) Walton_CHSA_2016 Page 5 of 21
154 Health Factors Health Behaviors Clinical Care Socioeconomic Physical Environment Aggravated Assault Alcohol Consumption in Past 30 Days (Adolescents) Alcohol Consumption in Lifetime (Adolescents) Alcohol-Related Motor Vehicle Traffic Crashes Binge Drinking (Adolescents) Births to Mothers Ages Births to Mothers Ages Births to Mothers Ages Births to Obese Mother (Rate) Blacking Out from Drinking Alcohol (Adolescents) Breast feeding Initiation Cancer Screening: PSA in past 2 years (Men 50 and up) Cigarette Use (Adolescents) Acute Care Beds Adult Psychiatric Beds Adult substance abuse beds Cancer Screening Mammogram Cancer Screening Pap Test Child and Adolescent Psychiatric Beds Dental Care Access by Low Income Persons Dentists Diabetic Annual Foot Exam (Adults) Diabetic Semi-Annual A1C Testing (Adult) ED Visits - Avoidable Conditions - Dental ED Visits - Chronic Conditions - Angina ED Visits - Chronic Conditions - Congestive Heart Failure Children in Poverty (Based on Household) Food Access Low Low Income Population Air Quality Ozone Drinking Water Violations Diabetic monitoring Domestic Violence Offenses Exercise Opportunities Forcible Sex Offenses Fruits and Vegetables Consumption 5 Servings per Day Healthy Weight (Youth) Live Births Where Mother Smoked During Pregnancy Medicaid Birth Rate Middle and High School Students Who Are Overweight or Obese Never Smoked (Adult) Obesity (Adult) Secondhand Smoke Exposure (Youth) Sedentary Adults Smoked in Last 30 Days (Youth) Smokers (Adult) ED Visits - Chronic Conditions Diabetes ED Visits - Chronic Conditions Hypertension Family Practice Physicians Flu Vaccination in the Past Year (Adult) Flu Vaccination in the Past Year (Adult Age 65 and Older) Insurance Uninsured Adults Insurance Uninsured Children Internists Mental Health Providers OB/GYNs Pediatricians Physicians Pneumonia Vaccination (Adult) Prenatal Care Begun Late or No Prenatal Care Primary Care Access Rehabilitation Beds (per Population Poverty Rate Public Assistance Income Real Per Capita Income Unemployment Grocery Store Access Severe Housing Problems Attachment E Page 6 of 21 Walton_CHSA_2016 Page 6 of 21
155 Priority Setting Process Attachment E Page 7 of 21 On October 21, 2015, the Walton County MAPP Executive Committee formed a Data Committee to review the results of all of the data and Assessments that had been collected and developed to-date. At the conclusion of the Data Committee s meetings, they had compiled a list of 50 indicators that were of greatest concern (where Walton County performed the worst compared to the State and to prior year results). Using this list of indicators (Attachment A) and the County Health Ranking s model of population health depicted on page 5 as a framework, the Committee identified the top five (5) priority health issues facing Walton County. The top health issues identified were: Provider Availability and Access Preventive Care Healthy Weight Tobacco Use Substance Abuse and Mental Health On November 17, 2015, WCHIP held a community meeting to identify the top priority health issues for the County. The results of the MAPP Assessments were presented to the 26 participants representing health and human service providers in the community (Attachment B). Sacred Heart Hospital shared a presentation (Attachment C) on County Health Ranking s model, community health surveys, and the top health issues compiled by the Data Committee. In reviewing the identified top five health issues, the participants were asked to consider three criteria for prioritizing the top issues: Severity/Magnitude (of the health issue) Feasibility to Address (availability of resources, community will) Potential Impact (on community health status) After reviewing the results of the MAPP Assessments and taking into consideration these prioritization criteria, participants used a hybrid multi-voting/nominal group technique to identify the top health issues facing Walton County (Attachment D). Top Priority Health Issues for Walton County The top priority health issues identified were: Substance Abuse and Mental Health Healthy Weight Provider Availability and Access Next Steps The next step in the Walton County CHNA process will be the development of a community health improvement plan with specific goals, tactics, and evaluation metrics. Activities include: Organizing work groups to develop comprehensive action plans to address each priority Identifying successful health improvement initiatives to serve as best practices Establishing metrics for performance, including measurable outcome indicators Continuing to communicate progress and results to the Walton County community Walton_CHSA_2016 Page 7 of 21
156 Attachment A Attachment E Page 8 of 21 Indicator FLORIDA Period 1 (Most Current) WALTON Period 1 (Most Current) Desired direction Walton Compared to the State Walton Progress (Period 1 Period 2 vs. Period 2) ISSUE AREA # 1 Preventive Care ISSUE AREA # 2 Tobacco Use ISSUE AREA # 3 Substance Abuse and Mental Health ISSUE AREA # 4 Healthy Weight ISSUE AREA # 5 Provider Availability and Access 1 Infant Mortality (0.9) 9.70 x x 2 Breast Cancer Deaths x 3 Prostate Cancer Deaths (1.0) x 4 Lung Cancer Deaths x 5 Deaths from Smoking related Cancers (8.1) x 6 Diabetes Deaths (7.8) x 7 Heart Disease Deaths (2.0) 183 x x 8 Chronic Lower Respiratory Disease Deaths (0.6) x 9 Injury Deaths x 10 Smokers (Adult) (1.1) x 11 Smoked in last 30 days (Adolescents) (5.60) x 12 Live Births w Mother Smoking During Pregnancy (1.4) x 13 Never Smoked (Adult) x 14 Secondhand Smoke exposure (Children) (11.9) x 15 Cigarette Use (Adolescents) (1.4) x 16 Alcohol Consumption in past 30 days (5.1) x 17 Alcohol Consumption in Lifetime (Adolescents) (1.7) x 18 Binge Drinking (Adolescents) (4.3) x 19 Sedentary Adults x 20 Grocery Store Access x 21 Fruits and Vegetables Consumption 5 servings (11.2) x 22 Primary Care Access x x 23 Cancer Screening Sigmoidoscopy or (4.5) x 24 HIV Testing (Adult age 65 and over) (11.8) x 25 Flu Vaccination in the Past Year (Adult age (18.6) x 26 Flu Vaccination in the Past Year (Adult) (10.5) x 27 Pneumonia Vaccination (Adult age 65 and over) (3.3) x 28 Pneumonia Vaccination (Adult) (0.2) x 29 ED Visits Chronic Conditions Angina (0.13) 0.84 x 30 ED Visits Chronic Conditions Diabetes (0.29) 5.57 x x 31 Dentists (per population) x 32 Acute Care Beds (per population) (4.0) 190 x 33 OB/GYN (per population) (0.70) 6.60 x 34 Family Practice Physicians (per population) x 35 Internists (per population) x 36 Pediatricians (per population) x 37 Physicians (per population) x 38 Births to Mothers Ages (Resident) Live births where mother smoked during (1.2) x 40 Medicaid birth rate (3.6) x 41 Domestic Violence Offenses (39) 795 x 42 Forcible Sex Offenses x 43 Violent Crime x 44 Meningitis, Other Bacterial, Cryptococcal, or x 45 Whooping Cough x 46 Vaccine Preventable Disease for All Ages x 47 Tuberculosis x 48 Chicken Pox x 49 Overweight (Youth) x 50 Obesity (Children and Adolescents) x Walton_CHSA_2016 Page 8 of 21
157 Attachment B Attachment E Page 9 of 21 Walton_CHSA_2016 Page 9 of 21
158 Walton_CHSA_2016 Page 10 of 21 Attachment E Page 10 of 21

159 Attachment C Attachment 4/4/2016 E Page 11 of 21 Walton_CHSA_2016 Page 11 of 21 1
160 Attachment 4/4/2016 E Page 12 of 21 Community Surveys Health and Human Services Organizations 30 Community Wide 253 (160 online, 93 paper) Respondents Walton Population* Female 86% 49% Black/African American 7.5% 5.9% White/Caucasian 90% 84.2% Bachelor's degree or higher 36.4% 24.1% Unemployed 4.8% 4.4% Income less than $35,001/year 45% Median Income $43,640 * Census Quick Facts Healthy Community? Health & Human Services Organizations Access to health services(e.g. family doctor, hospitals) Quality hospitals and urgent / emergency services Good employment opportunities Good schools Low alcohol & drug abuse Community Good employment opportunities Low crime / safe neighborhoods Access to health services( e.g. family doctor, hospitals) Good schools Walton_CHSA_2016 Page 12 of 21 2
161 Attachment 4/4/2016 E Page 13 of 21 Health Issues in Community? Health & Human Services Organizations Heart disease and stroke Mental health problems Cancers Obesity / Excess weight Aging problems (e.g. dementia, vision/hearing loss, loss of mobility) Diabetes Community Obesity / Excess weight Mental health problems Child abuse / neglect Cancers Heart disease and stroke Diabetes Most Concerning Behaviors? Health & Human Services Organizations Drug abuse Excess weight Poor eating habits / poor nutrition Not seeing a doctor or dentist Alcohol abuse Lack of exercise Tobacco use Community Drug abuse Alcohol abuse Poor eating habits / poor nutrition Not seeing a doctor or dentist Excess weight Tobacco use Walton_CHSA_2016 Page 13 of 21 3
162 Attachment 4/4/2016 E Page 14 of 21 Hard to Get Health Services? Health & Human Services Organizations Specialty medical care (specialist doctors) Primary medical care (a primary doctor/clinic) Alcohol or drug abuse treatment Mental Health services Services for the elderly Alternative therapies (acupuncture, herbals, etc.) Preventative healthcare (routine or wellness check ups, etc.) Community Specialty medical care (specialist doctors) Dental care including dentures Mental Health services Primary medical care (a primary doctor/clinic) Alcohol or drug abuse treatment Delayed Medical Care? General Population Did not have a delay in getting care Could not get an appointment soon enough Provider was not taking new patients Could not afford Vulnerable Population Did not have a delay in getting care Could not afford Insurance problems or lack of insurance Walton_CHSA_2016 Page 14 of 21 4
163 Attachment 4/4/2016 E Page 15 of 21 Where to go for Sick Care? General Population My family doctor Urgent care clinic Vulnerable Population My family doctor Hospital Emergency Room Health Department Where to go for Mental Health Services? General Population Private psychologist, psychiatrist or other mental health professional I do not know where to go for mental health care My family doctor Mental health clinic in Walton County Vulnerable Population I do not know where to go for mental health care My family doctor Mental health clinic in Walton County Walton_CHSA_2016 Page 15 of 21 5
164 Attachment 4/4/2016 E Page 16 of 21 Top Health Issues Provider Availability and Access Preventive Care Healthy Weight Tobacco Use Substance Abuse and Mental Health Health Ranking Model County Health Rankings Model 2014 UWPHI 50% - Mortality (Length of Life) 50% - Morbidity (Quality of Life) Health Outcomes 10% - Income 10% - Tobacco Use 40% - Social and Economic factors 10% - Employment 10% - Education 10% - Diet and Exercise 5% - Sexual Activity 5% - Alcohol and Drug Use 30% - Health Behaviors Health Factors 5% - Family and Social Support 10% - Physical Environment 5% - Community Safety 5% - Air and Water Quality 5% - Housing and Transit 10% - Quality of Care 10% - Access to Care 20% - Clinical Care Programs and Policies Walton_CHSA_2016 Page 16 of 21 6
165 Attachment 4/4/2016 E Page 17 of 21 Provider Availability and Access Morbidity and Mortality Clinical Care Premature Death Infant Mortality Cancer Deaths Prostate Cancer Deaths Lung Cancer Deaths Deaths from Smoking related Cancers Colon, Rectal or Anus Cancer Deaths Diabetes Deaths Heart Disease Deaths Neonatal Deaths (0 27 days) Post neonatal Deaths ( days) Chronic Liver Disease, Cirrhosis Deaths Chronic Lower Respiratory Disease Deaths Pneumonia, Influenza Deaths HIV/AIDS Deaths Breast Cancer Incidence High Blood Pressure (Adult) Dental Care Access by Low Income Persons Insurance Uninsured Adults and Children Primary Care Access Diabetic Annual Foot Exam (Adults) Cancer Screening in past two years PSA (Men age 50 & older) Cancer Screening Mammogram Cancer Screening Pap Test Cancer Screening Sigmoidoscopy or Colonoscopy ED Visits Dental ED Visits Angina ED Visits Congestive Heart Failure ED Visits Diabetes ED Visits Hyper Tension ED Visits Mental Health Mental health providers Dentists OB/GYN Family Practice Physicians Internists Pediatricians Physicians Acute Care Beds Adult psychiatric beds Adult substance abuse beds Child & Adolescent Psychiatric beds Rehabilitation beds Skilled nursing beds Salmonellosis Meningitis, Other Bacterial, Cryptococcal, or Mycotic Whooping Cough Vaccine Preventable Disease Tuberculosis Chicken Pox Population Receiving Medicaid Adults who have a personal doctor Preventative Care Morbidity and Mortality Clinical Care Premature Death Infant Mortality Cancer Deaths Prostate Cancer Deaths Colon, Rectal or Anus Cancer Deaths Diabetes Deaths Heart Disease Deaths Neonatal Deaths Post neonatal Deaths Breast Cancer Deaths Pneumonia, Influenza Deaths HIV/AIDS Deaths Diabetic monitoring Primary Care Access Diabetic Annual Foot Exam (Adults) Cancer Screening in past two years PSA (Men age 50 & older) Cancer Screening Mammogram Cancer Screening Pap Test Flu Vaccination in the Past Year (Adult age 65 and over) Flu Vaccination in the Past Year (Adult) Pneumonia Vaccination (Adult) Adults who have a personal doctor Cancer Screening Sigmoidoscopy or Colonoscopy Pneumonia Vaccination (Adult age 65 and over) Prenatal Care Begun in First Trimester Prenatal Care Begun Late or No Prenatal Care Walton_CHSA_2016 Page 17 of 21 7
166 Attachment 4/4/2016 E Page 18 of 21 Morbidity and Mortality Healthy Weight Health Behaviors Clinical Care Premature Death Cancer Deaths Colon, Rectal or Anus Cancer Deaths Diabetes Deaths Heart Disease Deaths Breast Cancer Incidence Diabetic monitoring High Blood Pressure (Adult) High Cholesterol (Adult) Heart Disease (Adult) Exercise opportunities Sedentary Adults Grocery Store Access Food Access Low Low Income Population Fruits and Vegetables Consumption 5 servings per day (Adult) Food Insecurity SNAP Participants Obesity (Adult) Middle and High School Students who are overweight or obese Healthy Weight (Youth) Breast feeding Initiation Diabetic Annual Foot Exam (Adults) ED Visits Congestive Heart Failure ED Visits Diabetes ED Visits Hyper Tension Births to Obese Mothers (rate) Morbidity and Mortality Premature Death Infant Mortality Cancer Deaths Lung Cancer Deaths Deaths from Smokingrelated Cancers Heart Disease Deaths Pneumonia, Influenza Deaths Breast Cancer Incidence Asthma (Adult) Chronic Lower Respiratory Disease Deaths Lung Cancer Incidence High Blood Pressure (Adult) Heart Disease (Adult) Tobacco Use Health Behaviors Smokers (Adult) Smoked in last 30 days (Adolescents) Live Births w Mother Smoking During Pregnancy Never Smoked (Adult) Secondhand Smoke exposure (Children) Cigarette Use Adolescents Tobacco Quit Attempt (Adult) Clinical Care ED Visits Chronic Conditions Congestive Heart Failure ED Visits Chronic Conditions Hyper Tension Live births where mother smoked during pregnancy Walton_CHSA_2016 Page 18 of 21 8
167 Attachment 4/4/2016 E Page 19 of 21 Substance Abuse and Mental Health Morbidity and Mortality Premature Death Infant Mortality Neonatal Deaths (0 27 days) Post neonatal Deaths ( days) Chronic Liver Disease, Cirrhosis Deaths Suicide Deaths Motor Vehicle Accident Deaths Injury Deaths Nephritis, Nephritic Syndrome, and Nephrosis Deaths Health Behaviors Alcohol related Motor Vehicle Traffic Crash Deaths Alcohol related Motor Vehicle Traffic Crashes Blacking out from drinking Alcohol (Adolescents) Alcohol Consumption in past 30 days (Adolescents) Alcohol Consumption in Lifetime (Adolescents) Binge Drinking (Adolescents) Clinical Care ED Visits Mental Health Adult psychiatric beds Adult substance abuse beds Child and Adolescent Psychiatric beds Mental health providers Average number of days where poor mental or physical health interfered with activities of daily living in the past 30 days Social Determinants Unemployment Median Household Income Real Per Capita Income Poverty Rate Children in poverty (based on household) Income Public Assistance Income Children in single parent households Households with No Motor Vehicle High school graduation (rate) Population > 25 without a high school diploma (rate) Drinking water violations Air Quality Ozone Severe housing problems Driving alone to work Domestic Violence Offenses Forcible Sex Offenses Aggravated Assault Violent Crime Walton_CHSA_2016 Page 19 of 21 9
168 Attachment 4/4/2016 E Page 20 of 21 Prioritization Top Health Issues Provider Availability and Access Preventive Care Healthy Weight Tobacco Use Substance Abuse and Mental Health Considerations MAPP Assessments Themes and Strengths Forces of Change Public Health System Community Health Status Severity/Magnitude Feasibility to Address: Resources / Community Will Potential Impact Walton_CHSA_2016 Page 20 of 21 10


169 Attachment D Attachment E Page 21 of 21 Walton_CHSA_2016 Page 21 of 21
EXECUTIVE SUMMARY... 2
 Y ou Y our F a mi l y Y our Ne i g h b o r h o o d Y our Communi t y Y ou Y our F a mi l y Y our Ne i g h b o r h o o d Y our Communi t y TABLE OF CONTENTS EXECUTIVE SUMMARY... 2 Community Health Needs
Community Health Needs Assessment
 Community Health Needs Assessment Bollinger County, Missouri This assessment will identify the health needs of the residents of Bollinger County, Missouri, and those needs will be prioritized and recommendations
Community Health Needs Assessment for Corning Hospital: Schuyler, NY and Steuben, NY:
 Community Health Needs Assessment for Corning Hospital: Schuyler, NY and Steuben, NY: November 2012 Approved February 20, 2013 One Guthrie Square Sayre, PA 18840 www.guthrie.org Page 1 of 18 Table of Contents
King County City Health Profile Seattle
 King County City Health Profile Seattle Shoreline Kenmore/LFP Bothell/Woodinville NW Seattle North Seattle Kirkland North Ballard Fremont/Greenlake NE Seattle Kirkland Redmond QA/Magnolia Capitol Hill/E.lake
Central Iowa Healthcare. Community Health Needs Assessment
 Central Iowa Healthcare Community Health Needs Assessment October 20, 2016 Table of Contents Executive Summary 1 Introduction 3 Summary Observations from Current CHNA 5 Information Sources and Data Collection
Implementation Plan Community Health Needs Assessment ADOPTED BY THE MARKET PARENT BOARD OF TRUSTEES, OCTOBER 2016
 2017 2019 Community Health Needs Assessment Implementation Plan ADOPTED BY THE MARKET PARENT BOARD OF TRUSTEES, OCTOBER 2016 MERCY HEALTH LOURDES HOSPITAL 1530 Lone Oak Rd., Paducah, KY 42003 A Catholic
2015 Community Health Needs Assessment Saint Joseph Hospital Denver, Colorado
 2015 Community Health Needs Assessment Saint Joseph Hospital Denver, Colorado December 11, 2015 [Type text] Page 1 Contributors Denver County Public Health Dr. Bill Burman, Director, and the team from
COMMUNITY HEALTH NEEDS ASSESSMENT HINDS, RANKIN, MADISON COUNTIES STATE OF MISSISSIPPI
 COMMUNITY HEALTH NEEDS ASSESSMENT HINDS, RANKIN, MADISON COUNTIES STATE OF MISSISSIPPI Sample CHNA. This document is intended to be used as a reference only. Some information and data has been altered
STEUBEN COUNTY HEALTH PROFILE
 STEUBEN COUNTY HEALTH PROFILE 2017 ABOUT THE REPORT The purpose of this report is to provide a summary of health data specific to Steuben County. Where possible, benchmarks have been given to compare county
2012 Community Health Needs Assessment
 Indiana University Health Goshen 2012 Community Health Needs Assessment A Report on Implementation Strategies to Address Community Health Needs Summary Report Our Commitment to You We are here for you,
2012 Community Health Needs Assessment
 2012 Community Health Needs Assessment University Hospitals (UH) long-standing commitment to the community spans more than 145 years. This commitment has grown and evolved through significant thought and
ONTARIO COUNTY HEALTH PROFILE. Finger Lakes Health Systems Agency, 2017
 ONTARIO COUNTY HEALTH PROFILE Finger Lakes Health Systems Agency, 2017 About the Report The purpose of this report is to provide a summary of health data specific to Ontario County. Where possible, benchmarks
Community Health Needs Assessment July 2015
 Community Health Needs Assessment July 2015 1 Executive Summary UNM Hospitals is committed to meeting the healthcare needs of our community. As a part of this commitment, UNM Hospitals has attended forums
Model Community Health Needs Assessment and Implementation Strategy Summaries
 The Catholic Health Association of the United States 1 Model Community Health Needs Assessment and Implementation Strategy Summaries These model summaries of a community health needs assessment and an
Methodist McKinney Hospital Community Health Needs Assessment Overview:
 Methodist McKinney Hospital Community Health Needs Assessment Overview: 2017-2019 October 26, 2016 Prepared by MHS Planning CHNA Requirement: Overview In order to maintain tax exempt status, the Affordable
STEUBEN COUNTY HEALTH PROFILE. Finger Lakes Health Systems Agency, 2017
 STEUBEN COUNTY HEALTH PROFILE Finger Lakes Health Systems Agency, 2017 About the Report The purpose of this report is to provide a summary of health data specific to Steuben County. Where possible, benchmarks
Community Health Needs Assessment Implementation Strategy Adopted by St. Vincent Charity Medical Center Board of Directors on April 5, 2017
 St. Vincent Charity Medical Center Community Health Needs Assessment Implementation Strategy Adopted by St. Vincent Charity Medical Center Board of Directors on April 5, 2017 Introduction In 2016, St.
MONROE COUNTY HEALTH PROFILE. Finger Lakes Health Systems Agency, 2017
 MONROE COUNTY HEALTH PROFILE Finger Lakes Health Systems Agency, 2017 About the Report The purpose of this report is to provide a summary of health data specific to Monroe County. Where possible, benchmarks
Southwest General Health Center
 Southwest General Health Center Community Health Needs Assessment Executive Summary July 2016 Southwest General Health Center CHNA Executive Summary Introduction Southwest General Health Center, a 358-bed
2007 Community Service Plan
 2007 Community Service Plan 169 Riverside Drive Binghamton, NY 607-798-5111 www.lourdes.com MESSAGE from the CEO Dear Friends, Providing community benefit is an important part of our Mission. It represents
BARNES-JEWISH HOSPITAL 2016 COMMUNITY HEALTH NEEDS ASSESSMENT & IMPLEMENTATION PLAN
 BARNES-JEWISH HOSPITAL 2016 COMMUNITY HEALTH NEEDS ASSESSMENT & IMPLEMENTATION PLAN 1 TABLE OF CONTENTS Executive Summary... 3 Community Description... 4 Geography... 4 Population Trends... 5 Income...
LIVINGSTON COUNTY HEALTH PROFILE. Finger Lakes Health Systems Agency, 2017
 LIVINGSTON COUNTY HEALTH PROFILE Finger Lakes Health Systems Agency, 2017 About the Report The purpose of this report is to provide a summary of health data specific to Livingston County. Where possible,
Community Health Needs Assessment Supplement
 2016 Community Health Needs Assessment Supplement June 30, 2016 Mission Statement, Core Values, and Guiding Social Teachings We, St. Francis Medical Center and Trinity Health, serve together in the spirit
DELAWARE FACTBOOK EXECUTIVE SUMMARY
 DELAWARE FACTBOOK EXECUTIVE SUMMARY DaimlerChrysler and the International Union, United Auto Workers (UAW) launched a Community Health Initiative in Delaware to encourage continued improvement in the state
Community Health Needs Assessment: St. John Owasso
 Community Health Needs Assessment: St. John Owasso IRC Section 501(r) requires healthcare organizations to assess the health needs of their communities and adopt implementation strategies to address identified
Community Health Implementation Plan Swedish Health Services First Hill and Cherry Hill Seattle Campus
 Community Health Implementation Plan 2016-2018 Swedish Health Services First Hill and Cherry Hill Seattle Campus Table of contents Community Health Implementation Plan 2016-2018 Executive summary... page
2015 DUPLIN COUNTY SOTCH REPORT
 2015 DUPLIN COUNTY SOTCH REPORT Reported March 2016 State of the County Health Report The State of the County Health Report provides a review of the current county health statistics and compares them to
St. Lawrence County Community Health Improvement Plan
 St. Lawrence County Community Health Improvement Plan November 1, 2013 Contents Executive Summary... 3 What are the health priorities facing St. Lawrence County?... 3 Prevent Chronic Disease... 3 Promote
2005 Community Service Plan
 2005 Community Service Plan 169 Riverside Drive Binghamton, NY 13905 (607) 798-5111 www.lourdes.com MESSAGE from the CEO Dear Friends, Providing community benefit is an important part of our Mission. It
Hendry County & Glades County, Florida. Hendry and Glades Rural Health Planning Council Strategic Plan
 The Health Planning Council of Southwest Florida Hendry and Glades Rural Health Planning Council Strategic Plan 2016-2019 Hendry County & Glades County, Florida Table of Contents Introduction......3 Methodology...
Implementation Strategy For the 2016 Community Health Needs Assessment North Texas Zone 2
 For the 2016 Community Health Needs Assessment North Texas Zone 2 Baylor Emergency Medical Center at Murphy Baylor Emergency Medical Center at Aubrey Baylor Emergency Medical Center at Colleyville Baylor
Community Health Needs Assessment 2013 Oakwood Heritage Hospital Implementation Strategy
 Community Health Needs Assessment 2013 Oakwood Heritage Hospital Implementation Strategy Community Health Needs Assessment 2013 Oakwood Healthcare CHNA Implementation Strategy Community Health Needs Assessment
Region 3 Parish Community Health Assessment Profile: Lafourche Parish
 Region 3 Parish Community Health Assessment Profile: Spring 2014 FOREWARD The Regional Meeting on Health Priorities was held in Houma, LA in November 2013, and was co-convened by the Department of Health
CHEMUNG COUNTY HEALTH PROFILE. Finger Lakes Health Systems Agency, 2017
 CHEMUNG COUNTY HEALTH PROFILE Finger Lakes Health Systems Agency, 2017 About the Report The purpose of this report is to provide a summary of health data specific to Chemung County. Where possible, benchmarks
Logan County Community Health Risk and Needs Assessment PLAN OF ACTION MARY RUTAN HOSPITAL
 Logan County Community Health Risk and Needs Assessment PLAN OF ACTION MARY RUTAN HOSPITAL The Board of Directors of Mary Rutan Hospital have reviewed the findings of the Logan County Community Health
Region 1 Parish Community Health Assessment Profile: St. Bernard Parish
 Region 1 Parish Community Health Assessment Profile: Spring 2014 FOREWORD The Regional Meeting on Health Priorities was held in Harvey, LA in November 2013, and was co-convened by the Department of Health
Community Health Needs Assessment. Implementation Plan FISCA L Y E AR
 Community Health Needs Assessment Implementation Plan FISCA L Y E AR 2 0 1 5-2 0 1 8 Table of Contents: I. Background 1 II. Areas of Priority 2 a. Preventive Care and Chronic Conditions b. Community Health
2012 Community Health Needs Assessment
 2012 Community Health Needs Assessment Table of Contents Executive Summary... 3 Overview of Key Findings.4 Conclusion...6 Introduction...7 1a. A Definition of the Community Served by the Hospital Facility...8
2016 Community Health Needs Assessment Implementation Plan
 2016 Community Health Needs Assessment Following the 2016 Community Health Needs Assessment, Saint Mary s Hospital developed an Implementation Strategy to illustrate the hospital s specific programs and
2009 Community Service Plan
 2009 Community Service Plan 169 Riverside Drive Binghamton, NY 607-798-5111 www.lourdes.com MESSAGE Overview from of the Programs CEO & Services Dear Friends, Providing community benefit is an important
Grande Ronde Hospital, Inc. Community Needs Health Assessment Implementation Strategy Fiscal Years
 Grande Ronde Hospital, Inc. Community Needs Health Assessment Implementation Strategy Fiscal Years 2016-2018 In 2015, Grande Ronde Hospital (GRH) completed a wide-ranging, regionally inclusive Community
Wake Forest Baptist Health Lexington Medical Center. CHNA Implementation Strategy
 Wake Forest Baptist Health Lexington Medical Center CHNA Implementation Strategy Background Wake Forest Baptist Health - Lexington Medical Center (LMC) is committed to understanding, anticipating, assessing,
1. What is your ethnic origin? (Check one) 2. What is your gender? 3. What is your age? Page 1. nmlkj. nmlkj. nmlkj. nmlkj. nmlkj. nmlkj. nmlkj.
 2. What is your gender? 3. What is your age? Page 1. nmlkj. nmlkj. nmlkj. nmlkj. nmlkj. nmlkj. nmlkj.") 1. What is your ethnic origin? (Check one) White Asian/Pacfic Island American Indian Black Hispanic 2. What is your gender? Female Male 3. What is your age? 18 to 24 55 to 64 25 to 34 65 to 74 35 to 44
1. What is your ethnic origin? (Check one) White Asian/Pacfic Island American Indian Black Hispanic 2. What is your gender? Female Male 3. What is your age? 18 to 24 55 to 64 25 to 34 65 to 74 35 to 44
Community Health Needs Assessment & Implementation Plan. July 1, 2013 June 30, 2016
 Community Health Needs Assessment & Implementation Plan July 1, 2013 June 30, 2016 For Period FY - July 1, 2013 June 30, 2016 Page 1 Introduction and Purpose The Patient Protection and Affordable Care
Community Health Needs Assessment 2016
 Community Health Needs Assessment 2016 OSF ST. FRANCIS HOSPITAL & MEDICAL GROUP DELTA COUNTY CHNA 2016 Delta County 2 TABLE OF CONTENTS Executive Summary... 3 Introduction... 5 Methods... 6 Chapter 1.
Community Health Needs Assessment and Implementation Strategy
 Community Health Needs Assessment and Implementation Strategy St. Luke s Lakeside Hospital October 29, 2013 The for the St. Luke s Lakeside Hospital were conducted and developed between April 22 and October
Community Health Needs Assessment April, 2018
 Community Health Needs Assessment April, 2018 The Centers, Inc. 2018 Community Health Needs Assessment Table of Contents Description of The Centers... 3 Annual Budget:... 4 Provided Services Include:...
Community Health Needs Assessment FY
 Community Health Needs Assessment FY 2017-19 Contents Introduction... 3 Forward... 3 Executive Summary... 3 Organization Description... 3 Community Served by the Hospital... 5 Defined Community... 5 Identification
December 23, To the community served by St. Charles Redmond:
 December 23, 2013 To the community served by : St. Charles Health System, along with all not-for-profit hospitals, has been mandated by the Federal Government, in accordance with The Patient Protection
METHODOLOGY FOR INDICATOR SELECTION AND EVALUATION
 CHAPTER VIII METHODOLOGY FOR INDICATOR SELECTION AND EVALUATION The Report Card is designed to present an accurate, broad assessment of women s health and the challenges that the country must meet to improve
Community Health Needs Assessment FY
 Community Health Needs Assessment FY 2017-19 Contents Introduction... 3 Forward... 3 Executive Summary... 3 Organization Description... 3 Community Served by the Hospital... 5 Defined Community... 5 Identification
COMMONWEALTH OF THE NORTHERN MARIANA ISLANDS WHO Country Cooperation Strategy
 COMMONWEALTH OF THE NORTHERN MARIA ISLANDS WHO Country Cooperation Strategy 2018 2022 OVERVIEW The Commonwealth of the Northern Mariana Islands is one of five inhabited United States island territories.
Community Service Plan
 Community Service Plan 2016-2018 The Mission of Oswego Hospital is to provide accessible, quality care and improve the health of residents in our community. Oswego Hospital An Affiliate of Oswego Health
Norton Hospital Norton Audubon Hospital Norton Women s and Children s Hospital Norton Brownsboro Hospital Norton Children s Hospital
 Norton Hospital Norton Audubon Hospital Norton Women s and Children s Hospital Norton Brownsboro Hospital Norton Children s Hospital Community Health Needs Assessment 2016 Community Health Needs Assessment
COMMUNITY HEALTH IMPLEMENTATION PLAN
 COMMUNITY HEALTH IMPLEMENTATION PLAN 2017 2017-2020 Table of Contents Letter from Jeff Feasel, President & CEO 1 About Halifax Health 3 Executive Summary 6 Halifax Health Community Health Plan 2017-2020
Community Health Plan. (Implementation Strategies)
") -2019 Community Health Plan (Implementation Strategies) May 15, Community Health Needs Assessment Process Florida Hospital at Connerton Long Term Acute Care Facility (LTAC or the Hospital) is a long-term
-2019 Community Health Plan (Implementation Strategies) May 15, Community Health Needs Assessment Process Florida Hospital at Connerton Long Term Acute Care Facility (LTAC or the Hospital) is a long-term
Sutter Health Novato Community Hospital
 Sutter Health Novato Community Hospital 2016 2018 Implementation Strategy Responding to the 2016 Community Health Needs Assessment 180 Rowland Way, Novato CA 94945 FACILITY LICENSE #110000375 www.sutterhealth.org
Providence Hood River Memorial Hospital 2010 Community Assets and Needs Assessment Report
 Providence Hood River Memorial Hospital 2010 Community Assets and Needs Assessment Report Produced by Lauren M. Fein, M.P.H. How the study was conducted Every three years, Providence Hood River Memorial
Community Analysis Summary Report for Clinical Care
 Community Analysis Summary Report for Clinical Care BACKGROUND ABOUT THE HEALTHY COMMUNITY STUDY The Rockford Health Council (RHC) exists to build and improve community health in the region. To address
Overlake Medical Center. Implementation Strategy
 2015 Overlake Medical Center Implementation Strategy Table of Contents Introduction... 2 Addressing the Health Needs... 4 Access to Care and Preventive Health Care... 5 Cancer... 6 Cardiovascular Disease...
Implementation Strategy Report for Community Health Needs
 2013 Implementation Strategy Report for Community Health Needs Kaiser Foundation Hospital WALNUT CREEK License #140000290 Kaiser Foundation Hospitals Community Health Needs Assessment (CHNA) Implementation
Hamilton Medical Center. Implementation Strategy
 2016 Hamilton Medical Center Implementation Strategy 0 2016 Hamilton Medical Center Hamilton Medical Center For FY2017-2019 Summary Hamilton Medical Center is regional, acute-care hospital with 282 beds.
Implementation Strategy
 Implementation Strategy Community Health Improvement Plan Community Memorial Hospital Fiscal Year 2016-2018 Plan Approved by Community Outreach Steering Committee on 12/11/2015 Plan last reviewed on 12/8/2017
2016 Community Health Needs Assessment
 2016 Community Health Needs Assessment Table of Contents Our Commitment to Community Health 2 2016 CHNA Overview: A Statewide Approach to Community Health Improvement 2016 CHNA Partners Research Methodology
EXECUTIVE SUMMARY... Page 3. I. Objectives of a Community Health Needs Assessment... Page 9. II. Definition of the UPMC Mercy Community...
 June 30, 2016 3 TABLE OF CONTENTS EXECUTIVE SUMMARY... Page 3 I. Objectives of a Community Health Needs Assessment... Page 9 II. Definition of the UPMC Mercy Community... Page 10 III. Methods Used to Conduct
Caldwell County Health Department Strategic Plan Caldwell County. North Carolina
 Health Department North Carolina Approved by the Board of Health February 5, 2015 1 Health Department Mission Statement Mission Statement To Promote, Protect and Improve the Health of Our Community To
Implementation Strategy Addressing Identified Community Health Needs
 2014-2017 Implementation Strategy Addressing Identified Community Health Needs Response to Schedule H Form 990 Table of Contents Page Overview of the Patient Protection and Affordable Care Act 3 Defined
Peninsula Health Strategic Plan Page 1
 Peninsula Health Strategic Plan 2013-2018 Page 1 Peninsula Health Strategic Plan 2013-2018 The Peninsula Health Strategic Plan for 2013-2018 sets out the future directions for Peninsula Health over this
How Wheaton Franciscan is meeting the NEEDS of our community. NSWERING HE CALL
 ANSWERING THE CALL MEETING OUR COMMUNITY NEEDS S July 1, 2013 June 30, 2016 S How Wheaton Franciscan is meeting the NEEDS of our community. NSWERING HE CALL COMMUNITY HEALTH NEEDS IMPLEMENTATION PLAN:
Critical Access Hospital-Relevant Measures for Health System Development and Population Health
 Flex Monitoring Team Policy Brief #42 December 2015 Critical Access Hospital-Relevant Measures for Health System Development and Population Health John Gale, MS; Andrew Coburn, PhD; Zach Croll, BA University
COURTENAY Local Health Area Profile 2015
 COURTENAY Local Health Area Profile 215 Courtenay Local Health Area (LHA) is one of 14 LHAs in Island Health and is located in Island Health s North Island Health Service Delivery Area (HSDA). Courtenay
State of Health: Watauga County 2016 Appalachian District Health Department Promoting safe & healthy living, preventing disease & protecting the
 State of Health: Watauga County 2016 Appalachian District Health Department Promoting safe & healthy living, preventing disease & protecting the environment. Table of Contents Overview and Demographics...
Community Health Needs Assessment 2016
 Community Health Needs Assessment 2016 Contents Introduction... 1 Summary of Community Health Needs Assessment... 2 Summary of Findings... 3 General Description of the Hospital... 4 Community Served by
Community Health Needs Assessment & Implementation Strategy
 2014-2016 Community Health Needs Assessment & Implementation Strategy Holy Family Memorial 2300 Western Avenue Manitowoc, WI 54220 Sister Rochelle Kerkhof, Director - Mission & Pastoral Care Email: rkerkhof@hfmhealth.org
St. James Mercy Hospital 2012 Community Service Plan Update Executive Summary
 St. James Mercy Hospital 2012 Community Service Plan Update Executive Summary Hospitals in New York State (NYS) are required by the Department of Health to create and publicly distribute an annual Community
2016 Community Health Needs Assessment & Implementation Strategy
 2016 Community Health Needs Assessment & Implementation Strategy 2 The Community Health Needs Assessment and Implementation Strategy for the CHI St. Luke s Health The Vintage Hospital were conducted and
Community Health Needs Assessment 2016
 Community Health Needs Assessment 2016 SAINT JAMES HOSPITAL known as OSF SAINT JAMES - JOHN W. ALBRECHT MEDICAL CENTER LIVINGSTON COUNTY CHNA 2016 Livingston County 2 TABLE OF CONTENTS Executive Summary...
Methodist Hospital of Sacramento Community Health Needs Assessment 2013 Community Benefit Implementation Plan
 Methodist Hospital of Sacramento 2013 Community Health Needs Assessment 2013 Community Benefit Implementation Plan Table of Contents I. 2013 Methodist Hospital of Sacramento Community Health Needs Assessment
Sanford Medical Center Mayville Community Health Needs Assessment Implementation Strategy
 Sanford Medical Center Mayville Community Health Needs Assessment Implementation Strategy 2017-2019 dba Sanford Mayville Medical Center EIN # 45-0228899 Dear Community Members, Sanford Mayville is pleased
Idaho Public Health Districts
 Idaho Public Health Districts Idaho s seven Public Health Districts were established in 1970 under Chapter 4, Title 39, Idaho Code. They were created to ensure essential public health services are made
Kaleida Health 2010 One-Year Community Service Plan Update September 2010
 2010 One-Year Community Service Plan Update September 2010 1 2 Kaleida Health 2010 One-Year Community Service Plan Update September 2010 Kaleida Health hospital facilities include the Buffalo General Hospital,
Intermountain Fillmore Community Hospital Community Health Needs Assessment 2016
 Intermountain Fillmore Community Hospital Community Health Needs Assessment 2016 Fillmore Community Hospital 674 South Highway 99 Fillmore, Utah 84631 Intermountain Fillmore Community Hospital 2016 Community
Union County Community Health Needs Assessment
 Community Health Needs Assessment November 2007 This page is intentionally left blank Community Health Needs Assessment November 2007 Health Department Needs Assessment Committee Winifred M. Holland, MPH,
Public Health Plan
 Summary framework for consultation DRAFT State Public Health Plan 2019-2024 Contents Message from the Chief Public Health Officer...2 Introduction...3 Purpose of this document...3 Building the public health
In , WHO technical cooperation with the Government is expected to focus on the following WHO strategic objectives:
 TONGA Tonga is a lower-middle-income country in the Pacific Ocean with an estimated population of 102 371 (2005), of which 68% live on the main island Tongatapu and 32% are distributed on outer islands.
Washington County Public Health
 Washington County Public Health Strategic Plan 2012-2016 Message from the Division Manager I am pleased to present the Washington County Public Health Division s strategic plan for fiscal years 2012 to
Draft. Public Health Strategic Plan. Douglas County, Oregon
 Public Health Strategic Plan Douglas County, Oregon Douglas County 2014 Letter from the Director Dear Colleagues It is with great enthusiasm that I present the Public Health Strategic Plan for 2014-2015.
Healthy People Healthy Families Healthy Communities: A Primary Health Care Framework for Newfoundland and Labrador
 I am proud to release Healthy People, Healthy Families, Healthy Communities: A Primary Health Care Framework for Newfoundland and Labrador 2015-2025. This Framework lays out a vision for a province where
2004 BAKER COUNTY HEALTH NEEDS ASSESSMENT
 Taking the pulse of the community 2004 BAKER COUNTY HEALTH NEEDS ASSESSMENT Prepared by: Health Planning Council of Northeast Florida, Inc. 900 University Blvd North, Suite 110 Jacksonville, Florida 32211
Good practice in the field of Health Promotion and Primary Prevention
 Good practice in the field of Promotion and Primary Prevention Dr. Mohamed Bin Hamad Al Thani Med Cairo February 28 th March 1 st, 2017 - Cairo - Egypt 1 Definitions Promotion Optimal Life Style Change
Public Health Accreditation Board STANDARDS. Measures VERSION 1.0 APPLICATION PERIOD 2011-JULY 2014 APPROVED MAY 2011
 Public Health Accreditation Board STANDARDS & Measures VERSION 1.0 APPLICATION PERIOD 2011-JULY 2014 APPROVED MAY 2011 Introduction The Public Health Accreditation Board (PHAB) Standards and Measures document
2016 Keck Hospital of USC Implementation Strategy
 2016 Keck Hospital of USC Implementation Strategy INTRODUCTION Keck Hospital of USC is a private, nonprofit 411-bed acute care hospital staffed by the faculty at the Keck School of Medicine of the University
Basic Concepts of Data Analysis for Community Health Assessment Module 5: Data Available to Public Health Professionals
 Basic Concepts of Data Analysis for Community Assessment Module 5: Data Available to Public Professionals Data Available to Public Professionals in Washington State Welcome to Data Available to Public
Colorado s Health Care Safety Net
 PRIMER Colorado s Health Care Safety Net The same is true for Colorado s health care safety net, the network of clinics and providers that care for the most vulnerable residents. The state s safety net
San Francisco is not exempt from the hypertension crisis, nor from the health disparities reflected in the African-American community.
 September 2017 San Francisco Health Network Heart Health Patient Communications and Community Events Project Brief and Request for Proposals I. Background Heart disease is the leading cause of death in
GREATER VICTORIA Local Health Area Profile 2015
 GREATER VICTORIA Local Health Area Profile 215 Greater Victoria LHA is one of 14 LHAs in Island Health and is located in Island Health s South Island Health Service Delivery Area (HSDA). The LHA is at
Community Health Needs Assessment
 Community Health Needs Assessment Prepared for Inova Mount Vernon Hospital By Verité Healthcare Consulting, LLC Board Approved June 29, 2016 1 Contents ABOUT VERITÉ HEALTHCARE CONSULTING... 4 EXECUTIVE
Community Health Needs Assessment: 2015 Implementation Strategy Update
 Community Health Needs Assessment: 2015 Implementation Strategy Update Framework for Evaluating Potential Strategic Options 2 In developing JFK Medical Center s CHNA Implementation Strategy, the following
Scott & White Hospital - Taylor 2013 Implementation Strategy. Addressing Community Health Needs
 Addressing Community Health Needs Scott & White Hospital-Taylor 2013 Community Health Needs Assessment Implementation Strategy Adopted by the Scott & White Hospital - Taylor Board of Directors on July
St. Anthony Hospital. Community Health Needs Assessment
 St. Anthony Hospital Community Health Needs Assessment Prepared by Tacoma-Pierce County Health Department Office of Assessment, Planning, and Improvement 1 Table of contents Key Findings... 3 Qualitative