Nursing Unit Staffing: An Innovative Model Incorporating Patient Acuity and Patient Turnover: A Dissertation
|
|
|
- Carmella Warren
- 6 years ago
- Views:
Transcription

1 University of Massachusetts Medical School Graduate School of Nursing Dissertations Graduate School of Nursing Nursing Unit Staffing: An Innovative Model Incorporating Patient Acuity and Patient Turnover: A Dissertation Shirley J. Tierney University of Massachusetts Medical School Follow this and additional works at: Part of the Health and Medical Administration Commons, and the Nursing Administration Commons Repository Citation Tierney, Shirley J., "Nursing Unit Staffing: An Innovative Model Incorporating Patient Acuity and Patient Turnover: A Dissertation" (2010). University of Massachusetts Medical School. Graduate School of Nursing Dissertations. Paper This material is brought to you by escholarship@umms. It has been accepted for inclusion in Graduate School of Nursing Dissertations by an authorized administrator of escholarship@umms. For more information, please contact Lisa.Palmer@umassmed.edu.

2
3 ii Dedication To my wonderful husband, Bill. I am successful because you stand behind me when I need your support, you stand in front of me when I need your vision and guidance, and you stand beside me when I need your shoulder to lean on. You are my everything.
4 iii Acknowledgements I would like to acknowledge my fabulous, dedicated, and enthusiastic dissertation committee. To my mentor and chairperson, Carol Bova, PhD, RN, ANP, who kept me focused and sane, cheered me on, and always believed in me. To my committee member, Paulette Seymour-Route, PhD, RN, my friend, colleague, and guardian angel, who has always encouraged me to dig deeper. To my statistician, Sybil Crawford, PhD who guided me and challenged my thinking. I sincerely thank all of you from the bottom of my heart. I would also like to acknowledge the never ending support of my family and friends who stood by me all the way. And thank you to all of the faculty at the Graduate School of Nursing who made learning a richly rewarding experience.
5 iv Table of Contents List of Figures... ix Chapter 1. State of the Science... 1 Introduction... 1 Overview... 5 Hours per Patient Day (HPPD)... 6 HPPD Associated With Case Mix and Patient Acuity... 8 Summary Chapter Introduction Origins of SCT The Major Components of SCT as a Theoretical Framework Purpose Assumptions Concepts and Relationships Contingency Structure Effectiveness Fit Healthcare Related Research Using SCT Use of SCT to Guide Nurse Staffing: The NSOR Model Operationalizing NSOR Concepts... 26
6 v Application of SCT for the Proposed Study Summary Operational Terms, Definitions, and Formulas Chapter 3. Methods Introduction Design Inclusion / Exclusion Criteria Setting and Sample Size Measures and Procedures Data Management Data Collection and Analysis: Aim Data Collection and Analysis: Aim Applying the Weight Factor Model Data Collection and Analysis: Aim Methodological Issues Secondary data use Nurse Staffing Research Human Subjects Issues Summary Chapter 4. Results Introduction Descriptive Data Findings for Specific Aim
7 vi Correlation Findings by Unit Type Correlation Findings Between HPPD and UAI by Individual Units Medical units FY FY FY Surgical units FY FY FY Mixed medical-surgical units FY FY FY Correlation Findings Between HPPD and CMI by Individual Units Medical units FY FY FY Surgical Units FY FY FY
8 vii Mixed medical-surgical units Findings for Specific Aim Findings from Using Linear Regression to Derive a Weight Factor Findings From Using an Alternative Method to Derive a Weight Factor Findings for Specific Aim Findings for FY 2008 Adjustments Findings for FY 2009 Adjustments Other Findings Summary Chapter V. Discussion Introduction The Importance of Unit Level Data Correlations between HPPD (Staff Hours) and UAI (Patient Turnover) and CMI (Patient Acuity) Benchmarking Use of Weight Factors to Adjust HPPD It appears that how well units were initially benchmarked made an impact on the results Clarification of the Measure of Unit Activity Index (UAI) Study Limitations Fit With Theoretical Framework Policy Implications Practice Implications... 86
9 viii Research Implications Conclusion References Appendix A Tables Appendix B.Weight Factor Decision Model Appendix C. Sample Staffing Plan Used for Annual Budget and Staff Planning Appendix D.Descriptive Statistics: Output from SPSS by Unit Type Appendix E. Residual Checks: Medical Units Appendix F: Alternative Method for Deriving Weights for use in Adjusting HPPD: Appendix G. Formula for Calculating Total Touched Patients Appendix H. Variations in HPPD in a 28 Bed Nursing Unit
10 ix List of Figures Figure 1. Relationships among the first order concepts of SCT Figure 2. Mark, Salyer, and Smith s (1996) modification of SCT concepts Figure 3. Variables to be measured by this study using SCT as a theoretical framework... 29
11 x Abstract Changes in reimbursement make it imperative for nurse managers to develop tools and methods to assist them to stay within budget. Disparity between planned staffing and required staffing often requires supplemental staffing and overtime. In addition, many states are now mandating staffing committees to demonstrate effective staff planning. This retrospective quantitative study developed an empirical method for building nursing unit staffing plans through the incorporation of patient acuity and patient turnover as adjustments towards planning nursing workload. The theoretical framework used to guide this study was structural contingency theory (SCT). Patient turnover was measured by Unit Activity Index (UAI). Patient acuity was measured using case mix index (CMI). Nursing workload was measured as hours per patient day (HPPD). The adjustment to HPPD was made through the derivation of a weight factor based on UAI and CMI. The study consisted of fourteen medical, surgical, and mixed medical-surgical units within a large academic healthcare center. Data from 3 fiscal years were used. This study found that there were significant, but generally weak correlations between UAI and CMI and HPPD. The method of deriving a weight factor for adjusting HPPD was not as important as the decision-making relative to when to adjust planned HPPD. In addition, the measure of unit activity index was simplified which will assist researchers to more easily calculate patient turnover. As a result of this study, nurse managers and will be better able to adjust and predict HPPD in cases where benchmarking has been problematic. Data-driven adjustments to HPPD based on UAI and CMI will assist the nurse manager to plan and budget resources more effectively.
12 1 Chapter 1 State of the Science Introduction The purpose of this study was to develop an empirical method for building nursing unit staffing plans through the incorporation of patient acuity and patient turnover as an adjustment to hours per patient day (HPPD). The goal of this study was to provide nurse managers on acute care general medical, surgical, and mixed medical-surgical units with an alternative, objective method for budgeting staffing plans weighted by patient acuity and patient turnover. The proposed staff resources planning process should reflect the complexity of nursing care and allow the nurse manager to stay within the allocated staff resources. The American Nurses Association (ANA) continues to question the use and value of HPPD alone as a unified measure of nursing care hours (American Nurses Association, 2009a). The ANA suggests incorporating other factors that illustrate the individuality of nursing workload at the unit level. Among these factors are patient turnover and patient acuity. In addition, nurse managers must be able to utilize and translate staffing data into appropriate staffing plans (Anderson & Kerfoot, 2009). The development of a staff planning model that incorporates adjustments to planned HPPD by incorporating patient acuity and patient turnover may reduce the variation between planned and actual HPPD. Further, the model proposed in this study will meet the objectives of successful staff planning put forth by the ANA.
13 2 The purpose of this chapter is to review the literature on patient turnover, patient acuity and HPPD. The importance of using an empirically based method for creating staffing plans is emphasized. Traditionally, staffing plans have been developed through the use of historical averages of fulltime equivalents (FTEs) or HPPD (Porter-O'Grady & Malloch, 2007). In an early study, Walker (1990) described patient volume by shift along with associated staffing levels and cost and found that the predetermined RN work schedule did not match daily shift RN staffing levels required for workload resulting from patient turnover. The evening shift accounted for 35% of all admissions, discharges, and transfers (ADTs) and 60% of RN overtime and supplemental staffing. Whereas the day shift accounted for 64% of ADTs, but only 19% of RN overtime and supplemental staffing (Walker, 1990). Jacobson, Seltzer, and Dam (1999) found a difference of 50.9% between the total number of patients cared for by the nursing staff throughout a 24 hour period and the budgeted average daily census upon which the staffing plan was built. Data extrapolated at the unit level from 2007 N=128, 2008 N=129, and 2009 N=132, staffing plans for the twelve Massachusetts acute care hospitals with 300 or more beds revealed only 38%, 36%, and 55% respectively of the medical and surgical units were on target 1 for planned versus actual staffing (PatientCareLink, 2010). Of the remaining units not on target, utilizing more staff than planned accounted for 55%, 54%, and 37% respectively. Using less staff than planned accounted for 7%, 9%, and 8% respectively. Differences between magnet status hospital units N=51, and non-magnet hospitals N=77,78, and 81respectively, as subsets of the abovementioned data over the 3 years 1 On Target = actual HPPD within + / - 5% of planned
14 3 revealed a range of 24% to 52% on target staffing for non-magnet status hospitals versus a range of 51% to 57% for magnet status hospitals. However, in magnet status hospitals, a range of 16% to 20% of units reported HPPD data below the -5% threshold (less staff used than planned) versus a range of 0% to 4% of non-magnet hospital units. Further data examining on target performance differences between magnet and non-magnet hospital units can be found in Table A1 (see Appendix A). Such disparity between planned staffing and required staffing often requires supplemental staffing, such as float pool nurses or per diem nurses, or nurses working extra shifts and overtime. A 2008 survey of 220,000 RNs representing 550 hospitals conducted by the ANA revealed that 43% of the RNs reported working overtime to cover shift shortages and increased unit activity (American Nurses Association, 2008). How much overtime is incurred as a result of inadequately planned and budgeted staffing is unknown. The industry standard for overtime is 2% of total worked hours (Dunham- Taylor & Pinczuk, 2010). Hospitals typically budget overtime at 4.4% of total worked hours and some teaching hospitals report overtime hours up to 30 % of hours paid at regular pay rates (Cavouras, 2002). Overtime is a costly solution to inadequately planned staffing. The largest share of hospital labor expenses is derived from nursing units (Haynor & Hohenleitner, 2007). An estimated 63% of hospital labor costs go towards nursing salaries (Rodgers & Lutz, 2003). This is in stark contrast to Kaplan s (1975) findings of 35 years ago when only 25% to 28% of the hospital costs were attributed to nursing salaries. The average hourly wage of a registered nurse (RN) in Massachusetts is $38.17 (Bureau of Labor Statistics, 2009). The addition of merely one extra eight hour shift per
15 4 week worked by an RN will result in nearly $16,000 of additional cost incurred by the unit. One extra eight hour shift per week worked by an RN at an overtime rate will add $24,000 to the unit s labor expenses. In large medical centers with several nursing units, it does not take many extra shifts worked to drive up labor expenses in excess of budgeted allowances. While hours per patient day is a common measure used to plan and budget for staffing and for the evaluation of staffing levels, they are often studied as an independent variable affecting outcomes. Petryshen, O'Brien-Pallas, & Shamian (1995) break down outcomes into three classifications: clinical, economic, and administrative. Clinical outcomes are concerned with patient safety and satisfaction, which are beyond the scope of this study. Economic outcomes include nursing hours and utilization costs. Administrative outcomes deal with efficiency and effectiveness. McGillis-Hall, Doran, and Pink (2004) list three characteristics of outcomes; (a) they must be measurable, (b) relevant to the patient, provider, and healthcare environment, and (c) representative of the effects of the care provided, whether intended or unintended. Several studies have examined the after effects of HPPD on nurse sensitive patient safety outcomes, nursing outcomes, and economic outcomes. Few studies have examined a combination of HPPD with other factors affecting nursing workload such as patient turnover (throughput) and patient acuity. No studies were found that examined a planning process that utilized patient turnover and patient acuity towards allocating budgeted resources necessary to produce an annual staffing plan that more accurately predicted HPPD.
16 5 Therefore, the purpose of this study was to provide acute care nurse managers of adult general medical, surgical, and mixed medical-surgical units with an alternative, objective method for planning and budgeting annual unit staffing resources weighted by patient acuity and patient turnover. The specific aims for this study were 1. To examine the correlation between patient acuity (using case mix index) and patient turnover (using unit activity index) as contingencies on the structure of worked hours per patient day, 2. To examine the fit between the contingencies of case mix index and unit activity index on the structure of hours per patient day, utilizing them as weight factors for building a more accurate predictive annual staffing plan, and 3. To examine the effectiveness of using the weight factors derived through Aim 2 by examining the differences in variance between weighted and unweighted staffing plans. Overview In preparation for this literature review, key words nurse staffing models, nurse staffing plans, creating and budgeting staffing plans, case mix index, patient acuity, patient turnover, patient throughput, nursing benchmarking and hours per patient day were searched using Pub Med and Google Scholar. In addition, the retrieved articles offered additional leads through references cited by their researchers. Twenty four research articles of varying empirical quality involving academic medical centers and having content relative to the measurement of HPPD and/or incorporating additional nursing workload measures of patient acuity and patient turnover
17 6 were reviewed. Data collection represented a range from 1 week (Jacobson, et al., 1999) to 8 years (Unruh & Fottler, 2006). The most prevalent outcome of the reviewed studies focused on the clinical area, specifically concerning nurse sensitive patient safety outcomes, through a combination of HPPD, skill mix, and/or patient to nurse ratios. Nurse sensitive patient safety outcomes consisted of patient fall rates, pressure ulcer prevalence, urinary tract infections (UTIs), pneumonia and other respiratory infections (URIs), medication errors, failure to rescue, wound infections, and patient satisfaction with various aspects of care. No studies examined HPPD as an outcome of effective staff planning. The outcome of staff planning, that is, the number of direct patient care providers scheduled to be on duty during a shift, contribute to the measure of HPPD, skill mix, and patients-to-nurse (PTN) ratios. Thus, HPPD, skill mix, and PTN become post hoc metrics of staffing plan effectiveness when evaluating nursing workload and attempting to tie it with patient safety outcomes, quality of nursing life, and hospital outcomes. Hours per Patient Day (HPPD) Nursing intensity, a typical measure of nursing unit staffing, is reported in hours per patient day (HPPD). In 1937, the National League of Nursing Education (NLNE) recommended 3.5 HPPD as a sufficient staffing level (Kaplan, 1975). This represents a patient to nurse (PTN) ratio of approximately 7:1. The Labor Management Institute (LMI) reported median HPPD from 2003 and 2004 from a national survey of 120 hospitals representing 1,980 units. HPPD ranged from 7.43 in 2003 on surgical units, N not reported, to 9.25 in 2004 on surgical units with telemetry,
18 7 N = 18 (Cavouras & Suby, 2004). Between 2007 and 2009, Massachusetts hospitals with beds reported median HPPDs of 8.05 in medical-surgical units, N = 49, SD = 1.14, to 9.52 in medical units, N = 49, SD = 1.34 (PatientCareLink, 2010). A full comparison of median HPPD by unit type by years can be found in Table A2 (see Appendix A). A variation of HPPD measurement considers skill mix; that is, the proportion of registered nurses (RNs) to other care providers such as licensed practical nurses (LPNs) and unlicensed assistive personnel (UAPs) such as nursing assistants and patient care technicians. A higher RN skill mix generally resulted in a lower rate, albeit mixed results of adverse patient outcomes (Blegen, Goode, & Reed, 1998; McGillis-Hall, et al., 2004; Needleman, Buerhaus, Mattke, Stewart, & Zelevinsky, 2001; Seago, Williamson, & Atwood, 2006). More specifically, medication error rates were found to be lower with a higher proportion of RNs (Blegen, Goode, & Reed, 1988; McGillis-Hall, Doran, & Pink, 2004; Seago, Williamson, & Atwood, 2006). Lower occurrences of UTIs, URIs, pressure ulcer rates and patient complaint rates were found in the presence of a higher RN skill mix, but patient fall rates were not well explained by HPPD or skill mix (Blegen, Goode, & Reed, (1998). Needleman et al. (2002) examined their findings by type of unit and found both medical and surgical unit patients enjoyed shorter lengths of stays (LOS), lower UTI and failure to rescue rates while medical unit patients alone experienced lower pneumonia rates. Patient satisfaction with pain management increased with a higher RN skill mix (Seago, Williamson, & Atwood, 2006). Lower RN skill mixes resulted in higher wound infection rates (McGillis-Hall, Doran, & Pink, 2004).
19 8 Sovie and Jawad (2001) found the proportion of RNs to UAPs did not result in any appreciable findings relative to patient fall rates, nosocomial pressure ulcer prevalence, nor urinary tract infections. Neither did the proportion of RNs to UAPs result in decreased patient satisfaction with pain management, received education, attention to needs, preparation for discharge or overall patient satisfaction with nursing care and hospital stay. However, Sovie and Jawad (2001) did find that higher RN HPPD were significantly associated with lower fall rates and increased patient satisfaction with pain reassessment. Patient to nurse ratios can also be examined as a proxy measure for HPPD. Higher patient to nurse (PTN) ratios resulted in less satisfied nurses and higher burnout rates (Aiken, Clarke, Sloane, Sochalski, & Silber, (2002). In addition, higher PTN ratios were linked to higher patient mortality and failure to rescue rates (Aiken, et al., 2002).Although the focus of this study is not on patient safety outcomes, studies incorporating HPPD, PTN ratios, and / or skill mix as measures of patient or nurse outcomes can be found in Table A3 (see Appendix A), to establish context around HPPD as one measure of nursing workload. HPPD Associated With Case Mix and Patient Acuity The advent of diagnosis-related groups (DRGs) and a subsequent decade of shortened patient length of stays have contributed to increased stress of bedside nurses (Kane, Shamliyan, Mueller, Duval, & Wilt, 2007). Shorter patient lengths of stay result in a concentration of nursing activities into abbreviated timeframes adding to the intensity of nursing workload (O'Brien-Pallas, Irvine, Peereboom, & Murray, 1997). The most recent (2007) average patient length of stay (ALOS) for US hospitals is 4.6 days (Agency
20 9 for Healthcare Research and Quality, 2008). The ALOS in 1993 was 5.7 days. This is a decrease of nearly 20% from the ALOS over the past 15 years. This means that a nurse who had 137 hours to assess, plan, implement, and evaluate care over the course of a patient stay 15 years earlier now has only 110 hours. A 2001 survey of 186 hospitals in 38 states revealed only 37% utilized a patient acuity system, and only 28% reported being satisfied with their patient acuity system (Cavouras, 2002). In a 2003 survey of Massachusetts hospitals, only 28% (19 of 67) indicated the use of a patient acuity system for documentation and review of patient care requirements (Massachusetts Organization of Nursing Executives, 2004). A follow up survey with nursing executives conducted the following year found 29% of Massachusetts acute care hospitals responding affirmatively to the question of utilizing an acuity based patient classification system (O Donnell (2004). Of interest with the follow-up survey was that an equal percentage of RNs (reported by the nurse executive of the hospital) had confidence (44%) / no confidence (44%) with the acuity system in use. Only 56% of the nurse executives felt that the acuity system was meeting the organizational needs and was helpful in decision making around meeting patient care needs, despite 86% of the respondents stating it was used for budgeting and strategic planning purposes (O'Donnell, 2004). Acuity must reflect patient status and needs; it is not a measure of nursing activity (VanSlyck & Johnson, 2001). Staffing budget variances can be evaluated by using a patient based acuity systems (VanSlyck & Johnson, 2001). However, in the absence of patient acuity systems, and because case mix index is patient specific, it often is used as a proxy measure of patient acuity.
21 10 O Brien-Pallas et al. (1997) studied singular medical case mix designations of pediatric patients in relationship to nursing care hours. While each case mix group had statistically significant differences from one another in terms of nursing care hours required, F = (70, 1344) = 25.78, p <.0001, medical case mix was not a good predictor of required nursing care hours. Nursing diagnoses, medical case mix grouper, nurse characteristics, and the care environment explained 60% of the variance in nursing hours. The impact of a variety of case mix groups nor the relative complexity of each case mix group at the unit level was not evaluated. Studies incorporating acuity relating to influencing outcome measures can be found in Table A4 (see Appendix A). HPPD Associated with Census Measures and Daily Patient Turnover Patient census, measured by average daily midnight census (ADMC or ADC) and / or daily admissions, discharges, and transfers was evaluated in eleven of the studies. Using ADT activity broken down by shift and matched with overtime, per diem and float pool use, Walker (1990) concluded that a predetermined, pre-posted RN work schedule did not match the required daily shift RN staffing levels required for the additional workload incurred by patient turnover. Walker (1990) found patient admission patterns to be consistent and constant throughout the week and found consistently high unit occupancy because of the constant turnover of patients. That is, there was no predictable relief period from patient admissions. Nurses reported patient turnover rates of 40% to 50% in a single shift (Norrish & Rundall, (2001). A unit activity index (UAI) > 50% suggests the need for increased staffing. In one study, unplanned admissions from the Emergency Department were as high as 80% (Walker, 1990). The number of admissions, discharges, and transfers
22 11 occurring on a unit is also known as environmental turbulence (Salyer, 1995). Environmental turbulence has an impact on nursing workload, and ADTs should be considered in the overall measurement of nursing workload (Minnick and Mion, 2009). The intensity of ADT activity adds between 60 and 90 minutes to a nurse s workload (Cavouras, 2002). High levels of environmental turbulence, examined over a two month period as potential stressors on RN job performance, resulted in nurses lower selfperceived quality of communication skills and interpersonal relationships (Salyer, 1995). Studies incorporating census and environmental turbulence related to or measuring patient or nurse outcomes can be found in Table A5 (see Appendix A). HPPD Associated with Economics and the Importance of Utilizing Empirically Based Methods for Staff Planning In a survey conducted by the American Hospital Association in November 2008, 53% (N = 736) of hospitals who responded to the survey reported reducing staff (type of staff not specified in paper) in response to economic concerns (American Hospital Association, 2009). Nurse staffing is often the target for cost reduction, and is frequently blamed when cost containment measures are underachieved (Buchan, 2000). Hospitals often engage in restructuring to reduce costs by replacing RNs with less expensive and less trained personnel (Norrish & Rundall, 2001). Nurses are vulnerable to cost cutting measures employed by hospitals because nurses comprise the largest share of the hospital labor costs (Buerhaus, 2009). Nurse managers need to rely on empirical evidence to support their staffing plans in order to make an objective business case for securing a budget that contains adequate numbers of nurses to meet the needs of the patients, the organization, and the nurses themselves. Without an evidence-based staffing plan, nurse
23 12 managers become susceptible to budget reductions to their nurse full-time equivalents (FTEs). Nurse managers, under an expanded scope of fiscal responsibilities, are expected to link available resources to systematic planning; while at the same time improve efficiency and control costs (Carruth, 2001). Staff planning is an expected competency and responsibility of nurse managers. The ANA s Scope and Standards of Practice for Nurse Administrators states that nurse managers are responsible for assuming oversight for staffing, and scheduling personnel considering scope of practice, competencies, patient needs, and complexity of care (American Nurses Association, 2009c, p. 17). Nurse staffing is closely scrutinized at the public level, as evidenced by the growing number of mandates arising from state government. Currently there are 15 states that are legislated to address nurse staffing (American Nurses Association, 2009b). Four additional states have pending legislation (American Nurses Association, 2009b). Eleven states are required to establish staffing committees (comprised of staff nurses and nurse managers) to oversee and evaluate unit staffing plans, and four states are required to publically report nurse staffing (American Nurses Association, 2009b). Given the current public interest in nurse staffing levels, and the growing body of literature exploring links between staffing and patient outcomes (Finkler, Kovner, & Jones, 2007), the emphasis on staff planning has shifted from experience and intuition to data-driven, evidence-based staffing (Dunham-Taylor & Pinczuk, 2010). Studies specifically targeting or incorporating economics as findings associated with HPPD can be found in Table A6 (see Appendix A).
24 13 Summary The American Nurses Association (ANA) states that staffing of any nursing unit should always take three things into consideration: the achievement of meeting quality patient outcomes, creating a manageable workload per nurse that supports a quality lifestyle and positive work environment, and being fiscally responsible to the organization (American Nurses Association, 2005). Nursing workload is comprised of the number of assigned patients per shift along with the required patient specific care (Walker, 1990). The impact of patient turnover and patient acuity on nursing workload are not well understood (Duffield, Diers, Aisbett, & Roche, 2009). Creating a balance between the daily nursing workload and the budgeted staffing plan is a major challenge faced by nurse managers (Czerwinski, 2007). Staffing plans serve as a baseline from which to make workload adjustments to match the fluctuating needs of the patients to the abilities of the available staff (2008). The number and skill type of direct care providers assigned to a nursing unit cost center are predetermined via the budget process. However, nurse managers have the ability to add or subtract these staffing resources as needed according to their assessment of patient care needs (acuity), anticipated unit activity (patient turnover), knowledge and experience of staff members assigned to the unit for that shift (Czerwinski, 2007). This is known as staffing at the unit level (Carayon & Gurses, 2005). Developing a predictive model staffing plan, adjusted for both patient acuity and patient turnover, will potentially assist nurse managers to more accurately forecast their staffing needs by using objective data. Although measuring patient, nurse, and/or hospital outcomes is not the focus of this study, it is hoped that breaking away from traditionally
25 14 derived staffing plans into more evidence-based staffing plans will bring about positive results for the patients, nurses, and hospital administration.
26 15 Chapter 2 Theoretical Framework Introduction Donaldson s contingency theory of organizational structure, also known as structural contingency theory (SCT) will be used to guide this study. Mark, Salyer, and Smith adapted SCT for use in nurse staffing (McGillis-Hall, 2005). This chapter (a) describes the origins of SCT, (b) outlines the key concepts and assumptions, (c) identifies the use of SCT in health-related research, (d) explores the concepts and assumptions of Mark, Salyer, and Smith s adaptation of SCT for use in nursing outcomes research, and (e) explains the fit of SCT for guiding this research project. Origins of SCT Structural contingency theory represents a paradigmatic shift in the ideas governing organizational structure (Donaldson, 1999). Prior to structural contingency theory, classical management theory in organizations was de rigueur. Classical management theory (CMT) held that a singular organizational structure was best for all organizations: top down control and decision making (Donaldson, 1999). CMT was popular during the early to mid 1900s, until there was a shift towards the human relations school of management theory mid-century (Donaldson, 1999). During this time the focus shifted from senior management to employee participation and group dynamics shaping the organization. SCT arose during the last half of the 20 th century when beliefs about organizational effectiveness began to reflect situationally appropriate behaviors as opposed to rigid rules and procedures. SCT is based upon environmental uncertainty
27 16 (Donaldson, 2001). The fundamental essence of contingency theory is to devise the best organizational structure to fit the demands of the situation (Kreitner, 2009). The Major Components of SCT as a Theoretical Framework Chinn and Kramer (2008) state that theory should include the following identifiable components: purpose, concepts, definitions, relationships and structure, and assumptions. The theory of structural contingency will be presented through these components. Purpose. The purpose of SCT is to provide organizations with an operational framework designed to illustrate situational factors impacting the organization s desired goals and to help the organization adapt accordingly in order to effectively achieve those goals. SCT allows for one to analyze a situation of concern, identify the variables that influence the situation, and initiate a decision or action to ameliorate the situation for the good of the organization s overall business strategy and goals (Schoech, 2006). Using contingency theory principles, managers examine a variety of standardized options and modify them in an attempt to create the most efficient organization possible (Kreitner, 2009). The purpose of research utilizing structural contingency theory is in matching contingency factors to the organizational structures and establishing the best fit towards maximum effectiveness using empirical examination Donaldson (1999). Assumptions. There are five key assumptions of SCT. The first assumption is that the best way to manage a situation or event is situational. The second is that there must be a fit between the organizational structure and the applied contingency. Third, the applied contingency must result in a positive effect. Fourth, as tasks grow more unpredictable, more innovation and individualization are required to perform them. Last,
28 17 the organization s goals have a better chance of being met when the structure is appropriate to the tasks and the environment (Donaldson, 2001). Concepts and Relationships Contingency. Contingency is the degree of environmental uncertainty and the adaptation of the organization to the situation (Kreitner, 2009). A contingency provides the relationship between two events or situations Schoech (2006). For example, if an organization is highly structured with well-defined hierarchy and rigid operating procedures, an employee who is a self-directed independent thinker would probably be dissatisfied in that type of environment (Schoech, 2006). Contingencies shape organizations, whereby the organization adapts to its situation to avoid ineffective performance (Donaldson, 2001). Donaldson (1999) defines contingency factors, or variables, as those that affect the organization such as its internal and external environmental complexity, size, task uncertainty, task interdependence, strategy, and technology. These variables influence the overall business milieu to which the organization must adapt in order to be effective (Donaldson, 1999). The state of the organizational environment holds a pivotal role in SCT. The environment was conceptualized by Dess & Beard (1984). Dess and Beard (1984) examined twenty three environmental variables and reduced their commonalities to three. The three commonalities composing environmental characteristics are dynamism, complexity and munificence (Dess & Beard, 1984). The dynamic portion of the environment encompasses the degree of stability experienced by the organization. Complexity refers to the required tasks and available technology. Munificence refers to the organizational size and capacity.
29 18 There are four predictors of environmental uncertainty: (a) social, political, and economic pressure; (b) technology availability and support; (c) availability of resources and supplies; and (d) the degree of stability on the demand for product or service (Kreitner, 2009). In addition, assessing the level of environmental uncertainty is a required precursor for implementing organizational structural strategy (Kreitner, 2009). Change occurring external to the organizational environment or within the organization itself introduces the concept of task uncertainty which influences task scheduling. When there is a great amount of uncertainty within the business environment, it is difficult to adhere to task schedules. When the scheduling of tasks becomes less effective due to uncertainty, managers must improvise to find solutions to problems (Donaldson, 1999). SCT holds that departmental units that are functionally similar are more efficient and have better performance outcomes (Hollenbeck et al, 2002). However, efficiency is only achieved within relatively stable and predictable environments. It is the context of the complexities of instability and uncertainty within units that elicit change and flexibility consistent with the contingency portion of the theory (Hollenbeck, et al., 2002). Smaller organizational units are able to more quickly react to environmental or structural changes (Hollenbeck, et al., 2002) Structure. The concept of structure is described as the make-up of an organization and its subunits. Burns and Stalker (2001) examined organizations and first classified them by the design of their structure (Donaldson, 1999). The Burns and Stalker model divided organizational structure into two basic types: mechanistic and organic (Burns & Stalker, 2001). Mechanistic organizations are tightly controlled, top down, rules-based bureaucracies. Organic organizations are at the opposite end of the
30 19 continuum with characteristics of peer-to-peer communications, innovation, and flexibility (Kreitner, 2009). The higher the degree of environmental stability, the more mechanistic the organization (Burns & Stalker, 2001). Effectiveness. Effectiveness is broadly conceptualized within SCT as a measure of how well an organization meets its goals. For example, goals set by an organization may include profitability, employee satisfaction, customer satisfaction, positive patient outcomes, or degree of innovation. Donaldson uses the terms effectiveness and performance interchangeably when he writes about SCT (Donaldson, 2001). He sees effectiveness and performance as similar concepts. For example, an organizational goal might be to improve positive patient outcomes through a reduction in pressure ulcers. Under SCT, the reduction in pressure ulcers would be both a measure of organizational effectiveness and a measure of organizational performance. Fit. The first level concepts used by SCT, contingency, structure, and effectiveness, are at the same level of abstraction. However, fit is an overarching concept around contingency and structure. It is described as the measure that allows an evaluation of the effect of a contingency upon a corresponding structure. The concept of fit is of major importance to contingency theory. Donaldson (2001) states that any structural variable needs to have a good fit with a corresponding contingency variable in order to have a positive and effectively performing organization. This goodness of fit, so to speak, has a positive effect on the performance, i.e. the effectiveness, of the organization (Donaldson, 2001). Thus, the concept of fit explains the association between contingency and structure. The stronger the relationship between contingency and structure, the stronger
.")

31 20 is the fit between them. Weak relationships are indicative of what is termed misfit. Empirical research using SCT as its theoretical framework should aim to find relationships between the contingency / structure fit and performance (Donaldson, 2001). The goal of any organization should be to find the best structure that fits the situation (Donaldson, 2004). The relationships among these concepts are illustrated in Figure 1. Fit Contingency Structure Effectiveness Figure 1. Relationships among the first order concepts of SCT. The structure itself is contingent upon varying factors affecting it: factors labeled as contingency factors (Donaldson, 1999). A contingency presents itself as a moderator between an organizational characteristic and resulting effectiveness (Donaldson, 2001). A varying structure, based on contingency factors such as the size of the organization or its business strategies, for example, is seen as a moderator for effectiveness. Healthcare Related Research Using SCT SCT has been used as a theoretical framework in a variety of health care settings and situations. Alexander and Randolph (1985) were two of the first researchers to see the potential of contingency theory for use in nursing research in their examination of the fit between technology and structure. Fit was measured assuming that for each value of a technology variable there was a best value of structure, measured by performance. Therefore, fit was represented as the absolute value between technology and structure. Using a regression model, the fit between the two components (contingency vis-à-vis
32 21 technology and structure vis-à-vis degree of participation) was found to be a better predictor of patient care quality than either structure or technology alone or together in the same model, R 2 =.50, F = 9.98, p <.01 (Alexander & Randolph, 1985). Zinn and Mor (1998) reviewed how structure was operationalized in healthcare research between 1976 and 1995 through a comparison of Donabedian s Structure- Process-Outcome (SPO) theory and SCT. Studies using SPO as a guiding framework operationalized structure through a focus on capability and capacity. SPO studies measured capability by payer mix, staffing ratios, years of experience (MD and RN), education and training, and specialization. SPO studies measured capacity by facility characteristics such as ownership, teaching affiliation, size, and volume. In contrast, studies using SCT as a guiding framework operationalized structure through degrees of standardization, specialization, and centralization, such as communication patterns, coordination efforts and degrees of control (Zinn & Mor, 1998) Frequently studied patient outcome measures (death, disease, disability, discomfort, and dissatisfaction) are more alike among researchers than are the theoretical frameworks used to guide their research (Zinn & Mor, 1998). In other words, regardless which theoretical framework guided the research study, the outcome measures (SPO) or effectiveness measures (SCT) were similar in nature. Larrabee et al. (2003) used SCT as a predictive model using multiple regression to examine the relationship between nurse job satisfaction and intent to leave. High scores measured via context, structure, attitude, and job satisfaction variables were hypothesized to negatively influence a nurse s intent to leave the job. High scores measured via context, structure and attitude variables were hypothesized to positively influence a
33 22 nurse s job satisfaction. For the first hypothesis, structure was operationalized as practice control and responsiveness of support services. Context was operationalized by degree of staffing, leadership style, and patient turnover. For the second hypothesis, structure was operationalized as responsiveness of support services and nurse / physician relationships. Context was operationalized as leadership style. For the first hypothesis, Larrabee et al. (2003) found that although structure variables did predict intent to leave, R 2 =.26, df = 86, F = 16.22, p <.0001, none of the context variables predicted intent to leave (statistics not reported). Therefore, there was a lack of fit between the context and structure proposed by the first hypothesis. For the second hypothesis, context and structure influenced job satisfaction only indirectly, moderated by the influence of psychological empowerment, R 2 =.58, df = 82, F = 29.14, p <.0001). Therefore, psychological empowerment provided the fit between context and structure. Zinn, Brannon, Mor, and Barry (2003) used SCT to study managerial and staff perceptions of their influences over physical and psychosocial care given by nursing assistants in nursing homes. They hypothesized that the physical work domain would be seen as being more mechanistically structured (through top down hierarchy) than the psychosocial work domain despite being provided by the same cadre of nursing assistants. Context variables were related to physical care and psychosocial care provided by the nursing assistants. Structure variables were related to the work environment within which the nursing assistants provided care (degrees of central authority versus autonomy, standardization of work through rules and practice protocols, and written documentation as evidence that work was performed).
34 23 Paired t tests were used to compare the degree of structural influence over the type of care provided (physical versus psychosocial). A hierarchical environment was found as having a higher degree of influence over physical care than psychosocial care given by nursing assistants, difference between M = -0.05, SD = 0.03, t value = -1.93, p <.05 (Zinn, et al., (2003). Charge nurses perceived the greatest difference in structural influence (difference between M = -0.15, SD = 0.02, t value = -6.75, p <.0001), while the nursing assistants did not perceive any significant difference in being influenced (difference between means = -0.05, SD = 0.03, t value = -1.22, p >.05 (Zinn, et al., 2003). These findings are consistent with the assumptions of SCT that less uncertainty and unpredictability of regulated required tasks results in a more bureaucratic structure; a structure appropriate for nursing homes with long term residents and fewer numbers of professional licensed staff. Chou, Yano, McCoy, Willis, and Doebbeling (2008) used SCT in conjunction with SPO to explore strategies associated with facilitating optimal antibiotic use and controlling the spread of antimicrobial resistant organisms issued through guidelines by the National Foundation for Infectious Diseases / Centers for Disease Control and Prevention (NFID-CDC). Contingency (process) was operationalized through measures that promoted implementation such as organizational culture, communication systems, and coordination of effort. Structure was operationalized by ascertaining the degree of formalization, centralization, and standardization in place within the organization. Chou et al. (2008) hypothesized that organizations that were more mechanistic were more likely to implement NFID-CDC guidelines.
35 24 A stepwise regression analysis with backward selection was used to examine structure and process variables vis-à-vis optimization of antibiotic use as well as controlling the spread of antimicrobial resistant organisms. Two of the three structural variable categories were positively associated with strategies to optimize antibiotic use: formalization: R 2 =.26, p.0001; centralization: R 2 =.11, p Of the three contingency variable categories, only culture was positively associated with strategies to optimize antibiotic use: data-driven culture: R 2 =.36, p.0001; flexible culture: R 2 =.10, p All three structural variable categories were positively associated with strategies to control the spread of antimicrobial resistant organisms: formalization (hand hygiene compliance feedback), R 2 =.32, p.0001; provision of infection control policies, R 2 =.04, p.05; standardization, R 2 =.06, p.0001; centralization, R 2 =.23, p All three contingency variable categories were also positively associated with strategies to optimize antibiotic use: coordination, R 2 =.10, p.0001; culture, R 2 =.08, p.0001; and communication, R 2 =.07, p.0001 (Chou, et al., 2008). The high degrees of formalization, centralization, and standardization in place within mechanistic organizations were an appropriate fit of structure for effectively promoting the adoption of NFID-CSC guidelines (Chou et al., 2008). Using secondary data analysis, Bacon, Hughes, and Mark (2009) examined the relationships among hospital context, nursing unit structure and patient characteristics to patients perceptions of their symptom management. Contingency was operationalized through environmental measurement (teaching status, magnet status, patient acuity and work complexity), and patient characteristics (age, gender, and previous hospitalizations). Structure was operationalized through measures of unit capacity (skill mix and RN
. While neither unit capacity, R 2 = -.152, p >.05, nor work engagement, R 2 =.047, p >.")
.")
36 25 education), work engagement (RN experience on unit and nursing expertise), and working conditions (autonomy and decision-making). Effectiveness was measured by patient perception of symptom management (Bacon, et al., 2009). While neither unit capacity, R 2 = -.152, p >.05, nor work engagement, R 2 =.047, p >.05 were significantly related to patients perceptions of symptom management, working conditions did significantly enhance patients perceptions of symptom management, R 2 =.144, p <.05 (Bacon, et al., 2009). It should also be noted that although patient characteristics were included as contingency variables, and patient age did demonstrate a significant relationship with patients perceptions of symptom management, R 2 =.082, p.001 (Bacon, et al., 2009), patient characteristics were not associated with structure in Bacon, Hughes, and Mark s model in order to satisfy the concept of fit. Use of SCT to Guide Nurse Staffing: The NSOR Model The inspiration for using SCT for the proposed study arose from McGillis-Hall s (2005) review of the theoretical frameworks used to guide nurse staffing. McGillis-Hall noted that research conducted by Mark, Salyer, and Smith used SCT to incorporate measures of nurse staffing. Mark, Salyer, and Smith (1996) proposed the Nursing Systems Outcomes Research (NSOR) model based on SCT to inform empirical studies of interest to nursing administration. Mark et al. (1996) labeled the SCT concepts as context (contingency), structure, and effectiveness (Figure 2.). Context Structure Effectiveness Figure 2. Mark, Salyer, and Smith s (1996) modification of SCT concepts
37 26 Mark et al. (1996) contend that there are two underlying assumptions of contingency theory: (a) the organization s environment and its technologies comprise its context, which must be taken into consideration by the structure of the organization subunits, and (b) not every subunit needs to adopt the same organizational structure. Mark et al. (1996) emphasized structure and context; while effectiveness may be an outcome of interest, it is not the primary focus of SCT. Nor is SCT s concept of fit a deliberate part of the NSOR model. Each of the contextual, structural, and effectiveness variables representing NSOR were specifically selected for their focus on nursing as an organizational subunit (Mark, Salyer, & Smith, 1996). They also indicated that these variables are related to current areas of nursing research interest, and are increasingly critical in nurse executive decision making (p. 15). Operationalizing NSOR Concepts In the NSOR model, the concept of context is operationalized by four hospital characteristics and four nursing unit characteristics. The four hospital characteristics are: (a) teaching status, (b) organizational size, (c) organizational life cycle, and (d) hospital technology. The four nursing unit characteristics are (a) skill mix, (b) education, (c) nursing unit technology, and (d) organizational life cycle. Teaching status (teaching / non-teaching) and organizational size (bed capacity) are self-explanatory. Organizational life cycle refers to changes in the growth or decline status of the organization over time and the resulting potential for instability and uncertainty. Hospital technology refers to the complexity of the services offered by the hospital, often affecting nursing workload.
38 27 Skill mix refers to the proportion of RNs to all nursing staff. Education is the average formal education possessed by the nursing staff on a unit. Mark et al. (1996) use Alexander and Bauerschmidt s (1987) definition of nursing unit technology: tasks employed by nursing personnel to change the status of a patient from a hospitalized patient to a discharged person (p. 17). There are three classifications of tasks associated with nursing technology: uncertainty, instability, and variability. Organizational life cycle pertaining to the nursing unit concerns growth or decline in occupancy and patient days experienced by the nursing unit itself. Structural variables are operationalized as decentralization, autonomy, nursephysician collaboration, support services. Decentralization refers to decision-making and whether it is an autocratic or participative process. Autonomy pertains to the degree of independence and discretion at the level of the individual in determining and performing work within the employee job description. Nurse-physician collaboration is associated with overall professional practice and the environmental climate. Support service pertains to work design and implementation to support the work of the nurse in providing non-nursing tasks. Effectiveness variables of concern in the NSOR model are medication administration errors, patient falls, patient satisfaction, job satisfaction, turnover, perceived team performance, and cost efficiency. However, given the diversity of patient characteristics and disease processes, any patient outcome of interest is a possible effectiveness variable (Mark et al., 1996). Knowledge development across nursing units and hospitals and the development of new methods to deploy towards the attainment of cost effectiveness are the fundamental objective (Mark et al., 1996). Table 7A (see
39 28 Appendix A) includes a summary of research preformed by Mark and colleagues using SCT / NSOR. Application of SCT for the Proposed Study To illustrate SCT for this study, consider that nursing workload, measured by hours per patient day (HPPD), is affected by the amount of activity occurring through patient movement on and off the unit in the form of admissions, discharges and transfers. This activity can be measured by the Unit Activity Index (UAI) and relates to how many times patients are turning over during any specified period. Each ADT adds incremental nursing time required to complete these activities. The amount of resources consumed by the patient can be measured by case-mix index (CMI). CMI is commonly used by hospitals as a relative measure of resource utilization and severity of illness (Friesner, Rosenman, & McPherson, 2007). It is tied to diagnosis related groupings (DRGs) and hospital costs and provides a basis for adjusting variation among differences in patient morbidity for hospital-to-hospital comparison (Kuster, et al., 2008). CMI in this study is used as a proxy measure of patient acuity. UAI and CMI become the contingencies, or contextual environment of the work performed. Nurse staffing represents a structural characteristic contained within the hospital environment (Brewer & Frazier, 1998). The application of a weight factor model to the context can be considered the technique applied to manage and control the work, thereby assisting the nurse managers to stay on target for HPPD and on budget, two organizational goals. This satisfies the fit between the contingency and structure parts of the model. The effectiveness portion of the SCT will be measured through a comparative analysis of predicted versus actual

40 29 worked hours per patient day. Although not a measure of effectiveness of this study per se, McGillis-Hall (2005) does list cost as a measure of effectiveness. Staffing costs could always be determined by calculating predicted versus actual HPPD. A representation of the SCT model applied to this study is found in Figure 3. Figure 3. Variables to be measured by this study using SCT as a theoretical framework Summary SCT is an excellent theoretical framework to guide this study because of its conceptual appeal using contingency, structure, effectiveness, and fit. Using a weight factor to effectively link CMI and UAI to HPPD will bring nurse staffing research a step closer to having an empirically based model by which to guide staff planning. Operational Terms, Definitions, and Formulas Admissions, discharges and transfers (ADTs). The number of patients admitted to, discharged from, transferred to, or transferred from a nursing unit during a defined time period such as per day or per week Average Daily Census (ADC). Midnight census Average patient length of stay (ALOS). Inpatient days (midnight census) / Inpatient discharges
41 30 Case Mix Index (CMI). A relative measure of resource utilization and severity of illness (Friesner, et al., 2007). It is tied to diagnosis related groupings (DRGs) and hospital costs and provides a basis for adjusting variation among differences in patient morbidity for hospital-to-hospital comparison (Kuster, et al., 2008). Midwest Healthcare Coding (2008) formula for CMI: (Relative Weights (payor/ provider/ time frame)) Number of patients Direct Care Providers. Includes RNs, LPNs, and UAPs who provide care to a patient Fulltime Equivalent (FTE). 40 hours paid time per week Hours per Patient Day (HPPD). The total number of worked hours by direct care providers divided by the ADC for a defined time period such as per day or per week. Typically, nursing unit staffing is reported in hours per patient day. A measure of nursing intensity. Midnight census. A count of all occupied beds on a nursing unit at midnight Nursing workload. The number of assigned patients per shift along with the required patient specific care (Walker, 1990). Patient acuity. A measure of how sick a patient is and how many resources a patient requires in terms of nursing care and treatments. Often measured through commercial or homegrown acuity systems Patient turnover. Patients who are admitted to or leave from a nursing unit. Includes admissions, discharges, and transfers in and out. Patient to Nurse (PTN) ratio. The number of patients assigned to an RN
42 31 Total treated patients. The starting census of a 24 hour period plus the number of admissions during the same 24 hour period Unit Activity Index (UAI). A ratio of ADTs to total treated patients Unlicensed Care Provider (UAP). Nursing assistants. Also referred to as CNAs or PCAs Worked hours. Number of hours worked by direct care providers on a nursing unit. Includes time worked for regular and overtime pay rates. Includes time worked by any source of direct care providers including agency/traveler staff, float pool staff, per diems, or floats from other nursing units. Does not include paid or unpaid time off unit, nor hours worked providing indirect care such as by charge nurses without a patient assignment or by UAPs providing one-to-one observation (sitter) care.
43 32 Chapter 3 Methods Introduction This study was the first to examine the relationship between patient acuity using case mix index and hours per patient day along with the relationship between patient turnover using the unit activity index and hours per patient day at the unit level. A weight factor, built upon a measure of patient acuity and patient turnover, was applied to planned hours per patient day using the weight factor decision model found in Appendix B, and to all units demonstrating a significant correlation. The annual staffing plans for each unit in the study, as well as each unit type (medical, surgical, or mixed medical-surgical), were compared for an improvement in the variance between planned and actual hours per patient day with and without incorporating a weight factor. Design A retrospective design was chosen for this quantitative study using secondary data analysis from four data sources: McKesson s ANSOS One-Staff nurse scheduling system, Medical Information Technology, Inc. (Meditech), the organization s patient information system, case mix index from the organization s Finance Department, and the organization s annual staffing plans for each unit included in the study. The daily census by shift report from Meditech provided patient days for the numerator portion of HPPD. ANSOS One-Staff was the source of worked hours by the direct care providers used for the denominator portion of HPPD. Meditech also provided the number of admissions, discharges, and transfers in and out of the unit used to calculate UAI. Case mix index, computed by the study sites Health Information
44 33 Management System (HIMS) Department and stored as part of patient information in Meditech was provided by the organization s Finance Department in the form of a Microsoft Excel spreadsheet. The organization s annual staffing plans for each study unit were used to determine if the application of a weight factor improved the variance between planned and actual HPPD. Inclusion / Exclusion Criteria Data encompassed three fiscal years: October 1, 2006 to September 30, Worked hours, patient census, and patient case mix index were obtained for inpatient acute care adult medical (n = 7), surgical (n = 4), or mixed medical units (n = 3) from the study s setting. These types of units were selected because of the public interest around staffing standards, typically focused on adult inpatient acute care units. Types of patient care units excluded from this study were critical care units, pediatric units, behavioral health units, and specialty units such as bone marrow transplant, post-anesthesia care, maternity, and emergency departments. Three fiscal years of data were used to obtain correlation results between HPPD and UAI and CMI. Two fiscal years of staffing plans were examined for an improvement in the variance between weighted and unweighted HPPD as a result of the correlational findings for this study. Fiscal year data were chosen to correspond with data reported to Massachusetts Patient CareLink (formerly Massachusetts Patients First). The fiscal year (FY) utilized by the study hospitals spans October to September. Since weekly data were used for the correlations, fiscal year periods were defined as follows: October 1, 2006 to September 29, 2007 (FY 2007), September 30, 2007 to September 27, 2008 (FY 2008) and September 28, 2008 to September 26, 2009 (FY 2009). A total of 14 units were included in the final data set for
45 34 FY 2007 and FY 2008, and 15 units were included for FY 2009, again to correspond with data submitted to Massachusetts Patient CareLink. During FY 2007, two large units were divided into smaller units. Data from the smaller units, albeit for a partial fiscal year, were reported to Massachusetts Patient CareLink. At the beginning of FY 2009, one large mixed medical-surgical unit was divided into two separate units; one became a surgical unit and the other remained a mixed medical-surgical unit. Setting and Sample Size Data were obtained from a large healthcare organization located in central Massachusetts. There were two data samples. The first sample, used for Aim 1, was for the correlation of CMI and UAI with HPPD. This consisted of 3 years of weekly data from each of the study units. Data was examined at the unit level and aggregated by unit type; medical, surgical, or mixed medical-surgical to correspond with the same typology utilized by Patient CareLink. Total number of data was 2,004 weeks. A breakdown of unit type and unit level numbers of data used in this study can be found in Table A8 (see Appendix A). Each unit s weekly data consisted of the computed HPPD as the dependent variable, and the corresponding CMI and UAI for that same week as independent variables. In addition to the first sample, a second sample was utilized, based on the findings from the correlation analysis. Annualized CMI and UAI data from each previous fiscal year were used as unit type specific weight factors applied to the following fiscal year s staffing plan in preparation for the analysis stipulated by Aim 3. A representation of the sample sizes and how each will be used can be found in Table A9 (see Appendix A).
46 35 Measures and Procedures A typical staffing plan is a visual representation of how many RNs, LPNs, and UAPs are needed by shift and by day of the week to provide care for the average daily census (ADC), or the average number of patients expected to be on the unit each day. The planned ADC is calculated from the unit s planned annual patient days. The hospital s finance department determines the annual patient days based on the organization s business assumptions for the forthcoming year. It can be ascertained how many hours of work per week are deemed necessary from the staffing plan. The total number of work hours per week can then be divided by the ADC to obtain the HPPD. Only direct care providers (RNs, LPNs, and UAPs) are counted for HPPD. An example of a staffing plan can be found in Appendix C. Actual worked hours by direct care providers were obtained from ANSOS/OneStaff, the hospital s nurse staffing and scheduling system. Worked hours included any regular and overtime hours worked; they did not include non-worked hours such as sick time, vacation time, or time spent at seminars or meetings. In order to compute the UAI, actual census and number of admissions, discharges and transfers (ADTs) were obtained from Meditech, the hospitals patient information system. A daily report was available that indicated the ADTs by unit and by shift, along with the ADC. UAI is the ratio of ADTs to total treated patients (Jacobson, et al., 1999; Wagner, Budreau, & Everett, 2005). The denominator of total treated patients is derived from the average midnight census plus the average ADTs. For this study UAI was computed as the number of ADTs per week for each specific unit divided by the number of total treated patients per week for that same unit.
47 36 There was no patient acuity system used by nursing in the sample hospitals. Therefore, in order to have a measure of patient acuity, case mix index was used. Case mix index is commonly used by hospitals not only for Medicare cases as a relative measure of resource utilization and severity of illness (Friesner, et al., 2007), but CMI is also typically used for all hospital cases (McCue, Mark, & Harless, 2003). The advantage of using case mix index as a proxy measure for patient acuity is that it provides standardization (Brennan & Daly, 2009; Seago, et al., 2006; Upenieks, Akhavan, Kotlerman, Esser, & Ngo, 2007). This eliminates the subjectivity found in patient acuity systems where the data is entered by the nurses (Campbell, Taylor, Callaghan, & Shuldham, 1997). The disadvantage is that case mix index does not capture individual patient complexity data at a specific point in time. Rather, it is an aggregate of the consumption of resources over the patient s entire length of stay (Petryshen, et al., 1995). Case mix index is tied to diagnosis related groupings (DRGs) and hospital costs and provides a basis for adjusting variation among differences in patient morbidity for hospital-to-hospital comparison (Kuster, et al., 2008). Inpatients are assigned a DRG based on diseases and procedures. Each DRG has a weight that is used to calculate case mix. The DRGs and relative weights are assigned by trained and certified coders in the Health Information Management System (HIMS) Department (formerly known as Medical Records). It is in the hospital s best interest to ensure accurate coding in order to not only receive the correct reimbursement, but also to be accurately risk adjusted when submitting quality data for quality ratings and rankings among other hospitals (Rangachari, 2007). Commercial software, such as 3M Encoder, is used to assign DRGs,
48 37 based on coder input of extracted physician diagnoses and procedure code data from the medical record. Additional software tools, such as PwC s Systematic Monitoring and Review Technique (SMART) can be programmed to identify outliers for manual review. Other audits to ensure data accuracy are conducted periodically, both by in-house personnel (such as from the Office of Compliance) and by external third party payers. Once the DRG coding has been finalized, the organization s Finance Department calculates the CMI based on the relative weight data assigned by the coding software according to the formula below and the results are stored as part of patient information in Meditech. The formula (Midwest Healthcare Coding) for CMI is: (Relative Weights (payor/ provider/ time frame)) number of patients CMI data for each week for each unit included in the study were provided to the principle investigator by the Finance Department on a Microsoft Excel spreadsheet Staffing data were available for each week of the study period along with patient turnover data and case mix index data for each study unit. Full fiscal years data were not available for some units due to changes in the unit composition during the year and are noted in Table A8. All data were cleaned for obvious outliers and corrections were made. No further data were excluded following corrections to outliers. Data were further screened for meeting the assumptions for parametric data use. Two basic assumptions for using parametric data are that data should be normally distributed and there should be homogeneity of variance (Field, 2005). Histograms were run for all variables, both aggregated by unit type and aggregated by fiscal year as well as by individual units in order to identify obvious outliers.
49 38 Data Management Data was managed through the purchase of a secure research drive access to store de-identified data in the form of Microsoft Excel (2007) spreadsheets, SPSS (16.0.1) data sheets, and SPSS (16.0.1) output sheets. The research drive is a network drive hosted by the University of Massachusetts, Worcester and is backed up nightly. In addition, data backup was provided in the form of an external flash drive provided to two of three committee members in the unlikely event of a system failure. Data Collection and Analysis: Aim 1 The first aim of this study sought to establish relationships between patient acuity (using CMI) and HPPD and between patient turnover (using UAI) and HPPD. This relationship can be positive or negative. Tests for normalities of data were performed, including homogeneity of data (such as histograms) and degree of skewness (such as the KS test). Correlations were performed using Pearson r. Two sets of correlations were run: the first set examined relationships between HPPD and UAI and the second set examined relationships between HPPD and CMI. Each row of data consisted of a week ending date, unit name, and case mix index. To calculate patient turnover using UAI, the number of patient days, the number of patient admissions and transfers into the unit, the number of patient discharges and transfers from the unit, and midnight census were imported from the Meditech Daily Census report. Data were then imported into a Microsoft Excel spreadsheet in order to perform the calculations. Data needed to calculate HPPD was downloaded from ANSOS One-Staff through the application s report writer and consisted of date, unit name, regular hours
50 39 worked by direct care providers, and any overtime hours worked by direct care providers. The formula for determining HPPD was the total number of patient days divided by total worked hours for a specified period. For the purposes of this study, data from the Meditech Daily census report and from ANSOS One-Staff were aggregated into weekending dates in order to be linked to the CMI data. To arrive at data by weekending date, HPPD was calculated as the sum of regular worked hours per week for each unit plus the sum of overtime hours worked per each week for each unit divided by the sum of patient days per each week for each unit. The UAI was calculated as the sum of admissions, discharges, and transfers (ADTs) divided by the average midnight census for each unit for each week plus the average ADTs for each unit for each week. ADTs were calculated as the number of patient admissions and transfers into each unit for each week, plus the sum of patient discharges and transfers out of each unit for each week. The Microsoft Excel spreadsheets containing CMI data, patient census data, and direct care provider worked hours data were brought together into a Microsoft Access (2007) database via a series of tables and queries prior to importing to SPSS (16.0.1). Tables A10 and A11 (see Appendix A) contain the variables, tables, and queries that needed to be brought together into one query for import into SPSS (16.0.1), represented in Table A12 (see Appendix A). Data Collection and Analysis: Aim 2 The second Aim sought to examine the fit between the contingencies of case mix index and unit activity index on the structure of hours per patient day, utilizing them as weight factors for building a more accurate predictive annual staffing plan. Two different
51 40 weight factors were derived in order to examine the moderating effects of CMI and UAI on HPPD. Weighting is the act of adding emphasis to measures (Agency for Healthcare Research and Quality, 2003). There are no standardized methods for applying weights. Weights may be determined a priori and then applied to a model, or can be derived empirically (Davis & Sauser, 1993). However, weighting measures are most often determined subjectively through expert judgment (Agency for Healthcare Research and Quality, 2003). When modeling data, as is the case in this study, a measure of uncertainty should be included in the analysis. This uncertainty is expressed by means of a weight (or emphasis) (Bourne, 2003, p ). Both case mix index and patient turnover add uncertainty to hours per patient day ultimately worked, and thus were used to derive the weight that was used to adjust HPPD. The first weight factor was derived from calculating the slope intercept from the linear regression of CMI and UAI. The formula used was the regression coefficient b for the dependent variable (HPPD) plus the regression coefficient b for the first independent variable (UAI) multiplied by the mean UAI from same fiscal year + the regression coefficient b for the second independent variable (CMI) multiplied by the mean CMI from same fiscal year divided by the planned HPPD. The weight factors derived from this method are found in Table A13 (see Appendix A). The second method of weighting consisted of taking each nursing unit s annual case mix index and multiplying it by its annual unit activity index, grouped within its unit type (medical, surgical, and mixed medical-surgical). The product of CMI and UAI was used to subtract the as yet unknown weight divided by -1 represented by the formula CMI
52 41 x UAI-(x/-1) where x is the unknown weight. Then through a series of trial and error, a number always less than one was inserted into the formula to represent a weight until the products of each unit s CMI x UAI summed to zero. Once the sums of each unit s products of CMI x UAI reached zero, the weight was multiplied by -1 to make it a positive number. This process was repeated for the three unit types: medical, surgical, and mixed medical-surgical. The weight factors derived from this method are found in Table A14 (see Appendix A). These two weighting methods were examined for similarities and differences in their results. This was an important step because replication of this method is desired for establishing future generalizability. Similar results mean that determining weight factors from a Microsoft Excel spreadsheet would be easier to replicate for nurse managers than using more complex statistical software and formulas. Applying the Weight Factor Model Each nursing unit s average annual case mix index and unit activity index that had been calculated and used for determining the weight factor were examined to know whether or not to adjust a staffing plan s HPPD through the application of the weight factor. In accordance with the decision model found in Appendix B, if a unit had both a higher than average CMI and a higher than average UAI among its unit type cohort, the specific unit type weight factor was added to the specific unit type HPPD used in constructing the unit s annual staffing plan. For example, if the HPPD used for medical units was set at 8.57 and Unit A had a higher than average UAI and CMI within its cohort of all medical units, and a weight factor of 0.72 had been derived for the medical unit
53 42 cohort, the weight factor of 0.72 would be added to the HPPD set at 8.57 giving Unit A a new target HPPD of 9.29 ( ) from which to construct a staffing plan. If a unit had both a lower than average CMI and lower than average UAI among its unit type peers, the unit type specific weight factor was subtracted from HPPD for use in building the unit s annual staffing plan. For example, if the HPPD used for medical units was set at 8.57 and Unit B had both a lower than average UAI and lower than average CMI within its cohort of all medical units, and a weight factor of 0.72 had been derived for the medical unit cohort, the weight factor of 0.72 would be subtracted from the HPPD set at 8.57 giving Unit B a new target HPPD of 7.85 ( ) from which to construct a staffing plan. If a unit has a lower than average CMI but a higher than average UAI among its type peers, the type specific weight factor will be ignored and only the specific unit type HPPD would be used for constructing the unit s annual staffing plan. For example, if the HPPD used for medical units was set at 8.57 and Unit C had a lower than average CMI but a higher than average UAI within its cohort of all medical units, Unit C would use the HPPD set at 8.57 from which to construct a staffing plan. Conversely, if a unit has a higher than average CMI but a lower than average UAI among its type peers, the type specific weight factor will be ignored and only the specific unit type HPPD would be used for constructing the unit s annual staffing plan. For example, if the HPPD used for medical units was set at 8.57 and Unit D had a higher than average CMI but a lower than average UAI within its cohort of all medical units, Unit D would use the HPPD set at 8.57 from which to construct a staffing plan.
54 43 Data Collection and Analysis: Aim 3 The third and final aim was to determine if there were differences in variance between weighted and unweighted planned HPPD and actual HPPD. Each unit s annual staffing plan was used as the source for the originally planned HPPD. Data collected for Aim 1 will serve as the source for actual HPPD for each unit for each year in the study. Adjusted HPPD will be obtained from the application of the weight factor specified by Aim 2. Both weighted and unweighted planned HPPD will be compared against the actual for each unit and by unit type. Variance between unweighted planned HPPD and actual HPPD along with weighted HPPD and actual HPPD will be examined. In addition, a simple count of the number of weeks HPPD was on target (within 5% of planned per Massachusetts Patients First parameters) with and without a weight factor applied by unit and by unit type was presented. Methodological Issues Secondary data use. Secondary data are those which are utilized for a purpose other than for what they were originally intended when collected (Nicoll & Beyea, 1999), (Polit & Beck, 2008). The original data may not have been collected for research purposes at all, such as census data. However, secondary data are an excellent source of variables for use when conducting new and exploratory research (Nicoll & Beyea, 1999). Using secondary data is often cost efficient and time effective (Magee, Lee, Giuliano, & Munro, 2006). Variables in the original dataset used as independent variables can become dependent variables in a new study (Polit & Beck, 2008). For this study, HPPD was used as the dependent variable unlike in other studies where it has been used as the predictor or independent variable.
55 44 When using secondary data, it is imperative that the researcher examine the data for actual or potential errors. Each variable to be used in the researcher s new study must be reviewed for quality, integrity and accuracy. Data entry is error prone and error in large datasets is commonplace (Maletic & Marcus, 2000). When errors are found, the researcher must have an established a priori plan for addressing them. For example, if the secondary data contains records from the year 2006 and an entry of 2060 is found, should an assumption be made that the 0 and 6 have been transposed? Or should this record not be included? If a blank field is found, should the missing data be imputed or discarded? The researcher needs to ask how much data can be safely imputed without compromising integrity (Moody & McMillan, 2002). The mixing and matching of data sources can also have an impact on research. For example, taking staffing data from one source and linking them to patient outcomes from a different source should be considered as a potential source of error when examining findings (Donaldson, Brown, & Aydin, 2001; Mark, 2006). The researcher must be very careful to ensure the congruence of data if using different sources, such as date linking, unit linking, or hospital linking. Because the researcher does not define the data, when using secondary data there must be a match between concepts of the proposed research s theoretical framework and the variables to be used (Magee, et al., 2006). The importance of using a theoretical or conceptual framework to guide data analysis using secondary data cannot be overemphasized (Magee et al., 2006; Mark, 2006). Nurse Staffing Research There are specific methodological issues concerning nurse staffing research in addition to the issues inherent in using secondary data sources. Mark (2006) outlined
56 45 several issues that researchers must heed; (a) lack of well-developed theories to guide research, (b) different databases using different staffing definitions, and (c) risk adjustment differences. There is no standardization in the measuring, collecting, or reporting of nurse staffing (Welton, Zone Smith, & Bandyopadhyay, 2009). Typically, hours used to measure HPPD on acute care medical surgical units consist of regular and overtime hours worked by direct care providers i.e. RNs, LPNs, and UAPs. However, California s Office of Statewide Health Planning and Development (OSHPD) database includes meeting time and educational activities internal or external to the hospital in addition to regular and overtime hours worked (Office of Statewide Health Planning and Development, 2009). FTEs can be reported as 40 hour per week employees or 36 hour per week employees. The difference between 40 hours per week per year versus 36 hours per week per year is 208 hours per year. This equates to one less FTE for every 10 employees if, in the absence of database field definitions, the researcher assumes an FTE to be 40 hours. Risk adjustments, such as disparate patient acuity measures, are also subject to validity questions. O'Brien-Pallas, Cockerill, and Leatt (1992) found a difference of 4.53 HPPD when applying four different acuity classification systems to the same patients. Mark (2006) offers three defenses to guard against threats to internal validity when conducting research in the area of nurse staffing: (a) using a well-developed theoretical framework or conceptual model to guide the study, (b) using reliable and valid data, and (c) using a valid, purposeful risk adjustment method consistent with the aims of the study.
57 46 For this study, the principle investigator was well acquainted with the data sources, definitions, and usage. Although there may have been minor errors in data coding inherent in all large datasets, gross errors had been discovered and corrected because the data sources had been used and validated for previous internal and external reporting by the included study units. Case mix index is a nationally accepted measure used by all inpatient hospitals. Unit activity index has been well-documented in the literature. A well-described theoretical framework had been established and connected to the specific aims in order to guide the study, outlined in Table A15 (see Appendix A) Human Subjects Issues No identifiable patient information was used. No identifiable employee information was used. Nursing units were de-identified and referred to by a letter and described as medical, surgical, or mixed medical-surgical unit type. An exempt IRB review was granted. There were no inherent risks to this study that have as yet been identified. Summary The creation of a predictive staffing model that incorporates the complexities of patient acuity and patient turnover is very challenging. Ultimately, finding a staffing model that results in less variance between planned and actual HPPD will enable nurse managers to stay on budget, reduce overtime, and provide staff with a more manageable workload.
58 47 Chapter 4 Results Introduction This chapter contains descriptive statistics of all data used in this study, organized by specific aim. Findings of correlations between the dependent variable, hours per patient day (HPPD) and the two independent variables, unit activity index (UAI) and case mix index (CMI) will be described. The derivation of a weight factor, using two different methods, for use in adjusting planned HPPD will be presented. The findings from adjusting planned HPPD from the application of two different weight factors using two different decision models will also be presented. Descriptive Data A total of 2,004 weeks of data were examined from all units included in the study: 900 weeks of medical unit data, 638 weeks of surgical unit data, and 466 weeks of mixed medical-surgical unit data. For individual units across all 3 years, weeks of data ranged from 50 (one partial fiscal year) to 156 (3 years of 52 weeks each). For individual units within a fiscal year, data ranged from 34 weeks (four units reporting partial fiscal years) to full fiscal year reporting of 52 weeks per unit. Specific unit and aggregated data relative to inclusion numbers can be found in Table A8. This study s dependent variable, hours per patient day (HPPD) ranged from 6.51, n = 52 on a mixed medical-surgical unit in FY 2007 to 14.68, n = 52 on a surgical unit in FY Mean HPPD ranged from 7.80, n =52 on a mixed medical-surgical unit in FY 2007 to 10.29, n = 52 on a surgical unit in FY Standard deviations for HPPD ranged from 0.31, n = 52 on a surgical unit in FY 2007 to 1.11, n = 52 on a surgical unit
59 48 in FY Median HPPD ranged from 7.66, n = 52 on a mixed medical-surgical unit in FY 2007 to 10.28, n = 52 on a surgical unit in FY Medical unit HPPD ranged from 6.72 to 12.46, N = 900, with a mean span of 8.70 to 9.46, an overall mean difference of 14 minutes. Surgical unit HPPD ranged from 7.23 to 14.68, N = 638 with a mean span of 8.88 to 9.70; an overall mean difference of nearly one hour. Mixed medical-surgical unit HPPD ranged from 6.51 to 10.94, n = 466 with a mean span of 8.37 to 9.07; an overall mean difference of only approximately 26 minutes. A full description of HPPD findings, including means, standard deviations, medians, and ranges by unit and by fiscal year can be found in Tables A16, A17, and A18 (see Appendix A). Unit activity index (UAI), the measure of patient turnover and the first independent variable of this study, ranged from 25%, n = 52 on a medical unit in FY 2008 to 72%, n = 52 on a surgical unit in FY Mean UAI ranged from 25%, n = 52 on a mixed medical-surgical unit in FY 2008 to 72%, n = 52 on a surgical unit in FY The range of standard deviations for UAI was small: 0.04 to Nine units, n= 466 had standard deviations of Surgical units, n = 258, aggregated across FY 2009 had a standard deviation of Median UAI ranged from 38%, n = 52 on a medical unit in FY 2007 to 57%, n = 52 on a surgical unit in FY Medical unit UAI ranged from 25% to 69%, n = 900, with a mean span of 46% to 47%, an overall mean difference of just 1%. Surgical unit UAI ranged from 27% to 72%, n = 638 with a mean span of 48% to 50%, a mean difference of 2%. Mixed medicalsurgical unit UAI ranged from 32% to 68%, n = 466 with a mean span of 47% to 49%, again a mean difference of just 2%. A full description of UAI findings, including means,
60 49 standard deviations, medians, and ranges by unit and by fiscal year can be found in Tables A19, A20, and A21 (see Appendix A). Case mix index (CMI), the proxy measure of patient acuity and this study s second independent variable, ranged from , n = 52 on a medical unit in FY 2007 to , n = 52 on a mixed medical-surgical unit also in FY Mean CMI ranged from , n = 52 on a medical unit in FY 2009 to , n = 52 on a surgical unit in FY Standard deviations for CMI ranged from 0.11, n = 104 on the same mixed medical surgical unit for both FY 2007 and FY 2008 to 0.59, n = 52 on a mixed medical-surgical unit in FY Medical unit CMI ranged from to , n = 900 with a mean span of to Surgical unit CMI ranged from to , n = 638 with a mean span of to Mixed medical-surgical unit CMI ranged from to , n = 466 with a mean span of to A full description of CMI findings, including means, standard deviations, medians, and ranges by unit and by fiscal year can be found in Tables A22, A23, and A24 (see Appendix A). Histograms and box plots for the aggregates of all units and unit types are presented in Appendix D. Histograms and box plots for individual units are not shown, but no obvious problems requiring data transformation were noted. Findings for Specific Aim 1 Aim 1 sought to examine the correlation between patient acuity (using case mix index) and patient turnover (using unit activity index) as contingencies on the structure of worked hours per patient day. Results of these data can be found in Tables A25, A26, and A27 (see Appendix A). Although significant correlations (p 0.01) between HPPD and
61 50 UAI were found among all units when aggregated across all years, and for each individual fiscal year, the maximum strength of these relationships was only r 2 =0.133, N = 676 for FY Although significant correlations (p 0.01) between HPPD and CMI were found among all units when aggregated across all years, and for each individual fiscal year, the maximum strength of these relationships was only r 2 =0.112, N = 604 for FY Correlation Findings by Unit Type Significant but weak correlations, p 0.01, r , n = 900 between HPPD and UAI were found among all medical units when aggregated across all years and for each individual fiscal year. A significant but weak correlation, p 0.01, r 2 = 0.130, n=312 between HPPD and CMI was found among all medical units only for FY A significant but weak correlation, p 0.05, r 2 = 0.007, n = 900 between HPPD and CMI was found across all medical units aggregated among fiscal years. Again, significant but weak correlations, p 0.01, r , n = 638 between HPPD and UAI were found among all surgical units when aggregated across all years and for each individual fiscal year. Aggregated data among all surgical units showed a strong significant correlation between HPPD and CMI, p 0.01, r 2 = 0.309, n = 172 only for FY Otherwise, significant but weak correlations, p 0.01, r , n = 466 between HPPD and CMI were found among all surgical units when aggregated across all years and for each individual fiscal year. Significant but weak correlations, p 0.01, r , n = 310 between HPPD and UAI were found among all mixed medical-surgical units only for FY 2008 and FY Significant but weak correlations, p 0.01, r 2 = 0.097, n=310 between HPPD and
62 51 CMI was found among mixed medical-surgical units only for FY FY 2009, and aggregated across all years. A significant but weak negative correlation, p 0.05, r 2 = 0.034, n=156 between HPPD and CMI was found aggregated across all medical units for FY This was the only significant negative correlation within unit type data. All other significant correlations were positive. Correlation Findings Between HPPD and UAI by Individual Units Medical units. All six medical units demonstrated significant but overall weak correlations, p 0.01, r , n = 744 between HPPD and UAI when aggregated across all years with the exception of Unit F. Unit F showed a significant correlation of p 0.01 with a magnitude of r 2 =0.275, n = 156. Two medical units demonstrated significant correlations between HPPD and UAI for each fiscal year. The remaining four medical units demonstrated significant findings for 2 of the 3 fiscal years included in this study. All significant associations were positive. FY Four medical units demonstrated significant correlations (p 0.01) between HPPD and UAI for FY Effect size ranged from r2 = 0.131, n = 52 to r2 = 0.326, n = 34. One medical unit demonstrated significant correlation at p 0.05, but weak effect, r2 = One medical unit, Unit A, showed no significant correlation at all between HPPD and UAI for FY All significant associations were positive. FY Four medical units demonstrated significant correlations (p 0.01) between HPPD and UAI for FY Effect size ranged from r 2 = 0.155, n = 52 to r 2 = 0.306, n = 52. One medical unit demonstrated significant correlation at p 0.05, but weak effect, r 2 = One medical unit, Unit B, showed no significant correlation at all between HPPD and UAI for FY All significant associations were positive.
63 52 FY Again, four medical units demonstrated significant correlations (p 0.01) between HPPD and UAI for FY Effect size ranged from r 2 = 0.157, n = 52 to r 2 = 0.255, n = 52. Two medical units showed no significant correlation between HPPD and UAI. All significant associations were positive. Surgical units. Three of the five surgical units demonstrated significant but overall weak correlations, p 0.01, r , n=326 between HPPD and UAI when aggregated across all years. Two surgical units demonstrated significant correlations between HPPD and UAI for each fiscal year. One surgical unit demonstrated significant findings for the a year it was included in this study. The remaining two surgical units demonstrated significant findings for one of the 3 fiscal years included in this study. All significant associations were positive. FY One surgical unit demonstrated a significant and strong correlation, p 0.01, r 2 =.0.391, n = 34 between HPPD and UAI for FY One surgical unit demonstrated a significant but weak correlation at p 0.05, r 2 = The remaining two surgical units included in FY 2007 showed no significant association at all between HPPD and UAI. All significant associations were positive. FY Two of four surgical units included in FY 2008 demonstrated significant p 0.01 and strong correlations between HPPD and UAI, r 2 = 0.284, n = 52 and 0.254, n = 52 respectively. An additional surgical unit showed a significant but weak relationship between HPPD and UAI, p 0.01, r 2 = 0.168, n = 52. The remaining surgical unit included in FY 2008 data showed no significant association between HPPD and UAI. All significant associations were positive.
64 53 FY Five surgical units were included in FY 2009 data. Only one surgical unit demonstrated a significant but weak correlation at the p 0.01 level, r2 = 0.148, n = 50 between HPPD and UAI. Three surgical units demonstrated significant but weak correlations at p 0.05, r , n = 156. The remaining surgical unit showed no significant association between HPPD and UAI. All significant associations were positive. Mixed medical-surgical units.there was no association between HPPD and UAI when data was aggregated across all mixed medical-surgical units across all 3 fiscal years. Two of the four mixed medical-surgical units demonstrated significant but weak correlations, p 0.01, r 2 = 0.123, n = 156 and p 0.05, r 2 = 0.032, n = 154 between HPPD and UAI for FY 2008 and FY 2009 respectively. All significant correlations were positive. FY Only three mixed medical-surgical units were included in the findings for FY One mixed medical-surgical unit demonstrated a significant but weak correlation, p 0.01, r2 = between HPPD and UAI for FY One mixed medical-surgical unit demonstrated a significant but weak correlation at p 0.05, r2 = The remaining mixed medical-surgical unit showed no significant association between HPPD and UAI for FY Both significant correlations were positive. FY All three mixed medical-surgical units included in FY 2008 data demonstrated significant but weak correlations, p 0.01, r , n = 156 between HPPD and UAI. All significant correlations were positive.
65 54 FY None of the three mixed medical-surgical units showed any significant association between HPPD and UAI, despite the significant but weak association demonstrated at the aggregated unit type data level. Correlation Findings Between HPPD and CMI by Individual Units Medical units. There were no significant associations found between HPPD and CMI for individual medical units across all fiscal years despite the significant but weak negative association demonstrated at the aggregated medical unit data level. FY There were no significant associations found between HPPD and CMI for medical units for FY FY One medical unit demonstrated a significant but weak positive correlation was found, p 0.05, r2 = 0.078, n = 52. The five remaining medical units showed no association between HPPD and CMI for FY FY One medical unit demonstrated a significant but weak negative correlation was found, p 0.01, r2 = 0.134, n = 52. The five remaining medical units showed no association between HPPD and CMI for FY Surgical Units. There were no significant associations found between HPPD and CMI for individual surgical units across all fiscal years despite the significant but weak positive association demonstrated at the aggregated medical unit data level. FY One surgical unit demonstrated a significant but weak positive correlation was found, p 0.05, r2 = 0.143, n = 34. The five remaining medical units showed no association between HPPD and CMI for FY 2007.
66 55 FY One surgical unit demonstrated a significant but weak positive correlation was found, p 0.05, r2 = 0.112, n = 52. The five remaining medical units showed no association between HPPD and CMI for FY FY There were no significant associations found between HPPD and CMI for surgical units for FY Mixed medical-surgical units. No significant correlations were found for any individual mixed medical-surgical units for any of the 3 fiscal years. Findings for Specific Aim 2 Specific Aim 2 sought to examine the fit between the contingencies of case mix index and unit activity index on the structure of hours per patient day, utilizing them as weight factors for building a more accurate predictive annual staffing plan, pending the findings from Specific Aim 1. The findings in Aim 1 demonstrated significant correlations between UAI and HPPD for medical and surgical units for each of the 3 fiscal years represented by this study, and for 2 of the 3 fiscal years for mixed medical-surgical units. Significant correlations between CMI and HPPD were found for medical units for one of the three fiscal years, all 3 fiscal years for the surgical units, and all 3 fiscal years for the mixed medical-surgical units. A review of these findings can be found in Tables A25, A26, and A27, (see Appendix A). There was a predominance of significant findings for each unit type for each fiscal year, therefore we proceeded with deriving a weight to apply to staffing plans. Two approaches towards building a weight factor had been proposed. The first one was the use of linear regression using CMI and UAI. The regressed HPPD divided by the
67 56 budgeted HPPD for each unit type was used as a weight factor. The alternative method for deriving a weight consisted of taking each individual unit s annual case mix index multiplied by its annual unit activity index, grouped within its unit type (medical, surgical, and mixed medical-surgical), and inserting a number less than 1 until the sum of the products of each individual unit s CMI x UAI equals 0. The resulting number was multiplied by -1 to make it a whole number. This method is explained in further detail in Appendix F. Residuals in the form of histograms, P-P plots, and scatter plots were examined for data issues for all unit types for all fiscal years. Collinearity diagnostics were also examined for all unit types for all fiscal years. Results can be seen in Appendix F. Findings from Using Linear Regression to Derive a Weight Factor Using linear regression to derive a weight factor resulted in to adjust planned HPPD to better predict actual HPPD for medical units in FY A weight factor of was computed to use to adjust planned HPPD to better predict actual HPPD for medical units in FY No data were available from FY 2006 to be used to predict FY Using linear regression to derive a weight factor resulted in to adjust planned HPPD to better predict actual HPPD for surgical units for FY A weight factor of was computed to use to adjust planned HPPD to better predict actual HPPD for surgical units in FY No data were available from FY 2006 to be used to predict FY Using linear regression to derive a weight factor resulted in to adjust planned HPPD to use to better predict actual HPPD for mixed medical-surgical units for
68 57 FY A weight factor of was computed to adjust planned HPPD to better predict actual HPPD for mixed medical-surgical units in FY No data were available from FY 2006 to be used to predict FY Table A13 (see Appendix A) contains detailed data regarding computations used to derive a weight factor from the use of linear regression. Findings From Using an Alternative Method to Derive a Weight Factor Using the alternative method of multiplying unit level CMI by UAI and zeroing out the products by the application of a number through trial and error resulted in a weight factor of to use to adjust planned HPPD to better predict actual HPPD for medical units for FY A weight factor of was computed to use to adjust planned HPPD to better predict actual HPPD for medical units in FY No data were available from FY 2006 to be used to predict FY Using the alternative method of multiplying unit level CMI by UAI and zeroing out the products by the application of a number through trial and error resulted in a weight factor of to use to adjust planned HPPD to better predict actual HPPD for surgical units for FY A weight factor of was computed for use to adjust planned HPPD to better predict actual HPPD for surgical units in FY No data were available from FY 2006 to be used to predict FY Using the alternative method of multiplying unit-level CMI by UAI and zeroing out the products by the application of a number through trial and error resulted in a weight factor of to use to adjust planned HPPD to better predict actual HPPD for mixed medical-surgical units for FY A weight factor of was computed to
69 58 use to adjust planned HPPD to better predict actual HPPD for mixed medical-surgical units in FY No data were available from FY 2006 to be used to predict FY Table A14 (see Appendix A) contains detailed data regarding computations used to derive a weight factor from the multiplying unit-level CMI by UAI and zeroing out the products. Findings for Specific Aim 3 Specific Aim 3 sought to examine the effectiveness of using the weight factors derived through Aim 2 by examining the differences in variance between weighted and unweighted staffing plans. Since data were unavailable from FY 2006 to derive a weight factor for use in applying to FY 2007 planned versus actual HPPD, this analysis was conducted for FY 2008 and FY 2009 only. FY 2007 weight factor results were applied to FY 2008 planned HPPD and compared to FY 2008 actual HPPD. There were 13 units in the FY 2008 analysis: six medical units, four surgical units, and three mixed medicalsurgical units. FY 2008 weight factor results were applied to FY 2009 planned HPPD and compared to FY 2009 actual HPPD. There were 14 units in the FY 2009 analysis: six medical units, five surgical units, and three mixed medical-surgical units. One large mixed medical-surgical unit from the FY 2008 cohort was divided into two units (one remained a mixed medical-surgical unit and one became a surgical unit) at the beginning of FY All HPPDs were weighted according to the decision model found in Appendix B. Units with equal to or higher than average within unit type CMI and UAI were given additional HPPD through the application of the weight factor for the unit type. Units with
70 59 lower than average CMI and UAI had HPPD subtracted from the planned by using the same weight factor for the unit type. Units that were equal or above average in either UMI or CMI, but not both, were left at their originally planned HPPD. Findings for FY 2008 Adjustments Neither method adjusted the planned HPPD to within the tolerance of +/- 5% variance established by the Massachusetts Patient CareLink in every case. Only one mixed medical-surgical unit was on target for FY 2008 prior to weight adjustments. According to the decision making model, one medical unit and one surgical unit met the criteria of having both higher CMI and UAI than the unit type mean and a weight adjustment was added to the planned HPPD. One medical unit, two surgical units and one mixed medical-surgical units had lower CMI and UAI than their respective unit type means and had the weight adjustment factor subtracted from their planned HPPD. Of the seven remaining units who received no adjustment to their planned HPPD, three units (two medical and one mixed medical-surgical) had higher CMI than their respective unit type mean and four units (two medical, one surgical, and one mixed medical-surgical) had higher UAI than their respective unit type mean. Following weight adjustments using the decision model, two additional units (one medical and one surgical) were brought within target using weights derived through linear regression. The medical unit changed from a 7.40% variance to a -3.74% variance with the application of the regressed weight. The surgical unit changed from an 8.26% variance to a -2.20% variance using the same weight method. The same two units were also brought within target by using the alternative method of weighting. The medical unit changed from a 7.40% variance to a 0.67%
71 60 variance with the application of the alternative weight. The surgical unit changed from an 8.26% variance to a -2.36% variance using the same weight method. For the one medical, two surgical, and one mixed medical-surgical units requiring a subtraction of the weight adjustment factor for having lower CMI and UAI than their respective unit type means, no units were brought within target using either weight adjustment method. For units requiring a subtraction of a weight factor according to the decision model, resulting adjusted HPPD was worse in all cases following adjustments. For the medical unit, pre-adjustment HPPD variance from planned was 24.11%. Following HPPD adjustment using regressed weighting, the HPPD variance from planned was 42.59%. Following HPPD adjustment using the alternative weighting method, the HPPD variance from planned was 34.16%. For the two surgical units, pre-adjustment HPPD variances from planned were 10.40% and 13.22%. Following HPPD adjustment using regressed weighting, the HPPD variances from planned were 26.88% and 28.23% Following HPPD adjustment using the alternative weighting method, the HPPD variances from planned were 27.20% and 28.52%. For the mixed medical-surgical unit, pre-adjustment HPPD variance from planned was 13.84%. Following HPPD adjustment using regressed weighting, the HPPD variance from planned was 31.86%. Following HPPD adjustment using the alternative weighting method, the HPPD variance from planned was 23.71%. Findings for FY 2009 Adjustments In FY units were on target for FY 2008 prior to weight adjustments: five of the six medical units, three of the five surgical units, and two of the three mixed
72 61 medical-surgical units. Neither weight factor method adjusted the planned HPPD to within the tolerance of +/- 5% variance established by the Massachusetts Patient CareLink when adjustments were made following the decision model. However, one medical unit s on target performance was improved from 4.07% to -2.70% using the alternative method of weight adjustment. This is in contrast to the linear regression method of weighting which resulted in an adjusted HPPD variance from planned of %. According to the decision making model, one medical unit and one surgical unit met the criteria of having both higher CMI and UAI than the unit type mean and a weight adjustment was added to the planned HPPD. One surgical unit and one mixed medicalsurgical units had lower CMI and UAI than their respective unit type means and had the weight adjustment factor subtracted from their planned HPPD. Of the 10 remaining units who received no adjustment to their planned HPPD, four units (two medical, one surgical, and one mixed medical-surgical) had higher CMI than their respective unit type mean and six units (three medical, two surgical, and one mixed medical-surgical) had higher UAI than their respective unit type mean. One surgical and one mixed medical-surgical units requiring a subtraction of the weight adjustment factor for having lower CMI and UAI than their respective unit type means. No medical units met the criteria for subtraction. No units were brought within target using either weight adjustment method. For units requiring a subtraction of a weight factor according to the decision model, resulting adjusted HPPD was worse in all cases following adjustments.
73 62 For the surgical unit, pre-adjustment HPPD variance from planned was 4.05% (on target). Following HPPD adjustment using regressed weighting, the HPPD variance from planned was 18.33%. Following HPPD adjustment using the alternative weighting method, the HPPD variance from planned was 17.35%. For the mixed medical-surgical unit, pre-adjustment HPPD variance from planned was -0.94% (on target). Following HPPD adjustment using regressed weighting, the HPPD variance from planned was 13.33%. Following HPPD adjustment using the alternative weighting method, the HPPD variance from planned was 7.58%. Other Findings There were six units in FY 2008 requiring an adjustment to planned HPPD according to the decision model: two medical units, three surgical units, and one mixed medical-surgical unit. Three of these same units also required an adjustment to planned HPPD the following year. Medical Unit B and mixed medical-surgical unit L were above the mean for both UAI and CMI for both FY 2008 and FY 2009 and had a weight factor applied to planned HPPD. Surgical unit J and mixed medical-surgical unit M were below the mean for UAI and CMI for both FY 2008 and FY 2009 and had a weight factor subtracted from their planned HPPD. Medical unit F was below the mean for both CMI and UAI in FY 2008 and had a weight factor subtracted from the planned HPPD, but was only below the mean for CMI in FY 2009 (no weighting applied). Surgical unit G was below the mean for both CMI and UAI in FY 2008 and had a weight factor subtracted from the planned HPPD, but was only below the mean for CMI in FY 2009 (no weighting applied).
74 63 Summary data of these findings can be found in Tables A28 through A34 (see Appendix A). Summary This chapter described significant findings among the overall associations between HPPD and UIA and HPPD and CMI along with the individual unit findings. All medical, surgical, and mixed medical-surgical units, aggregated together, demonstrated significant but weak associations between HPPD and CMI and HPPD and UAI. Significant correlations between HPPD and UAI were most prevalent across all medical units, across all fiscal years, and at the individual unit level. Surgical units also demonstrated significant, albeit weak relationships between HPPD and UAI at the aggregate level. The numbers of significant findings at the unit level were less than medical units. Significant findings of relationships between HPPD and UAI were weakest for mixed medical-surgical units. Significant correlations between HPPD and CMI were more prevalent across all surgical and mixed medical-surgical units at the aggregate unit type level, and for only FY 2008 for medical units. The numbers of significant findings of associations between HPPD and CMI at the unit level were sporadic. There was minimal differentiation from the results of applying either of the two methods for devising a weight factor in adjusting planned HPPD for comparison of weighted versus unweighted staffing plans. Differences in using a decision makingmodel based on a priori assumptions of when planned HPPD required adjustment versus applying an adjustment based on significant correlation results.
75 64 Chapter V Discussion Introduction This chapter will present an analysis of the findings from Chapter 4. Three major findings from this study will be presented. Prior to the discussion of these findings, the importance of utilizing data at the unit level will be offered. The first major finding was the significant, albeit weak correlations between the dependent variable, hours per patient day (nursing unit staffing), and the two independent variables: unit activity index (patient turnover) and case mix index (patient acuity). The second major finding resulted from the derivation and use of an adjustment to planned versus actual HPPD in an effort to better predict HPPD when formulating annual staffing plans. Decision-making relative to when to adjust planned HPPD was a major factor in the overall outcome of this study. A discussion of the relevance and importance of benchmarking will be presented to augment the context of the findings relative to the creation of a predictive model, along with the impact of benchmarking on formulating annual staffing plans. The third major finding was the creation of a clear method for calculating the unit activity index which will assist researchers to more easily determine patient turnover. In addition, limitations encountered by this study, and implications for future research as a result of this study s findings, will be presented. Lastly, the impact of this study on policy and practice will be discussed. The Importance of Unit Level Data This study s findings are best analyzed at the unit level. It is the granularity of unit level data that brings the researcher closer to the discovery of variables, or
76 65 contingencies, actually impacting the makeup of unit-based scheduling (Van den Heede, Diya, Lesaffre, Vleugels, & Sermeus, 2008). Generalities around higher level data aggregation shed little light on actual unit characteristics and potential contingencies affecting the structure of nursing workload (Berkow, Jaggi, Fogelson, Katz, & Hirschoff, 2007; Van den Heede, et al., 2008). Aggregated data can be used as a general indicator of staffing such as when assessing data for budgetary purposes; examining data at the unit level will better reflect differences in actual patient characteristics and nursing workload (Clarke & Donaldson, 2008). A 40% discrepancy (significance not reported) between unit level HPPD data and hospital level HPPD data (N=40) were reported by Minnick and Mion (2009). Reasons for the differences between unit level and hospital level data were the use of different date ranges for data capture (pay periods versus calendar month days), lack of inclusion of per diem staff because of differing pay periods, and accrual / reversal accounting techniques used with pay periods (Minnick & Mion, 2009). Unit level data provides a more understandable and accurate portrayal of detail. Van den Heede, et al. (2008) found more variability in nurse staffing at the unit level (58%) than at an aggregated hospital level (6.9%); measurement of nurse staffing at the unit level is more meaningful than aggregated across all hospital units. Findings from the present study support Van den Heede s findings. Correlation data aggregated by the type of unit (medical, surgical, and mixed medical-surgical) revealed significant (albeit weak) relationships between staff worked hours (HPPD) and patient turnover (UAI) and staff worked hours (HPPD) and patient acuity (CMI).
77 66 However, significant findings at the unit level were inconsistent and will be discussed in the ensuing section. Data utilized to measure staffing, such as hours per patient day, should directly correspond to the desired level of study (Mark, 2006). Getzen (2006) states The appropriate unit of analysis is determined not by the availability of data or the desire to increase N, but by matching units of observation to the units of action (p.1949). Since this study examined the correlation between staff hours and patient turnover and patient acuity at the unit level (in order to derive and apply a weight factor to adjust individual units staffing plans), unit level data was found to be most appropriate. Correlations between HPPD (Staff Hours) and UAI (Patient Turnover) and CMI (Patient Acuity) All adult inpatient medical, surgical, and mixed medical-surgical units, when aggregated together, demonstrated positive but weak associations between HPPD and patient turnover, measured by unit activity index (UAI). Although this might lead to a conclusion that as unit activity increases staffing increases to accommodate the surge in workload, no presumption should be made that any unit classified as medical, surgical, or mixed medical-surgical should show similar correlations. This was not the case in this study as evidenced by the number of non-significant findings at the individual unit level. There were 12 instances (30%) of non-significant associations between HPPD and UAI at the unit level over the 3 fiscal years studied. All but one of the fourteen units (93%) included in this study demonstrated significant associations between HPPD and UAI at the unit level, albeit at different magnitudes, at least once during the study period. The
78 67 one unit that showed no significant findings at any time during the study was a unit for which there was only one year of study data available. Not every individual medical, surgical, or mixed medical-surgical unit showed significant results for each fiscal year. However, when aggregated together, medical and surgical units did demonstrate significant but weak correlations between staffing hours and patient turnover for each fiscal year, and mixed medical-surgical units for two of three fiscal years. Individual medical units demonstrated moderate correlations between HPPD and UAI more often than surgical or mixed medical-surgical units. In eighteen groups of data (six medical units, 3 years of data per unit), medical units demonstrated significant findings 78% of the time, 43% with a moderate effect level. This was also a surprising finding. The PI expected to find more frequent and stronger correlations between HPPD and UAI among the surgical and mixed medical-surgical units, assuming more unit activity on units caring for surgical patients, However, the ALOS for medical patients in the study hospitals during the study period was 4.90 days compared with an ALOS of 5.20 days for the surgical units (data obtained from study hospital financial intranet site). In this study, medical, surgical, and mixed medical-surgical units showed similar patient turnover rates in the range of 46% to 50%. The PI s findings are inconsistent with those reported by Budreau, Balakrishnan, Titler, & Hafner (1999). Budreau et al. (1999) acknowledge the importance of admissions, discharges, and transfers as the second major source of work (p.319), the primary source being patient volume, but did not report any significant findings regarding the relationship between ADT activity by shift and overall HPPD (N=184 days) in a
79 68 similar hospital setting and units types. However, parsing data by shift and/or by day of week may have led to different findings from this study regarding the relationship between HPPD and UAI. As with UAI, significant correlations between staff worked hours and patient acuity should not lead to a conclusion that as patient acuity increases or decreases, staffing increases or decreases to adjust to the complexities of patients in their care. Few units at the individual unit level showed any significant association between HPPD and CMI: two medical units, two surgical units, and no mixed medical-surgical units. One of the medical units showed a significant negative correlation. Again, these are surprising findings, especially where significance was found in nearly all cases when aggregated by type of unit. However, associations between worked hours and case mix index were not as robust as anticipated at the unit level. In this study, surgical patients averaged an overall case mix index of compared with for medical patients and for mixed medical-surgical patients. The further away a case mix index is from 1.00, the more complex the patient. For example, a case mix index of indicates a more complex patient than a case mix Likewise, a case mix index of indicates a less acute patient than one with a case mix of (Benjamin, 2007) No studies were found that specifically correlated unit staffing levels with patient acuity at the unit level. Campbell, Taylor, Callaghan, & Shuldham (1997) found no overall relationship between case mix index and nursing hours (no statistics reported). Campbell et al. reported only cystic fibrosis as a case mix group had a significant effect (p.239) on nursing workload, again no statistics reported. That same year, O'Brien-
80 69 Pallas, Irvine, Peereboom, & Murray (1997) looked at differences between nursing complexity (measured by PRN 80, an acuity system used in Canada) and medical complexity (measured by CMI) and found a significant difference between the two measures, F=25.78, 70:1344, p< O Brien-Pallas et al. concluded that case mix index was not a good predictor of nursing workload. A third study from the same time period found that case mix index relative to staffing levels was not a significant variable (X=1.32, SD = 0.20, sig. not reported) at the unit level of data (Brewer & Frazier, 1998). Judging from the lack of further published literature, it appears that using case mix as a predictor of nursing workload was abandoned by researchers. This study will potentially add interest towards conducting further research in this untapped area. In summary, units showing any significant relationship between staffed hours and patient turnover and/or between staffed worked hours and patient acuity should definitely be viewed with confidence that these two variables do have an impact on the units staffing. Consideration should be given to adjusting planned HPPD to accommodate these associations when allocating staff resources. When engaging in staffing research, associations are not identified every time they are expected (Clarke & Donaldson, 2008, p. 14). Benchmarking Prior to engaging in a discussion on how the use of a weight factor to adjust planned HPPD based on UAI and CMI towards more accurately predicting actual HPPD, an understanding of the use and necessity of benchmarking must take place. Annual nursing staff planning is often begun using benchmarks. Benchmarking has become extensively used for the purposes of maintaining an eye on competitive best practices
81 70 (Ahmed & Rafiq, 1998), and for comparing one s own performance and characteristics to an established standard (Zimmerman, Alzola, & VonRueden, 2003). Ahmed and Rafiq (1998) identified eight unique types of benchmarking: internal, external, competitive, industry, generic, process, performance, and strategic. When establishing annual staffing plans, internal, external, performance, and sometimes competitive or strategic benchmarking is utilized. Internal benchmarking occurs within the organization itself, using like nursing units and metrics such as HPPD, case mix, and a volume measure such as patient turnover. Performance benchmarking occurs throughout the course of the year as the outcomes of established annual staffing plans are measured. Planned nursing staff worked hours, patient turnover, and patient acuity are compared to actual throughout the year. Organizations may voluntarily or be mandated to report planned staffing versus actual staffing. Organizations may engage in competitive or strategic benchmarking when hoping to acquire an edge on market share for physicians, nurses, patients, and third party payers. This can occur when annual staffing plans are made publically available so that patients, nurses, physicians, and third party payers can evaluate the staffing patterns in terms of expected nursing workload (DeVandry & Cooper, 2009). Various strengths and weaknesses should be acknowledged when using three common sources of benchmarking data: literature reviews, hospitals as single entities, and multiple hospitals as part of a system approach to benchmarking (Rudy, Lucke, Whitman, & Davidson, 2001). There are four typical problems found when attempting to establish benchmarks based on reviewed literature: (a) inconsistent definition of what was being measured, (b) lack of specificity regarding data collection and analysis, (c)
82 71 inability to generalize findings for different settings, and (d) lack of applicability to different patient populations (Rudy, Lucke, Whitman, & Davidson, (2001). External benchmarks are obtained at the unit type level, such as those for medical units, surgical units, or mixed medical-surgical units. Sources of external benchmarking for establishing staffing plans include, but are not limited to, Massachusetts Patient CareLink, University HealthSystem Consortium (UHC), and the National Database for Nursing Quality Indicators (NDNQI). Consulting groups, such as The Nursing Executive Center (part of the Advisory Board Company), the Labor Management Institute, and Applied Management Systems also have proprietary data that can be used for benchmarking purposes if a hospital subscribes to their services. While it may be possible to benchmark within unit type levels depending on the availability and accuracy of further unit descriptors, unit specific benchmarking can only take place within one s own organization by examining unit performance from year to year. For example, a medical unit caring for only oncology patients could be externally benchmarked against other oncology medical units or a cardiothoracic surgery unit could be externally benchmarked against other cardiothoracic surgery units for more accurate benchmarking. However, in the absence of detailed descriptors of patient populations served by a unit, external benchmarking must rely on data aggregated by higher level, more generic unit descriptions. Benchmarking within a hospital offers a level of control not found in literature reviews or from using multiple hospitals (Rudy, Lucke, Whitman, & Davidson, (2001). Specifically, definitions, methods, technology, and acuity can be controlled. However, internal benchmarking might give rise to a false sense of accomplishment if not stacked
83 72 against some form of external barometer for validation. Benchmarking against other hospitals in a system allows for examinations and comparisons to be made under broader scrutiny. Limitations for a systems approach to benchmarking are opposite the strengths in using internal benchmarking (Rudy, et al., 2001). Using external benchmarks from comparable sources, situating oneself at neither the lowest nor highest extreme, and acknowledging the many staffing variables and unit and staff characteristics when benchmarking comparatively is the recommended administrative practice (Clarke & Donaldson, 2008). Use of Weight Factors to Adjust HPPD Benchmarking is the starting point in formulating annual staffing plans and is typically derived from internal or external data garnered from the unit type level (medical, surgical, or mixed medical-surgical). The results are then applied to individual units whose general characteristics fall within the unit type to which it is assigned. This is an important concept since the findings from this study were predicated on the accuracy of the starting benchmarks coupled with the application of the right decision-making model and the units actual performance. Two methods for deriving weight factors for use in adjusting planned HPPD were developed and applied. The first used an empirical method of calculating the slope intercept of the regression between UAI and CMI. The second used a calculation derived by the PI involving the products of UAI and CMI. Two decision making models were also utilized. The first utilized a decision making model (found in Appendix B) that awarded adjustments to HPPD based on a unit s location above or below the means for UAI and CMI. In other words, a unit s mean
84 73 UAI and mean CMI from the previous year would be situated within the decision-making grid and the decision of when and how to apply a weight factor would be pre-determined by the grid. In the second instance, decisions were based on the individual unit s actual significant findings for the associations between HPD and UAI and CMI from the previous year. In other words, units with positive significant correlations, regardless of magnitude, would have their planned HPPD adjusted. Upon examining the final results, what appears to be of greater importance is the decision making applied towards whether or not to adjust the HPPD. Using the decision making model from Appendix B resulted in less effective adjustments to planned HPPD. In several instances the adjustments resulted in far worse results and illogical decision making. For example, for medical unit F in FY 2008, a subtraction of a weight factor, derived from either method, would have resulted in a planned HPPD as low as 6.82 and a variance between that and actual would have been as high as 42.95%. Given that Unit F s actual HPPD from FY 2007 was 8.46, it would have been highly unlikely that this unit would have been benchmarked and weight adjusted to start with a planned HPPD of 6.82, a decrease of nearly two hours of nursing care per day. Using the decision model from Appendix B also resulted in very few adjustments made to planned HPPD because of the mixed results of units mean UAI and CMI within the decision making grid. For example, only units with both higher and lower means for CMI and UAI were given an adjustment to their planned HPPD. Based on this decisionmaking, only nine adjustments to planned HPPD were made over the 2 fiscal years of
85 74 evaluation (30%), which resulted in only three improvements made to the planned versus actual variation in HPPD. It appears that using the decision-making grid was not sensitive enough towards the variations in individual units UAI and CMI. Therefore, a discussion of the merits of using a weight factor based on linear regression versus the PI s method of weighting is irrelevant in this instance given the disappointing findings from using the decision making grid. Making adjustments to planned HPPD based on known correlations after regressions had been analyzed, and awarding adjustments to HPPD based on significant correlations was a much more promising decision making model. Using this decision model, 21 adjustments to planned HPPD were made over the 2 fiscal years of evaluations (78%). The outcome of interest for this study was to have less variance between planned and actual HPPD. Using linear regression to derive a weight factor resulted in less instances of improving the variance of planned versus actual HPPD than did using the weight factor derived by the method proposed by the PI (48% versus 62%). An interesting finding is that, although using the weight factor derived by the PI was overall more successful, there were exceptions. The improvements in outcomes resulting in variances between planned and actual HPPD experienced by medical units at the unit level were totally dominated by the use of the PI s method. 83% of the medical units experienced an improvement in variance between planned and actual HPPD for both FY 2008 and FY 2009 as opposed to 50% using the linear regression model.
86 75 These findings were not the same for surgical and mixed-medical-surgical units. For example, the linear regression weight was more successful in FY 2008 for surgical unit L than the PI s method, but less successful in FY 2009 for surgical unit E. It should also be noted that the weight factors derived through linear regression and through the PI s own method were closest for the surgical units. There was only a difference between the two different weight factors for FY 2007 and difference for FY To put these differences in perspective, for FY 2007 there was approximately a one minute difference between the two weight factors and a four minute difference between the two weight factors for FY Concerning mixed medical-surgical units, the use of linear regression to derive a weight factor was superior to that of the method derived by the PI in the one instance (Unit H) where the outcome of having less variance between planned and actual HPPD was achieved. Neither method was successful in bringing about a successful outcome of having less variance between planned and actual HPPD for mixed medical-surgical units in FY Firm postulations of what might have made this modeling, i.e. adjusting HPPD by adding a weight factor based on significant correlations between HPPD and UAI and CMI, more successful in medical units is elusive. For example, when the strength of the correlations themselves was examined, medical units had four instances of moderate significant associations, or 33% of the time yet surgical unit experienced moderate significant associations 38% of the time. An examination of unadjusted planned HPPD for medical units revealed that 42% were within the on target performance standard of +/- 5% set by Massachusetts Patient CareLink. An examination of the unadjusted planned
87 76 HPPD for surgical units revealed only 33% of them were within the performance standard set by Massachusetts Patient Car Link. Yet, adjustments to HPPD were more successful for medical units. Findings from the mixed medical-surgical units have been most surprising of all. Two of three mixed medical-surgical units were within the performance threshold for FY No improvements to any mixed medical-surgical units were achieved through the application of either type of weight factor. One reason might be the very low variations between the unadjusted planned and actual HPPD experienced by mixed medical-surgical units: -0.94%, and 0.69%. To put this in terms of minutes, there were just four minutes of variation between planned and actual HPPD in the case of the unit with 0.94% variance and three minutes of variation between planned and actual HPPD in the case of the unit with 0.69% variance. It is unlikely that any type of weighting would achieve better results, leading to the conclusion that these units were benchmarked appropriately at the planning stage. Overall, 82% of all units delivered more patient care hours than planned. Although this outcome appears desirable, caution should be used when interpreting these data. Delivering more care than planned is not the same as delivering more care than needed. Higher HPPD, when not actually needed through failure to adjust staffing to meet actual patient needs, results in higher costs without additional reimbursement (Welton, 2008). This study did not examine patient care outcomes; therefore no interpretations or assumptions can be made from these positive variances. Conversely, another interesting finding is the interaction between units that delivered less staffing hours than planned and adjustments made to HPPD. There were
88 77 five occurrences where units worked less HPPD than planned, or 18% of the units over a two year period. Again, caution should be used when interpreting these data. Delivering less care hours than planned is not the same as delivering less care hours than needed. However, delivering less care hours than needed may be interpreted as an increase to a unit s susceptibility to invoking undesirable patient care outcomes (Welton, 2008). Again, this study did not examine patient care outcomes; therefore no interpretations or assumptions can be made from these negative variances. Indeed, three of these negative variances were well within the established performance targets established by Massachusetts Patient CareLink. Retrospectively, adjusting the HPPD upwards for units whose actual HPPD was below that of planned HPPD because of positive significant associations between HPPD and UAI and CMI did not result in increasing the actual HPPD delivered. Rather the outcomes from such an adjustment demonstrated a far greater variance than for unadjusted HPPD. For example, the FY 2008 plan for medical unit K was 8.89 HPPD (unadjusted). The actual HPPD worked by nursing staff was 8.62, a variance of -3.04%, well within the established parameters put forth by Massachusetts Patient CareLink. In practical terms, this meant that 8 hours and 53 minutes of nursing care per patient per day was planned and 8 hours and 37 minutes of nursing care per patient per day was delivered: a difference of 16 minutes. Alternatively, mixed medical-surgical unit H planned 8.36 HPPD (unadjusted) and delivered 7.62 HPPD, a variance of -8.73%. Although -8.73% lay beyond the established parameters for being on target set by Massachusetts Patients CareLink, it was an eminently better variance than one achieved through an adjustment to HPPD made by
89 78 using linear regression (9.43 adjusted HPPD, % variance) or through the PI s method (9.03 adjusted, % variance). It appears that how well units were initially benchmarked made an impact on the results. It is possible that acknowledgement at the unit level of the impact of UAI and CMI at the time of staff planning could have been inherently built into the staffing plan without any established formula. For example, in FY 2008 only one of 13 units delivered actual HPPD to within + / - 5% of planned. In FY 2009, 10 of 14 units were on target without any adjustment at all (although through weighting, five of them had their variances improved). On the other hand, using an example of what appears to be an ineffective benchmark, medical Unit F s actual planned HPPD for FY 2008 was Using Massachusetts Patient CareLink s benchmark for similar medical units in 300+ bed hospitals would have resulted in a non-adjusted HPPD of This would have yielded a variance of 11.20% (instead of the actual 24.11%). If that benchmark had been used and then adjusted, the adjusted HPPD would have been 9.77, variance -0.37% using the linear regression method and 9.34, variance 4.20% using the PI s method of weighting: both within the accepted parameters of staffing established by Massachusetts Patient CareLink. It should also be noted here that HPPD is hugely affected by the size of the unit. Although this characteristic was not an inherent part of this study as a contingency variable on the structure of HPPD, it does assist in establishing some context around the data examined by this study. For example, a 28 bed unit planned to have an average daily census of 25 and an HPPD of 8.32 has a range of 7.90 to 8.74 HPPD within which to
90 79 work to remain within the parameters of +/- 5% established by Massachusetts Patient CareLink (8.32*.95=7.90, 8.32*1.05=8.74). Using a mathematical grid found in Appendix H it can be seen that the addition or subtraction of one caregiver and two patients still results in an on target performance. However, an 18 bed unit planned for an average daily census of 14 and an HPPD of 8.00 (range: 7.60 to 8.40) is immediately off target if the staffing is increased or decreased by one caregiver or with the increase or decrease of one patient. That is, the variations in staffing and unit occupancy are less tolerated by smaller units. This ties into this study because of its premise that patient turnover, measured by the number of admissions, discharges and transfers as a ratio of total patients touched, affects the number of caregivers needed to accommodate the extra workload. A smaller unit with a high UAI will not tolerate additional care hours as well as a larger unit. Clarification of the Measure of Unit Activity Index (UAI) The measure of unit activity played a major role in this study s findings. Differences in variable measurements are one limitation faced by nurse staffing researchers (Clarke & Donaldson, 2008). Using the UAI calculation fostered by Jacobsen, Seltzer and Dam (1999) accurately captured true unit activity relative to patient turnover as a ratio of patient admissions, discharges, and transfers to total patients treated or touched. Jacobsen, Seltzer, and Dam (1999) defined total treated patients as the sum of patients admitted, transferred in, transferred out, and discharged with the same 24 hour period plus patients remaining on the unit for the same 24 hour period. This can be difficult for researchers to ascertain when presented with large data sets. A simplification of this formula is merely the total number of patients plus the total number of admissions
91 80 and transfers in during the same 24 hour period. This simplified formula is exemplified in Appendix G. Hours per patient day are calculated from the total number of worked hours by direct care providers divided by the average daily, i.e. midnight census (ADC). It is important to appreciate the difference between midnight census and number of total patients cared for on a unit for the entire 24 hour period within the context of this study. Since ADC was used in this study to calculate HPPD, it is appropriate to portray its differences with total treated patients and compare this study s findings with those of others. Jacobsen, Seltzer, and Dam (1999) reported a difference of 53.5%, N= 31 days, between midnight census and total treated patients, from a one month study of one medical inpatient unit. In the PI s study, medical inpatient units experienced weekly differences between midnight census and total treated patients ranging from 12.21% to 49.51%, N= 900 weeks. Surgical units experienced slightly larger differences, 15.70% to 52.94%, N= 638 weeks. Mixed medical surgical units were consistent in the range of 16.75% to 51.61%, N = 456 weeks. These findings are consistent with those found by Jacobsen, Seltzer, and Dam (1999). The current study s findings of UAI ranges of 24.6% to 68.8%, N=2004 weeks are also consistent with those of Wagner, Budreau, & Everett (2005) who used the same measure of unit activity and reported UAIs ranging from 31.0% to 51.2%, N=260 weeks. This lends credence to the use of the measure of UAI as defined by Jacobsen, Seltzer, and Dam (1999) for the PI s study to accurately capture patient turnover; a critical piece for conducting Specific Aim 1.
92 81 Study Limitations While this study demonstrated some instances of strong associations between HPPD and UAI and CMI, the results must be considered with caution. It cannot be said that UAI and CMI are the only explanations for the resulting HPPD rising above or falling below the originally planned annual HPPD used to create staffing plans. Changes to nursing units over the 3 study years were identified where possible, such as when a large unit was divided into two smaller units. Other changes within nursing units over the 3 study years are unknown and have not been identified or controlled for. For example, changes to the nursing staff, skill mix, patient type, additional education provided to the managers regarding budget management, and/or financial differences between fiscal years were neither addressed nor included. It is possible that any of the abovementioned changes, or others unknown and not identified, may have influenced the results if this study. Findings pertained to two hospitals from one healthcare organization and to adult acute care medical, surgical, and mixed medical-surgical units only, and may not be generalizable to other similar hospitals, smaller hospitals, or other unit types beyond this sample. Differences between academic medical centers and other types of hospitals are typical (Welton, Unruh, & Halloran, 2006). Case mix index is not a patient acuity measure in terms of nursing workload. It can only serve as a proxy measure in the absence of a valid and reliable patient acuity measure. Data entry, transcription, and/or coding errors within the secondary databases may be present and not discovered which can influence study results (Welton, et al., 2006). Maletic and Marcus (2000) suggest that field level error rates typically approximate five per cent.
93 82 A comparison between this study s case mix indices found for adult inpatient acute medical surgical units and that for other comparable hospitals was unable to be ascertained due to the high cost of accessing proprietary databases. Several care provider and unit characteristics identified by other staffing researchers were not included in this study. Examples of other variables that were not addressed by this study include skill mix, patient care delivery models, physical size and layout of the unit, human and technology support and resources including information systems, RN education, experience, and certification, nurse fatigue, use of per diem and agency staff, (Clarke & Donaldson, 2008) and nurse patient assignment (Welton, et al., 2009). Measuring staffing and staffing components is inconsistent among studies. Hospital personnel inclusion criteria used and calculating workload measures vary widely from study to study, making benchmarking and comparison difficult (Clarke & Donaldson, 2008). Often, data from entire hospital nursing department staff are included in outcome measures (Aiken, Clarke, Sloane, Sochalski, & Silber, (2002); Blegan, Goode, & Reed, 1998; Sovie & Jawad, 2001; Unruh, Fottler, & Talbott, 2003; Van den Heede, Diya, Lesaffre, Vleugels, & Sermeus, (2008)). The database containing nurse staff data from the state of California Office of Statewide Health Planning and Development does contain worked (productive) hours broken down by skill level, but includes both onsite and offsite meeting and educational time (Kyle, 2007); hours typically not included as productive time. HPPD can be broken down into various skills such as RN HPPD, LPN HPPD, UAP HPPD and total HPPD (Needleman, Buerhaus, Mattke, Stewart, & Zelevinsky, 2002). HPPD data that is aggregated at the hospital level is often higher or lower than
94 83 data limited to homogeneous unit cohorts such as medical and surgical units or intensive care units. Aggregated HPPD data across all units within hospitals may be higher because of the inclusion of critical care units, operating rooms, labor and delivery units, and post anesthesia care units with lower patient to nurse (PTN) ratios. Conversely, HPPD data may appear lower because of the inclusion of outpatient clinics where typically higher PTN ratios are found. Table A35 (see Appendix A) highlights the differences in HPPD for mixed unit aggregated data versus data aggregated by unit data. It can be seen, using intensive care units (ICUs) and emergency departments (EDs) as examples, that medical, surgical and mixed medical/surgical HPPD are skewed upwards or downwards. Using data in Table A35 as an example, if acute adult medical and surgical units are the desired units for comparison, the appropriate 2008 unit cohort benchmark is 9.20 HPPD. If the benchmark was established using a source that included critical care units as well, the results would be skewed upward by 3.16 HPPD. If the benchmark was established using a source that included medical and surgical units, ICUs and EDs, the results would be skewed upward by 1.67 HPPD. HPPD, patient acuity, and patient census data were aggregated four different ways among the studies reviewed for this dissertation: (a) across countries (Aiken, et al., 2001), (b) nationwide (Duffield, Diers, Aisbett, & Roche, 2009; Needleman, et al., 2002; Van den Heede, et al., 2008), (c) across hospitals at the state level (Sovie & Jawad, 2001; Unruh & Fottler, 2006; Unruh, Fottler, & Talbott, 2003), and (d) across all or selected units grouped within hospitals (Blegen, et al., 1998; McGillis-Hall, et al., 2004; Salyer, 1995, Walker, 1990; (Welton, et al., 2009).
95 84 Researchers are often challenged in obtaining unit-level data due to its availability and accessibility (Minnick & Mion, 2009). Not all hospitals have unit level staffing data by skill, shift, or work type (productive, non-productive, overtime, regular time). Not all hospitals have the ability to report patient turnover by day and shift. Large data repositories available to researcher and containing nurse staffing data such as the Center for Medicare and Medicaid Services (CMS) Provider of Services (POS) file, the AHA s Annual Survey of Hospitals and California s OSHPD may not have data at the level of detail appropriate for the study. For example, the CMS-POS file only includes worked hour data for RNs (Mark, 2006). Data provided by the American Hospital Association (AHA) does not distinguish RNs providing direct patient care from nurse administrators or nurse educators (Mitchell & Lang, 2003). Surveys might not capture the level of detail or the nuances that data collected onsite at the unit level may reveal (Minninck & Mion, 2009). Fit With Theoretical Framework This study demonstrated the fit of the contingency factors of patient turnover, measured by unit activity index, and patient acuity, measured by case mix index, on the structure of nursing unit staffing plans, measured by hours per patient day. The fit between UAI and CMI on HPPD was considered successful, i.e. effective, when the adjustment to HPPD resulted in less variance between planned and actual HPPD. When units experienced more variance between planned and actual HPPD, the results were considered ineffective; thus, there was no fit between UAI and CMI on HPPD. The effectiveness of using a weight factor to adjust planned HPPD based on significant correlational finding between HPPD and UAI and CMI at the unit level for
96 85 some units and the ineffectiveness resulting from applying the same system to other units underscores the tenets of structural contingency theory (SCT). SCT stresses the individuality of each unit; adjusting each unit s HPPD in the same way is not appropriate. Further, SCT states that a unit should strive to identify the contingencies affecting its structure. If there were no correlations found between worked hours and patient turnover and patient acuity, then these were not the contingencies affecting the structure, i.e. HPPD for this unit. Hence, the contingency variables of UAI and CMI chosen for this study were not the appropriate contingencies for all units included. Policy Implications Recent and ongoing legislative changes related to health care policy and reimbursement will continue to challenge hospitals to reduce costs (Centers for Medicare and Medicaid Services, 2010a). The Centers for Medicare and Medicaid Services (CMS) no longer pays hospitals for substandard care and outcomes for sequela related to several nurse-sensitive measures. These include, but are not limited to, pressure ulcers, catheterassociated blood stream infection, falls with serious injury, and catheter associated urinary tract infections (Centers for Medicare and Medicaid Services, 2010b). Nurse staffing will be held accountable for preventable adverse patient outcomes and poor patient satisfaction. The Joint Commission also requires adherence to its staffing effectiveness standards, requiring nurse administrators and managers to monitor and respond to changes affecting staffing (The Joint Commission, April 13, 2010). In addition, many states have already legislated or will be legislating hospital staffing committees to develop and make public their staffing plans that take into consideration patient acuity and skill mix (Stokowski, 2009). The optimum number and
97 86 skill mix of nursing unit staff has been elusive, and the mandated staffing ratios in California in effect since 2004 have not shown a demonstrable improvement in patient outcomes that are sensitive to nursing care (Spetz, et al., 2009). Hospital reimbursements for care delivered are continually threatened by changes within the economy, changes in legislation affecting CMS payments, and third party payers. In the absence of evidence-based staffing, unwanted and unwarranted changes to staff budgets, skill mixes, and salaries are possible. Newly mandated minimum staffing ratios in the state of Victoria, Australia, secured by its national nursing union, added 2,650 nurses back into its workforce, but with cuts to nursing pay raises (Buchan, 2005). Further work must be done in the area of rightsizing staffing plans to promote the collective interests of nurses and patients alike. Practice Implications The adjustment of HPPD based on significant findings of positive correlations between HPPD and patient turnover and patient acuity, if performed, will change the staffing numbers for each unit affected. For example, an initial benchmark of 8.14 for a medical unit adjusted to 8.74 (using the PI s weight factor) results in 1.30 fulltime equivalents (FTEs) added to the staffing plan. Using the same initial benchmark and adjusting HPPD to 9.15 (linear regression weight factor) results in 2.15 FTEs added to the staffing plan. (Conversely, significant findings of negative correlations between HPPD and patient turnover and patient acuity, and with adjustments made to HPPD, will have the same corresponding FTEs removed from the staffing plan). This might seem like adding expense to hospitals that may struggle to stay financially viable in today s market. However, if this change to staffing numbers results
98 87 in less overtime, less staff turnover, less use of per diem and agency nurses, produce better patient outcomes, and raise the level of patient and nurse satisfaction, the benefits may outweigh the expense. Only a cost-benefit analysis would ascertain the facts; an exercise outside the scope of this study. Practice implications are also interwoven with policy implications. For example, if hospitals are legislated to convene staffing committees to determine staffing levels and to make them publically available, this is a change in practice for the hospitals. Research Implications The results of this study have suggested additional research opportunities that may add to building the science of empirically based nurse staffing. Using the same variables contained within this study, changing the temporal measure of correlations between HPPD and UAI and CMI from weekly to daily or even by shift may yield more specific results. With measure of UAI clarified, perhaps another interesting possibility is to change the volume measure of HPPD from the average daily midnight census to total touched patients for a more accurate measure of true nursing workload. In addition, this study measured nursing workload in hours per patient day incorporating all direct care providers. Explicating the registered nurse portion of these data and replicating this study could ascertain if the findings still held, thus adding more information with regards to the impact of patient turnover and patient acuity on the RN portion of patient care. Changing from case mix index as the proxy measure for patient acuity, a study of the number of diagnosis-related groupings (DRGs) experienced by at the unit level might also shed light on the complexities of patient care experienced by nurses. In large
99 88 academic medical centers, patients tend to be homogeneously grouped by like DRGs: cardiac units, orthopedic units, oncology units, etc. Nurses tend to be specialized and even certified in caring for specific patient types. To replicate this study using the number of DRGs on a unit by week would be the next logical step. Nursing unit staffing is fraught with complex variables, each potentially affecting patient care and safety outcomes. In addition to patient acuity and patient turnover examined by this study, caregiver and care setting characteristics also must be taken into consideration so that a more complete model towards empirical staff planning can be built. Caregiver characteristics such as educational levels, length of experience, number of staff on orientation at any given time on the nursing unit, the percentage of core staffing as opposed to float pool, per diem, and agency or traveler staff, and staff competencies all contribute to the development of a staffing plan (Brewer & Frazier, 1998; Clarke & Donaldson, 2008; Mark, et al., 2008). Further study, adding these variables to this study s model will be of great interest towards the continued building of a predictive model for nursing unit staff planning based on empirical evidence. An alternatively proposed staffing measure is that of nurse-patient assignment (NPA). The NPA is a newly introduced measure of both direct nursing care hours and costs per inpatient day (Welton, et al., 2009). The NPA is also a measure made up of data that is currently kept and easily obtained by hospitals: how many patients were assigned and how many hours were worked per shift per nurse per day. Welton s research has focused on the cost of nursing care and has promoted the idea of billing for nursing services explicated from the hospital room and board charges. It is possible that his
100 89 proposed NPA measure would play a role in the search for a workable empirical staff planning model. Conclusion With the many staffing challenges faced by nurse managers and nurse administrators, and the drive to focus on evidence based staffing, nursing administration must be proactive in its approach to more accurately predict and budget staffing resources (Berkow, et al., 2007; Welton, 2008). Changes in reimbursement make it imperative for nurse managers to develop tools and methods to assist them to measure variables of importance without additional burden. Nurse managers must also utilize the results to influence decision-making, lobby for resources based on empirical evidence, and manage those resources effectively towards desired patient, staff, and administrative outcomes. Preparation for constructing an annual staffing plan is a complex challenge faced by nurse managers. Nurse managers are often at the mercy of fiscal restraints and changes in hospital reimbursements (Berkow, et al., 2007). Having the opportunity to study potential influences of nursing intensity measured through hours per patient day at the unit level provided some insight through the major findings of this study. The overall strength of this study was its ability to examine weekly data from acute care medical and surgical units at the unit level over a three year period, yielding 2,004 weeks of data. The major findings of this study were 1. Significant, albeit generally weak correlations between the dependent variable, hours per patient day (nursing unit staffing), and the two independent variables: unit activity index (patient turnover) and case mix index (patient acuity),
101 90 2. The derivation and subsequent application of a weight factor to planned versus actual HPPD adjusted for patient turnover and acuity in an effort to better predict HPPD when formulating annual staffing plans. This included a rejection of the initial decision making model in favor of one using results from the correlations, and 3. The clarification of the measure of unit activity index which will assist researchers to more easily calculate patient turnover. Nurse managers will continue to be challenged to identify all components affecting the delivery of patient care necessary to produce acceptable patient safety outcomes.
102 91 References Agency for Healthcare Research and Quality. (2003). Weight measures Retrieved Feb 20, 2010, from m Agency for Healthcare Research and Quality. (2008). HCUP facts and figures, 2006: Statistics on hospital-based care in the United States: Agency for Healthcare Research and Quality. Ahmed, P. K., & Rafiq, M. (1998). Integrated benchmarking: A holistic examination of select techniques for benchmarking analysis. Benchmarking for Quality Management & Technology, 5(3), Aiken, L. H., Clarke, S. P., Sloane, D. M., Sochalski, J., & Silber, J. H. (2002). Hospital nurse staffing and patient mortality, nurse burnout, and job dissatisfaction. Journal of the American Medical Association, 288, Alexander, J. W., & Randolph, W. A. (1985). The fit between technology and structure as a predictor of performance in nursing subunits. Academy of Management, 28(4), American Hospital Association. (2009). The economic downturn and its impact on hospitals. American Hospital Association Retrieved from American Nurses Association. (2005). Utilization guide for the ANA principles for nurse staffing. Silver Spring: American Nurses Association.
103 92 American Nurses Association. (2008, 11/23/09). Nurse Staffing Plans and Ratios Retrieved Nov 24, 2009, from telegislativeagenda/staffingplansandratios_1.aspx American Nurses Association. (2009a, 1/23/09). Nurse Staffing Plans and Ratios Retrieved Feb 16, 2009, from islativeagenda/staffingplansandratios 1.aspx American Nurses Association. (2009b, November 23). Nurse Staffing Plans and Ratios Retrieved March 7, 2010 American Nurses Association. (2009c). Nursing Administration: Scope and Standards of Practice. Silver Spring: Nursebooks.org. Anderson, R., & Kerfoot, K. (2009). The time has come for evidence-based staffing and scheduling. Nursing Economic$, 27(5), Bacon, C. T., Hughes, L. C., & Mark, B. A. (2009). Organizational influences on patient perceptions of symptom management. Research in Nursing & Health, 32(3), doi: /nur Benjamin, C. (2007). The Role of DRGs & CCs in Medicare's Acute Care Prospective Payment System Retrieved April 30, 2010, from Tutorial.pdf Berkow, S., Jaggi, T., Fogelson, R., Katz, S., & Hirschoff, A. (2007). Fourteen unit attributes to guide staffing. Journal of Nursing Administration, 37(3),
104 93 Blegen, M. A., Goode, C. J., & Reed, L. (1998). Nurse Staffing and Patient Outcomes. Nursing Research, 47(1), Bourne, D. W. A. (2003). Weighting data Retrieved Feb 20, 2010, from Brennan, C. W., & Daly, B. J. (2009). Patient acuity: A concept analysis. Journal of Advanced Nursing, 65(5), doi: /j x Brewer, C. S., & Frazier, P. (1998). The influence of structure, staff type, and managedcare indicators on registered nurse staffing. Journal of Nursing Administration, 28(9), Buchan, J. (2005). A certain ratio? The policy implications of minimum staffing ratios in nursing. Journal of Health Services Research & Policy, 10(4), Budreau, G., Balakrishnan, R., Titler, M., & Hafner, M. J. (1999). Caregiver-patient ratio: Capturing census and staffing variability. Nursing Economic$, 17(6), Buerhaus, P. I. (2009). Avoiding mandatory hospital nurse staffing ratios: An economic commentary. Nursing Outlook, 57(2), doi: /j.outlook Bureau of Labor Statistics. (2009). Occupational employment and wages, May 2008 Retrieved Oct 3, 2009, from Burns, T., & Stalker, G. M. (2001). The Management of Innovation (3rd ed.). New York: Oxford University Press.
105 94 Campbell, T., Taylor, S., Callaghan, S., & Shuldham, C. (1997). Case mix type as a predictor of nursing workload. Journal of Nursing Management, 5(4), doi: /j x Carayon, P., & Gurses, A. P. (2005). A human factors engineering conceptual framework of nursing workload and patient safety in intensive care units. Intensive and Critical Care Nursing, 21(5), Carruth, A. K. (2001, January 1). A comparative analysis of the budget-related activities used in the evaluation of clinical nurse managers, clinical supervisors and nurse executives. Research in Healthcare Financial Management Retrieved March 16, 2009, from /January/1-p5251 Cavouras, C. A. (2002). Nurse staffing levels in American hospitals: A 2001 report. Journal of Emergency Nursing, 28(1), Cavouras, C. A., & Suby, C. (2004) Survey of Hours Report: Direct and Total Hours per Patient Day (HPPD) by Patient Care Units Perspectives on Staffing and Scheduling (pp. 1-95). Phoenix: Labor Management Institute. Centers for Medicare and Medicaid Services. (2010a). Medicare's FY 2011 Hospital Inpatient Prospective Payment System Proposed Rule Retrieved April 30, 2010, from Centers for Medicare and Medicaid Services. (2010b). Proposals to Improve Quality of Care in Inpatient Stays in Acute Care Hospitals in FY 2010 Retrieved April 30, 2010, from
106 95 Chinn, P. L., & Kramer, M. K. (2008). Integrated Theory and Knowledge Development in Nursing (7th ed.). St. Louis: C.V.Mosby. Chou, A. F., Yano, E. M., McCoy, K. D., Willis, D. R., & Doebbeling, B. N. (2008). Structural and process factors affecting the implementation of antimicrobial resistance prevention and control strategies in U.S. hospitals. Health Care Management Review, 33(4), Clarke, S. P., & Donaldson, N. E. (2008). Chapter 25. Nurse staffing and patient care quality and safety. Patient Safety and Quality: An Evidence-Based Handbook for Nurses: AHRQ CD Retrieved April 22, 2010, from Czerwinski, B. S. (2007). Staffing and Scheduling Nursing Leadership and Management (pp ). Philadelphia: F.A. Davis Company. Davis, K. R. J., & Sauser, W. I. J. (1993). A Comparison of factor weighting methods in job evaluation: Implications for compensation systems. Public Personnel Management, 22(1). Dess, G. G., & Beard, D. W. (1984). Dimensions of organizational task environments. Administrative Science Quarterly, 29, DeVandry, S., & Cooper, J. (2009). Mandating nurse staffing in Pennsylvania: More than a numbers game. Journal of Nursing Administration, 39(11), doi: /NNA.0b013e3181bd5fe9 Donaldson, L. (1999). The Normal Science of Structural Contingency Theory. In S. R. Clegg & C. Hardy (Eds.), Studying Organization Theory and Method (pp ). London: Sage.
107 96 Donaldson, L. (2001). The Contingency Theory of Organizations. Thousand Oaks: Sage Publications. Donaldson, L. (2004). Defending structural contingency theory. Austrailian Graduate School of Management, 1-4. Donaldson, N. E., Brown, D. S., & Aydin, C. E. (2001). Nurse staffing in California hospitals : Findings from the California nursing outcome coalition database project. Policy, Politics, & Nursing Practice, 2(1), Duffield, C., Diers, D., Aisbett, C., & Roche, M. (2009). Churn: patient turnover and case mix. Nursing economic$, 27(3), 185. Dunham-Taylor, J., & Pinczuk, J. Z. (2010). Financial Management for Nurse Managers (2nd ed.). Sudbury: Jones and Bartlett. Field, A. (2005). Discovering Statistics Using SPSS (2nd ed.). London: SAGE Publications. Finkler, S. A., Kovner, C. T., & Jones, C. A. (2007). Financial Management for Nurse Managers and Executives (3rd ed.). Philadelphia: Saunders. Friesner, D. L., Rosenman, R., & McPherson, M. Q. (2007, January 1). Does a single case mix index fit all hospitals? Empirical evidence from Washington state. Research in Healthcare Financial Management Retrieved March 16, 2009, from %3f+Empirical+evidence...-a Getzen, T. (2006). Aggregation and the measurement of health care costs. Health Services Research, 41(5), doi: /j x
108 97 Haynor, P. M., & Hohenleitner, S. G. (2007). Budgeting. In R. A. P. Jones (Ed.), Nursing Leadership and Management (pp ). Philadelphia: F.A.Davis Company. Hollenbeck, J. R., Moon, H., Ellis, A. P. J., West, B., Ilgen, D. R., Sheppard, L., et al. (2002). Structural contingency theory and individual differences: Examination of external and internal person-team fit. Journal of Applied Psychology, 87(3), doi: // Jacobson, A. K., Seltzer, J. E., & Dam, E. J. (1999). New methodology for analyzing fluctuating unit activity. Nursing Economic$, 17(1), Kane, R. L., Shamliyan, T., Mueller, C., Duval, S., & Wilt, T. J. (2007). Nurse staffing and quality of patient care. Evid Rep Technol Assess (Full Rep)(151), Kaplan, R. S. (1975). Analysis and control of nurse staffing. Health Services Research, 10(3), Kreitner, R. (2009). Management (11th ed.). Boston: Houghton Mifflin. Kuster, S. P., Ruef, C., Bollinger, A. K., Ledergerber, B., Hintermann, A., Deplazes, C., et al. (2008). Correlation between case mix index and antibiotic use in hospitals. Journal of Antimicrobial Chemotherapy, 62(4), doi: /jac/dkn275 Kyle, R. (2007) Hospital Annual Financial Pivot Table. Retrieved Oct 10, 2009, from California Office of Statewide Health Planning and Development Larrabee, J. H., Janney, M. A., Ostrow, C. L., Withrow, M. L., Hobbs, G. R., Jr., & Burant, C. (2003). Predicting registered nurse job satisfaction and intent to leave. Journal of Nursing Administration, 33(5),
109 98 Magee, T., Lee, S. M., Giuliano, K. K., & Munro, B. (2006). Generating new knowledge from existing data. Nursing Research, 55(2S), S50-S56. Maletic, J. I., & Marcus, A. (2000). Data Cleansing: Beyond Integrity Analysis. Paper presented at the Proceedings of the Conference on Information Quality (IQ2000). Mark, B. A. (2006). Methodological Issues in Nurse Staffing Research. West J Nurs Res, 28(6), doi: / Mark, B. A., Hughes, l. C., Belyea, M., Bacon, C. T., YunKyung, C., & Jones, C. A. (2008). Exploring organizational context and structure as predications of medication errors and patient falls. Journal of Patient Safety, 4(2), Mark, B. A., Salyer, J., & Smith, C. S. (1996). A Theoretical Model for Nursing Systems Outcomes Research. Nursing Administration Quarterly, 20(4), Massachusetts Organization of Nursing Executives. (2004). Patient Classification Systems. Management of Practice Retrieved December 6, 2009, from McCue, M., Mark, B. A., & Harless, D. W. (2003). Nurse Staffing, Quality, and Financial Performance. Journal of Health Care Finance, 29(4), 54. McGillis-Hall, L. (2005). Nurse Staffing. In L. M. Hall (Ed.), Quality Work Environments for Nurse and Patient Safety (pp. 9-37). Sudbury: Jones and Bartlett. McGillis-Hall, L., Doran, D., & Pink, G. H. (2004). Nurse staffing models, nursing hours, and patient safety outcomes. Journal of Nursing Administration, 34(1), Midwest Healthcare Coding. Retrieved January 18, 2009, from
110 99 Minnick, A. F., & Mion, L. C. (2009). Nurse labor data: The collection and interpretation of nurse-to-patient ratios. Journal of Nursing Administration, 39(9), doi: /NNA.0b013e3181b3b656 Mitchell, P. H., & Lang, N. M. (2003). Nurse staffing: A Structural proxy for hospital quality? Medical Care, 42(1), 1-2. doi: /01.mlr f Moody, L. E., & McMillan, S. (2002). Maintaining data integrity in randomized clinical trials. Nursing Research, 51(2), Needleman, J., Buerhaus, P. I., Mattke, S., Stewart, M., & Zelevinsky, K. (2001). Nurse staffing and patient outcomes in hospitals (pp. i - 457). Boston: Harvard School of Public Health. Needleman, J., Buerhaus, P. I., Mattke, S., Stewart, M., & Zelevinsky, K. (2002). Nursestaffing levels and the quality of care in hospitals. New England Journal of Medicine, 346(22), Nicoll, L. H., & Beyea, S. C. (1999). Using secondary data analysis for nursing research. AORN Journal, 69(2), 428,430,433. Norrish, B. R., & Rundall, T. G. (2001). Hospital restructuring and the work of registered nurses. The Milbank Quarterly, 79(1), O'Brien-Pallas, L., Cockerill, R., & Leatt, P. (1992). Different systems, different costs?: An examination of the comparability of workload measurement systems. Journal of Nursing Administration, 22(12), O'Brien-Pallas, L., Irvine, D., Peereboom, E., & Murray, M. (1997). Measuring nursing workload: Understanding the variability. Nursing Economic$, 15(4),
111 100 O'Donnell, D. (2004). Use of acuity-based staffing systems in acute care hospitals in Massachusetts Retrieved December 6, 2009, from Office of Statewide Health Planning and Development. (2009). Hospital Annual Disclosure Reports PatientCareLink. (2010). Staffing Plans & Reports Retrieved Mar 28, 2010, from Petryshen, P., O'Brien-Pallas, L. L., & Shamian, J. (1995). Outcomes monitoring: Adjusting risk factors, severity of illness and complexity of care. Journal of the American Medical Informatics Association, 2(4), Polit, D. E., & Beck, C. T. (2008). Nursing Research: Generating and Assessing Evidence for Nursing Practice (8th ed.). Philadelphia: Lippincott, Williams, & Wilkins. Porter-O'Grady, T., & Malloch, K. (2007). Quantum Leadership. A Resource for Health Care Innovation (2nd ed.). Sudbury: Jones and Bartlett. Rangachari, P. (2007). Coding for quality measurement: The relationship between hospital structural characteristics and coding accuracy from the perspective of quality management. Perspectives in Health Information Management, 4(3), Rodgers, J., & Lutz, S. (2003). Cost of caring: Key drivers of growth in spending on hospital care Retrieved Oct 9, 2009, from Rudy, E. B., Lucke, J. F., Whitman, G. R., & Davidson, L. J. (2001). Benchmarking patient outcomes. Journal of Nursing Scholarship, 33(2),
112 101 Salyer, J. (1995). Environmental turbulence: Impact on nurse performance. Journal of Nursing Administration, 25(4), Schoech, D. (2006). Contingency Theory Retrieved Feb 1, 2010, from Seago, J. A., Williamson, A., & Atwood, C. (2006). Longitudinal analyses of nurse staffing and patient outcomes. Journal of Nursing Administration, 36(1), doi: need DOI Sovie, M. D., & Jawad, A. F. (2001). Hospital restructuring and its impact on outcomes: nursing staff regulations are premature. Journal of Nursing Administration, 31(12), Spetz, J., Chapman, S., Herrera, C., Kaiser, J., Seago, J., & Dower, C. (2009). Assessing the impact of California's nurse staffing ratios on hospitals and patient care Retrieved Apr 19, 2010, from Stokowski, L. A. (2009). Nurse staffing for safety Retrieved Apr 19, 2010, from The Center for Nursing Advocacy. (2008). What is Magnet status and how's that whole thing going Retrieved Aug. 16, 2009, from The Joint Commission. (April 13, 2010). Nurse staffing effectiveness in 2010: The interim standards. Briefings on The Joint Commission Retrieved Apr 19, 2010, from Effectiveness-in-2010-The-Interim-Standards
113 102 Unruh, L. Y., & Fottler, M. D. (2006). Patient turnover and nursing staff adequacy. Health Services Research, 41(2), doi: /j x Upenieks, V. V., Akhavan, J., Kotlerman, J., Esser, J., & Ngo, M. J. (2007). Value-added care: a new way of assessing nursing staffing ratios and workload variability. Journal of Nursing Administration, 37(5), doi: /01.NNA Van den Heede, K., Diya, L., Lesaffre, E., Vleugels, A., & Sermeus, W. (2008). Benchmarking nurse staffing levels: The development of a nationwide feedback tool. Journal of Advanced Nursing, 63(6), doi: /j x VanSlyck, A., & Johnson, K. R. (2001). Using patient acuity data to manage patient care outcomes and patient care costs. Outcomes Management for Nursing Practice, 5(1), Wagner, C., Budreau, G., & Everett, L. Q. (2005). Analyzing fluctuating unit census for timely staffing intervention. Nursing Economic$, 23(2), Walker, E. K. (1990). Staffing accommodations to hospital unit admissions. Nursing Economic$, 8(5), Welton, J., Zone Smith, L., & Bandyopadhyay, D. (2009). Estimating nursing intensity and direct cost using the nurse-patient assignment. Journal of Nursing Administration, 39(6), doi: /NNA.0b013e3181a72911
114 103 Welton, J. M. (2008). Implications of Medicare reimbursement changes related to inpatient nursing care quality. Journal of Nursing Administration, 38(7/8), Welton, J. M., Unruh, L., & Halloran, E. J. (2006). Nurse staffing, nursing intensity, staff mix, and direct nursing care costs across Massachusetts hospitals. Journal of Nursing Administration, 36(9), Zimmerman, J. E., Alzola, C., & VonRueden, K. T. (2003). The use of benchmarking to identify top performing critical care units: A preliminary assessment of their policies and practices. Journal of Critical Care, 18(2), doi: /jcrc Zinn, J. S., Brannon, D., Mor, V., & Barry, T. (2003). A structure-technology contingency analysis of caregiving in nursing facilities. Health Care Management Review, 28(4), Zinn, J. S., & Mor, V. (1998). Organizational structure and the delivery of primary care to older Americans. Health Services Research, 33(2 Pt 2),
115 104 Appendix A Tables Table A1. A Comparison of Variance between Planned and Actual Hours per Patient Day among Adult Acute Care Medical, Surgical, and Mixed Medical-Surgical Units, in Magnet and non-magnet Hospitals, found in 300+ bed hospitals in Massachusetts. Units by type Non-magnet Medical units Magnet Medical units Non-magnet Surgical units Magnet Surgical units Non-magnet Medical / Surgical units Magnet Medical / Surgical units Year (N) 2007 (30) 2008 (30) 2009 (31) 2007 (18) 2008 (18) 2009 (18) 2007 (21) 2008 (21) 2009 (21) 2007 (13) 2008 (13) 2009 (13) 2007 (26) 2008 (27) 2009 (29) 2007 (20) 2008 (20) n (%) on Target 9 (30%) 8 (27%) 20 (65%) 9 (50%) 10 (56%) 13 (72%) 5 (24%) 7 (33%) 11 (52%) 9 (69%) 6 (46%) 8 (62%) 9 (35%) 4 (15 %) 12 (41 %) 8 (40 %) 12 (60 %) n (%) above 5% threshold 21 (70%) 21 (70%) 11 (35%) 5 (28%) 3 (17%) 4 (22%) 16 (76%) 13 (62%) 9 (43%) 4 (31%) 5 (38%) 3 (23%) 17 (65%) 23 (85%) 15 (52%) 7 (35%) 5 (25%) Variance % Range above threshold 5.64 / / / / / / / / / / / / / / / / / n (%) below -5% threshold 0 (0%) 1 (3%) 0 (0%) 4 (22%) 5 (28%) 1 (6%) 0 (0%) 1 (5%) 1 (5%) 0 (0%) 2 (15%) 2 (15%) 0 (0%) 0 (0%) 2 (7%) 5 (25%) 3 (15%) Variance % Range below threshold / / / / / / /
116 105 Units by type Non-magnet medical, surgical, and medical / surgical units Magnet medical, surgical, and medical / surgical units All medical, surgical, and mixed medical / surgical units Year (N) 2009 (20) 2007 (77) 2008 (78) 2009 (81) 2007 (51) 2008 (51) 2009 (51) 2007 (128) 2008 (129) 2009 (132) n (%) on Target 8 (40 %) 23 (30 %) 19 (24 %) 42 (52 %) 26 (51 %) 28 (55 %) 29 (57 %) 49 (38 %) 47 (36 %) 72 (55 %) n (%) above 5% threshold 7 (35%) 54 (70%) 57 (73%) 36 (44%) 16 (31%) 13 (25%) 14 (27%) 70 (55%) 70 (54%) 49 (37%) Variance % Range above threshold 6.60 / / / / / / / / / / n (%) below -5% threshold 5 (25%) 0 (0%) 2 (3%) 3 (4%) 9 (18%) 10 (20%) 8 (16%) 9 (7%) 12 (9%) 11 (8%) Variance % Range below threshold / / / / / / / / /
117 106 Table A2. A comparison of median HPPD by unit type by years Unit Type Medical Medical w/ Tele. Mixed Med- Surg Surgical Surgical w/ Tele. Source Median HPPD (N, SD) (NR) 8.58 (NR) 7.98 (NR) 7.43 (NR) 9.24 (NR) LMI (Cavouras & Suby, 2004) 8.22 (63, NR) (48, 1.28) (48, NR) (116, NR) (46, 1.05) 7.90 (62, NR) (34, 1.30) (18, NR) 9.52 (48, 1.37) 8.23 (47, 1.41) 9.40 (34, 1.41) PatientCareLink, (49, 1.34) 8.05 (49, 1.14) 9.13 (34, 1.55)
118 107 Table A3. A Summary of Studies Incorporating Hours per Patient Day, Patient to Nurse Ratios and/or Skill Mix as Measures of Patient and Nursing Outcomes Researchers Relevant Statistics Findings Blegen, Goode, & Reed (1998) HPPD (N* / X / SD): 42 / / 1.09 *N=patient care units Skill mix: RN 72% (SD 15%) Range: 46% - 96% URIs, UTIs, pressure ulcer rates, and patient complaints higher on units with higher HPPD. Overall adverse outcomes decreased with higher RN skill mix up to 87.5%, then increased with RN skill mix greater than 87.5 %. Patient falls not explained by data findings. Budreau, Balakrishnan,Titler & Hafner (1999) Sovie & Jawad (2001) Needleman, Buerhaus, Mattke, N*=184 ADT allowance = 0 min: X = SD = 5.05 ADT allowance = 30 min: X = SD = 2.41 *Days HPPD (N* / X / SD): Medical Units FY 2007: 29 / 7.49 / 2.30 RNs only: 29 / 5.10 / 1.00 FY 2008: 29 / 8.22 / 2.93 RNs only: 29 / 5.52 / 1.65 Surgical Units FY 2007: 29 / 7.40 / 2.47 RNs only: 29 / 5.18 / 1.08 FY 2008: 29 / 7.71 / 2.29 RNs only: 29 / 5.15 / 0.88 *N=patient care units HPPD (N* / X / SD): Introduces the measure of CGPR (caregiver to patient ratio) as a methodology for computing HPPD (hourly CGPR times 24 hours). Comparison of CGPR with and without adjustments for ADTs (30 min allowance) revealed less variability but little effect on HPPD using CGPR calculation. Of the four main outcome variables included in study (fall rates, nosocomial pressure ulcers, urinary tract infections, patient satisfaction [pain management, received education, attention to needs, nursing and hospital, preparation for discharge]), higher RN-HPPD were only significantly associated with lower fall rates and increased patient satisfaction with pain reassessment. During the study period, the medical units experienced an 8% increase in RN-WHPPD and an 11% increase in UAP-HPPD. The surgical units experienced a 1% decrease in RN- WHPPD and a 13 % increase in UAP- HPPD. Skill mix (the percentage of RNs to UAPs) did not result in any noteworthy findings. For medical patients, higher RN staffing resulted in shorter LOS, lower UTIs,
119 108 Researchers Relevant Statistics Findings Stewart & Zelevinsky (2002) 799 / 11.4 / 4.1 RN only: 799* / 7.8 / 1.9 *N = hospitals pneumonia rates and failures to rescue. Among surgical patients, higher RN staffing resulted in lower UTIs and lower failure to rescue rates. Aiken, Clarke, Sloane, Sochalski & Silber (2002) McGillis-Hall, Doran & Pink (2004) Seago, Williamson, & Atwood (2006) N=10,184 RN respondents reported number of patients typifying an assignment: 4:1 (17.1%) 5:1 (47.3%) 6:1 (20.8% ) 7:1 (10.9%) 8:1 (4%) N = 77 units (medical, surgical and obstetrical) Staffing models: RNs and UAPs (42.9%) RNs, LPNs, and UAPs (20.8%) RNs and LPNs (20.8%) All RN staff (15.6%) HPPD (N* / X / SD): Unit A: (1,012 / 8.1 / 0.34) RN HPPD (1,012 / 6.0 / 0.22) Unit B: (947 / 8.3 / 0.34) RN HPPD (947 / 8.0 /.024) Unit C: (952 / 7.49 / 0.56) RN HPPD (952 / 5.4 / (0.32) Overall (2,911 / 7.97 / **) RN Overall (2,911 / 6.45 / **) *N=patient days per month ** unable to impute When looking at patient to nurse (PTN) ratios, higher PTN resulted in less satisfied nurses, higher nurse burnout rates and higher risk-adjusted patient mortality and failure to rescue rates. Only 31% (3,157) of nurses surveyed in this study worked in acute care general medical or surgical units. Lower RN skill mix yielded higher medication errors and wound infections. No significant impact on falls or UTIs. Actual HPPD not reported, although HPPD included paid hours, not just worked (productive) hours. Patient satisfaction increased as total HPPD increased. Greater patient satisfaction with pain management with higher RN skill mix. Medication errors increased with lower RN skill mix.
120 109 Researchers Relevant Statistics Findings Van den Heede, et al.,(2008) Minnick & Mion (2009) HPPD (N* / X / SD): 1,637 / 2.74 / not reported Non-ICU RN HPPD in academic hospitals ranged from *N = nursing units PTN ratios N=1,824 RN surveys returned (N* / X / SD): ICU RNs: 55 / 2.1:1 / 0.31 ICU staffing plans: 55 / 2.0:1 / 0.37 Non-ICU RNs: 82 / 5.9:1 / 1.04 Non-ICU staffing plans: 82 / 5.6:1 / 1.10 This study looked at correlating three different weight systems (hospital type, nursing care intensity, and type of service) that could be used to benchmark staffing data throughout Belgium. 70% of variability in nurse staffing explained using these three weights. This study examined the correlation between self-reported patient assignments and unit staffing plans, and the two were highly correlated (r = 0.96, p <.001). PTN is a reliable measure of nursing workload.
121 110 Table A4 A Summary of Studies Incorporating Acuity Associated with Hours per Patient Day or Impacting on Patient and/or Nursing Outcomes Researchers Relevant Statistics Findings Campbell, Taylor, Callaghan, & Shuldham (1997) No regression analysis statistics reported. No overall relationship between case mix groups and predicted and actual nursing hours worked. Case mix groups not a promising predictor of nursing workload. Only cystic fibrosis as a case mix group explained 18% of the variation on nursing workload. O'Brien-Pallas, Irvine, Peereboom, & Murray (1997) N*= 45 F = :1344 p<.0001 *N=case mix groups Nursing diagnoses, medical case mix groups, nurse characteristics, and the care environment explained 60% of the variance in nursing hours. Overall case mix group explained 19% of 60% total nursing workload variability. Specifically, case mix group Asthma and Bronchitis, and case mix group Craniotomy accounted for largest variation in nursing workload. Case mix group not a good predictive measure of nursing workload. Blegen, Goode, & Reed (1998) McGillis-Hall, Doran & Pink (2004) N* = 198,962 X = 4.19 SD = 1.09 Range: *N = patient days N=203 Acuity N, mean and SD not reported. Patient acuity based on scale of 1(least acute) to 7 (most acute). Patient acuity and HPPD highly correlated (r =.819). URIs, UTIs, pressure ulcer rates, and patient complaints higher on units with higher acuity. Acuity measured on a complexity scale of 1(not complex) to 4 (highly complex), or 9 (complexity not related to case mix group). Higher patient acuity resulted in
122 111 Researchers Relevant Statistics Findings significantly higher HPPD (t = 2.94, P =.003). Increased patient age (t = 2.65, P =.008) and higher acuity (t = 2.53, P =.01) were positively related to HPPD for medical and surgical patients. Seago, Williamson, & Atwood (2006) Unruh & Fottler (2006) Upenieks, Akhavan, Kotlerman, Esser, & Ngo (2007) Case mix index (N* / X / SD): Unit A: (1,012 / 1.99 / 0.21) Unit B: (947 / 2.63 / 0.43) Unit C: (952 / 1.23 / 0.09) *N=patient days per month Severity score: (N* / X / SD): * / 1.24 / 0.23 RN/1000 APDC (adj.) = 2.84 (1994) to 2.56 (2001) After adjustment for turnover and acuity range: t = (1994) to t = (2001) p<.0001 *N = not reported (8 years of patient data) Observations: Unit A (tele): N=1,592 RN time spent: 79.7% (necessary, valueadded care) 25% (direct care) Unit B (tele): N=1,536 RN time spent: Pressure ulcers increased as patient acuity increased. Patient severity score range: 0 (least severe) to 4 (most severe). Patient severity scores increased 9.8% over the eight years of the study. Study indicates a 26.49% decline in RNs per 1000 patient days in acute care PA hospitals when adjusted for patient acuity and turnover. Study results reported for patient turnover and patient turnover and severity. It is unknown if study did not perform or did not report RN per 1000 patient day impact when adjusted for patient severity only. Time study observations categorized by activity level (necessary, value-added care versus non-value added care) and activity category (direct care versus indirect care, documentation, personal time use, waste, and other).
123 112 Researchers Relevant Statistics Findings 83.3% (necessary, valueadded care) 32% (direct care) Unit C (medical-surgical): N=1,565 RN time spent: 79.0% (necessary, valueadded care) 30% (direct care) Variability for activity level: x 2 = p=.0005 Variability for category level: x 2 = p <.0001 RNs working on the two telemetry units with comparable patient diagnoses demonstrated different workloads. RNs working on either of the two telemetry units versus RNs working on the medical-surgical unit but with comparable patient diagnoses also demonstrated disparate workloads. This despite mandated minimum staffing ratios imposed by the state where the study was conducted. Duffield, Diers, Aisbett, Roche (2009) N*=4,964,924 n** = 606 X = 235 (1st year of study) X = 255 (5th year of study) *Time patient spent on unit no further specificity ** total number of Australian DRGs A 40% increase in the number of different AR-DRGs seen per nursing unit was observed over the five year study period, indicating a rise in patient care complexity for the nursing staff..
124 113 Table A5. A Summary of Studies Incorporating Patient Turnover Associated with Hours per Patient Day or Impacting on Patient and/or Nursing Outcomes Researchers Relevant Statistics Findings Walker (1990) N*=665 X = SD = Daily: X = 95 SD = Admissions and Transfers In: N=346 X = SD = 5.19 Discharges and Transfers Out: N=319 X = SD = *N = ADTs during sample week aggregated over 5 acute care units Eves: 35% of ADTs and 60% of RN overtime and supplemental staffing Days: 64% of ADTs and 19% of RN overtime and supplemental staffing Predetermined RN work schedule did not match daily shift RN staffing levels required to accommodate ADTs. Unit level ADT data not reported. Salyer (1995) Jacobson, Seltzer, & Dam (1999) Budreau, Balakrishnan,Titler & Hafner (1999) N = not reported Daily A&D: X = 7.38 SD = 3.23 Daily T: X = 9.28 SD = 4.10 N=243 X = 34.7 n=178 X = 22.6 SD = not reported N*=184 Day shift ADT range (4 units): 22% to 81% Evening shift ADT range (4 Higher number of ADTs resulted in lower selfperceived quality of communication skills and interpersonal relationships reported by 95 RNs participating in survey. There was a difference of 53.54% between total treated patients and midnight census. Patient turnover per shift as a measurement is more accurate than using midnight census data, but showed little effect on HPPD.
125 114 Researchers Relevant Statistics Findings units): 1% to 9% Night shift ADT range (4 units): 15% to 56% *N = Days Volpatti, Leathley, Walley, & Dodek (2000) ADMC and nursing supply: X =.42 Weighted nursing supply and nursing demand: X =.83 p<.0001 Nursing demand, weighted by RN to patient ratio, admissions, and acuity is a more accurate predictor of needed nursing supply than is average daily midnight census (ADMC) in ICUs. Unruh, Fottler, & Talbott (2003) Wagner, Budreau, & Everett (2005) Hendrich & Lee (2005) Unruh & Fottler (2006) Unadjusted N* = 840,659 Adjusted N* = 847,564 X difference 10- year range: -661 to -750 t value range: to p <.0001 for all t values *N = patient days ADMC: ADTT: UAI: 12.7% % N=200 (95% C.I.) Turnover x range: Patient days computed using American Hospital Association s Adjusted Patient Days of Care (APDC) = inpatient days + [inpatient days x (outpatient revenue/inpatient revenue)] shown to underestimate workload by two hours / patient stay. OK at hospital level but difference in patient days per year spread over an average of 198 hospitals included in the 10-year study is an insignificant average of 3.5 days per hospital. Total treated patients is a more accurate measure of nursing workload than ADMC. A unit activity index (UAI) > 50% suggests the need for increased staffing. Patient transfers incur approximately an hour of nursing time (Preparation for patient transfer = 22 min; actual patient transfer = 7 min; post-transfer patient report and assessment = 31 min.) Patient turnover increased 29% over the eight years of the study. Study indicates a 23.84%
126 115 Researchers Relevant Statistics Findings SD range: Before adjustment for turnover: RN/1000 APDC (adj.) = 2.84 (1994) to 2.56 (2001) After adjustment for turnover: t = (1995) to t = (2001) p<.0001 *N = not reported (8 years of patient data) decline in RNs per 1000 patient days in acute care PA hospitals when adjusted for patient turnover. Turnover computed using 1/LOS in days Duffield, Diers, Aisbett, Roche (2009) ADT : N=not reported Aggregated unit turnover: X = 0.24 (1st year of study) X = 0.25 (5th year of study) Max. = 0.60 Patient turnover increased by 7% over study period, but nursing hours did not generally increase to accommodate increase in workload. Turnover computed using 1/LOS in days (method used by Unruh & Fottler, 2006).
127 116 Table A6. A Summary of Studies Targeting or Incorporating Cost Measures Associated with Hours per Patient Day Researchers Findings Sovie & Jawad (2001) A 50%-70% RN staff mix resulted in a 3% reduction is cost per discharged patient from a 40%-50% RN staff mix. Graf, Millar, Feilteau, Coakley, & Erickson (2003) McGillis-Hall, Doran & Pink (2004) Shamliyan, Kane, Mueller, Duval, & Wilt (2009) Higher skill mix of RNs (83%) was associated with fewer hours per unit of work when benchmarked against other academic centers using same acuity system. Lower RN skill mix resulted in greater nursing hours used for medical and surgical patients (t = 3.37, P =.003) Increasing RN skill mix does not add cost from avoided patient deaths and adverse events for ICUs and surgical patients, but not medical patients.
128 117 Table A7. A Summary of Models used by Mark and colleagues using SCT / NSOR in their research Study Context Structure Effectiveness Mark, B. A., Salyer, J., Geddes, N., & Smith, C. S. (1998) Decentralization Autonomy Nurse-Physician collaboration Support Services Mark, B. A., Hughes, l. C., Belyea, M., Bacon, C. T., YunKyung, C., & Jones, C. A. (2008) Bacon, C. T., Hughes, L. C., & Mark, B. A. (2009) Hospital characteristics: Teaching Status Size Life cycle High-tech services Unit characteristics: Skill mix Education Life cycle Patient care technology External Environment: Urban / Rural Status Managed Care Penetration Geographical Region Internal Environment: Hospital Size Life Cycle Teaching Status Technological Complexity Magnet Status Nursing Unit Environment: Size Support Services Patient Acuity Work Complexity Hospital Size Teaching Status Illness Severity Magnet Certification Life Cycle Nursing Unit Size Support Services Patient Acuity Work Complexity Unit Capacity Skill Mix Number of RNs with BSN Work Engagement RN Unit Tenure Nursing Expertise Commitment to Care Work Conditions Autonomy Decision-Making Participation Relational Coordination RN proportion RN proportion with BSN RN unit tenure Nursing Expertise Commitment to Care Autonomy Decision-making participation Relational coordination Administrative outcomes: RN satisfaction Team performance Turnover Cost efficiency Patient Outcomes: Falls Medication errors Satisfaction Safety Climate: Medication Errors Patient Falls Symptom Management
129 118 Table A8. Descriptive Statistics of data used in study, ordered by total aggregated data, data aggregated by unit type, and individual unit data. Unit / Type All FYs FY 2007 FY 2008 FY 2009 N n n n Total Medical Unit A Unit B a Unit C Unit D Unit F Unit K a Surgical Unit E Unit G Unit J a Unit L a Unit N 50 0 b 0 b 50 c Mixed Medical Surgical Unit H Unit I b Unit M Unit O 50 0 b 0 b 50 c a Units divided into smaller units during fiscal year. Only 34 weeks of data submitted to Massachusetts Patient CareLink. b Unit did not exist in the fiscal year specified c Units divided into smaller units during fiscal year. Only 50 weeks of data submitted to Massachusetts Patient CareLink.
130 119 Table A9. Sample Sizes Specific for Each Aim of This Study Aim Sample Parsing Method / Individual Unit Statistic Unit Type Sample Sample 1. To examine the correlation between CMI and UAI with HPPD. Correlation (Pearson s r) Each unit, each week for 3 years: N = 2, To derive a weight factor consisting of CMI and UAI to apply to HPPD Determine each study unit s annual (FY) CMI (mean) Determine each study unit s annual (FY) UAI (mean) Apply Weight Factor (add / subtract or not applicable) 14 units o 7 medical (n=900) o 4 surgical o (n=638) o 3 mixed medicalsurgical o (n=466) Average CMI for each study unit from each prior fiscal year to use in determining applicability of weight factor for each study unit s subsequent fiscal year planned HPPD. (N=13) Average UAI for each study unit from each prior fiscal year to use in determining applicability of weight factor for each study unit s subsequent fiscal year planned HPPD. (N=13) Using its annual staffing plan, each study unit (N=13) will have a weight factor added to, subtracted from, or deemed not applicable applied to its benchmark HPPD for each year Each unit type, each week for 3 years: FY 2007: medical units (N=276) surgical units (N=172) mixed med-surg (N=156) FY 2008: medical units (N=312) surgical units (N=208) mixed med-surg (N=156) FY 2009: medical units (N=312) surgical units (N=258) mixed med-surg (N=154) n/a
131 120 included in the study, predicated upon the results of steps 2 and 3 above and utilizing the weight model. 3. To determine if there is an improvement to the difference between planned and actual HPPD when a weight factor of CMI and UAI is applied. Descriptive statistics by unit Each study unit (N=13) with and without weight factor, using its annual staffing plan for each fiscal year Each study unit type (N=3) with and without weight factor, using an aggregated type average HPPD from the annual staffing plans for each fiscal year
132 121 Table A10. Bringing Three Data Sources Together Into Microsoft Access Data Variable Initial Import Data Type Source Description Application Destination ANSOS One- Microsoft Microsoft Access Nursing unit Text Staff Excel Table: Units* *A linking table for de-identifying units needs to be established for use in subsequent queries ANSOS One- Microsoft Microsoft Access date Date/Time Staff Excel Table: Worked Hours ANSOS One- Microsoft Microsoft Access Nursing unit Text Staff Excel Table: Worked Hours ANSOS One- Staff ANSOS One- Staff regular hours worked by direct care providers overtime hours worked by direct care providers Integer, 2 decimal points Integer, 2 decimal points Meditech date Date/Time Meditech Nursing unit Text Meditech Meditech Meditech Meditech Meditech number of patient transfers into the unit number of patient admissions into the unit number of patient discharges from the unit number of patient transfers from the unit midnight census Integer, whole number Integer, whole number Integer, whole number Integer, whole number Integer, whole number Meditech Weekending date Date Time Meditech Unit Text Meditech Case Mix Index Integer, 4 decimal points Microsoft Excel Microsoft Excel Microsoft Excel Microsoft Excel Microsoft Excel Microsoft Excel Microsoft Excel Microsoft Excel Microsoft Excel Microsoft Excel Microsoft Excel Microsoft Excel Microsoft Access Table: Worked Hours Microsoft Access Table: Worked Hours Microsoft Access Table: Patient census Microsoft Access Table: Patient census Microsoft Access Table: Patient census Microsoft Access Table: Patient census Microsoft Access Table: Patient census Microsoft Access Table: Patient census Microsoft Access Table: Patient census Microsoft Access Table: Case Mix Microsoft Access Table: Case Mix Microsoft Access Table: Case Mix
133 122 Table A11. Queries Built in Preparation for Export of Data to SPSS Microsoft Access Query Microsoft Access Table Variable Description Weekending Worked Hours Weekending Worked Hours Weekending Worked Hours Weekending Patient Census Weekending Patient Census Weekending Patient Census Weekending Patient Census Unit Worked Hours Worked Hours Worked Hours Unit Patient Census Patient Census Patient Census Patient Census Unit Unit Weekending Date Total worked hours for the week Unit Unit Weekending Date Midnight Census ADTs none Function ([date]+7- Weekday([date],7) Sum ([regular hours]) + Sum ([overtime hours]) none ([date]+7- Weekday([date],7) Sum ([midnight census]) Sum([patient admissions]) + Sum([patient transfers in]) + Sum([patient discharges]) + Sum([patient transfers out]) Result Links unit names between tables, allowing deidentified unit name to be selected Changes record field date to weekending date in order to link to case mix index dates Adds all worked hours together for each week for each unit Links unit names between tables, allowing deidentified unit name to be selected Changes record field date to weekending date in preparation for linking to case mix index dates Sums the midnight census for the week to arrive at patient days per week Sums the ADTs for each week for each unit in preparation for calculating the UAI
134 123 Table A12. Final Query with All Data Ready for Export into SPSS Variable Microsoft Access Variable Label for Datasource Description SPSS Query: Weekending Worked Hours Query: Weekending Worked Hours Query: Weekending Worked Hours Query: Weekending Patient Census Query: Weekending Patient Census Table: Case Mix Index Unit Date HPPD UAI CMI De-identified alias Weekending Date Total worked hours / total patient days sum of ADTs / (mean midnight census + mean ADTs) Case mix index Variable Type for SPSS String Date, mm/dd/yy Numeric, 2 decimals Numeric, 2 decimals Numeric, 4 decimals Variable Measure for SPSS Nominal Scale Scale Scale Scale
135 124 Table A13. Key statistics from linear regressions between HPPD and CMI and UAI for each unit group for each fiscal year with resulting HPPD predictor for next fiscal year. Unit Type and Fiscal Year Medical units FY 2007 Medical units FY 2008 Surgical units FY 2007 Surgical units FY 2008 Mixed Medical- Surgical units FY 2007 Mixed Medical- Surgical units Variable Regression coefficient b Mean HPPD n/a UAI CMI HPPD n/a UAI CMI HPPD n/a UAI CMI HPPD n/a UAI CMI HPPD 8.35 n/a UAI CMI HPPD n/a UAI CMI Weight Factor a FY 2008 a Results formula per unit type: (regression coefficient b dependent variable (HPPD) + (regression coefficient b independent variable 1 (UAI) * mean UAI from same fiscal year) + (regression coefficient b independent variable 2 (CMI) * mean CMI from same fiscal year)) / planned HPPD
136 125 Table A14. Deriving a weight factor from Multiplying each unit s CMI and UAI and summing to zero by entering a negative number. Unit Type / Fiscal Year Medical FY 2007 Medical FY 2008 Surgical FY 2007 Surgical FY 2008 Mixed Med-Surg FY 2007 Mixed Med-Surg FY 2008 Unit Mean UAI Mean CMI UAI x CMI (UAI x CMI) - (weight factor/- 1) Unit A Unit B Unit C Unit D Unit F Unit K Unit A Unit B Unit C Unit D Unit F Unit K Unit E Unit G Unit J Unit L Unit E Unit G Unit J Unit L Unit H Unit I Unit M Unit H Unit I Unit M Weight Factor x
137 126 Table A15. Specific Aims Linked to Theoretical Model and Planned Data Analysis Aim SCT component Data Analysis Plan To examine the correlation between patient acuity (using case mix index) and patient turnover (using unit activity index) on worked hours per patient day Contingency Correlate case mix index to hours per patient day (HPPD). Expected results: the higher the CMI, the higher the HPPD (positive correlation) -Correlate Unit activity index (UAI) to HPPD. Expected results: the higher the activity ratio, the higher the WHPPD (positive correlation) To examine the moderating effects of case mix index and unit activity index on hours per patient day, utilizing them as weight factors for building a more accurate predictive annual staffing plan To conduct simulation analyses using the weight factor derived through Aim 2 to examine the difference in the variances between weighted and unweighted staffing plans Structure and Fit Effectiveness If correlations hold (see above), build a weight factor using CMI and UAI to modify HPPD by adding or subtracting the weight factor to staffing plans Compare the actual HPPD with the predicted HPPD to determine the predictive usefulness of this model.
138 127 Table A16. Descriptive Statistics of HPPD data used in study: All units and Medical Units Unit Fiscal Year N / n Mean SD Median Min Max All FYs All units FY in study FY FY All medical units Unit A Unit B Unit C Unit D Unit F Unit K All FYs FY FY FY All FYs FY FY FY All FYs FY FY FY All FYs FY FY FY All FYs FY FY FY All FYs FY FY FY All FYs FY FY FY
139 128 Table A17. Descriptive Statistics of HPPD data used in study: All units and Surgical Units Unit Fiscal Year N / n Mean SD Median Min Max All FYs All units FY in study FY FY All surgical units Unit E Unit G Unit J Unit L Unit N All FYs FY FY FY All FYs FY FY FY All FYs FY FY FY All FYs FY FY FY All FYs FY FY FY All FYs FY 2007 n/a n/a n/a n/a n/a n/a FY 2008 n/a n/a n/a n/a n/a n/a FY
140 129 Table A18. Descriptive Statistics of HPPD data used in study: All units and Mixed medical-surgical Units Fiscal Unit N / n Mean SD Median Min Max All units in study All mixed medsurg units Unit H Unit I Unit M Unit O Year All FYs FY FY FY All FYs FY FY FY All FYs FY FY FY All FYs FY FY FY 2009 n/a n/a n/a n/a n/a n/a All FYs FY FY FY All FYs FY 2007 n/a n/a n/a n/a n/a n/a FY 2008 n/a n/a n/a n/a n/a n/a FY
141 130 Table A19. Descriptive Statistics of UAI data (percentage of patient turnover) used in study: All Units and Medical Units Fiscal Unit N / n Mean SD Median Min Max All units in study All medical units Unit A Unit B Unit C Unit D Unit F Unit K Year All FYs % % 25% 72% FY % % 26% 72% FY % % 25% 69% FY % % 27% 71% All FYs % % 25% 69% FY % % 26% 64% FY % % 25% 69% FY % % 29% 62% All FYs % % 25% 58% FY % % 32% 58% FY % % 25% 52% FY % % 29% 49% All FYs % % 39% 64% FY % % 43% 64% FY % % 39% 64% FY % % 41% 62% All FYs % % 34% 62% FY % % 40% 60% FY % % 38% 62% FY % % 34% 55% All FYs % % 38% 64% FY % % 38% 60% FY % % 39% 64% FY % % 40% 59% All FYs % % 31% 69% FY % % 31% 64% FY % % 36% 69% FY % % 38% 62% All FYs % % 26% 55% FY % % 26% 51% FY % % 32% 55% FY % % 30% 49%
142 131 Table A20. Descriptive Statistics of UAI data (percentage of patient turnover) used in study: All units and Surgical Units Fiscal Unit N / n Mean SD Median Min Max All units in study All surgical units Unit E Unit G Unit J Unit L Unit N Year All FYs % % 25% 72% FY % % 26% 72% FY % % 25% 69% FY % % 27% 71% All FYs % % 27% 72% FY % % 32% 72% FY % % 31% 67% FY % % 27% 71% All FYs % % 41% 66% FY % % 44% 63% FY % % 44% 66% FY % % 41% 65% All FYs % % 34% 64% FY % % 40% 62% FY % % 37% 64% FY % % 34% 59% All FYs % % 27% 58% FY % % 32% 58% FY % % 31% 54% FY % % 27% 53% All FYs % % 38% 72% FY % % 42% 72% FY % % 38% 67% FY % % 42% 71% All FYs 50 42% % 34% 54% FY 2007 n/a n/a n/a n/a n/a n/a FY 2008 n/a n/a n/a n/a n/a n/a FY % % 34% 54%
143 132 Table A21. Descriptive Statistics of UAI data (percentage of patient turnover) used in study: All units and Mixed Medical-Surgical Units Fiscal Unit N / n Mean SD Median Min Max All units in study All mixed medsurg units Unit H Unit I Unit M Unit O Year All FYs % % 25% 72% FY % % 26% 72% FY % % 25% 69% FY % % 27% 71% All FYs % % 32% 68% FY % % 32% 68% FY % % 36% 61% FY % % 34% 68% All FYs % % 40% 68% FY % % 40% 68% FY % % 44% 61% FY % % 42% 68% All FYs % % 32% 56% FY % % 32% 56% FY % % 38% 53% FY 2009 n/a n/a n/a n/a n/a n/a All FYs % % 32% 57% FY % % 32% 53% FY % % 36% 56% FY % % 38% 57% All FYs 50 45% % 34% 54% FY 2007 n/a n/a n/a n/a n/a n/a FY 2008 n/a n/a n/a n/a n/a n/a FY % % 34% 54%
144 133 Table A22. Descriptive Statistics of CMI data used in study: All Units and Medical Units Unit Fiscal Year N / n Mean SD Median Min Max All FYs All units FY in study FY FY All medical units Unit A Unit B Unit C Unit D Unit F Unit K All FYs FY FY FY All FYs FY FY FY All FYs FY FY FY All FYs FY FY FY All FYs FY FY FY All FYs FY FY FY All FYs FY FY FY
145 134 Table A23. Descriptive Statistics of CMI data used in study: All units and Surgical Units Unit Fiscal Year N / n Mean SD Median Min Max All FYs All units FY in study FY FY All surgical units Unit E Unit G Unit J Unit L Unit N All FYs FY FY FY All FYs FY FY FY All FYs FY FY FY All FYs FY FY FY All FYs FY FY FY All FYs FY 2007 n/a n/a n/a n/a n/a n/a FY 2008 n/a n/a n/a n/a n/a n/a FY
146 135 Table A24. Descriptive Statistics of CMI data used in study: All Units and Mixed Medical-Surgical Units Fiscal Unit N / n Mean SD Median Min Max All units in study All mixed medsurg units Unit H Unit I Unit M Unit O Year All FYs FY FY FY All FYs FY FY FY All FYs FY FY FY All FYs FY FY FY 2009 n/a n/a n/a n/a n/a n/a All FYs FY FY FY All FYs FY 2007 n/a n/a n/a n/a n/a n/a FY 2008 n/a n/a n/a n/a n/a n/a FY
147 136 Table A25. Results of All Unit and Medical Unit correlations between HPPD and CMI and UAI using Pearson s correlation coefficient (r), 2-tailed significance. N signifies weeks. Unit / Type All Units Medical Units Unit A Unit B Unit C Unit D Unit F Unit K Statistic r r 2 Sig. (N) r r 2 Sig. (N) r r 2 Sig. (N) r r 2 Sig. (N) r r 2 Sig. (N) r r 2 Sig. (N) r r 2 Sig. (N) r r 2 Sig. All FYs.257** (2004).283** (900).215** (156).322** (138).312** (156).225** (156).524** (156).441** HPPD / UAI FY 2008 FY ** (604).231** (276) (52).571** (34).502** (52).362** (52).440** (52).376* ** (676).377** (312).553** (52) (52).503** (52).394** (52).284* (52).423** (N) (138) (34) (52) *Correlation is significant at the 0.05 level (2-tailed). **Correlation is significant at the 0.01 level (2-tailed). FY ** (724).208** (312).396** (52).454** (52) (52) (52).464** (52).505** (52) All FYs.244** (2004) -.081* (900) (156) (138) (156) (156) (156) (138) FY ** (604) (276) (52) (34) (52) (52) (52) (34) HPPD / CMI FY ** (676).360** (312) (52).279* (52) (52) (52) (52) (52) FY ** (724) (312) (52) (52) (52) -.366** (52) (52) (52)
148 137 Table A26. Results of All Unit and Surgical Unit correlations between HPPD and CMI and UAI using Pearson s correlation coefficient (r), 2-tailed significance. N signifies weeks. Unit / Type All Units Surgical Units Unit E Unit G Unit J Unit L Unit N Statistic r r 2 Sig. (N) r r 2 Sig. (N) r r 2 Sig. (N) r r 2 Sig. (N) r r 2 Sig. (N) r r 2 Sig. (N) r r 2 Sig. (N) All FYs.257** (2004).342** (638).318** (156) (156) (138).463** (138).385** (50) FY ** (604).250** (172).341* (52) (52) (34).625** (34) n/a HPPD / UAI FY ** (676).345** (208).410** (52).533** (52) (52).504** (52) n/a *Correlation is significant at the 0.05 level (2-tailed). **Correlation is significant at the 0.01 level (2-tailed). FY ** (724).448** (258).311* (52) (52).289* (52).306* (52).385** (50) All FYs.244** (2004).396** (638) (156) (156) (138) (138) (50) HPPD / CMI FY 2008 FY ** (604).556** (172) (52) (52).378* (34) (34) n/a.100** (676).285** (208) (52) (52) (52).335* (52) n/a FY ** (724).421** (258) (52) (52) (52) (52) (50)
149 138 Table A27. Results of All Unit and Mixed Medical-Surgical Unit correlations between HPPD and CMI and UAI using Pearson s correlation coefficient (r), 2-tailed significance. N signifies weeks. Unit / Type All Units Mixed Med- Surg Units Unit H Unit I Unit M Unit O Statistic r r 2 Sig. (N) r r 2 Sig. (N) r r 2 Sig. (N) r r 2 Sig. (N) r r 2 Sig. (N) r r 2 Sig. All FYs.257** (2004) (466).266** (156).381** (104).165* (156) HPPD / UAI FY ** (604) (156).407** (52).345* (52) (52) n/a FY ** (676).351** (156).386** (52).440** (52).398** (52) n/a (N) (50) *Correlation is significant at the 0.05 level (2-tailed). **Correlation is significant at the 0.01 level (2-tailed). FY ** (724).178* (154) (52) n/a (52) (50) All FYs.244** (2004).159** (466) (156) (104) (156) (50) HPPD / CMI FY 2008 FY ** (604).290** (156) (52) (52) (52) n/a.100** (676) -.184* (156) (52) (52) (52) n/a FY ** (724).312** (154) (52) n/a (52) (50)
150 139 Table A28. Results for Medical Units in FY 2008 and FY 2009 from applying predicted weight from linear regression versus weight from alternative method using decision-making model (Appendix B) Medical Units: All A a B b C a D a F c K a FY 2008 Planned HPPD Actual HPPD Variance 12.43% 12.50% 7.40% 18.79% 6.67% 24.11% 7.14% Adjusted HPPD using Regressed Weight n/a Variance n/a 12.50% -3.74% 18.79% 6.67% 42.59% 7.14% Adjusted HPPD using alternative n/a weighting Variance n/a 12.50% 0.67% 18.79% 6.67% 34.16% 7.14% Bold and shaded indicates on target with variance +/- 5% per Massachusetts Patient CareLink Units on target before adjustments: 0% Units on target after adjusting with regressed weight: 17% Units on target after adjusting with alternative weight: 17% a No HPPD adjustment b weight factor added to planned HPPD c weight factor subtracted from HPPD Medical Units: FY 2009 All A a B b C a D a F a K a Planned HPPD Actual HPPD Variance 3.09% 4.23% 4.07% 8.00% 3.15% 2.59% -3.04% Adjusted HPPD using Regressed Weight n/a Variance n/a 4.23% -7.78% 8.00% 3.15% 2.59% -3.04% Adjusted HPPD using alternative n/a weighting Variance n/a 4.23% -2.70% 8.00% 3.15% 2.59% -3.04% Bold and shaded indicates on target with variance +/- 5% per Massachusetts Patient CareLink Units on target before adjustments: 83% Units on target after adjusting with regressed weight: 67% Units on target after adjusting with alternative weight: 83% a No HPPD adjustment b weight factor added to planned HPPD c weight factor subtracted from HPPD
151 140 Table A29. Results for Surgical Units in FY 2008 and FY 2009 from applying predicted weight from linear regression versus weight from alternative method using decision-making model (Appendix B) Surgical Units: FY All E a G c J c L b 2008 Planned HPPD Actual HPPD Variance 13.06% 22.29% 26.88% 13.22% 8.26% Adjusted HPPD using Regressed Weight n/a Variance n/a 22.29% 26.88% 28.23% -2.20% Adjusted HPPD using alternative weighting n/a Variance n/a 22.29% 27.20% 28.52% -2.36% Bold and shaded indicates on target with variance +/- 5% per Massachusetts Patient CareLink Units on target before adjustments: 0% Units on target after adjusting with regressed weight: 25% Units on target after adjusting with alternative weight: 25% a No HPPD adjustment b weight factor added to planned HPPD c weight factor subtracted from HPPD Surgical Units: FY 2009 All E a G a J c L b N a Planned HPPD Actual HPPD Variance -0.00% 7.58% 4.65% 4.05% -2.49% % Adjusted HPPD using Regressed Weight n/a Variance n/a 7.58% 4.65% 18.33% % % Adjusted HPPD using alternative weighting n/a Variance n/a 7.58% 4.65% 17.35% % % Bold and shaded indicates on target with variance +/- 5% per Massachusetts Patient CareLink Units on target before adjustments: 60.00% Units on target after adjusting with regressed weight: 20% Units on target after adjusting with alternative weight: 20% a No HPPD adjustment b weight factor added to planned HPPD c weight factor subtracted from HPPD
152 141 Table A30. Results for Mixed Medical-Surgical Units in FY 2008 and FY 2009 from applying predicted weight from linear regression versus weight from alternative method using decision-making model (Appendix B) Mixed Units: FY 2008 All H a I a M c Planned HPPD Actual HPPD Variance 8.46% 11.05% 1.49% 13.84% Adjusted HPPD using Regressed Weight n/a Variance n/a 11.05% 1.49% 31.86% Adjusted HPPD using alternative weighting n/a Variance n/a 11.05% 1.49% 23.71% Bold and shaded indicates on target with variance +/- 5% per Massachusetts Patient CareLink Units on target before adjustments: 33% Units on target after adjusting with regressed weight: 33% Units on target after adjusting with alternative weight: 33% a No HPPD adjustment b weight factor added to planned HPPD c weight factor subtracted from HPPD Mixed Units: FY 2009 All H M O Planned HPPD Actual HPPD Variance -2.94% -8.73% -0.94% 0.69% Adjusted HPPD using Regressed Weight n/a Variance n/a -8.73% % 0.69% Adjusted HPPD using alternative weighting n/a Variance n/a -8.73% -7.58% 0.69% Bold and shaded indicates on target with variance +/- 5% per Massachusetts Patient CareLink Units on target before adjustments: 67% Units on target after adjusting with regressed weight: 33% Units on target after adjusting with alternative weight: 33% a No HPPD adjustment b weight factor added to planned HPPD c weight factor subtracted from HPPD
153 142 Table A 31. Results for Medical Units in FY 2008 and FY 2009 from applying predicted weight from linear regression versus weight from alternative method according to correlation results Medical Units: All A a B C D F K FY 2008 Planned HPPD Actual HPPD Variance 12.43% 12.50% 7.40% 18.79% 6.67% 24.11% 7.14% Adjusted HPPD using Regressed Weight Variance 2.30% 12.50% -3.74% 5.53% -3.85% 9.86% -4.09% Adjusted HPPD using alternative weighting Variance 6.34% 12.50% 0.67% 10.74% 0.33% 15.45% 0.35% Bold and shaded indicates on target with variance +/- 5% per Massachusetts Patient CareLink Units on target before adjustments: 0% Units on target after adjusting with regressed weight: 50% Units on target after adjusting with alternative weight: 50% a No HPPD adjustment: no significant correlation found Medical Units: FY 2009 All A B C D F K Planned HPPD Actual HPPD Variance 3.09% 4.23% 4.07% 8.00% 3.15% 2.59% -3.04% Adjusted HPPD using Regressed Weight Variance -8.67% -7.45% -7.78% -4.92% -8.62% -9.20% % Adjusted HPPD using alternative weighting Variance -3.63% -2.44% -2.70% 0.60% -3.58% -4.15% -9.15% Bold and shaded indicates on target with variance +/- 5% per Massachusetts Patient CareLink Units on target before adjustments: 83% Units on target after adjusting with regressed weight: 17% Units on target after adjusting with alternative weight: 83%
154 143 Table A32. Results for Surgical Units in FY 2008 and FY 2009 from applying predicted weight from linear regression versus weight from alternative method according to correlation results Surgical Units: FY All E G a J a L 2008 Planned HPPD Actual HPPD Variance 13.06% 22.29% 10.40% 13.32% 8.26% Adjusted HPPD using Regressed Weight Variance 5.84% 7.89% 10.40% 13.32% -2.20% Adjusted HPPD using alternative weighting Variance 6.59% 7.67% 10.40% 13.32% -2.36% Bold and shaded indicates on target with variance +/- 5% per Massachusetts Patient CareLink Units on target before adjustments: 0% Units on target after adjusting with regressed weight: 25% Units on target after adjusting with alternative weight: 25% a No HPPD adjustment: no significant correlation found Surgical Units: FY 2009 All E G J a L N a Planned HPPD Actual HPPD Variance -0.00% 7.58% 4.65% 4.05% -2.49% % Adjusted HPPD using Regressed Weight Variance -6.56% -5.06% -7.21% 4.05% % % Adjusted HPPD using alternative weighting Variance -6.18% -4.37% -6.56% 4.05% % % Bold and shaded indicates on target with variance +/- 5% per Massachusetts Patient CareLink Units on target before adjustments: 60% Units on target after adjusting with regressed weight: 20% Units on target after adjusting with alternative weight: 40% a No HPPD adjustment: no significant correlation found
155 144 Table A33. Results for Mixed Medical-Surgical Units in FY 2008 and FY 2009 from applying predicted weight from linear regression versus weight from alternative method according to correlation results Mixed Units: FY 2008 All H I M a Planned HPPD Actual HPPD Variance 8.46% 11.05% 1.49% 13.84% Adjusted HPPD using Regressed Weight Variance -0.24% -2.39% -9.38% 13.84% Adjusted HPPD using alternative weighting Variance 3.20% 2.79% -5.15% 13.84% Bold and shaded indicates on target with variance +/- 5% per Massachusetts Patient CareLink Units on target before adjustments: 33% Units on target after adjusting with regressed weight: 33% Units on target after adjusting with alternative weight: 33% a No HPPD adjustment: no significant correlation found Mixed Units: FY 2009 All H M O Planned HPPD Actual HPPD Variance -2.94% -8.73% -0.94% 0.69% Adjusted HPPD using Regressed Weight Variance % % % % Adjusted HPPD using alternative weighting Variance % % -8.21% -6.56% Bold and shaded indicates on target with variance +/- 5% per Massachusetts Patient CareLink Units on target before adjustments: 33% Units on target after adjusting with regressed weight: 0% Units on target after adjusting with alternative weight: 0%
156 145 Table A34. Results for All Unit Types in FY 2008 and FY 2009 from applying predicted weight from linear regression versus weight from alternative method according to correlation results All Units FY 2008 FY 2009 Planned HPPD Actual HPPD Variance 11.81% 0.72% Adjusted HPPD using Regressed Weight Variance 3.11% -9.00% Adjusted HPPD using alternative weighting Variance 5.76% -5.92% Units on target before adjustments 7.69% 71.43% Units on target after adjusting with 38.46% 14.29% regressed weight Units on target after adjusting with alternative weight 38.46% 50.00% Bold and shaded indicates on target with variance +/- 5% per Massachusetts Patient CareLink
157 146 Table A35. A Comparison of Actual Hours per Patient Day among Adult Acute Care Medical, Surgical, and Mixed Medical-Surgical Units, Magnet Hospitals, Adult Intensive Care Units, and Emergency Departments found in 300+ bed hospitals in Massachusetts. Units aggregated by type HPPD Medical units SD (N) 1.28 (48) HPPD 9.44 SD (N) 1.37 (48) HPPD 9.35 SD (N) 1.34 (49) Surgical units (34) (34) (34) Mixed medical / surgical units (46) (47) (49) All medical, surgical, and mixed medical / surgical (128) (129) (132) Magnet Hospital medical, surgical, and mixed medical / surgical units (51) (51) (51) Intensive care units (46) (46) (46) Emergency Departments (14) (14) (14) All medical, surgical, and mixed medical / surgical + ICUs All medical, surgical, and mixed medical / surgical + EDs All medical, surgical, and mixed medical / surgical + ICUs + EDs (174) 2.20 (142) 6.03 (188) (175) 2.31 (143) 6.11 (189) (178) 2.32 (146) 5.90 (192)
158 147 Appendix B.Weight Factor Decision Model high Patient Turnover (UAI) high UAI, low CMI use benchmark HPPD low UAI, low CMI subtract weight factor from benchmark HPPD high UAI, high CMI add weight factor from benchmark HPPD low UAI, high CMI use benchmark HPPD low Patient Acuity (CMI) high

159 Appendix C. Sample Staffing Plan Used for Annual Budget and Staff Planning 148
160 149 Appendix D.Descriptive Statistics: Output from SPSS by Unit Type Statistics: Medical Units HPPD HPPD UAI UAI CMI CMI N Valid Missing Mean Median Mode 9.03 a a Std. Deviation Variance Skewness Std. Error of Skewness Kurtosis Std. Error of Kurtosis Range Minimum Maximum a. Multiple modes exist. The smallest value is shown One-Sample Kolmogorov-Smirnov Test: Medical Units HPPD HPPD UAI UAI CMI CMI N Normal Parameters a Mean Std. Deviation Most Extreme Differences Absolute Positive Negative Kolmogorov-Smirnov Z Asymp. Sig. (2-tailed) a. Test distribution is Normal.

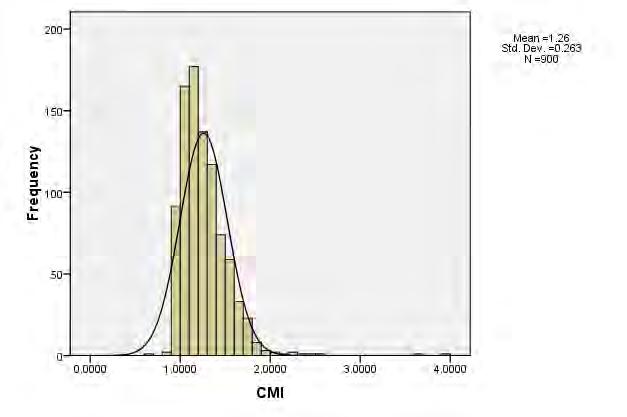

161 Medical Unit Study Variables Histograms: Output from SPSS 150

162 Medical Unit Study Variables Boxplots: Output from SPSS 151
163 152 Statistics: Surgical Units HPPD UAI CMI N Valid Missing Mean Median Mode 8.95 a a Std. Deviation Variance Skewness Std. Error of Skewness Kurtosis Std. Error of Kurtosis Range Minimum Maximum a. Multiple modes exist. The smallest value is shown One-Sample Kolmogorov-Smirnov Test: Surgical Units HPPD UAI CMI N Normal Parameters a Mean Std. Deviation Most Extreme Differences Absolute Positive Negative Kolmogorov-Smirnov Z Asymp. Sig. (2-tailed) a. Test distribution is Normal.


164 Surgical Unit Study Variables Histograms: Output from SPSS 153

165 Surgical Unit Boxplots: Output from SPSS 154
166 155 Statistics: Mixed Medical-Surgical Units HPPD HPPD UAI UAI CMI CMI N Valid Missing Mean Median Mode Std. Deviation Variance Skewness Std. Error of Skewness Kurtosis Std. Error of Kurtosis Range Minimum Maximum One-Sample Kolmogorov-Smirnov Test: Mixed Medical-Surgical Units HPPD HPPD UAI UAI CMI CMI N Normal Parameters a Mean Std. Deviation Most Extreme Differences Absolute Positive Negative Kolmogorov-Smirnov Z Asymp. Sig. (2-tailed) a. Test distribution is Normal.


167 Mixed Medical-Surgical Units Study Variables: Output from SPSS 156
168 Mixed Medical-Surgical Unit Study Variables Boxplots: Output from SPSS 157

169 Appendix E. Residual Checks: Medical Units 158


170 Regression Data: Medical Units FY


171 Regression Data: Medical Units FY


172 Residual Checks: Surgical Units 161
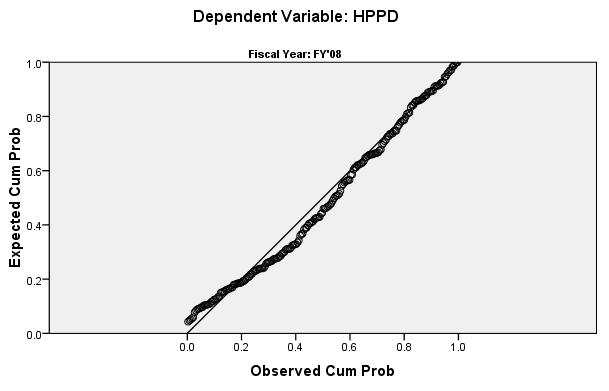
173 162
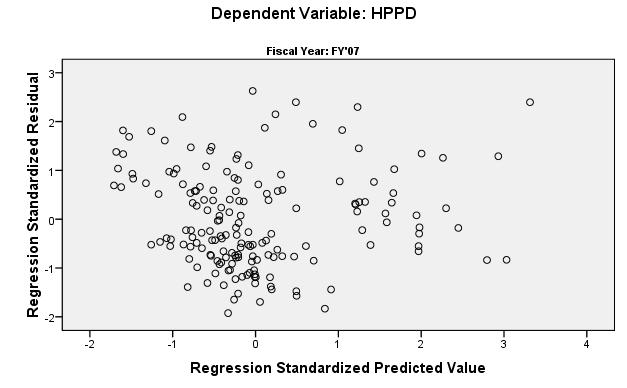

174 163

175 Regression Data: Surgical Units FY
176 Regression Data: Surgical Units FY

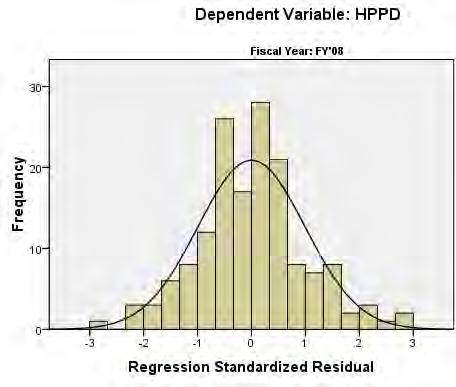


177 Residual Checks: Mixed Medical-Surgical Units 166
"Nurse Staffing" Introduction Nurse Staffing and Patient Outcomes
 "Nurse Staffing" A Position Statement of the Virginia Hospital and Healthcare Association, Virginia Nurses Association and Virginia Organization of Nurse Executives Introduction The profession of nursing
Chapter 39. Nurse Staffing, Models of Care Delivery, and Interventions
 Chapter 39. Nurse Staffing, Models of Care Delivery, and Interventions Jean Ann Seago, Ph.D., RN University of California, San Francisco School of Nursing Background Unlike the work of physicians, the
Staffing and Scheduling
 Staffing and Scheduling 1 One of the most critical issues confronting nurse executives today is nurse staffing. The major goal of staffing and scheduling systems is to identify the need for and provide
Gantt Chart. Critical Path Method 9/23/2013. Some of the common tools that managers use to create operational plan
 Some of the common tools that managers use to create operational plan Gantt Chart The Gantt chart is useful for planning and scheduling projects. It allows the manager to assess how long a project should
PG snapshot Nursing Special Report. The Role of Workplace Safety and Surveillance Capacity in Driving Nurse and Patient Outcomes
 PG snapshot news, views & ideas from the leader in healthcare experience & satisfaction measurement The Press Ganey snapshot is a monthly electronic bulletin freely available to all those involved or interested
Nursing Resources, Workload, the Work Environment and Patient Outcomes
 Nursing Resources, Workload, the Work Environment and Patient Outcomes NDNQI Conference 2010 Christine Duffield, Michael Roche, Donna Diers Study Team Professor Christine Duffield Michael Roche Professor
BAPTIST HEALTH SCHOOLS LITTLE ROCK-SCHOOL OF NURSING NSG 4027: PROFESSIONAL ROLES IN NURSING PRACTICE
 BAPTIST HEALTH SCHOOLS LITTLE ROCK-SCHOOL OF NURSING NSG 4027: PROFESSIONAL ROLES IN NURSING PRACTICE M1 ORGANIZATION PROCESSES AND DIVERSIFIED HEALTHCARE DELIVERY 2007 LECTURE OBJECTIVES: 1. Analyze economic,
Nurse staffing & patient outcomes
 Nurse staffing & patient outcomes Jane Ball University of Southampton, UK Karolinska Institutet, Sweden Decades of research In the 1980 s eg. - Hinshaw et al (1981) Staff, patient and cost outcomes of
Evaluation Framework to Determine the Impact of Nursing Staff Mix Decisions
 Evaluation Framework to Determine the Impact of Nursing Staff Mix Decisions CANADIAN PRACTICAL NURSES ASSOCIATION A. Introduction In 2004, representatives from the Canadian Nurses Association (CNA), the
Are You Undermining Your Patient Experience Strategy?
 An account based on survey findings and interviews with hospital workforce decision-makers Are You Undermining Your Patient Experience Strategy? Aligning Organizational Goals with Workforce Management
Determining Like Hospitals for Benchmarking Paper #2778
 Determining Like Hospitals for Benchmarking Paper #2778 Diane Storer Brown, RN, PhD, FNAHQ, FAAN Kaiser Permanente Northern California, Oakland, CA, Nancy E. Donaldson, RN, DNSc, FAAN Department of Physiological
Patient Safety: Rights of Registered Nurses When Considering a Patient Assignment
 Position Statement Patient Safety: Rights of Registered Nurses When Considering a Patient Assignment Effective Date: March 12, 2009 Status: Revised Position Statement Originated By: Congress on Nursing
Missed Nursing Care: Errors of Omission
 Missed Nursing Care: Errors of Omission Beatrice Kalisch, PhD, RN, FAAN Titus Professor of Nursing and Chair University of Michigan Nursing Business and Health Systems Presented at the NDNQI annual meeting
Critique of a Nurse Driven Mobility Study. Heather Nowak, Wendy Szymoniak, Sueann Unger, Sofia Warren. Ferris State University
 Running head: CRITIQUE OF A NURSE 1 Critique of a Nurse Driven Mobility Study Heather Nowak, Wendy Szymoniak, Sueann Unger, Sofia Warren Ferris State University CRITIQUE OF A NURSE 2 Abstract This is a
The Coalition of Geriatric Nursing Organizations
 - The Coalition of Geriatric Nursing Organizations Representing 28,700 Nurses American Academy of Nursing (AAN) Expert Panel on Aging American Assisted Living Nurses Association (AALNA) American Association
Nurses' Job Satisfaction in Northwest Arkansas
 University of Arkansas, Fayetteville ScholarWorks@UARK The Eleanor Mann School of Nursing Undergraduate Honors Theses The Eleanor Mann School of Nursing 5-2014 Nurses' Job Satisfaction in Northwest Arkansas
Collaborative. Decision-making Framework: Quality Nursing Practice
 Collaborative Decision-making Framework: Quality Nursing Practice SALPN, SRNA and RPNAS Councils Approval Effective Sept. 9, 2017 Please note: For consistency, when more than one regulatory body is being
Executive Summary Leapfrog Hospital Survey and Evidence for 2014 Standards: Nursing Staff Services and Nursing Leadership
 TO: FROM: Joint Committee on Quality Care Cindy Boily, MSN, RN, NEA-BC Senior VP & CNO DATE: May 5, 2015 SUBJECT: Executive Summary Leapfrog Hospital Survey and Evidence for 2014 Standards: Nursing Staff
STAFFING: The Pivotal Role of RNs
 STAFFING: The Pivotal Role of RNs RN Staffing Standards: Medicare Requirements and the Joint Commission Standards November 16, 2007 Patients go to the hospital for an intervention and stay in the hospital
State of Kansas Department of Social and Rehabilitation Services Department on Aging Kansas Health Policy Authority
 State of Kansas Department of Social and Rehabilitation Services Department on Aging Kansas Health Policy Authority Notice of Proposed Nursing Facility Medicaid Rates for State Fiscal Year 2010; Methodology
Riverside s Vigilance Care Delivery Systems include several concepts, which are applicable to staffing and resource acquisition functions.
 1 EP8: Describe and demonstrate how nurses used trended data to formulate the staffing plan and acquire necessary resources to assure consistent application of the Care Delivery System(s). Riverside Medical
The attitude of nurses towards inpatient aggression in psychiatric care Jansen, Gradus
 University of Groningen The attitude of nurses towards inpatient aggression in psychiatric care Jansen, Gradus IMPORTANT NOTE: You are advised to consult the publisher's version (publisher's PDF) if you
Decreasing Environmental Services Response Times
 Decreasing Environmental Services Response Times Murray J. Côté, Ph.D., Associate Professor, Department of Health Policy & Management, Texas A&M Health Science Center; Zach Robison, M.B.A., Administrative
Impact of hospital nursing care on 30-day mortality for acute medical patients
 JAN ORIGINAL RESEARCH Impact of hospital nursing care on 30-day mortality for acute medical patients Ann E. Tourangeau 1, Diane M. Doran 2, Linda McGillis Hall 3, Linda O Brien Pallas 4, Dorothy Pringle
The significance of staffing and work environment for quality of care and. the recruitment and retention of care workers. Perspectives from the Swiss
 The significance of staffing and work environment for quality of care and the recruitment and retention of care workers. Perspectives from the Swiss Nursing Homes Human Resources Project (SHURP) Inauguraldissertation
Barriers & Incentives to Obtaining a Bachelor of Science Degree in Nursing
 Southern Adventist Univeristy KnowledgeExchange@Southern Graduate Research Projects Nursing 4-2011 Barriers & Incentives to Obtaining a Bachelor of Science Degree in Nursing Tiffany Boring Brianna Burnette
Exemplary Professional Practice: Staffing Scheduling and Budgeting Processes
 Exemplary Professional Practice: Staffing Scheduling and geting Processes EP10 Nurses use trended data in the budgeting process, with clinical nurse input, to redistribute existing nursing resources or
Workload Models. Hospitalist Consulting Solutions White Paper Series
 Hospitalist Consulting Solutions White Paper Series Workload Models Author Vandad Yousefi MD CCFP Senior partner Hospitalist Consulting Solutions 1905-763 Bay St Toronto ON M5G 2R3 1 Hospitalist Consulting
The Safe Staffing for Quality Care Act will have a profound impact on the Advanced
 Anne Marie Holler NUR 503 Group Project- Safe Staffing for Quality Care Act 11/21/11 Impact of Safe Staffing for Quality Care Act The Safe Staffing for Quality Care Act will have a profound impact on the
Nursing skill mix and staffing levels for safe patient care
 EVIDENCE SERVICE Providing the best available knowledge about effective care Nursing skill mix and staffing levels for safe patient care RAPID APPRAISAL OF EVIDENCE, 19 March 2015 (Style 2, v1.0) Contents
Case-mix Analysis Across Patient Populations and Boundaries: A Refined Classification System
 Case-mix Analysis Across Patient Populations and Boundaries: A Refined Classification System Designed Specifically for International Quality and Performance Use A white paper by: Marc Berlinguet, MD, MPH
Final Report No. 101 April Trends in Skilled Nursing Facility and Swing Bed Use in Rural Areas Following the Medicare Modernization Act of 2003
 Final Report No. 101 April 2011 Trends in Skilled Nursing Facility and Swing Bed Use in Rural Areas Following the Medicare Modernization Act of 2003 The North Carolina Rural Health Research & Policy Analysis
Evaluation of Selected Components of the Nurse Work Life Model Using 2011 NDNQI RN Survey Data
 Evaluation of Selected Components of the Nurse Work Life Model Using 2011 NDNQI RN Survey Data Nancy Ballard, MSN, RN, NEA-BC Marge Bott, PhD, RN Diane Boyle, PhD, RN Objectives Identify the relationship
School of Nursing Applying Evidence to Improve Quality
 Applying Evidence to Improve Quality Linda A Dudjak PhD RN Associate Professor University of Pittsburgh School of Nursing Compare Two Alternatives Implement a Test of Change (Experiment) to Fix a Broken
The Determinants of Patient Satisfaction in the United States
 The Determinants of Patient Satisfaction in the United States Nikhil Porecha The College of New Jersey 5 April 2016 Dr. Donka Mirtcheva Abstract Hospitals and other healthcare facilities face a problem
Report on Feasibility, Costs, and Potential Benefits of Scaling the Military Acuity Model
 Report on Feasibility, Costs, and Potential Benefits of Scaling the Military Acuity Model June 2017 Requested by: House Report 114-139, page 280, which accompanies H.R. 2685, the Department of Defense
NURSING SPECIAL REPORT
 2017 Press Ganey Nursing Special Report The Influence of Nurse Manager Leadership on Patient and Nurse Outcomes and the Mediating Effects of the Nurse Work Environment Nurse managers exert substantial
Influence of Professional Self-Concept and Professional Autonomy on Nursing Performance of Clinic Nurses
 , pp.297-310 http://dx.doi.org/10.14257/ijbsbt.2015.7.5.27 Influence of Professional Self-Concept and Professional Autonomy on Nursing Performance of Clinic Nurses Hee Kyoung Lee 1 and Hye Jin Yang 2*
Full-time Equivalents and Financial Costs Associated with Absenteeism, Overtime, and Involuntary Part-time Employment in the Nursing Profession
 Full-time Equivalents and Financial Costs Associated with Absenteeism, Overtime, and Involuntary Part-time Employment in the Nursing Profession A Report prepared for the Canadian Nursing Advisory Committee
A Publication for Hospital and Health System Professionals
 A Publication for Hospital and Health System Professionals S U M M E R 2 0 0 8 V O L U M E 6, I S S U E 2 Data for Healthcare Improvement Developing and Applying Avoidable Delay Tracking Working with Difficult
Acute Care Nurses Attitudes, Behaviours and Perceived Barriers towards Discharge Risk Screening and Discharge Planning
 Acute Care Nurses Attitudes, Behaviours and Perceived Barriers towards Discharge Risk Screening and Discharge Planning Jane Graham Master of Nursing (Honours) 2010 II CERTIFICATE OF AUTHORSHIP/ORIGINALITY
PANELS AND PANEL EQUITY
 PANELS AND PANEL EQUITY Our patients are very clear about what they want: the opportunity to choose a primary care provider access to that PCP when they choose a quality healthcare experience a good value
Managing Staffing Expense: H-P-P-D Initiative. Stephanie Abbu, MSN, RN Neonatal Services Clinical Business Coordinator
 Managing Staffing Expense: H-P-P-D Initiative Stephanie Abbu, MSN, RN Neonatal Services Clinical Business Coordinator Objectives After attending this presentation / discussion, the conference participant
Massachusetts ICU Acuity Meeting
 Massachusetts ICU Acuity Meeting Acuity Tool Certification and Reporting Requirements Acuity Tool Certification Template Suggested Guidance Acuity Tool Submission Details Submitting your acuity tool for
Despite the shortage of nurses in
 The Relationships Between Nurses Perceptions of the Hemodialysis Unit Work Environment and Nurse Turnover, Patient Satisfaction, and Hospitalizations Jane K. Gardner Charlotte Thomas-Hawkins Louis Fogg
How Allina Saved $13 Million By Optimizing Length of Stay
 Success Story How Allina Saved $13 Million By Optimizing Length of Stay EXECUTIVE SUMMARY Like most large healthcare systems throughout the country, Allina Health s financial health improves dramatically
The Management and Control of Hospital Acquired Infection in Acute NHS Trusts in England
 Report by the Comptroller and Auditor General The Management and Control of Hospital Acquired Infection in Acute NHS Trusts in England Ordered by the House of Commons to be printed 14 February 2000 LONDON:
SENATE, No. 989 STATE OF NEW JERSEY. 218th LEGISLATURE INTRODUCED JANUARY 16, 2018
 SENATE, No. STATE OF NEW JERSEY th LEGISLATURE INTRODUCED JANUARY, 0 Sponsored by: Senator JOSEPH F. VITALE District (Middlesex) Senator LORETTA WEINBERG District (Bergen) Co-Sponsored by: Senator Gordon
Quality Assessment and Performance Improvement in the Ophthalmic ASC
 Quality Assessment and Performance Improvement in the Ophthalmic ASC ELETHIA DEAN RN,BSN, MBA, PHD Regulatory Requirements QAPI Program required by: Medicare Most states ASC licensing regulations Accrediting
Learning Activity: 1. Discuss identified gaps in the body of nurse work environment research.
 Learning Activity: LEARNING OBJECTIVES 1. Discuss identified gaps in the body of nurse work environment research. EXPANDED CONTENT OUTLINE I. Nurse Work Environment Research a. Magnet Hospital Concept
Policy Brief. Nurse Staffing Levels and Quality of Care in Rural Nursing Homes. rhrc.umn.edu. January 2015
 Policy Brief January 2015 Nurse Staffing Levels and Quality of Care in Rural Nursing Homes Peiyin Hung, MSPH; Michelle Casey, MS; Ira Moscovice, PhD Key Findings Hospital-owned nursing homes in rural areas
Running head: NURSE TO PATIENT RATIOS AND THE EFFECTS ON PATIENT 1
 Running head: NURSE TO PATIENT RATIOS AND THE EFFECTS ON PATIENT 1 Nurse to Patient Ratios and the Effects on Patient Outcomes: An Evidence Based Practice Analysis Heather Nowak, Sofia Warren, Catherine
Patient Driven Payment Model (PDPM) and the MDS: A Total Evolution of the SNF Payment Model
 and the MDS: A Total Evolution of the SNF Payment Model") Patient Driven Payment Model (PDPM) and the MDS: A Total Evolution of the SNF Payment Model By Devin Kassi, PT, DPT, and Melissa Keiter, RN, RAC-CT, DNS-CT, DON Centers for Medicare & Medicaid Services
Patient Driven Payment Model (PDPM) and the MDS: A Total Evolution of the SNF Payment Model By Devin Kassi, PT, DPT, and Melissa Keiter, RN, RAC-CT, DNS-CT, DON Centers for Medicare & Medicaid Services
time to replace adjusted discharges
 REPRINT May 2014 William O. Cleverley healthcare financial management association hfma.org time to replace adjusted discharges A new metric for measuring total hospital volume correlates significantly
Work- life Programs as Predictors of Job Satisfaction in Federal Government Employees
 Work- life Programs as Predictors of Job Satisfaction in Federal Government Employees Danielle N. Atkins PhD Student University of Georgia Department of Public Administration and Policy Athens, GA 30602
Union-Management Negotiations over Nurse Staffing Issues in Hospitals
 Union-Management Negotiations over Nurse Staffing Issues in Hospitals Benjamin Wolkinson Michigan State University Victor Nichol University of Houston Abstract Over the past several decades, systematic
Engaging Students Using Mastery Level Assignments Leads To Positive Student Outcomes
 Lippincott NCLEX-RN PassPoint NCLEX SUCCESS L I P P I N C O T T F O R L I F E Case Study Engaging Students Using Mastery Level Assignments Leads To Positive Student Outcomes Senior BSN Students PassPoint
USE OF NURSING DIAGNOSIS IN CALIFORNIA NURSING SCHOOLS AND HOSPITALS
 USE OF NURSING DIAGNOSIS IN CALIFORNIA NURSING SCHOOLS AND HOSPITALS January 2018 Funded by generous support from the California Hospital Association (CHA) Copyright 2018 by HealthImpact. All rights reserved.
Collaborative. Decision-making Framework: Quality Nursing Practice
 Collaborative Decision-making Framework: Quality Nursing Practice December 7, 2016 Please note: For consistency, when more than one regulatory body is being discussed in this document, the regulatory bodies
A project of the Office of Nursing Workforce Research, Planning, and Development University of Vermont College of Nursing and Health Sciences Funded
 A project of the Office of Nursing Workforce Research, Planning, and Development University of Vermont College of Nursing and Health Sciences Funded by the Vermont Department of Health Health Workforce
The Monthly Publication of the National Hospice and Palliative Care Organization
 The Monthly Publication of the National Hospice and Palliative Care Organization Print-friendly PDF From June 2013 Issue Determining Caseloads Gilchrist Hospice Care on Its Process By Regina Shannon Bodnar,
Social and Behavioral Sciences (SBS)
") Social and Behavioral Sciences (SBS) 1 Social and Behavioral Sciences (SBS) Courses SBS 5001. Fundamentals of Public Health. 3 Credit Hours. This course encompasses historical and sociocultural approaches
Social and Behavioral Sciences (SBS) 1 Social and Behavioral Sciences (SBS) Courses SBS 5001. Fundamentals of Public Health. 3 Credit Hours. This course encompasses historical and sociocultural approaches
THE CONTROVERSY OVER man -
 Staffing Unleashed Kathy Douglas Ratios If It Were Only That Easy EXECUTIVE SUMMARY Health care staffing is a complicated arena, and nurses are in the best position to assure a good match between the problems
Quality Management Building Blocks
 Quality Management Building Blocks Quality Management A way of doing business that ensures continuous improvement of products and services to achieve better performance. (General Definition) Quality Management
MEASURING POST ACUTE CARE OUTCOMES IN SNFS. David Gifford MD MPH American Health Care Association Atlantic City, NJ Mar 17 th, 2015
 MEASURING POST ACUTE CARE OUTCOMES IN SNFS David Gifford MD MPH American Health Care Association Atlantic City, NJ Mar 17 th, 2015 Principles Guiding Measure Selection PAC quality measures need to Reflect
What Job Seekers Want:
 Indeed Hiring Lab I March 2014 What Job Seekers Want: Occupation Satisfaction & Desirability Report While labor market analysis typically reports actual job movements, rarely does it directly anticipate
A Comparison of Job Responsibility and Activities between Registered Dietitians with a Bachelor's Degree and Those with a Master's Degree
 Florida International University FIU Digital Commons FIU Electronic Theses and Dissertations University Graduate School 11-17-2010 A Comparison of Job Responsibility and Activities between Registered Dietitians
UCSF Stanford Center for Research & Innovation in Patient Care. How to Write a Good Abstract: Dos, Don ts, and Helpful Hints
 1 UCSF Stanford Center for Research & Innovation in Patient Care How to Write a Good Abstract: Dos, Don ts, and Helpful Hints Before You Begin Susan E. Shapiro, PhD, RN Nancy Donaldson RN, DNSc. FAAN Abstracts
Creating a Patient-Centered Payment System to Support Higher-Quality, More Affordable Health Care. Harold D. Miller
 Creating a Patient-Centered Payment System to Support Higher-Quality, More Affordable Health Care Harold D. Miller First Edition October 2017 CONTENTS EXECUTIVE SUMMARY... i I. THE QUEST TO PAY FOR VALUE
Maximizing the Power of Your Data. Peggy Connorton, MS, LNFA AHCA Director, Quality and LTC Trend Tracker
 Maximizing the Power of Your Data Peggy Connorton, MS, LNFA AHCA Director, Quality and LTC Trend Tracker Objectives Explore selected LTC Trend Tracker reports & features including: re-hospitalization,
Standards of Practice for Professional Ambulatory Care Nursing... 17
 Table of Contents Scope and Standards Revision Team..................................................... 2 Introduction......................................................................... 5 Overview
The Relationship between Nurse Staffing and Patient Satisfaction in Emergency Departments
 The Relationship between Nurse Staffing and Patient Satisfaction in Emergency Departments by Imtiaz Daniel A thesis submitted in conformity with the requirements for the degree of Doctor of Philosophy
COACHING GUIDE for the Lantern Award Application
 The Lantern Award application asks you to tell your story. Always think about what you are proud of and what you do well. That is the story we want to hear. This coaching document has been developed to
paymentbasics The IPPS payment rates are intended to cover the costs that reasonably efficient providers would incur in furnishing highquality
 Hospital ACUTE inpatient services system basics Revised: October 2015 This document does not reflect proposed legislation or regulatory actions. 425 I Street, NW Suite 701 Washington, DC 20001 ph: 202-220-3700
A Span of Control Tool for Clinical Managers
 NURSING RESEARCH 83 A Span of Control Tool for Clinical Managers Robin Morash, RN, BNSc, MHS Clinical Manager, Geriatric Assessment Unit and Day Hospital Past Co-chair, Nursing Management Work Group The
4/15/2018. Disclosure of Commercial Interests. Reducing Staff Vacancy in Senior Care Organizations
 Disclosure of Commercial Interests I have commercial interests in the following organization(s): I work for HEALTHCARESOURCE I work there as the CHIEF MARKETING OFFICER HEALTHCARESOURCE provides healthcare
Does Having a Unit-Based Nurse Practitioner Increase Nurses Level of Satisfaction with Patient Care Delivery? Patricia Meyer, DNP, CRNP, NE-BC
 Does Having a Unit-Based Nurse Practitioner Increase Nurses Level of Satisfaction with Patient Care Delivery? Patricia Meyer, DNP, CRNP, NE-BC INTRODUCTION Why Nursing Satisfaction Is Important Improved
10/20/2015 INTRODUCTION. Why Nursing Satisfaction Is Important
 Does Having a Unit-Based Nurse Practitioner Increase Nurses Level of Satisfaction with Patient Care Delivery? Patricia Meyer, DNP, CRNP, NE-BC Why Nursing Satisfaction Is Important Improved patient outcomes
THE EFFECTS OF PATIENT AND NURSING UNIT CHARACTERISTICS ON OUTCOMES AMONG HOSPITALIZED PATIENTS WITH CHRONIC ILLNESS IN THAILAND.
 THE EFFECTS OF PATIENT AND NURSING UNIT CHARACTERISTICS ON OUTCOMES AMONG HOSPITALIZED PATIENTS WITH CHRONIC ILLNESS IN THAILAND by Sriwan Meeboon Copyright Sriwan Meeboon 2006 A Dissertation Submitted
Running Head: READINESS FOR DISCHARGE
 Running Head: READINESS FOR DISCHARGE Readiness for Discharge Quantitative Review Melissa Benderman, Cynthia DeBoer, Patricia Kraemer, Barbara Van Der Male, & Angela VanMaanen. Ferris State University
Family and Community Support Services (FCSS) Program Review
 Program Review") Family and Community Support Services (FCSS) Program Review Judy Smith, Director Community Investment Community Services Department City of Edmonton 1100, CN Tower, 10004 104 Avenue Edmonton, Alberta,
Family and Community Support Services (FCSS) Program Review Judy Smith, Director Community Investment Community Services Department City of Edmonton 1100, CN Tower, 10004 104 Avenue Edmonton, Alberta,
Medicare P4P -- Medicare Quality Reporting, Incentive and Penalty Programs
 Medicare P4P -- Medicare Quality Reporting, Incentive and Penalty Programs Presenter: Daniel J. Hettich King & Spalding; Washington, DC dhettich@kslaw.com 1 I. Introduction Evolution of Medicare as a Purchaser
Mandated Nurse Staffing Levels Literature Review
 Mandated Nurse Staffing Levels Literature Review March 2013 Created By: Kirsten Ehresmann, Research Assistant HealthEast Research Executive Summary Background The state of California was the first state
The Impact of State Nursing Home Staffing Standards on Nurse Staffing Levels
 594733MCRXXX10.1177/1077558715594733Medical Care Research and ReviewPaek et al. research-article2015 Empirical Research The Impact of State Nursing Home Staffing Standards on Nurse Staffing Levels Medical
paymentbasics Defining the inpatient acute care products Medicare buys Under the IPPS, Medicare sets perdischarge
 Hospital ACUTE inpatient services system basics Revised: October 2007 This document does not reflect proposed legislation or regulatory actions. 601 New Jersey Ave., NW Suite 9000 Washington, DC 20001
Prepared for North Gunther Hospital Medicare ID August 06, 2012
 Prepared for North Gunther Hospital Medicare ID 000001 August 06, 2012 TABLE OF CONTENTS Introduction: Benchmarking Your Hospital 3 Section 1: Hospital Operating Costs 5 Section 2: Margins 10 Section 3:
Executive Summary. This Project
 Executive Summary The Health Care Financing Administration (HCFA) has had a long-term commitment to work towards implementation of a per-episode prospective payment approach for Medicare home health services,
Continuing nursing education: best practice initiative in nursing practice environment
 Available online at www.sciencedirect.com Procedia - Social and Behavioral Sciences 60 ( 2012 ) 450 455 UKM Teaching and Learning Congress 2011 Continuing nursing education: best practice initiative in
Relationship between Organizational Climate and Nurses Job Satisfaction in Bangladesh
 Relationship between Organizational Climate and Nurses Job Satisfaction in Bangladesh Abdul Latif 1, Pratyanan Thiangchanya 2, Tasanee Nasae 3 1. Master in Nursing Administration Program, Faculty of Nursing,
Forecasts of the Registered Nurse Workforce in California. June 7, 2005
 Forecasts of the Registered Nurse Workforce in California June 7, 2005 Conducted for the California Board of Registered Nursing Joanne Spetz, PhD Wendy Dyer, MS Center for California Health Workforce Studies
Nursing and Personal Care: Funding Increase Survey
 Nursing and Personal Care: Funding Increase Survey Prepared for: Ministry of Health and Long-Term Care Long Term Care Facilities Branch 5 th Floor, Hepburn Block 80 Grosvenor Street Toronto, Ontario Prepared
Quality Outcomes and Data Collection
 Quality Outcomes and Data Collection Presented By: Joanne Jones Director, Clinical Consulting Services August 30, 2016 Quality Measurement in LTC CMS Nursing Home Compare 5 Star Rating System New measures
NURSING (MN) Nursing (MN) 1
 Nursing (MN) 1") Nursing (MN) 1 NURSING (MN) MN501: Advanced Nursing Roles This course explores skills and strategies essential to successful advanced nursing role implementation. Analysis of existing and emerging roles
Nursing (MN) 1 NURSING (MN) MN501: Advanced Nursing Roles This course explores skills and strategies essential to successful advanced nursing role implementation. Analysis of existing and emerging roles
The Global Quest for Practice-Based Evidence An Introduction to CALNOC
 The Global Quest for Practice-Based Evidence An Introduction to CALNOC Presented on Behalf of the CALNOC TEAM by Diane Brown RN, PhD, FNAHQ, FAAN Nancy Donaldson RN, DNSc, FAAN CALNOC Strategic Overview
Nurse Managers Role in Promoting Quality Nursing Practice
 Nurse Managers Role in Promoting Quality Nursing Practice Mission Critical: Nurse Manager Summit Fredericton, New Brunswick April 30, 2015 Jeanne Besner, C.M., PhD, RN 1 Outline of Presentation Background
Identifying Research Questions
 Research_EBP_L Davis_Fall 2015 Identifying Research Questions Leslie L Davis, PhD, RN, ANP-BC, FAANP, FAHA UNC-Greensboro, School of Nursing Topics for Today Identifying research problems Problem versus
DOI: / Page
 IOSR Journal of Dental and Medical Sciences (IOSR-JDMS) e-issn: 2279-0853, p-issn: 2279-0861.Volume 14, Issue 11 Ver. IV (Nov. 2015), PP 31-35 www.iosrjournals.org A Study on Contract Nurse Staffing as
Findings Brief. NC Rural Health Research Program
 Do Current Medicare Rural Hospital Payment Systems Align with Cost Determinants? Kristin Moss, MBA, MSPH; G. Mark Holmes, PhD; George H. Pink, PhD BACKGROUND The financial performance of small, rural hospitals
CASE-MIX ANALYSIS ACROSS PATIENT POPULATIONS AND BOUNDARIES: A REFINED CLASSIFICATION SYSTEM DESIGNED SPECIFICALLY FOR INTERNATIONAL USE
 CASE-MIX ANALYSIS ACROSS PATIENT POPULATIONS AND BOUNDARIES: A REFINED CLASSIFICATION SYSTEM DESIGNED SPECIFICALLY FOR INTERNATIONAL USE A WHITE PAPER BY: MARC BERLINGUET, MD, MPH JAMES VERTREES, PHD RICHARD
Copyright 2018 Wolters Kluwer Health, Inc. All rights reserved.
 26 June 2018 Nursing Management www.nursingmanagement.com nursingmanagement.com STAFFING SERIES PART 2 1.5 CONTACT HOURS Meeting the measurements of inpatient staffing productivity L By Pamela S. Hunt,