Supporting Cancer prevention strategies using Geospatial Analysis on HRSA data
|
|
|
- Denis Riley
- 6 years ago
- Views:
Transcription
1 Supporting Cancer prevention strategies using Geospatial Analysis on HRSA data CP GIS Capstone Project; Spring 2016 Arthi Rao, Doctoral Candidate School of City and Regional Planning, Georgia Institute of Technology
2 Introduction The Affordable Care Act of 2010 greatly expanded the role of Federally Qualified Health Centers (FQHCs) in providing healthcare services to underserved communities. The American Cancer Society (ACS) and other public health organizations consider FQHCs as key collaborators in a national effort to promote disease prevention. ACS leads cancer prevention initiatives such as colorectal (80% by 2018) and breast cancer screening, and recently is working with the CDC to increase HPV vaccination uptake. FQHCs are required to report on a number of measures regarding the operation and performance of health centers. These include clinical, operational and financial data as well as aggregate patient characteristics including health outcomes, services and residential zip codes. Among these measures are rates for colorectal cancer screening, breast cancer screening and cervical cancer screening (pap smears). Geographic coverage of service areas for health providers and healthcare utilization is available through organizations such as HRSA, Dartmouth Atlas and others. These types of spatial data are routinely used in health policy research. However, the spatial coverage of safety net providers such as FQHCs has not been studied. The goal of this project was to develop a methodology to generate and visualize FQHC service areas. The project also demonstrates how geospatial analysis of HRSA and Census data can identify factors associated with disparities in cancer screening rates and redirect available resources strategically towards local cancer prevention efforts and other targeted interventions. Both contiguity and non-contiguity based methods were compared and core service areas (SAs) were generated using Python scripts (PHASE I). The methodology is validated by examining both spatial and temporal trends within the geographical distribution of service areas 1
3 for 2012, 2013 and 2014 data. Core service areas are layered with socioeconomic profiles, urban/rural classifications, cancer screening rates and other data from publicly available sources, such as the Census and BRFSS. Screening rates for colorectal cancer as reported by FQHCs are also mapped to demonstrate the utility of this methodology. The analysis identified Communities of Focus where there is high co-occurrence of risk factors (PHASE II). The advanced spatial analysis and modeling were effective in identifying areas of low screening rates and associated socioeconomic determinants. This integrated information will be used to evaluate performance of ACS cancer screening initiatives and to support better targeting and improved resource allocation in communities. Data, methods, and a collaborative roadmap for utilizing this research within the organization are elucidated in this paper. A brief history of FQHCs Federally Qualified Health Centers were established in 1965 during the Lyndon Johnson administration as part of the War on Poverty program. Neighborhood (Community) Health centers were commissioned by the Office of Economic Opportunity to provide poor and medically underserved communities with access to health and social services (safety-net provideers). These health centers were formally sanctioned and funded under Section 330 of the Public Health Service Act (PHSA). The grant funding program is administered by the Health Resources and Services Administration (HRSA), Bureau of Primary Health Care within the U.S. Department of health and Human Services (HHS). FQHCs receive grant funds from HHS to cover the cost of providing care to uninsured patients. They also bill Medicaid, Medicare and private insurers for services provided to insured patients. In order to receive section 330 grant funds, an FQHC must meet the following requirements (Taylor, 2012): 2
4 Must be located in a federally designated medically underserved area (MUA) or serve a federally designated medically underserved population (MUP) Have nonprofit or public status Provide comprehensive primary health care services and referrals Provide services such as case management, translation and transportation that facilitate access to care Have a governing board where majority of the members are patients of the health center Provide services to everyone regardless of their ability to pay and have a sliding fee schedule that adjusts to the family income. FQHCs and Cancer Prevention FQHCs provide comprehensive primary and preventive care to patients regardless of their ability to pay for services. The Affordable Care Act (ACA) greatly expanded the role of FQHCs by increasing infrastructural support as well as extension of Medicaid coverage to lowincome adults, irrespective of their family status. The ACA is predicted to create an influx of newly-insured, low income patients into FQHCs. These patients are at higher risk for cancer due to their socioeconomic status. In addition to disproportionate cancer morbidity and mortality, the uninsured and underinsured also get much lower levels of preventive services including screening for breast, colorectal and cervical cancer compared to the general population. However, several measures including increased funding, patient-centered medical home transformation, electronic health record implementation and increased emphasis on screening from HRSA is anticipated to increase screening levels within FQHCs (Allen et al., 2013; Daly et al, 2015; Martinez-Gutierrez et al., 2013; Taplin et al., 2008). Cancer-focused organizations such 3
5 as the ACS are seeking to collaborate with FQHCs to increase cancer screening and other prevention strategies. Significance of Study Geographic datasets such as Hospital Referral Regions (HRRs), Hospital service areas (HSAs), Pediatric surgical areas (PSAs) and Primary care service areas (PCSAs) are available through a joint effort between HRSA and The Dartmouth Institute for Health Policy and Clinical Practice. These datasets are freely downloadable at the Dartmouth Atlas for Healthcare website. A key limitation to this data is that it only captures Medicare related patient utilization patterns. These datasets are also developed by aggregating different spatial units and capture related but different aspects of the healthcare system. To date, the spatial distribution and coverage of FQHC utilization patterns (safety-net services) have not been studied at a national scale. If interventions for improving screening are to be effective, it would be useful to visualize the geographical patterns of FQHC utilization and understand their socioeconomic/demographic composition. Organizations can then strategically plan their interventions by identifying Communities of Focus or areas of low screening rates where risk factors coalesce. The American Cancer Society plays a primary role in prevention initiatives such as the 80% by 2018 convened through the National Colorectal Cancer Roundtable (NCCRT) jointly founded by the CDC and ACS and is a coalition between several agencies. The aim is to increase colorectal cancer screening rates to 80% by the year Breast and cervical cancer screening and tobacco cessation are other important areas of focus. The ACS also funds FQHCs to improve their screening programs. An analysis of FQHC service areas and understanding their constituent 4
6 communities are foreseen to help all of these initiatives. This paper primarily focuses on an analysis of colorectal cancer screening. Healthcare Service Areas Service areas, also referred to as catchment areas, are geographic areas that capture the patient population utilizing a particular hospital or other healthcare provider. These areas usually represent patient travel patterns and demonstrate variations in patterns of utilization (Klauss et al, 2005). Several variations on the definitions and methodologies used to construct these service areas exist based on their intended purpose. Some commonly used typologies are described in table 1. Table 1. Typologies of commonly available healthcare service areas Service Area Definition Methodology Hospital service areas (HSAs) Hospital referral regions (HRRs) Polygons representing local health care markets for hospital care. An HSA is a collection of ZIP codes whose residents receive most of their hospitalizations from the hospitals in that area. Polygons representing regional health care markets for tertiary medical care that generally requires the services of a major referral center. The regions were defined by determining where patients were referred for major cardiovascular surgical procedures and for HSAs were defined by assigning ZIP codes to the hospital area where the greatest proportion of their Medicare residents were hospitalized. Minor adjustments were made to ensure geographic contiguity. This process resulted in 3,436 HSAs. When these regions were created in the early 1990s, most hospital service areas contained only one hospital. In the intervening years, hospital closures have left some HSAs with no hospital; these HSAs have been maintained as distinct areas in order to preserve the continuity of the database. Each hospital service area (HSA) was examined to determine where most of its residents went for these services. The result was the aggregation of the 3,436 hospital service areas into 306 HRRs. Each HRR has at least one city where both major cardiovascular surgical procedures and neurosurgery are performed. 5
7 Primary care service areas (PCSAs) Health Service Areas neurosurgery. Polygons reflect Medicare patient travel to primary care providers. Polygons representing a single county or cluster of contiguous counties which are relatively selfcontained with respect to hospital care Population zip codes were assigned to the provider zip code where the plurality of beneficiaries received care, and these assignments were adjusted to create contiguous zip code groups Counties grouped into service areas through agglomerative hierarchical clustering analysis. Based on the methodology for each service area described in table 1, it can be seen that these readily downloadable datasets focus on Medicare utilization patterns. There is no such data available on FQHCs or other community health providers. Generating and mapping the FQHC service areas would enable visualizing the spatial distribution and coverage of safety-net health services. This exercise would be valuable in and of itself to inform a wide variety of purposes within ACS and within the larger research community engaged in health policy and services research. Within ACS, overlaying socioeconomic and other risk factors over this base layer was foreseen to inform strategic prevention initiatives as well as resource allocation and fund raising. UDS Data on Federally Qualified Health Centers The Uniform Data System (UDS) is a reporting requirement for Health Resources and Service Administration (HRSA) grantees, including community health centers, migrant health centers, health care for the homeless grantees, and public housing primary care grantees. FQHCs are required to submit data annually to the Bureau of Primary Health Care (BPHC) through HRSA s Electronic Handbook (EHB) system. The UDS is a core system of information appropriate for reviewing the operation and performance of health centers, identify trends over tie and improve health center performance. UDS data are compared with national data to review 6
8 differences between the U.S population at large and those individuals and families who rely on the health care safety net for primary care. The UDS is comprised of 12 tables designed to yield consistent clinical, operational, and financial data: 1. Patient Origin: Patients served reported by ZIP code and by primary third party medical insurance source, if any 2. Table 3A: Patients by age and gender 3. Table 3B: Patients by race, Hispanic/Latino ethnicity, and language barriers 4. Table 4: Patients by income (percent of poverty level) and primary third party medical insurance source; Table 4 also reports the number of special population patients receiving services, and managed care member months. 5. Table 5: Full-time equivalent staff by position, visits by provider type, and patients by service type 6. Table 5A: Tenure for selected health center staff 7. Table 6A: Selected diagnoses for medical, mental health, and substance abuse visits; and selected medical and dental services provided 8. Table 6B: Quality of care measures 9. Table 7: Health outcomes measures by race and ethnicity 10. Table 8A: Direct and indirect expenses by cost center 11. Table 9D: Full charges, collections, and allowances by payor type as well as sliding discounts and patient bad debt 12. Table 9E: Non patient-service income The entire set of 12 tables was obtained through a Freedom of Information Act (FOIA) request. The Patient Origin and Quality of Care measures tables were utilized in this project. The initial request was made for 2012 data. Subsequently, 2013 and 2014 data were also obtained through the same process. The service area methodology and subsequent analysis documented in this paper was performed on 2012 data. 7
.")
9 Tables 2 and 3 provide a snapshot of the data and structure of the variables. Table 2 shows an example of an FQHC identified through the BHCMISID (unique identifier that stays consistent for all years). The ZipCode, ZipCodeType and TotalNumberofPatients are the primary variables of interest. The BHCMISID shares a one-to-many relationship with the other variables. Table 2. The "Patient Origin" table showing the number of patients from each zipcode seen at an FQHC (the BHCMISID is the unique identifier for an FQHC) Under ZipCodeType, there are two categories 1) Other ZIP Codes 2) Unknown Residence, that indicate that there are some patients for whom the zipcode is not known or recorded. These categories do not contain a specific spatial reference and cannot be used in the construction of Service Areas. Patients from these categories will not be accounted for in the service areas and geospatial analysis and forms a key limitation of the method. However, a preliminary evaluation was done to assess how much total information would be lost due to their exclusion. There were a total of 1194 unique FQHCs in the 2012 data. 13 FQHCs had less than 80% captured from known zipcodes (table 3). 8


10 Table 3. Percentage of patients remaining after eliminating unidentifiable zipcodes The Quality of Care measures table (table 4) has numerous measures pertaining to screening snd prevention rates for each FQHC. The colorectal screening rates are used as a demonstration in this study. Table 4. A sample of the "Quality of Care measures table where the colorectal cancer screening rates for each FQHC (identified through the BHCMISID) are recorded. 9
11 Overview of Service Area Methodology (PHASE I) From a methodological perspective, the primary aim of this project was to create Core Service Areas that effectively captured a majority of the FQHC patient population. The core SAs would be a representation of the community surrounding the FQHC. Census tract level socioeconomic and other risk factors were then computed for each SA. Risk factors for colorectal cancer and screening rates were overlaid on the SAs to identify communities of focus for strategic prevention initiatives. The overall process is outlined in fig.1 below. Data Cleaning Eliminate table records with missing or unknown ZCTAs Data Integration Iterate through the table based on FQHC ID and join with ZCTA shapefile (inner join) Dissolve the output from the join process to create a contiguous polygon Exploratory Data Analysis (EDA) Spatial Diagnostics - How many patients were serviced from each ZCTA Remove low service ZCTAs Core Service Areas Overlay analysis to identify Communities of Focus Figure 1. Overview of Methodology 10
12 Creating the baseline Service Areas The cleaned excel file (removal of ZipCodeType with Other and Unknown categories) was used for generating the first round of Service Areas that included all patients with known zipcodes of origin. Using the census crosswalk files, zipcodes were matched to their respective zctas to prevent loss of patients from zipcodes that were not an exact match with a zcta. Patient counts for each zcta were further aggregated using pivot tables. Since this was the first attempt at creating the SAs, the decision was made to keep each component of the process separate to retrace steps and be able to inspect every FQHC individually. It was also essential to make each SA available individually for further analysis. The first step was to create separate tables for each unique FQHC and store it within a folder. A free downloadable excel add-in (ASAP utilities) was used to accomplish this task. The algorithm shown in fig.1 was then developed to write and execute the Python scripts. A discrete polygon shapefile was created for each FQHC and saved in a folder. After the dissolve process, the polygons did not contain any attribute information. However, ideally, each polygon would be able to be identified through the BHCMISID associated with the FQHC that it served. The BHCMISID was extracted from the name of the shapefile and added to an additional field created in the attribute table for each SA shapefile. These steps were also executed using python scripts. The SAs were then mapped to visualize the spatial distribution of SAs including all patients. 11
13 Remove rows with categories such as Unknown Residence and Other Zip Codes. These do not contain a specific spatial reference and cannot be used in the creation of Service Areas. Used this cleaned workbook for further analysis. Create separate tables for each FQHC and store in a folder (ASAP utilities). List Tables in folder Create a loop where each table is selected based on the list. For each table, join with ZCTA shapefile (inner join). For each table, Dissolve the output from the join process to create a contiguous polygon. For each table, remove the join so that all zctas are available for the next table. Figure 2. Algorithm used to write Python scripts to generate Service Area polygons. Exploratory Data Analysis (EDA) When the Service Areas were mapped from the previous process, the FQHC coverage appears really good geographically. However, this information could be misleading as numerous Service Areas have several distant and proximal zipcodes with just 1 patient. The EDA was executed to examine scenarios where zip codes with small patient populations would be 12
 Calculate information loss when Unknown & Other categories are removed Investigating the result of spatialcontiguitybased")
14 eliminated from the Service Areas and the resulting information that would be lost. The logic of the EDA process is explained in fig.3 below. Calculate 100% Totals from original FQHC file (KnownZip+Unknown + Other) Calculate information loss when Unknown & Other categories are removed Investigating the result of spatialcontiguitybased analysis to capture core service areas Generate Spatial Weights Matrix in ArcGIS Calculate total patients in FQHC zip and neighbors Calculate % of patients captured by FQHC zip and neighbors Calculate information loss scenarios after removing 1,5,10,15 patients 99% of FQHCs > 80% of patient information captured Investigating the result of capturing the core area based only on the number of patients Too much variation in information captured!! More Consistent Figure 3. Overview of the EDA process Both contiguity and non-contiguity based methods were evaluated to inform the methodology. The contiguity based method was built on the assumption that majority of FQHC patients reside in the immediate neighborhood of the FQHC location. This is a commonly used approach to creating service areas as healthcare utilization patterns are assumed to be fairly localized. However, these patterns are regulated through insurance and other mechanisms that determine healthcare access and are less relevant to FQHC access. The first step in the EDA process was to compare the number of patients captured by aggregating patients from the zipcodes in the immediate neighborhood of each FQHC. This was 13

15 accomplished by adding up patients from the zctas containing the FQHC as well as those surrounding it as identified from the contiguity matrix generated in ArcGIS (table 5). Table 5. ArcGIS generates a sparse matrix that only identifies the adjacent zipcodes. The next step was to calculate total patients in FQHC zip and neighbors. The percentage of patients captured by this method was calculated by dividing the previously calculated total by the total patients from all known zipcodes going to that FQHC. Both these calculations are shown in table 6. 14

16 Table 6. Calculating total patients in FQHC zip and neighbors The next step in the EDA process was to examine a non-contiguity based method that systematically eliminated zctas with small numbers of patients. Scenarios for removing 1, 5, 10, 15, 20 and 30 patient zctas were examined both through pivot table analysis as well as spatial techniques. For example, all zctas contributing 1 patient to any FQHC were removed. The total patients remaining after this elimination were aggregated and the percentage of the total FQHC patient population that they represented was calculated. A similar process was executed for the rest of the scenarios. Two criteria were considered in selecting the optimal threshold for eliminating zctas with small patient populations. The first criterion was the 80% threshold the point at which most FQHCs are still represented by 80 % of their total population after eliminating small patient zctas. The second criterion was to look at the number of zctas that would be eliminated from the analysis as they consistently contributed small patient populations across all FQHCs. This criterion was important because several zctas have memberships in multiple FQHC Service 15
17 Areas. The criterion was intended to isolate zips that consistently contribute small number of patients to all of the FQHCs they are associated with. Conversely, a zip that provides small number of patients to one FQHC but many patients to another will remain. The performance of the contiguity and non-contiguity based methods were compared. The histograms below show the distributions of the percentage of patients captured by each method (fig.4). The contiguity method shows a high variability (undesirable) with a large number of zeroes. This potentially indicates that Service Areas are not spatially continuous on a consistent basis. The non-contiguity method is clearly superior even after eliminating zctas with small patient populations. The distribution is strongly concentrated in 90%-100% region (desirable). Figure 4. Comparing the contiguity and non-contiguity methods 16
18 Different methodologies have been used to resolve the problem with overlapping polygons for service areas. For example, in the case of the HRSA datasets, a plurality rule is applied where a zcta (or other geographical unit) is assigned only to one healthcare provider (hospital, doctor, etc.). When a zcta contributes to multiple service areas, the provider that gets the maximum number of patients retains ownership of the zcta. Accordingly, the zcta is not represented in other service areas. Service area boundaries are further simplified to eliminate overlap and retain contiguity. For example, overlapping service areas may be dissolved so that one service area contains multiple providers. This can also be characterized as more of a patientcentered approach rather a provider-centered one. Another approach is to define a service area based on the plurality of services consumed by the majority population (majority and plurality rules). These methods, however, are more applicable to datasets that contain healthcare consumption data for individuals (Klauss et al, 2005; Goodman et al, 2003; Makuc et al, 1991). Another simpler method is to limit the service area so that it captures between 80% to 90% of the patient population (Cromley and McLafferty, 2012). This method was better suited to this study for two reasons. First, the dataset does not contain information on individuals. Only aggregate counts for each zipcode are provided. Second, specific communities for each FQHC needed to be identified for assessing performance with respect to cancer screening. This aligns better with ACS goals of improving screening rates within each FQHC, particularly in underperforming ones. After carefully examining the scenarios shown in table 7 and fig.5, the decision was made to eliminate zctas that contributed upto 15 patients (Core Service Areas). This threshold still allowed for upto 99% of the FQHCs to account for 80% of their patient population. Python scripts were revised to eliminate the 15 patient (and less) zctas from each FQHC and recreate new polygons that represented the Core Service Areas shown in fig.6. 17


19 Table 7. Scenarios eliminating unique zctas contributing small numbers of patients Scenario Number % of Total ZCTAs Unique 1 Patient ZCTAs Unique 5 Patient ZCTAs Unique 10 Patient ZCTAs Unique 15 Patient ZCTAs Unique 20 Patient ZCTAs Unique 30 Patient ZCTAs Figure 5. Maps showing the spatial distribution of unique ZCTAs that will be eliminated for each scenario (marked in orange) 18

20 Figure 6. Spatial coverage of Core Service Areas Validating the Methodology Service areas for FQHCs in 2013 and 2014 were generated using the identical methodology outlined in the preceding sections to assess its validity for successive years. A preliminary analysis indicated that the methodology performed consistently for the three years. The maps shown in fig.7 help visualize the spatial coverage of FQHC service areas in 2013 and 2014 respectively. There appears to be a marginal improvement in coverage in the lower part of the Midwest (potentially new FQHCs) and will be looked at further in future analysis. The histograms shown in fig.8 help communicate the changes in patient capture from year to year. 19


21 Figure 7. FQHC Core Service Areas for 2013 and
22 % of FQHCs % of FQHCs % of FQHCs CP 6950 GIS Capstone Project Arthi Rao A total of 1167 FQHCs had consecutive data for the years 2012, 2013 and Percent change in the number of patients captured by the Service Area methodology was compared. There were minor variations between years. Overall, between 2012 and 2014, 719 FQHCs (61%) captured the same or more patients (greater than or equal to 80% of total patient population) based on the methodology developed. Of the 447 FQHCs that saw a decrease, 413 had a decrease of less than 2% in the percentage of patients captured. Change in % of Patients Captured Change in % of Patients Captured Change in % of Patients Captured Figure 8. Trends in percentage of patients captured between 2012, 2013 and
23 Identifying Communities of Focus (Phase II) The next phase in the analysis was to identify areas of geographic focus for ACS interventions. These focus areas represent the cumulative occurrence of risk factors, social vulnerability and low cancer screening rates. Fig.9 outlines the methodological framework for identifying these communities of focus. The framework is focused on colorectal cancer screening due to its significance to ACS initiatives such as the 80% by 2018 NCCRT (national roundtable). Join demographic and socioeconomic data to census tracts within service areas Identify areas of co-occurrence for high vulnerability and low screening rates Identify Communities of Focus for strategic cancer intervention strategies Age (50-75) Spatial overlay Gender (% male) analysis Race/Ethnicity (% non-white) Income (% poverty) Education (< high school) Rural/Urban classification Demonstrate examples of typologies for Colorectal Cancer Screening Figure 9. Methodological framework for identifying Communities of Focus The risk factors (socioeconomic and demographic) shown in the framework were identified directly from prior peer-reviewed research published by ACS (Siegel et al, 2015). The variables in blue were used for immediate analysis. The variables greyed out will be considered in future analysis. Census data for the socioeconomic and demographic variables selected are available at census tract and county scales. The service areas were evaluated against both sets of political boundaries to gauge the appropriate level of analysis. 22

24 Counties, particularly in urban areas, have non-uniform population distributions. This is reflected in the size of the tracts. They get smaller towards the urban core, reflecting a higher population density. When service areas only partially cover spatial units, proportioning the population based on area in the tract would be a better approximation rather than area of county included (fig.10). Therefore, census tract level overlay analysis was considered the best suited for the purposes of this project. Counties_2010 GA_Tracts ServiceArea_ Figure 10. Overlaying counties, census tracts and Service Areas Based on the algorithm illustrated in fig.11, python scripts were written to intersect each service area with census tract boundaries. Areas of the tracts within each Service Area were calculated. Tracts which were partially included within the service area will have reduced areas (IntSubArea) compared to their original areas before they were intersected (Area1). The percentage area of the tract represented within the service area was used as a weight to 23


25 proportion the population and associated socioeconomic and demographic variables (fig.12). The resulting dbf tables from each of the service area shapefiles were appended into a single excel table for further analysis. Calculate area in square miles for each shapefile (service area) Intersect Tracts with Service Areas (SA). This creates a set of shapefiles with sub-areas of tracts nested within the Service Areas Calculate area in square miles for each subarea within SA Calculate % of sub-area (tract area) belonging to the SA Figure 11. Algorithm for intersecting Service Areas with census tracts 24


26 FQHC ID and FQHC SA area in sq miles Tracts that the SA intersects with Area1 is the area of the full tract and IntSubArea is the area of the portion of that tract within the SA Figure 12. Attribute tables with percentage of tract area calculated The relevant socioeconomic and demographic variables were downloaded from the American Community Survey year estimates were used for the analysis. This table served as a master vlookup table for joining with the appended attribute tables. Using the VLOOKUP function in excel, each tract within every Service Area was assigned the matrix of risk factor variables. The variables were multiplied by the respective tract weights (IntSubArea) to calculate the proportion within each Service Area. Pivot tables were used to aggregate the totals for each variable by the FQHC Service Area (table 8). This restructures the data from a stacked table (multiple rows for each FQHC) to a table with one row of variables per FQHC. 25

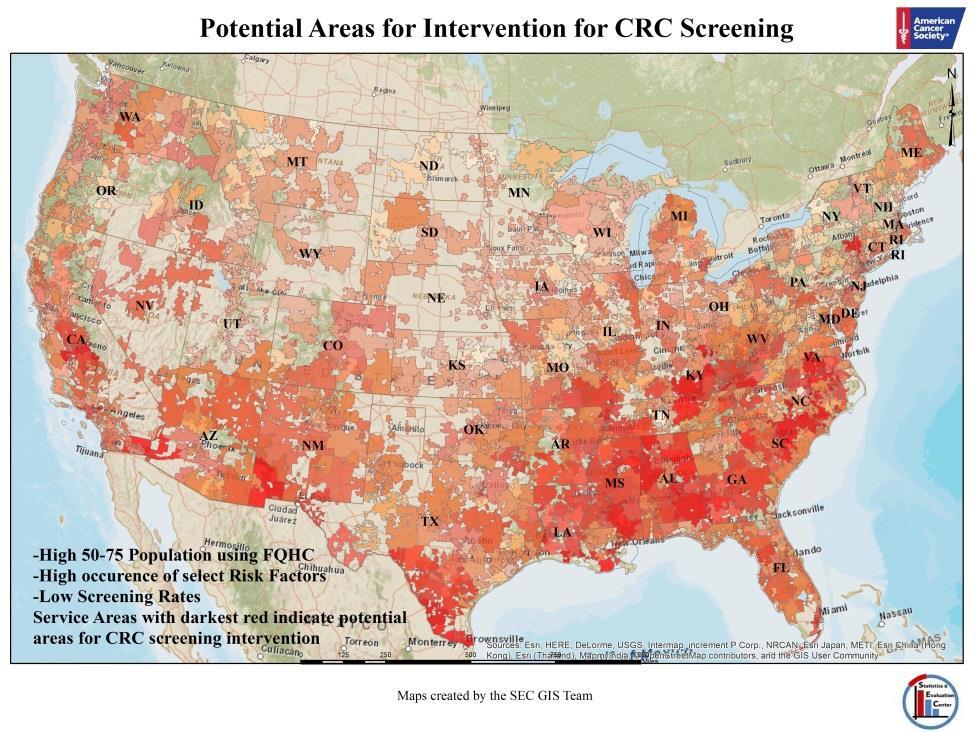
27 Table 8. Risk factor variables proportioned and aggregated to the service area level Percentages for each variable were calculated based on the total population in the service areas. Percentages make the service areas comparable. The percentages were further normalized by calculating z-scores and added up to calculate a composite index score of risk factors. The risk index was overlaid with the screening rates and with FQHC utilization rates by the age group. The layers were overlaid using transparent color fill (graduated red tones) for the polygons (service areas). When the layers were placed over each other, it became easy to visualize Communities of Focus with the darkest color (highest intensity of red). The series of maps below show the individual layers as well as the results of the overlay analysis. 26

28 27

29 28
30 Contributions to ACS initiatives This analysis is envisioned to contribute to the following ACS initiatives: National Colorectal Cancer Roundtable- 80% x 2018 Identify FQHC for focused intervention for CRC screening Cervical Cancer Prevention As part of the HPV Roundtable effort, identify FQHCs to promote HPV vaccination efforts (immunization) Identify FQHCs for increasing utilization of pap tests (screening) Lung cancer prevention Identify FQHCs for increased efforts towards Tobacco use assessment and intervention Breast Cancer prevention Identify areas of focus for increasing breast cancer prevention efforts (mammograms, exams) Directions for Further Research Preliminary statistical analysis did not yield significant results. While the methodology was useful in identifying vulnerable communities, the determinants of screening rates might be internal to the FQHC. Therefore this approach might not be as effective in predicting screening rates based on community-level characteristics. More in-depth analysis will be pursued to better understand mechanisms internal t the FQHC that are more closely related to screening rates. Meanwhile, methods such as hierarchical clustering will be applied to identify and categorize these communities of focus to inform the design of strategic interventions. Other techniques of index construction will also be explored. The particular requirement for reporting screening rates to the UDS system was initiated in It is possible that there may be errors associated with data reporting as FQHCs tried to 29
31 cope with the new reporting protocols. The analysis carried out on 2012 data will be extended to 2013 and 2014 data to examine data consistency and validity. The analytical approach will also be applied to other cancer prevention initiatives outlined in the previous section. 30
32 References: Allen, C. L., Harris, J. R., Hannon, P. A., Parrish, A. T., Hammerback, K., Craft, J., & Gray, B. (2013). Opportunities for Improving Cancer Prevention at Federally Qualified Health Centers. Journal of Cancer Education, 29(1), doi: /s Cromley, E.K. and McLafferty, S.L. (2012). GIS and Public Health (2 nd edition). Guilford Press, New York, NY. Daly, J., Levy, B., Moss, C., & Bay, C. (2015). System Strategies for Colorectal Cancer Screening at Federally Qualified Health Centers. American Journal of Public Health, 105(1), Goebel, J. (2013). A Brief History of Federally Qualified Health Centers (FQHC). Goodman, D., Mick, S., Bott, D., Stukel, T., Chang, C., Marth, N.,... Carretta, H. (2003). Primary Care Service Areas: A New Tool for the Evaluation of Primary Care Services. Health Services Research, 38(1p1), Klauss, G., Staub, L., Widmer, M., & Busato, A. (2005). Hospital service areas a new tool for health care planning in Switzerland. BMC Health Services Research, 5, 33. Makuc DM et al. (1991). Health service areas for the United States National Center for Health Statistics. Vital Health Stat (2)1 12, U.S. Department of Health and Human Services. Martinez-Gutierrez, J., Jhingan, E., Angulo, A., Jimenez, R., Thompson, B., & Coronado, G. (2013). Cancer Screening at a Federally Qualified Health Center: A Qualitative Study on Organizational Challenges in the Era of the Patient-Centered Medical Home. Journal of Immigrant and Minority Health, 15(5), doi: /s Taplin, S. H., Haggstrom, D., Jacobs, T., Determan, A., Granger, J., Montalvo, W.,... Calvo, A. (2008). Implementing Colorectal Cancer Screening in Community Health Centers: Addressing Cancer Health Disparities through a Regional Cancer Collaborative. Medical Care, 46(9), S74-S83. Taylor, J. (2012). Changes in Latitudes, Changes in Attitudes: FQHCs and Community Clinics in a Reformed Health Care Market. Siegel RL, Sahar L, Robbins A, Jemal A.(2015). Where can colorectal cancer screening interventions have the most impact? Cancer Epidemiol Biomarkers Prev. 24(8): doi: / EPI Epub 2015 Jul 8. 31
Analysis and Use of UDS Data
 Analysis and Use of UDS Data Welcome and thanks for dropping by to learn about how to analyze and use the valuable UDS data you are reporting! Please click START to begin. Welcome If you have attended
Colorado s Health Care Safety Net
 PRIMER Colorado s Health Care Safety Net The same is true for Colorado s health care safety net, the network of clinics and providers that care for the most vulnerable residents. The state s safety net
RUPRI Center for Rural Health Policy Analysis Rural Policy Brief
 RUPRI Center for Rural Health Policy Analysis Rural Policy Brief Brief No. 2015-4 March 2015 www.public-health.uiowa.edu/rupri A Rural Taxonomy of Population and Health-Resource Characteristics Xi Zhu,
Community Health Needs Assessment for Corning Hospital: Schuyler, NY and Steuben, NY:
 Community Health Needs Assessment for Corning Hospital: Schuyler, NY and Steuben, NY: November 2012 Approved February 20, 2013 One Guthrie Square Sayre, PA 18840 www.guthrie.org Page 1 of 18 Table of Contents
COMMUNITY HEALTH NEEDS ASSESSMENT HINDS, RANKIN, MADISON COUNTIES STATE OF MISSISSIPPI
 COMMUNITY HEALTH NEEDS ASSESSMENT HINDS, RANKIN, MADISON COUNTIES STATE OF MISSISSIPPI Sample CHNA. This document is intended to be used as a reference only. Some information and data has been altered
Analysis of 340B Disproportionate Share Hospital Services to Low- Income Patients
 Analysis of 340B Disproportionate Share Hospital Services to Low- Income Patients March 12, 2018 Prepared for: 340B Health Prepared by: L&M Policy Research, LLC 1743 Connecticut Ave NW, Suite 200 Washington,
GAO HEALTH RESOURCES AND SERVICES ADMINISTRATION. Many Underserved Areas Lack a Health Center Site, and the Health Center Program Needs More Oversight
 GAO August 2008 United States Government Accountability Office Report to the Ranking Member, Subcommittee on Oversight and Investigations, Committee on Energy and Commerce, House of Representatives HEALTH
Overview Application for a Medically Underserved Population Designation for Fairfax County
 Overview Application for a Medically Underserved Population Designation for Fairfax County Definitions/General Information Medically Underserved Areas (MUAs)/Medically Underserved Populations (MUPs) are
Geiger Gibson / RCHN Community Health Foundation Research Collaborative. Policy Research Brief # 42
 Geiger Gibson Program in Community Health Policy Geiger Gibson / RCHN Community Health Foundation Research Collaborative Policy Research Brief # 42 How Has the Affordable Care Act Benefitted Medically
Health Centers Overview. Health Centers Overview. Health Care Safety-Net Toolkit for Legislators
 Health Centers Overview Health Centers Overview Health Care Safety-Net Toolkit for Legislators Health Centers Overview Introduction Federally Qualified Health Centers (FQHCs), also known as health centers,
GIS Strengthens Health Services Policy and Programming. Ana Lòpez-De Fede, PhD
 GIS Strengthens Health Services Policy and Programming Ana Lòpez-De Fede, PhD GIS Strengthens Health Services Policy and Programming Ana Lòpez-De Fede, PhD Rebecca Wilkerson John Stewart Kathy Mayfield-Smith
Community Clinic Grant Program
 This document is made available electronically by the Minnesota Legislative Reference Library as part of an ongoing digital archiving project. http://www.leg.state.mn.us/lrl/lrl.asp Commissioner's Office
NEED, RESPONSE, EVALUATIVE MEASURES, RESOURCES/CAPABILITIES, GOVERNANCE
 New Access Point application (2014) Considering Need The following selected excerpts on need were taken from the most recent New Access Point (NAP) funding announcement. Although each new HRSA funding
REPORT OF THE BOARD OF TRUSTEES
 REPORT OF THE BOARD OF TRUSTEES B of T Report 21-A-17 Subject: Presented by: Risk Adjustment Refinement in Accountable Care Organization (ACO) Settings and Medicare Shared Savings Programs (MSSP) Patrice
2015 Community Health Needs Assessment Saint Joseph Hospital Denver, Colorado
 2015 Community Health Needs Assessment Saint Joseph Hospital Denver, Colorado December 11, 2015 [Type text] Page 1 Contributors Denver County Public Health Dr. Bill Burman, Director, and the team from
An Introduction to MPCA and Federally Qualified Health Centers~ Partners for Quality Care
 An Introduction to MPCA and Federally Qualified Health Centers~ Partners for Quality Care AIM Partnership Forum June 5, 2014 Lynda C. Meade, MPA Director of Clinical Services Michigan Primary Care Association
XYZ Community Health Center
 Federally Qualified Health Centers and other safety-net clinics such as [XYZ Community Health Center] provide tremendous value and impacts to their communities from JOBS and ECONOMIC STIMULUS to local
Community Analysis Summary Report for Clinical Care
 Community Analysis Summary Report for Clinical Care BACKGROUND ABOUT THE HEALTHY COMMUNITY STUDY The Rockford Health Council (RHC) exists to build and improve community health in the region. To address
PROGRAM INFORMATION NOTICE
 PROGRAM INFORMATION NOTICE DOCUMENT NUMBER: 2003-21 DATE: August 26, 2003 DOCUMENT TITLE: Federally Qualified Health Center Look-Alike Guidelines and Application TO: Community Health Centers Migrant Health
Patient Protection and Affordable Care Act Selected Prevention Provisions 11/19
 Patient Protection and Affordable Care Act Selected Prevention Provisions 11/19 Coverage of Preventive Health Services (Sec. 2708) Stipulates that a group health plan and a health insurance issuer offering
Industry Market Research release date: November 2016 ALL US [238220] Plumbing, Heating, and Air-Conditioning Contractors Sector: Construction
![Industry Market Research release date: November 2016 ALL US [238220] Plumbing, Heating, and Air-Conditioning Contractors Sector: Construction](/thumbs/80/81994465.jpg "Industry Market Research release date: November 2016 ALL US [238220] Plumbing, Heating, and Air-Conditioning Contractors Sector: Construction") Industry Market Research release date: November 2016 ALL US [238220] Plumbing, Heating, and Air-Conditioning Contractors Sector: Construction Contents P1: Industry Population, Time Series P2: Cessation
Industry Market Research release date: November 2016 ALL US [238220] Plumbing, Heating, and Air-Conditioning Contractors Sector: Construction Contents P1: Industry Population, Time Series P2: Cessation
Methodist McKinney Hospital Community Health Needs Assessment Overview:
 Methodist McKinney Hospital Community Health Needs Assessment Overview: 2017-2019 October 26, 2016 Prepared by MHS Planning CHNA Requirement: Overview In order to maintain tax exempt status, the Affordable
Exploring Public Health Barriers and Opportunities in Eye Care: Role of Community Health Clinics
 Exploring Public Health Barriers and Opportunities in Eye Care: Role of Community Health Clinics Susan A. Primo, O.D., M.P.H., F.A.A.O. Director, Vision and Optical Services Emory Eye Center Professor
Predicting Medicare Costs Using Non-Traditional Metrics
 Predicting Medicare Costs Using Non-Traditional Metrics John Louie 1 and Alex Wells 2 I. INTRODUCTION In a 2009 piece [1] in The New Yorker, physician-scientist Atul Gawande documented the phenomenon of
Medically Underserved Population Status - A Progress Report. Barbara L. Kornblau JD, OTR University of Michigan - Flint
 Medically Underserved Population Status - A Progress Report Barbara L. Kornblau JD, OTR University of Michigan - Flint Disclaimer Objectives At the end of this session, participants will be able to: -
TECHNICAL ASSISTANCE GUIDE
 TECHNICAL ASSISTANCE GUIDE COE DEVELOPED CSBG ORGANIZATIONAL STANDARDS Category 3 Community Assessment Community Action Partnership 1140 Connecticut Avenue, NW, Suite 1210 Washington, DC 20036 202.265.7546
PHCPI framework: Presentation Crosswalk to Service Delivery Elements
 PHCPI framework: Presentation Crosswalk to Service Delivery Elements C. Service Delivery America s Federally Qualified Health Centers (FQHC) Program David Stevens, MD, FAAFP George Washington University
Designating Health Professional Shortage Areas and Medically Underserved Populations/ Medically Underserved Areas: A Primer on Basic Issues to Resolve
 Designating Health Professional Shortage Areas and Medically Underserved Populations/ Medically Underserved Areas: A Primer on Basic Issues to Resolve Prepared by the RUPRI Health Panel Andrew F. Coburn,
The Role of EIS in Communities of Solution: Using GIS and Epi to Activate Health Partnerships Alexander D. Langmuir Lecture, CDC
 The Role of EIS in Communities of Solution: Using GIS and Epi to Activate Health Partnerships Alexander D. Langmuir Lecture, CDC Bob Phillips, MD, MSPH Vice President for Research & Policy American Board
The Health Center Program Quality Improvement
 The Health Center Program Quality Improvement National Network for Oral Health Access Annual Conference November 8, 2016 Vy Nguyen, DDS, MPH Dental Officer, Office of Quality Improvement Bureau of Primary
California Community Health Centers
 California Community Health Centers Financial & Operational Performance Analysis, 2011-2014 Prepared by Sponsored by Blue Shield of California Foundation Introduction This report, prepared by Capital Link
Implementation Strategy For the 2016 Community Health Needs Assessment North Texas Zone 2
 For the 2016 Community Health Needs Assessment North Texas Zone 2 Baylor Emergency Medical Center at Murphy Baylor Emergency Medical Center at Aubrey Baylor Emergency Medical Center at Colleyville Baylor
Medicare Fee-For Service Provider Utilization & Payment Data Inpatient Public Use File: A Methodological Overview
 Medicare Fee-For Service Provider Utilization & Payment Data Inpatient Public Use File: A Methodological Overview May 30, 2014 Prepared by: The Centers for Medicare and Medicaid Services, Office of Information
Findings Brief. NC Rural Health Research Program
 Safety Net Clinics Serving the Elderly in Rural Areas: Rural Health Clinic Patients Compared to Federally Qualified Health Center Patients BACKGROUND Andrea D. Radford, DrPH; Victoria A. Freeman, RN, DrPH;
Total Cost of Care Technical Appendix April 2015
 Total Cost of Care Technical Appendix April 2015 This technical appendix supplements the Spring 2015 adult and pediatric Clinic Comparison Reports released by the Oregon Health Care Quality Corporation
HRSA Community Access Program: Local Achievements and Lessons Learned
 The Institute for Health, Health Care Policy, and Aging Research HRSA Community Access Program: Local Achievements and Lessons Learned Denise A. Davis, Dr.P.H., M.P.A. Amy M. Tiedemann, Ph.D. Joel C. Cantor,
1. Standard Contract Provisions [ 438.3(s)(3)]: Ensuring access to the 340B prescription drug program
![1. Standard Contract Provisions [ 438.3(s)(3)]: Ensuring access to the 340B prescription drug program](/thumbs/85/91553997.jpg "1. Standard Contract Provisions [ 438.3(s)(3)]: Ensuring access to the 340B prescription drug program") July 27, 2015 Centers for Medicare and Medicaid Services Department of Health and Human Services Attn: CMS-2390-P P.O. Box 8016 Baltimore, MD 21244-8016 RE: Proposed Rule for Medicaid and Children s Health
July 27, 2015 Centers for Medicare and Medicaid Services Department of Health and Human Services Attn: CMS-2390-P P.O. Box 8016 Baltimore, MD 21244-8016 RE: Proposed Rule for Medicaid and Children s Health
The Affordable Care Act and Its Potential to Reduce Health Disparities Cara V. James, Ph.D.
 The Affordable Care Act and Its Potential to Reduce Health Disparities Cara V. James, Ph.D. Director, Office of Minority Health Centers for Medicare & Medicaid Services April 22, 2013 The Affordable Care
Community Health Centers in the Dakotas, 2018
 Community Health Centers in the Dakotas, 2018 B y H. B r u c e Vo g t, M D, FA A F P ; J e n n i f e r Ti n g u e l y, M D, M P H ; J i l l F r a n k e n, M S ; a n d S h e l l y Te n N a p e l, M S W,
Fostering Effective Integration of Behavioral Health and Primary Care in Massachusetts Guidelines. Program Overview and Goal.
 Blue Cross Blue Shield of Massachusetts Foundation Fostering Effective Integration of Behavioral Health and Primary Care 2015-2018 Funding Request Overview Summary Access to behavioral health care services
Using population health management tools to improve quality
 Using population health management tools to improve quality Jessica Diamond, MPA, CPHQ Chief Population Health Officer CHCANYS Statewide Conference and Clinical Forum Sunday, October 18, 2015 Introduction
How to leverage state funding to bring federal dollars into Nevada
 How to leverage state funding to bring federal dollars into Nevada EXHIBIT F Senate Committee on Health and Human Services Date: 2-12-2013 Page: 1 of 38 FQHC Opportunities for Federal Funding FQHC 101
Social Determinants: The Next Phase of Value-Based Innovation
 Social Determinants: The Next Phase of Value-Based Innovation UNDERSTANDING AND INFLUENCING KEY PREDICTORS OF HEALTH OUTCOMES Presented by RAM Technologies, Inc. Social determinants: The next phase of
Cancer Screening in Primary Care: Lessons from Community Health Centers
 Cancer Screening in Primary Care: Lessons from Community Health Centers Dialogue for Action Washington, DC April 11, 2018 Durado Brooks, MD, MPH Managing Director, Cancer Control Intervention American
INNAUGURAL LAUNCH MAIN SOURCE OF PHILOSOPHY, APPROACH, VALUES FOR FOUNDATION
 FOUNDATION PHILOSOPHY DOCUMENT SEPTEMBER 29, 2015 INNAUGURAL LAUNCH MAIN SOURCE OF PHILOSOPHY, APPROACH, VALUES FOR FOUNDATION Foundation Philosophy TABLE OF CONTENTS 1) Introduction a. Foundation Approach
Community Health Needs Assessment. And. Community Health Strategic Plan
 Community Health Needs Assessment And Community Health Strategic Plan June 30, 2013 TABLE OF CONTENTS EXECUTIVE SUMMARY... Page 3 I. Objectives of a Community Health Needs Assessment... Page 7 II. Definition
Health Indicators. for the Dallas/Fort Worth Combined Metropolitan Statistical Area Brad Walsh and Sue Pickens Owens
 Health Indicators Our Community Health for the Dallas/ Fort Worth Combined Metropolitan Statistical Area Checkup 2007 for the Dallas/Fort Worth Combined Metropolitan Statistical Area Brad Walsh and Sue
STEUBEN COUNTY HEALTH PROFILE. Finger Lakes Health Systems Agency, 2017
 STEUBEN COUNTY HEALTH PROFILE Finger Lakes Health Systems Agency, 2017 About the Report The purpose of this report is to provide a summary of health data specific to Steuben County. Where possible, benchmarks
PCMH 2014 Record Review Workbook (RRWB)
") PCMH 2014 Record Review Workbook (RRWB) Purpose of the Record Review Workbook (RRWB) There are three elements in PCMH 2014 that require an accurate estimate of the percentage of patients for whom practices
PCMH 2014 Record Review Workbook (RRWB) Purpose of the Record Review Workbook (RRWB) There are three elements in PCMH 2014 that require an accurate estimate of the percentage of patients for whom practices
BCBSM Physician Group Incentive Program
 BCBSM Physician Group Incentive Program Organized Systems of Care Initiatives Interpretive Guidelines 2012-2013 V. 4.0 Blue Cross Blue Shield of Michigan is a nonprofit corporation and independent licensee
Primary Care Options in Rural Healthcare. Jonathan Pantenburg, MHA, Senior Consultant September 15, 2017
 Primary Care Options in Rural Healthcare Jonathan Pantenburg, MHA, Senior Consultant JPantenburg@Stroudwater.com September 15, 2017 Overview Overview Market Updates Definitions / Regulations Rural and
Draft for the Medicare Performance Adjustment (MPA) Policy for Rate Year 2021
 Policy for Rate Year 2021") Draft for the Medicare Performance Adjustment (MPA) Policy for Rate Year 2021 October 2018 Health Services Cost Review Commission 4160 Patterson Avenue Baltimore, Maryland 21215 (410) 764-2605 FAX: (410)
Draft for the Medicare Performance Adjustment (MPA) Policy for Rate Year 2021 October 2018 Health Services Cost Review Commission 4160 Patterson Avenue Baltimore, Maryland 21215 (410) 764-2605 FAX: (410)
Caution: DRAFT NOT FOR FILING
 Caution: DRAFT NOT FOR FILING This is an early release draft of an IRS tax form, instructions, or publication, which the IRS is providing for your information as a courtesy. Do not file draft forms. Also,
PCA/HCCN Health Center Program Update
 PCA/HCCN Health Center Program Update National Association of Community Health Centers Community Health Institute August 30, 2016 Tonya Bowers, MHS Acting Associate Administrator Bureau of Primary Health
New York State s Ambitious DSRIP Program
 New York State s Ambitious DSRIP Program A Case Study Speaker: Denise Soffel, Ph.D., Principal May 28, 2015 Information Services Webinar HealthManagement.com HealthManagement.com HealthManagement.com HealthManagement.com
Evaluation of Health Care Homes:
 Division of Health Policy PO Box 64882 St. Paul, MN 55164-0882 651-201-3626 www.health.state.mn.us Evaluation of Health Care Homes: 2010-2012 Minnesota Department of Health Minnesota Department of Human
Health Care for the Uninsured in Metropolitan Atlanta Jane Branscomb, BE; Glenn Landers, MBA, MHA
 IssueBrief November 2008 Health Care for the Uninsured in Metropolitan Atlanta Jane Branscomb, BE; Glenn Landers, MBA, MHA Grady Memorial Hospital s neighborhood clinics handled 55 percent of all primary
2014 MASTER PROJECT LIST
 Promoting Integrated Care for Dual Eligibles (PRIDE) This project addressed a set of organizational challenges that high performing plans must resolve in order to scale up to serve larger numbers of dual
Health Equity and Performance and Quality Improvement (PQI): How a Local Health Department Is Transforming Health Inequities from Within
: How a Local Health Department Is Transforming Health Inequities from Within") Health Equity and Performance and Quality Improvement (PQI): How a Local Health Department Is Transforming Health Inequities from Within Umair A. Shah, MD, MPH and Jennifer Hadayia, MPA Harris County Public
Health Equity and Performance and Quality Improvement (PQI): How a Local Health Department Is Transforming Health Inequities from Within Umair A. Shah, MD, MPH and Jennifer Hadayia, MPA Harris County Public
Community Health Needs Assessment July 2015
 Community Health Needs Assessment July 2015 1 Executive Summary UNM Hospitals is committed to meeting the healthcare needs of our community. As a part of this commitment, UNM Hospitals has attended forums
Physician Workforce Fact Sheet 2016
 Introduction It is important to fully understand the characteristics of the physician workforce as they serve as the backbone of the system. Supply data on the physician workforce are routinely collected
Indianapolis Transitional Grant Area Quality Management Plan (Revised)
") Indianapolis Transitional Grant Area Quality Management Plan 2017 2018 (Revised) Serving 10 counties: Boone, Brown, Hamilton, Hancock, Hendricks, Johnson, Marion, Morgan, Putnam and Shelby 1 TABLE OF CONTENTS
Indianapolis Transitional Grant Area Quality Management Plan 2017 2018 (Revised) Serving 10 counties: Boone, Brown, Hamilton, Hancock, Hendricks, Johnson, Marion, Morgan, Putnam and Shelby 1 TABLE OF CONTENTS
June 2018 COMMUNITY HEALTH CENTER CHART
 June 2018 COMMUNITY HEALTH CENTER CHART About Community Health Centers The National Association of Community Health Centers (NACHC) is pleased to present Community Health Center Chartbook, an overview
s n a p s h o t Medi-Cal at a Crossroads: What Enrollees Say About the Program
 s n a p s h o t Medi-Cal at a Crossroads: What Enrollees Say About the Program May 2012 Introduction Medi-Cal, which currently provides health and long term care coverage for more than 7.5 million Californians,
St. James Mercy Hospital 2012 Community Service Plan Update Executive Summary
 St. James Mercy Hospital 2012 Community Service Plan Update Executive Summary Hospitals in New York State (NYS) are required by the Department of Health to create and publicly distribute an annual Community
RE: CMS-1631-PM Medicare Program; Revisions to Payment Policies under the Physician Fee Schedule and Other Revisions to Part B for CY 2016
 September 8, 2015 Centers for Medicare & Medicaid Services Department of Health and Human Services Attention: CMS-2333-P Mail Stop C4-26-05 7500 Security Boulevard Baltimore, MD 21244-1850 Main Office
Recruitment & Financial Benefits of Health Professional Shortage Areas
 Recruitment & Financial Benefits of Health Professional Shortage Areas Bobbi Buckner Bentz, MHA, MPH Primary Care Office Director Iowa Department of Public Health Presentation Goals What is a Health Professional
LIVINGSTON COUNTY HEALTH PROFILE. Finger Lakes Health Systems Agency, 2017
 LIVINGSTON COUNTY HEALTH PROFILE Finger Lakes Health Systems Agency, 2017 About the Report The purpose of this report is to provide a summary of health data specific to Livingston County. Where possible,
Bureau of Primary Health Care Update
 Bureau of Primary Health Care Update February 6, 2014 Angela R. Powell, MPH, CPH Director, Southwest Division U.S. Department of Health and Human Services Health Resources and Services Administration Bureau
VISION Every Rhode Islander has equal access to affordable, quality, comprehensive health care.
 Rhode Island Health Center Association 235 Promenade Street, Suite 455 Providence, RI 02908 Phone (401) 274-1771 Fax (401) 274-1789 www.rihca.org 2010 / 2011 Mission The Rhode Island Health Center Association
Impact of Financial and Operational Interventions Funded by the Flex Program
 Impact of Financial and Operational Interventions Funded by the Flex Program KEY FINDINGS Flex Monitoring Team Policy Brief #41 Rebecca Garr Whitaker, MSPH; George H. Pink, PhD; G. Mark Holmes, PhD University
Primary Care Capacity Assessment
 Better Information for Better Outcomes Primary Care Capacity Assessment The 22nd Annual Symposium on Health Care Services in New York: Research and Practice Wednesday October 12, 2011 Jean Moore, Director
Accessing Standard UDS Reports
 Uniform Data System (UDS) Reports in the HRSA EHBs A quick reference sheet for Program Grantees The Uniform Data System (UDS) is a system through which organizations funded under the Health Center Cluster
Deficiencies in the quality of health care and disparities in
 Access In CHCs Access To Specialty Care And Medical Services In Community Health Centers Lack of access to specialty services is a more important problem for CHCs than previously thought. by Nakela L.
MERMAID SERIES: SECONDARY DATA ANALYSIS: TIPS AND TRICKS
 MERMAID SERIES: SECONDARY DATA ANALYSIS: TIPS AND TRICKS Sonya Borrero Natasha Parekh (Adapted from slides by Amber Barnato) Objectives Discuss benefits and downsides of using secondary data Describe publicly
UDS UDS: UNIFORM DATA SYSTEM. General Information UNIFORM DATA SYSTEM WHAT IS THE UDS? WHAT TABLES DO I SUBMIT? REPORTING REQUIREMENTS:
 : General Information WHAT IS THE? The Uniform Data System () is a standardized reporting system that provides consistent information about health centers. The includes: The number and socio-demographic
Collaboration Between State Primary Care Offices and State Offices of Minority Health
 Collaboration Between State Primary Care Offices and State Offices of Minority Health State primary care offices (PCOs) and state offices of minority health (OMHs) are federally funded programs located
EXECUTIVE SUMMARY... Page 3. I. Objectives of a Community Health Needs Assessment... Page 9. II. Definition of the UPMC Mercy Community...
 June 30, 2016 3 TABLE OF CONTENTS EXECUTIVE SUMMARY... Page 3 I. Objectives of a Community Health Needs Assessment... Page 9 II. Definition of the UPMC Mercy Community... Page 10 III. Methods Used to Conduct
Contents. Page 1 of 42
 Contents Using PIMS to Provide Evidence of Compliance... 3 Tips for Monitoring PIMS Data Related to Standard... 3 Example 1 PIMS02: Total numbers of screens by referral source... 4 Example 2 Custom Report
ABOUT COMMUNITY HEALTH CENTERS
 ABOUT COMMUNITY HEALTH CENTERS The National Association of Community Health Centers (NACHC) is pleased to present Community Health Center Chartbook, an overview of the Health Center Program and the communities
COMMUNITY CLINIC GRANT PROGRAM
 COMMUNITY CLINIC GRANT PROGRAM FINAL GRANT APPLICATION GUIDANCE Grant Project Period: April 1, 2015 March 31, 2016 Application Due: December 22, 2014 MINNESOTA DEPARTMENT OF HEALTH OFFICE OF RURAL HEALTH
South Carolina Rural Health Research Center. Findings Brief April, 2018
 South Carolina Health Research Center Findings Brief April, 2018 Kevin J. Bennett, PhD Karen M. Jones, MSPH Janice C. Probst, PhD. Health Care Utilization Patterns of Medicaid Recipients, 2012, 35 States
STEUBEN COUNTY HEALTH PROFILE
 STEUBEN COUNTY HEALTH PROFILE 2017 ABOUT THE REPORT The purpose of this report is to provide a summary of health data specific to Steuben County. Where possible, benchmarks have been given to compare county
Friday Health Plans of Colorado
 QUALITY OVERVIEW Health Plans of Colorado (formerly Colorado Choice Health Plans) Serving Colorado for over 4 years, Health Plans utilizes a community-focused model. We work hand in hand with local providers
Community Health Needs Assessment 2013 Oakwood Heritage Hospital Implementation Strategy
 Community Health Needs Assessment 2013 Oakwood Heritage Hospital Implementation Strategy Community Health Needs Assessment 2013 Oakwood Healthcare CHNA Implementation Strategy Community Health Needs Assessment
Activities and Workforce of Small Town Rural Local Health Departments: Findings from the 2005 National Profile of Local Health Departments Study
 Activities and Workforce of Small Town Rural Local Health Departments: Findings from the 2005 National Profile of Local Health Departments Study 1100 17th Street, NW 2nd Floor Washington, DC 20036 (202)
SAFETY NET 2017 REQUEST FOR PROPOSAL
 SAFETY NET 2017 REQUEST FOR PROPOSAL HCF Providing leadership, advocacy and resources to eliminate barriers and promote quality health for the uninsured and underserved VISION: Healthy People, Healthy
The VA Medical Center Allocation System (MCAS)
") Background The VA Medical Center Allocation System (MCAS) Beginning in Fiscal Year 2011, VHA Chief Financial Officer (CFO) established a standardized methodology for distributing VISN-level VERA Model
Background The VA Medical Center Allocation System (MCAS) Beginning in Fiscal Year 2011, VHA Chief Financial Officer (CFO) established a standardized methodology for distributing VISN-level VERA Model
Health Center Partners of Southern California
 Seventeen Federally Qualified Health Centers (FQHCs) and other safety-net clinics provide care to residents of Southern California. They collectively provide tremendous value and impacts to their communities
CHEMUNG COUNTY HEALTH PROFILE. Finger Lakes Health Systems Agency, 2017
 CHEMUNG COUNTY HEALTH PROFILE Finger Lakes Health Systems Agency, 2017 About the Report The purpose of this report is to provide a summary of health data specific to Chemung County. Where possible, benchmarks
TEXAS DEPARTMENT OF HEALTH CENTER FOR HEALTH STATISTICS (CHS) DATA PRODUCTS AND REPORTS
 DATA PRODUCTS AND REPORTS") HOSPITAL SURVEY/HOSPITAL DATA Hospital Survey Form (Hard Copy), 1998-2003 Blank copy of the Annual Survey of Hospitals form. The three most recent survey forms may be viewed and printed from the CHS web
HOSPITAL SURVEY/HOSPITAL DATA Hospital Survey Form (Hard Copy), 1998-2003 Blank copy of the Annual Survey of Hospitals form. The three most recent survey forms may be viewed and printed from the CHS web
Dobson DaVanzo & Associates, LLC Vienna, VA
 Analysis of Patient Characteristics among Medicare Recipients of Separately Billable Part B Drugs from 340B DSH Hospitals and Non-340B Hospitals and Physician Offices Dobson DaVanzo & Associates, LLC Vienna,
REQUEST FOR PROPOSALS
 REQUEST FOR PROPOSALS Improving the Treatment of Opioid Use Disorders The Laura and John Arnold Foundation s (LJAF) core objective is to address our nation s most pressing and persistent challenges using
Aging in Place: Do Older Americans Act Title III Services Reach Those Most Likely to Enter Nursing Homes? Nursing Home Predictors
 T I M E L Y I N F O R M A T I O N F R O M M A T H E M A T I C A Improving public well-being by conducting high quality, objective research and surveys JULY 2010 Number 1 Helping Vulnerable Seniors Thrive
MONROE COUNTY HEALTH PROFILE. Finger Lakes Health Systems Agency, 2017
 MONROE COUNTY HEALTH PROFILE Finger Lakes Health Systems Agency, 2017 About the Report The purpose of this report is to provide a summary of health data specific to Monroe County. Where possible, benchmarks
Outreach Across Underserved Populations A National Needs Assessment of Health Outreach Programs
 Outreach Across Underserved Populations A National Needs Assessment of Health Outreach Programs In late 2012 and early 2013, Health Outreach Partners (HOP) conducted its fifth national needs assessment.
Implementation Plan Community Health Needs Assessment ADOPTED BY THE MARKET PARENT BOARD OF TRUSTEES, OCTOBER 2016
 2017 2019 Community Health Needs Assessment Implementation Plan ADOPTED BY THE MARKET PARENT BOARD OF TRUSTEES, OCTOBER 2016 MERCY HEALTH LOURDES HOSPITAL 1530 Lone Oak Rd., Paducah, KY 42003 A Catholic
2012 Community Health Needs Assessment
 2012 Community Health Needs Assessment University Hospitals (UH) long-standing commitment to the community spans more than 145 years. This commitment has grown and evolved through significant thought and
Basic Concepts of Data Analysis for Community Health Assessment Module 5: Data Available to Public Health Professionals
 Basic Concepts of Data Analysis for Community Assessment Module 5: Data Available to Public Professionals Data Available to Public Professionals in Washington State Welcome to Data Available to Public
Maternal and Child Health North Carolina Division of Public Health, Women's and Children's Health Section
 Maternal and Child Health North Carolina Division of Public Health, Women's and Children's Health Section Raleigh, North Carolina Assignment Description The WCHS is one of seven sections/centers that compose