Case Studies of Seven Rural Programs Cooperatively Marketing Recyclables
|
|
|
- Cameron Carr
- 5 years ago
- Views:
Transcription
1
2
3 Case Studies of Seven Rural Programs Cooperatively Marketing Recyclables Lola Schoenrich April 1994 Funding Provided by the Tennessee Valley Authority and EPA Region IV
4
5 To order copies of the full report from which this Synopsis is excerpted: From within the Tennessee Valley Authority service area contact: Tennessee Valley Authority Community Infrastructure Services 400 West Summit Hill Drive Knoxville, Tennessee (615) From elsewhere contact: The Minnesota Project 1885 University Avenue West Suite 315 St. Paul, Minnesota (612) This program is financially assisted by the Tennessee Valley Authority and the Environmental Protection Agency Region IV. It is offered on a nondiscriminatory basis, without regard to race, color, national origin, religion, sex, age, or handicap. This document has been funded in part by the United States Environmental Protection Agency. The contents of this document do not necessarily reflect the views and policies of the Environmental Protection Agency, nor does mention of trade names or commercial products constitute endorsement or recommendation for use. Printed with soy-based ink on 50% recycled, 10% post-consumer content paper
6 About the Minnesota Project The Minnesota Project is a nonprofit organization working to strengthen rural communities. Founded in 1979, we work with leaders in rural areas as they build their capacity to resolve their own issues of sustainability and natural resource management. We currently focus our mission, values, and project work in six basic areas: Groundwater protection Pollution prevention Recycling market development Sustainable agriculture River protection Renewable energy In each area, we develop citizen involvement and leadership in Minnesota communities, and couple that with broader research and participation in regional and national policy creation. In all of our work, the Minnesota Project serves a clear role of interpreter, educator, and connector between the community and the policy or policy-makers. About the Tennessee Valley Authority TVA is one of the Nation s largest electric power producers, a regional development agency, and a national laboratory, established in 1933 by the U.S. Congress. TVA covers all of Tennessee and parts of six other states, including Kentucky, North Carolina, Georgia, Alabama, and much of Mississippi. TVA s strategic goals are to be an environmental leader, to have competitive rates, and to put people first. As a regional resource development agency, TVA has a staff of engineers, biologists, planners, economists, and technicians skilled in community planning and development, enterprise development, sustainable agriculture, wastewater management, waste management, ecosystem-based management, reclamation of mined land, river management, floodplain management, and environmental communications. TVA has extensive experience in using an integrated approach to achieving a balance between economic and environmental system components. Services are provided to local governments by Community Partnerships, the TVA organization chiefly responsible for TVA s economic and community development initiatives. This publication and work on cooperative marketing of recyclables is sponsored by Community Infrastructure Service s Waste Management Assisstance Team. We have six recycling marketing cooperatives in the Tennessee Valley, each comprised of 5-6 counties with one designed to serve 34 counties. The oldest started in 1987 and the most recent began in We appreciate the opportunity to fulfill our mission as a demonstration agency and pass along innovative information to a national audience.
7 ti Introduction Cooperative marketing refers to a group of government entities, sometimes in conjunction with private organizations, that voluntarily agree to work together to sell their recyclable materials. Cooperative marketing programs take many forms and offer a wide array of services. The commonality is that they all market recyclables together on the assumption that they can do this more efficiently together than any one of them can alone. Generally, the communities participating in cooperative marketing groups are not required to work together by any state laws, and groups that are regional by law do not call their work cooperative marketing. Cooperative marketing is widely seen as a solution to the difficulties of recyclers in rural areas, and the number of cooperative marketing programs is growing quickly. The first program in the country, the New Hampshire Resource Recovery Association, proved that cooperative marketing can work, and people began to take notice. In 1992, a survey by the University of Wisconsin1 identified over 15 cooperative marketing groups. By 1994, there were over 50 programs in the United States and Canada. Rural communities face specific difficulties marketing recyclables. In many rural places it is common to find many suppliers of recyclable materials and only a few buyers. At best, a handful of brokers and end markets may dominate the secondary materials markets in any one region. This fundamental imbalance between buyers and sellers leaves the sellers at a distinct disadvantage. Cooperative marketing seeks to correct this imbalance by selling materials from many communities together. Rural programs face additional challenges because of high transportation costs to distant markets. This cuts into market revenues and also makes recycling logistically more difficult. Small communities may not have the space to store materials long enough to accumulate the full truck load of one type of material needed for shipping. Cooperative marketing programs seek to improve transportation efficiencies and often combine loads of materials from more than one community, allowing more frequent shipments. New rural recycling programs have the additional problem of inexperienced staff and little time to learn about marketing recyclables. Cooperative marketing programs provide guaranteed outlets for collected materials and usually provide information and training - through informal sharing, market databases, workshops, and other types of technical assistance to participants. This is a synopsis of a full study, Case Studies of Seuen Rural Programs Cooperatiuely Marketing Recyclables. The study offers in-depth information about seven very different rural cooperative marketing programs. The study came about because of the firm belief of the Minnesota Project, the Tennessee Valley Authority, and the Environmental Protection Agency that people learn best from one another. Given the tremendous interest in cooperative marketing, it is well worth taking a careful look at existing programs. There is much that can be learned from experience. The case study format is an excellent way for local decision makers to learn about what has worked well and not so well in other places, to compare strategies, and to develop informed local solutions. 1. Mary Kohrell & Holly Johnson, Cooperative Marketing in North America: Report on the results of a Comprehensive Survey, University of Wisc: - Extension Solid & Hazardous Waste Education Center, June 1992
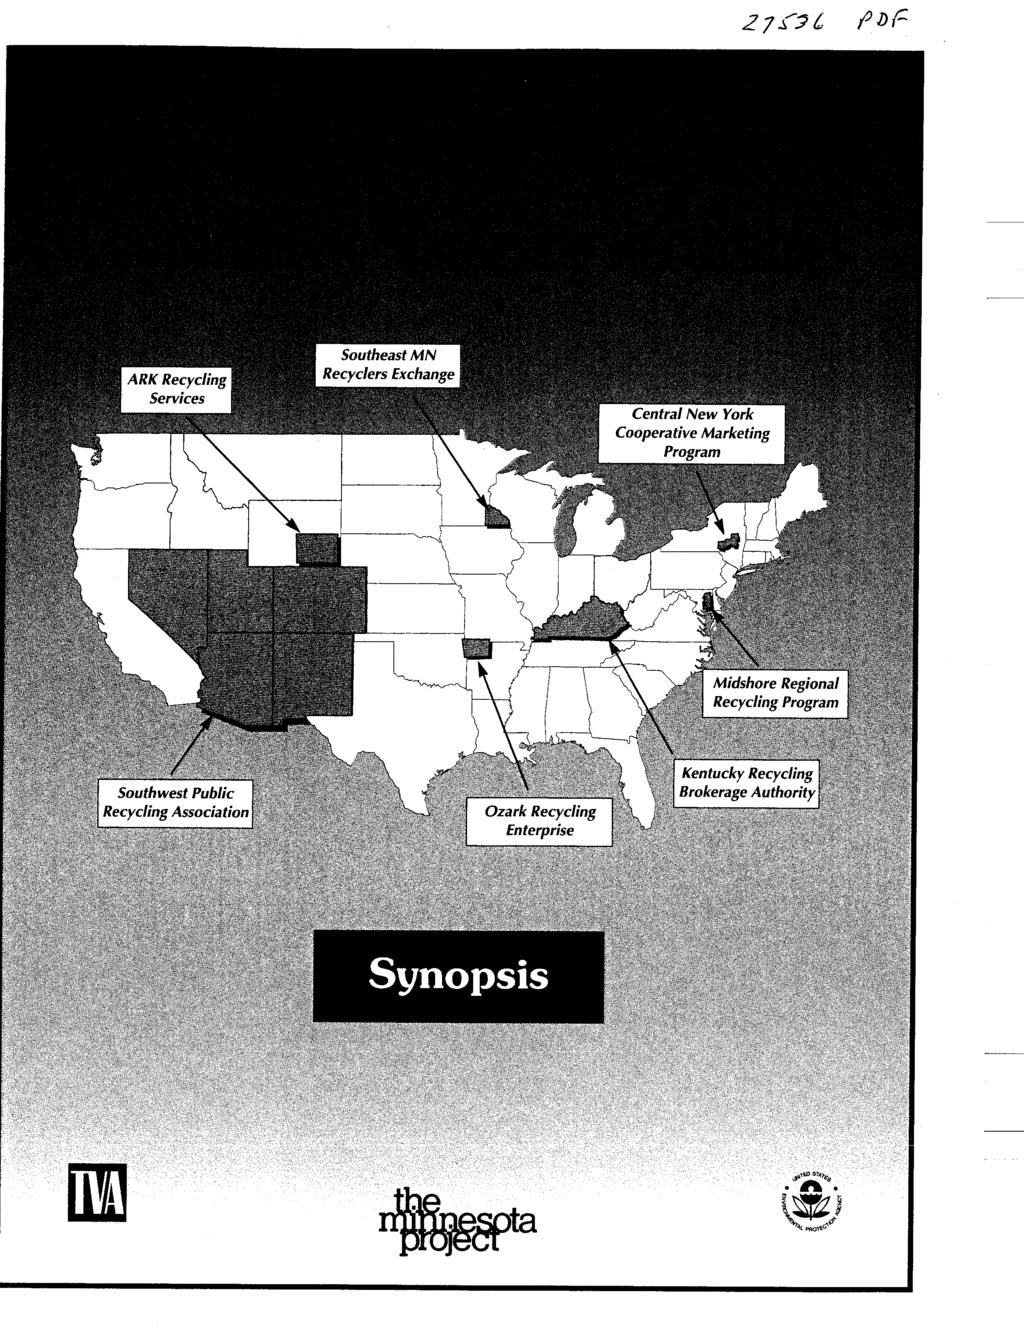
8 The seven case study sites were chosen with the assistance of a project Advisory Committee from among the 50 or more identified programs. Each of the seven programs was studied in detail. The research began with calls to key people working with each cooperative marketing program, and review of the written literature about the program. The most important part of the research was conducted on-site during two to three day visits to each program. At each location, meetings were held with cooperative marketing program staff, participants - including local recycling staff, private and nonprofit haulers and recyclers, and local elected officials - and state agency staff funding the programs. These people talked about their work and answered a predetermined set of questions. By interviewing a number of people with different perspectives, we attempted to get a good sense of the history, operations, and success of each program. The locations of the case study sites are shown in Figure 1 and the programs are summarized in Table 1. Figure 1 Location of Case Study Sites ARK Recycling I sf.svicg L I I Southeast MN I Recyclers Exchange wokerage Authority
9 Table 1 General Program Information About Case Study Sites Program ARK Recycling Services Service Area Ten communities and nonprofit recyclers in the southeast quarter of Wyoming Population Served 136,000 Services -Processing -Storage -Shipping -Marketing -Technical assistance -Loaned processing equipment Materials Handled -Newspaper -Corrugated -Office paper -Magazines -Steel cans -Aluminum -Glass containers -HDPE & PET Tonnages 4,500 tons Structure Nonprofit or g a-n i za t i o n providing services to the developmentally disabled Central New York Cooperativ Marketing Program Kentucky Recycling Brokerage Authority Midshore Regional Recycling Program Ozark Recycling Enterprise, Inc. Southeast Minnesota Recyclers Exchange Southwest Public Recyciing Assoc. Five counties in upstate New York Counties, communities, private recyclers, and businesses in the state of Kentucky Four counties on the Eastern Shore of Maryland Seven counties, six cities, and seven private and nonprofit recyclers in northern Arkansas Five counties, one private and one nonprofit recycler in the southeastern corner of Minnesota Six states in the southwest: Arizona, Colorado, New Mexico, Nevada, Utah, and west Texas 250, million 109, , ,000 5 or 6 nillion -Market information -Storage -Shipping -Marketing -Market information available for a wide ranqe of mat e rials -Market information and other information sharing -Shipping -Market contracts -Training & info -Market develonment -Collection -Material consolidation -Minimal p r o c e s s i n g -Shipping -Marketing -Information sharing -Mobile plastics baling -Market contracts -Shipping -Training & info -Information sharing -Shipping -Market agreements -Local market development -Training -Shipping -Market contracis -Market development -Buy recycled -Tin cans -HDPE plastic -Mixed paper -Aluminum cans -Steel cans -HDPE & PET -Newspaper -Corrugated -Glass -Bimetal cans -Mixed office paper -Newspaper -Corrugated -Glass -Aluminum -Steel cans -HDPE & PET -HDPE & PET -Newspaper -Corrugated -Mixed paper -Aluminum -Steel cans -Corrugated -High-grade paper - N e w s p a p e r -Magazines -Glass -Textiles -HDPE & PET -Steel cans -Glass /-. L.J -Lo1 I uydteu -Newspaper -Magazines -High grade paper -Poly coated paper 8,477 tons (1/93-12/93) 300 tons (6/93-12/93). Tonnages will increase in 1994 as more programs come on line 8,500 tons yearly (based on 1992 actual tonnages) 114 tons of HDPE and PET in Tonnages will increase in 1994 with other materials added. 1,400 tons (2791-2/92) 680 tons (6/93 - i c) Inn! I&/ 73). Tonnages will increase in 1994 with the addition of other materials. lntergovernment al agreement relating to cooperative marketing public corporation created by the Kentucky legislature to operate a statewide cooperative marketing p r o g r a m Intergovernment al agreement between counties to create a region waste management entity Nonprofit formed to provide recycling related technical assistance in northwest Arkansas Informal, except for non-binding agreement to participate in cooperative marketing Nonprofit organization L-..--J I- IUIIII~U tu strengthen recycling markets in the southwest
10 CI General Findings The report discusses the seven cooperative marketing programs as a group, comparing and contrasting their work. Each case study is also presented in-depth, along with appendices that include sample legal agreements, contracts, job descriptions, and operations documents. A summary of findings is as follows. I There are six primary goals for these cooperative marketing programs. The mission of the cooperative marketing programs in this study is to strengthen markets for recyclable materials and by so doing, improve the viability of local recycling programs. The participants in these cooperative marketing programs believe that by marketing recyclables together, they will have increased leverage in the marketplace with larger quantities and higher quality materials. The programs have the following goals: Improve market stability for recyclables Improve access to markets Provide assistance to newly starting recycling programs Improve prices for recyclables Improve economies of scale for collection, processing, and transportation Attract new end markets for recyclables to the region. I Cooperative marketing programs meet most goals. By and large these cooperative marketing groups do meet most of their intended goals. First, market stability and access to markets is enhanced because of increased quantities and quality of materials sold. Second, economies of scale for collection and processing are improved by making more efficient use of personnel and equipment. Finally, market development is a natural extension of cooperative marketing, because industry is attracted to regions that can guarantee the needed supply of raw materials. Nonetheless, cooperative marketing does not always increase market prices for recyclables. I Cooperative marketing is particularly helpful to new rural recycling programs. Community representatives participating in five of the seven case studies said that cooperative marketing made the difference for them between recycling and not recycling. These small programs have the fewest resources, the least information, and limited time and capacity to market and sometimes to collect and process recyclables on their own. The cooperative marketing programs have helped rural recycling programs by providing: collection and processing; access to markets; shared ixfgrr;..atign and connections to other rura! reqclers; Giie-Gii-Giie training and technical assistance; and processing equipment at no cost through equipment loans or at lower cost through joint purchasing.
11 4 There are additional advantages to cooperative marketing. In addition to meeting most of the programs goals, program participants, program staff, and state staff working with or funding the cooperative marketing programs also talked about a number of other benefits. Cooperative marketing programs also: Allow participants to share information Improve regional connections Save storage space and improve cash flow Save time for local recycling staff Allow programs to add new materials Give participants peace of mind. 4 Znformation sharing is a key advantage. Informal information sharing is one of the most important benefits for participants in the four smallest programs. Information sharing helps new and smaller local recycling programs and helps to build trust that can lead to other successful regional efforts. 4 Buyers benefit as well. Buyers of recyclables from the cooperative marketing groups also see benefits. The benefits include: coordination of marketing agreements and arrangements with one entity rather than many; high quality materials; access to larger, more consistent sources of materials; and a positive public image. 4 Cooperative marketing programs offer three main services. The case studies represent three types of cooperative marketing programs with respect to services offered. Many characteristics of cooperative marketing groups vary depending on the type of service offered. The three types of services are: Collection, processing, and marketing Processing and marketing Marketing only. 4 Znformation sharing and market development are important additional services. The other services provided by these cooperative marketing programs fall into two general categories. The first category is formal and informal information sharing and technical assistance and the second is market development and buy recycled programs. Information and technical assistance is needed for participating Inca! recycling programs to make good use of the cooperative marketing programs. Market development and buy recycled, along with cooperative marketing, are the integral components of strengthening recycling markets.
12 E Cooperative marketing groups are different from private brokers. Cooperative marketing groups differ from private brokers in that they are controlled by the membership. The result of this difference in control is that users of cooperative marketing groups trust that the cooperative marketing program is acting in their best interests, handling all materials, not just those that are the most profitable. Many cooperative marketing groups also differ from private brokers in that they do not ever own the materials that are sold. They merely arrange for the sale, and the revenue and responsibility for quality belongs to the seller. Many cooperative marketing groups sell their materials through brokers. H The size of the service area for cooperative marketing groups varies. The optimum size for cooperative marketing groups depends in part on the services provided. Programs coordinating collection and processing must be small enough to reasonably transport unprocessed materials from the collection sites to the processing facility, usually no bigger than three to six counties. Groups that offer only marketing services range in size from five counties to six states. Larger groups attract the interest of larger, potentially more lucrative and helpful end markets for recyclables. Smaller groups offer the intimacy of regular sharing of common problems and offer the potential to build other regional programs as trust develops between participants. H Good models exist for cooperative marketing program operations. Operations difficulties should not be a barrier to successful cooperative marketing. Each of the seven programs studied here has developed effective operating procedures. Each has procedures for processing and storing materials, communicating with buyers, arranging shipping, dealing with quality control, and tracking materials and payments. These procedures and those of other successful programs can and should be used as models by newly developing cooperative marketing programs. H There are differences in materials handled by cooperative marketing programs. Most cooperative marketing programs intend to handle all commonly collected materials in time, but they differ in how they begin. The programs in this study are evenly split between those that begin by handling all materials, those that begin by handling materials with the greatest value, and those that begin with materials that are the hardest to market. The programs that begin by handling the highest value materials have the greatest potential to increase revenues for local programs immediately. Those that begin with the hardest to market materials provide a popular service if successful, but risk frustration and failure if they are not able to improve market conditions. E A variety of methods are used to find markets. These programs used a variety of methods to find and select markets. Several used a formal request for proposal process and involved participants in the market selection. This helped new cooperative marketing programs get the lay of the land and identify interested buyers. However, this formal process was not always needed. Programs were able to find stable buyers with good prices through informal research.
13 W Market relationships vary as well. Market relationships vary from long-term formal contracts, to purchase orders, and verbal agreements. The type of relationship depends on both the goals of the cooperative marketing program and the common practices of the program participants and the buyers. Programs with the goal of long-term stability are most likely to use contracts with a designated floor and ceiling price. Cooperative marketing programs that are seeking the highest prices are more likely to use more informal, shorter-term verbal or written agreements. The practices of the local participants also vary by region, from those that require a written contract to make a sale, to those that are averse to written contracts. Cooperative marketing works either way. W There are four possible legal structures. The programs in this study use three different legal structures: nonprofit organization, intergovernmental agreement, and state agency. A fourth possible legal structure, legal cooperative, is not represented in this study. The legal structure chosen depends on the goals of the cooperative marketing program and the resources already available in the community. Some goals can only be met by one legal structure. For instance, the private sector can only participate actively in a nonprofit organization, and states will typically recognize only an intergovernmental agreement as a legitimate region for solid waste planning purposes. H A key decision must be made about the involvement of elected officials. One of the cooperative marketing programs studied cites the active involvement of local elected officials as a special strength. Two list the exclusive involvement of local recycling staff as one of the reasons that they have been successful. There are benefits to both approaches, but they are different. Local elected officials carry the voice of the people and can ensure that the cooperative marketing program serves the policy directions of the local governments. With their involvement and voice, they are ready and able to provide the funding for the organization. On the other hand, local staff tend to have common problems and interests, and little history of conflict. Together, they put aside the larger problems and focus on creating a program that serves their needs. Excluding elected officials, however, can lead to problems when funding is needed from local governments because they may not be familiar with the program. H Grants play a key role in the start-up of cooperative marketing groups. Grants from state agencies, the Tennessee Valley Authority, and others such as the US. Environmental Protection Agency have had a key role in getting cooperative marketing groups started. This is because local governments have been unwilling to invest in programs until they are proven effective and because there is a period of planning and start-up before programs begin to generate revenue. It is quite likely that few of the programs studied would have started without the grant funding they received. Grants have funded the start-up operations of the groups offering marketing services, and capital costs for the groups offering collection and processing.
14 H There are a variety of sources of revenues, but there is still much grant reliance. Revenue sources depend on the services offered. Grants are the primary source of revenues for four of the seven groups. One is a state agency, funded entirely by legislative appropriation. The two programs offering collection and processing are funded with: a landfill surcharge fund, material revenues, and processing and brokerage fees. The programs providing marketing services augment their grants with a combination of: brokerage fees paid by sellers, service fees paid by buyers, membership fees, contributions by members for certain services, and workshop and conference fees. Table 2, Budgets and Sources of Revenue, compares the seven programs. I I Table 2 Budgets and Sources of Revenue Program ARK Recycling Services Central New York Cooperative Marketing Program H Think about timing. Timing of funding for cooperative marketing is critical. In at least one case, state agency staff felt that the timing was both too late and too early. This particular grant came too late to help newly forming groups and too early for the communities to be ready to consider program improvements that might lead to cooperative marketing. Also, the length of the grants is important. One year seems to be too short a time for a program to get up and running and also prove itself to local participants. Cooperative marketing groups ask for longer term support of up to two years Budget Funding $300,000 -Sale of materials (most important revenue source) -Brokerage fees paid by users -Processing fees -Grants for capital costs $36,519 -Grant from New York State (82%) -County contribution (18%) Kentucky Recycling Brokerage Authority Midshore Regional Recycling Program Ozark Recycling Enterprise, Inc. $170,000 $396,872 $36,000 Legislative appropriation (100% of operating costs) -Landfill surcharge fund (100% of operating costs) -State grants for capital costs Grants from the state, EPA and private businesses (100%) Southeast Minnesota Recyclers Exchange Southwest Public Recycling Association $52,850 -Grants from businesses and other private sources (51%) -Brokerage fees paid by users (16%) -County contributions (16%) -1nkind contributions (17%) $283,800 -Grants from EPA, state agencies, and foundations (67%) -Memberships(20%) -Earned Income ( 13%)
15 ti Role of State and Regional Agencies In some parts of the country, state and regional agencies have taken a lead role in promoting and funding cooperative marketing programs. The availability of state grants catalyzed formation of three of the seven case studies and state funding is an important source of revenue for four of the seven. Staff and elected officials of other states can learn from these experiences. With this in mind, the following reflections are offered. Cooperative marketing programs usually need start-up funding. Most newly forming cooperative marketing groups would probably put funding at the top of their list of needs. While some funding may come from local governments, matching grants from states or other agencies can help make up the difference. As previously discussed, start-up grants have been a helpful source of support for new cooperative marketing programs. It does take time to get a program up and running and it is unreasonable to believe that fees can support a program during start-up. Grants, however, are a double edged sword. Applicants are tempted to provide what the funder is looking for, whether or not it is really the best fit, and can rush a group into a commitment for which they are not really ready. Agencies can provide technical assistance. Sometimes money is not all that is needed. Several cooperative marketing groups commented on the importance of an outside facilitator who helped them to plan their program. Some state agencies have been able to provide this long-term outside support, helping with facilitation, information, and encouragement. In some cases, this kind of help has been what was needed to pull a group together and begin taking action. Regional efforts work best if promoted from the beginning. It is easier to promote regionalization from the beginning than to impose it later. Once counties and communities have started independent programs, invested in capital equipment, and hired their own recycling staff, they are reluctant at best to look for regional solutions. By then each community is proud and committed to their own way of doing things. Like other regional approaches, cooperative marketing is easier if it is started as recycling programs are starting. ti Difficulties and Challenges The seven case study programs faced a number of difficulties in their operations to date. They also face challenges to their future success. Again, there are many commonalities summarized here. Cooperative marketing has not iived up to aii expectations. Despite an almost universal feeling from participants that the cooperative marketing programs have been worthwhile, there are ways that they have not lived up to expectations. In some cases this is because expectations were too high and needed to be adjusted, and in some cases the program would have better lived up to expectations had it been set up or operated differently.
16 There are several ways that programs have actually offered less than was hoped for. In each case, people have learned from the experience and can talk about what they would do differently next time. The areas of disappointment were: Program development took longer than expected The service provided was not as useful as it could have been Prices did not increase as expected The costs were too high. Financing is an ongoing challenge. Cooperative marketing groups that only offer marketing services face particular difficulties and uncertainty with long-term funding. This is the single biggest challenge for their survival. These groups have not had access to the typical sources of funding for recycling programs like revenues from sale of materials, landfill surcharge funds, household service fees, and local taxes. Some may succeed over time and some may not. If they are to be successful, the local users must see them as worthwhile and be willing to pay for the services. Groups need to learn to quantify the benefits of cooperative marketing to individual participants in order to convince local decision makers of the value. Cooperative marketing does not always raise market prices for recyclables. Larger local recycling programs participating in these cooperative marketing programs did not always see price increases because they are already handling larger amounts of materials and are usually closer to urban areas where markets are located. Also, prices may not increase in parts of the country where buyers have access to more supply than they need. If this is a primary goal for the program, some participants will be disappointed. H There are other challenges in three basic categories. All organizations face challenges and difficulties from time to time. By struggling with them and resolving them, organizations grow and improve the work that they do. These cooperative marketing groups are no exception. Program staff, participants, and state staff talked about the challenges faced by each. Each program is somewhat unique, but the challenges tend to fall into the three basic categories of financing, operations, and the inherent difficulties of working together. 0 Elements of Success There were a number of areas where there were common elements of success in the seven case study programs. They are described here. H The services provided must meet the needs of the -,..4:,:,,, &.. IJUI blblljurlb3. The most successful of the case study programs made the best matches between the services they provided and the needs and capacity of the local participants. For instance, very rural communities and newer recycling programs benefited from access to processing, processing equipment, and even recycling collection services. Established local recycling programs are able to use marketing services that broker materials and arrange shipment to market from the local recycling centers.
17 H Successful programs take advantage of existing local resources. Programs were most successful when they made good use of existing local resources. It is far simpler and cost effective to make better use of existing resources than to start from scratch. Local resources used by these cooperative marketing programs included existing recycling centers, collection and processing equipment, host organizations, and funding sources. Those case study programs that offer collection or processing are able to do so because one county or nonprofit organization had already invested in a recycling center or equipment that could be shared with others. Existing nonprofit organizations operate the cooperative marketing programs in Arkansas and Wyoming. One program successfully sought grant funding from agricultural cooperatives in the area that wanted to support other types of rural cooperatives. H New recycling programs need technical information and support. The most successful case study programs working with new recycling programs offer them technical information and support. Simply making markets available is not enough. Staff and volunteers at new recycling programs need help learning how to collect and process recyclables. They are still learning proper sorting, processing, baling methods, meeting buyers specifications, and loading techniques. The technical assistance work both helps to fulfill the cooperative marketing programs missions of promoting recycling and helps local programs make better use of the cooperative marketing programs services. H Combining planning and action leads to success. Programs that take too long to develop any markets frustrate participants. The most successful programs took action early on, either beginning with easier to market materials that had the potential to increase revenues quickly or by successfully developing solutions to the problems of hard to market materials. 1 Legal structures offer a framework for goals. All of the cooperative marketing programs in the study either were preexisting organizations, developed legal structures early on, or had experience working together before they began cooperative marketing. One of the advantages to a legal structure or organization is that it offers a framework within which to work. The successful programs made a good match between their goals and the legal structure they chose. H Having an independent structure can be a benefit. In most of the case study programs, independence from other organizations has been helpful. In one case where the cooperative marketing program was operated by another entity, the program has suffered from changes in the priorities of the parent organization. In another case where the cooperative marketing program is operated by an organization with a different primary mission, some community members worry that the cooperative marketing program could be abandoned.
18 H Democratic control by the membership offers some advantages. Five of the seven case studies are democratically controlled by the participants or membership through boards of directors and committees. Democratic control by the membership offers a sense of security that the cooperative marketing program is acting in the best interests of the membership. On the other hand, it does take time and energy that may add little to the organization running the program. H Decision-making should be made by sellers of materials. Buyers and sellers of recyclables have different interests, and private recyclers are often buyers as well as sellers of materials. Therefore, putting buyers in decision making roles in the program can create conflicts of interest. H Program participants must make some commitments to the program. Six of the seven programs studied have taken steps to formalize agreements with members or participants using the services. The agreements assist in planning and in attracting and securing markets by providing estimates of the amount of recyclables that will be marketed. They also ensure that participants are committed to their participation in the program. H Good leadership is a critical component of success. Each of the cooperative marketing programs in this study succeeded in part because of strong and competent leadership. Cooperative marketing, however, requires more than one leader. People at each of the member communities must be committed to the strategy and willing and able to advocate for active involvement with their colleagues and local decision-makers. Given the importance of strong leadership, it is also important to make arrangements for staff and leadership transitions to ensure program continuity. H Good staffing is important. Participants in the cooperative marketing groups thought that it was extremely helpful to have a paid staff person. That one person is able to put energy and attention to the task of developing both the cooperative marketing program and good markets for recyclables. 1 Successful cooperative marketing requires trust. Planning a new cooperative marketing program or participating in an existing one means taking risks with other people and trusting others with your interests. Many recyclers, for example, treat market information as proprietary and share it very reluctantly, if at all. A participant in one cooperative marketing program said you need to break the paradigm that there are winners and losers and create new ways for all to win. The most successful programs have created an atmosphere of sharing and trust that respects all the different needs, interests, and concerns of participants. None of this happens overnight. Several of the case study programs began with communities and groups that had a history of successful collaborations. Respectful collaboration through the cooperative marketing program has deepened their trust in one another and paved the way for other successful collaborative efforts.
Fiscal Year 1999 Comparisons. State by State Rankings of Revenues and Spending. Includes Fiscal Year 2000 Rankings for State Taxes Only
 Fiscal Year 1999 Comparisons State by State Rankings of Revenues and Spending Includes Fiscal Year 2000 Rankings for State Taxes Only January 2002 1 2 published annually by: The Minnesota Taxpayers Association
Rankings of the States 2017 and Estimates of School Statistics 2018
 Rankings of the States 2017 and Estimates of School Statistics 2018 NEA RESEARCH April 2018 Reproduction: No part of this report may be reproduced in any form without permission from NEA Research, except
National Study of Nonprofit-Government Contracts and Grants 2013: State Profiles
 www.urban.org Study of Nonprofit-Government Contracts and Grants 2013: State Profiles Sarah L. Pettijohn, Elizabeth T. Boris, and Maura R. Farrell Data presented for each state: Problems with Government
2014 ACEP URGENT CARE POLL RESULTS
 2014 ACEP URGENT CARE POLL RESULTS PREPARED FOR: PREPARED BY: 2014 Marketing General Incorporated 625 North Washington Street, Suite 450 Alexandria, VA 22314 800.644.6646 toll free 703.739.1000 telephone
STATE ENTREPRENEURSHIP INDEX
 University of Nebraska - Lincoln DigitalCommons@University of Nebraska - Lincoln Business in Nebraska Bureau of Business Research 12-2013 STATE ENTREPRENEURSHIP INDEX Eric Thompson University of Nebraska-Lincoln,
Statutory change to name availability standard. Jurisdiction. Date: April 8, [Statutory change to name availability standard] [April 8, 2015]
![Statutory change to name availability standard. Jurisdiction. Date: April 8, [Statutory change to name availability standard] [April 8, 2015]](/thumbs/83/87461560.jpg "Statutory change to name availability standard. Jurisdiction. Date: April 8, [Statutory change to name availability standard] [April 8, 2015]") Topic: Question by: : Statutory change to name availability standard Michael Powell Texas Date: April 8, 2015 Manitoba Corporations Canada Alabama Alaska Arizona Arkansas California Colorado Connecticut
Topic: Question by: : Statutory change to name availability standard Michael Powell Texas Date: April 8, 2015 Manitoba Corporations Canada Alabama Alaska Arizona Arkansas California Colorado Connecticut
Unemployment Rate (%) Rank State. Unemployment
 Rank State. Unemployment") States Ranked by February 2018 Unemployment Rate Seasonally Adjusted Unemployment Unemployment Unemployment 1 Hawaii 2.1 19 Alabama 3.7 33 Ohio 4.5 2 New Hampshire 2.6 19 Missouri 3.7 33 Rhode Island 4.5
States Ranked by February 2018 Unemployment Rate Seasonally Adjusted Unemployment Unemployment Unemployment 1 Hawaii 2.1 19 Alabama 3.7 33 Ohio 4.5 2 New Hampshire 2.6 19 Missouri 3.7 33 Rhode Island 4.5
Unemployment Rate (%) Rank State. Unemployment
 Rank State. Unemployment") States Ranked by November 2015 Unemployment Rate Seasonally Adjusted Unemployment Unemployment Unemployment 1 North Dakota 2.7 19 Indiana 4.4 37 Georgia 5.6 2 Nebraska 2.9 20 Ohio 4.5 37 Tennessee 5.6
States Ranked by November 2015 Unemployment Rate Seasonally Adjusted Unemployment Unemployment Unemployment 1 North Dakota 2.7 19 Indiana 4.4 37 Georgia 5.6 2 Nebraska 2.9 20 Ohio 4.5 37 Tennessee 5.6
Unemployment Rate (%) Rank State. Unemployment
 Rank State. Unemployment") States Ranked by April 2017 Unemployment Rate Seasonally Adjusted Unemployment Unemployment Unemployment 1 Colorado 2.3 17 Virginia 3.8 37 California 4.8 2 Hawaii 2.7 20 Massachusetts 3.9 37 West Virginia
States Ranked by April 2017 Unemployment Rate Seasonally Adjusted Unemployment Unemployment Unemployment 1 Colorado 2.3 17 Virginia 3.8 37 California 4.8 2 Hawaii 2.7 20 Massachusetts 3.9 37 West Virginia
Unemployment Rate (%) Rank State. Unemployment
 Rank State. Unemployment") States Ranked by August 2017 Unemployment Rate Seasonally Adjusted Unemployment Unemployment Unemployment 1 North Dakota 2.3 18 Maryland 3.9 36 New York 4.8 2 Colorado 2.4 18 Michigan 3.9 38 Delaware 4.9
States Ranked by August 2017 Unemployment Rate Seasonally Adjusted Unemployment Unemployment Unemployment 1 North Dakota 2.3 18 Maryland 3.9 36 New York 4.8 2 Colorado 2.4 18 Michigan 3.9 38 Delaware 4.9
Unemployment Rate (%) Rank State. Unemployment
 Rank State. Unemployment") States Ranked by March 2016 Unemployment Rate Seasonally Adjusted Unemployment Unemployment Unemployment 1 South Dakota 2.5 19 Delaware 4.4 37 Georgia 5.5 2 New Hampshire 2.6 19 Massachusetts 4.4 37 North
States Ranked by March 2016 Unemployment Rate Seasonally Adjusted Unemployment Unemployment Unemployment 1 South Dakota 2.5 19 Delaware 4.4 37 Georgia 5.5 2 New Hampshire 2.6 19 Massachusetts 4.4 37 North
Unemployment Rate (%) Rank State. Unemployment
 Rank State. Unemployment") States Ranked by September 2017 Unemployment Rate Seasonally Adjusted Unemployment Unemployment Unemployment 1 North Dakota 2.4 17 Indiana 3.8 36 New Jersey 4.7 2 Colorado 2.5 17 Kansas 3.8 38 Pennsylvania
States Ranked by September 2017 Unemployment Rate Seasonally Adjusted Unemployment Unemployment Unemployment 1 North Dakota 2.4 17 Indiana 3.8 36 New Jersey 4.7 2 Colorado 2.5 17 Kansas 3.8 38 Pennsylvania
Unemployment Rate (%) Rank State. Unemployment
 Rank State. Unemployment") States Ranked by December 2017 Unemployment Rate Seasonally Adjusted Unemployment Unemployment Unemployment 1 Hawaii 2.0 16 South Dakota 3.5 37 Connecticut 4.6 2 New Hampshire 2.6 20 Arkansas 3.7 37 Delaware
States Ranked by December 2017 Unemployment Rate Seasonally Adjusted Unemployment Unemployment Unemployment 1 Hawaii 2.0 16 South Dakota 3.5 37 Connecticut 4.6 2 New Hampshire 2.6 20 Arkansas 3.7 37 Delaware
Unemployment Rate (%) Rank State. Unemployment
 Rank State. Unemployment") States Ranked by September 2015 Unemployment Rate Seasonally Adjusted Unemployment Unemployment Unemployment 1 North Dakota 2.8 17 Oklahoma 4.4 37 South Carolina 5.7 2 Nebraska 2.9 20 Indiana 4.5 37 Tennessee
States Ranked by September 2015 Unemployment Rate Seasonally Adjusted Unemployment Unemployment Unemployment 1 North Dakota 2.8 17 Oklahoma 4.4 37 South Carolina 5.7 2 Nebraska 2.9 20 Indiana 4.5 37 Tennessee
Unemployment Rate (%) Rank State. Unemployment
 Rank State. Unemployment") States Ranked by November 2014 Unemployment Rate Seasonally Adjusted Unemployment Unemployment Unemployment 1 North Dakota 2.7 19 Pennsylvania 5.1 35 New Mexico 6.4 2 Nebraska 3.1 20 Wisconsin 5.2 38 Connecticut
States Ranked by November 2014 Unemployment Rate Seasonally Adjusted Unemployment Unemployment Unemployment 1 North Dakota 2.7 19 Pennsylvania 5.1 35 New Mexico 6.4 2 Nebraska 3.1 20 Wisconsin 5.2 38 Connecticut
Unemployment Rate (%) Rank State. Unemployment
 Rank State. Unemployment") States Ranked by July 2018 Unemployment Rate Seasonally Adjusted Unemployment Unemployment Unemployment 1 Hawaii 2.1 19 Massachusetts 3.6 37 Kentucky 4.3 2 Iowa 2.6 19 South Carolina 3.6 37 Maryland 4.3
States Ranked by July 2018 Unemployment Rate Seasonally Adjusted Unemployment Unemployment Unemployment 1 Hawaii 2.1 19 Massachusetts 3.6 37 Kentucky 4.3 2 Iowa 2.6 19 South Carolina 3.6 37 Maryland 4.3
Colorado River Basin. Source: U.S. Department of the Interior, Bureau of Reclamation
 The Colorado River supports a quarter million jobs and produces $26 billion in economic output from recreational activities alone, drawing revenue from the 5.36 million adults who use the Colorado River
N A S S G A P Academic Year. 43rd Annual Survey Report on State-Sponsored Student Financial Aid
 N A S 43rd Annual Survey Report on State-Sponsored Student Financial Aid 2011-2012 Academic Year National Association of State Student Grant and Aid Programs S G A P About NASSGAP and this Report The National
Procurement and Purchasing
 Procurement and purchasing activities support the educational and research objectives of the college. Accordingly, individuals across campus are involved in purchasing goods and services as well as entering
FY 2014 Per Capita Federal Spending on Major Grant Programs Curtis Smith, Nick Jacobs, and Trinity Tomsic
 Special Analysis 15-03, June 18, 2015 FY 2014 Per Capita Federal Spending on Major Grant Programs Curtis Smith, Nick Jacobs, and Trinity Tomsic 202-624-8577 ttomsic@ffis.org Summary Per capita federal
Date: 5/25/2012. To: Chuck Wyatt, DCR, Virginia. From: Christos Siderelis
 1 Date: 5/25/2012 To: Chuck Wyatt, DCR, Virginia From: Christos Siderelis Chuck Wyatt with the DCR in Virginia inquired about the classification of state parks having resort type characteristics and, if
TENNESSEE TEXAS UTAH VERMONT VIRGINIA WASHINGTON WEST VIRGINIA WISCONSIN WYOMING ALABAMA ALASKA ARIZONA ARKANSAS
 ALABAMA ALASKA ARIZONA ARKANSAS CALIFORNIA COLORADO CONNECTICUT DELAWARE DISTRICT OF COLUMBIA FLORIDA GEORGIA GUAM MISSOURI MONTANA NEBRASKA NEVADA NEW HAMPSHIRE NEW JERSEY NEW MEXICO NEW YORK NORTH CAROLINA
THE STATE OF GRANTSEEKING FACT SHEET
 1 THE STATE OF GRANTSEEKING FACT SHEET ORG ANIZATIONAL COMPARISO N BY C ENSUS DIV ISION S PRING 2013 The State of Grantseeking Spring 2013 is the sixth semi-annual informal survey of nonprofits conducted
national assembly of state arts agencies
 STATE ARTS AGENCY GRANT MAKING AND FUNDING Each of America's 50 states and six jurisdictions has a government that works to make the cultural, civic, economic and educational benefits of the available
PRESS RELEASE Media Contact: Joseph Stefko, Director of Public Finance, ;
 PRESS RELEASE Media Contact: Joseph Stefko, Director of Public Finance, 585.327.7075; jstefko@cgr.org Highest Paid State Workers in New Jersey & New York in 2010; Lowest Paid in Dakotas and West Virginia
Index of religiosity, by state
 Index of religiosity, by state Low Medium High Total United States 19 26 55=100 Alabama 7 16 77 Alaska 28 27 45 Arizona 21 26 53 Arkansas 12 19 70 California 24 27 49 Colorado 24 29 47 Connecticut 25 32
2015 Community-University Engagement Awards Program
 2015 Community-University Engagement Awards Program W.K. Kellogg Foundation Community Engagement Scholarship Awards and C. Peter Magrath Community Engagement Scholarship Award Overview and Application
Is this consistent with other jurisdictions or do you allow some mechanism to reinstate?
 Topic: Question by: : Forfeiture for failure to appoint a resident agent Kathy M. Sachs Kansas Date: January 8, 2015 Manitoba Corporations Canada Alabama Alaska Arizona Arkansas California Colorado Connecticut
TABLE 3c: Congressional Districts with Number and Percent of Hispanics* Living in Hard-to-Count (HTC) Census Tracts**
 Census Tracts**") living Alaska 00 47,808 21,213 44.4 Alabama 01 20,661 3,288 15.9 Alabama 02 23,949 6,614 27.6 Alabama 03 20,225 3,247 16.1 Alabama 04 41,412 7,933 19.2 Alabama 05 34,388 11,863 34.5 Alabama 06 34,849 4,074
living Alaska 00 47,808 21,213 44.4 Alabama 01 20,661 3,288 15.9 Alabama 02 23,949 6,614 27.6 Alabama 03 20,225 3,247 16.1 Alabama 04 41,412 7,933 19.2 Alabama 05 34,388 11,863 34.5 Alabama 06 34,849 4,074
VOLUME 35 ISSUE 6 MARCH 2017
 VOLUME 35 ISSUE 6 MARCH 2017 IN THIS ISSUE Index of State Economic Momentum The Index of State Economic Momentum, developed by Reports founding editor Hal Hovey, ranks states based on their most recent
Estimated Economic Impacts of the Small Business Jobs and Tax Relief Act National Report
 Regional Economic Models, Inc. Estimated Economic Impacts of the Small Business Jobs and Tax Relief Act National Report Prepared by Frederick Treyz, CEO June 2012 The following is a summary of the Estimated
TABLE 3b: Congressional Districts Ranked by Percent of Hispanics* Living in Hard-to- Count (HTC) Census Tracts**
 Census Tracts**") Rank State District Count (HTC) 1 New York 05 150,499 141,567 94.1 2 New York 08 133,453 109,629 82.1 3 Massachusetts 07 158,518 120,827 76.2 4 Michigan 13 47,921 36,145 75.4 5 Illinois 04 508,677 379,527
Rank State District Count (HTC) 1 New York 05 150,499 141,567 94.1 2 New York 08 133,453 109,629 82.1 3 Massachusetts 07 158,518 120,827 76.2 4 Michigan 13 47,921 36,145 75.4 5 Illinois 04 508,677 379,527
LEVERAGING TRADE AND INVESTMENT TO BUILD A STRONGER ECONOMY
 LEVERAGING TRADE AND INVESTMENT TO BUILD A STRONGER ECONOMY New Mexico must establish itself as a player in the global economy. The current administration s short-sighted approach has put New Mexico far
Critical Access Hospitals and HCAHPS
 Critical Access Hospitals and HCAHPS Michelle Casey, MS Senior Research Fellow and Deputy Director University of Minnesota Rural Health Research Center June 12, 2012 Overview of Presentation Why is HCAHPS
RAISING ACHIEVEMENT AND REDUCING GAPS: Reporting Progress Toward Goals for Academic Achievement in Mathematics
 RAISING ACHIEVEMENT AND REDUCING GAPS: Reporting Progress Toward Goals for Academic Achievement in Mathematics By: Paul E. Barton January, 2002 A REPORT TO THE NATIONAL EDUCATION GOALS PANEL NATIONAL EDUCATION
Food Stamp Program State Options Report
 United States Department of Agriculture Food and Nutrition Service Fourth Edition Food Stamp Program State s Report September 2004 vember 2002 Program Development Division Program Design Branch Food Stamp
STATE AGRICULTURAL ORGANIZATIONS SUPPORTING S. 744 AS APPROVED BY THE SENATE AGRICULTURE COMMITTEE
 STATE AGRICULTURAL ORGANIZATIONS SUPPORTING S. 744 AS APPROVED BY THE SENATE AGRICULTURE COMMITTEE ALABAMA ALASKA ARIZONA Alabama Department of Agriculture & Industries* Alabama Poultry & Egg Association
Department of Defense Regional Council for Small Business Education and Advocacy Charter
 Department of Defense Regional Council for Small Business Education and Advocacy Charter Office of Small Business Programs 19 March 2014 1 CHARTER DoD REGIONAL COUNCIL FOR SMALL BUSINESS EDUCATION AND
 3+ 3+ N = 155, 442 3+ R 2 =.32 < < < 3+ N = 149, 685 3+ R 2 =.27 < < < 3+ N = 99, 752 3+ R 2 =.4 < < < 3+ N = 98, 887 3+ R 2 =.6 < < < 3+ N = 52, 624 3+ R 2 =.28 < < < 3+ N = 36, 281 3+ R 2 =.5 < < < 7+
STATE ARTS AGENCY GRANT MAKING AND FUNDING
 STATE ARTS AGENCY GRANT MAKING AND FUNDING Each of America's 50 states and six jurisdictions has a government that works to make the cultural, civic, economic and educational benefits of the available
AMERICAN ASSOCIATION FOR AGRICULTURAL EDUCATION FACULTY SALARIES
 AMERICAN ASSOCIATION FOR AGRICULTURAL EDUCATION 1999-2000 FACULTY SALARIES Contents Page Summary Data for 1999-2000 Faculty FTEs by Region Nine-month appointments (Table 1)...2 Twelve-month appointments
The American Legion NATIONAL MEMBERSHIP RECORD
 The American Legion NATIONAL MEMBERSHIP RECORD www.legion.org 2016 The American Legion NATIONAL MEMBERSHIP RECORD 1920-1929 Department 1920 1921 1922 1923 1924 1925 1926 1927 1928 1929 Alabama 4,474 3,246
USDA Farm to School Program FY 2013 FY 2017 Summary of Grant Awards
 USDA Farm to School Program FY 2013 FY 2017 Summary of Grant Awards ABOUT THIS REPORT This report summarizes findings from an analysis of select data from the 365 farm to school projects funded by USDA
Rutgers Revenue Sources
 Rutgers Revenue Sources 31.2% Tuition and Fees 27.3% State Appropriations with Fringes 1.0% Endowment and Investments.5% Federal Appropriations 17.8% Federal, State, and Municipal Grants and Contracts
Arizona State Funding Project: Addressing the Teacher Labor Market Challenge Executive Summary. Research conducted by Education Resource Strategies
 Arizona State Funding Project: Addressing the Teacher Labor Market Challenge Executive Summary Research conducted by Education Resource Strategies Key findings 1. Student outcomes in Arizona lag behind
W.K. Kellogg Foundation Community Engagement Scholarship Awards and C. Peter Magrath Community Engagement Scholarship Award
 W.K. Kellogg Foundation Community Engagement Scholarship Awards and C. Peter Magrath Community Engagement Scholarship Award Overview and Application Guidelines Submission Deadline: April 16, 2018 Since
Table 8 Online and Telephone Medicaid Applications for Children, Pregnant Women, Parents, and Expansion Adults, January 2017
 Table 8 Online and Telephone Medicaid Applications for Children, Pregnant Women, Parents, and Expansion Adults, January 2017 State Applications Can be Submitted Online at the State Level 1 < 25% 25% -
Food Stamp Program State Options Report
 United States Department of Agriculture Food and Nutrition Service Fifth Edition Food Stamp Program State s Report August 2005 vember 2002 Program Development Division Food Stamp Program State s Report
ACEP EMERGENCY DEPARTMENT VIOLENCE POLL RESEARCH RESULTS
 ACEP EMERGENCY DEPARTMENT VIOLENCE POLL RESEARCH RESULTS Prepared For: American College of Emergency Physicians September 2018 2018 Marketing General Incorporated 625 North Washington Street, Suite 450
BRAND REPORT FOR THE 6 MONTH PERIOD ENDED JUNE 2017
 Hanley Wood Media, Inc. One Thomas Circle NW Suite 600 Washington, DC 20005 Tel.: (202) 452-0800 Fax: (202) 785-1974 www.builderonline.com BRAND REPORT FOR THE 6 MONTH PERIOD ENDED JUNE 2017 No attempt
MAP 1: Seriously Delinquent Rate by State for Q3, 2008
 MAP 1: Seriously Delinquent Rate by State for Q3, 2008 Seriously Delinquent Rate Greater than 6.93% 5.18% 6.93% 0 5.17% Source: MBA s National Deliquency Survey MAP 2: Foreclosure Inventory Rate by State
What do the following have
 Solutions Solutions to Environmental Finance Challenges The Environmental Finance Center Network Approach By Jeffrey Hughes and Lexi Kay The Environmental Finance Center Network is a national network of
DEVELOPMENT DISTRICT ASSOCIATION OF APPALACHIA
 DEVELOPMENT DISTRICT ASSOCIATION OF APPALACHIA Jobs and Sustained Economic Growth. Workforce Readiness. Modern Infrastructure Assets. Quality of Life. Vibrant Communities. SUSTAINED ECONOMIC GROWTH. VIBRANT
SDVOSB Information Guide
 SDVOSB Information Guide Table of Contents 1. Eligibility for SDVOSB or VOSB Verification 2. Affiliation 3. SDVOSB Stats 4. If Denied SDVOSB Reconsideration 5. SDVOSB Market Share Trend 6. SDVOSB Good
SOUTHWEST PUBLIC RECYCLING ASSOCIATION: A COOPERATIVE MODEL
 SOUTHWEST PUBLIC RECYCLING ASSOCIATION: A COOPERATIVE MODEL Submitted to: EPA Region 9 March 1993 Submitted by: Southwest Public Recycling Association (SPRA) (602) 791-4069 TABLE OF CONTENTS SECTION1-BACKGROUND...
THE METHODIST CHURCH (U.S.)
") THE METHODIST LIBRARY CONFERENCE JOURNALS COLLECTION PAGE: 1 ALABAMA 1939-58 ALABAMA WEST FLORIDA 1959-1967 ALASKA MISSION 1941, 1949-1967 ATLANTA 1939-1951 BALTIMORE CALIFORNIA ORIENTAL MISSION 1939-1952
THE METHODIST LIBRARY CONFERENCE JOURNALS COLLECTION PAGE: 1 ALABAMA 1939-58 ALABAMA WEST FLORIDA 1959-1967 ALASKA MISSION 1941, 1949-1967 ATLANTA 1939-1951 BALTIMORE CALIFORNIA ORIENTAL MISSION 1939-1952
Technology Driven Enterprise & Economic Development. for the BECC
 Technology Driven Enterprise & Economic Development for the BECC by L. (Marty) Murphy Manager, NREL Enterprise Development Program Nov. 17, 2008. Sacramento, CA 1 Public Private Partnerships - Going Beyond
GROWING THE MIDDLE: SECURING THE FUTURE LOS ANGELES
 GROWING THE MIDDLE: SECURING THE FUTURE LOS ANGELES 02.21.18 MANUEL PASTOR @Prof_MPastor THE WIDENING GAP 1 THE WIDENING GAP INEQUALITY: HOW CALIFORNIA RANKS Household* Gini Coefficient, 1969 Mississippi
WikiLeaks Document Release
 WikiLeaks Document Release February 2, 2009 Congressional Research Service Report 98-968 The Hill-Burton Uncompensated Services Program Barbara English, Knowledge Services Group May 9, 2006 Abstract. The
 Page 1 of 11 NOAA Technical Memorandum NWS SR-193, Section 4 Section 4 Table of Contents: 4. Variations by State Weighted by Population A. Death and Injury (Casualty) Rate per Population B. Death Rate
FEDERAL FINANCING OF RURAL FIRMS IN THE U.S.
 FEDERAL FINANCING OF RURAL FIRMS IN THE U.S. September 2016 E.U. Agri Cork 2.0 Short history of rural financing Current financing tools in the U.S. How programs are delivered How costs are determined Obama
DataArts and the New CDP
 DataArts and the New CDP October 26, 2016 PRESENTED BY Mary Garcia Charumilind Senior Business Development Associate Overview Agenda Agenda 1 2 3 4 5 About DataArts The DataArts Platform The New Cultural
Program Plan For the Energy Efficiency and Renewable Energy Technology Account Under New York s Clean Air Interstate Rules (CAIR)
") Program Plan For the Energy Efficiency and Renewable Energy Technology Account Under New York s Clean Air Interstate Rules (CAIR) New York Battery and Energy Storage Technology Consortium Originally prepared
Program Plan For the Energy Efficiency and Renewable Energy Technology Account Under New York s Clean Air Interstate Rules (CAIR) New York Battery and Energy Storage Technology Consortium Originally prepared
engineering salary guide
 engineering salary guide At a time when lean practices and agile teams create the expectation of doing more with less, employers need to develop new strategies to attract and retain the best employees
Annex A: State Level Analysis: Selection of Indicators, Frontier Estimation, Setting of Xmin, Xp, and Yp Values, and Data Sources
 Annex A: State Level Analysis: Selection of Indicators, Frontier Estimation, Setting of Xmin, Xp, and Yp Values, and Data Sources Right to Food: Whereas in the international assessment the percentage of
NMLS Mortgage Industry Report 2016 Q1 Update
 NMLS Mortgage Industry Report 2016 Q1 Update Released June 10, 2016 Conference of State Bank Supervisors 1129 20 th Street, NW, 9 th Floor Washington, D.C. 20036-4307 NMLS Mortgage Industry Report: 2016Q1
Grants 101: An Introduction to Federal Grants for State and Local Governments
 Grants 101: An Introduction to Federal Grants for State and Local Governments Introduction FFIS has been in the federal grant reporting business for a long time about 30 years. The main thing we ve learned
High-Tech Nation: How Technological Innovation Shapes America s 435 Congressional Districts
 High-Tech Nation: How Technological Innovation Shapes America s 435 Congressional Districts John Wu, Adams Nager, and Joseph Chuzhin November 2016 itif.org/technation High-Tech Nation: How Technological
CRMRI White Paper #3 August 2017 State Refugee Services Indicators of Integration: How are the states doing?
 CRMRI White Paper #3 August 7 State Refugee Services Indicators of Integration: How are the states doing? Marci Harris, Julia Greene, Kilee Jorgensen, Caren J. Frost, & Lisa H. Gren State Refugee Services
Concept Paper for ANN VISTA Project for FY 2012 Submitted
 Executive Summary Concept Paper for ANN VISTA Project for FY 2012 Submitted 12-11-11 1. Provide a brief description of the proposed project, including the project goal(s) as well as an overview of the
NMLS Mortgage Industry Report 2017Q2 Update
 NMLS Mortgage Industry Report 2017Q2 Update Released September 18, 2017 Conference of State Bank Supervisors 1129 20 th Street, NW, 9 th Floor Washington, D.C. 20036-4307 NMLS Mortgage Industry Report:
NMLS Mortgage Industry Report 2018Q1 Update
 NMLS Mortgage Industry Report 2018Q1 Update Released July 5, 2018 Conference of State Bank Supervisors 1129 20 th Street, NW, 9 th Floor Washington, D.C. 20036-4307 NMLS Mortgage Industry Report: 2018Q1
NMLS Mortgage Industry Report 2017Q4 Update
 NMLS Mortgage Industry Report 2017Q4 Update Released March 9, 2018 Conference of State Bank Supervisors 1129 20 th Street, NW, 9 th Floor Washington, D.C. 20036-4307 NMLS Mortgage Industry Report: 2017Q4
News & Updates from our members and ESC State Chapters
 News & Updates from our members and ESC State Chapters 7th Annual ESC Market Transformation Conference Goes Down to Georgia: October 4-5, 2018 in Atlanta The 7th Annual Energy Services Coalition Market
Department of Defense INSTRUCTION
 Department of Defense INSTRUCTION NUMBER 4715.02 August 28, 2009 Incorporating Change 2, August 31, 2018 USD(A&S) SUBJECT: Regional Environmental Coordination References: (a) DoD Instruction 4715.2, DoD
Hennepin County Residential Recycling Funding Policy
 Attachment A Hennepin County Residential Recycling Funding Policy January 1) 2017 - December 31,2020 Board Adopted: November 29,2016 H Public Works Environment and Energy Department I. Policy Description
Comparison of Drinking Water State Revolving Fund (DWSRF) Programs and other Federal Assistance to Disadvantaged Communities in EPA Region 4
 Programs and other Federal Assistance to Disadvantaged Communities in EPA Region 4") Comparison of Drinking Water State Revolving Fund (DWSRF) Programs and other Federal to Disadvantaged Communities in EPA Region 4 By Chris Heaney Chris Heaney is a graduate assistant who has worked with
Comparison of Drinking Water State Revolving Fund (DWSRF) Programs and other Federal to Disadvantaged Communities in EPA Region 4 By Chris Heaney Chris Heaney is a graduate assistant who has worked with
Agriculture Secretary Vilsack Announces Economic Development Funding To Create Jobs in Rural Communities in 26 States
 Agriculture Secretary Vilsack Announces Economic Development Funding To Create Jobs in Rural Communities in 26 States ALBUQUERQUE, N.M., - October 26, 2011 Agriculture Secretary Tom Vilsack today announced
U.S Department of Agriculture. Agricultural Outlook Forum February 20 & 21, 2003 NEW PROGRAMS TO BENEFIT RURAL HOUSEHOLDS AND BUSINESSES
 U.S Department of Agriculture Agricultural Outlook Forum 2003 February 20 & 21, 2003 NEW PROGRAMS TO BENEFIT RURAL HOUSEHOLDS AND BUSINESSES Thomas C. Dorr Under Secretary for Rural Development, USDA (As
September 14, 2009 Nashville, Tennessee
 Your New Jobs May Be Homegrown: Entrepreneurship as an Economic Development Strategy Brian Dabson Governor s Conference on Economic and Community Development Nashville, Tennessee Public perception of entrepreneurs
Military Representative to State Council of the Military Interstate Children s Compact Resource Guide
 Military Representative to State Council of the Military Interstate Children s Compact Resource Guide Publication: October 16, 2017 Table of Contents INTRODUCTION TO THE MILITARY INTERSTATE CHILDREN S
Ability to Meet Minimum Expectations: The Current State of Local Public Health in Minnesota
 Ability to Meet Minimum Expectations: The Current State of Local Public Health in Minnesota SUMMARY OF ASSESSMENT FINDINGS Executive Summary Minnesota s Local Public Health Act (Minn. Stat. 145A) provides
4th Quarter Manpower Employment Outlook Survey. United States
 4th Quarter 2003 Manpower Employment Outlook Survey United States Contents United States Employment Outlook 2 The Americas Employment Outlook 14 Global Employment Outlook 16 About the Survey 18 About Manpower
Financing Local Infrastructure: Methodology for Developing Project Profiles
 Preliminary Roadmap Infrastructure Toolkit Methodology for Local Economic Development Finance Initiative of Tanzania (LFI-T) Financing Local Infrastructure: Methodology for Developing Project Profiles
FINANCING BRIEF. Implementation of Health Reform for Children s Mental Health HEALTH REFORM PROVISIONS EXPLORED
 FINANCING BRIEF Implementation of Health Reform for Children s Mental Health Beth A. Stroul, M.Ed. Jonathan Safer-Lichtenstein, B.S. Linda Henderson-Smith, Ph.D., LPC Lan Le, M.P.A. MAY 2015 The National
Nielsen ICD-9. Healthcare Data
 Nielsen ICD-9 Healthcare Data Healthcare Utilization Model The Nielsen healthcare utilization model has three primary components: demographic cohort population counts, cohort-specific healthcare utilization
SUPPORTING ENTREPRENEURS. A Longitudinal Impact Study of Accion and Opportunity Fund Small Business Lending in the U.S.
 SUPPORTING ENTREPRENEURS A Longitudinal Impact Study of Accion and Opportunity Fund Small Business Lending in the U.S. April 2018 A Letter from Accion & Opportunity Fund Dear Partners, Friends and Supporters:
STATE INDUSTRY ASSOCIATIONS $ - LISTED NEXT PAGE. TOTAL $ 88,000 * for each contribution of $500 for Board Meeting sponsorship
 Exhibit D -- TRIP 2017 FUNDING SOURCES -- February 3, 2017 CORPORATE $ 12,000 Construction Companies $ 5,500 Consulting Engineers Equipment Distributors Manufacturer/Supplier/Producer 6,500 Surety Bond
Table 6 Medicaid Eligibility Systems for Children, Pregnant Women, Parents, and Expansion Adults, January Share of Determinations
 Table 6 Medicaid Eligibility Systems for Children, Pregnant Women, Parents, and Expansion Adults, January 2017 Able to Make Share of Determinations System determines eligibility for: 2 State Real-Time
Table 1 Elementary and Secondary Education. (in millions)
") Revised February 22, 2005 WHERE WOULD THE CUTS BE MADE UNDER THE PRESIDENT S BUDGET? Data Table 1 Elementary and Secondary Education Includes Education for the Disadvantaged, Impact Aid, School Improvement
Revised February 22, 2005 WHERE WOULD THE CUTS BE MADE UNDER THE PRESIDENT S BUDGET? Data Table 1 Elementary and Secondary Education Includes Education for the Disadvantaged, Impact Aid, School Improvement
SERVICE PROVIDER. Membership Benefits. Water Knowledge, Resources, and Community
 SERVICE PROVIDER Membership Benefits Water Knowledge, Resources, and Community Build Expertise and Relationships in the Water Sector 88% of AWWA members who work at utilities are decision makers Members
Connecting Startups to VC Funding in Canada
 Technology & Life sciences Connecting Startups to VC Funding in Canada introduction While the majority of respondents have accessed early seed investment from friends, family and angel investors, many
Acm762 AG U.S. VITAL STATISTICS BY SECTION, 2017 Page 1
 Acm762 AG U.S. VITAL STATISTICS BY SECTION, 2017 Page 1 District Summary Major Worship Total Total -------------------- Adherents -------------------- Service District Churches Membership Boys Girls Men
In the District of Columbia we have also adopted the latest Model business Corporation Act.
 Topic: Question by: : Reinstatement after Admin. Dissolution question Dave Nichols West Virginia Date: March 14, 2014 Manitoba Corporations Canada Alabama Alaska Arizona Arkansas California Colorado Connecticut
Implications of Changing FAFSA Deadline and Distribution of Financial Aid Awards
 Implications of Changing FAFSA Deadline and Distribution of Financial Aid Awards December 2015 2015 JCR p. 121 MARYLAND HIGHER EDUCATION COMMISSION 6 N. Liberty Street, 10 th Floor, Baltimore, MD 21201
Continuum of Health Care
 What Is Case Management? While there are many definitions of case management, the 2016 definition approved by CMSA is as follows (CMSA, Standards of Practice for Case Management, Rev. 2016): Case Management
Licensure Challenges in Preventive Medicine A Public Policy Issue
 Licensure Challenges in Preventive Medicine A Public Policy Issue Sharon K. Hull, MD, MPH, Neal D. Kohatsu, MD, MPH, Clyde B. Schechter, MD, Hugh H. Tilson, MD, DrPH Introduction Preventive medicine is
Sharing of Data Between Agencies. Date: August 31, 2011 [ INSERT TOPIC NAME ] [ INSERT YEAR MONTH DD ]
![Sharing of Data Between Agencies. Date: August 31, 2011 [ INSERT TOPIC NAME ] [ INSERT YEAR MONTH DD ]](/thumbs/71/65784909.jpg "Sharing of Data Between Agencies. Date: August 31, 2011 [ INSERT TOPIC NAME ] [ INSERT YEAR MONTH DD ]") Topic: Question by: : Sharing of Data Between Agencies Mandy Harlan Louisiana Date: August 31, 2011 Manitoba Corporations Canada Alabama Alaska Arizona Arkansas California An automated process of exchange
Topic: Question by: : Sharing of Data Between Agencies Mandy Harlan Louisiana Date: August 31, 2011 Manitoba Corporations Canada Alabama Alaska Arizona Arkansas California An automated process of exchange
Report Responding to Requirements of Legislation: Student and Employer Connection Information System
 Report Responding to Requirements of Legislation: Student and Employer Connection Information System Executive Summary The RealTime Talent Exchange was recently introduced to Minnesota to bring greater
State Purchasing Fees
 hasing Fees 6.1 Central Purchasing is funded through: 6.2 Does the state office charge state agencies for services provided by the central procurement office? 6.3 What value-added services (other than