Connecticut s Energy Efficiency & Conservation Programs
|
|
|
- Ashlee Barber
- 6 years ago
- Views:
Transcription
1 Staff Briefing Connecticut s Energy Efficiency & Conservation Programs September 25, 2008 Legislative Program Review & Investigations Committee CONNECTICUT GENERAL ASSEMBLY
2 Committee Staff on Project Catherine M. Conlin, Chief Analyst Michelle Riordan-Nold, Legislative Analyst II Legislative Program Review and Investigations Committee Connecticut General Assembly State Capitol Room 506 Hartford, CT Tele: (860) Web:
3 Introduction Purpose of Study The committee undertook this study in May 2008 to assess what progress Connecticut has made in achieving two of the eight broad goals of the state s energy policy, which was established in statute in The two broad goals under review are to: assist citizens and businesses in implementing measures to reduce energy consumption and costs; and ensure that low-income households can meet essential energy needs. Rationale of Goal One The reason for Connecticut to implement measures to reduce demand and consumption of energy, especially at peak demand times, is that it provides many benefits to all state residents and businesses. Those benefits include: 1 More sustainable and stable rates of growth in energy demand; Reduced risk of huge price increases and price volatility; Lower total energy bills for all consumers; Increased energy reliability, including reduced risks of blackouts and shortages that can have drastic impacts on the state s well-being and economy Less need to site and pay for potentially controversial, expensive, and environmentally harmful energy supply facilities; Cuts in emissions of air pollutants and greenhouse gases Balances and diversifies the manner of a state s energy portfolio Direct and indirect economic development benefits including: developing a green workforce ; more reduction in energy consumption and costs makes a more competitive business environment, even to the extent of keeping some businesses open that otherwise may close or relocate. 1 Many of the benefits are cited by the American Council for Energy-Efficient Economy, and noted in the Connecticut Energy Efficiency Fund 2008 Energy Excellence Plan, May 2008, p.8. 1
4 Rationale of Goal Two The reasons for ensuring that assistance is provided to low-income residents to meet their energy needs are fairly apparent: Many of the state s low-income residents are also vulnerable in some other way e.g., elderly and or disabled, and heat and light become as basic a need as food or medicine; As energy costs rise, bills for light and heat take a greater portion of income and more and more residents have a harder time paying those bills, the need for financial assistance becomes more acute. Since this is considered a societal responsibility federal and (to a lesser extent) state dollars support these program. Also, because low-income residents also pay electric bills and consequently the surcharges on those bills, financial support also comes from electric companies as well as gas companies, through their rates. Measuring results. It is fairly easy to lay out why the state should implement energy efficiency and conservation programs and assist low-income households with energy expenses, but it is much more difficult to assess whether the state s efforts have been successful. One measure of success in attaining the energy efficiency goal is that Connecticut has been recognized as a national leader in delivering energy efficiency programs by the American Council for an Energy-Efficient Economy (ACEEE). 2 The ACEEE ranks states based on their progress in eight energy efficiency policy categories including spending on programs sponsored by utility ratepayers, tax incentives, building energy codes, and whether the state has an energy policy and standards. Connecticut ranked first, along with California and Vermont, in the ACEEE 2006 scorecard. But other yardsticks of success that are closer to consumers may be more difficult to assess. A major factor that stymies efforts on both fronts -- improving energy efficiency and helping lower-income groups is largely beyond the control of state or even national policy makers to control: that is the cost of energy. One of the goals of efficiency programs is of course to save money, but as much as consumers may try to implement efficiency measures, if energy costs increase so do their utility and heating bills, frustrating expectations to see pocketbook results. The state s efforts to assist low-income households with energy expenses face similar challenges. As energy costs rise faster than incomes, especially for lower and middle income groups, more households fall into the groups needing assistance. The amount of public monies available has not increased to match that demand, hence more people face an affordability gap and the less that gap is able to be filled with assistance. The General Assembly, recognizing the 2 The ACEEE is a nonprofit organization established in 1980, relies on funding and support from a variety of public and private sources, advances energy efficiency as a means of promoting economic prosperity, energy security, and environmental protection. 2
5 severity of the energy affordability problem, in August 2008 allocated surplus 2008 funds to various programs aimed at improving energy efficiency and assisting low- and moderate-income households pay their energy bills. Another obstacle to measuring energy efficiency is that the world is dynamic and constantly changing. Modifications and upgrades in the home and the workplace can impact energy use profoundly. New technologies and their widespread use, like flat screen televisions or personal computers in every home and on every office desk, are prime examples. So, while it may appear that energy use keeps increasing despite implementing efficiency measures, it is difficult to estimate what use would have been had the measures not been implemented. Some aspects of meeting the two energy policy goals under this review may be well beyond the control of state government and other entities involved. Others, such as ensuring the efforts are coordinated and state residents receive the most value for the dollars spent are certainly within the purview of policymakers and program administrators and therefore should be measured, evaluated, and necessary improvements made. This briefing report is only a first phase of examining these two goals and how well they are being met. The report for the most part is limited to describing what programs are in place now both to implement energy efficiency measures and assist low income residents, and to a much lesser extent, how well they are working. The issues of coordination and gaps in programs will be developed further for the final report along with proposals for improving any deficiencies identified. Methods. The program review committee staff has relied on many sources in developing the briefing report. In addition to state statutes, staff relied on energy documents produced by a variety of both federal and state government agencies and nonprofit policy organizations. Many interviews were held with staff from several state agencies, including: the Office of Policy and Management; Office of the Attorney General; Office of Consumer Counsel; and the Departments of Public Utility Control, Economic and Community Development, Environmental Protection, and Social Services. Interviews were also conducted with staff from the utilities, and a number of board members and staff from the Energy Conservation and Management Board, the Clean Energy Fund, the Connecticut Energy Advisory Board, and the Low Income Energy Advisory Board. A number of these boards meetings were also observed. Committee staff also met with representatives of the Institute for Sustainable Energy, Operation Fuel, and the Connecticut Association for Community Action Agencies (CAFCA). Report organization. The briefing report contains five sections. The first section describes energy consumption and cost trends, both nationally and in Connecticut, and places them in context with population and the economy, as well as their impact on consumers, especially lower-income groups. The second section discusses why energy efficiency policies and programs are important and what governments, especially at the state level, are doing to spur implementation of energy efficiency measures. It also summarizes the components of a model action plan for energy 3
6 efficiency, based on the National Action Plan for Energy Efficiency, developed by more than 50 leaders from government, business, and utilities, and sponsored by the federal Department of Energy and the Environmental Protection Agency. The section also describes what elements are generally in place in Connecticut. The last three sections provide a comprehensive description of all programs currently in place to implement energy efficiency and assist low-income customers with their energy costs and in weatherizing their homes to conserve energy. The sections are organized primarily by program funding source: Section III includes those that are funded by electric or gas ratepayers, while Section IV discusses those funded with state bonds, General Fund, or special dedicated funding. Section V describes those programs aimed at assisting low-income residents. The description of each program highlights key features, including: origination and purpose; eligibility requirements and benefit levels; program administration and oversight; funding and activity levels; and reported monitoring and evaluation results, if any. The scope of the study also called for a status report of the many measures required (P.A ), a comprehensive energy act passed in That is provided in Appendix A. 4
7 Section I Overview of Connecticut and Energy Use This section discusses overall energy consumption trends both nationally and in Connecticut. The section also describes what the costs of energy have been and their impact on the economy in this state and nationwide. While national figures are based on recent 2007 data, comparative information between Connecticut and other states is somewhat older (2005). Finally, the consumption and costs of different types of energy and the increasing burden those costs are placing on Connecticut households, especially those of lower income, are analyzed. To help put energy use in perspective, and assist in understanding this section, Table I-1 provides some terms of measurement for different types of energy and overall consumption. Appendix B also provides a glossary of commonly used energy terms. Table I-1. Energy Terms for Measurement Number of Households in Connecticut in CL&P and UI territory Average Energy Consumption per Household Electricity Oil Natural Gas Energy Measurements Electricity Oil Natural Gas Overall Energy BTU 1.4 million 700 kwh per month 8400 kwh per year gallons per year 1,030 ccf per year kwh (kilowatt hours) measures the amount of electricity consumed over time: 1,000 kwh = 1 MWh 1,000 MWh = 1 GWh KW measures the amount of constant electricity needed 1,000 KW = 1 MW Gallons measures the amount of oil consumed in gallons Ccf- measures the amount of gas consumed in hundreds of cubic feet Mcf thousands of cubic feet MMcf millions of cubic feet BTU British Thermal Units measures energy consumption and allows for consumption comparisons among fuels that are measured in different units Quadrillion BTUs - for total population Millions of BTUs - for individuals Nationally, over the past 30 years overall consumption of energy (including transportation uses) has increased about 27 percent from about 80 quadrillion BTUs in 1978 to in 2007, as shown in Figure I-1. National consumption declined more than 10 percent 5
8 between 1978 and 1983, as a result of a national recession in the early 1980s, a reduction in overseas oil production and higher oil prices. However, the impact was temporary, and when prices dropped again national consumption resumed, although somewhat more moderately. Measured on a per-person basis, energy consumption has remained fairly stable during the same time period, as shown in Figure I-2. The per-person use was at its peak in 1978 at 359 million BTUs, before dropping substantially in the early 1980s, and then grew moderately. More recent per capita consumption has actually declined, from 345 million BTUs in 1998 to 337 million BTUs in Figure I-1. National Energy Consumption Figure I-2. U.S. Per Capita Energy Consumption Quad. BTUs Source: Federal Energy Information Administration 2007 Million BTUs Source: Federal Energy Information Administration Much of the national increase in energy use is due to economic growth. Data show that gross domestic product (GDP) significantly outpaced growth in energy consumption. Nationally, between 1997 and 2007, the GDP increased by almost 67 percent in actual dollars, while national energy consumption grew by about 7 percent. A newer measure that attempts to gauge intensity of energy consumption to support the economy calculates energy use for every dollar the economy produces. Thus, if energy consumption is measured in 1,000 BTUs for every real dollar of GDP, or the energy it takes to produce every dollar of economic growth, the decline in consumption is also dramatic. Thus, for every dollar of GDP in 1997 it took (1,000 BTUs) to produce that, and only 8.78 (1,000 BTUs) in 2007, a reduction of almost 20 percent. While the energy being consumed to drive the economy may be lessening, the cost of energy as a percent of GDP is increasing after being stable for a time. As Figure I-3 shows, energy expenditures are not taking as much of our national gross product as they were during the later 1970s and early 1980s, when the energy costs accounted for almost 12 percent of GDP, that percentage has been increasing and is again approaching 10 percent. percent Figure I-3. Energy Expenditures as a Percent of National GDP
9 Connecticut s Energy Consumption It is difficult to compare trends nationally with Connecticut using the same time period as above, because the most recent state data is for Consumption data for the period between 1995 and 2005 show that the state s energy consumption grew from trillion BTUs to trillion BTUs, an increase of about 15.6 percent. For the same period national consumption increased about 10 percent. Compared to other states, Connecticut s overall consumption is fairly low. In total energy consumption (all sources) Connecticut ranked 33 of 50 states and D.C. in Comparing Connecticut to other states by end-use sector, the residential and the commercial sector (e.g., office buildings, retail) both ranked 28. Connecticut ranked 44 in consumption by the industrial (manufacturing) sector, reflecting that Connecticut s economy is not heavily manufacturingbased. Per capita consumption in Connecticut also is comparatively low. The state ranked 44 in total energy consumed per capita in 2005, an increase from 2001, when Connecticut ranked 47. Connecticut s 2005 per capita consumption of million BTUs is about 24 percent less than the national average per capita consumption of million BTUs, indicating that Connecticut residents are relatively low consumers of energy. Connecticut s Energy Costs Connecticut has not been a high energy-consuming state, but Connecticut has high energy prices. In 2005, Connecticut had the third-highest prices in the nation per million BTUs. At $19.40 per million BTUs, Connecticut was behind only Hawaii and D.C., and was about 20 percent higher than the national average price of $ However, Connecticut ranks in the middle (26) of all the states when comparing expenditures per person. Connecticut expended $3,571 per person on energy in 2005, only 1.2 percent above the national average of $3,525. Because Connecticut residents pay a lot for energy they may be more cautious energy consumers, hence their overall expenditures do not differ much from the national average. The two graphs below show the growth in energy expenditures as a measure of the state economy. Figure I-4 illustrates the growth in Connecticut s overall energy expenditures as a percent of gross state product. Between 1997 and 2005, growth in that measure has gone from less than 5 percent in the late 1990s to almost 7 percent in 2005, an almost 40 percent increase. While actual data are not available beyond 2005, additional and dramatic increases in energy costs since then make it likely that energy expenses are consuming a much greater share of the state s economy. 7
10 Percent Figure I-4. Connecticut Energy Costs as a Percent of Gross State Product Source: Federal Energy Information Administration Energy expenses as a share of the state s total personal income have also grown over the same period from a low of about 5 percent in 2002 to more than 7 percent in 2005 (Figure I-5). Again, if more recent data were available, this ratio would likely be much higher since energy prices have increased substantially since Further, state personal income is a gross measure of the overall income of all state residents, but the impact energy costs have on individuals and households can be much higher than the 7 percent, depending on their income. This impact will be discussed later in this section. Percent Figure I-5. Connecticut Energy Costs as a Percent of State Personal Income Sources of Data: EIA for Energy Costs and Bureau of Economic Analysis for Personal Income Statewide Consumption and Cost by Type of Energy Just as Connecticut does not rank high in overall consumption of energy, it also does not rank high in consumption of any one type of energy. However, because of the state s geographic location and lack of fossil fuels, it pays some of the highest prices for all types of energy. A brief description of consumption and price of energy in Connecticut follows. 8
11 Oil. In 2005, Connecticut ranked 29th of the 50 states and D.C. for overall consumption of oil. Within Connecticut, residential customers are the largest consumers of oil, consuming over 500 million gallons of oil in 2006 (see Table I-2). Table I-2: Annual Oil Consumption (Mgal) in Connecticut by Sector Residential 579, , , , , ,807 Commercial 144, , , , , ,141 Industrial 24,716 16,094 52,299 22,895 14,693 14,669 Total 749, , , , , ,617 Source: Federal Energy Information Administration Figure I-6 graphically depicts the total oil consumption for the state since As the figure demonstrates, total consumption reached a high in 2003 and has been on a decline ever since. Figure I-6: Annual Oil Consumption (Mgal) for Residential, Commercial and Industrial Use 950, , , , , , , , , , , , , ,617 Oil prices for all users, residential, commercial, and industrial, generally have steadily increased since 2001 (Figure I-7). Residential customers have experienced a 172 percent increase in prices since 2001, reaching an average high of $3.27/gallon for the first four months in Commercial and industrial customers have seen larger percentage increases since 2001, 226 percent and 257 percent respectively, although a lower average price per gallon than residential customers. 9
12 $/gallon Figure I-7: CT Average Annual Price of Oil by Customer Type (excluding taxes) Jan-Apr 08 Source: Federal Energy Information Administration Residential Commercial Industrial Natural gas. Connecticut is not a large consumer of natural gas; it ranks 36th among the 50 states and D.C. in 2005 (the latest year all state rankings were developed). Further, much of the natural gas consumed in the state in 2007 about 42 percent - was used for the production of electricity. The remainder of the state s natural gas consumption was split among residential (25 percent), commercial (20 percent), and industrial (13 percent) customers. Overall consumption for all customer types has seen a steady increase since 2003 as shown in Figure I-8. The electric industry s shift from reliance on coal to natural gas has increased its overall share. Over the past four years, consumption of natural gas to produce electricity has increased by one and half times, going from 28 percent to 42 percent (Figures I-9 and I-10). In contrast, commercial, industrial, and residential customers have all decreased their consumption. 10
13 Figure I-8: Annual Natural Gas Consumption (MMcf) 180, , , , , , , , , , , , Figure I-9: 2003 Natural Gas Consumption Figure I-10: 2007 Natural Gas Consumption 28% 30% 25% 42% 16% 20% 26% Residential Commercial Industrial Electric Power Source: Energy Information Adminstration 13% Residential Commercial Industrial Electric Power Natural gas prices have also been on the rise since 2003, although since 2005 they appear to have leveled off (Figure I-11). Similarly to oil prices, residential customers pay the highest price for natural gas among the three customer types. 11
14 Figure I-11: CT Average Annual Price of Natural Gas by Customer Type (per Mcf) $/Mcf Residential Commercial Industrial Source: Federal Energy Information Administration Electricity. Consumption of electricity has steadily increased since 1996 (see Figure I- 12). However, in 2006 there was a precipitous drop, which leveled out in Most likely the drop was a result of the large increase in electricity prices around that time. 36,000 35,000 34,000 33,000 32,000 31,000 30,000 29,000 Figure I-12: CT Electricity Usage Source: ISO-New England data GWh Following the pattern of overall electricity usage, residential consumers have also steadily increased electricity consumption (see Figure I-13). 12
15 Figure I-13: Connecticut Residential kwh usage per Household 11,000 10,000 kwh 9,000 8, Source: EIA and ISO-NE Consumption trends in electricity vary by sector as shown in Table I-3. While the number of households has grown by less than 7 percent from 1996 to 2006, residential use has grown by almost 11 percent, indicating the real growth has been in usage per household. Further, in the industrial sector, there has actually been a decline in manufacturing (as measured by employment) of more than 20 percent, while industrial electricity usage has declined by almost half that, indicating usage has outpaced the economic growth in that sector. Only in the commercial non-manufacturing sector has the sector growth outstripped electric consumption growth. Table I-3: Connecticut Electric Demand: Components of Growth Percent Growth 1996 to 2006 Sum-of-companies Forecasts Residential GWh Sales 17.9% Households 6.7% Usage 11.2% Commercial GWh Sales 18.3% Non-manufacturing Employment 10.8% Usage 7.5% Industrial GWh Sales (11.5%) Manufacturing Employment (21.3%) Usage 9.8% Source: An Analysis of Demand for Electricity in Connecticut prepared for the ECMB, January 28,
16 In overall electricity sales in 2006, Connecticut ranked 35th among the 50 states and D.C. However, within New England, Connecticut residents and commercial customers consume the most kwh per month. 3 In Connecticut, these two customers types together account for 83 percent of total sales, with the remainder being sales to the industrial and transportation sectors. Connecticut has the second highest average residential retail electricity prices out of the 50 states and D.C., according to the most recent rankings from the Federal Energy Information Agency. At about 18 cents per kwh, Connecticut trails only Hawaii in what its residential electric customers pay. The primary driver of the cost of electricity is the generation service charge as shown by Figure I-14. Since 2005, this charge has comprised about two-thirds of the cost of electricity. Figure I-14: CL&P & UI Average Electric Rates, Cents/kWh Jan Jan Jan Jan Jan Jan Jan Jan Distribution Transmission C&LM CTA SBC Renewables GSC FMCC [FMCC=Federally Mandated Congestion Charges; GSC=Generation Service Charge; SBC=Systems Benefits Charge; CTA= Competitive Transition Assessment; C&LM=Conservation & Load Management] Source: The Cost of Electricity: An Analysis of the Components and Drivers of Electricity Costs in Connecticut, ECMB, May 15, (viewed on Energy Information Administration) 14
17 Figure I-15 illustrates the components of that generation charge, of which more than 70 percent pays for fuel. Capacity 9% Figure I-15 Approximate 2007 Energy Generation Cost Components Courtesy of United Illuminating and Connecticut Light and Power For Illustration Purposes Only Uplift 2% Ancillary Services 3% ISO Administration 1% Renewable Portfolio Standard 2% Losses 5% Congestion 7% Energy (Fuel) 71% Source: The Cost of Electricity: An Analysis of the Components and Drivers of Electricity Costs in Connecticut, Energy Conservation Management Board, May 15, Residential Energy Consumption and Prices Home heating. Households in Connecticut primarily use oil (50 percent) as the primary source of home heating fuel followed by natural gas (30 percent) and electric heat (15 percent). The remainder of households use another fuel source. This compares to the average U.S. household where 51 percent heat with natural gas; 9 percent, oil; 30 percent, electric heat; 7 percent, liquefied petroleum gases; and the remainder, other sources. In Connecticut, the primary source of heat varies based on whether the residence is owner or renter occupied (Table I-4). Table I-4: Primary Source of Heating for Residential Housing in CT House Heating Fuel All Housing Units Owner Occupied Renter- Occupied Oil 50.3% 59.4% 29.4% Natural gas 30.0% 26.1% 39.0% Electricity 14.9% 9.3% 27.7% Other 4.8% 5.2% 96.1% Source: 2006 U.S. Census Bureau American Community Survey 15
18 The price of home heating oil rose at a relatively stable rate through the late 90s and early part of this decade but recent increases have been dramatic. Between March 2007 and August 2008, the price of oil jumped 69 percent (Table I-5). Table I-5: Average Monthly Residential Oil Retail Price (includes taxes) 4 per gallon March April May June July August 2007 $2.44 $2.50 $2.50 $2.54 $2.61 $ $3.76 $3.97 $4.29 $4.60 $4.65 $4.13 % change 54% 59% 72% 81% 78% 61% Source: Office of Policy and Management If the prices continue in this trend, the cost of energy for households for the heating season will steeply increase from past years. The heating bill for an average household that uses oil will cost between $3,304 and $3,717, using the most recent price of oil, compared with an average annual cost of $2,035 for the heating season. 5 As shown in Table I-6, natural gas customers will also experience an increase for the heating season, with an estimated bill of $2, Table I-6: CT Average Annual Household Heating Bill Heating Fuel Source (projected) % Change Oil 7 $2,035 $3,058 $ 3,511 73% Natural Gas $1,597 $1,693 $2,393 50% Source: PRI calculations Electricity. A Connecticut household uses about 700 kwh (kilowatt hours) of electricity per month 8. There are two major electric investor-owned utilities in the state that supply electricity for residential customers Connecticut Light & Power (CL&P) and United Illuminating (UI). Table I-7 shows the most recent data on rates for residential customers. Table I-7: Standard Residential Rates for CL&P and UI Standard Residential Rate CL&P UI Monthly Service Charge $15.00 per month $14.33 per month Rate per kwh (summer) (winter) Source: CL&P and UI websites (viewed data) 4 OPM, Connecticut Heating Oil Regional Retail Price. 5 PRI calculation using OPM s average monthly retail price for the 2007 heating season (Jan-April) and EIA average of gallons of oil consumed per household. 6 PRI calculation: Average usage of 1,030 ccf using June 2008 EIA price of $23.23 per thousand ccf (most recent price available) 7 PRI calculation: average between a high and low usage customer 8 EIA ( 16
19 Using the above published rates, this means that the average CL&P customer can expect to pay approximately $140 a month, or $1,660 for the year. For the same average monthly usage of 700 kwh, the standard residential UI customer pays approximately $156 a month, or $1,856 for the year. Summary of findings. About half of Connecticut households those that heat with home heating oil will be paying approximately $3,500 in the season to heat their homes. For about half the households in Connecticut, then, heating their homes will cost approximately 2 times the cost of their electricity bills. For households earning 60 percent of the state median income of $55,323, 9 their total energy bill if they heat with oil will be approximately $5,160 representing about 10 percent of annual income. Affordability gap. As energy prices increase, the financial pressure on low-income households rises. The affordability level for home energy bills - including heating, cooling, electricity, and hot water - is considered to be 6 percent of household income. Last year, the average difference between actual and affordable energy bills for households at or below 185% 10 of the federal poverty level (FPL) reached $2,929 per household. 11 This placed Connecticut 48th among the 50 states and D.C. with one of the highest average affordability gaps. The federal low income home energy assistance program (LIHEAP) assists households with the heating and cooling portion of their energy bills. In 2002, LIHEAP covered 29.9 percent of the affordability gap. However, in 2007, LIHEAP covered only about 12.8 percent of the energy affordability gap, as Figure I-16 illustrates. 9 FY2008 Federal Poverty Guidelines for a household of four 10 For 2008, 185% of FPL is equivalent to an annual income of $39,220 for a family of four 11 Home Energy Affordability Gap: Connecticut Legislative Districts, Fisher, Sheehan, and Colton, November
20 Figure I-16: Portion of Heating/Cooling Affordability Gap Covered by LIHEAP 35.0% 30.0% 25.0% 29.9% 32.6% 31.1% 25.7% 20.0% 20.2% 15.0% 12.8% 10.0% 5.0% 0.0% Source: "On the Brink," Fisher, Sheehan & Colton Table I-8 illustrates the impact the home energy burden the gap between affordability and income-- has on low-income households by income level. Additionally the table illustrates how many households are affected by the gap in coverage for home heating and cooling needs. Table I-8: Connecticut Home Energy Burden, 2007 Poverty Level Home Energy Burden No. of Households Annual Income for Household of Four Below 50% 100% 50,164 <$10, % 40% 24,418 Up to $15, % 29% 27,954 Up to $15, % 22% 32,976 Up to $26, % 18% 37,286 Up to $31, % 15% 56,028 Up to $39,220 Source: On the Brink: 2007, Fisher, Sheehan & Colton. 18

21 Section II Benefits of Energy Efficiency Programs While energy efficiency practices have been around for quite some time, only recently have they been recognized as the most economical and cleanest way to address energy needs. As shown in the previous section, nationwide energy consumption, as measured per dollar of economic output or gross domestic product, has been reduced to half of what it was in In other words, each unit of energy consumed today provides substantially more energy services than the same unit did in While it is difficult to state precisely how much of that is due to energy efficiency, a recent study by the American Council for an Energy Efficient Economy (ACEEE) indicates that about 75 percent is due to more efficient energy measures and use and 25 percent is due to increased energy supply. The ACEEE, a well-respected broad-based research and policy organization in the area of energy efficiency, analyzed national energy consumption data and forecasts and arrived at the finding illustrated in Figure II-1 below. The graph shows increasing energy demands have been met more with energy efficiency measures than with new generation or supply. The graph also shows that the reliance on efficiency to meet energy needs is decidedly growing. Unlike new power supply sources, energy efficiency is not as visible, and thus has not received the attention, credit, or investment it deserves as the best way to meet future energy needs while reducing environmental impacts. However, there appears to be a recognizable societal shift by policymakers, business leaders, and ordinary consumers in attitudes -- that appears likely to accelerate the influence energy efficiency and conservation has in transforming lifestyles and the economy. 19

22 Several major influences are cited as contributing to this sea change in attitude: rising and more volatile energy prices; issues around delivering capacity for conventional energy supplies (e.g., transmission lines); increased urgency in responding to climate change concerns; growing consumer and investor concerns about energy industry responsibility; and rapid pace of technological advances. While there has been no adoption of a broad national policy to reduce energy consumption or promote energy efficiency requirements, 19 states, including Connecticut, have begun to impose energy efficiency resource standards (EERS) including renewable standards as state policy. The map below in Figure II-2 illustrates the states that have adopted, or are pending adoption of efficiency energy resource standards as of May While Connecticut is considered to have an energy efficiency standard, that goal really revolves around its renewable portfolio standard (RPS) more than a mandated reduction in overall energy use resulting from energy efficiency, as some other states have. The RPS requirements set percentage amounts of what electricity need to be supplied (or purchased) through alternative sources rather than through traditional sources. As a way for utilities to meet the state s RPS requirements, Connecticut uses it energy portfolio, which include energy 20
23 efficiency programs. Beginning in 2006, Connecticut has set an ambitious phased-in target of meeting 10 percent of its electricity generation needs by 2010 through Class I or II renewable resources, with at least 7 percent coming from Class I. Class I includes solar, wind, landfill gas, fuel cells, wave, or tidal power, while Class II resources include generation from facilities like trash-to-energy, biomass, or certain hydroelectric facilities. Starting in 2007, the state s electric utilities are additionally required to procure at least 1 percent of sales increasing to 4 percent in 2010 from Class III resources, which include combined heat and power systems installed after January 1, 2006; waste heat recovery systems installed after January 1, 2007; and energy efficiency and conservation programs begun after January 1, Regardless of the standard established, the adoption of such goals sets the stage for a state s support of policies and programs that make the mandated standard achievable. Almost all states considered leaders in implementing energy efficiency programs have set fairly ambitious energy efficiency and/or renewable energy standards. Indeed, it is not a coincidence that states that receive high grades on the ACEEE energy efficient scorecard also have standards for efficiency or renewable energy use in place. The types of programs aimed at promoting such policies are discussed in this section. Types of Programs Typically, the way to achieve a policy goal is either to mandate that certain measures take place or to offer incentives so that residents and businesses will adopt them by choice. In many cases, a state may choose to use both methods. Examples of mandated programs aimed at energy conservation and efficiency include: reduction of greenhouse gases through cap and trade agreements; reduction in use of energy (typically some percentage by a future date) through efficiency programs; and use of Leadership in Energy and Environmental Design (LEED) standards for all new building construction. 12 In addition, or alternatively, promoting energy efficiency as a policy goal can be achieved through offering incentives. Most often these are financial incentives, from tax credits or exemptions, to rebates, and to grants and loans. Federal incentives. The federal government offers several incentives, including: two programs aimed at individual taxpayers who install alternative energy measures such as solar heating or purchase items (e.g., insulation or windows) to make their homes more energy efficient; 12 LEED standards are a suite of measures developed by the U.S. Green Building Code Committee that incorporate environmentally sustainable goals for a building. 21
24 exemption from both corporate and personal income tax of any utility-granted subsidies issued to businesses or individuals for installing efficient or renewable energy measures, and a tax credit for home builders who build energy efficient homes; grants and loan programs, including a program known as energy efficient mortgages where loans by private lenders to individual homeowners of up to $8,000 can be added onto their mortgages and are guaranteed by the Federal Housing Administration. Another program offers loans and grants to local and state governments and commercial establishments for implementing energy efficiency measures or installing renewable energy technologies; and federal block grants to states to provide weatherization services to low-income persons who qualify. Federal production incentives are also available to state or local governments or non-profits to produce and sell electricity generated through renewable sources. Some of the federal incentive programs expired at the end of 2007 while others are due to expire at the end of 2008, unless reauthorized by Congress. State Initiatives Absent a national energy efficiency policy or standard, many states have exercised their authority to establish a variety of measures aimed at encouraging energy efficiency. The National Action Plan for Energy Efficiency issued in July 2006 suggests the following multipronged approach for states to use in developing meaningful energy efficiency structures. According to the national plan, each major component of the proposed energy efficiency infrastructure illustrated in Figure II-3 is important in ensuring good results, but requires many steps to implement. Often, there are obstacles and barriers to implementation, many times tied to financial constraints. 22
25 Figure II-3. Elements of Energy Efficiency Policy and Program Design Policy Structure Utility Resource Planning Program Implementation Develop Utility Incentives Develop Rate Designs to Encourage Energy Efficiency Make Energy Efficiency part of Resource Mix Develop Energy Efficiency Programs Design and Roll-out of specific Programs Management and Evaluation Source: National Action Plan for Energy Efficiency, July 2006 Connecticut Connecticut has made strides to put into practice many of the elements illustrated. Some of the components were put in place as the result of electric restructuring in 1998 and thus have been part of the energy efficiency design for some time. Others have been required only since 2007, when P.A established a whole host of energy efficiency measures, some of which have not yet been implemented. (See Appendix A for a status of all P.A requirements). In addition to the RPS mandate discussed earlier, the legislature has also mandated that Connecticut, through the Department of Environmental Protection participate in a regional cap and trade agreement to reduce the state s greenhouse gases. Under the program, electric power providers who cut their emissions by more than the targeted amount can sell their excess credits to non-compliant plants through an auction. Funds raised through the auction can be used to strengthen energy conservation and efficiency programs. Regulations for Connecticut s participation in the program were approved in July, and the first auction is scheduled for September 25, 2008, so at this point it is difficult to predict how much funding the trades will provide. Rate design and structure. Because Connecticut consumers have the second-highest electric rates per kwh in the nation, there is already a financial incentive to use less electricity. But there are many ways that rates can be structured to encourage energy efficiency, at either the utility or consumer level. For example, consumers can be charged a different rate depending on how much they use, so that if they consume beyond a certain number of kwh per month, the rate goes up. Another way that rates can be structured is to charge a lower rate when customers use electricity during periods of low demand, also known as time-of-use rates. In the past, these rates were optional for customers, and peak rates were charged from 7 a.m. to 11 p.m. weekdays. Beginning in 2008 and 2009, the peak rate hours are now charged from 12 noon to 8 p.m., and 23
26 mandatory time-of-use rates are being phased in for customers of both utilities according to a schedule set by DPUC, with the largest-usage customers being mandated first. CL&P s residential customers were slated to begin mandatory time-of-use rates in 2009, but because of the costs of changing the metering system, DPUC has issued a delay and ordered CL&P to first conduct a pilot to determine which types of meters should be used. Surcharge. While technically not part of the ratemaking structure, surcharges on customer electric bills is the most common way of funding energy efficiency programs. Typically, the surcharges expressed as a mill per kwh of usage. Twenty states and D.C. are using this method with varying surcharge levels. Table II-1 shows the states that have implemented this type of surcharge and what that mill/kwh is. Since electric restructuring in 1998, Connecticut has statutorily required a surcharge of 3 mills per kilowatt hour for energy efficiency programs and another 1 mill per kwh for renewable energy projects. For a residential electric customer using 700 kwh a month, 3 mills equates to about $2.10, and the 1 mill equates to about $.70. Table II-1. State Electric Surcharges for Energy Efficiency and Renewable Energy Programs State Energy Efficiency (EE) surcharge Mill/kWh Arizona California Connecticut Delaware D.C Illinois Maine Renewable energy surcharge Mill/kWh Maryland 1 (per settlement w/2 largest utilities) Massachusetts Michigan 0.07 Included in EE Montana Nevada New Hampshire New Jersey New Mexico New York 0.83 (& $100 million supported by unregulated utilities) 0.25 (in research and development) Ohio Oregon Pennsylvania 0.04 (used for research and development) 0.05 Rhode Island 2.30 (in EE) Vermont 2.9 Source of Data: American Council for an Energy-Efficient Economy, Summary of Public Benefit Programs, 2007 In Connecticut, the 3 mill energy efficiency surcharge annually raises approximately $90 million and the 1 mill renewable energy surcharge accounts for another $30 million annually. Since 2003, however, only about two-thirds of those funds have been going to support the energy efficiency and clean energy funds; the other one-third has been going to pay for bonds issued 24
27 when the state was in a fiscal crisis in (Restoration to full funding for both funds was required in 2007 legislation, which will be discussed in Section III). In addition to electric rate surcharges that go directly to fund energy efficiency programs, other rate structure mechanisms can offer more direct incentives for reducing energy use and implementing efficiency measures -- from outright rebates based on a percentage reduction to increasing rates during peak demand hours (or conversely lowering them for usage during times of low demand). In 2007, Connecticut s electric utilities implemented a statutorily required direct rebate program for residential customers who demonstrated lower usage during the summer of 2007 compared to the same months in About $24 million was returned to about 371,000 customers in the form of rebates on their bills. However, measuring how much reduction is due to actual conservation and efficiency, or how much is due to cooler weather, for example, is always difficult. The Department of Public Utility Control issued a report on the program citing this issue as well as the costs and recommended that better methods of evaluating impact be in place before implementing another such rebate program. Planning The second action area outlined in the national plan (Figure III-3 above) is that a state should engage in planning efforts including resource planning. P.A required that the utilities and the Connecticut Energy Advisory Board develop an integrated resources plan (IRP) for the state. Also known as the procurement plan, it is to include energy efficiency as part of how energy will be procured. The plan was submitted to DPUC in September 2008 for its approval. The plan reinforces the requirement that electric companies, by 2010, procure at least 4 percent of their generation from Class III resources, which includes energy efficiency programs. Energy efficiency measures are also now being recognized and valued as part of meeting the future electric needs of the New England region. The independent system operator (ISO), which controls the electric supply to meet demand for the region (thus preventing blackouts), also plans for the future capacity requirements in New England. In February 2008, ISO-New England began paying electric utilities for demand side resources, including energy efficiency measures, just as suppliers of electricity are paid. This new source of revenue, resulting from the first ISO-New England forward capacity market auction, will support the expansion of energy efficiency programs in New England. In addition to the integrated resource plan discussed above, Connecticut has a number of plans around energy and energy efficiency, including: the Conservation and Load Management Fund (or CEEF) developed by the utilities and the Energy Conservation Management Board; and the Comprehensive Clean Energy Fund Plan. All of these plans, along with accompanying budgets, must be submitted and approved by the Department of Public Utility Control, Connecticut s utility regulatory agency. Connecticut has a number of other plans that impact energy efficiency, including the Climate Change Action Plan and the Clean Energy Vision Plan, which do not require DPUC approval, but which do establish energy goals for the state. 25
28 Program Implementation The literature on energy efficiency finds one of the clearest benefits of implementing efficiency and conservation programs is that they cost less than increasing the supply. The cost of increasing electric supply by building new generation plants or adding transmission lines is generally double the cost of efficiency programs. The benefits are even more pronounced in regions of the country like New England where generation costs are very high. As Section III discusses, Connecticut s ratepayer-funded energy efficiency programs are calculated to result in $4 in lifetime electric savings for every $1 spent. While benefits are realized, that must be communicated to customers so they will participate. In addition to communicating benefits and demonstrating results, other major factors in program design and implementation should ensure the following: provide programs for all key customer groups; align goals with funding; make it easy for customers to participate; measure and assess programs, ensuring that new technologies are adopted; and communicate and publicize results. Types of programs offered. Every state in the country provides some financial incentives aimed at energy efficiency and/or renewable energy. 13 An incentives summary is contained below, and a full listing is in Appendix C. Twenty-one states allow credits on their personal income tax for renewable energy installation, and a fewer number (11) allow credits on personal income tax for implementing energy efficiency measures. Connecticut does neither. Twenty-three states, not including Connecticut, offer programs with credits (32 in total) from the state corporate income tax for renewable energy. Eight states issue corporate income tax credits to businesses for energy efficiency. Connecticut does not. Twenty-eight states, including Connecticut, exempt the purchase of renewable energy products from sales tax. Eleven states, including Connecticut, have sales tax exemptions on energy efficient products. Connecticut had allowed sales tax exemptions on certain ENERGY STAR household appliances, but the exemption period expired in Database of State Incentives for Renewables and Efficiency (DSIRE) maintained at North Carolina State University. Website dsireusa.org accessed August
29 Thirty-three states, including Connecticut, offer some type of property tax exemption for renewable energy system installation. Connecticut, for example, requires towns to exempt from property tax renewable energy systems using Class I resources such as solar or wind, and authorizes town to exempt combined heat and power systems. A much smaller number (four) of states have exemptions on any increased value of property due to energy efficiency measures taken. By far, the most common financial incentive offered is the use of rebates on energy efficient or renewable products. Forty-two states have programs that issue a total of about 625 different rebates (mostly by utility companies) for energy efficient products, and 38 states have more than 200 different rebates for renewable energy measures. Outright grants are also offered to a lesser extent 24 states and D.C. have grant programs to assist entities with renewable energy measures, and 20 states offer energy efficiency grants. Deferred or low-interest loans are also a financial incentive to residents and businesses. Connecticut offers both grants and loans, many through the Connecticut Energy Efficiency Fund. Administration and Oversight There are a number of different models for administering energy efficiency programs. As will be discussed in the final three chapters, Connecticut implements many different programs with a variety of funding mechanisms, including ratepayer surcharges, state bonds, the General Fund, and federal block grants. Program implementation is also varied including those administered the utilities, state agencies, state quasi publics, and non-profit organizations. It is not clear that there is an ideal structure for administration of energy efficiency programs, especially one that is designed to ensure coordination, promote client participation among groups and energy users, avoid duplication, and operate cost effectively. Connecticut s administration of its energy efficiency programs, including those supported with ratepayer surcharges is discussed in the last three chapters of this report and program administration will be explored more thoroughly for the final report. The energy efficiency and low-income assistance programs that are supported by ratepayers are subject to DPUC oversight, and include: Connecticut Energy Efficiency Fund plan and budgets; Connecticut Clean Energy Fund plan and budget; and Utility-sponsored plans and budgets that support low-income customers such as matching payment and forgiveness programs. As part of the approval process, the plans and budgets are subject to public hearings and public comment period. Frequently, the Office of Consumer Counsel, the state advocate office for ratepayers, will provide official input. 27
30 For those programs that are not ratepayer supported, the oversight can be submission of a plan to the legislature, as is the case with the Connecticut Energy Assistance Plan, or to the federal funding agency, as with the federal Department of Energy weatherization assistance program. Oversight mechanisms related to the specific programs are discussed in the final three chapters of the report. Measurement, Verification, and Evaluation A vital step in program development and implementation is ensuring that energy efficiency programs, including the financial investments to support them, deliver results. This means the program must collect, track, and report on data including client participation, costs, and benefits. However, equally important is ensuring that the information is monitored and evaluated periodically by objective third parties, and that the results are used to improve the quality of the programs. The measurement, verification, and evaluation of the utility-sponsored programs is somewhat formalized, and there is money in the CEEF and the Clean Energy Fund budgets for conducting evaluations. There is no requirement as to how often the individual CEEF programs be evaluated, although the Clean Energy Fund programs are statutorily required to be evaluated every five years. Typically, national consultants specializing in energy efficiency are hired to evaluate the ratepayer-funded programs. There are a variety of tests and evaluation protocols and measures that are used depending on the program and the type of energy being assessed. The measurement and evaluation aspects of the electric efficiency programs will become even more important. As the auction payments for those begin in 2010, ISO-New England will require evaluations with demonstrated results will be required in order for the program sponsors to be paid. Evaluations of programs that do not receive ratepayer funds are less formal, and often years go by without an assessment of whether goals are met, how well a program is working, or even how many residents are being served. These measurement and evaluation aspects of individual energy efficiency programs are also discussed in the last three sections. 28
31 Section III Connecticut s Energy Efficiency Programs As Figure III-1 illustrates, Connecticut has a myriad of programs aimed at energy efficiency and conservation as well as a number designed to help lower-income residents pay energy costs. The last three sections of this report describe the many programs and are organized mainly around the funding that supports the programs. Section III contains those that are funded by ratepayers, Section IV provides information on programs funded with state funds, and Section V discusses programs aimed to assist low-income residents pay their energy bills or to help weatherize their homes to make them more energy efficient. Appendix D contains a full listing of all the program websites by category and a brief highlight of the information to be found at the website. Ratepayer-funded programs. Many of the energy efficiency and conservation programs are funded by electric utility customers, and more recently, gas company customers. The ratepayer-funded programs that are discussed in Section III are the: Connecticut Energy Efficiency Fund (CEEF); Energy Independence Act (EIA) programs; Municipal utility sponsored programs administered through the Connecticut Municipal Energy Efficiency Cooperative (CMEEC); Electric Efficiency Partners (EEP) program; and Clean Energy Fund (CCEF). This section describes these major funds that are supported with ratepayer monies. In most cases this is done through an extra surcharge on all customers bills, while in others financial support for programs is built into the overall rate. The funding mechanisms are explained below, as well as program administration, what oversight mechanisms exist, descriptions of the specific programs within each fund and what energy savings and benefits have been realized, if available. State-funded programs. Section IV discusses similar aspects of the state-funded energy efficiency programs which include the: Energy Conservation Loan Program (ECL); Furnace rebate program within the Office of Policy and Management; Fuel oil conservation program; and Efforts in state government facilities. Low-income energy assistance programs. Section V provides a description of those programs assisting low-income households. Funding for these programs comes from federal and state government, charitable donations, as well as utility ratepayers. These programs include: 29
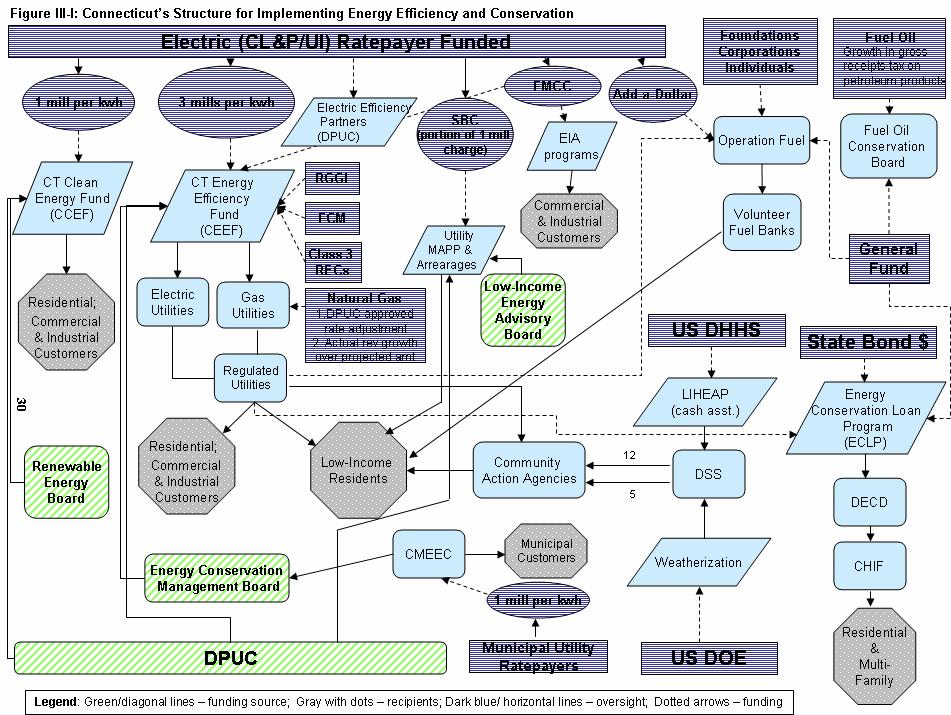
32
33 Connecticut Energy Assistance Program (CEAP); Operation Fuel; Utility-sponsored matching payments and debt forgiveness; and Weatherization programs administered both by the state and by the utility companies. Connecticut Energy Efficiency Fund The Connecticut Energy Efficiency Fund (CEEF) was created by legislation in 1998 as a result of electric restructuring. When the fund first started it applied only to the investor-owned electric utilities and only more recently as a result of 2005 legislation were gas utilities added. For calendar year 2007, the fund spent close to $100 million. The fund is primarily financed through a charge on United Illuminating (UI) and Connecticut Light and Power (CL&P) customer bills. The fund supports the development and administration of cost-effective energy efficiency and load management programs for residential, commercial and industrial customers. The programs are administered by the electric distribution companies, CL&P and UI, and thus only serve customers in their territories. The CEEF s primary objectives are: (1) advancing efficient use of energy; (2) reducing air pollution and other negative environmental impacts; (3) promoting economic development; and (4) providing energy security and affordability. Figure III-2 shows the CEEF structure including the funding mechanisms, utilities involved, customers served, and administrative and regulatory oversight in existence. 31

34 Funding. The primary funding mechanism is through a statutorily established 3 mills per kwh surcharge ($0.003 cents) on each electric ratepayer s bill. This means the typical residential customer is charged $25.20 for the year. The total amount realized from the surcharge for the fund in 2007 was $66 million. Lesser amounts are derived from the customer adjustment mechanisms (CAMs) on gas utility customer bills and proceeds from: the ISO-NE Forward Capacity Market (FCM), Class 3 Renewable Credits (RECs) 14, and the Federally Mandated Congestion Charge (FMCC) Renewable Energy Credit - A certificate that is issued for each Megawatt-hour (MWh) of energy generated from certain clean or renewable resources or for each MWh of energy conserved through the installation of energy 32
35 The second largest source of funding for the CEEF programs is derived from the FMCC. Additional money, when ratepayer surcharge funding has not met demand for efficiency projects, has been authorized by DPUC to be raised through this charge that in 2007 amounted to $12 million. In addition, the utility companies in 2005 were authorized to raise money for projects through the charge that ultimately would lower charges incurred because of congestion. As a result of the 2007 energy legislation, a portion of the financial value derived from the Class III Renewable Energy Credits (RECs) is directed to the CEEF. In 2007, the fund collected $3.9 million from the RECs. Another source of funding for the CEEF includes the Forward Capacity Market, which generated $2.6 million in Beginning in 2006 the Federal Energy Regulatory Commission approved a settlement that established a redesigned wholesale electric capacity market in New England. The new market was structured to encourage the maintenance of current power plants and construction of new generation facilities. ISO-New England, the operator of the region s electric market, projects energy needs for the region ahead three years. An auction is conducted to purchase the power resources necessary to satisfy the region s future needs. The auction includes both electric supply from power plants and for the first time in February 2008 includes as eligible capacity, decreased electricity use through demand-side management resources. Having the auction cover a three-year period allows new projects still under development to compete in the market. The first auction was held in February 2008, and the Connecticut Energy Efficiency Fund will receive revenues from the auction beginning in June The energy efficiency measures purchased through the auction will have to go through a measurement and verification process to verify that energy efficiency measures promoted by the programs were installed, are still in place, and are functioning as intended. Program administration. The programs funded through the Connecticut Energy Efficiency Fund are administered by the electric distribution companies (CL&P and UI) in conjunction with the gas utilities (Connecticut Natural Gas, Southern Connecticut Gas, and Yankee Gas). The electric utilities receive an administration fee, known as a performance incentive, as payment for operating the programs, and also receive reimbursement for operating expenses. In 2007, the performance incentive for the two major utilities totaled $5.7 million, or about 6 percent of total expenditures. Generally, the utilities market the programs, although the Energy Management Conservation Board has begun to actively promote the Connecticut Energy Efficiency Fund as the sponsor of the programs. efficiency measures. RECs can be sold or traded to fulfill the Renewable Portfolio Standard and are monitored by ISO-NE. 15 Federally Mandated Congestion Charges The Federal Regulatory Energy Commission allowed generators to incorporate into their rates additional charges for areas where lack of transmission caused congestion problems; issue was especially acute in Southwest region of the state. The DPUC authorizes FMCC additional funds from ratepayers to establish programs that will help alleviate those congestion problems. 33
36 The two electric utilities accept applications from residents and businesses in their respective service areas, determine program eligibility, and pay for the financial incentives or specific efficiency measures, depending on the program. For most of the programs, the utilities also select the vendors that will do the work required in the business or home. Both utilities indicated to committee staff that they use a competitive process based on response to qualifications to select vendors. Connecticut Light and Power stated it received 18 proposals and chose 12 different vendors for its small business program, while United Illuminating contracts with 14 vendors in its small business programs. CL&P has selected five vendors to conduct its Home Energy Solutions (HES) program, while UI has three vendors for that program. There are a couple of exceptions where the utilities do not select the vendors. For the low-income weatherization programs the utilities use the same community action agencies that conduct the work for the publicly funded weatherization program, although UI also has one private vendor. In the large commercial and industrial programs, the establishments select their own contractors, and submit the work proposal to the utility. The utility reviews it, and if it agrees with the proposal, will send out a letter of award, although the two utilities differ on how and when this is done. Administrative oversight. The Energy Conservation Management Board (ECMB), a statutorily established 14-member board, advises and assists with the implementation and administration of the CEEF programs. The board has three statutory tasks: review and approve plans including reviewing the budgets and budget allocations, program proposals, and new initiatives; monitor the performance of programs, evaluate program implementation, and provide feedback to the utilities on a regular basis; and examine and make recommendations to the DPUC and/or General Assembly on key policy matters. The board has six consultants that it has contracted with to assist in these efforts. Utility members of the board may only vote on matters relating to conservation measures pertaining to their utility. The board advises on the budget for the fund and its programs but does not set the budget for the CEEF. In 2007, expenses for the ECMB and its consultants, which came out of the CEEF, totaled $475,542 or about 0.5 percent of overall spending. Regulatory oversight. The Department of Public Utility Control (DPUC), the state s regulatory body for investor-owned utilities, has regulatory and budget oversight over the Connecticut Energy Efficiency Fund since funding is derived from the rates set by the department. Each year the utilities and the ECMB develop a plan for the Connecticut Energy Efficiency Fund (also known as the Conservation and Load Management Plan) for submission to DPUC. Typically the plan is submitted to the department in October and is based on the upcoming calendar year. The DPUC treats the plan as a regulatory proceeding, requiring a 34
37 docket number and accompanying filings, a hearing, and a resulting decision on the plan, its programs, and its funding levels. The DPUC issued its most recent final decision regarding the 2008 Plan in June The decision set the funding level of the CEEF at $136.7 million for the 2008 program year (including funding from all sources), $15.4 million above the proposed budget filed October 1, 2007 since demand for energy efficiency programs was higher than planned. Energy efficiency programs. CEEF programs are designed to meet the needs of all residential customers including low-income residents, as well as commercial and industrial customers. In addition, the fund supports educational programs administered by the utilities and contracts with the Institute for Sustainable Energy to assist with educational outreach. Figure III- 3 displays the programs offered in each sector. The 2005 Energy Independence Act (EIA) required the implementation of programs aimed at reducing peak demand. These programs are supported with ratepayer funds, administered by the utilities, and included in CEEF plans and documents submitted to DPUC. Therefore, these programs are included as part of CEEF programming and will be discussed later in this section. Residential programs. As shown in Figure III-3, there are six CEEF funded programs established for all residential customers regardless of income level. There is also a 35
38 weatherization program, targeted for low-income households (discussed in Section V). The residential and low-income programs received $26 million in Table III-1 lists the largest programs available for residential customers, with activity levels from 2004 through the second quarter of this calendar year (Q2 2008). Table III-1: CEEF Major Residential Programs Program Description Customers served (2004-Q2 2008) Retail Products Home Energy Solutions New Construction Weatherization In 2008 the utilities pursued negotiated cooperative promotions (NCPs) where payment of incentives is tied to store-level sales data. Previously, rebates and coupons were offered directly to customers but were abandoned upon determination they were not cost-effective. Provides comprehensive in-home energy services including both an audit and direct installation of many efficiency measures. Encourage builders and consumers to move beyond ENERGY STAR specifications to high-performing homes that qualify for federal tax credits. Where this is not possible, work to upgrade the energy elements of the home beyond standard code levels. Spectrum of services from neighborhood canvass to comprehensive weatherization. Further discussion in Section V. Approx million bulbs, fixtures, and appliances Households 35,284 (electric) 6,661 (gas)* Households - 5,934 Households 69,987 (electric) 5,867 (gas)* TOTAL Spent on Residential Programs (2004-Q2 2008) 16 $105,230,079 *Gas households also included in the electric household count Source: Information requested from CL&P and UI; C&LM 2008 Plan Commercial and industrial programs. Table III-2 describes five CEEF funded programs established for commercial and industrial customers. The commercial and industrial programs in 2007 received $60.2 million. 16 Total dollars expended includes residential programs not listed in the table such as the Room Air Conditioner Turn-in Program 36
39 Table III-2: CEEF Major Commercial and Industrial (C&I) Programs Program Description Incentive C&I Customers Served 17 (2004- Q2 2008) Energy Conscious Blueprint New C&I construction, planned remodeling, major renovations, and new equipment Up to 100% of incremental cost 3,603 Energy Opportunities All C&I customers Up to 60% of installed cost (dependent upon energy-efficient measure) and possible two-year payback buy down Accelerated Chiller Retirement (Only applies to electric chillers not gas engine chillers) Small Business Energy Advantage Operation & Maintenance (O&M) Services C&I customers with water-cooled chiller 25 years or older. Unit must operate during ISO summer peak hours. All C&I customers, including municipalities and state buildings, with up to 200 kw (CL&P) or 150 kw (UI) of average peak demand All C&I customers Prescriptive rebates from $15-$55 per fixture or 100% of the incremental cost Incentives are the lesser amount of 75% of the total installed cost, 100% of the Utility Measure Cap, or $600/ton installed cost. Interest free financing with prescriptive incentives for : Lighting up to 50% installed cost HVAC up to 50% of installed cost Refrigeration up to 50% of installed cost Incentives up to 50% of installed cost (Southwest CT customers eligible for incentives up to 100% of installed cost). TOTAL Spent on Commercial and Industrial Programs (2004-Q2 2008) $205,712,206 Source: Information requested from CL&P and UI; C&LM 2008 Plan 2, , Educational programs. Each utility operates specific educational programs for customers in their area. UI operates the Smart Living Center in Orange intended to educate residents about the importance of energy efficiency through exhibits. CL&P has a Museum Partnership program, which established a permanent exhibit at the Stepping Stones Museum in Norwalk and has also partnered with the Clean Energy Fund to create a joint exhibit at the Connecticut Science Center. One joint program, eesmarts, provides science education curriculum related to energy efficiency for grades K-8. Institute for Sustainable Energy (ISE). The institute was established in 2001 at Eastern Connecticut State University to focus on matters related to energy education, energy policy, energy conservation and load management, energy efficiency, renewable energy and the dissemination of information to promote a more sustainable energy future. Funding is primarily provided by the Connecticut Energy Efficiency Fund. The institute also receives funding from the Clean Energy Fund, Tremaine Foundation, and the Office of Policy and Management. The total budget for 2008 is $622,000; approximately $400,000 is provided by the Connecticut Energy Efficiency Fund. For the 2009 program year, the institute s total budget is $680,000 of which CEEF will provide $500, Represents the number of customers served; one customer can have multiple efficiency measures installed 37
40 The institute sponsors numerous educational programs including: 1. Building Inspector Code Training which increases awareness, knowledge, and enforcement of the energy-related components of the state energy code for residential and commercial inspectors; 2. K-12 School Energy Management Certification Course which focuses on identifying cost effective practices and alternatives to school maintenance personnel s current operating procedures as well as on purchasing efficient equipment; and 3. Energy Education Curriculum Development Program which developed and launched a high school education curriculum accessible through The program also works with the Connecticut technical high schools to integrate energy efficiency and renewable energy topics into the curriculum to help prepare students to enter Green Collar Jobs in Connecticut. In addition, the institute administers a new, more consolidated website aimed at coordinating information and serving as a clearinghouse for web-based information. The institute also staffs a WISE-USE phone line during regular business hours. The phone line provides energy efficiency information to callers and also tracks call volume, sources of calls, and topics of interest. Energy Independence Act (EIA). While not technically a program, the act (P.A ) established several initiatives and programs to reduce electric power supply costs. The joint programs offered by the utilities include: ISO-NE Load Response Programs and a General Awareness Campaign. Two programs are only offered for UI customers: a Commercial Retrofit Program and a Residential HVAC Program. One program, the Gas Efficiency Pilot Program, was only offered by CL&P and is currently not offered. These programs, aimed at commercial and industrial customers, encourage onsite generation and conservation through load management as a way to reduce generation-related congestion charges. The charge on electric ratepayer bills for these programs in 2006 and 2007 totaled $51.2 million. CEEF FUNDING LEVEL ANALYSIS This funding analysis covers both CEEF and EIA programmatic spending. Monies raised for CEEF specific programming totaled $100 million in 2007 and monies raised for EIA programs totaled $28.4 million in History of funding. CEEF funding and budgeting was seriously impacted in 2003, when the legislature used the fund to help alleviate the state s fiscal crisis. Beginning in 2004 and 2005, the collections decreased due to the transfer of money from the CEEF to the General Fund and to pay for deficit reduction bonds. Ratepayers are still charged the 3 mills per kwh, but each year a portion of the collections goes towards repayment of the deficit reduction bonds. Since 2003, $85 million has gone to pay off the bonds and $31 million has been transferred to the state General Fund. However, in P.A , the legislature appropriated from the General Fund the sum of $95 million dollars for the purpose of defeasing the state deficit reduction bonds maturing after December 30,
41 Sources. As mentioned previously, the public benefits surcharge (3 mills per kwh) is not the only source of CEEF funding, although it is the largest with $65.9 million contributed in Figure III-4 shows the other sources of funding that constitute the CEEF, including funding raised specifically for Energy Independence Act programs. Figure III-4: 2007 Contributions to CEEF & EIA ($ in millions) $0.4 $0.1 $1.5 3 mill charge $28.4 Forward Capacity Market (FCM) Class 3 Renewables FMCC FMCC for EIA $9.6 FCM EIA $3.9 $2.5 $65.9 CAM (gas) Gas ratepayers Source: Information supplied to PRI by utilities Spending on CEEF and EIA programs. Spending on energy efficiency programs in 2007 was $128.2 million. These expenditures included programming for residential, commercial, and industrial customers as well as projects required under the EIA. Figure III-5 shows how spending is allocated for the various programs as well as for administration and performance management fee spending. Figure III-5: 2007 CEEF & EIA Spending EIA 22% Residential & Low -income 20% Admin/Planning/ Perf Mngmt 8% Other 1% Education 1% Source: Information supplied to PRI by the utilities C&I 48% 39
42 Between 2004 and 2007, the Connecticut Energy Efficiency Fund has spent a total of $319 million on energy efficiency and conservation programs as well as $51 million for EIA programs. In the same time period, $343.6 million has been collected as shown in Figure III-6. Figure III-6: Connecticut Energy Efficiency Fund $140 $128 Millions $120 $100 $80 $60 $40 $70 $67 $64 $80 $97 $95 $112 $20 $ Collections Spendng (CEEF & EIA) Source: Information provided to PRI by the utilties Between 2004 and 2007, the CEEF spent $89.3 million on residential and low-income programs. During the same period, $173.9 million was spent on commercial and industrial efficiency programs. As shown in Figure III-7, residential and low-income spending has steadily increased over time, whereas C&I program spending has fluctuated with a 70 percent increase between 2006 and Figure III-7: CEEF Trend in Spending by Sector ( ) $70,000,000 $60,000,000 $173.9 MM $50,000,000 $40,000,000 $89.3 MM $30,000,000 $20,000,000 $10,000,000 $5.3 MM $9.9 MM $40.8 MM $- Res. & Lowincome C&I Education Other Admin/Plan/Perf Mngmt Source: Data provided to PRI by Investor Ow ned Utilties 40
43 Parity. The Energy Conservation Management Board has an objective of parity in treatment among the ratepayers. Commercial and industrial, residential non low-income, and residential low-income customers contribute approximately 58 percent, 31 percent, and 11 percent respectively. Thus spending that benefits a ratepayer group in a given year should be proportional to their contribution made through the 3 mill charge. However, as Table III-3 demonstrates, when actual spending levels are analyzed it does not appear this goal has been met. Only CEEF funding and programs were considered and not EIA since those programs are specifically targeted to reducing peak demand and load among commercial and industrial users. The percentage in 2007 sums to more than 100 percent since spending was greater than collections by the 3 mill charge. This is largely due to an increase of $25 million over the prior year in spending on commercial and industrial projects. Table III-3: % of Ratepayer collected funds spent on efficiency programs Residential including low-income 26% 34% 33% 34% Commercial & Industrial 51% 66% 50% 78% Source: PRI analysis Energy Independence Act. Approximately 20 percent of collections raised through ratepayers is targeted toward programs established by the 2005 Energy Independence Act. As noted previously, these programs are targeted primarily to large commercial and industrial customers to achieve a decrease in peak load. Table III-4 shows the breakout of spending for the different programs for the two years they have been in operation. Table III-4: Energy Independence Act Total Program Expenditures (Actual $) Program Name Total ISO-NE Load Response $ 18,925,251 $ 25,975,715 $ 44,900,966 Residential HVAC 1,260,482 42,473 1,302,955 Energy Opportunities 2,142,084 2,024,202 4,166,286 General Awareness 298, , ,036 Gas Pilot Program 121,094 45, ,482 Direct Load Control - 43,720 43,720 Total $ 22,747,047 $ 28,428,398 $ 51,175,445 Source: CL&P and UI CEEF ACTIVITY LEVEL ANALYSIS Although the intent of the Connecticut Energy Efficiency Fund is to focus on both electric and gas efficiency, the vast majority of program participants have been electric customers. This is due to the CEEF s focus on programs and technologies targeted to electric customers since the bulk of funding comes from electric customers. The gas utility customers began contributing to the CEEF only in 2006, although gas utilities had operated their own programs on a much smaller scale previously. There has been an effort to create equity by having the electric and gas utilities pay for the program measures that relate to their respective energy savings. The majority of the savings to date have come from electricity. 41
44 Residential customers served. Between 2004 and the second quarter of 2008, a total of 111,205 residential households 18 have been served by three of the residential programs: Residential New Construction, Home Energy Solutions, 19 and Low-Income weatherization. (See Appendix E for trend information on participant levels). Commercial & industrial customers served. Between 2004 and the second quarter of 2008, 15,003 commercial and industrial customers have been served by all the programs offered by the CEEF. These figures represent the number of customers and not the number of projects, as one customer might utilize multiple efficiency projects at their facility. (See Appendix E for trend information on participant levels). CEEF SAVINGS AND BENEFIT ANALYSIS The Connecticut Energy Efficiency fund is required to calculate energy savings and benefits as a result of the efficiency measures implemented as a way to show the costeffectiveness of the programs. Calculated savings. Each year the electric distribution companies (CL&P and UI) must submit program savings documentation (PSD) to the DPUC. The documentation serves as the base of the demand reduction calculations that are submitted to ISO-NE for the forward capacity market and also form the basis of estimated savings in the CEEF plan approved by DPUC. The savings calculations in the PSD manual represent typical measures that, if taken, would produce the savings estimate. According to the PSD manual, third party engineering consultants are contracted to run simulations necessary for complicated detailed projects and review all calculations for reasonableness. Any projected electricity savings in the tables below are those calculated by the utilities for the programs based on the PSD manual. Table III-5 shows the calculated savings to the grid from residential programs and Table III-6 shows the calculated savings from programs implemented for commercial and industrial customers. Table III-7 shows the gas efficiency savings for the residential programs (savings for commercial and industrial programs only realized in 2008). For an explanation of the various energy measurements, such as megawatts and kilowatt hours, see Section I, Table I-1. In order to maintain a reliable electricity system, Connecticut requires approximately 7,000 megawatts of power to meet summer peak demand for one year. As can be seen in the tables below, since 2004, the residential, commercial, and industrial programs have saved Connecticut approximately megawatts. 18 Does not include retail products, lighting, or purchases from Smart Living Catalog 19 In 2007, the CEEF combined smaller residential programs to create one comprehensive residential program offering an energy audit and direct measure installation called Home Energy Solutions. 42
45 Table III-5: Residential Annual MW Savings Residential Total Retail Products Residential New construction Home Energy Solutions Low-Income Appliance Retirement Other programs currently not offered TOTAL Source: CL&P and UI Table III-6: Commercial & Industrial Annual MW Savings C&I - Major Programs Total Energy Conscious Blueprint Energy Opportunities Operating & Maintenance Services Small Business Advantage ISO-NE Load Response Other Programs currently not offered TOTAL Source: CL&P and UI Table III-7: Gas Efficiency Program Annual Savings (ccf) Residential Home Energy Solutions 39, ,381 Low-Income 123, ,099 TOTAL 163, ,480 Source: CNG, SNG, Yankee Gas Given the savings listed in Table III-8, efficiency measures for residential customers have saved the equivalent of the electricity needed for 10,621 to 14,266 homes in a given year (a typical household in Connecticut consumes approximately 700 kwh a month or 8400 kwh in a year). Table III-8: Residential Annual kwh Savings (000 s) Residential Retail Products 78,261 69,304 79,772 93,060 Residential New construction 932 3,589 4,487 3,182 Home Energy Solutions 1,758 2,4 34 5,779 8,931 Low-Income 12,606 13,887 14,388 14,661 Appliance Retirement 7,244 10,220 3,458 - Other programs currently not offered 4,278 6, TOTAL 105, , , ,834 Source: CL&P and UI 20 Includes projects completed for municipalities and schools 43
46 Table III-9 lists the total kwh savings from commercial and industrial programs since 2004, as well as the savings by individual programs. Table III-9: Commercial & Industrial Annual kwh Savings (000 s) C&I Major Programs Energy Conscious Blueprint 54,639 55,297 61,690 59,307 Energy Opportunities 18,591 24, , ,509 Operating & Maintenance Services 3,553 11,330 5,754 5,774 Small Business Advantage 23,668 21,018 38,322 44,978 Other programs currently not offered 6,794 11, TOTAL 186, , , ,568 Source: CL&P and UI EIA Electricity Savings. The Energy Independence Act requires DPUC to authorize near-term measures that would reduce Federally Mandated Congestion Charges. As shown in Table III-10, 226 megawatts and 367 megawatts were reduced in 2006 and 2007 respectively as a result of the implemented measures. Table III-10: EIA Electricity Savings (Annual MW Savings) Load Response Energy Opportunities 2 2 Residential HVAC Gas Pilot Program TOTAL Source: CL&P and UI A gas efficiency pilot program was an approved near-term measure supported by the EIA legislation. The pilot program funded four projects and reduced FMCC charges by providing reductions in electrical consumption and peak load through the use of efficient gas cooling technologies instead of electrical cooling equipment. Table III-11 below shows the total energy savings from the pilot program based on 225 tons of installed capacity. Over the course of the program, an additional 50 tons were installed; so the total actual energy savings would be slightly higher than what is shown in the table. Although the technology demonstrated it reduced peak demand and overall energy use, the program is no longer offered. Table III-11: Comparison of Total Energy Savings for Gas Efficiency Pilot Program under EIA Electric Unit Energy Usage Natural Gas Unit Energy Usage Electric Savings % inc/(dec) Peak Demand (kw) (96%) Electrical Usage (kwh) 53,735 3,677 50,058 (93%) Natural Gas Usage (ccf) 3, % BTU Usage 661,468, ,831, ,637,694 (35%) Source: Docket PH01 Late File No. 4 44
47 Cost Benefit Analysis. Various cost benefit tests are employed for measuring the costeffectiveness of efficiency programs. A summary of these cost-effective tests, and what they measure, is summarized in Table III-12. Table III-12: Efficiency Cost Tests Cost Test Questions Addressed Participant Cost Test -Is it worth it to the customer to install EE? Ratepayer Impact Measure -Would the project require an increase in rates to reach the same operating margin? -What happens to customers bills or rates? Utility Cost Test ( a.k.a. -Do total utility costs increase or decrease? Electric System B/C Ratio) Total Resource Cost Test (a.k.a. -Are all of the benefits greater than all of the costs (regardless of who pays Total Resource B/C Ratio) the costs and who receives the benefits)? Societal Cost Test -Are all of the benefits, including indirect benefits, greater than all of the costs (regardless of who pays the costs and who receives the benefits)? The DPUC requires the Connecticut Energy Efficiency Fund to report on the cost effectiveness of their programs ensuring programs are designed to obtain energy savings and system benefits, including mitigation of federally mandated congestion charges. Currently, the DPUC only requires plan goals to be submitted, not actual numbers from the prior year. Table III-13 shows the actual utility cost test results based on realized savings and the estimated total resource cost test. Using the cost benefit test and total resource test, the utility companies apply the calculation to the individual programs and the efficiency measures taken to arrive at the actual cost-effectiveness results. For example, for every dollar the fund spends on the retail products program, the electric system calculated lifetime savings range from $6 to $9.80. From these program results, the CEEF aggregates or levels out the savings for all fund programs. This process is the origination of the claim that overall, every $1 spent yields $4 in savings. CL&P and UI utilize different methods of accounting for program expenditures and therefore electric and total energy savings are not necessarily accounted for in the year they were realized. CL&P accounts for both the cost and savings of the efficiency measure when the project is complete. On the other hand, UI realizes the energy savings when the project is complete but realizes the cost of the project when the letter of agreement is signed. For UI, this results in costs and savings not aligning in the same accounting year for projects that cross over calendar years and can explain the significant differences in cost effectiveness results between the two companies. Although the DPUC issued a decision in 2005 (Docket ) requiring both companies to utilize a singular, consistent method, company practices did not change and the issue has been raised again by the DPUC. 45
48 Table III-13: Cost Effectiveness Tests 2007 Utility Cost Test (Actuals) Total Resource Cost Test (Estimated) 21 Residential CL&P UI Overall CL&P UI Overall Retail Products Residential New Construction Home Energy Solutions Low Income Commercial CL&P UI Overall CL&P UI Overall Energy Conscious Blueprint Energy Opportunities O&M Small Business Overall Source: PRI analysis based on data provided by UI & CL&P Connecticut Municipal Energy Efficiency Cooperative (CMEEC) The Connecticut Energy Efficiency Fund does not serve customers served by non investor-owned utilities. Instead, CMEEC a cooperative formed in 1976 by the state s publicly owned electric utilities, oversees energy efficiency programs for its customers. CMEEC is owned by the municipal utilities in the cities of Groton and Norwich, the Borough of Jewett City, and the Second (South Norwalk) and Third (East Norwalk) Taxing Districts of the City of Norwalk. CMEEC also provides all the power required by other utilities participating in CMEEC including the Town of Wallingford Department of Public Utilities, the Bozrah Light and Power Company, and the Mohegan Tribal Utility Authority. All together these utilities provide power for about 5 percent of Connecticut residents. The broad goals of CMEEC are to: develop and implement a collaborative program which balances the existing statewide efforts; create unique programs where these make the most sense; and capitalize on direct customer relationships. Figure III-8 shows the structure for implementing energy efficiency and conservation programs to municipal utility customers. 21 The utilities do not track customer costs so only estimated figures can be provided 22 Calculated average ( ) since the accounting method employed by UI does not match savings and costs in the same year 46
, discussed earlier in the CEEF description, mandated the municipal utilities charge 1 mill per kilowatt hour beginning in 2006 for energy conservation programs, and increasing to 2.")
49 Funding. The 2005 Energy Independence (P.A ), discussed earlier in the CEEF description, mandated the municipal utilities charge 1 mill per kilowatt hour beginning in 2006 for energy conservation programs, and increasing to 2.5 mills starting January The money from the surcharge goes into a special nonlapsing fund held by CMEEC, which must develop a conservation plan to include efficiency programs that are consistent with CEEF programs. The plan is submitted to the ECMB for review, although the CMEEC programs and budget are not part of the CEEF and not subject to the same level of approval by ECMB. Also, DPUC does not approve its plan and budget. Energy efficiency programs. Each municipal utility operates its own energy efficiency programs for residential, commercial, and industrial customers with CMEEC coordinating the programming. In addition, municipal customers can participate in the demand response program through ISO-NE. Figure III-9 shows the different programs offered by CMEEC. 47
50 Residential programs. CMEEC program offerings for residential customers are: incentives for new residential construction; an existing home retrofit; low-income weatherization program; and rebates for efficient lighting and appliances. Participation by each of the municipal utilities varies by program. For example, Norwich Public Utility (NPU) is the only utility participating in the new residential construction program while Groton Utilities and NPU were the only two that offered weatherization services to low-income residents in CMEEC does not offer a program similar to the CEEF Home Energy Solutions program where customers who are not low-income can receive an energy audit with direct installation of efficiency measures. Commercial and industrial programs. CMEEC is supporting two programs, Motor Up and Cool Choice, which offer financial incentives for equipment replacement for commercial customers. These programs are modeled after the programs offered under CEEF. The existing facility retrofit, a third program for commercial, industrial, and municipal sectors, offers customers technical and financial assistance to promote replacement of existing equipment with more efficient alternatives. Demand response program. In an effort to reduce summer peak electricity use, CMEEC teamed up with EnerNOC, Inc., a large demand response and energy management solutions provider, to offer participation in the ISO-New England Gap RFP program. The program resulted in 2.5 megawatts of demand response registered with ISO-New England. Energy efficiency financing. Municipal utilities have developed financing products that allow commercial and industrial customers to amortize energy efficiency project costs as a way to overcome the initial capital investment required for the projects. In 2007, ten customers took advantage of project financing. CMEEC ACTIVITY LEVEL ANALYSIS Table III-14 below provides the amounts collected by CMEEC as a result of the 2005 Energy Independence Act, as well as the programmatic spending levels. Table III-14: CMEEC Energy Efficiency Collections & Spending Collections $1,729,251 $2,173,771 Spending $1,409,690 $2,469,154 Residential $602,059 $994,880 Commercial & Industrial $807,631 $1,474,274 Source: CMEEC Table III-15 shows the 2007 participation levels for the various energy efficiency programs offered by the municipal utilities. 48
51 Table III-15: CMEEC Energy Efficiency Customers Served 2007 Residential CFLs distributed 210,000 Low Income Households 142 Existing Home Retrofit 100 Appliance rebates 850 Commercial/Industrial Commercial Equipment Replacement 11 C&I Existing Facility retrofit 67 Source: 2007 Annual CMEEC report CMEEC SAVINGS AND BENEFITS ANALYSIS Table III-16 lists the calculated savings from the energy efficiency measures implemented during the 2007 calendar year. Table III-17 demonstrates both the utility cost test and total resource cost test for residential and commercial programs. Table III-16: Municipal Electric Energy Savings (2007) Savings Measurement Sector Annual MW Annualized kwh Residential ,829,507 Commercial/Industrial ,778,731 Source: Data provided to PRI by CMEEC Table III-17: Municipal Electric Benefit Cost Ratios (2007) Sector Utility Cost Test Total Resource Cost Test Low Income Program Existing Home Retrofit Efficient Products Commercial Overall Source: CMEEC 2007 Annual Report Electric Efficiency Partners Program (EEP) The EEP program was established by section 94 of P.A The objective of the EEP program is to support enhanced demand-side management technologies 23 that conserve 23 An example of an approved technology is a gas chiller which provides area air conditioning for industrial and commercial customers. 49

52 electricity and reduce electric distribution customers electric demand in the state, specifically reducing peak demand. The EEP program is specifically established to support programs that for one reason or another would not receive funding from the CEEF. The legislation requires approved technologies to have a payback ratio of 2:1. Figure III-10 shows the current funding and administrative structure for the Electric Efficiency Partners Program. Funding. The legislation authorized spending for the EEP of up to $60 million a year collected through a charge imposed on electric ratepayers. As of August 2008, funds had not yet been collected through the rates. P.A stated that at least 75 percent of the appropriated annual ratepayer investment must be used for technologies. Additionally, an entity cannot receive funding through the EEP if the entity has received funding for the same project through the C&LM program funds. Program administration. The legislation requires that the program be administered by DPUC. The department reviews project proposals, determines eligible technology measures and incentives, and also determines the criteria for certifying partners. A partner can either be a General Partner or a Vendor Partner. A General Partner will facilitate the EEP program, having the ability to recommend several technologies to a customer. A Vendor Partner, on the other hand, supplies only approved technologies. Partners are responsible for overseeing the sitespecific EEP program projects and for reviewing project documentation while verifying project savings and cost-effectiveness. The partnership may end once the technology is deployed or it may be an ongoing process to help the end user deploy technologies at a time when the customer and the electric system can realize the greatest savings. The legislation also required the DPUC to develop a low-interest loan program to help customers finance their share of any efficiency measures adopted. The department can offer these loans under an existing agreement with the Connecticut Development Authority (CDA), or 50
53 through an entity chosen by competitive bid. The financing agreements entered into with the CDA cannot exceed $10 million. Activity level. As of August 2008, DPUC had applications posted on its website for the two types of partners and a customer application. Thus far, 3 applications have been received for technologies of which 2 were approved, but no applications to be a general partner or a customer have been received. Connecticut Clean Energy Fund (CCEF) The Clean Energy Fund, also known as the Renewable Energy Investment Fund, was established in 1998 as part of electric restructuring required by the state legislature (C.G.S. Sec. 16a-245m). The purpose of the fund is to provide financing for alternative sources of energy. Its goals are to: 1) increase installed renewable energy capacity; 2) promote renewable energy technologies; and 3) build public awareness about renewable energy and make renewable energy sustainable. The Clean Energy Fund programs did not become operational until 2000, and in its early stages from 2000 to 2004, the fund largely focused on investments (i.e., venture capital) for renewable energy. Figure III-11 shows the funding structure as well as administrative and regulatory oversight for the Clean Energy Fund. 51
54 Funding. The Clean Energy Fund is financed by a surcharge of not less than.001 cent (1 mill) per kwh on ratepayers electric bills. This and some other rate surcharges are now combined into one public benefits charge on electric ratepayers bills, but the amount allocated for the Clean Energy Fund is 1 mill. Other sources of revenue have been interest and payments for renewable energy credits (RECs) as described earlier in the CEEF funding. Table III-18 below shows the revenues and aggregate expenditures for the fund for FY 08 and FY
55 Table III-18: CT Clean Energy Fund Revenues and Expenditures FY 08 and FY 09 (000) Revenues FY 08 FY 09 Utility Customer Assessments $22,279 $29,331 Interest on Deposits $4,234 $2,025 Renewable Energy Credits $200 $215 Total Fund revenues $26,722 $31,571 Table III-18 Expenditures Staff Salaries and Wages $2,137 $2,405 Benefits $1,120 $1,297 Other $1,327 $1,225 Total Operating Expenses $4,584 $4,927 Grants and Programs $20,726 $43,745 Total Fund Expenditures $25,310 $48,672 The Clean Energy Fund staff indicates that the expenditures for fund programs are increasing dramatically because of increased program demand and funding allocated to projects already approved in the pipeline. Program administration. The Clean Energy Fund is under Connecticut Innovations Incorporated (CII) a quasi-public agency, for administrative purposes only. However, the Connecticut Clean Energy Fund has its own executive director and staff, and reports to a 15- member Renewable Energy Investments Board, also known as the Connecticut Clean Energy Board. Administrative oversight. The Clean Energy Fund is under Connecticut Innovations Incorporated (CII), a quasi-public agency, for administrative purposes only. However, the Connecticut Clean Energy Fund has its own executive director and staff, and reports to a 15- member Renewable Energy Investments Board, also known as the Connecticut Clean Energy Board. Public Act reconstituted the board, which had previously been advisory to the CII, and increased its membership from 11 to 15. The 2007 act added the heads (or designees) of the Office of Consumer Counsel, the Department of Emergency Management and Homeland Security, Office of Policy and Management and the Department of Environmental Protection, and 11 appointed members with various specified expertise and backgrounds three by the Governor; one by each of the six legislative leaders; and two by the CII board. This act also gave the board significantly more authority, requiring that no expenditures from the fund be made without prior board approval, and also required the board to develop a comprehensive plan, hold public hearings on the plan and submit the plan to DPUC for action after its proceedings. Regulatory oversight. Public Act required that the Clean Energy Fund develop a comprehensive plan, receive public comment, and hold three public hearings on the plan, 53
56 before submitting it to the Department of Public Utility Control for approval. Up until 2007, the Clean Energy Fund developed a strategic plan but outside approval was not required. The Clean Energy Fund developed its comprehensive plan and submitted it to DPUC in April DPUC held a public hearing and comments were received, but DPUC had not made a final decision on the plan as of August. Clean Energy Fund Programs Figure III-12 below shows the Clean Energy Fund programs organized by Fund goals. Connecticut Clean Energy Fund Increase Capacity for Renewable Energy Promote Renewable Technologies Create Community-Based Programs - Project 150 -Onsite Distributed Generation -Small Projects including Solar rebates and leasing programs - Municipal and state projects - Operational Demonstration Projects - Collaborative efforts with universities and industry - Clean Energy Communitiesthose that commit to 20% of electricity in municipal buildings from renewable energy by High Performance Schools - Public awareness programs including Learning for Clean Energy program Program activity and results. Connecticut residents and businesses in the two major electric utility service areas are eligible for the programs. Specific information on the programs is available on the Clean Energy Fund website. Table III-19 below describes the programs, including eligibility criteria, the number that are completed or approved, and program expenditures on the program as of June As with the Connecticut Energy Efficiency Program, the Clean Energy Fund also measures and reports on savings from the programs including (also shown in Table III-9): the electric savings (equivalent to average of 700 kwh/month); avoided emissions (e.g., tons of carbon dioxide) resulting from its programs; lifetime avoided $ congestion charges mandated by the Federal Energy Regulatory Commission 54
57 Table III-19. Clean Energy Fund: Program Activity, Expenditures and Results to Date Program # of projects Expenditure s to Date CCEF-reported results (over lifetime) On-site Renewable Distributed Generation 89 projects $56.3 million Electricity saved= 4,046 homes FMCC avoided= $2.8m Tons carbon dioxide avoided =107,000 Project 150 program is legislatively mandated. Requires utilities to enter longterm electricity purchase agreements (EPAs) with projects that receive CCEF funding. EPAs must purchase at least 150 megawatts of Class I renewable energy Residential and small solar photovoltaic (PV) systems Use a pre-qualified installer approved installers Equipment must be new, meet certain standards, and produce no more than what has been the customers annual electric consumption Rebate approval must be issued before work begins Typically rebates are half the cost (1/2 of $44,000) No income limits Eligible for sale renewable energy credits and eligible for personal income tax credit (30% of cost, up to $2000) Solar lease program New program begun in July 2008 To help finance the half of the solar installation not covered by the rebate CCEF works with lender to offer lease arrangements typically about $120 a month Income limits of 150% of MFI by area family of 4 in Hartford area -- $121,650 Operational Demonstration Projects 7 Completed $11.7 million 3 in Progress Community-based programs -75 towns participate in 20% by grants issued -160 PV systems to 28 towns $3.3 million Source: Clean Energy Comprehensive Plan FY 09-10, and CCEF website 7 projects $5.8 million Electricity saved= 88,413 homes FMCC avoided= $81.4m Tons carbon dioxide avoided =4.9m 529 projects $11.9 million Electricity saved= 290homes FMCC avoided= $321,471 Tons carbon dioxide avoided = 28,940 55
58
59 Section IV State Funded Programs This section discusses energy efficiency programs that are primarily supported with state monies, either through state-issued bonds, the General Fund, or in some cases, part of the proceeds from a particular tax, such as the gross receipts tax on petroleum products. As with the funds discussed in the previous section, there is overlap in funding mechanisms, and the program administration lines are not always clear and definitive. The programs discussed in this section include: the Energy Conservation Loan Fund; the recently established furnace rebate program; the fuel oil conservation program; and programs targeted to energy efficiency in state facilities. ENERGY CONSERVATION LOAN FUND (ECL) The conservation loan funds were established in 1979 (C.G.S. 16a-40a) to provide financing at below market rates to single family and multi-family residential property owners for the purchase and installation of cost-saving energy conservation improvements. Figure IV-1 shows the funding and administrative structure of the program. 57
60 Funding. The Department of Economic and Community Development (DECD) funds the program through revolving loans and the issuance of bonds in principal amount not exceeding in the aggregate $23.7 million. Annually, the proceeds from the loan repayments amount to approximately $2 million. At its August 2008 meeting, the State Bond Commission issued an additional $2 million for the fund, and the legislature allocated another $2 million in General Fund surplus to the program at its August 22 special session. Program administration. DECD contracts with the Connecticut Housing Investment Fund (CHIF) to administer the program. CHIF is a private, nonprofit organization established to finance affordable housing and neighborhood revitalization projects throughout Connecticut. Since 1979, CHIF has lent over $84.6 million in energy conservation loans to all 169 towns in the state. Approximately loans are closed each month with an average loan amount of $10,000 in 2005, increasing to $12,000 in The low interest rate loans to households are subsidized by the state s major utilities based on a formula outlined in C.G.S. Section 16a-40b(f). In FY 08, the gas and electric utilities paid close to $400,000. The principal from the loans is deposited into the fund, approximately $1.5 million a year, with the interest going into the General Fund. CHIF does not have an annual budget for marketing activities. In 2006, CHIF spent $2,000 on special marketing activities to promote several new aspects of the ECL program but since then has not had funds for marketing activities. The top three ways in which borrowers learn about the ECL program are by: 1) word of mouth; 2) referrals from contractors; and 3) the CHIF website. Eligibility. Connecticut single family homeowners (1-4 units) with income up to 200 percent of the median family income (MFI) 24 by geographic area and family size may borrow between $400 and $25,000 with a maximum loan term of 10 years. Multi-family property owners may borrow up to $2,000 per unit with a maximum of $60,000 per building for a period of 10 years for eligible improvements. In order to qualify, the client must have a debt load less than or equal to 39 percent of income, which is calculated based on housing expenses, loan obligations, revolving charges, and monthly income. In 2007, 203 applications were rejected. The most common reasons an application is rejected include: poor debt to income ratio, derogatory credit history, bankruptcy, and tax liens. CHIF also offers a program for senior citizens to prevent them from going without heat. If a resident has a furnace that has been red tagged meaning it does not function-- CHIF will offer a loan to replace or fix the furnace regardless of credit history. Customers receive a three year deferred loan, payable upon the sale of the house. CHIF also offers a three year deferred loan if a homeowner experiences a hardship due to divorce, death, or a medical reason. After three years, CHIF will reevaluate the homeowner s their financial conditions for repayment. 24 The income eligibility levels were increased in the August 2008 Special session to 200 percent of area median income. For a household of four this equates, for example, to $95,550 in Waterbury MSA and $176,700 in the Stamford-Norwalk MSA 58
61 There are certain types of home improvements that qualify for a loan. CHIF classifies improvements into two categories: Type 1 and Type 2. Enumerated below are examples of the improvements covered by the two programs. Type 1 Improvements: Energy efficient insulation Replacement thermal windows and doors Replacement furnaces and boilers Replacement hot water heaters Secondary heating systems using a source of heat other than electricity Conversion of a primary electric heating system to a system using a source of heat other than electricity if home was constructed prior to 1/1/80 Vinyl or aluminum siding for existing eligible structures Replacement roofs Type 2 Improvements: Replacement central air conditioning systems Heat pumps or solar systems and passive solar additions Recent restrictions. The August 2008 Special Session legislation allocating funding to the ECL program appears to limit the zero percent loans to the purchase of very high efficiency boilers and furnaces -- natural gas furnaces or boilers that meet or exceed federal ENERGY STAR standards and propane and oil furnaces and boilers that are not less than 84 percent efficient. Committee staff is exploring whether this is just codifying a practice that has been in place, or whether this will substantially alter the program. ECL ACTIVITY LEVEL ANALYSIS Type 1 Rates % Median Family Income (MFI) 50% MFI 0% % MFI 3% Interest Rate Type 2 Rates % Median Family Income (MFI) 50% MFI 1% 51-80% MFI 3% 81%-150% MFI 6% Interest Rate A majority of the loans are provided to single-family households as demonstrated in Table IV-1. The number of loans issued increased by 35 percent between 2005 and 2006 but then dropped 17 percent in Since the program started in 1979, over 21,000 loans have been issued. Table IV-1. New Loans Processed and Amounts for Calendar Years Calendar Yr 2005 Calendar Yr 2006 Calendar Yr 2007 Loan type # loans Total Funded # of loans Total Funded # of loans Total Funded Single Family 161 $1,553, $2,188, $1,973,818 Multifamily 4 $65,912 2 $59,527 9 $267,925 Total 165 $1,619, $2,248, $2,241,743 59
62 In each of the past three years, loans for heating systems (35-40%), thermal windows (30-35%), and roofs (20-25%) were the most common type of improvements funded by the program. However, in the past year CHIF has seen an increase in the number of requests for replacing heating systems due to the rise in energy costs. Over the past three years, the number of loans between 30 and 120 days delinquent has ranged from a high of 44 in 2005 to a low of 34 in 2007, representing 4.7 percent and 3.6 percent respectively of the total loans outstanding in those years. DECD and CHIF will work with the borrowers of loans that are over 120 days outstanding and work out a feasible repayment schedule. FURNACE REBATE PROGRAM The furnace rebate program was established during the 2007 legislative session as part of P.A and amended during the August 2008 Special Session. As a result of legislation, between July 1, 2007 and June 30, 2017, the Office of Policy Management must provide rebates of up to $500 for the purchase and installation of high efficiency home heating equipment or for the repair and upgrade to a high efficiency heating system. Funding. While the initial rebate program was established in 2007, it was not until the August 2008 State Bond Commission meeting that $5 million in bonds was issued for the program. As a result of the August 2008 Special Session, the legislature appropriated an additional $3 million in funding for the furnace replacement program and an additional $2 million for furnace/boiler repair and upgrades. Program administration. The program is run through the Energy Unit of the Office of Policy and Management. All information, including applications and guidelines, can be found on the OPM website. According to P.A , the ECMB must report to the Energy and Technology Committee on the cost-effectiveness of the rebate program by January 1, Eligibility. To be eligible for the rebate, the furnace or boiler must be installed between July 1, 2007 and April 15, A replacement natural gas furnace/boiler must meet or exceed Federal ENERGY STAR standards. A replacement oil or propane furnace/boiler must be at least 84 percent efficient. Rebate levels are based on an applicants 2007 filing status for federal income tax and state adjusted gross income (AGI), and are reduced by 10 percent for every $10,000 the applicant s income exceeds the category threshold. For example, to receive the full $500 rebate, a single filer s AGI cannot exceed $56,500, and the AGI for married joint filers cannot exceed $100,500 to be eligible for the full rebate. Residents can also qualify for a rebate of up to $500 if they repair or upgrade their existing boilers or furnaces on or after August 1, 2008, to improve the efficiency. The rebate only applies to residences of up to four dwelling units. 60
63 FUEL OIL CONSERVATION BOARD More than 50 percent of Connecticut households heat with home heating oil; those residents were not the target population of the programs and services offered by CEEF, which focuses primarily on electric use. Recognizing the gap, the legislature through P.A established a 13-member board to administer energy efficiency and conservation programs targeted at oil heating customers. All appointments must come from groups specifically designated in the legislation, including fuel oil dealers and the heating, ventilation, and air conditioning trades, as well as environmental groups, and two representing residential customers, one of whom represents low-income residents. Figure IV-2 shows the funding and administrative structure for the Fuel Oil Conservation Board. Operational administration. P.A established very specific directives and timeframes for its organization and operations. The board must establish itself as a federally tax exempt nonprofit (501c) organization, and issue an RFP to select an entity to administer the programs. By November 1, 2007, the board was required to contract with the selected administrator for up to three years. Oversight. Once the administrator is selected, a comprehensive plan is required to be developed by March 1, 2008, and submitted to the Energy Conservation Management Board for its approval. The board advises and assists the administrator in the development of the plan and its implementation. The Office of the Attorney General is also required to select a third party to audit the activities of the board on a biennial basis. 61
64 Funding. The funding for these conservation initiatives is to come from the excess in the petroleum products gross receipts tax over the 2006 revenue, subject to a $10 million cap, decreasing to $5 million in 2009, and annually thereafter. The funds are to go into a fuel oil conservation account, which is a separate nonlapsing account within the General Fund, but any monies not spent are transferred to the General Fund. Because of funding issues around when the Comptroller could allocate money into the fuel oil conservation account, the board had no funding until the 2008 June Special session when the legislature authorized the Comptroller to deposit $2.5 million in the account, with the remainder going into the account by October 1, In addition, in the August Special Session, $7 million was authorized in surplus General Funds to establish an energy audit program within OPM for persons who heat their homes with oil or another non-regulated source. The monies would cover the costs of the audit -- beyond a $75 required fee from the customer- performed by qualified oil companies and other vendors between September 1, 2008 and June 30, Activities. The fuel oil board met earlier in 2008 and issued an RFP in February 2008 to select an administrator, but the board did not meet from May through September. As of September 2008, a board subcommittee had reviewed the responses to the RFP for an administrator and the board recommended the subcommittee negotiate a fairly short-term contract with the subcommittee s final candidate. The board is also considering a proposal from the CAP agencies that already serve persons in the low-income energy assistance programs (discussed in the next section), and who are already known to need furnace repairs and replacement, or are awaiting other residential conservation measures. ENERGY EFFICIENCY AND CONSERVATION IN STATE BUILDINGS Government buildings are a significant source of energy consumption. Focus on energy efficiency in state government facilities has always been a concern, but has become more acute as the costs of energy have increased. Attention to the practice of energy efficiency by state governments is one of the eight areas where states are judged by the ACEEE on the state energy efficiency scorecard. The national organization ranks and awards states on their model efficiency programs, including how well they practice energy efficiency in state facilities, transportation and procurement practices or leading by example (LBE) as the category is labeled. As cited earlier in this report, in 2006 Connecticut received top ranking along with California and Vermont in its overall score, but it was in the middle of the state rankings with a score of 1 out of a possible 3 in this lead by example category. Sixteen states achieved a higher ranking. Common deficiencies in state programs are: Limited knowledge. Information sharing and learning from the experiences of other states can help break the barrier of limited knowledge. Insufficient funding. Innovative financing mechanisms that are already being used by many states can fund some of the LBE efficiency programs. Limited support and staff availability. Identifying a champion in each agency to ensure that LBE programs are implemented. 62
65 The ACEEE report suggests some key policies that can improve a state s energy efficiency practices, and hence its overall program. Some of those are: using energy efficiency performance criteria, including EPA s ENERGY STAR requirements; establishing new and existing building energy efficiency targets and savings goals; implementing procurement requirements, such as ENERGY STAR appliances, energy efficient equipment and vehicles; identifying and using innovative financing mechanisms (e.g., energy savings performance contracts that require the savings cover the cost of improvements); adopting a tracking and reporting system for agency-by-agency data collection; assigning an agency-level energy manager to be accountable for progress. CONNECTICUT S EXPERIENCE In 2007, costs for energy in Connecticut state buildings were approximately $123 million. While less than 1 percent of the state budget, it is a significant operating cost. However, the attention and priority to energy efficiency and conservation programs is episodic and results are spotty, as the discussion below indicates. For the most part, state government s energy costs are an operating expense paid for from the General Fund. Capital improvements to state buildings, including installation of energy efficiency measures, are mostly supported with state bond funds. In the 2001 June Special session, the legislature required that $12 million be diverted from the Connecticut Conservation and Load Management Fund (now known as the Connecticut Energy Efficiency Fund) to a non-lapsing account for the Department of Public Works (DPW) for energy conservation programs in state facilities. DPW recently issued two reports on the status of those funds and the projects, which are summarized in the two tables below. The first table summarizes the status of projects that are being funded without utility matching funds and the second table summarizes the status of projects that will tap into the CEEF Small Business Energy Advantage Program. 63
66 Table IV-2. Status Summary of Projects Using $12 Million Diverted from CEEF to DPW: No Utility Matching Funds Project Status 38 potential projects DPW Funds Agency Contributions 11 completed $3.5 million $700, underway; not yet complete $3.83 million $150,000 1 project complete No DPW funding $310,710 (OPM) 1 project for solar PV $150,000 Applied to Clean Energy Fund ($450,000) 5 projects cancelled (bidding and contract issues, too cost prohibitive, or not enough savings projected) N/A N/A 1 project on hold (bidding issues) N/A N/A Total $7.3 million Source: PRI Staff Summary of DPW July 2008 status report Table IV-3. Status Summary of Projects Using $12 million Diverted from CEEF to DPW: With CEEF Funding Project Status 23 potential projects DPW Funds CEEF Small Business Program Funds 3 completed/substantially completed $264,248 $261,685 3 underway $135,199 $124,196 5 about to start $214,104 $227,796 6 on hold, pending CL&P funding (1 project does not have cost figures yet) 6 on hold DPW review or other reasons $129,620 (5 projects) $93,185 $489,996 $302,243 Total $1,233,167 Source: PRI Staff Summary of DPW July 2008 status report Since the $12 million was dedicated seven years ago, the identification and completion of projects has been slow; only 35 projects have been completed or are underway, with about $8.5 64
67 million spent or committed. One possible contributing factor is that responsibility for oversight and implementation of state facility energy management appears split between the Office of Policy and Management and the Department of Public Works. Further, there is only one and a half FTE staff at the Department of Public Works to oversee energy efficiency projects. P.A Other attention has been given to energy management and efficiency in state buildings. In 2003, P.A was passed to implement the recommendations of the 2002 program review study on Energy Management by State Government. Three primary recommendations in that legislation were: 1) a mandate that the Office of Policy and Management require each state agency to identify methods available to reduce energy costs and the feasibility of implementing those methods; 2) that the Governor s budget include a line-item breakdown of each agency s energy expenditures and 3) that OPM and DPW establish a pilot program that selects a state facility or complex to be covered by an energy performance contract with a private vendor. In response to the legislation, OPM did survey all state agencies and in February 2004 released a report entitled Energy Management in State Facilities: A New Direction. That report identified strategies for improvement including development of energy consumption monitoring data by building and by time of day, and linking that information to CoreCT (state government s automated business system for personnel, bill payment etc.) so that use data would automatically be reported at the time of bill payment. However that linking has not yet been done, both because of system issues and because the biggest state government user of energy, higher education, is not on the CoreCT system. Thus, sound data on energy consumption in state facilities is difficult to obtain. Partially due to the lack of system capabilities, the budget reporting of energy expenses by agency has not been done. The 2004 OPM report also identified the need for energy benchmarking in state buildings that compares their energy profile to similar buildings, to better target those state facilities most in need of energy improvements. In 2005, OPM issued a memorandum of agreement with the Institute for Sustainable Energy to conduct this benchmarking effort. To date, 110 buildings have been benchmarked, and some have been identified for energy efficiency project outlined in Table IV-3 and IV-4 above. However, the second recommendation to pilot a private vendor energy performance contract was never implemented. Thus, no results can be analyzed to assess whether this might be an opportunity for state government to execute energy efficiency in a cost-effective way. Governor Rell directive. In mid-december 2004, following significant increases in electric rates, Governor Rell directed the Department of Public Utility Control, the Office of Consumer Counsel, and the Energy Conservation Management Board to identify opportunities to reduce electric consumption at state facilities. The focus was to reduce the impact of increases in electric rates on the state budget. The working group issued a report in February 2005, stating there are considerable opportunities for savings that remain untapped. The report cited that a major gap was that the 65
68 state had no comprehensive energy efficiency plan for its agencies. The report proposed 32 action steps that could be taken to reduce electricity consumption, many of which, according to the report authors, could be implemented quickly and would involve little or no upfront financial investment relative to the savings that could be achieved. The 32 proposals for change focused on the following: Directing state agencies to contact electric utilities to ensure they are receiving the most beneficial rate or using the rate schedule that provides the lowest overall cost; Creating a single point of contact for energy efficiency at all state agencies, staffed by personnel with expertise in energy efficiency; Assigning responsibility for energy efficiency to management at each state agency; Instilling an energy efficiency ethic among state employees; Developing statewide energy efficiency standards and practice for agencies; Establishing state energy reduction goals, suggesting a 10 percent reduction in 2005 and an additional reduction of 5 percent in 2006; Using incentives to sustain consumption reduction like embedding a portion of the savings in the agency budget; Participating in load response programs; and Establishing a state government energy plan, and preparing an energy efficiency scorecard for every state building and the equipment it contains. However, the report did not clearly designate any agency or staff as being responsible for implementation. No status report on the results has ever been issued, and while it is clear that many of the steps have not yet been implemented, progress is being made in some areas. For example, state government: participates in load response programs; has recently begun using the electricity markets and its clout as a large purchaser to obtain favorable rates for state government s energy supply, realizing considerable financial savings; and issued an energy plan for state buildings in
69 Load response. P.A , the Energy Independence Act, established several initiatives to reduce electric power supply costs caused by inadequate transmission and generation infrastructure in Connecticut, especially in the southwestern region of the state. Many of the financial incentives have supported installing onsite electric generation so that demand can be reduced off the New England electric grid during times of peak demand. Since 2005, 11 state agencies at 40 different sites have been participating in these load response programs, which generate about $1.7 million in payments to state government from ISO-New England, the region s independent electric grid operator. State energy plan. The state has also developed a state energy management plan for state facilities. The plan, which was also a requirement of P.A , was developed by the Office of Policy and Management Energy Unit and issued in September 2007, modified in November The plan provides anticipated savings and efficiencies that could be realized around certain proposals, including expansion of the load response program discussed above. One of the tasks outlined in the plan is to develop a master contract with the utilities to govern state agency participation in ratepayer-supported CEEF and CCEF programs. In the early years of the Connecticut Energy Efficiency Fund, the state had accessed the fund frequently. Between 2000 and 2004, 326 state projects received financial incentives from the Connecticut Energy Efficiency Fund totaling over $7.8 million. However, in the wake of ethics scandals, Governor Rell issued a series of Executive Orders during 2005 and 2006 requiring contracting reforms in state government. It was determined that the state access to the Connecticut Energy Efficiency Fund would be affected and that more formal contracting would be required. The provisions for the master contract have been developed over the past year and a request for proposals has been issued by the Department of Administrative Services. Responses are due on September 23, During the time the contract was being developed, the state s participation in the CEEF has fallen dramatically. United Illuminating indicates that the only 32 state projects participated in its programs during (to date), and received funding of about $112,000, while CL&P stated that for the calendar years, it funded 60 state projects for a total of about $1.1 million. Since the Clean Energy Fund is within a quasi-public state agency, the state would not have faced similar contracting issues with that fund, but only two state agencies have used, or attempted to use it since its inception. DOT received $140,000 for a solar system and DEP has applied to the fund for $450,000 for a solar system. Public Act authorized $30 million in bonds for the Clean Energy Fund to support the costs of renewable energy and combined heat and power projects in state buildings that could meet certain design ratings. However, the State Bond Commission has not issued any bonds for that purpose. 67
70
71 Section V Low-Income Assistance Programs Energy costs are taking a greater share of everyone s household budget, and lowerincome residents are especially hard hit. Often these households use more energy as an ill, disabled, or elderly person lives in the house, and thus the unit is occupied for more hours, and the building structures are frequently older and inefficient. Since lower-income households pay the same energy prices, it takes a greater portion of their household income. As Figure V-1 demonstrates, energy assistance for low-income households is provided as cash assistance or through conservation measures. Both types of programs are supported both with utility ratepayer funding and with federal and state funds, as well as charitable donations. This section presents information on all energy assistance programs focused on low-income residents, including how the programs are administered, the eligibility requirements, how they are funded, and program activity levels. Low Income Home Energy Assistance Program (LIHEAP) The major energy assistance program for low-income households is known as the Connecticut Energy Assistance Program (CEAP), which is funded almost exclusively with federal dollars. Those federal dollars come to Connecticut by way of a block grant through the Low Income Home Energy Assistance Program (LIHEAP), a federal Department of Health and Human Services initiative begun in

72 The purpose of the program is to assist low-income households with their heating (or cooling) expenses. The program clearly states, however, that the purpose is not to pay for all of a household s energy costs. Figure V-2 below shows how the program is implemented. Funding. As noted, the Connecticut program is primarily funded through a federal block grant from the U.S. Department of Health and Human Services known as the Low Income Home Energy Assistance Program. This is not an entitlement program, so once the allocation of the block grant runs out the state must fund the program or terminate enrollment. Funding is based on the federal fiscal year and for FFY 08 was about $65 million dollars, which included a federal contingency allocation of almost $17 million. Table V-1 below shows the aggregate expenditures for FFY 07, the latest data available on expenditures. Table V-1. Connecticut Energy Assistance Program FFY 07 Client Asst. Benefits $54,881,921 CAP Agency administration $4,244,317 Assurance 16 (case management) $1,000,000 Federal charges $12,778 DSS administration $ Total $60,369,016 Source: CEAP 2007 Report to Legislature Operations and administration. The Department of Social Services is the state agency designated to receive the federal block grant funding, but DSS contracts out the actual operation of the program to the 12 Community Action Agencies (CAPs), the anti-poverty agencies created by federal law in the 1960s. 70
About 44% of the energy was consumed in the residential sector, 30% in the commercial sector, and 26% in the industrial sector.
 MEMO DATE: October 12, 2006 (Revision #2) TO: Blair Hamilton and Beth Sachs FROM: David Carroll, Jackie Berger, and Jim Devlin SUBJECT: Need for and Design of a Fossil Fuel Energy Efficiency Program Energy
TENNESSEE TEXAS UTAH VERMONT VIRGINIA WASHINGTON WEST VIRGINIA WISCONSIN WYOMING ALABAMA ALASKA ARIZONA ARKANSAS
 ALABAMA ALASKA ARIZONA ARKANSAS CALIFORNIA COLORADO CONNECTICUT DELAWARE DISTRICT OF COLUMBIA FLORIDA GEORGIA GUAM MISSOURI MONTANA NEBRASKA NEVADA NEW HAMPSHIRE NEW JERSEY NEW MEXICO NEW YORK NORTH CAROLINA
Weatherization Assistance Program PY 2013 Funding Survey
 Weatherization Assistance Program PY 2013 Summary Summary............................................................................................... 1 Background............................................................................................
Overview: Administrative Structures for Utility Customer Energy Efficiency Programs in the United States
 Overview: Administrative Structures for Utility Customer Energy Efficiency Programs in the United States Dan York, Ph.D., Utilities Program Director American Council for an Energy-Efficient Economy dwyork@aceee.org
Arizona State Funding Project: Addressing the Teacher Labor Market Challenge Executive Summary. Research conducted by Education Resource Strategies
 Arizona State Funding Project: Addressing the Teacher Labor Market Challenge Executive Summary Research conducted by Education Resource Strategies Key findings 1. Student outcomes in Arizona lag behind
STATE ENTREPRENEURSHIP INDEX
 University of Nebraska - Lincoln DigitalCommons@University of Nebraska - Lincoln Business in Nebraska Bureau of Business Research 12-2013 STATE ENTREPRENEURSHIP INDEX Eric Thompson University of Nebraska-Lincoln,
Finding Funding for Energy Efficiency
 54M102007D Finding Funding for Energy Efficiency Retail Industry Leaders Association Presented by Shaw Environmental & Infrastructure, Inc. 02M062007D July 9, 2009 2 Agenda Introduction to Shaw Overview
Weatherization and Intergovernmental Program
 Weatherization and Intergovernmental Program LeAnn Oliver, Program Manager Weatherization & Intergovernmental Program Office of Energy Efficiency and Renewable Energy U.S. Department of Energy National
Green Recovery: How Weatherization Works for Iowans Sustainable Policy Assists Struggling Families, Enhances Iowa s Economy
 POLICY BRIEF May 20, 2010 www.iowafiscal.org Green Recovery: How Weatherization Works for Iowans Sustainable Policy Assists Struggling Families, Enhances Iowa s Economy By Molly Fleming and David Swenson
5.6 Home Energy Savings Program
 5.6 Home Energy Savings Program 5.6.1 Overview The Home Energy Savings Program (HESP) is the program through which the Trust pursues savings from upgrades to a home's building envelope or certain heating
FY2016 RENEWABLE ELECTRIC STORAGE INCENTIVE PROGRAM STRAW PROPOSAL MAY 07, 2015
 FY2016 RENEWABLE ELECTRIC STORAGE INCENTIVE PROGRAM STRAW PROPOSAL MAY 07, 2015 Purpose and Intent The New Jersey Board of Public Utilities Staff (Staff) and the Market Manager are issuing this straw proposal
The Regional Economic Outlook
 The Regional Economic Outlook Presented by: Mark McMullen, Director of Government Svcs Prepared for: FTA Revenue Estimating Conference September 15, 2008 Recent Economic Performance 2 1 The Job Market
Maine s Economic Outlook: 2009 and Beyond
 Maine s Economic Outlook: 2009 and Beyond January 2009 James Breece, Ph.D. University of Maine System Outline 1. External Economic Drivers 2. Current Conditions 3. Economic Projections 4. Long-term Trends
Introduction. Current Law Distribution of Funds. MEMORANDUM May 8, Subject:
 MEMORANDUM May 8, 2018 Subject: TANF Family Assistance Grant Allocations Under the Ways and Means Committee (Majority) Proposal From: Gene Falk, Specialist in Social Policy, gfalk@crs.loc.gov, 7-7344 Jameson
Figure 10: Total State Spending Growth, ,
 26 Reason Foundation Part 3 Spending As with state revenue, there are various ways to look at state spending. Total state expenditures, obviously, encompass every dollar spent by state government, irrespective
07/01/2010 ACTUAL START
 PAGE, 1/27/21 6:18:42PM Grant Number: SC2224 Activity: Municipal Facility Energy Conservation Program Quarter: 1/1/29-12/31/29 Metric Activity: Building Retrofits Status: Active % of Work Complete: Activity
Fiscal Research Center
 January 2016 Georgia s Rankings Among the States: Budget, Taxes and Other Indicators ABOUT THE FISCAL RESEARCH CENTER Established in 1995, the (FRC) provides nonpartisan research, technical assistance
Fiscal Research Center
 January 2017 Georgia s Rankings Among the States: Budget, Taxes and Other Indicators ABOUT THE FISCAL RESEARCH CENTER Established in 1995, the (FRC) provides nonpartisan research, technical assistance
Fiscal Research Center
 January 2018 Georgia s Rankings Among the States: Budget, Taxes and Other Indicators ABOUT THE FISCAL RESEARCH CENTER Established in 1995, the (FRC) provides nonpartisan research, technical assistance
5.7 Low-Income Initiatives
 5.7 Low-Income Initiatives 5.7.1 Overview Efficiency Maine Trust delivers energy-saving opportunities to low-income customers through a portfolio of initiatives. Customer Segment The target market for
Partner(s): City of Asheville, Duke Energy Progress, Green Built Alliance, Community Action Opportunities, NC Sustainable Energy Association (NCSEA)
: City of Asheville, Duke Energy Progress, Green Built Alliance, Community Action Opportunities, NC Sustainable Energy Association (NCSEA)") Project Title: Blue Horizons - Efficiency Network Summary Statement: Buncombe County, the City of Asheville, Duke Energy Progress, and other partners propose a pilot program to centralize, enhance, and
Project Title: Blue Horizons - Efficiency Network Summary Statement: Buncombe County, the City of Asheville, Duke Energy Progress, and other partners propose a pilot program to centralize, enhance, and
Powering Our Communities. Grant Guidelines
 Powering Our Communities Grant Guidelines Powering Our Communities Grant Guidelines The Northeast Ohio Public Energy Council, Inc. ( NOPEC ) is pleased to invite its electric member communities of The
EAP Member Electric and Natural Gas Utilities AN OVERVIEW OF PA UTILITY CONSUMER SERVICES
 EAP Member Electric and Natural Gas Utilities AN OVERVIEW OF PA UTILITY CONSUMER SERVICES By Donna M. J. Clark General Counsel Energy Association of Pennsylvania PA PUC Advisory Council Meeting March 22,
Annex A: State Level Analysis: Selection of Indicators, Frontier Estimation, Setting of Xmin, Xp, and Yp Values, and Data Sources
 Annex A: State Level Analysis: Selection of Indicators, Frontier Estimation, Setting of Xmin, Xp, and Yp Values, and Data Sources Right to Food: Whereas in the international assessment the percentage of
Energy Efficiency and Economic Recovery Initiative
 Alliance to Save Energy * Edison Electric Institute * Energy Future Coalition Natural Resources Defense Council Energy Efficiency and Economic Recovery Initiative December 19, 2008 To put Americans back
Frequently Asked Questions
 U.S. Department of Energy Weatherization Assistance Program QUESTIONS AND & ANSWERS Frequently Asked Questions What is the Weatherization Assistance Program? The Weatherization Assistance Program (WAP)
Financing Clean Energy Projects Under the Reinvestment Act of 2009
 Financing Clean Energy Projects Under the Reinvestment Act of 2009 Major ARRA Provisions for Project Financing William D. Hewitt Pierce Atwood LLP June 11, 2009 Pierce Atwood LLP 125+ attorneys Offices
Rankings of the States 2017 and Estimates of School Statistics 2018
 Rankings of the States 2017 and Estimates of School Statistics 2018 NEA RESEARCH April 2018 Reproduction: No part of this report may be reproduced in any form without permission from NEA Research, except
CLEAN ENERGY DEVELOPMENT FUND
 CLEAN ENERGY DEVELOPMENT FUND Annual Report to the Vermont Legislature Fiscal Year 2012 Submitted to the House and Senate Committees on Natural Resources and Energy, the Senate Committee on Finance, and
January 2015 June 2016
 school district Report to Legislative Assembly on Public Purpose Expenditures January 2015 June 2016 Final 18-Month Report December 14, 2016 Evergreen Economics Portland, OR 503-894-8676 EvergreenEcon.com
California Self-Generation Incentive Program Evaluation
 California Self-Generation Incentive Program Evaluation Brenda Gettig, Itron, Inc. Patrick Lilly, Itron, Inc. Alan Fields, Itron, Inc. Kurt Scheuermann, Itron, Inc. Lori Kudo, Itron, Inc. Pierre Landry,
Fiscal Year 1999 Comparisons. State by State Rankings of Revenues and Spending. Includes Fiscal Year 2000 Rankings for State Taxes Only
 Fiscal Year 1999 Comparisons State by State Rankings of Revenues and Spending Includes Fiscal Year 2000 Rankings for State Taxes Only January 2002 1 2 published annually by: The Minnesota Taxpayers Association
Weekly Market Demand Index (MDI)
") VOL. 8 NO. 28 JULY 13, 2015 LOAD AVAILABILITY Up 7% compared to the Weekly Market Demand Index (MDI) Note: MDI Measures Relative Truck Demand LOAD SEARCHING Up 18.3% compared to the TRUCK AVAILABILITY
VOL. 8 NO. 28 JULY 13, 2015 LOAD AVAILABILITY Up 7% compared to the Weekly Market Demand Index (MDI) Note: MDI Measures Relative Truck Demand LOAD SEARCHING Up 18.3% compared to the TRUCK AVAILABILITY
PUBLIC COMMENTS SOUGHT REGARDING:
 PUBLIC COMMENTS SOUGHT REGARDING: JOINT BOARD/DCA STAFF RECOMMENDATION CONCERNING WEATHERIZATION AND ENROLLMENT IN THE UNIVERSAL SERVICE FUND & LOW INCOME HOME ENERGY ASSISTANCE PROGRAMS Staff of the Board
Alabama Leverages Funding for Industrial Energy Efficiency
 Alabama Leverages Funding for Industrial Energy Efficiency Sandy Glatt and Jamey Evans, U.S. Department of Energy Garrett Shields, BCS, Incorporated ABSTRACT The state of Alabama is using a number of federal
Colorado River Basin. Source: U.S. Department of the Interior, Bureau of Reclamation
 The Colorado River supports a quarter million jobs and produces $26 billion in economic output from recreational activities alone, drawing revenue from the 5.36 million adults who use the Colorado River
FY 2014 Per Capita Federal Spending on Major Grant Programs Curtis Smith, Nick Jacobs, and Trinity Tomsic
 Special Analysis 15-03, June 18, 2015 FY 2014 Per Capita Federal Spending on Major Grant Programs Curtis Smith, Nick Jacobs, and Trinity Tomsic 202-624-8577 ttomsic@ffis.org Summary Per capita federal
Estimated Economic Impacts of the Small Business Jobs and Tax Relief Act National Report
 Regional Economic Models, Inc. Estimated Economic Impacts of the Small Business Jobs and Tax Relief Act National Report Prepared by Frederick Treyz, CEO June 2012 The following is a summary of the Estimated
INFOBRIEF SRS TOP R&D-PERFORMING STATES DISPLAY DIVERSE R&D PATTERNS IN 2000
 INFOBRIEF SRS Science Resources Statistics National Science Foundation NSF 03-303 Directorate for Social, Behavioral, and Economic Sciences November 2002 TOP R&D-PERFORMING STATES DISPLAY DIVERSE R&D PATTERNS
Food Stamp Program State Options Report
 United States Department of Agriculture Food and Nutrition Service Fourth Edition Food Stamp Program State s Report September 2004 vember 2002 Program Development Division Program Design Branch Food Stamp
Fundraising Sources & Investment Decisions: How Capital Needs Impact Lending Activity at Clean Energy Finance Organizations
 Fundraising Sources & Investment Decisions: How Capital Needs Impact Lending Activity at Clean Energy Finance Organizations ACEEE Finance Forum, Chicago, IL Monday May 22, 2017 Discussion with founders
ENERGY STAR OVERVIEW OF 2005 ACHIEVEMENTS
 ENERGY STAR OVERVIEW OF 2005 ACHIEVEMENTS HOME PERFORMANCE WITH ENERGY STAR A COST-EFFECTIVE STRATEGY FOR IMPROVING EFFICIENCY IN EXISTING HOMES State Energy Offices, utilities, and energy efficiency advocates
Food Stamp Program State Options Report
 United States Department of Agriculture Food and Nutrition Service Fifth Edition Food Stamp Program State s Report August 2005 vember 2002 Program Development Division Food Stamp Program State s Report
DOMINION PEOPLES UNIVERSAL SERVICE AND ENERGY CONSERVATION PLAN
 DOMINION PEOPLES UNIVERSAL SERVICE AND ENERGY CONSERVATION PLAN 2009-2011 DOMINION PEOPLES UNIVERSAL SERVICE AND ENERGY CONSERVATION PLAN LIST OF ATTACHMENTS ATTACHMENT A ATTACHMENT B ATTACHMENT C ATTACHMENT
EVALUATION AND STATUS REPORT
 NEW YORK S SYSTEM BENEFITS CHARGE PROGRAMS EVALUATION AND STATUS REPORT QUARTERLY REPORT TO THE PUBLIC SERVICE COMMISSION QUARTER ENDING SEPTEMBER 30, 2009 FINAL REPORT NOVEMBER 2009 NEW YORK STATE ENERGY
FREQUENTLY ASKED QUESTIONS
 LOW INCOME WEATHERIZATION PROGRAM FREQUENTLY ASKED QUESTIONS Contents GENERAL QUESTIONS... 1 PROGRAM ELIGIBILITY... 2 PROGRAM PROCESS... 3 PROJECT MEASURES, TIMELINE, AND CONSTRUCTION... 4 ENERGY EFFICENCY
REGIONAL AND STATE EMPLOYMENT AND UNEMPLOYMENT MAY 2013
 For release 10:00 a.m. (EDT) Friday, June 21, USDL-13-1180 Technical information: Employment: Unemployment: Media contact: (202) 691-6559 sminfo@bls.gov www.bls.gov/sae (202) 691-6392 lausinfo@bls.gov
ENERGY UPGRADE CALIFORNIA
 ENERGY UPGRADE CALIFORNIA Cathy Fogel, Residential Energy Efficiency Program Analyst California Public Utilities Commission California and Energy: Agencies California Public Utilities Commission Regulates
Grants 101: An Introduction to Federal Grants for State and Local Governments
 Grants 101: An Introduction to Federal Grants for State and Local Governments Introduction FFIS has been in the federal grant reporting business for a long time about 30 years. The main thing we ve learned
Solar Energy Policy: Lessons and Opportunities. Ken Zweibel Director, The George Washington University Solar Institute
 Solar Energy Policy: Lessons and Opportunities Ken Zweibel Director, The George Washington University Solar Institute zweibel@gwu.edu Why? Solar meets important societal goals Price stability and climate
Recovery. Retrofit. Through OCTOBER 2009 MIDDLE CLASS TASK FORCE COUNCIL ON ENVIRONMENTAL QUALITY. Recovery Through Retrofit Page 0
 Recovery Through Retrofit OCTOBER 2009 MIDDLE CLASS TASK FORCE COUNCIL ON ENVIRONMENTAL QUALITY Recovery Through Retrofit Page 0 CONTENTS EXECUTIVE SUMMARY... 1 INTRODUCTION... 5 A STRATEGIC PLAN FOR RECOVERY
REGIONAL AND STATE EMPLOYMENT AND UNEMPLOYMENT JUNE 2010
 For release 10:00 a.m. (EDT) Tuesday, July 20, USDL-10-0992 Technical information: Employment: Unemployment: Media contact: (202) 691-6559 sminfo@bls.gov www.bls.gov/sae (202) 691-6392 lausinfo@bls.gov
Ross Borden, Director of Intergovernmental Affairs. Recommended Projects for EECBG Direct Allocation
 To: From: Mayor and Council Ross Borden, Director of Intergovernmental Affairs Date: June 3, 2009 Re: Recommended Projects for EECBG Direct Allocation SUMMARY As part of the American Recovery and Reinvestment
The Contribution of Office, Industrial and Retail Development and Construction to the U.S. Economy
 The Contribution of Office, Industrial and Retail Development and Construction to the U.S. Economy 2008 Edition Stephen S. Fuller, PhD Dwight Schar Faculty Chair and University Professor Director, Center
How North Carolina Compares
 How North Carolina Compares A Compendium of State Statistics January 2013 Prepared by the N.C. General Assembly Program Evaluation Division Program Evaluation Division North Carolina General Assembly Legislative
NCSHA 2012 Awards. Category: Special Achievement Entry Name: Expanding the Role of Energy Efficiency in Housing Programs
 NCSHA 2012 Awards Category: Special Achievement Entry Name: Improving a home s energy efficiency saves money for the homeowner and precious resources for our entire state, while training and empowering
National Study of Nonprofit-Government Contracts and Grants 2013: State Profiles
 www.urban.org Study of Nonprofit-Government Contracts and Grants 2013: State Profiles Sarah L. Pettijohn, Elizabeth T. Boris, and Maura R. Farrell Data presented for each state: Problems with Government
Rutgers Revenue Sources
 Rutgers Revenue Sources 31.2% Tuition and Fees 27.3% State Appropriations with Fringes 1.0% Endowment and Investments.5% Federal Appropriations 17.8% Federal, State, and Municipal Grants and Contracts
COMMON FUTURES: ENERGY EFFICIENCY, SUSTAINABILITY, ECONOMIC OPPORTUNITY AND AABE
 COMMON FUTURES: ENERGY EFFICIENCY, SUSTAINABILITY, ECONOMIC OPPORTUNITY AND AABE 35 th Annual Conference of The American Association of Blacks in Energy The Power of Energy: Winning Our Future Wendell
Issue Brief February 2015 Affordable Care Act Funding:
 CENTER FOR HEALTHCARE RESEARCH & TRANSFORMATION Issue Brief February 2015 Affordable Care Act Funding: An Analysis of Grant Programs under Health Care Reform FY2010- The Patient Protection and Affordable
Table 1 Elementary and Secondary Education. (in millions)
") Revised February 22, 2005 WHERE WOULD THE CUTS BE MADE UNDER THE PRESIDENT S BUDGET? Data Table 1 Elementary and Secondary Education Includes Education for the Disadvantaged, Impact Aid, School Improvement
Revised February 22, 2005 WHERE WOULD THE CUTS BE MADE UNDER THE PRESIDENT S BUDGET? Data Table 1 Elementary and Secondary Education Includes Education for the Disadvantaged, Impact Aid, School Improvement
Adult Education and Family Literacy Act: Major Statutory Provisions
 Adult Education and Family Literacy Act: Major Statutory Provisions Benjamin Collins Analyst in Labor Policy November 17, 2014 Congressional Research Service 7-5700 www.crs.gov R43789 Summary The Adult
Nicole Galloway, CPA
 Office of State Auditor Nicole Galloway, CPA Statewide Performance Indicators: A National Comparison Report No. 2017-050 June 2017 auditor.mo.gov Statewide Performance Indicators: A National Comparison
What are the steps? Incentives for energy efficient buildings
 Buildings energy efficiency sessions done in partnership with: Energy Efficiency Training Week What are the steps? Incentives for energy efficient buildings Buildings Session 7 Energy Efficiency Training
Title 35-A: PUBLIC UTILITIES
 Maine Revised Statutes Title 35-A: PUBLIC UTILITIES Chapter 97: EFFICIENCY MAINE TRUST ACT 10104. DUTIES 1. Generally. In accordance with this section and other applicable law, the trust administers and
Office of Weatherization and Intergovernmental Program (OWIP)
") Office of Weatherization and Intergovernmental Program (OWIP) Public Service of Colorado Ponnequin Wind Farm The Parker Ranch installation in Hawaii ACEE April 12, 2011 LeAnn M. Oliver Program Manager
Office of Weatherization and Intergovernmental Program (OWIP) Public Service of Colorado Ponnequin Wind Farm The Parker Ranch installation in Hawaii ACEE April 12, 2011 LeAnn M. Oliver Program Manager
Implementing Subsidy Reforms: lessons from international experience Maria Vagliasindi, Program Leader, GCC, World Bank SUBSIDY REFORM 11 1
 Implementing Subsidy Reforms: lessons from international experience Maria Vagliasindi, Program Leader, GCC, World Bank SUBSIDY REFORM 11 1 Energy subsidy cost are extremely high Energy subsidies in selected
5/28/2010. w w w. w a t t c h o i c e s. c o m. Agenda
 Agenda Thank you Act 129 and Duquesne Light s goals and plan and budget Rates Commercial Market Segments and goals Programs How do I get a rebate? Why I m happy to be a Duquesne Light customer today 3/11/2010
Page. II. TECHNICAL ASSISTANCE PROJECT DESCRIPTIONS.. 3 A. Introduction... B. Technical Assistance Areas.. 1. Rate Design Consumer Programs...
 TABLE OF CONTENTS I. INTRODUCTION............... Page 1 II. TECHNICAL ASSISTANCE PROJECT DESCRIPTIONS.. 3 A. Introduction.... 4 B. Technical Assistance Areas.. 5 1. Rate Design.... 5 2. Consumer Programs...
How North Carolina Compares
 How North Carolina Compares A Compendium of State Statistics March 2017 Prepared by the N.C. General Assembly Program Evaluation Division Preface The Program Evaluation Division of the North Carolina General
Multifamily Affordable Solar Housing. Semi Annual Progress Report. July 30, 2012
 Multifamily Affordable Solar Housing Semi Annual Progress Report July 30, 2012 Table of Contents 1. Executive Summary... 2 2. Background... 3 2.1. Incentive Types: Track 1 (A and B) and Track 2... 4 Table
Local Weatherization Guide
 Local Weatherization Guide Icicles Hanging From Your Roof? COVER Home Repair Weatherization Assistance Program Mobile Home Replacement Program Home Performance With ENERGY STAR Icicles indicate that warm
Finding Common Ground
 Finding Common Ground Presented for Panel 8: Climate Change and Energy Efficiency Policy ACEEE Summer Study on Energy Efficiency in Buildings By Janine Migden-Ostrander, Principal August 22, 2014 The Regulatory
( ) Page: 1/24. Committee on Subsidies and Countervailing Measures SUBSIDIES
 Page: 1/24. Committee on Subsidies and Countervailing Measures SUBSIDIES") 14 July 2017 (17-3798) Page: 1/24 Committee on Subsidies and Countervailing Measures Original: English SUBSIDIES NEW AND FULL NOTIFICATION PURSUANT TO ARTICLE XVI:1 OF THE GATT 1994 AND ARTICLE 25 OF THE
14 July 2017 (17-3798) Page: 1/24 Committee on Subsidies and Countervailing Measures Original: English SUBSIDIES NEW AND FULL NOTIFICATION PURSUANT TO ARTICLE XVI:1 OF THE GATT 1994 AND ARTICLE 25 OF THE
Local Government Energy Audit (LGEA) Program Program Guide. Fiscal Year 2018 (7/1/2017 through 6/30/2018)
 Program Program Guide. Fiscal Year 2018 (7/1/2017 through 6/30/2018)") Local Government Energy Audit (LGEA) Program Program Guide Fiscal Year 2018 (7/1/2017 through 6/30/2018) Table of Contents 1. Overall Program Description... 3 2. Target Market... 3 3. Links to Website...
Local Government Energy Audit (LGEA) Program Program Guide Fiscal Year 2018 (7/1/2017 through 6/30/2018) Table of Contents 1. Overall Program Description... 3 2. Target Market... 3 3. Links to Website...
California s Distributed Solar Energy Program. Working to Transform the Market for Solar PV and Thermal
 Click to Edit California s Distributed Solar Energy Program Working to Transform the Market for Solar PV and Thermal California Public Utilities Commission November 9, 2010 Damon Franz, Energy Division
FEDERAL SPENDING AND REVENUES IN ALASKA
 FEDERAL SPENDING AND REVENUES IN ALASKA Prepared by Scott Goldsmith and Eric Larson November 20, 2003 Institute of Social and Economic Research University of Alaska Anchorage 3211 Providence Drive Anchorage,
CLP CLIMATE ACTION BOND
 CLP CLIMATE ACTION BOND DNV GL 2ND PARTY OPINION Scope and Objectives CLP Holdings Limited (CLP) (henceforth referred to as CLP ) is one of the largest investor-owned power businesses with presence in
Family and Community Support Services (FCSS) Program Review
 Program Review") Family and Community Support Services (FCSS) Program Review Judy Smith, Director Community Investment Community Services Department City of Edmonton 1100, CN Tower, 10004 104 Avenue Edmonton, Alberta,
Family and Community Support Services (FCSS) Program Review Judy Smith, Director Community Investment Community Services Department City of Edmonton 1100, CN Tower, 10004 104 Avenue Edmonton, Alberta,
Table of Contents Introduction... 2
 Snapshot Missouri: A National Comparison Report 9-212 Table of Contents Introduction... 2 Economy 3 Median Household Income 21... 4 Unemployment Rate 211... 5 Job Growth Rate 29.. 6 Cigarette Tax per Pack
Optimization Annual Report
 Energy Optimization 212 Annual Report Executive Summary 1 Commercial & Industrial (C&I) Programs.... 2 Commercial & Industrial Prescriptive Program.... 6 1 EO Program Results Goals and Targets.... 6 Spending
Removing Disincentives: Efforts to Promote Electric Utility Efficiency
 Removing Disincentives: Efforts to Promote Electric Utility Efficiency By: Kenneth J. Gish, Jr. Smart grid technology refers to the integration of digital information technology with the electric grid.
Alignment: Bringing resources, tax credits and messages together to catalyze change
 Alignment: Bringing resources, tax credits and messages together to catalyze change ACEEE 2007 Market Transformation Symposium Rick Gerardi Director, Residential Programs NYSERDA EPAct Consumer Tax Incentives:
Child & Adult Care Food Program: Participation Trends 2017
 Child & Adult Care Food Program: Participation Trends 2017 February 2018 About FRAC The Food Research and Action Center (FRAC) is the leading national organization working for more effective public and
Multifamily Affordable Solar Housing. Semi Annual Progress Report. July 31, 2013
 Multifamily Affordable Solar Housing Semi Annual Progress Report July 31, 2013 Table of Contents 1. Executive Summary... 2 2. Background... 3 2.1. Incentive Types: Track 1 (A and B) and Track 2... 4 Table
SNC BRIEF. Safety Net Clinics of Greater Kansas City EXECUTIVE SUMMARY CHALLENGES FACING SAFETY NET PROVIDERS TOP ISSUES:
 EXECUTIVE SUMMARY The Safety Net is a collection of health care providers and institutes that serve the uninsured and underinsured. Safety Net providers come in a variety of forms, including free health
US SERVICES TRADE AND OFF-SHORING
 US SERVICES TRADE AND OFF-SHORING Martin Neil Baily With the Assistance of Matt Johnson The Brookings Institution Presentation at Princeton s CEPS Symposium on Off-Shoring November 16-17, 2007 The Broader
THE WHITE HOUSE. The State of the Union: President Obama s Plan to Win the Future
 THE WHITE HOUSE The State of the Union: President Obama s Plan to Win the Future In his State of the Union, President Obama spoke of the need to maintain America s leadership in a rapidly changing world
The Economic Impacts of the New Economy Initiative in Southeast Michigan
 pwc.com/us/nes The Economic Impacts of the New Economy Initiative in Southeast Michigan The Economic Impacts of the New Economy Initiative in Southeast Michigan June 2016 Prepared for The Community Foundation
National Grid. The Narragansett Electric Company INVESTIGATION AS TO THE PROPRIETY OF PROPOSED TARIFF CHANGES. Testimony and Schedules of:
 National Grid The Narragansett Electric Company INVESTIGATION AS TO THE PROPRIETY OF PROPOSED TARIFF CHANGES Testimony and Schedules of: Alfred P. Morrissey John E. Walter Carmen Fields Book 8 of 9 June
Washburn University. Faculty Salary Analysis
 Washburn University Faculty Salary Analysis 2012-13 Office of Institutional Research Washburn University May 15, 2013 Washburn University Faculty Salary Analysis 2012-13 This report provides an overview
Engineering Vacancies Report
 Engineering Vacancies Report 2017 Update February 2018 Author: Mark Stewart Engineers Australia 11 National Circuit, Barton ACT 2600 Tel: 02 6270 6555 Email: publicaffairs@engineersaustralia.org.au www.engineersaustralia.org.au
Business Incentives and Economic Development Expenditures: An Overview of Delaware s Program Investments and Outcomes Summary
 Business Incentives and Economic Development Expenditures: An Overview of Delaware s Program Investments and Outcomes Summary Across the country, state economic development incentives have evolved into
Nevada Energy Perspectives
 Nevada Energy Perspectives Governor s Office of Energy www.energy.nv.gov Paul A. Thomsen Director @PaulThomsen1 @NevGoe 1 Department Overview The mission of the Governor's Office of Energy is to ensure
Commercial & Industrial (C&I) Local Government Energy Audit (LGEA) Program Program Guide. Fiscal Year 2017 (7/1/2016 through 6/30/2017)
 Local Government Energy Audit (LGEA) Program Program Guide. Fiscal Year 2017 (7/1/2016 through 6/30/2017)") Commercial & Industrial (C&I) Local Government Energy Audit (LGEA) Program Program Guide Fiscal Year 2017 (7/1/2016 through 6/30/2017) Table of Contents 1. Overall Program Description... 3 2. Target Market...
Commercial & Industrial (C&I) Local Government Energy Audit (LGEA) Program Program Guide Fiscal Year 2017 (7/1/2016 through 6/30/2017) Table of Contents 1. Overall Program Description... 3 2. Target Market...
November 24, First Street NE, Suite 510 Washington, DC 20002
 820 First Street NE, Suite 510 Washington, DC 20002 Tel: 202-408-1080 Fax: 202-408-1056 center@cbpp.org www.cbpp.org November 24, 2008 TANF BENEFITS ARE LOW AND HAVE NOT KEPT PACE WITH INFLATION But Most
PROMOTIONAL PRACTICES SCHEDULE PRO
 P.S.C. Mo. No. 5 Sec. 4 4 th Revised Sheet No. 8 Canceling P.S.C. Mo. No. 5 Sec. 4 3 rd Revised Sheet No. 8 A. Dealer Cooperative Advertising The Company may develop and implement various cooperative advertising
Lean & Green Michigan and Property Assessed Clean Energy (PACE)
") Lean & Green Michigan and Property Assessed Clean Energy (PACE) A Financing Breakthrough End Energy Waste with Positive Cash Flow Cory Connolly cory@levinenergypartners.com Property Assessed Clean Energy
Lean & Green Michigan and Property Assessed Clean Energy (PACE) A Financing Breakthrough End Energy Waste with Positive Cash Flow Cory Connolly cory@levinenergypartners.com Property Assessed Clean Energy
Project Application Webinar
 Green Infrastructure Phase II Emerging Renewable Power Program Project Application Webinar March 9, 2018 2 Contents Background Applicant Guide Overview: Eligibility and funding Application process Project
Federal and State Incentives for Wind Development
 Chapter 12 Federal and State Incentives for Wind Development The federal government and many state governments now offer various incentives for wind energy development. Many of these incentives are specifically