Utah Population
|
|
|
- Charlotte Lane
- 5 years ago
- Views:
Transcription
1
2
3 Millions Utah Population '00 '01 '02 '03 '04 '05 '06 '07 '08 '09 '10 '11 '12
4 Millions Utah Population M M '00 '01 '02 '03 '04 '05 '06 '07 '08 '09 '10 '11 '12
5 Rhode Island Vermont Ohio West Virginia Illinois Michigan Maine New Mexico Pennsylvania Missouri New Hampshire Mississippi Kentucky Wisconsin Connecticut Indiana Arkansas Iowa Alabama New Jersey Kansas New York Louisiana Oklahoma Minnesota Idaho Montana Nebraska Oregon Tennessee Massachusetts California South Carolina Maryland Washington North Carolina Georgia Arizona Delaware Virginia South Dakota Alaska Hawaii Nevada Utah Florida Colorado Wyoming Texas North Dakota Dist. of Columbia Population Growth State Comparisons % 2.0% 1.5% 1.4% 1.0% 0.5% United States: 0.8% 0.0% -0.5%
6 Thousands Utah Employment ,400 1,200 1,
7 Alaska Dist. of Columbia Alabama Hawaii Oklahoma Rhode Island Ohio Pennsylvania West Virginia Connecticut Virginia Arkansas Illinois Maine New Hampshire New Mexico Iowa Kentucky Kansas Missouri Nebraska Wyoming California New York Tennessee Montana Vermont Indiana Michigan Oregon Delaware Florida Maryland Massachusetts Mississippi North Carolina South Carolina Wisconsin Louisiana South Dakota Nevada Arizona New Jersey Georgia Washington Colorado Minnesota Texas Idaho Utah North Dakota Employment Growth State Comparisons % 3.0% 2.5% 2.0% 1.5% 1.0% 0.5% 0.0% -0.5% -1.0% United States: 1.7% 2.7%
8 Utah Unemployment Rate % 8.0% 6.0% 4.0% 4.7% 2.0% 0.0%
9 North Dakota South Dakota Nebraska Hawaii Vermont Wyoming Utah Iowa New Hampshire Minnesota Montana Oklahoma Virginia Kansas Alabama West Virginia Texas Alaska Wisconsin Idaho New Mexico Colorado Florida Louisiana Maine Maryland Washington Massachusetts Missouri Delaware Ohio Arkansas New York Pennsylvania Connecticut Indiana Oregon South Carolina Arizona Kentucky Mississippi New Jersey Tennessee Dist. of Columbia Georgia North Carolina California Michigan Rhode Island Illinois Nevada Unemployment Rate State Comparisons August % 8.0% United States: 7.3% 6.0% 4.0% 4.7% 2.0% 0.0%
10 Billions Utah Personal Income $120 $100 $80 $60 $40 $20 $0 '00 '01 '02 '03 '04 '05 '06 '07 '08 '09 '10 '11 '12
11 Billions Utah Personal Income $120 $100 $80 $90.6 B $98.8 B $60 $40 $20 $0 '00 '01 '02 '03 '04 '05 '06 '07 '08 '09 '10 '11 '12
12 Mississippi Idaho South Carolina West Virginia Utah Arkansas Kentucky New Mexico Alabama Arizona Georgia Indiana North Carolina Nevada Montana Michigan Tennessee Oregon Oklahoma Missouri Ohio Louisiana Maine Florida Wisconsin Texas Kansas Delaware Iowa Vermont Nebraska Pennsylvania South Dakota Hawaii Illinois California Rhode Island Colorado Washington Minnesota Alaska New Hampshire Virginia Wyoming North Dakota Maryland New York New Jersey Massachusetts Connecticut Dist. of Colombia Thousands Personal Income Per Capita State Comparisons 2012 $80 $70 $60 $50 $40 $30 $20 $10 $0 $34,601 United States: $42,693


13 Utah heads our list of the Best States for Business for a third straight year. Utah s economy has expanded 2.3% annually since 2006 fifth best in the U.S versus 0.5% for the nation as a whole.
14 Among the strongest economies in the United States The most diversified economy of its size in the United States Strong cluster development and commercialization of research, including via universities High rates of population growth, but more importantly, population retention
15 5.96M State of Utah Projected Population (2060) +3.20M State of Utah Projected Population Growth (2060)
16 $130.5B State of Utah Gross Domestic Product (2012) +3.4% State of Utah Gross Domestic Product Growth Rate (2012)
17 2,855,287 State of Utah Resident Population (2012)
18 1,292,000 State of Utah Employment Base (July 2012) +3.2% State of Utah Employment Growth Rate (July 2012)
19 $98.8B State of Utah Total Personal Income (2012)
20
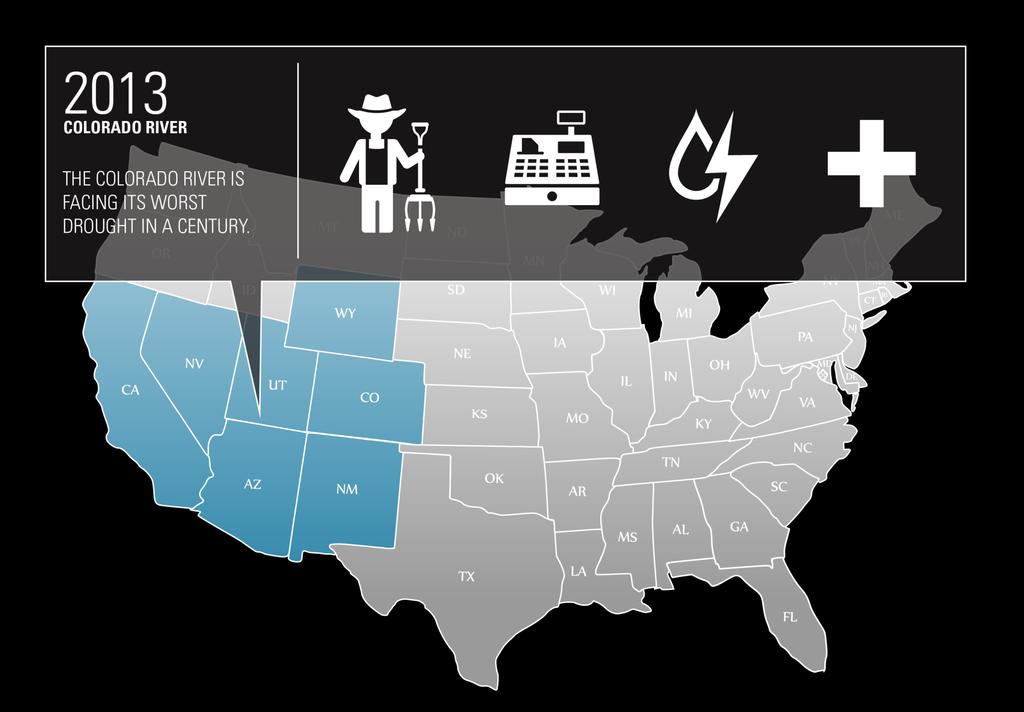
21 Conflict is not Likely, it is Imminent

22 In a recent volley between Phoenix and Los Angeles, newspapers in those two arid cities pointed fingers at each other over who has the least sustainable water supply.


23 the Supreme Court ruled Thursday that thirsty Texas counties can t run a pipeline into Oklahoma for more drops to drink.


24 At issue is a 2012 order to eventually pump some 84,000 acre-feet of groundwater a year from four rural valleys in Lincoln and White Pine counties.
25
26
27
28


29

30 Water Shortage Impacts
31
32
33
34
35
36
37
38
39
40
41
42
43
44
45
46 The new estimate for municipal and industrial water demand was increased to 2,553,000 ac-ft. However, water planners estimated that local suppliers would still be able to meet this larger future demand and maintain a reliable supply surplus, if a variety of strategies were employed.

47 The new estimate for municipal and industrial water demand was increased to 2,553,000 ac-ft. However, water planners estimated that local suppliers would still be able to meet this larger future demand and maintain a reliable supply surplus, if a variety of strategies were employed.

48 Proposed Pipeline Projects in the West
49 Perception = Reality Uncertainty abounds - climate change, population shifts, reliability of existing resources The water manager s long view Strategies are not mutually exclusive, conservation + water resource development How much risk are you willing to accept?
50
51
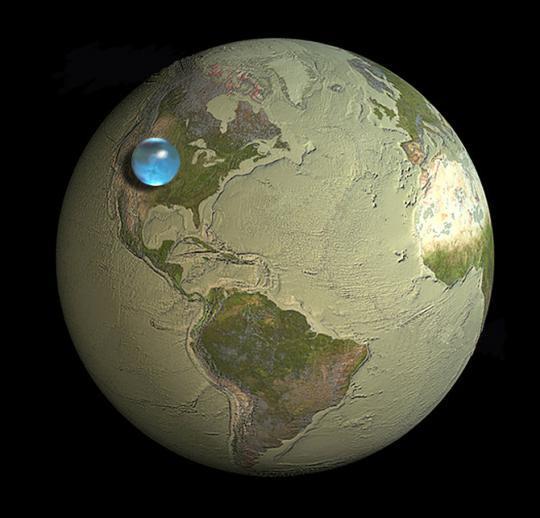
52 Renewable Internal Freshwater Supply Per Capita (in Cubic Meters) Latin America & Caribbean 22,364 North America 16,378 United States Europe & Central Asia World East Asia & Pacific Sub-Saharan Africa 9,044 7,922 6,123 4,617 4,422 South Asia Middle East & North Africa 1,
53 Annual Freshwater Withdrawals (% of Internal Resources) Middle East & North Africa 133.3% South Asia 51.6% United States East Asia & Pacific North America World Europe & Central Asia Sub-Saharan Africa Latin America & Caribbean 17.0% 10.9% 9.3% 9.2% 7.7% 3.2% 2.0%
54 Water Productivity (in GDP Per Cubic Meter of Freshwater) Europe & Central Asia $32 United States North America $28 $28 World Latin America & Caribbean East Asia & Pacific $11 $14 $14 Middle East & North Africa Sub-Saharan Africa $8 $7 South Asia $2
55 Water Productivity Top 20 (in GDP Per Cubic Meter of Freshwater) $1,000 $900 $800 $700 $600 $500 $400 $300 $200 $100 $0 $938
56 Water Productivity (in GDP Per Cubic Meter of Freshwater*) $27 $28 $34 $14 $15 World Utah California U.S. Nevada *Withdrawals include saline sources in some cases
57 Billion Gallons Per Day Millions Water Use in the United States * Total Withdrawals Population *Most current data available
58 Billion Gallons Per Day Millions Water Use in the United States * Public Supply Irrigation Thermoelectric Power Population Other *Most current data available
59 Per Capita Water Use (in Gallons) * 1,194 1,463 1,506 1,600 1,797 1,941 1,873 1,638 1,601 1,494 1,448 1,363 *Most current data available
60 Dist. of Columbia Rhode Island Maine Oklahoma Massachusetts Georgia South Dakota Pennsylvania Minnesota New York Vermont New Jersey Washington Nevada Ohio Mississippi New Hampshire Florida Kentucky Arizona Connecticut Iowa Michigan Texas Illinois Delaware California Maryland Kansas Virginia Hawaii North Carolina Indiana Missouri Wisconsin Alaska New Mexico Tennessee South Carolina Oregon Utah North Dakota Alabama Louisiana West Virginia Colorado Arkansas Nebraska Wyoming Montana Idaho Per Capita Water Use (in Gallons) State Comparisons 2005* 14,000 12,000 10,000 8,000 6,000 4,000 2,000 0 United States: 1,363 2,008 *Most current data available
61 California Water Use By Category Other 3.8% Public Supply 15.3% Irrigation 53.3% Thermoelectric Power 27.6%
62 Nevada Water Use By Category Public Supply 28.4% Other 7.0% Irrigation 63.1% Thermoelectric Power 1.5%
63 Utah Water Use By Category Other 8.8% Thermoelectric Power 1.2% Public Supply 11.9% Irrigation 78.2%
64 Utah Water Use By Category Public Supply 11.9% Other 8.8% Irrigation 78.2% Thermoelectric Power 1.2%
65 Water Productivity (Excluding Irrigation) (in GDP Per Cubic Meter of Freshwater*) $92 $57 $70 $34 United States Average *Withdrawals include saline sources in some cases California Utah Nevada
66 5.7 MAF Total Water Withdrawals (All Purposes), State of Utah, 2005 (Latest Available From the USGS)
67 Utah Water Use (in Acre-Feet Per Year) Agricultural Municipal & Industrial Total Diverted 3,743,000 1,001,000 4,744,000 Consumed 2,706, ,000 3,116,000 Returned to the Environment 1,037, ,000 1,628,000
68
69 Water Resource Development Timeline 1948 Upper Colorado River Compact allocated Upper Basin water based on percentages (Utah received 23 percent) Jordan Valley Water Conservancy District became first customer for Central Utah Project, which provided funds necessary for construction to begin Flaming Gorge and Glen Canyon Dams built, providing water storage for droughts and emergencies Quail Creek Dam and Sand Hollow Reservoir become early examples of state funded water development projects Bear River Development Act passed Lake Powell Pipeline Development Act passed The Utah Water Conservancy District Act was passed, allowing government entities to build reservoir projects and provide water supply protection Weber Basin Water Conservancy District created, allowing Bureau of Reclamation to construct Weber Basin Project Colorado River States Project passed, allowing for dams in Upper Basin of Colorado River and funding for Central Utah Project Central Utah Water Conservancy District formed Central Utah Project Completion Act approved, marking the end of federal funding for water development projects. Funding now provided by the state The Legislative Task Force formed to focus on water development throughout the state.
70 $20 B Estimated Cost of Utah Water Infrastructure Projects
71 Water Projects $1 Billion + By Sponsor 1) Weber Basin WCD (Davis County) - $1.5 Billion 2) Weber Basin WCD (Weber County) - $1.5 Billion 3) Bear River Development - $1.5 Billion 4) Washington County WCD - $1.0 Billion 5) Lake Powell Pipeline - $1.0 Billion
72 Millions Utah Water Infrastructure Projects Projected Annual Funding Needs $1,400 $1,200 $1,000 $800 $600 $400 $200 Projected Funding Covered by State Funding Agencies $0
73 Conservation, Conservation, Conservation
74 The Goal: Reduce per capita water use by 25% by 2025
75

76 What Does Nearly $20 Billion in Water Projects Mean for the State of Utah?

77 One-Time Construction Impacts Preliminary Impacts Jobs: ±198,000 Wages: ±$8.4 Billion Output: ±$29.7 Billion
78 Economic Growth Potential Population: 3.2 Million Households: 1,030,000 GSP: $183 Billion Income: $107 Billion Business: 90,000

79 Water Resource Diversity
80 1,292,000 Total Utah Employees Currently Supported by Water Resource Stability
81 83,694 Total Utah Businesses Currently Supported by Water Resource Stability
82 Growth Interruption Mild (1% to 2%) = $1.3B to $2.6B Moderate (3% to 5%) =$3.9B to $6.5B Severe (6% to 10%) = $7.8B to $13.1B Annually
83
84 Water resources are an essential element of economic development and diversification. Ensuring water resources is critical to protecting the state s economy. A comprehensive, master-planned approach is necessary and appropriate.
85
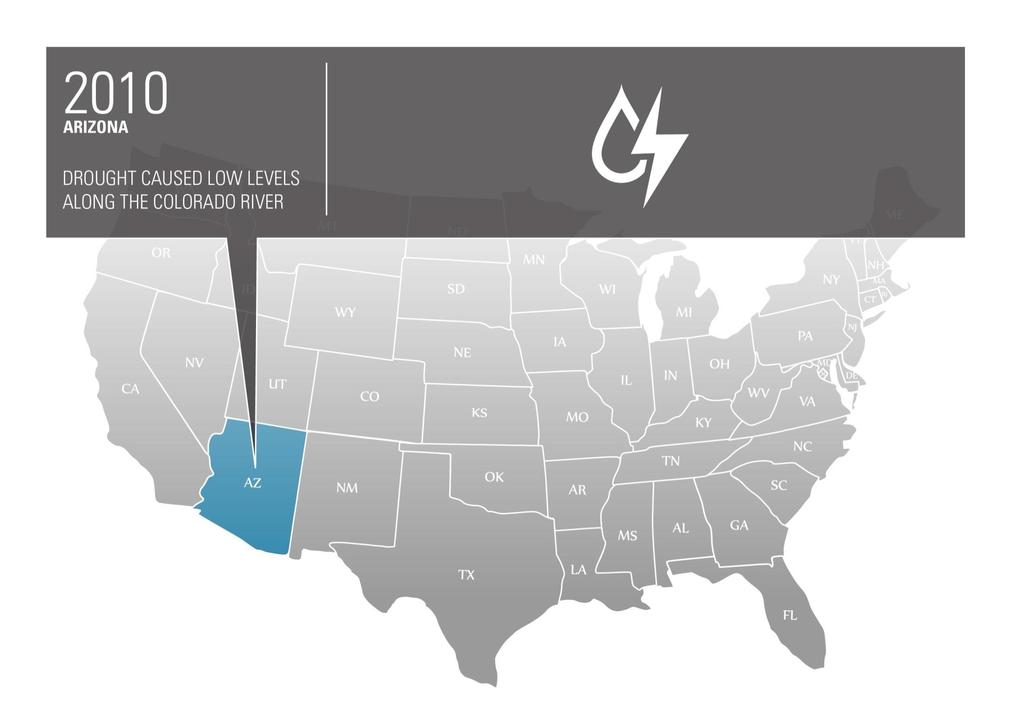
Colorado River Basin. Source: U.S. Department of the Interior, Bureau of Reclamation
 The Colorado River supports a quarter million jobs and produces $26 billion in economic output from recreational activities alone, drawing revenue from the 5.36 million adults who use the Colorado River
 3+ 3+ N = 155, 442 3+ R 2 =.32 < < < 3+ N = 149, 685 3+ R 2 =.27 < < < 3+ N = 99, 752 3+ R 2 =.4 < < < 3+ N = 98, 887 3+ R 2 =.6 < < < 3+ N = 52, 624 3+ R 2 =.28 < < < 3+ N = 36, 281 3+ R 2 =.5 < < < 7+
TABLE 3c: Congressional Districts with Number and Percent of Hispanics* Living in Hard-to-Count (HTC) Census Tracts**
 Census Tracts**") living Alaska 00 47,808 21,213 44.4 Alabama 01 20,661 3,288 15.9 Alabama 02 23,949 6,614 27.6 Alabama 03 20,225 3,247 16.1 Alabama 04 41,412 7,933 19.2 Alabama 05 34,388 11,863 34.5 Alabama 06 34,849 4,074
living Alaska 00 47,808 21,213 44.4 Alabama 01 20,661 3,288 15.9 Alabama 02 23,949 6,614 27.6 Alabama 03 20,225 3,247 16.1 Alabama 04 41,412 7,933 19.2 Alabama 05 34,388 11,863 34.5 Alabama 06 34,849 4,074
TABLE 3b: Congressional Districts Ranked by Percent of Hispanics* Living in Hard-to- Count (HTC) Census Tracts**
 Census Tracts**") Rank State District Count (HTC) 1 New York 05 150,499 141,567 94.1 2 New York 08 133,453 109,629 82.1 3 Massachusetts 07 158,518 120,827 76.2 4 Michigan 13 47,921 36,145 75.4 5 Illinois 04 508,677 379,527
Rank State District Count (HTC) 1 New York 05 150,499 141,567 94.1 2 New York 08 133,453 109,629 82.1 3 Massachusetts 07 158,518 120,827 76.2 4 Michigan 13 47,921 36,145 75.4 5 Illinois 04 508,677 379,527
The American Legion NATIONAL MEMBERSHIP RECORD
 The American Legion NATIONAL MEMBERSHIP RECORD www.legion.org 2016 The American Legion NATIONAL MEMBERSHIP RECORD 1920-1929 Department 1920 1921 1922 1923 1924 1925 1926 1927 1928 1929 Alabama 4,474 3,246
Unemployment Rate (%) Rank State. Unemployment
 Rank State. Unemployment") States Ranked by February 2018 Unemployment Rate Seasonally Adjusted Unemployment Unemployment Unemployment 1 Hawaii 2.1 19 Alabama 3.7 33 Ohio 4.5 2 New Hampshire 2.6 19 Missouri 3.7 33 Rhode Island 4.5
States Ranked by February 2018 Unemployment Rate Seasonally Adjusted Unemployment Unemployment Unemployment 1 Hawaii 2.1 19 Alabama 3.7 33 Ohio 4.5 2 New Hampshire 2.6 19 Missouri 3.7 33 Rhode Island 4.5
Unemployment Rate (%) Rank State. Unemployment
 Rank State. Unemployment") States Ranked by November 2015 Unemployment Rate Seasonally Adjusted Unemployment Unemployment Unemployment 1 North Dakota 2.7 19 Indiana 4.4 37 Georgia 5.6 2 Nebraska 2.9 20 Ohio 4.5 37 Tennessee 5.6
States Ranked by November 2015 Unemployment Rate Seasonally Adjusted Unemployment Unemployment Unemployment 1 North Dakota 2.7 19 Indiana 4.4 37 Georgia 5.6 2 Nebraska 2.9 20 Ohio 4.5 37 Tennessee 5.6
Unemployment Rate (%) Rank State. Unemployment
 Rank State. Unemployment") States Ranked by April 2017 Unemployment Rate Seasonally Adjusted Unemployment Unemployment Unemployment 1 Colorado 2.3 17 Virginia 3.8 37 California 4.8 2 Hawaii 2.7 20 Massachusetts 3.9 37 West Virginia
States Ranked by April 2017 Unemployment Rate Seasonally Adjusted Unemployment Unemployment Unemployment 1 Colorado 2.3 17 Virginia 3.8 37 California 4.8 2 Hawaii 2.7 20 Massachusetts 3.9 37 West Virginia
Unemployment Rate (%) Rank State. Unemployment
 Rank State. Unemployment") States Ranked by August 2017 Unemployment Rate Seasonally Adjusted Unemployment Unemployment Unemployment 1 North Dakota 2.3 18 Maryland 3.9 36 New York 4.8 2 Colorado 2.4 18 Michigan 3.9 38 Delaware 4.9
States Ranked by August 2017 Unemployment Rate Seasonally Adjusted Unemployment Unemployment Unemployment 1 North Dakota 2.3 18 Maryland 3.9 36 New York 4.8 2 Colorado 2.4 18 Michigan 3.9 38 Delaware 4.9
Unemployment Rate (%) Rank State. Unemployment
 Rank State. Unemployment") States Ranked by March 2016 Unemployment Rate Seasonally Adjusted Unemployment Unemployment Unemployment 1 South Dakota 2.5 19 Delaware 4.4 37 Georgia 5.5 2 New Hampshire 2.6 19 Massachusetts 4.4 37 North
States Ranked by March 2016 Unemployment Rate Seasonally Adjusted Unemployment Unemployment Unemployment 1 South Dakota 2.5 19 Delaware 4.4 37 Georgia 5.5 2 New Hampshire 2.6 19 Massachusetts 4.4 37 North
Unemployment Rate (%) Rank State. Unemployment
 Rank State. Unemployment") States Ranked by September 2017 Unemployment Rate Seasonally Adjusted Unemployment Unemployment Unemployment 1 North Dakota 2.4 17 Indiana 3.8 36 New Jersey 4.7 2 Colorado 2.5 17 Kansas 3.8 38 Pennsylvania
States Ranked by September 2017 Unemployment Rate Seasonally Adjusted Unemployment Unemployment Unemployment 1 North Dakota 2.4 17 Indiana 3.8 36 New Jersey 4.7 2 Colorado 2.5 17 Kansas 3.8 38 Pennsylvania
Unemployment Rate (%) Rank State. Unemployment
 Rank State. Unemployment") States Ranked by December 2017 Unemployment Rate Seasonally Adjusted Unemployment Unemployment Unemployment 1 Hawaii 2.0 16 South Dakota 3.5 37 Connecticut 4.6 2 New Hampshire 2.6 20 Arkansas 3.7 37 Delaware
States Ranked by December 2017 Unemployment Rate Seasonally Adjusted Unemployment Unemployment Unemployment 1 Hawaii 2.0 16 South Dakota 3.5 37 Connecticut 4.6 2 New Hampshire 2.6 20 Arkansas 3.7 37 Delaware
Unemployment Rate (%) Rank State. Unemployment
 Rank State. Unemployment") States Ranked by September 2015 Unemployment Rate Seasonally Adjusted Unemployment Unemployment Unemployment 1 North Dakota 2.8 17 Oklahoma 4.4 37 South Carolina 5.7 2 Nebraska 2.9 20 Indiana 4.5 37 Tennessee
States Ranked by September 2015 Unemployment Rate Seasonally Adjusted Unemployment Unemployment Unemployment 1 North Dakota 2.8 17 Oklahoma 4.4 37 South Carolina 5.7 2 Nebraska 2.9 20 Indiana 4.5 37 Tennessee
Unemployment Rate (%) Rank State. Unemployment
 Rank State. Unemployment") States Ranked by November 2014 Unemployment Rate Seasonally Adjusted Unemployment Unemployment Unemployment 1 North Dakota 2.7 19 Pennsylvania 5.1 35 New Mexico 6.4 2 Nebraska 3.1 20 Wisconsin 5.2 38 Connecticut
States Ranked by November 2014 Unemployment Rate Seasonally Adjusted Unemployment Unemployment Unemployment 1 North Dakota 2.7 19 Pennsylvania 5.1 35 New Mexico 6.4 2 Nebraska 3.1 20 Wisconsin 5.2 38 Connecticut
Unemployment Rate (%) Rank State. Unemployment
 Rank State. Unemployment") States Ranked by July 2018 Unemployment Rate Seasonally Adjusted Unemployment Unemployment Unemployment 1 Hawaii 2.1 19 Massachusetts 3.6 37 Kentucky 4.3 2 Iowa 2.6 19 South Carolina 3.6 37 Maryland 4.3
States Ranked by July 2018 Unemployment Rate Seasonally Adjusted Unemployment Unemployment Unemployment 1 Hawaii 2.1 19 Massachusetts 3.6 37 Kentucky 4.3 2 Iowa 2.6 19 South Carolina 3.6 37 Maryland 4.3
Interstate Pay Differential
 Interstate Pay Differential APPENDIX IV Adjustments for differences in interstate pay in various locations are computed using the state average weekly pay. This appendix provides a table for the second
Estimated Economic Impacts of the Small Business Jobs and Tax Relief Act National Report
 Regional Economic Models, Inc. Estimated Economic Impacts of the Small Business Jobs and Tax Relief Act National Report Prepared by Frederick Treyz, CEO June 2012 The following is a summary of the Estimated
5 x 7 Notecards $1.50 with Envelopes - MOQ - 12
 5 x 7 Notecards $1.50 with Envelopes - MOQ - 12 Magnets 2½ 3½ Magnet $1.75 - MOQ - 5 - Add $0.25 for packaging Die Cut Acrylic Magnet $2.00 - MOQ - 24 - Add $0.25 for packaging 2535-22225 California AM-22225
Index of religiosity, by state
 Index of religiosity, by state Low Medium High Total United States 19 26 55=100 Alabama 7 16 77 Alaska 28 27 45 Arizona 21 26 53 Arkansas 12 19 70 California 24 27 49 Colorado 24 29 47 Connecticut 25 32
Rutgers Revenue Sources
 Rutgers Revenue Sources 31.2% Tuition and Fees 27.3% State Appropriations with Fringes 1.0% Endowment and Investments.5% Federal Appropriations 17.8% Federal, State, and Municipal Grants and Contracts
2015 State Hospice Report 2013 Medicare Information 1/1/15
 2015 State Hospice Report 2013 Medicare Information 1/1/15 www.hospiceanalytics.com 2 2013 Demographics & Hospice Utilization National Population 316,022,508 Total Deaths 2,529,792 Medicare Beneficiaries
MAP 1: Seriously Delinquent Rate by State for Q3, 2008
 MAP 1: Seriously Delinquent Rate by State for Q3, 2008 Seriously Delinquent Rate Greater than 6.93% 5.18% 6.93% 0 5.17% Source: MBA s National Deliquency Survey MAP 2: Foreclosure Inventory Rate by State
Current Medicare Advantage Enrollment Penetration: State and County-Level Tabulations
 Current Advantage Enrollment : State and County-Level Tabulations 5 Slide Series, Volume 40 September 2016 Summary of Tabulations and Findings As of September 2016, 17.9 million of the nation s 56.1 million
Voter Registration and Absentee Ballot Deadlines by State 2018 General Election: Tuesday, November 6. Saturday, Oct 27 (postal ballot)
") Voter Registration and Absentee Ballot Deadlines by State 2018 General Election: All dates in 2018 unless otherwise noted STATE REG DEADLINE ABSENTEE BALLOT REQUEST DEADLINE Alabama November 1 ABSENTEE
Voter Registration and Absentee Ballot Deadlines by State 2018 General Election: All dates in 2018 unless otherwise noted STATE REG DEADLINE ABSENTEE BALLOT REQUEST DEADLINE Alabama November 1 ABSENTEE
HOME HEALTH AIDE TRAINING REQUIREMENTS, DECEMBER 2016
 BACKGROUND HOME HEALTH AIDE TRAINING REQUIREMENTS, DECEMBER 2016 Federal legislation (42 CFR 484.36) requires that Medicare-certified home health agencies employ home health aides who are trained and evaluated
STATE INDUSTRY ASSOCIATIONS $ - LISTED NEXT PAGE. TOTAL $ 88,000 * for each contribution of $500 for Board Meeting sponsorship
 Exhibit D -- TRIP 2017 FUNDING SOURCES -- February 3, 2017 CORPORATE $ 12,000 Construction Companies $ 5,500 Consulting Engineers Equipment Distributors Manufacturer/Supplier/Producer 6,500 Surety Bond
2016 INCOME EARNED BY STATE INFORMATION
 BY STATE INFORMATION This information is being provided to assist in your 2016 tax preparations. The information is also mailed to applicable Columbia fund non-corporate shareholders with their year-end
Child & Adult Care Food Program: Participation Trends 2016
 Child & Adult Care Food Program: Participation Trends 2016 March 2017 About FRAC The Food Research and Action Center (FRAC) is the leading national organization working for more effective public and private
Child & Adult Care Food Program: Participation Trends 2017
 Child & Adult Care Food Program: Participation Trends 2017 February 2018 About FRAC The Food Research and Action Center (FRAC) is the leading national organization working for more effective public and
PRESS RELEASE Media Contact: Joseph Stefko, Director of Public Finance, ;
 PRESS RELEASE Media Contact: Joseph Stefko, Director of Public Finance, 585.327.7075; jstefko@cgr.org Highest Paid State Workers in New Jersey & New York in 2010; Lowest Paid in Dakotas and West Virginia
Sentinel Event Data. General Information Copyright, The Joint Commission
 Sentinel Event Data General Information 1995 2015 Data Limitations The reporting of most sentinel events to The Joint Commission is voluntary and represents only a small proportion of actual events. Therefore,
Child & Adult Care Food Program: Participation Trends 2014
 Child & Adult Care Food Program: Participation Trends 2014 1200 18th St NW Suite 400 Washington, DC 20036 (202) 986-2200 / www.frac.org February 2016 About FRAC The Food Research and Action Center (FRAC)
FY 2014 Per Capita Federal Spending on Major Grant Programs Curtis Smith, Nick Jacobs, and Trinity Tomsic
 Special Analysis 15-03, June 18, 2015 FY 2014 Per Capita Federal Spending on Major Grant Programs Curtis Smith, Nick Jacobs, and Trinity Tomsic 202-624-8577 ttomsic@ffis.org Summary Per capita federal
FORTIETH TRIENNIAL ASSEMBLY
 FORTIETH TRIENNIAL ASSEMBLY MOST PUISSANT GENERAL GRAND MASTER GENERAL GRAND COUNCIL OF CRYPTIC MASONS INTERNATIONAL 1996-1999 -
Percentage of Enrolled Students by Program Type, 2016
 Percentage of Enrolled Students by Program Type, 2016 Doctorate 4% PN/VN 3% MSN 15% ADN 28% BSRN 22% Diploma 2% BSN 26% n = 279,770 Percentage of Graduations by Program Type, 2016 MSN 12% Doctorate 1%
Sentinel Event Data. General Information Q Copyright, The Joint Commission
 Sentinel Event Data General Information 1995 2Q 2014 Data Limitations The reporting of most sentinel events to The Joint Commission is voluntary and represents only a small proportion of actual events.
Table 6 Medicaid Eligibility Systems for Children, Pregnant Women, Parents, and Expansion Adults, January Share of Determinations
 Table 6 Medicaid Eligibility Systems for Children, Pregnant Women, Parents, and Expansion Adults, January 2017 Able to Make Share of Determinations System determines eligibility for: 2 State Real-Time
Statutory change to name availability standard. Jurisdiction. Date: April 8, [Statutory change to name availability standard] [April 8, 2015]
![Statutory change to name availability standard. Jurisdiction. Date: April 8, [Statutory change to name availability standard] [April 8, 2015]](/thumbs/83/87461560.jpg "Statutory change to name availability standard. Jurisdiction. Date: April 8, [Statutory change to name availability standard] [April 8, 2015]") Topic: Question by: : Statutory change to name availability standard Michael Powell Texas Date: April 8, 2015 Manitoba Corporations Canada Alabama Alaska Arizona Arkansas California Colorado Connecticut
Topic: Question by: : Statutory change to name availability standard Michael Powell Texas Date: April 8, 2015 Manitoba Corporations Canada Alabama Alaska Arizona Arkansas California Colorado Connecticut
Weights and Measures Training Registration
 Weights and Measures Training Registration Please fill out the form below to register for Weights and Measures training and testing dates. NIST Handbook 44, Specifications, Tolerances and other Technical
Table 8 Online and Telephone Medicaid Applications for Children, Pregnant Women, Parents, and Expansion Adults, January 2017
 Table 8 Online and Telephone Medicaid Applications for Children, Pregnant Women, Parents, and Expansion Adults, January 2017 State Applications Can be Submitted Online at the State Level 1 < 25% 25% -
States Ranked by Annual Nonagricultural Employment Change October 2017, Seasonally Adjusted
 States Ranked by Annual Nonagricultural Employment Change Change (Jobs) Change (Jobs) Change (Jobs) 1 Texas 316,100 19 Nevada 36,600 37 Hawaii 7,100 2 California 256,800 20 Tennessee 34,800 38 Mississippi
Is this consistent with other jurisdictions or do you allow some mechanism to reinstate?
 Topic: Question by: : Forfeiture for failure to appoint a resident agent Kathy M. Sachs Kansas Date: January 8, 2015 Manitoba Corporations Canada Alabama Alaska Arizona Arkansas California Colorado Connecticut
In the District of Columbia we have also adopted the latest Model business Corporation Act.
 Topic: Question by: : Reinstatement after Admin. Dissolution question Dave Nichols West Virginia Date: March 14, 2014 Manitoba Corporations Canada Alabama Alaska Arizona Arkansas California Colorado Connecticut
STATE ENTREPRENEURSHIP INDEX
 University of Nebraska - Lincoln DigitalCommons@University of Nebraska - Lincoln Business in Nebraska Bureau of Business Research 12-2013 STATE ENTREPRENEURSHIP INDEX Eric Thompson University of Nebraska-Lincoln,
Fiscal Research Center
 January 2016 Georgia s Rankings Among the States: Budget, Taxes and Other Indicators ABOUT THE FISCAL RESEARCH CENTER Established in 1995, the (FRC) provides nonpartisan research, technical assistance
Introduction. Current Law Distribution of Funds. MEMORANDUM May 8, Subject:
 MEMORANDUM May 8, 2018 Subject: TANF Family Assistance Grant Allocations Under the Ways and Means Committee (Majority) Proposal From: Gene Falk, Specialist in Social Policy, gfalk@crs.loc.gov, 7-7344 Jameson
Rankings of the States 2017 and Estimates of School Statistics 2018
 Rankings of the States 2017 and Estimates of School Statistics 2018 NEA RESEARCH April 2018 Reproduction: No part of this report may be reproduced in any form without permission from NEA Research, except
Weekly Market Demand Index (MDI)
") VOL. 8 NO. 28 JULY 13, 2015 LOAD AVAILABILITY Up 7% compared to the Weekly Market Demand Index (MDI) Note: MDI Measures Relative Truck Demand LOAD SEARCHING Up 18.3% compared to the TRUCK AVAILABILITY
VOL. 8 NO. 28 JULY 13, 2015 LOAD AVAILABILITY Up 7% compared to the Weekly Market Demand Index (MDI) Note: MDI Measures Relative Truck Demand LOAD SEARCHING Up 18.3% compared to the TRUCK AVAILABILITY
Critical Access Hospitals and HCAHPS
 Critical Access Hospitals and HCAHPS Michelle Casey, MS Senior Research Fellow and Deputy Director University of Minnesota Rural Health Research Center June 12, 2012 Overview of Presentation Why is HCAHPS
STATE AGRICULTURAL ORGANIZATIONS SUPPORTING S. 744 AS APPROVED BY THE SENATE AGRICULTURE COMMITTEE
 STATE AGRICULTURAL ORGANIZATIONS SUPPORTING S. 744 AS APPROVED BY THE SENATE AGRICULTURE COMMITTEE ALABAMA ALASKA ARIZONA Alabama Department of Agriculture & Industries* Alabama Poultry & Egg Association
THE METHODIST CHURCH (U.S.)
") THE METHODIST LIBRARY CONFERENCE JOURNALS COLLECTION PAGE: 1 ALABAMA 1939-58 ALABAMA WEST FLORIDA 1959-1967 ALASKA MISSION 1941, 1949-1967 ATLANTA 1939-1951 BALTIMORE CALIFORNIA ORIENTAL MISSION 1939-1952
THE METHODIST LIBRARY CONFERENCE JOURNALS COLLECTION PAGE: 1 ALABAMA 1939-58 ALABAMA WEST FLORIDA 1959-1967 ALASKA MISSION 1941, 1949-1967 ATLANTA 1939-1951 BALTIMORE CALIFORNIA ORIENTAL MISSION 1939-1952
Fiscal Research Center
 January 2017 Georgia s Rankings Among the States: Budget, Taxes and Other Indicators ABOUT THE FISCAL RESEARCH CENTER Established in 1995, the (FRC) provides nonpartisan research, technical assistance
All Approved Insurance Providers All Risk Management Agency Field Offices All Other Interested Parties
 United States Department of Agriculture Farm Production and Conservation Risk Management Agency Beacon Facility Mail Stop 080 P.O. Box 49205 Kansas City, MO 644-6205, 207 INFORMATIONAL MEMORANDUM: PM-7-06
EXHIBIT A. List of Public Entities Participating in FEDES Project
 EXHIBIT A List of Public Entities Participating in FEDES Project Alabama Alabama Department of Economic and Community Affairs Alabama Department of Industrial Relations Alaska Department of Labor and Workforce
Fiscal Research Center
 January 2018 Georgia s Rankings Among the States: Budget, Taxes and Other Indicators ABOUT THE FISCAL RESEARCH CENTER Established in 1995, the (FRC) provides nonpartisan research, technical assistance
NMLS Mortgage Industry Report 2016 Q1 Update
 NMLS Mortgage Industry Report 2016 Q1 Update Released June 10, 2016 Conference of State Bank Supervisors 1129 20 th Street, NW, 9 th Floor Washington, D.C. 20036-4307 NMLS Mortgage Industry Report: 2016Q1
YOUTH MENTAL HEALTH IS WORSENING AND ACCESS TO CARE IS LIMITED THERE IS A SHORTAGE OF PROVIDERS HEALTHCARE REFORM IS HELPING
 2 3 4 MENTAL HEALTH AND SUBSTANCE USE CONDITIONS ARE COMMON MOST AMERICANS LACK ACCESS TO CARE OF AMERICAN ADULTS WITH A MENTAL ILLNESS DID NOT RECEIVE TREATMENT ONE IN FIVE REPORT AN UNMET NEED NEARLY
Senior American Access to Care Grant
 Senior American Access to Care Grant Grant Guidelines SENIOR AMERICAN (age 62 plus) ACCESS TO CARE GRANT GUIDELINES: The (ADAF) is committed to supporting U.S. based organizations exempt from taxation
NMLS Mortgage Industry Report 2017Q2 Update
 NMLS Mortgage Industry Report 2017Q2 Update Released September 18, 2017 Conference of State Bank Supervisors 1129 20 th Street, NW, 9 th Floor Washington, D.C. 20036-4307 NMLS Mortgage Industry Report:
TENNESSEE TEXAS UTAH VERMONT VIRGINIA WASHINGTON WEST VIRGINIA WISCONSIN WYOMING ALABAMA ALASKA ARIZONA ARKANSAS
 ALABAMA ALASKA ARIZONA ARKANSAS CALIFORNIA COLORADO CONNECTICUT DELAWARE DISTRICT OF COLUMBIA FLORIDA GEORGIA GUAM MISSOURI MONTANA NEBRASKA NEVADA NEW HAMPSHIRE NEW JERSEY NEW MEXICO NEW YORK NORTH CAROLINA
NMLS Mortgage Industry Report 2017Q4 Update
 NMLS Mortgage Industry Report 2017Q4 Update Released March 9, 2018 Conference of State Bank Supervisors 1129 20 th Street, NW, 9 th Floor Washington, D.C. 20036-4307 NMLS Mortgage Industry Report: 2017Q4
NMLS Mortgage Industry Report 2018Q1 Update
 NMLS Mortgage Industry Report 2018Q1 Update Released July 5, 2018 Conference of State Bank Supervisors 1129 20 th Street, NW, 9 th Floor Washington, D.C. 20036-4307 NMLS Mortgage Industry Report: 2018Q1
Fiscal Year 1999 Comparisons. State by State Rankings of Revenues and Spending. Includes Fiscal Year 2000 Rankings for State Taxes Only
 Fiscal Year 1999 Comparisons State by State Rankings of Revenues and Spending Includes Fiscal Year 2000 Rankings for State Taxes Only January 2002 1 2 published annually by: The Minnesota Taxpayers Association
CRMRI White Paper #3 August 2017 State Refugee Services Indicators of Integration: How are the states doing?
 CRMRI White Paper #3 August 7 State Refugee Services Indicators of Integration: How are the states doing? Marci Harris, Julia Greene, Kilee Jorgensen, Caren J. Frost, & Lisa H. Gren State Refugee Services
Table 1 Elementary and Secondary Education. (in millions)
") Revised February 22, 2005 WHERE WOULD THE CUTS BE MADE UNDER THE PRESIDENT S BUDGET? Data Table 1 Elementary and Secondary Education Includes Education for the Disadvantaged, Impact Aid, School Improvement
Revised February 22, 2005 WHERE WOULD THE CUTS BE MADE UNDER THE PRESIDENT S BUDGET? Data Table 1 Elementary and Secondary Education Includes Education for the Disadvantaged, Impact Aid, School Improvement
HIGH SCHOOL ATHLETICS PARTICIPATION SURVEY
 2011-12 HIGH SCHOOL ATHLETICS PARTICIPATION SURVEY Conducted By THE NATIONAL FEDERATION OF STATE HIGH SCHOOL ASSOCIATIONS Based on Competition at the High School Level in the 2011-12 School Year BOYS GIRLS
*ALWAYS KEEP A COPY OF THE CERTIFICATE OF ATTENDANCE FOR YOUR RECORDS IN CASE OF AUDIT
 State Alabama Alaska Arizona Arkansas California INSTRUCTIONS FOR CLE ATTENDANCE REPORTING AT IADC 2012 TRIAL ACADEMY Attorney Reporting Method After the CLE activity, fill out the Certificate of Attendance
Name: Date: Albany: Jefferson City: Annapolis: Juneau: Atlanta: Lansing: Augusta: Lincoln: Austin: Little Rock: Baton Rouge: Madison: Bismarck:
 Albany: Annapolis: Atlanta: Augusta: Austin: Baton Rouge: Bismarck: Boise: Boston: Carson City: Charleston: Cheyenne: Columbia: Columbus: Concord: Denver: Des Moines: Dover: Frankfort: Harrisburg: Hartford:
HOPE NOW State Loss Mitigation Data December 2016
 HOPE NOW State Loss Mitigation Data December 2016 Table of Contents Page Definitions 2 Data Overview 3 Table 1 - Delinquencies 4 Table 2 - Foreclosure Starts 7 Table 3 - Foreclosure Sales 8 Table 4 - Repayment
U.S. Army Civilian Personnel Evaluation Agency
 Army Regulation 10 89 Organizations and Functions U.S. Army Civilian Personnel Evaluation Agency Headquarters Department of the Army Washington, DC 15 December 1989 Unclassified SUMMARY of CHANGE AR 10
HOPE NOW State Loss Mitigation Data September 2014
 HOPE NOW State Loss Mitigation Data September 2014 Table of Contents Page Definitions 2 Data Overview 3 Table 1 - Delinquencies 4 Table 2 - Foreclosure Starts 7 Table 3 - Foreclosure Sales 8 Table 4 -
How North Carolina Compares
 How North Carolina Compares A Compendium of State Statistics March 2017 Prepared by the N.C. General Assembly Program Evaluation Division Preface The Program Evaluation Division of the North Carolina General
Department of Defense INSTRUCTION
 Department of Defense INSTRUCTION NUMBER 4715.02 August 28, 2009 Incorporating Change 2, August 31, 2018 USD(A&S) SUBJECT: Regional Environmental Coordination References: (a) DoD Instruction 4715.2, DoD
Interstate Turbine Advisory Council (CESA-ITAC)
") Interstate Turbine Advisory Council (CESA-ITAC) Mark Mayhew NYSERDA for Val Stori Clean Energy States Alliance SWAT 4/25/12 Today CESA ITAC, LLC - What, who and why The Unified List - What, why, how and
Interstate Turbine Advisory Council (CESA-ITAC) Mark Mayhew NYSERDA for Val Stori Clean Energy States Alliance SWAT 4/25/12 Today CESA ITAC, LLC - What, who and why The Unified List - What, why, how and
Economic Freedom of North America
 Economic Freedom of North America 08 Annual Report (Canadian Edition) Amela Karabegović & Fred McMahon with Nathan J. Ashby & Russell S. Sobel The Fraser Institute 08 FRA S ER INSTITUTE Chapter 1 Economic
Percent of Population Under Age 65 Uninsured, 2013, 2014, and 2015
 Exhiit 1 Percent of Population Under Age 65 Uninsured, 13, 14, and 15 13 14 15
State Authority for Hazardous Materials Transportation
 Appendixes Appendix A State Authority for Hazardous Materials Transportation Hazardous Materials Transportation: Regulatory, Enforcement, and Emergency Response* Alabama E Public Service Commission ER
The Regional Economic Outlook
 The Regional Economic Outlook Presented by: Mark McMullen, Director of Government Svcs Prepared for: FTA Revenue Estimating Conference September 15, 2008 Recent Economic Performance 2 1 The Job Market
How North Carolina Compares
 How North Carolina Compares A Compendium of State Statistics January 2013 Prepared by the N.C. General Assembly Program Evaluation Division Program Evaluation Division North Carolina General Assembly Legislative
Larry DeBoer Purdue University September Real GDP Growth. Real Consumption Spending Growth
 Larry DeBoer Purdue University September 2011 Real GDP Growth Real Consumption Spending Growth 1 Index of Consumer Sentiment 57.8 Sept 11 Savings Rate (percent of disposable income) Real Investment Spending
national assembly of state arts agencies
 STATE ARTS AGENCY GRANT MAKING AND FUNDING Each of America's 50 states and six jurisdictions has a government that works to make the cultural, civic, economic and educational benefits of the available
AMERICAN ASSOCIATION FOR AGRICULTURAL EDUCATION FACULTY SALARIES
 AMERICAN ASSOCIATION FOR AGRICULTURAL EDUCATION 1999-2000 FACULTY SALARIES Contents Page Summary Data for 1999-2000 Faculty FTEs by Region Nine-month appointments (Table 1)...2 Twelve-month appointments
F O R E S T R I V E R M A R I N E
 F O R E S T R I V E R M A R I N E Regional Sales Manager - Eric Rose Cell: (574) 361-8673 E-mail: erose@forestriverinc.com Sales Coordinator - Neil Massing (574) 825-8168 Cell: (574) 825-6180 E-mail: nmassing@forestriverinc.com
CONNECTICUT: ECONOMIC FUTURE WITH EDUCATIONAL REFORM
 CONNECTICUT: ECONOMIC FUTURE WITH EDUCATIONAL REFORM This file contains detailed projections and information from the article: Eric A. Hanushek, Jens Ruhose, and Ludger Woessmann, It pays to improve school
National Collegiate Soils Contest Rules
 National Collegiate Soils Contest Rules Students of Agronomy, Soils, and Environmental Sciences (SASES) Revised September 30, 2008 I. NAME The contest shall be known as the National Collegiate Soils Contest
UNCLASSIFIED UNCLASSIFIED
 The National Guard Bureau Critical Infrastructure Program in Conjunction with the Joint Interagency Training and Education Center Brigadier General James A. Hoyer Director Joint Staff West Virginia National
Selection & Retention Of State Judges. Methods from Across the Country
 Selection & Retention Of State Judges Methods from Across the Country Formal Methods of Selecting State Judges COURTS OF LAST RESORT............................. 3 INTERMEDIATE APPELLATE COURTS....................
Supplemental Nutrition Assistance Program. STATE ACTIVITY REPORT Fiscal Year 2016
 Supplemental Nutrition Assistance Program ACTIVITY REPORT Fiscal Year 2016 Food and Nutrition Service Supplemental Nutrition Assistance Program Program Accountability and Administration Division September
Cooperative Program Allocation Budget Receipts Southern Baptist Convention Executive Committee August 2015
 Cooperative Program Allocation Budget Receipts August 2015 Cooperative Program Allocation Budget Current Current $ Change % Change Month Month from from Contribution Sources 2014-2015 2013-2014 Prior Year
Cooperative Program Allocation Budget Receipts Southern Baptist Convention Executive Committee March 2018
 Cooperative Program Allocation Budget Receipts March 2018 Cooperative Program Allocation Budget Current Current $ Change % Change Month Month from from Contribution Sources 2017-2018 2016-2017 Prior Year
Cooperative Program Allocation Budget Receipts Southern Baptist Convention Executive Committee January 2014
 Cooperative Program Allocation Budget Receipts January 2014 Cooperative Program Allocation Budget Current Current $ Change % Change Month Month from from Contribution Sources 2013-2014 2012-2013 Prior
Cooperative Program Allocation Budget Receipts Southern Baptist Convention Executive Committee April 2015
 Cooperative Program Allocation Budget Receipts April 2015 Cooperative Program Allocation Budget Current Current $ Change % Change Month Month from from Contribution Sources 2014-2015 2013-2014 Prior Year
Cooperative Program Allocation Budget Receipts Southern Baptist Convention Executive Committee March 2015
 Cooperative Program Allocation Budget Receipts March 2015 Cooperative Program Allocation Budget Current Current $ Change % Change Month Month from from Contribution Sources 2014-2015 2013-2014 Prior Year
Cooperative Program Allocation Budget Receipts Southern Baptist Convention Executive Committee May 2016
 Cooperative Program Allocation Budget Receipts May 2016 Cooperative Program Allocation Budget Current Current $ Change % Change Month Month from from Contribution Sources 2015-2016 2014-2015 Prior Year
Cooperative Program Allocation Budget Receipts Southern Baptist Convention Executive Committee December 2015
 Cooperative Program Allocation Budget Receipts December 2015 Cooperative Program Allocation Budget Current Current $ Change % Change Month Month from from Contribution Sources 2015-2016 2014-2015 Prior
2014 ACEP URGENT CARE POLL RESULTS
 2014 ACEP URGENT CARE POLL RESULTS PREPARED FOR: PREPARED BY: 2014 Marketing General Incorporated 625 North Washington Street, Suite 450 Alexandria, VA 22314 800.644.6646 toll free 703.739.1000 telephone
STATE ARTS AGENCY GRANT MAKING AND FUNDING
 STATE ARTS AGENCY GRANT MAKING AND FUNDING Each of America's 50 states and six jurisdictions has a government that works to make the cultural, civic, economic and educational benefits of the available
NAFCC Accreditation Annual Update
 NAFCC Accreditation Annual Update 1st year 2nd year First MI Last Co-provider (if applicable) Address on License, Registration or Certificate Phone Fax Mailing Address Email City State Zip County Country
State Nicknames A Right Angle Puzzle by David Pleacher
 State Nicknames A Right Angle Puzzle by David Pleacher Determine the name of the state for each of the fifty nicknames listed below. Then write the letters of that state in the 19 by 22 matrix using the
Acm769 AG U.S. WATER BAPTISMS, 2017¹ Page 1
 Acm769 AG U.S. WATER BAPTISMS, 2017¹ Page 1 Baptisms Baptisms Pct Baptisms Pct Baptisms Pct Alabama 2,552 2,944-392 -13.3 3,146-594 -18.9 2,501 51 2.0 Alaska 511 392 119 30.4 443 68 15.3 505 6 1.2 Appalachian