Child & Adult Care Food Program: Participation Trends 2016
|
|
|
- Adela Gabriella Warren
- 5 years ago
- Views:
Transcription

1 Child & Adult Care Food Program: Participation Trends 2016 March 2017
2 About FRAC The Food Research and Action Center (FRAC) is the leading national organization working for more effective public and private policies to eradicate domestic hunger and undernutrition. For more information about FRAC, or to sign up for FRAC s Weekly News Digest, visit For more information about CACFP, go to Acknowledgements This report was prepared by Randy Rosso and Geri Henchy. Many thanks to the United s Department of Agriculture s Food and Nutrition Service for providing the data used in this report. The CACFP data are preliminary. Food Research and Action Center CACFP Participation Trends
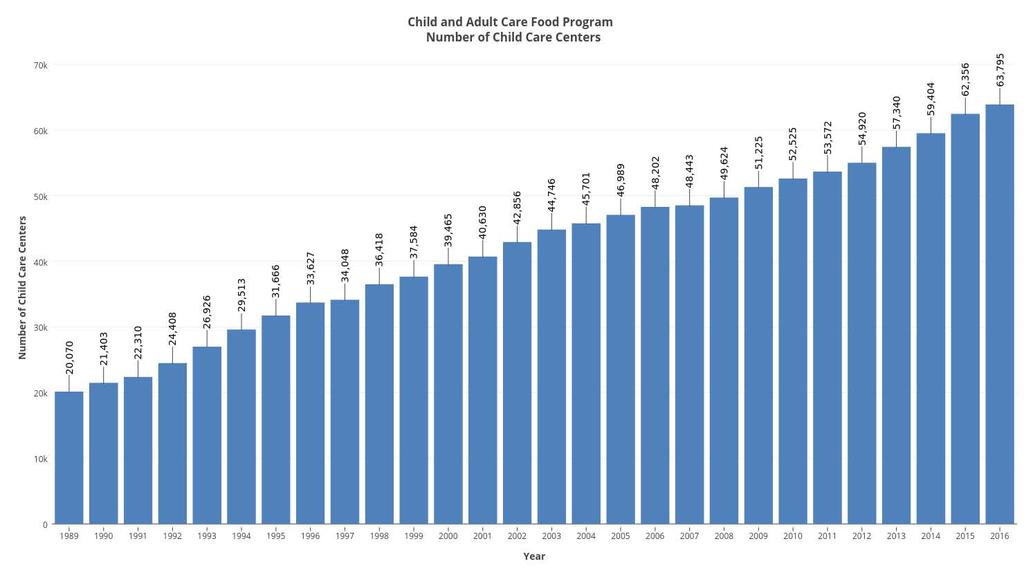
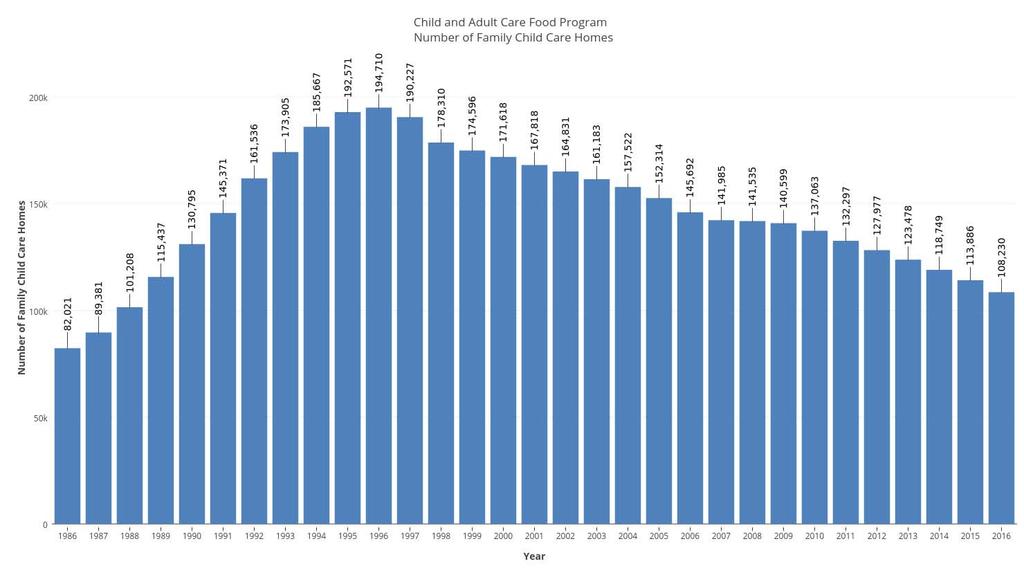
3 Child and Adult Care Food Program (CACFP) M any low-income working parents rely on child care and afterschool programs to provide a safe and healthy place for their children while they commute and work. By paying for nutritious meals and snacks for eligible children who are enrolled at participating child care centers, day care homes and Head Start programs, the Child and Adult Care Food Program (CACFP) plays an important role in improving the quality of those programs and in making them more affordable for low-income parents. CACFP is a well-documented success. Young children can receive up to two meals and a snack that meet USDA nutritional standards. Studies have shown that children in CACFP receive meals that are nutritionally superior to those served to children in child care settings without CACFP. Children in participating institutions have higher intakes of key nutrients, fewer servings of fats and sweets, than children in non-participating care. Research cites participation in CACFP as one of the major factors influencing quality care, reporting that 87 percent of the family child care homes considered to be providing quality child care participated in CACFP. While the Child and Adult Care Food Program has several segments, the majority of CACFP participants are preschool-aged children attending participating family child homes, child care centers or Head Start programs. Depending on the type of program, eligibility is based either on the poverty status of the area or on the income of the enrolled children. Each year the Food Research and Action Center (FRAC) analyzes CACFP participation data for child care centers and family child care homes provided by the United s Department of Agriculture (USDA) for the United s as a whole and for each of the 50 states and the District of Columbia. Key findings for fiscal year 2016 include: Child Care Centers Just over 3.5 million children enrolled in child care centers benefited daily from CACFP in fiscal year 2016, a 7.4 percent increase from fiscal year Nationally the number of child care centers participating in CACFP grew to 64,845 in fiscal year 2016, a 4.0 percent increase from the previous year. Family Child Care Homes In fiscal year 2016, 756,037 low-income children attending family child care homes relied on CACFP to provide healthy meals each day, a 2.7 percent decrease from fiscal year Nationally 108,326 family child care homes participated in CACFP in fiscal year 2016, a 4.9 percent decrease from the previous year. The Impact of the CACFP Means Test As part of the reform of welfare undertaken in 1996, major changes in the way family child care homes are reimbursed in the Child and Adult Care Food Program were mandated. A means test was instituted which effectively cut in half the federal reimbursement for meals and snacks for providers serving moderateincome children. These changes have had negative consequences that continue to affect the program. Between 1996 and 2016 the number of family child care homes participating in CACFP dropped by 44.4 percent, while the number of children served fell by 220,179. This is in contrast to the growth of child care centers, including child care and afterschool programs, using CACFP over that time. During the same 20 year period, the participation of centers in CACFP grew by 92.8 percent and the number of children served by those centers grew by just over 2.1 million. Food Research and Action Center CACFP Participation Trends
4
5
6
7 Table 1 in the of Child Care Centers, FY 1996 to FY 2016 Centers FY 1996 Centers FY 2016 ( ) Alabama % 13 Alaska % 41 Arizona % 42 Arkansas 394 1, % 6 California 3,342 7,527 4, % 10 Colorado % 21 Connecticut % 46 Delaware % 4 District of Columbia % 25 Florida 1,219 4,505 3, % 3 Georgia 983 2,429 1, % 8 Hawaii % 50 Idaho % 9 Illinois 1,477 2, % 29 Indiana % 39 Iowa % 47 Kansas % 40 Kentucky 790 1, % 45 Louisiana % 19 Maine % 51 Maryland 399 1, % 5 Massachusetts % 44 Michigan 898 1, % 24 Minnesota % 48 Mississippi % 18 Missouri 614 1, % 14 Montana % 38 Nebraska % 26 Nevada % 1 New Hampshire % 36 New Jersey 898 1, % 35 New Mexico % 31 New York 2,247 4,455 2, % 16 North Carolina 1,457 2, % 33 North Dakota % 20 Ohio 1,387 1, % 43 Oklahoma % 37 Oregon % 32 Pennsylvania 1,486 3,311 1, % 11 Rhode Island % 15 South Carolina % 23 South Dakota % 30 Tennessee 790 1, % 12 Texas 1,708 6,344 4, % 2 Utah % 49 Vermont % 7 Virginia 756 1, % 22 Washington 778 1, % 27 West Virginia % 17 Wisconsin % 34 Wyoming % 28 US 33,627 64,845 31, %
8 Table 2 in the of Child Care Centers, FY 2015 to FY 2016 Centers FY 2015 Centers FY 2016 ( ) Alabama % 4 Alaska % 45 Arizona % 21 Arkansas 1,258 1, % 44 California 6,969 7, % 8 Colorado % 22 Connecticut % 51 Delaware % 31 District of Columbia % 1 Florida 4,167 4, % 6 Georgia 2,384 2, % 30 Hawaii % 48 Idaho % 10 Illinois 2,487 2, % 49 Indiana % 17 Iowa % 43 Kansas % 34 Kentucky 993 1, % 28 Louisiana % 11 Maine % 29 Maryland 1,272 1, % 13 Massachusetts % 3 Michigan 1,415 1, % 7 Minnesota % 14 Mississippi % 40 Missouri 1,187 1, % 23 Montana % 18 Nebraska % 46 Nevada % 50 New Hampshire % 32 New Jersey 1,302 1, % 26 New Mexico % 12 New York 4,130 4, % 9 North Carolina 2,212 2, % 38 North Dakota % 41 Ohio 1,866 1, % 39 Oklahoma % 27 Oregon % 15 Pennsylvania 3,165 3, % 19 Rhode Island % 2 South Carolina % 16 South Dakota % 24 Tennessee 1,742 1, % 42 Texas 6,074 6, % 20 Utah % 36 Vermont % 5 Virginia 1,339 1, % 33 Washington 1,272 1, % 35 West Virginia % 37 Wisconsin % 25 Wyoming % 47 US 62,356 64,845 2, %
9 Table 3 in the Average Daily Attendance of Child Care Centers, FY 1996 to FY 2016 ADA Centers FY 1996 ADA Centers FY 2016 ( ) Alabama 21,000 53,437 32, % 15 Alaska 4,577 8,393 3, % 38 Arizona 29,304 32,852 3, % 51 Arkansas 14,504 60,934 46, % 5 California 136, , , % 8 Colorado 18,068 35,741 17, % 31 Connecticut 9,027 17,552 8, % 33 Delaware 5,599 16,096 10, % 10 District of Columbia 3,866 14,656 10, % 7 Florida 62, , , % 3 Georgia 57, ,924 70, % 21 Hawaii 7,563 9,884 2, % 48 Idaho 3,486 9,678 6, % 13 Illinois 51, ,441 67, % 20 Indiana 25,176 62,230 37, % 18 Iowa 16,895 27,671 10, % 43 Kansas 16,532 24,968 8, % 46 Kentucky 32,600 56,237 23, % 40 Louisiana 19,362 54,958 35, % 11 Maine 4,103 5,233 1, % 50 Maryland 17,326 76,504 59, % 4 Massachusetts 25,263 52,536 27, % 27 Michigan 35,446 69,995 34, % 32 Minnesota 17,463 35,722 18, % 29 Mississippi 22,222 38,391 16, % 39 Missouri 24,420 58,306 33, % 19 Montana 4,488 8,581 4, % 35 Nebraska 13,485 26,779 13, % 30 Nevada 3,096 15,773 12, % 2 New Hampshire 4,313 8,257 3, % 34 New Jersey 33,607 71,509 37, % 25 New Mexico 15,513 26,512 10, % 41 New York 123, , , % 26 North Carolina 75, ,863 39, % 45 North Dakota 4,238 9,112 4, % 24 Ohio 58,932 98,199 39, % 42 Oklahoma 24,445 45,257 20, % 36 Oregon 12,388 34,670 22, % 12 Pennsylvania 48, ,686 84, % 14 Rhode Island 5,271 7,462 2, % 47 South Carolina 15,309 31,730 16, % 28 South Dakota 4,966 11,052 6, % 22 Tennessee 26,036 65,457 39, % 17 Texas 91, , , % 1 Utah 14,963 19,247 4, % 49 Vermont 1,931 7,961 6, % 6 Virginia 27,238 59,784 32, % 23 Washington 26,026 65,488 39, % 16 West Virginia 7,116 20,770 13, % 9 Wisconsin 26,863 49,679 22, % 37 Wyoming 3,572 5,456 1, % 44 US 1,384,225 3,514,919 2,130, %
10 Table 4 in the Average Daily Attendance of Child Care Centers, FY 2015 to FY 2016 ADA Centers FY 2015 ADA Centers FY 2016 ( ) Alabama 44,906 53,437 8, % 3 Alaska 9,114 8, % 50 Arizona 32,073 32, % 29 Arkansas 61,734 60, % 43 California 426, ,377 32, % 14 Colorado 35,210 35, % 36 Connecticut 16,651 17, % 18 Delaware 15,487 16, % 22 District of Columbia 5,259 14,656 9, % 1 Florida 252, ,075 29, % 6 Georgia 125, ,924 1, % 34 Hawaii 10,028 9, % 46 Idaho 9,148 9, % 17 Illinois 114, ,441 3, % 26 Indiana 57,456 62,230 4, % 13 Iowa 28,057 27, % 45 Kansas 24,425 24, % 31 Kentucky 50,408 56,237 5, % 7 Louisiana 64,655 54,958-9, % 51 Maine 5,053 5, % 23 Maryland 69,430 76,504 7, % 9 Massachusetts 43,816 52,536 8, % 2 Michigan 63,543 69,995 6, % 10 Minnesota 35,388 35, % 40 Mississippi 38,814 38, % 42 Missouri 54,901 58,306 3, % 15 Montana 8,850 8, % 47 Nebraska 27,151 26, % 44 Nevada 15,238 15, % 25 New Hampshire 8,039 8, % 28 New Jersey 65,712 71,509 5, % 12 New Mexico 25,179 26,512 1, % 20 New York 236, ,952 25, % 8 North Carolina 113, ,863 1, % 39 North Dakota 8,952 9, % 33 Ohio 97,762 98, % 41 Oklahoma 42,946 45,257 2, % 19 Oregon 33,542 34,670 1, % 27 Pennsylvania 130, ,686 1, % 37 Rhode Island 7,369 7, % 38 South Carolina 31,243 31, % 35 South Dakota 10,673 11, % 24 Tennessee 61,710 65,457 3, % 16 Texas 406, ,625 75, % 4 Utah 20,333 19,247-1, % 48 Vermont 6,837 7,961 1, % 5 Virginia 56,966 59,784 2, % 21 Washington 59,712 65,488 5, % 11 West Virginia 20,393 20, % 32 Wisconsin 48,552 49,679 1, % 30 Wyoming 5,836 5, % 49 US 3,271,586 3,514, , %
11 Table 5 in the of Family Child Care Homes, FY 1996 to FY 2016 Homes FY 1996 Homes FY 2016 ( ) Alabama 2, , % 47 Alaska % 30 Arizona 4,114 2,283-1, % 17 Arkansas 1, % 44 California 24,008 14,075-9, % 12 Colorado 4,938 1,125-3, % 50 Connecticut 2, , % 42 Delaware 1, % 35 District of Columbia % 33 Florida 2,623 1, % 8 Georgia 2,542 1, % 11 Hawaii % 28 Idaho % 39 Illinois 7,306 6, % 5 Indiana 2,298 2, % 7 Iowa 2,658 1, % 10 Kansas 6,153 2,990-3, % 25 Kentucky % 29 Louisiana 8,675 8, % 3 Maine 1, % 23 Maryland 5,646 2,805-2, % 22 Massachusetts 7,012 4,071-2, % 13 Michigan 9,476 3,847-5, % 36 Minnesota 12,768 6,908-5, % 19 Mississippi % 6 Missouri 2,667 1,063-1, % 38 Montana 1, % 32 Nebraska 3,706 2,030-1, % 18 Nevada % 49 New Hampshire % 51 New Jersey 1, , % 48 New Mexico 6,891 2,217-4, % 45 New York 7,309 9,183 1, % 1 North Carolina 3,172 1,765-1, % 16 North Dakota 2,201 1,018-1, % 27 Ohio 5,179 2,151-3, % 34 Oklahoma 2,216 1, % 9 Oregon 5,753 2,033-3, % 43 Pennsylvania 3,212 1,611-1, % 21 Rhode Island % 2 South Carolina 1, % 41 South Dakota % 20 Tennessee 1,753 1, % 4 Texas 10,144 4,964-5, % 24 Utah 4,205 1,684-2, % 37 Vermont % 26 Virginia 3,805 2,179-1, % 15 Washington 6,073 1,795-4, % 46 West Virginia 1, % 14 Wisconsin 4,296 1,857-2, % 31 Wyoming % 40 US 194, ,326-86, %
12 Table 6 in the of Family Child Care Homes, FY 2015 to FY 2016 Homes FY 2015 Homes FY 2016 ( ) Alabama % 36 Alaska % 4 Arizona 2,502 2, % 43 Arkansas % 45 California 14,567 14, % 11 Colorado 1,182 1, % 25 Connecticut % 5 Delaware % 7 District of Columbia % 42 Florida 2,060 1, % 24 Georgia 1,735 1, % 46 Hawaii % 44 Idaho % 47 Illinois 6,986 6, % 35 Indiana 2,057 2, % 6 Iowa 1,898 1, % 22 Kansas 3,109 2, % 14 Kentucky % 50 Louisiana 8,031 8, % 2 Maine % 15 Maryland 2,993 2, % 30 Massachusetts 4,259 4, % 21 Michigan 4,061 3, % 27 Minnesota 7,383 6, % 31 Mississippi % 1 Missouri 1,112 1, % 19 Montana % 13 Nebraska 2,153 2, % 28 Nevada % 33 New Hampshire % 17 New Jersey % 3 New Mexico 2,510 2, % 49 New York 9,596 9, % 18 North Carolina 1,910 1, % 37 North Dakota 1,052 1, % 10 Ohio 2,494 2, % 51 Oklahoma 1,617 1, % 8 Oregon 2,158 2, % 29 Pennsylvania 1,743 1, % 38 Rhode Island % 32 South Carolina % 48 South Dakota % 12 Tennessee 1,685 1, % 40 Texas 5,222 4, % 26 Utah 1,828 1, % 41 Vermont % 9 Virginia 2,278 2, % 20 Washington 1,934 1, % 34 West Virginia % 16 Wisconsin 2,013 1, % 39 Wyoming % 23 US 113, ,326-5, %
13 Table 7 in the Average Daily Attendance of Family Child Care Homes, FY 1996 to FY 2016 ADA Homes FY 1996 ADA Homes FY 2016 ( ) Alabama 11,502 4,015-7, % 47 Alaska 2,596 1,553-1, % 30 Arizona 9,690 9, % 11 Arkansas 4,889 3,034-1, % 27 California 133, ,728-20, % 15 Colorado 20,530 7,039-13, % 49 Connecticut 10,824 4,354-6, % 46 Delaware 6,120 4,138-1, % 22 District of Columbia % 35 Florida 10,372 12,320 1, % 5 Georgia 18,656 10,854-7, % 32 Hawaii 1,424 1, % 18 Idaho 2,990 2, % 19 Illinois 24,849 24, % 10 Indiana 15,403 23,809 8, % 2 Iowa 10,869 14,944 4, % 4 Kansas 38,066 23,928-14, % 26 Kentucky 3,895 4, % 6 Louisiana 39,258 41,206 1, % 9 Maine 10,157 5,740-4, % 34 Maryland 29,860 16,039-13, % 36 Massachusetts 22,757 24,816 2, % 8 Michigan 35,727 30,622-5, % 14 Minnesota 76,763 54,583-22, % 20 Mississippi 4,497 3, % 13 Missouri 17,743 10,649-7, % 29 Montana 8,368 4,751-3, % 33 Nebraska 24,465 15,925-8, % 24 Nevada 1, % 45 New Hampshire 2, , % 51 New Jersey 7,321 2,317-5, % 50 New Mexico 26,653 9,150-17, % 48 New York 41,859 80,490 38, % 1 North Carolina 16,725 8,628-8, % 39 North Dakota 14,208 8,698-5, % 28 Ohio 19,872 15,631-4, % 17 Oklahoma 18,995 9,491-9, % 40 Oregon 24,182 14,119-10, % 31 Pennsylvania 15,085 12,302-2, % 16 Rhode Island 1,229 1, % 3 South Carolina 8,745 3,891-4, % 44 South Dakota 7,289 6, % 12 Tennessee 10,296 11,473 1, % 7 Texas 55,401 39,039-16, % 21 Utah 25,453 13,342-12, % 37 Vermont 6,981 3,296-3, % 42 Virginia 14,204 9,487-4, % 23 Washington 27,222 14,077-13, % 38 West Virginia 6,025 3,899-2, % 25 Wisconsin 23,506 11,443-12, % 41 Wyoming 4,564 2,077-2, % 43 US 976, , , %
14 Table 8 in the Average Daily Attendance of Family Child Care Homes, FY 2015 to FY 2016 ADA Homes FY 2015 ADA Homes FY 2016 ( ) Alabama 4,307 4, % 42 Alaska 1,565 1, % 12 Arizona 10,087 9, % 44 Arkansas 3,307 3, % 47 California 113, ,728-1, % 15 Colorado 7,358 7, % 29 Connecticut 4,418 4, % 17 Delaware 4,155 4, % 9 District of Columbia % 6 Florida 12,907 12, % 30 Georgia 12,474 10,854-1, % 50 Hawaii 1,196 1, % 45 Idaho 2,541 2, % 48 Illinois 25,326 24, % 27 Indiana 23,934 23, % 10 Iowa 15,466 14, % 24 Kansas 25,172 23,928-1, % 34 Kentucky 3,723 4, % 1 Louisiana 39,199 41,206 2, % 3 Maine 6,028 5, % 32 Maryland 16,896 16, % 35 Massachusetts 25,480 24, % 19 Michigan 31,479 30, % 21 Minnesota 57,849 54,583-3, % 38 Mississippi 3,492 3, % 2 Missouri 10,852 10, % 18 Montana 4,926 4, % 26 Nebraska 16,719 15, % 31 Nevada % 20 New Hampshire % 41 New Jersey 2,252 2, % 5 New Mexico 10,237 9,150-1, % 49 New York 80,921 80, % 11 North Carolina 9,126 8, % 37 North Dakota 8,793 8, % 16 Ohio 16,193 15, % 25 Oklahoma 9,818 9, % 23 Oregon 14,237 14, % 13 Pennsylvania 12,818 12, % 28 Rhode Island 1,843 1, % 46 South Carolina 4,478 3, % 51 South Dakota 7,211 6, % 22 Tennessee 11,419 11, % 7 Texas 41,146 39,039-2, % 36 Utah 14,199 13, % 39 Vermont 3,187 3, % 4 Virginia 9,968 9, % 33 Washington 14,079 14, % 8 West Virginia 3,932 3, % 14 Wisconsin 12,196 11, % 40 Wyoming 2,231 2, % 43 US 776, ,037-20, %
15 Table 9 and age of Tier I Family Child Care Homes FY 2016 CACFP of Homes Tier I Homes Tier I Homes as of (Homes as of ) Alabama % 16 Alaska % 44 Arizona 2,283 2, % 6 Arkansas % 9 California 14,075 12, % 27 Colorado 1, % 38 Connecticut % 40 Delaware % 17 District of Columbia % 1 Florida 1,961 1, % 7 Georgia 1,550 1, % 20 Hawaii % 23 Idaho % 18 Illinois 6,463 5, % 29 Indiana 2,011 1, % 26 Iowa 1,813 1, % 35 Kansas 2,990 2, % 36 Kentucky % 11 Louisiana 8,390 8, % 3 Maine % 31 Maryland 2,805 2, % 39 Massachusetts 4,071 3, % 41 Michigan 3,847 3, % 33 Minnesota 6,908 3, % 50 Mississippi % 2 Missouri 1, % 24 Montana % 34 Nebraska 2,030 1, % 37 Nevada % 46 New Hampshire % 51 New Jersey % 30 New Mexico 2,217 2, % 4 New York 9,183 8, % 21 North Carolina 1,765 1, % 12 North Dakota 1, % 49 Ohio 2,151 2, % 13 Oklahoma 1,567 1, % 19 Oregon 2,033 1, % 15 Pennsylvania 1,611 1, % 22 Rhode Island % 14 South Carolina % 8 South Dakota % 47 Tennessee 1,553 1, % 5 Texas 4,964 4, % 25 Utah 1,684 1, % 28 Vermont % 43 Virginia 2,179 1, % 42 Washington 1,795 1, % 32 West Virginia % 10 Wisconsin 1,857 1, % 45 Wyoming % 48 US 108,326 94, %
16 Table 10 in of Sponsoring Organizations for Family Child Care Homes, FY 1996 to FY 2016 Sponsors FY 1996 Sponsors FY 2016 Cghange ( ) Alabama % 24 Alaska % 35 Arizona % 19 Arkansas % 26 California % 20 Colorado % 15 Connecticut % 31 Delaware % 4 District of Columbia % 37 Florida % 6 Georgia % 16 Hawaii % 37 Idaho % 12 Illinois % 28 Indiana % 44 Iowa % 14 Kansas % 25 Kentucky % 28 Louisiana % 48 Maine % 36 Maryland % 9 Massachusetts % 47 Michigan % 37 Minnesota % 37 Mississippi % 30 Missouri % 34 Montana % 17 Nebraska % 9 Nevada % 23 New Hampshire % 3 New Jersey % 45 New Mexico % 31 New York % 27 North Carolina % 8 North Dakota % 37 Ohio % 50 Oklahoma % 1 Oregon % 51 Pennsylvania % 33 Rhode Island % 37 South Carolina % 22 South Dakota % 11 Tennessee % 7 Texas % 18 Utah % 46 Vermont % 5 Virginia % 13 Washington % 43 West Virginia % 2 Wisconsin % 21 Wyoming % 49 US 1, %
17 Table 11 in of Sponsoring Organizations for Family Child Care Homes, FY 2015 to FY 2016 Sponsors FY 2015 Sponsors FY 2016 ( ) Alabama % 4 Alaska % 40 Arizona % 4 Arkansas % 4 California % 3 Colorado % 50 Connecticut % 4 Delaware % 4 District of Columbia % 4 Florida % 34 Georgia % 4 Hawaii % 4 Idaho % 47 Illinois % 4 Indiana % 41 Iowa % 4 Kansas % 4 Kentucky % 39 Louisiana % 4 Maine % 37 Maryland % 4 Massachusetts % 35 Michigan % 4 Minnesota % 44 Mississippi % 1 Missouri % 4 Montana % 4 Nebraska % 4 Nevada % 49 New Hampshire % 4 New Jersey % 4 New Mexico % 46 New York % 33 North Carolina % 2 North Dakota % 42 Ohio % 48 Oklahoma % 4 Oregon % 51 Pennsylvania % 43 Rhode Island % 4 South Carolina % 4 South Dakota % 44 Tennessee % 35 Texas % 32 Utah % 4 Vermont % 4 Virginia % 4 Washington % 38 West Virginia % 4 Wisconsin % 4 Wyoming % 4 US %
Child & Adult Care Food Program: Participation Trends 2017
 Child & Adult Care Food Program: Participation Trends 2017 February 2018 About FRAC The Food Research and Action Center (FRAC) is the leading national organization working for more effective public and
Child & Adult Care Food Program: Participation Trends 2014
 Child & Adult Care Food Program: Participation Trends 2014 1200 18th St NW Suite 400 Washington, DC 20036 (202) 986-2200 / www.frac.org February 2016 About FRAC The Food Research and Action Center (FRAC)
 3+ 3+ N = 155, 442 3+ R 2 =.32 < < < 3+ N = 149, 685 3+ R 2 =.27 < < < 3+ N = 99, 752 3+ R 2 =.4 < < < 3+ N = 98, 887 3+ R 2 =.6 < < < 3+ N = 52, 624 3+ R 2 =.28 < < < 3+ N = 36, 281 3+ R 2 =.5 < < < 7+
TABLE 3c: Congressional Districts with Number and Percent of Hispanics* Living in Hard-to-Count (HTC) Census Tracts**
 Census Tracts**") living Alaska 00 47,808 21,213 44.4 Alabama 01 20,661 3,288 15.9 Alabama 02 23,949 6,614 27.6 Alabama 03 20,225 3,247 16.1 Alabama 04 41,412 7,933 19.2 Alabama 05 34,388 11,863 34.5 Alabama 06 34,849 4,074
living Alaska 00 47,808 21,213 44.4 Alabama 01 20,661 3,288 15.9 Alabama 02 23,949 6,614 27.6 Alabama 03 20,225 3,247 16.1 Alabama 04 41,412 7,933 19.2 Alabama 05 34,388 11,863 34.5 Alabama 06 34,849 4,074
TABLE 3b: Congressional Districts Ranked by Percent of Hispanics* Living in Hard-to- Count (HTC) Census Tracts**
 Census Tracts**") Rank State District Count (HTC) 1 New York 05 150,499 141,567 94.1 2 New York 08 133,453 109,629 82.1 3 Massachusetts 07 158,518 120,827 76.2 4 Michigan 13 47,921 36,145 75.4 5 Illinois 04 508,677 379,527
Rank State District Count (HTC) 1 New York 05 150,499 141,567 94.1 2 New York 08 133,453 109,629 82.1 3 Massachusetts 07 158,518 120,827 76.2 4 Michigan 13 47,921 36,145 75.4 5 Illinois 04 508,677 379,527
The American Legion NATIONAL MEMBERSHIP RECORD
 The American Legion NATIONAL MEMBERSHIP RECORD www.legion.org 2016 The American Legion NATIONAL MEMBERSHIP RECORD 1920-1929 Department 1920 1921 1922 1923 1924 1925 1926 1927 1928 1929 Alabama 4,474 3,246
5 x 7 Notecards $1.50 with Envelopes - MOQ - 12
 5 x 7 Notecards $1.50 with Envelopes - MOQ - 12 Magnets 2½ 3½ Magnet $1.75 - MOQ - 5 - Add $0.25 for packaging Die Cut Acrylic Magnet $2.00 - MOQ - 24 - Add $0.25 for packaging 2535-22225 California AM-22225
Unemployment Rate (%) Rank State. Unemployment
 Rank State. Unemployment") States Ranked by February 2018 Unemployment Rate Seasonally Adjusted Unemployment Unemployment Unemployment 1 Hawaii 2.1 19 Alabama 3.7 33 Ohio 4.5 2 New Hampshire 2.6 19 Missouri 3.7 33 Rhode Island 4.5
States Ranked by February 2018 Unemployment Rate Seasonally Adjusted Unemployment Unemployment Unemployment 1 Hawaii 2.1 19 Alabama 3.7 33 Ohio 4.5 2 New Hampshire 2.6 19 Missouri 3.7 33 Rhode Island 4.5
Unemployment Rate (%) Rank State. Unemployment
 Rank State. Unemployment") States Ranked by November 2015 Unemployment Rate Seasonally Adjusted Unemployment Unemployment Unemployment 1 North Dakota 2.7 19 Indiana 4.4 37 Georgia 5.6 2 Nebraska 2.9 20 Ohio 4.5 37 Tennessee 5.6
States Ranked by November 2015 Unemployment Rate Seasonally Adjusted Unemployment Unemployment Unemployment 1 North Dakota 2.7 19 Indiana 4.4 37 Georgia 5.6 2 Nebraska 2.9 20 Ohio 4.5 37 Tennessee 5.6
Unemployment Rate (%) Rank State. Unemployment
 Rank State. Unemployment") States Ranked by April 2017 Unemployment Rate Seasonally Adjusted Unemployment Unemployment Unemployment 1 Colorado 2.3 17 Virginia 3.8 37 California 4.8 2 Hawaii 2.7 20 Massachusetts 3.9 37 West Virginia
States Ranked by April 2017 Unemployment Rate Seasonally Adjusted Unemployment Unemployment Unemployment 1 Colorado 2.3 17 Virginia 3.8 37 California 4.8 2 Hawaii 2.7 20 Massachusetts 3.9 37 West Virginia
Unemployment Rate (%) Rank State. Unemployment
 Rank State. Unemployment") States Ranked by August 2017 Unemployment Rate Seasonally Adjusted Unemployment Unemployment Unemployment 1 North Dakota 2.3 18 Maryland 3.9 36 New York 4.8 2 Colorado 2.4 18 Michigan 3.9 38 Delaware 4.9
States Ranked by August 2017 Unemployment Rate Seasonally Adjusted Unemployment Unemployment Unemployment 1 North Dakota 2.3 18 Maryland 3.9 36 New York 4.8 2 Colorado 2.4 18 Michigan 3.9 38 Delaware 4.9
Unemployment Rate (%) Rank State. Unemployment
 Rank State. Unemployment") States Ranked by March 2016 Unemployment Rate Seasonally Adjusted Unemployment Unemployment Unemployment 1 South Dakota 2.5 19 Delaware 4.4 37 Georgia 5.5 2 New Hampshire 2.6 19 Massachusetts 4.4 37 North
States Ranked by March 2016 Unemployment Rate Seasonally Adjusted Unemployment Unemployment Unemployment 1 South Dakota 2.5 19 Delaware 4.4 37 Georgia 5.5 2 New Hampshire 2.6 19 Massachusetts 4.4 37 North
Unemployment Rate (%) Rank State. Unemployment
 Rank State. Unemployment") States Ranked by September 2017 Unemployment Rate Seasonally Adjusted Unemployment Unemployment Unemployment 1 North Dakota 2.4 17 Indiana 3.8 36 New Jersey 4.7 2 Colorado 2.5 17 Kansas 3.8 38 Pennsylvania
States Ranked by September 2017 Unemployment Rate Seasonally Adjusted Unemployment Unemployment Unemployment 1 North Dakota 2.4 17 Indiana 3.8 36 New Jersey 4.7 2 Colorado 2.5 17 Kansas 3.8 38 Pennsylvania
Unemployment Rate (%) Rank State. Unemployment
 Rank State. Unemployment") States Ranked by December 2017 Unemployment Rate Seasonally Adjusted Unemployment Unemployment Unemployment 1 Hawaii 2.0 16 South Dakota 3.5 37 Connecticut 4.6 2 New Hampshire 2.6 20 Arkansas 3.7 37 Delaware
States Ranked by December 2017 Unemployment Rate Seasonally Adjusted Unemployment Unemployment Unemployment 1 Hawaii 2.0 16 South Dakota 3.5 37 Connecticut 4.6 2 New Hampshire 2.6 20 Arkansas 3.7 37 Delaware
Unemployment Rate (%) Rank State. Unemployment
 Rank State. Unemployment") States Ranked by September 2015 Unemployment Rate Seasonally Adjusted Unemployment Unemployment Unemployment 1 North Dakota 2.8 17 Oklahoma 4.4 37 South Carolina 5.7 2 Nebraska 2.9 20 Indiana 4.5 37 Tennessee
States Ranked by September 2015 Unemployment Rate Seasonally Adjusted Unemployment Unemployment Unemployment 1 North Dakota 2.8 17 Oklahoma 4.4 37 South Carolina 5.7 2 Nebraska 2.9 20 Indiana 4.5 37 Tennessee
Unemployment Rate (%) Rank State. Unemployment
 Rank State. Unemployment") States Ranked by November 2014 Unemployment Rate Seasonally Adjusted Unemployment Unemployment Unemployment 1 North Dakota 2.7 19 Pennsylvania 5.1 35 New Mexico 6.4 2 Nebraska 3.1 20 Wisconsin 5.2 38 Connecticut
States Ranked by November 2014 Unemployment Rate Seasonally Adjusted Unemployment Unemployment Unemployment 1 North Dakota 2.7 19 Pennsylvania 5.1 35 New Mexico 6.4 2 Nebraska 3.1 20 Wisconsin 5.2 38 Connecticut
Unemployment Rate (%) Rank State. Unemployment
 Rank State. Unemployment") States Ranked by July 2018 Unemployment Rate Seasonally Adjusted Unemployment Unemployment Unemployment 1 Hawaii 2.1 19 Massachusetts 3.6 37 Kentucky 4.3 2 Iowa 2.6 19 South Carolina 3.6 37 Maryland 4.3
States Ranked by July 2018 Unemployment Rate Seasonally Adjusted Unemployment Unemployment Unemployment 1 Hawaii 2.1 19 Massachusetts 3.6 37 Kentucky 4.3 2 Iowa 2.6 19 South Carolina 3.6 37 Maryland 4.3
Index of religiosity, by state
 Index of religiosity, by state Low Medium High Total United States 19 26 55=100 Alabama 7 16 77 Alaska 28 27 45 Arizona 21 26 53 Arkansas 12 19 70 California 24 27 49 Colorado 24 29 47 Connecticut 25 32
2015 State Hospice Report 2013 Medicare Information 1/1/15
 2015 State Hospice Report 2013 Medicare Information 1/1/15 www.hospiceanalytics.com 2 2013 Demographics & Hospice Utilization National Population 316,022,508 Total Deaths 2,529,792 Medicare Beneficiaries
Interstate Pay Differential
 Interstate Pay Differential APPENDIX IV Adjustments for differences in interstate pay in various locations are computed using the state average weekly pay. This appendix provides a table for the second
MAP 1: Seriously Delinquent Rate by State for Q3, 2008
 MAP 1: Seriously Delinquent Rate by State for Q3, 2008 Seriously Delinquent Rate Greater than 6.93% 5.18% 6.93% 0 5.17% Source: MBA s National Deliquency Survey MAP 2: Foreclosure Inventory Rate by State
Estimated Economic Impacts of the Small Business Jobs and Tax Relief Act National Report
 Regional Economic Models, Inc. Estimated Economic Impacts of the Small Business Jobs and Tax Relief Act National Report Prepared by Frederick Treyz, CEO June 2012 The following is a summary of the Estimated
FY 2014 Per Capita Federal Spending on Major Grant Programs Curtis Smith, Nick Jacobs, and Trinity Tomsic
 Special Analysis 15-03, June 18, 2015 FY 2014 Per Capita Federal Spending on Major Grant Programs Curtis Smith, Nick Jacobs, and Trinity Tomsic 202-624-8577 ttomsic@ffis.org Summary Per capita federal
Voter Registration and Absentee Ballot Deadlines by State 2018 General Election: Tuesday, November 6. Saturday, Oct 27 (postal ballot)
") Voter Registration and Absentee Ballot Deadlines by State 2018 General Election: All dates in 2018 unless otherwise noted STATE REG DEADLINE ABSENTEE BALLOT REQUEST DEADLINE Alabama November 1 ABSENTEE
Voter Registration and Absentee Ballot Deadlines by State 2018 General Election: All dates in 2018 unless otherwise noted STATE REG DEADLINE ABSENTEE BALLOT REQUEST DEADLINE Alabama November 1 ABSENTEE
Rutgers Revenue Sources
 Rutgers Revenue Sources 31.2% Tuition and Fees 27.3% State Appropriations with Fringes 1.0% Endowment and Investments.5% Federal Appropriations 17.8% Federal, State, and Municipal Grants and Contracts
STATE INDUSTRY ASSOCIATIONS $ - LISTED NEXT PAGE. TOTAL $ 88,000 * for each contribution of $500 for Board Meeting sponsorship
 Exhibit D -- TRIP 2017 FUNDING SOURCES -- February 3, 2017 CORPORATE $ 12,000 Construction Companies $ 5,500 Consulting Engineers Equipment Distributors Manufacturer/Supplier/Producer 6,500 Surety Bond
Table 6 Medicaid Eligibility Systems for Children, Pregnant Women, Parents, and Expansion Adults, January Share of Determinations
 Table 6 Medicaid Eligibility Systems for Children, Pregnant Women, Parents, and Expansion Adults, January 2017 Able to Make Share of Determinations System determines eligibility for: 2 State Real-Time
Current Medicare Advantage Enrollment Penetration: State and County-Level Tabulations
 Current Advantage Enrollment : State and County-Level Tabulations 5 Slide Series, Volume 40 September 2016 Summary of Tabulations and Findings As of September 2016, 17.9 million of the nation s 56.1 million
Sentinel Event Data. General Information Copyright, The Joint Commission
 Sentinel Event Data General Information 1995 2015 Data Limitations The reporting of most sentinel events to The Joint Commission is voluntary and represents only a small proportion of actual events. Therefore,
HOME HEALTH AIDE TRAINING REQUIREMENTS, DECEMBER 2016
 BACKGROUND HOME HEALTH AIDE TRAINING REQUIREMENTS, DECEMBER 2016 Federal legislation (42 CFR 484.36) requires that Medicare-certified home health agencies employ home health aides who are trained and evaluated
Sentinel Event Data. General Information Q Copyright, The Joint Commission
 Sentinel Event Data General Information 1995 2Q 2014 Data Limitations The reporting of most sentinel events to The Joint Commission is voluntary and represents only a small proportion of actual events.
PRESS RELEASE Media Contact: Joseph Stefko, Director of Public Finance, ;
 PRESS RELEASE Media Contact: Joseph Stefko, Director of Public Finance, 585.327.7075; jstefko@cgr.org Highest Paid State Workers in New Jersey & New York in 2010; Lowest Paid in Dakotas and West Virginia
Is this consistent with other jurisdictions or do you allow some mechanism to reinstate?
 Topic: Question by: : Forfeiture for failure to appoint a resident agent Kathy M. Sachs Kansas Date: January 8, 2015 Manitoba Corporations Canada Alabama Alaska Arizona Arkansas California Colorado Connecticut
2016 INCOME EARNED BY STATE INFORMATION
 BY STATE INFORMATION This information is being provided to assist in your 2016 tax preparations. The information is also mailed to applicable Columbia fund non-corporate shareholders with their year-end
FORTIETH TRIENNIAL ASSEMBLY
 FORTIETH TRIENNIAL ASSEMBLY MOST PUISSANT GENERAL GRAND MASTER GENERAL GRAND COUNCIL OF CRYPTIC MASONS INTERNATIONAL 1996-1999 -
Table 8 Online and Telephone Medicaid Applications for Children, Pregnant Women, Parents, and Expansion Adults, January 2017
 Table 8 Online and Telephone Medicaid Applications for Children, Pregnant Women, Parents, and Expansion Adults, January 2017 State Applications Can be Submitted Online at the State Level 1 < 25% 25% -
Weights and Measures Training Registration
 Weights and Measures Training Registration Please fill out the form below to register for Weights and Measures training and testing dates. NIST Handbook 44, Specifications, Tolerances and other Technical
Percentage of Enrolled Students by Program Type, 2016
 Percentage of Enrolled Students by Program Type, 2016 Doctorate 4% PN/VN 3% MSN 15% ADN 28% BSRN 22% Diploma 2% BSN 26% n = 279,770 Percentage of Graduations by Program Type, 2016 MSN 12% Doctorate 1%
Statutory change to name availability standard. Jurisdiction. Date: April 8, [Statutory change to name availability standard] [April 8, 2015]
![Statutory change to name availability standard. Jurisdiction. Date: April 8, [Statutory change to name availability standard] [April 8, 2015]](/thumbs/83/87461560.jpg "Statutory change to name availability standard. Jurisdiction. Date: April 8, [Statutory change to name availability standard] [April 8, 2015]") Topic: Question by: : Statutory change to name availability standard Michael Powell Texas Date: April 8, 2015 Manitoba Corporations Canada Alabama Alaska Arizona Arkansas California Colorado Connecticut
Topic: Question by: : Statutory change to name availability standard Michael Powell Texas Date: April 8, 2015 Manitoba Corporations Canada Alabama Alaska Arizona Arkansas California Colorado Connecticut
Supplemental Nutrition Assistance Program. STATE ACTIVITY REPORT Fiscal Year 2016
 Supplemental Nutrition Assistance Program ACTIVITY REPORT Fiscal Year 2016 Food and Nutrition Service Supplemental Nutrition Assistance Program Program Accountability and Administration Division September
Introduction. Current Law Distribution of Funds. MEMORANDUM May 8, Subject:
 MEMORANDUM May 8, 2018 Subject: TANF Family Assistance Grant Allocations Under the Ways and Means Committee (Majority) Proposal From: Gene Falk, Specialist in Social Policy, gfalk@crs.loc.gov, 7-7344 Jameson
In the District of Columbia we have also adopted the latest Model business Corporation Act.
 Topic: Question by: : Reinstatement after Admin. Dissolution question Dave Nichols West Virginia Date: March 14, 2014 Manitoba Corporations Canada Alabama Alaska Arizona Arkansas California Colorado Connecticut
States Ranked by Annual Nonagricultural Employment Change October 2017, Seasonally Adjusted
 States Ranked by Annual Nonagricultural Employment Change Change (Jobs) Change (Jobs) Change (Jobs) 1 Texas 316,100 19 Nevada 36,600 37 Hawaii 7,100 2 California 256,800 20 Tennessee 34,800 38 Mississippi
HIGH SCHOOL ATHLETICS PARTICIPATION SURVEY
 2011-12 HIGH SCHOOL ATHLETICS PARTICIPATION SURVEY Conducted By THE NATIONAL FEDERATION OF STATE HIGH SCHOOL ASSOCIATIONS Based on Competition at the High School Level in the 2011-12 School Year BOYS GIRLS
Rankings of the States 2017 and Estimates of School Statistics 2018
 Rankings of the States 2017 and Estimates of School Statistics 2018 NEA RESEARCH April 2018 Reproduction: No part of this report may be reproduced in any form without permission from NEA Research, except
*ALWAYS KEEP A COPY OF THE CERTIFICATE OF ATTENDANCE FOR YOUR RECORDS IN CASE OF AUDIT
 State Alabama Alaska Arizona Arkansas California INSTRUCTIONS FOR CLE ATTENDANCE REPORTING AT IADC 2012 TRIAL ACADEMY Attorney Reporting Method After the CLE activity, fill out the Certificate of Attendance
All Approved Insurance Providers All Risk Management Agency Field Offices All Other Interested Parties
 United States Department of Agriculture Farm Production and Conservation Risk Management Agency Beacon Facility Mail Stop 080 P.O. Box 49205 Kansas City, MO 644-6205, 207 INFORMATIONAL MEMORANDUM: PM-7-06
Senior American Access to Care Grant
 Senior American Access to Care Grant Grant Guidelines SENIOR AMERICAN (age 62 plus) ACCESS TO CARE GRANT GUIDELINES: The (ADAF) is committed to supporting U.S. based organizations exempt from taxation
Interstate Turbine Advisory Council (CESA-ITAC)
") Interstate Turbine Advisory Council (CESA-ITAC) Mark Mayhew NYSERDA for Val Stori Clean Energy States Alliance SWAT 4/25/12 Today CESA ITAC, LLC - What, who and why The Unified List - What, why, how and
Interstate Turbine Advisory Council (CESA-ITAC) Mark Mayhew NYSERDA for Val Stori Clean Energy States Alliance SWAT 4/25/12 Today CESA ITAC, LLC - What, who and why The Unified List - What, why, how and
FOOD STAMP PROGRAM STATE ACTIVITY REPORT
 FOOD STAMP PROGRAM ACTIVITY REPORT Federal Fiscal Year 2004 Food Stamps Make America Stronger United States Department of Agriculture Food and Nutrition Service Program Accountability Division February
Critical Access Hospitals and HCAHPS
 Critical Access Hospitals and HCAHPS Michelle Casey, MS Senior Research Fellow and Deputy Director University of Minnesota Rural Health Research Center June 12, 2012 Overview of Presentation Why is HCAHPS
Fiscal Year 1999 Comparisons. State by State Rankings of Revenues and Spending. Includes Fiscal Year 2000 Rankings for State Taxes Only
 Fiscal Year 1999 Comparisons State by State Rankings of Revenues and Spending Includes Fiscal Year 2000 Rankings for State Taxes Only January 2002 1 2 published annually by: The Minnesota Taxpayers Association
CRMRI White Paper #3 August 2017 State Refugee Services Indicators of Integration: How are the states doing?
 CRMRI White Paper #3 August 7 State Refugee Services Indicators of Integration: How are the states doing? Marci Harris, Julia Greene, Kilee Jorgensen, Caren J. Frost, & Lisa H. Gren State Refugee Services
Table 1 Elementary and Secondary Education. (in millions)
") Revised February 22, 2005 WHERE WOULD THE CUTS BE MADE UNDER THE PRESIDENT S BUDGET? Data Table 1 Elementary and Secondary Education Includes Education for the Disadvantaged, Impact Aid, School Improvement
Revised February 22, 2005 WHERE WOULD THE CUTS BE MADE UNDER THE PRESIDENT S BUDGET? Data Table 1 Elementary and Secondary Education Includes Education for the Disadvantaged, Impact Aid, School Improvement
Hunger Doesn t Take a Vacation:
 Hunger Doesn t Take a Vacation: Breakfast Status Report June 2017 n www.frac.org FRAC n Breakfast Status Report 2017 n www.frac.org n twitter @fractweets 1 Hunger Doesn t Take a Vacation: Breakfast Status
November 24, First Street NE, Suite 510 Washington, DC 20002
 820 First Street NE, Suite 510 Washington, DC 20002 Tel: 202-408-1080 Fax: 202-408-1056 center@cbpp.org www.cbpp.org November 24, 2008 TANF BENEFITS ARE LOW AND HAVE NOT KEPT PACE WITH INFLATION But Most
Colorado River Basin. Source: U.S. Department of the Interior, Bureau of Reclamation
 The Colorado River supports a quarter million jobs and produces $26 billion in economic output from recreational activities alone, drawing revenue from the 5.36 million adults who use the Colorado River
Weekly Market Demand Index (MDI)
") VOL. 8 NO. 28 JULY 13, 2015 LOAD AVAILABILITY Up 7% compared to the Weekly Market Demand Index (MDI) Note: MDI Measures Relative Truck Demand LOAD SEARCHING Up 18.3% compared to the TRUCK AVAILABILITY
VOL. 8 NO. 28 JULY 13, 2015 LOAD AVAILABILITY Up 7% compared to the Weekly Market Demand Index (MDI) Note: MDI Measures Relative Truck Demand LOAD SEARCHING Up 18.3% compared to the TRUCK AVAILABILITY
Department of Defense INSTRUCTION
 Department of Defense INSTRUCTION NUMBER 4715.02 August 28, 2009 Incorporating Change 2, August 31, 2018 USD(A&S) SUBJECT: Regional Environmental Coordination References: (a) DoD Instruction 4715.2, DoD
F O R E S T R I V E R M A R I N E
 F O R E S T R I V E R M A R I N E Regional Sales Manager - Eric Rose Cell: (574) 361-8673 E-mail: erose@forestriverinc.com Sales Coordinator - Neil Massing (574) 825-8168 Cell: (574) 825-6180 E-mail: nmassing@forestriverinc.com
YOUTH MENTAL HEALTH IS WORSENING AND ACCESS TO CARE IS LIMITED THERE IS A SHORTAGE OF PROVIDERS HEALTHCARE REFORM IS HELPING
 2 3 4 MENTAL HEALTH AND SUBSTANCE USE CONDITIONS ARE COMMON MOST AMERICANS LACK ACCESS TO CARE OF AMERICAN ADULTS WITH A MENTAL ILLNESS DID NOT RECEIVE TREATMENT ONE IN FIVE REPORT AN UNMET NEED NEARLY
STATE AGRICULTURAL ORGANIZATIONS SUPPORTING S. 744 AS APPROVED BY THE SENATE AGRICULTURE COMMITTEE
 STATE AGRICULTURAL ORGANIZATIONS SUPPORTING S. 744 AS APPROVED BY THE SENATE AGRICULTURE COMMITTEE ALABAMA ALASKA ARIZONA Alabama Department of Agriculture & Industries* Alabama Poultry & Egg Association
National Collegiate Soils Contest Rules
 National Collegiate Soils Contest Rules Students of Agronomy, Soils, and Environmental Sciences (SASES) Revised September 30, 2008 I. NAME The contest shall be known as the National Collegiate Soils Contest
Date: 5/25/2012. To: Chuck Wyatt, DCR, Virginia. From: Christos Siderelis
 1 Date: 5/25/2012 To: Chuck Wyatt, DCR, Virginia From: Christos Siderelis Chuck Wyatt with the DCR in Virginia inquired about the classification of state parks having resort type characteristics and, if
The Regional Economic Outlook
 The Regional Economic Outlook Presented by: Mark McMullen, Director of Government Svcs Prepared for: FTA Revenue Estimating Conference September 15, 2008 Recent Economic Performance 2 1 The Job Market
EXHIBIT A. List of Public Entities Participating in FEDES Project
 EXHIBIT A List of Public Entities Participating in FEDES Project Alabama Alabama Department of Economic and Community Affairs Alabama Department of Industrial Relations Alaska Department of Labor and Workforce
Fiscal Research Center
 January 2017 Georgia s Rankings Among the States: Budget, Taxes and Other Indicators ABOUT THE FISCAL RESEARCH CENTER Established in 1995, the (FRC) provides nonpartisan research, technical assistance
U.S. Army Civilian Personnel Evaluation Agency
 Army Regulation 10 89 Organizations and Functions U.S. Army Civilian Personnel Evaluation Agency Headquarters Department of the Army Washington, DC 15 December 1989 Unclassified SUMMARY of CHANGE AR 10
Name: Date: Albany: Jefferson City: Annapolis: Juneau: Atlanta: Lansing: Augusta: Lincoln: Austin: Little Rock: Baton Rouge: Madison: Bismarck:
 Albany: Annapolis: Atlanta: Augusta: Austin: Baton Rouge: Bismarck: Boise: Boston: Carson City: Charleston: Cheyenne: Columbia: Columbus: Concord: Denver: Des Moines: Dover: Frankfort: Harrisburg: Hartford:
State Authority for Hazardous Materials Transportation
 Appendixes Appendix A State Authority for Hazardous Materials Transportation Hazardous Materials Transportation: Regulatory, Enforcement, and Emergency Response* Alabama E Public Service Commission ER
Economic Freedom of North America
 Economic Freedom of North America 08 Annual Report (Canadian Edition) Amela Karabegović & Fred McMahon with Nathan J. Ashby & Russell S. Sobel The Fraser Institute 08 FRA S ER INSTITUTE Chapter 1 Economic
THE METHODIST CHURCH (U.S.)
") THE METHODIST LIBRARY CONFERENCE JOURNALS COLLECTION PAGE: 1 ALABAMA 1939-58 ALABAMA WEST FLORIDA 1959-1967 ALASKA MISSION 1941, 1949-1967 ATLANTA 1939-1951 BALTIMORE CALIFORNIA ORIENTAL MISSION 1939-1952
THE METHODIST LIBRARY CONFERENCE JOURNALS COLLECTION PAGE: 1 ALABAMA 1939-58 ALABAMA WEST FLORIDA 1959-1967 ALASKA MISSION 1941, 1949-1967 ATLANTA 1939-1951 BALTIMORE CALIFORNIA ORIENTAL MISSION 1939-1952
national assembly of state arts agencies
 STATE ARTS AGENCY GRANT MAKING AND FUNDING Each of America's 50 states and six jurisdictions has a government that works to make the cultural, civic, economic and educational benefits of the available
CONNECTICUT: ECONOMIC FUTURE WITH EDUCATIONAL REFORM
 CONNECTICUT: ECONOMIC FUTURE WITH EDUCATIONAL REFORM This file contains detailed projections and information from the article: Eric A. Hanushek, Jens Ruhose, and Ludger Woessmann, It pays to improve school
Percent of Population Under Age 65 Uninsured, 2013, 2014, and 2015
 Exhiit 1 Percent of Population Under Age 65 Uninsured, 13, 14, and 15 13 14 15
Cooperative Program Allocation Budget Receipts Southern Baptist Convention Executive Committee August 2015
 Cooperative Program Allocation Budget Receipts August 2015 Cooperative Program Allocation Budget Current Current $ Change % Change Month Month from from Contribution Sources 2014-2015 2013-2014 Prior Year
Cooperative Program Allocation Budget Receipts Southern Baptist Convention Executive Committee March 2018
 Cooperative Program Allocation Budget Receipts March 2018 Cooperative Program Allocation Budget Current Current $ Change % Change Month Month from from Contribution Sources 2017-2018 2016-2017 Prior Year
Pipeline Safety Regulations and the Effects on Operator Qualification Programs. March 28, 2017
 Pipeline Safety Regulations and the Effects on Operator Qualification Programs March 28, 2017 Community Assistance and Technical Services (CATS) Name Change Community Liaison (CL) Effective: January 1,
Cooperative Program Allocation Budget Receipts Southern Baptist Convention Executive Committee January 2014
 Cooperative Program Allocation Budget Receipts January 2014 Cooperative Program Allocation Budget Current Current $ Change % Change Month Month from from Contribution Sources 2013-2014 2012-2013 Prior
Cooperative Program Allocation Budget Receipts Southern Baptist Convention Executive Committee April 2015
 Cooperative Program Allocation Budget Receipts April 2015 Cooperative Program Allocation Budget Current Current $ Change % Change Month Month from from Contribution Sources 2014-2015 2013-2014 Prior Year
Cooperative Program Allocation Budget Receipts Southern Baptist Convention Executive Committee March 2015
 Cooperative Program Allocation Budget Receipts March 2015 Cooperative Program Allocation Budget Current Current $ Change % Change Month Month from from Contribution Sources 2014-2015 2013-2014 Prior Year
Cooperative Program Allocation Budget Receipts Southern Baptist Convention Executive Committee May 2016
 Cooperative Program Allocation Budget Receipts May 2016 Cooperative Program Allocation Budget Current Current $ Change % Change Month Month from from Contribution Sources 2015-2016 2014-2015 Prior Year
Cooperative Program Allocation Budget Receipts Southern Baptist Convention Executive Committee December 2015
 Cooperative Program Allocation Budget Receipts December 2015 Cooperative Program Allocation Budget Current Current $ Change % Change Month Month from from Contribution Sources 2015-2016 2014-2015 Prior
Fiscal Research Center
 January 2016 Georgia s Rankings Among the States: Budget, Taxes and Other Indicators ABOUT THE FISCAL RESEARCH CENTER Established in 1995, the (FRC) provides nonpartisan research, technical assistance
Fiscal Research Center
 January 2018 Georgia s Rankings Among the States: Budget, Taxes and Other Indicators ABOUT THE FISCAL RESEARCH CENTER Established in 1995, the (FRC) provides nonpartisan research, technical assistance
How North Carolina Compares
 How North Carolina Compares A Compendium of State Statistics March 2017 Prepared by the N.C. General Assembly Program Evaluation Division Preface The Program Evaluation Division of the North Carolina General
HOPE NOW State Loss Mitigation Data December 2016
 HOPE NOW State Loss Mitigation Data December 2016 Table of Contents Page Definitions 2 Data Overview 3 Table 1 - Delinquencies 4 Table 2 - Foreclosure Starts 7 Table 3 - Foreclosure Sales 8 Table 4 - Repayment
HOPE NOW State Loss Mitigation Data September 2014
 HOPE NOW State Loss Mitigation Data September 2014 Table of Contents Page Definitions 2 Data Overview 3 Table 1 - Delinquencies 4 Table 2 - Foreclosure Starts 7 Table 3 - Foreclosure Sales 8 Table 4 -
RECERTIFICATION REQUIREMENTS
 Alabama Yes The Council on Recertification of Nurse Anesthetists. [Alabama Board of Nursing Admin. Code, sec. 610-X-9-.01(1)(d)] Alaska Yes Current national certification. [Professional Regulations, Board
UNCLASSIFIED UNCLASSIFIED
 The National Guard Bureau Critical Infrastructure Program in Conjunction with the Joint Interagency Training and Education Center Brigadier General James A. Hoyer Director Joint Staff West Virginia National
STATE ARTS AGENCY GRANT MAKING AND FUNDING
 STATE ARTS AGENCY GRANT MAKING AND FUNDING Each of America's 50 states and six jurisdictions has a government that works to make the cultural, civic, economic and educational benefits of the available
NMLS Mortgage Industry Report 2016 Q1 Update
 NMLS Mortgage Industry Report 2016 Q1 Update Released June 10, 2016 Conference of State Bank Supervisors 1129 20 th Street, NW, 9 th Floor Washington, D.C. 20036-4307 NMLS Mortgage Industry Report: 2016Q1
Larry DeBoer Purdue University September Real GDP Growth. Real Consumption Spending Growth
 Larry DeBoer Purdue University September 2011 Real GDP Growth Real Consumption Spending Growth 1 Index of Consumer Sentiment 57.8 Sept 11 Savings Rate (percent of disposable income) Real Investment Spending
NURSING HOME STATISTICAL YEARBOOK, 2015
 NURSING HOME STATISTICAL YEARBOOK, 2015 C. MCKEEN COWLES COWLES RESEARCH GROUP Acknowledgments We extend our appreciation to Craig Dickstein of Tamarack Professional Services, LLC for optimizing the SAS
AMERICAN ASSOCIATION FOR AGRICULTURAL EDUCATION FACULTY SALARIES
 AMERICAN ASSOCIATION FOR AGRICULTURAL EDUCATION 1999-2000 FACULTY SALARIES Contents Page Summary Data for 1999-2000 Faculty FTEs by Region Nine-month appointments (Table 1)...2 Twelve-month appointments
NMLS Mortgage Industry Report 2017Q2 Update
 NMLS Mortgage Industry Report 2017Q2 Update Released September 18, 2017 Conference of State Bank Supervisors 1129 20 th Street, NW, 9 th Floor Washington, D.C. 20036-4307 NMLS Mortgage Industry Report:
NAFCC Accreditation Annual Update
 NAFCC Accreditation Annual Update 1st year 2nd year First MI Last Co-provider (if applicable) Address on License, Registration or Certificate Phone Fax Mailing Address Email City State Zip County Country
NMLS Mortgage Industry Report 2017Q4 Update
 NMLS Mortgage Industry Report 2017Q4 Update Released March 9, 2018 Conference of State Bank Supervisors 1129 20 th Street, NW, 9 th Floor Washington, D.C. 20036-4307 NMLS Mortgage Industry Report: 2017Q4
NMLS Mortgage Industry Report 2018Q1 Update
 NMLS Mortgage Industry Report 2018Q1 Update Released July 5, 2018 Conference of State Bank Supervisors 1129 20 th Street, NW, 9 th Floor Washington, D.C. 20036-4307 NMLS Mortgage Industry Report: 2018Q1
Sharing of Data Between Agencies. Date: August 31, 2011 [ INSERT TOPIC NAME ] [ INSERT YEAR MONTH DD ]
![Sharing of Data Between Agencies. Date: August 31, 2011 [ INSERT TOPIC NAME ] [ INSERT YEAR MONTH DD ]](/thumbs/71/65784909.jpg "Sharing of Data Between Agencies. Date: August 31, 2011 [ INSERT TOPIC NAME ] [ INSERT YEAR MONTH DD ]") Topic: Question by: : Sharing of Data Between Agencies Mandy Harlan Louisiana Date: August 31, 2011 Manitoba Corporations Canada Alabama Alaska Arizona Arkansas California An automated process of exchange
Topic: Question by: : Sharing of Data Between Agencies Mandy Harlan Louisiana Date: August 31, 2011 Manitoba Corporations Canada Alabama Alaska Arizona Arkansas California An automated process of exchange