Benefits, Costs, and Trade-Offs: Strategic and Operational Decision Making in the Multi-Mission U.S. Coast Guard; A First Look
|
|
|
- Marilyn Baldwin
- 5 years ago
- Views:
Transcription
1 Benefits, Costs, and Trade-Offs: Strategic and Operational Decision Making in the Multi-Mission U.S. Coast Guard; A First Look By Frank R. Parker B.S. Mathematics and Computer Science, U.S. Coast Guard Academy, 1988 M.S. Operations Research, Georgia Institute of Technology, 1994 Submitted to the MIT Sloan School of Management in Partial Fulfillment of the Requirements for the Degree of Master of Science in Management at the Massachusetts Institute of Technology June 2008 Frank R. Parker. All rights reserved. The author hereby grants to MIT permission to reproduce and to distribute publicly paper and electronic copies of this thesis document in whole or in part. Signature of Author: MIT Sloan School of Management May 9 th, 2008 Certified by: John Van Maanen Erwin H. Schell Professor of Organizational Studies Thesis Supervisor Accepted by: Stephen J. Sacca Director, MIT Sloan Fellows Program in Innovation and Global Leadership
2 Benefits, Costs, and Trade-Offs: Strategic and Operational Decision Making in the Multi-Mission U.S. Coast Guard; A First Look By Frank R. Parker Submitted to the MIT Sloan School of Management on May 9 th, 2008 in Partial Fulfillment of the Requirements for the Degree of Master of Science in Management ABSTRACT The U.S. Coast Guard performs a diverse array of missions ensuring the maritime safety and security of America as well as the stewardship of her maritime resources. It efficiently and competently performs these missions along America s coasts, internal federal waters, and overseas every day. Conduct of these missions generates significant public value in the form of safe and efficient maritime commerce systems, the security and integrity of our nation s maritime borders, the protection of natural resources, and in lives saved. This thesis evaluates and, where possible, quantifies the value of Coast Guard services performed to enable a strategic comparison, across missions, of services delivered. This was accomplished by researching, evaluating, and consolidating relevant government and industry analyses and valuations of Coast Guard services and related services performed by other entities. In addition, this thesis summarizes and evaluates the process used by the Coast Guard to develop, communicate, and modify its operational planning to achieve service level goals across multiple mission areas. Thesis Supervisor: John Van Maanen, Erwin H. Schell Professor of Organizational Studies 2
3 Acknowledgements I would like to thank John Van Maanen, my thesis supervisor, for his patience and astute guidance. He encouraged me to expand the scope of my thesis to evaluate the linkages between performance measurement and communicating strategic intent. This added dimension of study and research greatly contributed to my personal and professional growth. I am indebted to the scores of Coast Guard personnel who assisted me in gathering the information and reference materials needed to complete this work. Their willingness to be interviewed, share their candid insights and experiences, and provide encouragement and support were greatly appreciated. I would also like to thank Jeffrey Kayser, Timothy Sullivan, Robert S. Branham, James Maes, Lawrence Hall, Brett McGough, and John Tomko for their leadership and believing enough in me that I would be given the opportunity to attend the MIT Sloan Fellows Program. To the men and women of the U.S. Coast Guard, thank-you for your selfless service. Though I have been privileged to serve with exemplary individuals aboard cutters, at various staff tours, and at the very best engineering and logistics support unit in the Coast Guard, I will always remember and be motivated by the bravery and dedication of the Coast Guard s coxswains and boat crews you are truly The Soul of the Service. And finally, I would like to recognize the enduring love and support provided by my wife, Susan, and our two children, Madeline and Ethan; thank-you from the very bottom of my heart. 3
4 Table of Contents Chapter 1: Introduction... 6 Chapter 2: Methodology Chapter 3: Coast Guard Overview A. History B. Organization & Structure C. Mission Overview D. Mission Performance Goals, Targets, & Outcomes Chapter 4: Coast Guard Mission Outcome Valuations A. Safety Search and Rescue Marine Safety B. Security Ports, Waterways, and Coastal Security Illegal Drug Interdiction Undocumented Migrant Interdiction Defense Readiness Other Law Enforcement C. Stewardship Marine Environmental Protection Living Marine Resources Aids to Navigation Ice Operations D. Summary of Mission Outcome Values and the Coast Guard Consequence Equivalency Matrix Chapter 5: Strategic Guidance Chapter 6: Operational Planning System A. Operational Campaign Plans B. The Coast Guard Standard Operational Planning Process Chapter 7: Challenges to the Standard Operations Planning Process Chapter 8: Conclusions Appendix A: Coast Guard Platforms and Units Appendix B: Principles of Coast Guard Operations
5 Appendix C: Principles of War Appendix D: Example Operational Campaign Plan Appendix E: Coast Guard Standard Operational Planning Process Interview Questionnaire Bibliography
6 Chapter 1: Introduction A few armed vessels, judiciously stationed at the entrances of our ports, might at a small expense be made useful sentinels of the laws. Alexander Hamilton, the first Secretary of the Treasury Federalist No. 12, The Utility of the Union in Respect to Revenue From the New York Packet, 27 November 1787 Alexander Hamilton envisioned a small number of armed vessels, strategically located at major trading ports, to enforce customs laws for the fledgling United States of America. His use of the words few, judiciously, and small expense indicated his desire to maximize effectiveness in terms of collecting customs duties, thereby ensuring the sovereignty of the new government, while limiting federal expenses incurred. From this small number of armed vessels, the U.S. Coast Guard was born. As shown in Hamilton s quote, the concept of maximizing the benefit of government services delivered to the nation and its taxpayers is not new. Today, this balance between public benefit and public cost is documented in benefit-cost analyses and tracked through formalized program assessments. But the road to today s more formalized but admittedly imperfect system of checks and balances was anything but smooth. The U.S. government s use of structured cost-benefit analysis can be traced back to the late 1920 s when the River and Harbors Acts of 1927 and 1928 authorized the U.S. Army Corps of Engineers to estimate the construction costs of proposed projects. Realizing that cost estimates did not reflect the benefit delivered to the taxpayer, Congress passed the Flood Control Act of 1936 which specified that public works projects be economically justified (Fuguitt, 1999). The subsequent passage of the 1939 U.S. Reclamation Project Act expanded 6
7 the requirement to study the benefits of irrigation and water related projects. From these legislations, cost benefit analyses clearly play an important role in the determination of budgets and in the selection of particular projects (McKean, 1958). As post-war expenditures in the 1950 s grew, the need to prioritize and justify budget expenditures in defense and health increased. Determining the monetary value of national security and defense objectives proved difficult resulting in the reliance on cost-effectiveness analyses that focused on the cost to achieve a stated level of performance or outcome in place of an economic benefit (Fuguitt, 1999). Also during this time, cost-benefit and costeffectiveness techniques were applied to health care problems resulting in the then controversial practice of assigning a monetary value to a human life or illness. Many of these same concerns persist today (Viscusi, 2006). Despite these hurdles, the use of cost-benefit analyses continued to grow in the 1960 s and 1970 s. With the U.S economy struggling under the burden of an 11% annual inflation rate in 1974, President Ford directed agencies to evaluate the economic benefits and burdens of proposed rule-makings marking the first required use of cost-benefit analyses (Fuguitt, 1999). Despite this economic and administrative impetus, application of cost-benefit principles still proved challenging, particularly in the fields of pollution control and environmental regulations. The U.S. Clean Air Act of 1970 and 1977 amendments omitted cost-benefit considerations which were later corrected with passage of the 1990 U.S. Clean Air Act Amendments (Fuguitt, 1999). 7
8 Since President Ford s directive, several executive orders have been issued and major pieces of legislation have been passed requiring further use of cost-benefit analysis and performance plans by federal agencies. In March 1978, President Carter signed Executive Order which required agencies to assess the economic impacts and consequences of proposed regulatory actions. The assessment was to include a statement of the problem; a description of the major alternative ways of dealing with the problem that were considered by the agency; an analysis of the economic consequences of each of these alternatives and a detailed explanation of the reasons for choosing one alternative over the others." This regulatory analysis was required for regulatory actions having an economic impact of $100 million or more annually, would result in significant cost or price increases, or as otherwise selected by agency administrators (Carter, 1978). In 1981, President Reagan signed Executive Order that extended the analysis of regulatory impacts to include those that could adversely impact competition, investment, productivity, employment, or the international competitive position of the U.S. businesses. In addition, EO directed agencies to prioritize on regulatory alternatives that maximized net benefits, as allowed for by governing statute. (Reagan, 1981) President Clinton later followed suit by issuing Executive Order on September 30, 1993 which specified the issuance of regulations whose benefits exceed costs given consideration for the overall impact on regulated entities by the proposed and previously existing regulations. In analyzing this Executive Order, Viscusi (2006) concludes that it requires agencies to conduct benefit cost analyses and suggests that they (agencies) explore possible monetization of these benefits. 8
9 Executive Orders 12044, 12291, and focused on regulatory actions but not the conduct or prioritization of new government projects and acquisitions or use of existing resources and equipment. Echoing the intent of the Flood Control Act of 1936, the Government Performance Results Act of 1993 attempted to close this gap by establishing a framework for achieving the following: improve the confidence of the American people in the capability of the Federal Government, by systematically holding Federal agencies accountable for achieving program results; initiate program performance reform with a series of pilot projects in setting program goals, measuring program performance against those goals, and reporting publicly on their progress; improve Federal program effectiveness and public accountability by promoting a new focus on results, service quality, and customer satisfaction; help Federal managers improve service delivery, by requiring that they plan for meeting program objectives and by providing them with information about program results and service quality; improve congressional decision making by providing more objective information on achieving statutory objectives, and on the relative effectiveness and efficiency of Federal programs and spending; and improve internal management of the Federal Government. The most recent update to what is now called performance based management of Federal agencies was recently issued by President Bush on November 13, 2007 through Executive Order entitled Improving Government Program Performance. This executive order requires agencies to: 9
10 approve for implementation: o clear annual and long-term goals defined by objectively measurable outcomes; and o specific plans for achieving the goals, including: assignments to specified agency personnel of: the duties necessary to achieve the goals; and the authority and resources necessary to fulfill such duties; means to measure: progress toward achievement of the goals; and efficiency in use of resources in making that progress; and mechanisms for ensuring continuous accountability of the specified agency personnel to the head of the agency for achievement of the goals and efficiency in use of resources in achievement of the goals; assist the President in making recommendations to the Congress that are justified based on objective performance information and accurate estimates of the full costs of achieving the annual and long-term goals approved under subsection (a)(i) of this section; and ensure that agency Internet websites available to the public include regularly updated and accurate information on the performance of the agency and its programs, in a readily useable and searchable form, that sets forth the successes, shortfalls, and challenges of each program and describes the agency's efforts to improve the performance of the program. (Bush, 2007) The Office of Management and Budget (OMB) uses a Program Assessment Rating Tool (PART) to assess performance of Federal programs and further performance improvement initiatives. The PART is designed to provide consistent approach to assessing and rating programs across the Federal government. (OMB, 2008) Executive Order and OMB s PART system establish clear requirements for Federal agencies to establish annual and long-term performance goals based on objective and measurable outcomes. In this thesis, I will first summarize past research activities conducted by government agencies, research institutes and academies, and commercial entities related to measurable outcomes for seven of the Coast Guard s eleven mission areas. Second, I will summarize the process through which the Coast Guard makes strategic and operational decisions and communicates those decisions through the chain of command to achieve its 10
11 stated multi-mission performance goals. Finally, I will try to identify potential improvements to the current decision making and communication process to achieve consistent risk management based decisions across multiple mission areas with disparate outcomes. This thesis is structured as follows. Chapter 2 outlines my methodology. Chapter 3 provides an overview of relevant moments in Coast Guard history, the current organizational structure, and provides a high-level introduction of the Coast Guard s eleven mission areas. Chapter 4 discusses the key performance metrics and related outcomes for each mission area and summarizes relevant research by government agencies, research institutes and academies, and commercial entities. Chapter 5 provides an overview of the strategic guidance and organizational doctrine that forms the foundation for strategic and operational decisions within the Coast Guard. Chapter 6 summarizes the Standard Operational Planning Process (SOPP), the system of deliberate processes and reports that have been put in place to communicate strategic intent and mission emphasis as well as provide crucial mission performance feedback throughout the four levels in the Coast Guard s operational chain of command. Chapter 7 concludes this thesis by identifying areas of the Standard Operational Planning Process that may challenge its long-term effectiveness in achieving its stated goals. 11
12 Chapter 2: Methodology As stated, this thesis will document past research related to measurable Coast Guard mission area outcomes and summarize the process through which the Coast Guard makes and communicates strategic and operational decisions to achieve its stated multi-mission performance goals. I originally chose these two loosely related topics due to my professional interests and personal belief that someday in the future, the Coast Guard, and public policy makers in general, would be able to use quantitative techniques to estimate the economic value of outcomes to improve their public policy decisions. Operating under this premise, my research began with a review of publically available research and reports published in professional journals, books, and on the internet by scholars, researchers, and government agencies. To limit the vast quantities of information and general commentary available on the array of Coast Guard mission outcomes, I focused my search on directly relevant sources; tangentially relevant sources were used only when I was unable to locate more direct or pertinent sources. Due to the politically sensitive nature of some Coast Guard mission outcomes (e.g. immigration), I further limited my research to sources that had been published or formally presented in public forums (e.g. congressional testimony). Despite this more stringent screening criterion, some source organizations do possess an underlying political viewpoint. In these situations, I have tried to limit referenced information to that which is factually based while avoiding reference to politically driven conclusions. In addition to the potentially sensitive political issues, the simple act of assigning representative economic values to a human life or an endangered animal presents ethical or moral problems. 12
13 Public policy outcomes are diverse and include a range of potential outcomes including lives saved, national security, environmental sustainability, as well as personal comfort and entertainment. Public policy makers must use limited resources to best meet the sometimes competing needs of the nation and, in many situations, the larger global community. Whether we personally agree or not, trade-offs that directly or indirectly equate the relative value of diverse public policy outcomes are a necessary part of today s society. In light of this fact, this thesis focuses on documenting research pertaining to the economic valuation of Coast Guard mission area outcomes. I have refrained from including personal commentary regarding the relative scale of the outcome valuations. Following my initial research phase that reviewed Coast Guard mission outcomes and planning processes, I conducted personal interviews with ten Coast Guard personnel representing various aspects of the Coast Guard s strategic and operational planning processes as well as the four levels of the Coast Guard operational chain of command. At Coast Guard Headquarters, I interviewed personnel responsible for the Coast Guard s strategic, budgetary, and operational planning processes. In addition, I interviewed key resource managers and planning personnel at Coast Guard Atlantic Area located in Portsmouth, VA, the First Coast Guard District located in Boston, MA, and Coast Guard Sector Boston also located in Boston, MA. These units were chosen for several reasons. First, they represent a continuous chain of command ranging from the policy and budgetary responsibilities of headquarters to the operationally focused Sector Boston. Second, the Atlantic Area and First District offices were identified as lead developers and successful implementers of the relatively new Standard Operational Planning Process. Third, the proximity of Washington, DC and Portsmouth, VA as well as the local access provided 13
14 by the First District and Sector Boston enabled all interviews to be conducted in person in a time and cost efficient manner. As the interviews progressed, it became clear that despite the introduction of a standardized operational planning process and a staggering amount of operational guidance and priorities, all levels in the chain of command lacked information needed to consistently perform mission trade-offs. As this became evident, the focus of my research shifted toward developing a potential link between mission outcome valuations and multi-mission tradeoffs at the strategic and operational levels of the Coast Guard. After changing the focus of this thesis, I updated the title to reflect that despite great efforts, this study is not complete. Inclusion of the words, A First Look, suggests that additional work remains to identify relevant outcome values for mission areas that I was unable to locate. In addition, I did not attempt to quantify the Coast Guard s ability to influence desired outcomes, whether through preventive programs or response activities. Lastly, I did not attempt to develop efficient or effective strategies to close performance gaps where assets employed or regulations enacted may impact multiple mission outcomes simultaneously. 14
15 Chapter 3: Coast Guard Overview A. History 1 The U.S. Coast Guard traces its long and proud history as America s longest continuously operating naval force back to the passage of the Tariff Act of This act authorized the construction of ten small ships, also known as cutters, and the establishment of a 100 person Revenue Marine service to assist in the collection of customs duties. The Revenue Marine was placed within the Treasury Department along with the independent U.S. Lighthouse Service, established in 1789 to construct and maintain the nation s maritime aids to navigation. Over the next 73 years, the Revenue Marine was called upon for a variety of mission expanding duties. In 1798 America entered the Quasi-war, an undeclared war fought almost entirely at sea, with France. Having disbanded the Navy following the revolutionary War, America found itself without a military naval force. In 1798 the Revenue Marine was assigned military duties which it continued to perform until 1800 as an augmenting force the newly reconstituted Navy. Revenue Marine cutters again augmented the Navy s six frigates in the War of 1812 resulting in the first capture of a British war prize at sea. Following the War of 1812, the Revenue Marine also made significant contributions to the African Slave Trade patrols and operations against West Indian Pirates during the period 1820 through In the early 1830 s, the Revenue Marine began limiting general cruising to set aside resources with the intent of providing assistance to mariners in distress. This successful program was later formalized by legislation in 1837 authorizing public vessels to render air to distressed mariners. In addition to their 1 The following accounts of historical events relevant to this thesis were summarized from the Coast Guard Publication 1 entitled Coast Guard: America s Maritime Guardian,
16 revenue collection and growing rescue duties, the shallow draft Revenue Marine cutters were called to service performing coastal naval defense operations during the Seminole War (1836 to 1839) and the Mexican War ( ). During this period, several other federal programs were developing independently of the Revenue Marine. In response to a series of deadly steam vessel explosions, Congress enacted legislation in 1838 to improve vessel safety. This legislation would eventually result in the creation of the Steamboat Inspection Service within the Treasury Department. In addition, the U.S. Lifesaving Service was established in 1848 in response to the grounding of the barque Terasto and the loss of her crew. The Revenue Marine and the U.S. Lifesaving Service worked closely together providing for the safety of mariners along America s coasts. The Revenue Marine was again called to augment the Navy during the Civil War ( ) with the Revenue Cutter Harriet Lane being credited with firing the first navel shots of the war near Fort Sumter, South Carolina in In 1863, the Revenue Marine was renamed the Revenue Cutter Service. When the United States purchased Alaska in 1867, the Revenue Cutter Service was dispatched to establish a federal presence by performing a variety of civil, humanitarian, and scientific duties. In response to lagging training and equipment readiness levels, the Revenue Marine Bureau was established in 1871 to overhaul the Revenue Cutter Service. The Bureau s success in retraining and re-equipping the Revenue Cutter Service resulted in the Bureau being assigned similar duties for the Life Saving Service which was transferred as a branch of the Revenue Cutter Service. Following several high profile tragedies in the late 1870 s, Congress passed 16
17 legislation in 1878 separating the Lifesaving Service from the Revenue Cutter Service and authorizing construction of additional shore-based lifesaving stations. Following this shift, the Revenue Cutter Service and Lifesaving Service continued to closely coordinate rescue efforts. Legislative actions added several new missions to the Revenue Cutter Service s repertoire during this growth phase in the Revenue Cutter Service s history. The Revenue Cutter Service was assigned enforcement duties for new federal anchorage regulations (1889), removal of derelict hulls (1906), and authority over pleasure boating (1910). Following the tragic sinking of the Titanic in 1912, the Revenue Cutter Service assumed responsibility for ice patrol duties in the North Atlantic. In addition to these new missions, the Revenue Cutter Service continued to perform its traditional missions including augmentation of the Navy for the Spanish American War in In 1911, President Taft established a special commission to recommend ways to improve the efficiency of the federal government. The commission determined that single purpose agencies were more efficient than agencies with multiple functions. The commission recommended dissolution of the multi-functional Revenue Cutter Service and distribution of its functions to the Navy and a combined Lifesaving Serve and Lighthouse Service. The Navy, not wanting to take possession of the smaller and lighter cutters and associated missions, objected. This led to the combination of the Revenue Cutter Service and the Lifesaving Service in 1915 to form what would become today s Coast Guard. In 1939, the Lighthouse Service was added to the Coast Guard followed by the Steamboat Inspection Service in The aggregation of these four agencies and their associated functional responsibilities form the bulk of the mission set of 17
18 today s U.S. Coast Guard. In 1967 the Coast Guard was transferred to the Department of Transportation. In 2003, the Coast Guard was again transferred, this time to the newly created Department of Homeland Security with the provision that the service and its multi-mission nature, including performance of non-homeland security related missions, would remain intact. 18

19 B. Organization & Structure From its humble beginnings of ten small cutters and 100 Revenue Marine personnel responsible for enforcing customs laws off select trading ports, the Coast Guard has grown into an organization of more than 47,200 full-time civilian and active duty military members, more than 8,000 part-time or Reserve military members, and more than 34,800 volunteer Auxiliary team members. These personnel serve in more than 740 units, many of them with fewer than 30 personnel assigned. The units are distributed along America s coasts, interstate lakes and rivers, and select foreign locations. An approximate distribution of Coast Guard shore units is presented in Figure 3-1 below. Figure
20 Coast Guard units can be further classified, with a few exceptions, into operational and administrative/logistics support units. Operational units include: the Coast Guard s 251 cutters ranging from feet in length; 23 air stations operating 211 helicopters and fixed wing aircraft; 35 sector offices that perform command and control (C2) as well as some regulatory duties; 11 regional commands that perform operational management and command and control functions; and 189 small-boat stations, 13 Maritime Safety and Security Teams, 8 Port Security Units, and 60 Aids to Navigation Teams that cumulatively operate more than 1,700 small-boats. A representative sample of Coast Guard operating platforms and their predominant missions is included in Appendix 1. The operational chain of command, or the hierarchical organization responsible for the management and conduct of the Coast Guard s operational missions, consists of four levels as shown in Figure 3-2 below. Figure

21 The operational chain of command is geographically organized to facilitate coordination of operations across adjacent areas of responsibility and sharing of response assets. In 2006, the Coast Guard completed the formation of Sectors by combining the functions of the historical Group and Marine Safety Office units. Sectors serve as the consolidated, single point of contact for all Coast Guard operations in a given region. The geographic organization of the Coast Guard, reflecting the nine regional District boundaries and the 35 unified Sectors is shown in Figure 3-3 below. Figure
22 C. Mission Overview The U.S. Coast Guard is the principal federal agency charged with maritime Safety, Security and Stewardship. As such, the Coast Guard protects vital interests of the U.S. - the personal safety and security of our population, our natural and economic resources, and the territorial integrity of our maritime borders from internal and external threats, natural and manmade... The Coast Guard generates public value through its roles and missions that ensure maritime Safety, Security and Stewardship. These roles and missions are enduring, long standing responsibilities, accrued to the Coast Guard over two centuries of service because they are inherently governmental, serve the collective good, and can be accomplished most effectively by a single federal maritime force. U.S. Coast Guard 2008 Budget in Brief and Performance Report The following is an overview of the Coast Guard s three broad mission roles and its eleven statutorily-mandated missions. The Coast Guard s eleven missions are divided into three broad roles. These broad roles are used to track program performance across multiple missions and related resource management decisions. These roles also allow one to think more generally about the basic services that a maritime nation requires. The first role is that of safety. This role is focused on saving lives and protecting property. The stated objective for the safety role is to eliminate deaths, injury, and property damage associated with maritime transportation, fishing, and recreational boating. Two missions, search and rescue (SAR) and marine safety, fall under the broad mission role of safety. Search and rescue and marine safety attempt to achieve the same goal of saving lives and protecting property from two different ends of the maritime casualty continuum. Search and rescue focuses efforts on the Coast Guard s response to mariners in distress while marine safety focuses on preventing deaths, injuries, and property loss from occurring. 22
23 The second major role is security. The objective for the maritime security role is to establish and maintain a secure maritime system while facilitating its use for the national good. The security role includes the missions of ports, waterways, and coastal security (PWCS), illegal drug interdiction, undocumented migrant interdiction, defense readiness, and other law enforcement activities. The security mission role seeks to protect the nation by preventing illegal or malicious activities from exploiting our nation s vast maritime boundaries. The PWCS mission goal is to deter, detect, prevent and respond to attacks against U. S. territory, population, and critical maritime infrastructure. The illegal drug interdiction mission seeks to halt the flow of illegal drugs into the United States by maritime routes. The undocumented migrant interdiction mission s goal is to interdict undocumented migrants at sea, denying them entry via maritime routes to the United States, its territories and possessions. The goal of defense operations is to defend the nation as one of the five U.S. armed services and enhance regional stability in support of the National Security Strategy, using the Coast Guard s unique and relevant maritime capabilities. And finally, the goal of other law enforcement activities is to prevent and interdict other illegal incursions into the U.S. maritime territories including foreign encroachment of the U.S. exclusive economic zone which is shown in Figure

24 Figure 3-4 Source: Coast Guard Publication 1 Complementing the Coast Guard s maritime security role, the Coast Guard also performs a substantial stewardship role. Here, the Coast Guard seeks to maximize the effectiveness and sustainability of the nation s maritime environs. With the goal of managing the sustainable and effective use of the nation s inland, coastal, and ocean waters and resources for the future national good, the stewardship role includes the following four missions: marine environmental protection, protection of living marine resources, aids to navigation, and ice operations. The marine environmental protection mission seeks to eliminate environmental damage and the degradation of natural resources associated with maritime transportation, fishing, and recreational boating. The living marine resources mission seeks to enforce domestic fisheries law to ensure the sustainability of fish stocks. The goal of the aids to navigation and ice 24
25 operations missions is to facilitate maritime commerce and eliminate interruptions and impediments to the efficient and economical movement of goods and people, while maximizing recreational access to and enjoyment of the water. The relationship between the Coast Guard s safety, security, and stewardship roles and the associated eleven missions is shown in Figure 3-5 below. Safety Security Stewardship Saving Lives & Protecting Property Search and Rescue Marine Safety Establishing & Maintaining a Secure Maritime System while Facilitating its Use for the National Good Ports, Waterways & Coastal Security Illegal Drug Interdiction Undocumented Migrant Interdiction Defense Readiness Other Law Enforcement Managing the Sustainable & Effective Use of its Inland, Coastal, and Ocean Waters & Resources for the Future Marine Environmental Protection Living Marine Resources Aids to Navigation Ice Operations Source: USCG 2008 Budget in Brief and Performance Report Figure
26 D. Mission Performance Goals, Targets, & Outcomes The Coast Guard s multi-mission character is defined by its ability to conduct distinct yet complementary functions in the maritime domain law enforcement, national defense, maritime mobility, maritime safety, environmental protection, and humanitarian response. This unique character positions the Coast Guard to meet a broad range of national interests within the maritime domain. The Coast Guard secures the nation s vast maritime border while ensuring the safe and efficient transportation of people and goods. It protects the marine environment and guards natural resources. It defends our nation at home and abroad alongside the other Armed Services. And it saves the lives of those in distress, both at sea and ashore. U.S. Coast Guard 2008 Budget in Brief and Performance Report The Coast Guard performs its eleven statutorily-mandated missions with a wide array of multimission assets including aircrafts, ships, boats, and command centers. It communicates its desired mission balance to operational commanders, Congress, and eventually the American public through explicitly stated performance goals and target levels of performance for each mission. Table 3-1 summarizes the Coast Guard s performance goals and target levels of performance for fiscal year 2007 for its eleven missions. In addition, the fundamental outcome unit is listed. Since these missions are performed using many of the same or similar assets, how does one apportion, or plan to distribute, those assets to achieve the targeted level of performance? How does one compare the benefit to the American public of improving the percentage of mariners saved versus improving the compliance rate on fishing vessels (which would presumably improve the long-term sustainability of fish stocks)? 26
27 Stewardship Security Safety Mission Role Mission Performance Goal Search and Rescue Marine Safety Ports, Waterways, and Coastal Security Illegal Drug Interdiction Undocumented Migrant Interdiction Defense Readiness Other Law Enforcement Save mariners in imminent danger on our nation s oceans and waterways. Eliminate maritime fatalities and injuries on our nation s oceans and waterways. Reduce homeland security risk in the maritime domain. Increase the removal rate of cocaine. The percentage of the non-commercial maritime flow of cocaine to the U.S. seized, jettisoned, abandoned, or otherwise destroyed. Increase the interdiction rate of illegal migrants (all nationalities) attempting to enter the U.S. via maritime means. Support our national security and military strategies by ensuring assets are at the level of readiness required by the Combatant Commander. Reduce the number of vessel incursions into the U.S. Exclusive Economic Zone (EEZ). Performance Target (FY07) 86% of mariners saved 4,721 or fewer fatalities or injuries 15% reduction in risk 26% removal rate 67% interdiction rate Fundamental Outcome Unit Life Life & injury Risk of terrorist attack Kilogram of cocaine Undocumented migrant 100% readiness Unit readiness level 199 or fewer incursions Vessel incursion Marine Environment-al Protection Living Marine Resources Aids to Navigation Ice Operations Eliminate oil spills and chemical discharge incidents > 100 gallons. Increase the observed compliance rate of domestic fishing vessels. Eliminate collisions, allisions, and groundings by vessels on our nation s oceans and waterways. Maintain operational channels for navigation, limiting channel closures. Table or fewer oil spills & chemical discharges 97% observed compliance rate 1,664 or fewer collisions, allisions, & groundings Less than 2 days during average winters, 8 days during severe winters Oil spill, chemical discharge Compliance rate Collisions, allisions, groundings Channel closure days 27
28 The reader should note that performance targets for some missions are absolute, e.g. 199 or fewer EEZ incursions, while performance targets for other missions are proportional to an unknown future threat, e.g. save 86% of mariners in distress. These differences exist for a number of reasons including the certainty of size of future risk populations, how the Coast Guard apportions and positions assets to perform missions, as well as a variety of other relatively unknown, and possibly unknowable, organizational biases and interests. The purpose of this thesis, however, is not to evaluate the performance goals and their related targets, but probe deeper into the mechanisms and processes used to conduct trade-offs in a multi-mission organization. For this task, the performance goals and related performance targets are of secondary importance. The key piece of information to be examined here is the fundamental outcome unit and its value to society. The Coast Guard s challenge of trading off performance between eleven distinct but complementary missions is but a small subset of the public policy challenges that occur at the federal, state, and local levels. To address this challenge, governmental agencies have attempted to monetize the benefits (or outcomes) of public policy decisions in order to maximize the overall benefit delivered to the public. As outlined in Chapter 1, numerous federal acts and executive orders require federal agencies to perform benefit cost analyses before enacting major public policy decisions. The advantages of monetizing benefits are best stated by Viscusi (2006: pg 1) as follows: 28
29 From an economic standpoint, the advantages of monetizing benefits are quite strong because establishing this kind of metric makes it much easier to compare benefits with costs and make choices across various policy alternatives. Because society s resources are limited, ultimately we must be making choices such as these across different policy domains. To assess which regulatory interventions make sense and which do not, it is essential to have a scorecard by which it is feasible to make such comparisons. Monetization also has an additional practical benefit in a world of regulatory impact analysis. Costs are quantifiable in dollar terms, as are many benefit components, so failing to place a monetary value on seemingly intangible benefits such as environmental amenities may lead to inadequate attention to intangible benefits in the policy choice process. Monetizing these benefits puts them on equal footing with benefits that are perceived to have real economic value because they can be quantified in dollar terms. Monetizing the benefit of eliminating a vessel grounding or preventing a kilogram of cocaine from entering the country for public consumption is difficult but trying to do so is understandable. Benefits, whether they consist of avoiding damage to a ship or general increases in worker productivity and reductions in public health care and law enforcement costs, are tangible and logically limited in scale. Yet the question remains: How does one monetize the value of a human life or preventing an endangered species from becoming extinct? Viscusi (2006) reasons that in order for something to be priceless, it must have infinite economic value. If this were true, then if saving the snail darter is priceless, no amount of monetary cost should be spared in preserving these birds even if it depletes the entire GDP. (Viscusi 2006: pg 2) One does not need to go to the extreme of the previous example to conclude that there are no priceless benefits of public policy. Temporarily setting aside the concept of benefit monetization, the fact that the government simultaneously regulates activities resulting in a myriad of public benefits indicates that these benefits have bounded relative value. If this were 29
30 not the case, government should attempt to regulate activities to achieve the single most valuable benefit before pursuing any other. Public policy benefits can be monetized using a number of different techniques that attempt to quantify the opportunity cost for valuing both benefits and costs. The two most prevalent techniques are willingness-to-pay (WTP) and willingness-to-accept (WTA). Willingness-to-pay techniques measure what individuals are willing to forgo to enjoy a benefit (e.g. pay to prevent something undesirable from happening) while willingness-to-accept techniques attempt to determine how much compensation individuals would be willing to accept for not receiving a potential benefit. In general, economists and government entities favor willingness-to-pay as the preferred measure of opportunity cost although willingness-to-accept valuations may be valid in some circumstances (OMB A ). Some may feel that relative benefit valuation techniques are more ethically and morally acceptable than absolute monetization of benefits. This may be true. However, once a monetary value is assigned to any public policy benefit, the monetary valuations for all benefits could then be derived. For these reasons, I have chosen to research monetary valuations of Coast Guard mission outcomes. Due to the period of time over which research has been performed on various mission outcomes, it is important to identify the time basis for each monetary estimate of public value. I have employed the practice of identifying the reference year for monetary estimates by listing the reference year immediately followed by a dollar sign in parenthesis following monetary estimates. For example, if a study found that a loaf of bread cost one dollar in 2005, the value 30
31 would be listed as $1 (2005$). At the conclusion of Chapter 4, monetary benefits for each Coast Guard mission area will be summarized and calculated with applicable adjustments for inflation to reflect equivalent values in 2007 thereby enabling direct cross-mission comparison. 31
32 Chapter 4: Coast Guard Mission Outcome Valuations I conceive that the great part of the miseries of mankind are brought upon them by false estimates they have made of the value of things. Benjamin Franklin, The Whistle, 1779 The broad roles and associated missions will be discussed using the same structure and order of presentation as discussed in Chapter 3. This chapter is divided into three sections reflecting the Coast Guard s mission roles of safety, security, and stewardship. Each of these three sections is then broken down into sub-sections reflecting the Coast Guard s eleven mission areas. A. Safety The Coast Guard s safety role traces its historical roots back to the heroic rescue and assistance efforts of the early lighthouse keepers, the use of Revenue Marine cutters to assist distressed mariners, the creation of the U.S. Lifesaving Service, and the efforts of the Steamboat Inspection Service. The Coast Guard seeks to prevent injuries and the loss of life through a comprehensive program of preventative and response based actions. Preventative actions include enacting and enforcing safety regulations, inspecting vessel construction to ensure compliance with accepted industry standards and regulations, and monitoring and regulating marine events. Despite these preventive measures, mariners often require assistance or rescue. The Coast Guard responds to mariners in distress with a fleet of multi-mission ships, boats, and aircraft as well as the ability to request and coordinate rescue efforts by other government agencies and individual mariners that may be available to respond. 32
33 1. Search and Rescue there is a great deal of debate about the appropriate value (of a statistical life), and no single dollar figure has been uniformly accepted by the academic community or within the Federal government. Federal Highway Administration Memorandum, 1994 Performance Goal: Save mariners in imminent danger on our nation s oceans and waterways. Fundamental Outcome Unit: Human life Before beginning the summary of research related to the monetization value of a human life, it is important to note that I have cited research to only those efforts that focus on monetizing the value of a statistical life (VSL) and not the value of any single or specific individual. This qualification is important since society s willingness-to-pay would likely vary considerably depending on the individual in question, whether they be the President of the United States, a famous celebrity, a young girl stuck in a well, a convicted murderer, or a homeless person who has all but vanished from society s view. The value of a statistical life estimates society s willingness-to-pay to reduce the risk of death over a given population. To demonstrate the value of a statistical life, consider the following scenario. Assume you live in a city with a population of one million people. The mayor announces that one random citizen will die from a preventable accident. How much are citizens willing to pay to eliminate this known risk? If the population on average indicates it is willing to pay $5 per individual to eliminate the risk, then the resulting value of a statistical life is $5 million. Viscusi (2006) notes that there are two primary means to estimate the value of a statistical life. Estimates can be made by surveying a representative sample of the target population. The 33
34 second and preferred method is to estimate the value of a statistical life by analyzing actual market data that result from public policy decisions. Market data is preferred to survey data because it reflects actual public policy decisions versus stated responses to a hypothetical situation. Several studies have documented the value of a statistical life based on actual public policy decisions. Government and academic studies have documented a wide range of implied values of statistical life. In 1981, the Government Accounting Office conducted a survey of federal agencies and noted: Our survey of a number of Government agencies with responsibility for health and safety regulation indicates that they have little in common in how they assign dollar values to premature death, injury, or illness. The report went on to summarize its findings that included Cost per Life Saved values ranging from $72 thousand for kidney transplants to $4.5 million for jet plane ejector seats to greater than $158 million for OSHA coke oven emissions standards. (GAO 1981) One of the most comprehensive and respected studies was completed by Viscusi and Aldy (2003) which compared the value of statistical life based on 16 regulatory decisions completed by U.S. agencies between 1985 and The resulting analyses revealed an average value of statistical life of $3.8 million (2000$) with a range of $1M -$6.3M million. The first question to be asked is: Are all values of statistical life the same? The academic literature indicates they are not. Sunstein (2004) asserts that value of statistical life estimates can be further broken down based on the target population s wealth, gender, race, age, nationality and income level (and presumably job type). Viscusi and Aldy (2003) support the 34
35 development of more targeted valuations of statistical life estimates and argue such measures should be a priority for the research community and government agencies. They suggest that improved estimates could result in better government interventions to address environmental, health, and safety risks. Research supports the concept of adapting the value of statistical life estimates for target populations based on age, income, and nationality (Aldy and Viscusi 2003, Viscusi 2006). Viscusi and Aldy (2003) have also found that the value of statistical life decreases with age once an individual passes prime working years. More specifically, the value of statistical life estimates for individuals in their early 60 s is percent lower than the average for the general population and 50-66% less than that of prime aged workers (Viscusi and Aldy 2003). One common alternative to estimating value of statistical life based on age is to divide the value of statistical life for a prime aged worker by the estimated years of life resulting in a value per life, per year. This approach should be treated with caution because it assumes all remaining years of life are of equal value (Viscusi 2006). Research also supports varying estimates of the value of statistical life based on income level, and, by derivation, nationality. More specifically, Viscusi estimated changes in income level to have a 0.5 to 0.6 elastic effect on value of statistical life estimates. For example, a 20% increase in income results in a 10-12% increase in estimated value of statistical life values (Viscusi 2006). As a result, workers in developing countries have significant, but smaller, values of statistical life consistent with relative income level elasticity. (Viscusi and Aldy 2003: pg 63) 35
36 While research supports the existence of different value of statistical life estimates, is it fair to those populations who have a lower value of statistical life? Addressing the moral implications of different estimates is beyond the scope of this thesis; however, Sunstein presents an interesting perspective on the ethical aspects of income based value of statistical life estimates: With respect to persons, the argument is more controversial, above all because it treats poor people as less valuable (literally) than rich people. But at least at first glance, differences are appropriate here as well. The reason is not that poor people are less valuable than rich people. It is that no one, rich or poor, should be forced to pay more than they are willing to pay for the reduction of risks. This idea embodies a norm of equality. And if poor people are unwilling to pay much for the reduction of serious risks, the appropriate response is not a compelled purchase, but a subsidy. (Sunstein 2004: pg 29) Sunstein (2004) supports the individualization of risk reduction measurement and notes that while it is impossible to implement from a regulatory perspective, every person should be given regulatory risk protection commiserate with their personal willingness-to-pay criteria. The idea that individuals self-select an equivalent value of statistical life based on their individual risk decisions has potentially profound impacts on public policy. Consider the research of Ashenfelter and Greenstone (2003) who estimated the value of statistical life based on a population s actual risk trade-off decisions in a voluntary setting. They evaluated the benefits and costs associated with driving speed in states that raised highway speed limits. Based on the 21 states that were able to provide complete data, the increased driving speeds resulted in approximately 125,000 transit hours saved for every life lost. Applying average hourly wage rates, this results in a savings of approximately $1.54 million (1997$) per fatality. The interesting aspect of this research, however, is that it represents a 36
37 rare opportunity to base the value of statistical life estimates on the public s voluntary behavior (e.g. whether to drive faster) in light of a known safety risk. Whether an individual truly understands the incremental change in risk associated with increasing their driving speed by a few miles per hour can be debated. However, this approach is interesting since it is contrasted against other public policy decisions where a remote third party is enacting regulations on disparate population segments (e.g. air travelers versus construction site workers). Ashenfelter and Greenstone (2003: pg 2) concluded: Speed limit regulations, however, provide benefits (reduced travel time) and costs (fatality risk) to precisely the same people, so that appeals to a simple model of the typical voter are far more plausible in this context. How should public policy address the fact that some individuals are willing to undertake behaviors with known safety risks? This question has implications for the Coast Guard. First, the fishing profession, for example, is routinely cited as one of the most dangerous occupations in the world. The Coast Guard regulates certain aspects of the fishing industry and responds to save fishermen in distress. Similarly, should the Coast Guard account for individual risk behaviors including extreme sports (e.g. powerboat racing, kite surfing), endurance events (e.g. solo circumnavigation of the world, transoceanic rowing attempts), individuals who disregard regulations (e.g. carrying too few personal floatation devices), and undertake questionable risk taking behavior (e.g. transiting during inclement conditions or weather)? The Environmental Protection Agency identified that value of statistical life studies often do not fully reflect consumer costs to reduce risks or account for related benefits incidental to taking an averting action. As a result, consumer market studies may underestimate value of statistical life estimates (EPA 2000). This factor becomes especially important for populations that 37
38 undertake actions that have a perceived level of heightened risk as individual risk mitigation actions could play an even greater role. As indicated earlier in this chapter, there exists a range of value of statistical life estimates. Viscusi and Aldy (2003) concluded that while estimates vary across studies, the consensus value of statistical life for prime-aged workers has a median value of about $7 million in the United States. From the public policy side, the Environmental Protection Agency, the source agency for many costly federal regulations, has published a guide specifically addressing the proper conduct of benefit-cost analyses in a regulatory setting. Based on its evaluation of 26 different value of statistical life studies, the guide recommends use of $4.8 million (1990$), updated to the base year of the analysis, as a value of statistical life estimate (EPA 2000). The Federal Aviation Administration recommends use of $3 million (2001$) as a value of statistical life (GRA 2007) which is consistent with its parent department, the Department of Transportation, which recommends use of $3 million (2001$) (DOT 2002). Contrary to DOT guidance, the Federal Highways Administration used a value of statistical life value of $3.5 million (2001$) in its benefit analysis of proposed tire pressure measurement system regulations (DOT 2005). In September 2007, the Bureau of Customs and Border Protection issued a proposed rulemaking citing benefit cost analyses using two different value of statistical life estimates, $3 million and $6 million (Federal Register 72:180). In contrast, the Office of National Drug Control Policy estimated the mortality losses associated with drug-related deaths. The losses, which were discounted to account for lost lifetime market and household productivity, averaged $1 million per death (ONDCP 2004). 38
39 Determination of the value of statistical life estimate for Coast Guard use is a policy decision that should be coordinated within the Department of Homeland Security. Given its extensive history on studying the value of statistical life, the Environmental Protection Agency appears to be the lead federal agency in statistical life estimations for public policy use. In addition, the Environmental Protection Agency s transparency in how their value of statistical life estimates are developed and applied adds credibility and confidence to their use. Therefore, the Environmental Protection Agency s value of statistical life estimate of $4.8 M (1990$), updated to the base year of analysis, should be the default value used for future public policy decisions. 39
40 2. Marine Safety The injuries we do and those we suffer are seldom weighed in the same scales Aesop BC Performance Goal: Eliminate maritime fatalities and injuries on our nation s oceans and waterways. Fundamental Outcome Unit: Human life, human injury Given the development of value of statistical life estimates, this section focuses on the economic valuations associated with preventing human injuries. The concept of the value of statistical injury closely follows the concept of value of statistical life with the primary focus being on the loss of economic utility. One of the most referenced studies on value of statistical injury was completed by Miller, Luchter, and Brinkman (1989) which based cost per injury on widely accepted abbreviated injury scale (AIS) criteria as summarized in Table 4-1. The maximum AIS (MAIS) level represents the highest injury level for victims receiving multiple injuries. Table 4-1: Cost Per Injury Based on Maximum AIS Severity Cost per Injury Severity Description (1986$) MAIS6 Fatality $2,000,000 MAIS5 Critical $1,525,000 MAIS4 Severe $375,000 MAIS3 Serious $115,000 MAIS2 Moderate $36,000 MAIS1 Minor $4,000 The values represent expected loss of economic utility only. In addition, Miller (1989) noted that treatment costs combined with the associated loss of utility may result in economic costs for some debilitating injuries that exceed the value of statistical life. For example, a MAIS 5 40
41 burn may result in $3.6 million (1986$) in treatment costs and loss of economic utility; MAIS 5 disabling head injury $3.2 million, MAIS 5 quadriplegia $2.6 million, MAIS 4 disabling head injury $2.9 million, and MAIS 4 quadriplegia $2.2 million (Miller 1989). One particularly difficult aspect of monetizing statistical injuries is that large percentages of the general population participate in activities that are detrimental to their own health which can then be used to estimate their personal attitudes toward risk. Specifically, Viscusi (2006) found that smokers exhibit behaviors that reflect an implicit value of $20,000 per statistical injury versus $39,000 for people who don t smoke prompting the question of how public policy should account for differing valuations based on demonstrated risk tolerances and behaviors. Use of value of statistical injury estimates by government agencies has a long history. In 1981, the Department of Transportation issued guidelines specifying the average monetary value for injuries for use in regulatory evaluations. Critical injuries (survival uncertain) were assigned a value of $230,000, severe injuries (life threatening, survival probable) $102,000, moderate injuries $68,000, and minor injuries $3,400 (1981$) (DOT 1981). Citing the work performed by Miller, Luchter, and Brinkman (1989), the Department of Transportation updated its guidance and issued comprehensive costs based on the abbreviated injury scale. Despite the use of the word comprehensive and a definition that comprehensive costs include medical treatment, the estimates below do not reflect Miller s findings that value of statistical injury for some situations can exceed the value of statistical life. 41
42 Table 4-2: Comprehensive Costs per Injury (DOT Tech Advisory, 1994) Comprehensive Cost Severity Descriptor per Injury (1994$) MAIS6 Fatality $2,600,000 MAIS5 Critical $1,980,000 MAIS4 Severe $490,000 MAIS3 Serious $150,000 MAIS2 Moderate $40,000 MAIS1 Minor $5,000 In its 2005 benefit cost analysis on Tire Pressure Monitoring Systems, the Federal Highways Administration used the following equivalency scale for estimating the value of statistical injuries relative to the value of statistical life estimates. Table 4-3: Relative Value per Injury (DOT TPMS, 2005) Relative Value per Severity Description Injury (2000$) MAIS6 Fatality MAIS5 Critical MAIS4 Severe MAIS3 Serious MAIS2 Moderate MAIS1 Minor The ability to link injury levels to the statistical value of life is desirable from a public policy standpoint. This structure allows for consistent and repeatable calculation of benefit values for scenarios in which a mixture of fatalities and injuries are possible. In situations where statistical value of life estimates are developed for a specific population, the use of relative injury values allows for a consistent application of relative value of injuries. 42
43 B. Security Any society that would give up a little liberty to gain a little security will deserve neither and lose both. Benjamin Franklin, The United States has more than 19,000 miles of land and maritime borders. Securing the more than 12,000 miles of maritime borders, which consists of over 95,000 miles of shoreline, is further complicated by the presence of more than 300 relatively open ports and a high level of commercial maritime and recreational boating traffic. In recent years, the United States has improved security of its air, land, and maritime borders. However, the maritime border s size makes it a more attractive point of entry as the nation increases air and land border security. Balanced security across all three border regimes is necessary to improve the nation s overall security. The overarching goal of the security mission role is to establish and maintain a secure maritime system while facilitating its use for the national good. The Coast Guard breaks the overarching security mission role into the following five mission areas: Ports, Waterways, and Coastal Security, Illegal Drug Interdiction, Undocumented Migrant Interdiction, Defense Readiness, and Other Law Enforcement. 43
44 1. Ports, Waterways, and Coastal Security We will bankrupt ourselves in the vain search for absolute security. Dwight D. Eisenhower, Performance Goal: Reduce homeland security risk in the maritime domain. Fundamental Outcome Unit: Risk of terrorist attack Due to the complexities of monetizing the economic value of national security and relative risk of attack, I was unable to locate many references to take up this challenging problem. The PWCS mission is a trade-off. On one hand, approximately 95 percent of all U.S. overseas trade moves by water (Loy 1999) and contributes more than $700 billion per year to the national economy (U.S. Commission Ocean Policy 2004). This volume requires an extremely efficient transportation system. Transportation delays can prove costly. Jones (2005) estimated the economic costs of delaying the container ship CSAV RIO PUELO, carrying 1,084 containers of cargo including five containers of Argentine lemons, for six days. An anonymous source alleged that the lemon shipment may contain a hazardous biological agent. The resulting commercial delays, response efforts, and loss of perishable cargo totaled more than $1.5 million. No biological agent was found. If this scenario were played out at the port level (i.e. the entire port gets shut-down), the potential economic costs grow substantially. The Congressional Budget Office estimates that a one week closure of the port of Los Angeles/Long Beach would result in approximately $450 million, or the equivalent of $65 million per day, in cargo delay costs alone (Congressional Budget Office 2006). This figure does not include any costs associated with response, investigation, or mitigation actions. Homan and Steiner (2007) estimated that policy changes resulting in a 4 44
45 hour increase in shipping time for containerized cargo would result in a $117.3 million decrease in U.S. gross domestic product while a similar increase in shipping times in the ports of Los Angeles/Long Beach would reduce U.S. gross domestic product by $58.9 million. These costs are balanced by potentially devastating costs that would be associated with a successful terrorist attack in the maritime domain. Volpe (1991: Vol III Exhibit 3.1) estimated that estimated that the economic impact of a liquefied natural gas release resulting from a ship collision in Everett, Massachusetts could result in over 3,500 fatalities and property damage exceeding $230 million (1990$). The largest challenge associated with estimating the economic benefits of Coast Guard PWCS mission outcomes does not lie in estimating the economic impacts associated with various action alternatives. The more challenging aspect is to quantify the Coast Guard s ability to influence the actual risk, and more specifically, the intent and capability of would-be attackers. I was unable to locate work done in this domain. 45
46 2. Illegal Drug Interdiction Performance Goal: Increase the removal rate of cocaine. The percentage of the noncommercial maritime flow of cocaine to the U.S. seized, jettisoned, abandoned, or otherwise destroyed. Fundamental Outcome Unit: Kilogram of cocaine Stemming the use of illegal drugs in the United States requires a balanced strategy of prevention, treatment, interdiction, and law enforcement. This section is limited to the examination of interdiction efforts in the maritime domain. The Coast Guard is designated as the lead federal agency for maritime drug interdiction. It also shares lead responsibility for air interdiction with the U.S. Customs Service. Currently, the Coast Guard focuses its effort on stopping the flow of cocaine as it is the primary illegal drug destined for the United States conveyed via the maritime domain. The Coast Guard's mission is to reduce the supply of drugs by removing cocaine as it is transported through in the Transit Zone, a six million square mile area, including the Caribbean, Gulf of Mexico and Eastern Pacific. The Office of National Drug Control Policy completed a report in 2002 that estimated the economic costs of illicit drug use including the associated law enforcement costs. The report did not include costs related to abuse of legal substances (e.g., alcohol, tobacco, and prescription medications). The report found that illegal drug use cost the U.S. an estimated $180.9 billion in These costs were distributed between lost productivity (71% - $128.6 billion), health care (9% - $15.8 billion), and other (20% - $36.4 billion); (ONDCP 2002). Productivity losses include losses due to premature death, drug-related illnesses, 46
 The largest component of the productivity loss results from criminal activity, including")
47 hospitalization, incarceration, and crime related activities. As shown in Table 4-4, illegal drug use is one of the three most costly health problems facing the U.S. (ONDCP 2002). Table 4-4: Comparison of Costs of Major Health Problems in US (Costs in billions of estimate year dollars) The largest component of the productivity loss results from criminal activity, including lost productivity attributable to the more than 660,000 offenders incarcerated for drug-related crimes (ONDCP 2002). In addition, there were an estimated 23,500 drug-related deaths (e.g., overdose, poisoning, homicide, HIV and hepatitis B/C due to drug related needle sharing) in Taking into account other associated enforcement and corrections efforts, an estimated one million person years of effort could have been available for economically productive activities were it not for illegal drug use and related criminal activities (ONDCP 2002). When 47
48 crime-related lost productivity, health care, and other costs are aggregated, the total economic impact of drug-related crime is $107.8 billion per year. One challenging aspect of the ONDCP s report is that it does not break out economic costs by illegal drug type. In order to estimate the economic value associated with cocaine use, a method to disaggregate the economic costs of illegal drug use must be developed. One possible method is to estimate the percentage of cost associated with various drug types based on an underlying cost driver. Two possible approaches would be to use the perceived seriousness of the drug threat and relative drug-related arrest rates. A survey of local and state agencies identified the following percentages for greatest drug threat: methamphetamine 35%, cocaine 40%, marijuana 12%, heroin 8%, and pharmaceuticals 5% (Dept of Justice NDIC 2007). Since crime-related costs account for a large percentage of economic costs, drug-specific arrest rates could also be used to estimate a disaggregated cost. In 2002, there were 33,692 drug arrests for federal offenses; 37% for cocaine, 22% for marijuana, 13% for methamphetamine, 6% for heroin, and 22% for other drugs (Dept of Justice 2004). Looking beyond federal offenses, in 2002 there were an estimated 1,535,800 arrests for drug law violations at the federal, state, and local levels in the U.S. Of these, the break-down between drug types were as follows: 30% for cocaine and heroin, 45% for marijuana, 5% for synthetic drugs, 20% for other (Dept of Justice 2004). Assuming a similar ratio of cocaine versus heroin arrests at the federal level, this would result in the following estimated break-down for drug law arrests at the federal, state, and local level: 26% for cocaine, 45% for marijuana, 4% for heroin, 5% for synthetic, and 20% for other. Arguably, the social economic costs of a cocaine arrest are 48
49 greater than that of a marijuana arrest so estimating cocaine s contribution to the overall drugrelated costs at 26% should be conservative. Combining the relative arrest rate and perceived drug threat rates results in cocaine accounting for an estimated 26-40% of the U.S. drug related economic costs, or $ billion (2002$). Since an estimate of street availability of cocaine in 2002 was not publically available, an estimate of street availability for 2001 will be used. Given an estimated 265 metric tons of cocaine were available for retail sale in U.S. in 2001 (Dept of Justice 2002), the average economic impact of keeping one kilogram of cocaine from being consumed, whether through prevention, treatment, or enforcement, is approximately $177,000-$273,000, with an average value of $225,000 per kilogram (2002$). 49
50 3. Undocumented Migrant Interdiction "Give me your tired, your poor, Your huddled masses yearning to breathe free, The wretched refuse of your teeming shore. Send these, the homeless, tempest-tost to me, I lift my lamp beside the golden door!" Emma Lazarus, The New Colossus, 1883 Performance Goal: Increase the interdiction rate of illegal migrants (all nationalities) attempting to enter the U.S. via maritime means. Fundamental Outcome Unit: Undocumented migrant The United States is predominately a nation of immigrants. Our borders have never been completely open or closed with respect to immigration resulting in strong polarization of beliefs on how best to address immigration and related public policies. As a law enforcement agency, the Coast Guard s assigned role is to enforce immigration laws at sea. At-sea interdiction efforts prevent the loss of life by intercepting migrant vessels that are often dangerously overloaded, enable timely return of undocumented migrants to their country of origin, and support the nation s legal migration system. Like many public policies, the United States immigration policy has evolved and changed over time. In 1965, passage of the Immigration and Naturalization Act replaced immigration quotas based on national original with a system that favored family unification and certain occupational skills. This law resulted in a shift in overall immigration demographics, increasing immigration rates from Latin America and Pacific Rim countries while decreasing immigration from Western European countries (Smith and Edmonston 1997). The Immigration Reform and Control Act of 1986 mandated employer verification of legal immigration status but created new legal status termed alien lawfully admitted for temporary residence to account for illegal 50
51 immigrants who could prove long-term and continuous residence in the United States (Smith and Edmonston 1997). Partially offsetting this shift in immigration policy, the Personal Responsibility and Work Opportunity Reconciliation Act of 1996 restricted noncitizen legal immigrants from receiving access to select public programs (Smith and Edmonston 1997). The ebb and flow of public policy combined with the future prospects of a globalized economy fueled research into the economic value of immigration. Vernez and McCarthy conducted an analysis of immigration studies and found, not surprisingly, that immigration studies often had inconsistent findings. The benefits of immigrants ranged from an annual cost of $1,400 per immigrant to an annual benefit of $1,600 per immigrant (Vernez and McCarthy 1996). This range of economic values was due in part to differing definitions of who is an immigrant, unavailability of data, different treatment of public services consumed and benefits derived, and the overall lack of a consistent accounting framework (Vernez and McCarthy 1996). With regard to defining who is an immigrant and who is not, all studies included foreign born noncitizens but often treated naturalized immigrants and children of immigrants, both legal and illegal, differently. In addition, they found that most studies included public services provided to individuals (e.g. education, medical, social services) but did not account for more general economic costs and benefits (e.g. national defense, interest on the national debt). Likewise, studies generally included benefits derived from individuals (e.g. income, property and sales tax), but excluded more general sources of revenue (e.g. business and corporate revenues and taxes). They also found that often immigrants are net consumers of public services, not because of their immigration status, but because of their generally low income levels (Vernez and McCarthy 1996). Given this bias towards income level versus immigration status plus the 51
52 fact that economic values vary with age and employment, Vernez and McCarthy recommend that economic impacts be measured over the duration of an immigrant s residence and that policy debates be focused on selectivity of admission based on long-term costs and benefits. One comprehensive study that tried to address the shortcomings of previous works was completed by the National Research Council in This study, entitled The New Americans: Economic, Demographic, and Fiscal Effects of Immigration, evaluated the economic impacts of immigrants; it did not differentiate between legal and illegal immigrants. It also looked at the overarching economic impacts of immigration. One such impact was that immigration acts like international trade to dissolve the rigid link between domestic production and consumption (Smith and Edmonston 1997). As a result, residents with higher skill and capital levels benefit from immigrant labor while domestic workers with skills comparable to immigrants experience reduced wages from labor competition. When trade becomes more open, which it has in the 10 years since the study was completed, the negative wage effects that immigrants have on domestic workers becomes less severe (Smith and Edmonston 1997). The study also found that all segments of society benefit when immigrant labor performs jobs that would otherwise go unfilled. With regard to specific economic impacts, New Americans found the overall economic benefit from immigration is $ billion annually; however, the benefits and costs are not distributed equally throughout the country. States or localities of immigrant residence bearing the bulk of the fiscal burden with non-residency states experiencing a net economic benefit (Smith and Edmonston 1997). 52
53 The two primary determinants of economic contribution are educational level and age with education level playing the predominant role. In general, the higher an immigrant s education level, the greater their economic contribution. For individual immigrants (i.e. not counting the economic contributions of their descendents), the economic impact for immigrants with less than a high school education is -$89,000, with a high school education -$31,000, with a greater than high school education $105,000 resulting in an average economic impact of -$3,000 per immigrant (Smith and Edmonston 1997). If the economic impacts of future generations are included, the economic impact for immigrants with less than a high school education is - $13,000, with a high school education $51,000, with a greater than high school education $198,000 resulting in a average economic impact of $80,000 per immigrant and future descendents (Smith and Edmonston 1997). It should be noted that the New Americans study included economic contributions of future generations spanning 300 years, the duration of which is highlighted by the study s detractors (Camarota and Bouvier 1999). Expanding the evaluation to include age, economic contributions are greatest for immigrants at or just before their prime wage earning years. Older immigrants generally consume services at a higher rate without offsetting contributions during their prime wage earning years. The fiscal impacts for an individual immigrant are positive for those with greater than high school education up to their late 40 s, for those with a high school education a positive impact is experienced up to their mid 30 s, and for those with less than a high school education a positive impacts is experienced up to their mid 20 s (Smith and Edmonston 1997). 53
54 Taking average education level and age of entry into account, the net effect of immigration from Latin America is negative while immigration from Canada and Europe is positive. The fact that most immigrants arrive at a relatively young working age reduces the net negative impacts of Latin American immigrants (Smith and Edmonston 1997). Given this construct, I will now focus on the current scale of illegal immigration in the United States. Government agencies have recently updated their terminology to reflect today s illegal immigration situation. The term unauthorized migrant is now used to describe foreign citizens residing in the United States illegally and includes immigrants who enter the country without proper approval and immigrants who violate the terms of their temporary admission program (CBO 2007). The Department of Homeland Security estimated that 11.6 million unauthorized migrants were residing in the United States as of January 2006 (DHS 2007). Given this large unauthorized migrant population, it is valuable to better understand their demographics. Approximately 80% of unauthorized migrants originate from Latin American countries with the remainder almost equally split between Asian countries and the rest of the world (Passel 2005). In addition, unauthorized migrants, as a general population, are much younger than the average United States resident and legal immigrant population. Approximately 84% of working age (18-64 years old) unauthorized migrants are younger than age 45 compared to approximately 60% of native and legal immigrants (Passel 2005). Educationally, unauthorized migrants lag both legal immigrants and the native population. Approximately 49% of unauthorized migrants lack a high school education, compared to 25% of legal immigrants and 9% of the native population. Conversely, 25% of unauthorized migrants 54
55 are educated beyond the high school level compared to 50% of legal immigrants and 59% of the native population. These differences in education level are reflected in average family income estimates. In 2004, unauthorized migrants earned an average of $27,400 per family which was 57% of the average family income earned by legal immigrants and native families (Passel 2005). The fact that unauthorized migrants possess differing economic impacts based on education level and age has several public policy implications. Should immigration policies be further adapted to allow, or even encourage, immigration by persons with advanced education? Should enforcement efforts target undocumented migrants originating from countries with lower educational levels? Or does national sovereignty, through control of our borders, outweigh any differences in economic impacts of unauthorized migrants from one country versus another? Regardless of the answer to these policy questions, the use of economic impact estimates to quantify the overall value of enforcement efforts appears valid. More accurate economic impacts can be developed by tying economic impact to unauthorized migrants education level; -$89,000 for unauthorized migrants with less than a high school education, -$31,000 for those with a high school education, and $105,000 for those possessing advanced education (1999$). Applying the demographic educational profiles for unauthorized migrants reported by the Pew Institute, the average economic impact of an unauthorized migrant is -$25,410 (1999$). Restated in a manner more consistent with other mission performance outcomes, the public service benefit of interdicting an unauthorized migrant is $25,410 (1999$). 55
56 4. Defense Readiness Performance Goal: Support our national security and military strategies by ensuring assets are at the level of readiness required by the Combatant Commander. Fundamental Outcome Unit: Unit readiness level The outcome value of the Coast Guard s defense readiness mission could be quantified by estimating the equivalent life-cycle costs required for the Department of Defense to perform defense related activities and capabilities currently assigned to the Coast Guard. This benefit would need to be offset by the Coast Guard s reduced performance of non-defense missions while actively supporting Combatant Commanders as well as any additional costs associated with maintaining defense readiness in excess of that required for non-defense missions. Unfortunately, I was unable to locate any references in the public domain that estimated these economic values. 56
57 5. Other Law Enforcement Performance Goal: Reduce the number of vessel incursions into the U.S. Exclusive Economic Zone. Fundamental Outcome Unit: Vessel incursion The U.S. Exclusive Economic Zone is the largest in the world, containing 3.4 million square miles of ocean and 90,000 miles of coastline. While the U.S. Exclusive Economic Zone protects the U.S. claim to all resources located within the zone including minerals, vegetation, and animals, the majority of vessel incursions occur for the taking of fishery resources. The Magnuson- Stevens Fisheries Conservation and Management Act (MSFCMA) of 1976 extended U.S. fisheries management authority out to the full 200 miles authorized by international law. The three most frequent threats to the U.S. Exclusive Economic Zone occur near the maritime boundary with the former Soviet Union west of Alaska, the border with Mexico in the Gulf of Mexico, and along the international boundary with Canada in the Great Lakes. Unfortunately, no studies assessing the economic costs associated with vessel incursions of the U.S. Exclusive Economic Zone were located. 57
58 C. Stewardship The same challenges of scope and breadth of area of responsibility that apply to safety and security missions also apply to the Coast Guard s stewardship role. The Coast Guard s stewardship role is defined as managing and sustaining the effective use of its inland, coastal, and ocean waters and resources for the future. It includes a variety of mission areas ranging from environmental protection, to aids to navigation, to ice operations, each enabling the nation to make best use of its present and future maritime resources. 1. Marine Environmental Protection Performance Goal: Eliminate oil spills and chemical discharge incidents >100 gallons. Fundamental Outcome Unit: Oil spill, chemical discharge Estimating ecological benefits is a complex science that must incorporate benefits derived from direct and indirect market and non-market impacts. Due to the resulting complexity of the problem, economic impacts are often estimated for individual ecological benefits then summed rather than estimating the overall benefit or replacement cost for an ecosystem (EPA 2000). The Coast Guard seeks to accomplish its goal of eliminating oil spills and chemical discharges, and minimizing the damage resulting from incidents that do occur, through a combined program of regulatory actions, facility inspections, and timely response to reported incidents. Regardless of the cause of an oil spill or chemical discharge, the economic impact remains. Several studies have attempted to estimate the economic impact of oil spills and chemical discharges. In fact, the economic impact of an oil spill or chemical discharge is highly dependent on a number of variables including the geographic location, the type of material 58
59 spilled, the size of the spill, the distance from shore or sensitive habitats, as well as the effectiveness of recovery and clean-up efforts. Before discussing the economic value of preventing oil spills and chemical discharges from occurring, it is important to determine whether regulatory actions can influence the occurrence of incidents. Grau and Groves (1997) concluded that while Coast Guard enforcement efforts decreased both the frequency and size of oil spills, the threat of penalty fines had no appreciable impact in the frequency or size of oil spills. In addition, Grau and Groves found that use of a performance measurement system did improve the effectiveness of Coast Guard actions (1997). Several studies assessed the economic impacts or costs associated with a limited number of cost categories that could result from an oil spill or chemical discharge in the marine environment. An extensive study completed by the Volpe National Transportation Systems Center estimated the economic costs associated with the reduction of maritime accidents as part of a benefit-cost study for the expansion of vessel traffic management systems (i.e. similar to air traffic control but for large commercial shipping in busy ports). A subset of the economic impacts associated with maritime accidents was potential environmental damage resulting from spilled oil or chemical discharge. The Port Needs Study (Vessel Traffic Services Benefits) estimated the economic costs associated with natural resource losses, recreation and tourism losses, affected property value losses, cleanup costs, economic losses of subsistent populations, and environmental damage assessment costs (Volpe 1991). The study estimated economic impacts of additional factors including vessel repair costs, cost of idled vessels, commodity 59
60 losses, and fatalities and injuries which are not discussed in this section due their independence from environmental damage costs. Volpe (1991) estimated economic impacts resulting from natural resource losses by applying the Natural Resource Damage Assessment Model for Coastal and Marine Environments (NRDAM/CME) developed by the U.S. Department of the Interior. Spill scenarios were run for three different spills sizes small (0-10,000 gal), medium (10, ,000 gal), large (100, ,000) with loss estimates for catastrophic spills (+750,000 gal) extrapolated from model results for a large spill. These spill categories were then modeled using spills sizes of 8,000 gal, 90,000 gal, 500,000 gal, and 4,000,000 gal, respectively. Since the environmental impacts are geographically dependent and reflect animal species specific to the locale, economic impacts are listed by major port. In addition, the type and toxicity of prevalent cargos must also be factored in to reflect expected damages. Table 4-5 lists the economic impacts resulting from natural resource losses by major port for prevalent cargos transported through that port. 60
61 Table 4-5: Natural Resource Loss per Spill for Prevalent Commodities Shipped thru Port (1990$) Port Small (8K gal) Medium (90K gal) Large (500K gal) Catastrophic (4M gal) 01-Boston $7,950 $109,300 $599,700 $4,797, Puget Sound $19,357 $223,321 $1,702,786 $13,622, Los Angeles/Long Beach $42,000 $281,125 $1,372,875 $10,983, Santa Barbara $37,500 $473,000 $3,048,500 $24,388, Port Arthur $352,250 $3,562,550 $21,265,150 $141,637, New Orleans $237,083 $4,005,667 $22,511,292 $180,090, Houston/Galveston $1,028,235 $8,388,765 $32,696,353 $173,209, Chesapeake Bay $7,833 $96,278 $572,556 $4,580, Baltimore $15,700 $1,963,300 $29,968,500 $266,748, Corpus Christi $34,000 $445,625 $13,455,563 $107,644, New York $42,227 $503,818 $3,209,864 $25,678, Long Island Sound $35,933 $320,267 $1,479,867 $9,918, Philadelphia $33,895 $386,474 $2,230,789 $17,846, San Francisco $37,333 $569,400 $3,865,467 $30,923, Portland OR $30,286 $289,929 $1,582,286 $12,658, Cook Inlet $78,273 $257,545 $841,000 $6,728, Portland ME $13,667 $148,500 $835,167 $6,681, Portsmouth $9,833 $90,750 $499,583 $3,996, Providence $48,250 $928,375 $10,297,500 $82,380, Wilmington $198,250 $2,114,083 $8,351,667 $66,813, Jacksonville $34,000 $471,667 $2,994,000 $23,952, Tampa $40,333 $322,111 $1,557,778 $12,462, Mobile $192,842 $4,272,000 $32,367,158 $258,937,263 Average $128,257 $1,511,209 $9,438,652 $70,109,150 Values derived from data contained in Port Needs Study (Volpe Vol III 1991: Table 6-3) The environmental impact results can further be summarized according to commodity type. Natural resource losses by commodity type, averaged across the 23 ports studied, are shown in Table
62 Table 4-6: Natural Resource Loss per Commodity Type Spill (1990$) Commodity Small (8K gal) Medium (90K gal) Large (500K gal) Catastrophic (4M gal) 1311-(crude) $31,673 $219,855 $1,072,273 $8,578, (sodium hydroxide) $6,000 $227,000 $1,748,000 $13,984, (alcohol) $1,996,727 $17,726,091 $67,504,273 $351,865, (benzene, toluene) $137,167 $1,191,500 $4,896,167 $38,836, (gasoline) $114,642 $2,413,481 $20,917,049 $167,336, (jet fuel) $10,714 $86,143 $947,286 $46,149, (kerosene) $2,111 $24,778 $165,333 $1,322, (#2 fuel oil) $94,372 $1,082,000 $7,365,705 $58,556, (#6 fuel oil) $24,411 $187,822 $982,033 $7,856,267 Average $128,257 $1,511,209 $9,438,652 $70,109,150 Values derived from data contained in Port Needs Study (Volpe Vol III 1991: Table 6-3 The economic impacts to recreation and tourism losses resulting from a petroleum spill are listed in Table 4-7. In addition to recreation and tourism losses, economic impacts to property values were also estimated and are listed in Table
63 Table 4-7: Losses to Recreation & Tourism Due to Releases of Petroleum and Petroleum Products (1990$ per Barrel Reaching Shore) Petroleum Port Petroleum Table 4-8: Lost Property Value Due to Releases of Petroleum and Petroleum Products (1990$ per Barrel Reaching Shore) Petroleum Product Product Port Petroleum Boston $213 $160 Boston $614 $460 Puget Sound $341 $255 Puget Sound $2,104 $1,578 Los Angeles $2,524 $1,892 Los Angeles $10,522 $7,891 Santa Barbara $2,788 $2,091 Santa Barbara $10,522 $7,891 Port Arthur $678 $509 Port Arthur $140 $105 New Orleans $678 $509 New Orleans $70 $53 Houston/Galveston $678 $509 Houston/Galveston $526 $395 Chesapeake Bay $1,008 $755 Chesapeake Bay $701 $526 Baltimore $1,008 $755 Baltimore $701 $526 Corpus Christi $678 $509 Corpus Christi $701 $526 New York $213 $160 New York $614 $460 Long Island Sound $213 $160 Long Island Sound $1,228 $921 Philadelphia $1,008 $755 Philadelphia $701 $526 San Francisco $461 $346 San Francisco $1,403 $1,052 Portland OR $341 $255 Portland OR $2,104 $1,578 Cook Inlet $3 $2 Cook Inlet $140 $105 Portland ME $213 $160 Portland ME $701 $526 Portsmouth $213 $160 Portsmouth $701 $526 Providence $213 $160 Providence $1,228 $921 Wilmington $593 $444 Wilmington $526 $395 Jacksonville $593 $444 Jacksonville $526 $395 Tampa $421 $316 Tampa $2,104 $1,578 Mobile $253 $190 Mobile $526 $395 Average $667 $500 Average $1,700 $1,275 Data obtained from Port Needs Study Data obtained from Port Needs Study (Volpe Vol III 1991: Table 6-4) (Volpe Vol III 1991: Table 6-5) The economic impact estimates resulting from recreation and tourism losses and property value losses are based on the amount of petroleum product that lands on shore. Table 4-9 provides point estimates for percent of oil products spilled that reach shore. This value is highly dependent on prevailing weather conditions. 63
64 Table 4-9: Percent of Spilled Oil and Oil Product Reaching Shore Commodity Code Commodity Name Percent 1311 Crude Oil 60% 2811 Petroleum Product 15% 2817 Benzene, Toulene 10% 2911 Gasoline 10% 2912 Jet Fuel 35% 2913 Kerosene 35% 2914 Distillate Fuel Oil 45% 2915 Residual Fuel Oil 70% Data obtained from Port Needs Study (Volpe Vol III 1991: Table 6-6) The information contained in Tables 4-7 through 4-9 can be combined to estimate the combined recreation, tourism, and property value losses associated with a petroleum spill, as shown in Table Table 4-10: Estimated Recreation, Tourism, and Property Value Losses for Petroleum Spill by Port (1990$) Port Small (8K gal) Medium (90K gal) Large (500K gal) Catastrophic (4M gal) 01-Boston $72,175 $811,964 $4,510,909 $36,087, Puget Sound $213,382 $2,400,545 $13,336,364 $106,690, Los Angeles/Long Beach $1,138,560 $12,808,800 $71,160,000 $569,280, Santa Barbara $1,161,600 $13,068,000 $72,600,000 $580,800, Port Arthur $71,389 $803,127 $4,461,818 $35,694, New Orleans $65,280 $734,400 $4,080,000 $32,640, Houston/Galveston $105,076 $1,182,109 $6,567,273 $52,538, Chesapeake Bay $149,149 $1,677,927 $9,321,818 $74,574, Baltimore $149,149 $1,677,927 $9,321,818 $74,574, Corpus Christi $120,349 $1,353,927 $7,521,818 $60,174, New York $72,175 $811,964 $4,510,909 $36,087, Long Island Sound $125,760 $1,414,800 $7,860,000 $62,880, Philadelphia $149,149 $1,677,927 $9,321,818 $74,574, San Francisco $162,676 $1,830,109 $10,167,273 $81,338, Portland OR $213,382 $2,400,545 $13,336,364 $106,690, Cook Inlet $12,480 $140,400 $780,000 $6,240, Portland ME $79,767 $897,382 $4,985,455 $39,883, Portsmouth $79,767 $897,382 $4,985,455 $39,883, Providence $125,760 $1,414,800 $7,860,000 $62,880, Wilmington $97,658 $1,098,655 $6,103,636 $48,829, Jacksonville $97,658 $1,098,655 $6,103,636 $48,829, Tampa $220,364 $2,479,091 $13,772,727 $110,181, Mobile $67,985 $764,836 $4,249,091 $33,992,727 Average $206,552 $2,323,708 $12,909,486 $103,275,889 Values derived from data contained in Port Needs Study (Volpe Vol III 1991: Tables 6-3 through 6-6) 64
65 Volpe (Vol III 1991) provides an estimated range of costs associated with petroleum spill cleanup costs as shown in Table The upper limit of 95% confidence interval was felt to most accurately reflect recent (circa 1990) cleanup costs. Table 4-11: Cleanup Costs By Spill Size (1990$) Spill Size (gal) Cleanup Cost 68% Confidence Interval 95% Confidence Interval 8K $80,000 (20K; 315K) (5K; 1,239K) 90K $46,000 (117K; 1,811K) (30K; 7,132K) 500K $1,590,000 (404K; 6,261K) (103K; 24,650K) 4M $7,154,000 (1,817K; 28,167K) (461K; 110,901K) Values derived from data contained in Port Needs Study (Volpe Vol III 1991: Table 6-8) Due to the range of estimated cleanup costs contained in Table 4-11, the Volpe estimates are quite subjective. Fortunately, subsequent studies that focused specifically on cleanup costs have been completed. Etkin (2000) found that oil spill cleanup response costs are contingent on a number of factors including location, oil type, spill size, and cleanup strategy. Differences in prevailing cultural values, socio-economic costs, and labor costs are also reflected in oil spill cleanup costs resulting in significantly higher cleanup costs in the United States. Other factors, such as spill location, oil type, and spill size, also drive spill cleanup costs. Etkin (2000) also found that near-shore spills are 4-5 times as costly to cleanup as offshore spills and heavy fuels are more than 10 times as costly to cleanup as lighter fuels. Etkin (2004) estimated oil spill response costs based on the Environmental Protection Agency s Basic Oil Spill Cost Estimation Model (BOSCEM). Specific multiplier factors can be applied to reflect cleanup costs by oil type, shoreline type (e.g. rocky versus sandy), and cleanup method 65
66 used (e.g. mechanical, dispersants, In Situ burning). Estimated marine crude oil spill response costs using mechanical recovery are provided in Table 4-12 below. Table 4-12: Per-Unit Marine Oil Spill Response Costs in the US (2003$) Response Costs Spill Size (gal) ($/gal) $ ,000 $197 1,000-10,000 $195 10, ,000 $ ,000-1,000,000 $118 >1,000,000 $82 Data derived from Etkin (2004: Table 1) As shown in the data above, larger spills are less expensive to cleanup on a per-unit basis due to one-time equipment and personnel mobilization and set-up costs. Converting the cleanup costs to equivalent size spills estimated in the Volpe Port Needs Study results in the oil spill cleanup costs are contained in Table Table 4-13: Estimated Oil Spill Cleanup Costs (2003$) Small (8K gal) $1,560,000 Medium (90K gal) $16,650,000 Large (500K gal) $59,000,000 Catastrophic (4M gal) $328,000,000 Sometimes large oil spills and chemical discharges can directly impact the ability of local subsistence families to provide for themselves. Table 4-14 summarizes additional economic costs associated with subsistence losses. Table 4-14: Subsistence Losses Resulting from Spill of Petroleum (1990$) Small (8,000 gal) $0 Medium (90,000 gal) $5,100 Large (500,000 gal) $12,300 Catastrophic (4,000,000 gal) $6,109,200 Data obtained from Volpe (Vol III 1991: Table 6-9) 66
67 Additional economic costs are incurred to conduct environmental damage assessments following an oil spill or chemical discharge. Table 4-15 summarizes environmental damage assessment costs for oil spills. Table 4-15: Environmental Damage Assessment Costs Resulting from Petroleum Spill (1990$) Small (8,000 gal) $0 Medium (90,000 gal) $15,000 Large (500,000 gal) $3,000,000 Catastrophic (4,000,000 gal) $15,000,000 Data obtained from Volpe (Vol III 1991: Table 6-10) In total, the economic costs represented in Tables 4-6 through 4-15 can be aggregated to estimate economic impacts associated with oil spills of various sizes as listed in Table 4-16; cost data is reported in 2003 dollars using standard adjustments for inflation. Table 4-16: Average Economic Costs Resulting from Petroleum Spill (2003$) Small (8,000 gal) $2,031,000 Medium (90,000 gal) $22,070,000 Large (500,000 gal) $94,685,000 Catastrophic (4,000,000 gal) $593,208,000 Economic costs associated with chemical discharges will vary depending on the attributes of the chemical discharged. To account for cost impacts associated with oil or chemical spills in specific locations, one should use the Environmental Protection Agency s Basic Oil Spill Cost Estimation Model (BOSCEM) to estimate costs associated with specific spill scenarios in those locations. 67
68 2. Living Marine Resources Performance Goal: Increase the observed compliance rate of domestic fishing vessels. Fundamental Outcome Unit: Compliance rate The Coast Guard s role in ensuring the sustainability of U.S. fisheries is the result of a complex relationship between government regulators, regional management councils consisting of government and industry representatives, and the commercial fishing industry. This set of relationships is further complicated by differing enforcement capabilities and legal jurisdictions of the various agencies involved. This relationship was best characterized in a study completed by the Center for Naval Analysis: The USCG is one component of a complex national management structure for fishery resources. The Coast Guard remains the only agency with both the authority and ability to maintain an enforcement presence over the whole EEZ. NOAA, which sets overall policy, prosecutes enforcement cases initiated by the USCG, and performs shore-side enforcement of fisheries regulations. Regional fisheries management councils (RFMCs), who set quotas and formulate regulations for individual fisheries. Individual states, through involvement via Joint Enforcement Agreements to assist enforcement in federal fisheries. The Department of State, international regional fisheries management organizations (RFMOs), and other nations. In its fisheries enforcement mission, the USCG enforces regulations it does not write, leading to resolutions it does not control using data it does not hold. (Filadelfo et al 2006) As a result of this complex relationship, the Coast Guard measures its performance on the compliance rate observed onboard domestic fishing vessels. It is clear that the fishing industry has a positive economic value. In 2006, U.S. consumers spent approximately $69.5 billion on fishery related products and services (NMFS 2007). The recreational saltwater fishing industry alone is estimated to be worth $20 billion (Filadelfo et al 2006). It is estimated that commercial fisheries contribute more than $35 billion in value to the U.S. gross national product each year (NMFS 2007) and this contribution comes from fishery 68
69 stocks that are producing at about 60 percent of their long-term potential yield (USCG Ocean Guardian 2004). Unfortunately, I was unable to locate any studies that linked observed compliance levels to the economic value of sustaining the U.S. fishery stocks. 69
70 3. Aids to Navigation Performance Goal: Eliminate collisions, allisions, and groundings by vessels on our nation s oceans and waterways. Fundamental Outcome Unit: Collisions, allisions, and groundings The United States is a maritime nation. Our economy relies heavily on the safe and efficient interstate transport and international import and export of raw materials and finished products. This reliance on maritime trade is carried out by the approximately 700 ships that arrive in U.S. ports each day to transport cargo that contributes more than $700 billion per year the U.S. economy (CG Strategy 2007). Despite higher waterway congestion and the introduction of larger and faster ships, the worldwide average vessel loss rate has declined from 3% in 1900, to 0.5% in 1960, and to 0.25% in 2000 (Kristiansen 2005). Some of this decrease is attributable to improved vessel construction and accident avoidance technologies, but also the introduction and improvements in vessel navigational services. The goal of the Coast Guard s Aids to Navigation mission is to eliminate vessel collisions, allisions (i.e. collisions with a stationary structure), and groundings. The Coast Guard accomplishes this mission with a range of navigational services including short range (i.e. visual) aids to navigation, vessel traffic management services, and long-range (i.e. electronic) aids to navigation. The presence of these three categories of systems cumulatively reduces the risks associated with navigating in open-ocean, coastal, and port environments. Short-range navigational aids include lighthouses, buoys, day markers, and fog signals that help mariners pilot in coastal and port environments. The reference markers assist mariners in 70
71 determining their position and warning mariners of maritime hazards such as shallow water or submerged wrecks. The Coast Guard maintains approximately 50,000 short range aids to navigation with a similar number being maintained by private entities. (Bureau Transportation Statistics 1999). The Coast Guard operates two long distance electronic navigational aids, the LORAN-C system and the Differential Global Positioning System (DGPS). LORAN-C provides positioning information with a 0.25 mile absolute accuracy. Since the mid-1990 s, use of satellite based global positioning services (GPS) and satellite based with terrestrial reference stations, differential global positioning services (DGPS) have become more widespread. DGPS enables ships with special receivers to determine their position with 5-10 meter accuracy, compared with 100 meters for standard positioning systems. This difference in capability is very important considering that some channels used by large vessels are less than 100 meters wide. DGPS s highly precise positioning capabilities combined with advanced electronic charting systems enable vessels to more safely navigate in restricted waterways. In addition to short and long range aids to navigation, the Coast Guard operates Vessel Traffic Services in select ports. Vessel Traffic Services increase the quality and timeliness of information a mariner needs to navigate their vessel safely. Information, including the location and intentions of other vessels, aid to navigation discrepancies, hazards to navigation, and local weather reports, are passed to vessels participating in the service. In addition, Vessel Traffic Services will alert vessel operators of specific hazards to navigation or collision threats and recommend a course of action to avoid the hazard or threat. Vessel operators voluntarily act 71
72 on VTS recommendations in most situations. In situations where a vessel ignores the recommendation and continues with an unsafe action, the Vessel Traffic Service may issue a direction to the vessel. Failing to follow a direction may result in administrative hearings and civil, or even criminal, penalties. The effectiveness of Vessel Traffic Services to increase safety is generally accepted. The National Research Council (1996) concluded that Vessel Traffic Services can be a significant factor in enhancing the safety and efficiency of ports and waterways when used in conjunction with other traditional aids to navigation and hydrographic and other information. The Volpe Port Needs Assessment (1991), as previously discussed in the Marine Environmental Protection section, estimated the economic value of increasing vessel safety through use of Vessel Traffic Services. The study found that approximately 64% of cargo vessel casualties occurring between 1979 and 1989 were caused by factors that a Vessel Traffic Service could have prevented or mitigated (Volpe 1991). Of the 23 port regions evaluated, the study found that 11 would experience a positive net economic benefit of having Vessel Traffic Services. More important than the report s summary findings, however, is the analysis that allows vessel casualty risk profiles and economic costs of collisions, allisions, and groundings to be developed. Not surprisingly, the risk associated with a vessel transit is associated with the maritime setting in which the vessel is operating. Table 4-14 contains the average casualty rates by navigational setting indicate the relative risk associated with different maritime navigation settings. 72
73 Table 4-17: National Average Casualty Rates by Navigational Setting (Number of casualties per 100K transits by med/large dry cargo and tank vessels) Navigational Setting Casualty Rate Open approach Convergence Open Harbor Enclosed Harbor Constricted Waterway River Total Data obtained from Volpe (Vol III 1991: Table 4) The Volpe Port Needs Assessment found that for casualties involving participating vessels, 40% resulted in vessel damage, 3% resulted in fatalities, 10% resulted in injuries, 11% resulted in cargo damage or loss, 2% result in damage to an aid to navigation, 1% result in bridge damage, 100% result in a Coast Guard response of some type, and 13% of casualties involving vessels carrying bulk cargoes resulted in hazardous spills (Volpe 1991). These relative risk rates, or relative risk rates estimated from more recent data, can then be used to estimate the economic cost of vessels collisions, allisions, and groundings. Economic costs associated with vessel damage, loss or damage of cargo, aid to navigation damage, and Coast Guard response costs can be obtained or estimated from existing Coast Guard databases and will not be discussed further here. Economic costs estimates associated with fatalities, injuries, and the spill of hazardous materials can be obtained from the previous sections of this thesis. The remainder of this section will summarize economic costs associated with waterway blockages and bridge damage. 73
74 Vessel casualties that occur in narrow channel or waterways can potentially prevent other vessels from transiting the waterway. Table 4-18 provides estimates developed by Volpe (1991) through interactions with knowledgeable persons. Table 4-18: Average Daily Costs of Channel Blockage by Vessel Type (for each day over 2 days a port is closed) Vessel Type Cost per Day (1990$) Passenger, small $75,000 Passenger, medium $150,000 Passenger, large $250,000 Dry Cargo, small $9,000 Dry Cargo, medium $12,000 Dry Cargo, large $16,000 Tanker, small $16,000 Tanker, medium $20,000 Tanker, large $24,000 Tug & Barge, small $3,000 Tug & Barge, large $5,000 Fishing Vessel $9,000 Other $4,000 Data obtained from Volpe (Vol III 1991: Table 6-16) Table 4-19 summarizes the estimated cost of bridge damage resulting from vessel allisions. The estimates do not include economic impacts resulting from bridge closures (e.g. additional transit time for alternate routes). Table 4-19: Cost of Bridge Damage by Severity of Casualty (1990$) Severity Cost Low $35,000 Moderate $255,000 Severe $10,784,000 Data obtained from Volpe (Vol III 1991: Table 6-17) 74
75 4. Ice Operations Performance Goal: Maintain operational channels for navigation, limiting channel closures. Fundamental Outcome Unit: Channel closure days The Coast Guard s ice operations mission consists of several distinct parts. First, the Coast Guard conducts icebreaking activities during the winter to assist the movement of dry and liquid-bulk cargos through the Great Lakes and domestic ports and waterways. This mission is the result of Executive Order No 7521 dated December 21, 1936 entitled Use of Vessels for Icebreaking Operations in Channels and Harbors. This executive order stated: The Coast Guard, operating under the direction of the Secretary of the Treasury, is hereby directed to assist in keeping open to navigation by means of icebreaking operations, in so far as practicable and as the exigencies may require, channels and harbors in accordance with the reasonable demands of commerce; and to use for that purpose such vessels subject to its control and jurisdiction or which may be made available to it as are necessary and are reasonable suitable for operations. The Coast Guard accomplishes this by establishing tracks or pathways of broken ice through which vessels can transit. If a vessel becomes or is about to become beset in ice, the Coast Guard directly assists the vessel to keep commerce flowing and to mitigate potential hazards (e.g. prevent a vessel beset in ice from being blown out of the channel resulting in a grounding). The economic benefits of domestic ice breaking are estimated to total more than $78 million (Volpe 1995) in the Great Lakes alone on account of reduced inventory levels of dry bulk and liquid cargoes during the winter season. Looking more specifically at the impacts of waterways closures one week prior and two weeks following the winter closure of the St Mary s River, the average economic benefit of maintaining navigation on the St Mary s River during those three 75
76 weeks is approximately $ million (1994$) (Volpe 1995). Using an average value of $33.71 million for the 21 days, or $1.6 million per day (1994$). Estimates of economic benefits for domestic icebreaking services outside the Great Lakes were not located, however, shipping delays resulting from ice can be estimated using the economic costs of waterways closures provided in the previous aids to navigation section. The second ice breaking activity that the Coast Guard conducts is flood relief operations. During winter months, ice dams can form resulting in increased river levels and flooding of nearby areas. In some situations, the Coast Guard is able to relief the flooding by breaking up the ice dams allowing the rivers to flow more freely. I was unable to locate studies that estimated the economic benefits of flood relief operations due to ice dams. The third ice operations activity conducted by the Coast Guard is support of polar research and resupply of research outposts. The National Research Council recommended to Congress that: The nation needs the capability to operate in both polar regions reliably and at will. Specifically, the Committee recommends: The United States should continue to project an active and influential presence in the Arctic to support its interests. This requires U.S. government polar icebreaking capability to assure year-round access throughout the region. The United States should continue to project an active and influential presence in the Antarctic to support its interests. The nation should reliably control sufficient icebreaking capability to break a channel into and assure the maritime resupply of McMurdo Station... (National Academy Sciences 2007) While estimates for transporting cargo to McMurdo is estimated to cost 11 cents per pound by ship as compared to $2.50 per pound by air (T-AK 4729, GlobalSecurity.org), estimated economic benefits of icebreaking services performed by the Coast Guard as compared to other potential ice breaking service providers, were not able to be located. 76
77 The fourth ice operations activity performed by the Coast Guard is the International Ice Patrol. This activity consists of determining the limits of all known ice originating from the North Atlantic and providing that information to mariners to aid in their voyage planning. This activity, resulting from the sinking of the Titanic in 1912, has remained essentially unchanged since its inception in The success of this activity is demonstrated by the fact that there have been no ship-iceberg collisions reported outside the limits of all known ice since the program s inception. Conversely, in 1993 three ship-iceberg collisions occurred inside the limits of all known ice resulting in significant vessel damage (Pritchett 1997). By estimating reduced transit costs associated with knowing the limits of all known ice, Pritchett estimated that the International Ice Patrol results in approximately $3.5 million of economic value each year (Pritchett 1997). 77
78 D. Summary of Mission Outcome Values and the Coast Guard Consequence Equivalency Matrix Recognizing the need to tradeoff expected mission related outcomes to make budgetary decisions, the Coast Guard recently developed a methodology to compare the expected level of public benefit across multiple mission areas. Glander (2007) observes that the Coast Guard has historically relied on the purchase of multi-mission assets, thereby creating a flexible and adaptable force, to meet complex challenges spanning multiple missions. Given these challenges, the Coast Guard has begun to evaluate reductions in overall public risk as a basis for budgetary decisions. To accomplish this, the public risk owner must be able to consistently measure public risk across multiple Coast Guard mission outcomes using the same scale (Glander 2007). The first step in developing a consistent public risk scale is to delineate the risk related outcomes that the agency is responsible for or can reasonably influence. Bounding constraints such as outcome time horizon and complementary agency roles and contributions must be defined (Glander 2007). This is followed by the need to develop a consequence scoring system that can equate varying levels of public risk across multiple mission outcome types and developing the basis to rank the resulting public risks. Glander highlights the challenges of comparing public risk for discrete events (e.g. collisions) versus non-discrete measures or difficult to measure flows (e.g. compliance levels and drug smuggling flows). Finally, the overall public risk is assessed for the stated time horizon based on the expected frequency and distribution of mission outcome types. 78
79 The above process resulted in development of the Coast Guard Risk Assessment and Consequence Equivalency Matrix. The consequence equivalency matrix consists of rows representing outcome types roughly associated with the Coast Guard s eleven mission areas. In addition, qualitative assessments of addition concerns (e.g. primary and secondary economic costs at the regional/national level and the public s perceptions concerning national security, civil order, and symbolic impact) are considered. Each outcome type is broken down into eight levels of severity representing a 10 million factor range in relative risk. For example, the lowest risk range for human life represents one injury while the most severe represents more than 100,000 fatalities. The individual cells representing relative risk values for each outcome type are estimated using a combination of scholarly or governmental references with values for resulting gaps being developed using expert opinion collected over several years. A full version of the Coast Guard s Consequence Equivalency Matrix is not included since it has not been publically released to date. The tenets of the Coast Guard Consequence Equivalency Matrix align closely with the documentation of research conducted by this thesis. Several important differences do exist but not to the detriment of either approach. While the Coast Guard Consequence Equivalency Matrix combines academic and government research with expert opinion to estimate the relative public risk associated with a wide range of scenarios, Chapter 4 of this thesis focused on the economic value of fundamental mission outcome units to compare risks across mission areas. Comparing the relative risk values of the Consequence Equivalency Matrix and the economic costs identified in Chapter 4 reveals some substantial differences in relative public 79
80 risk value as shown in Table 4-20 below. Representative risk and economic values were calculated relative to the value of a single statistical life. Table 4-20: Comparison of Consequence Equivalency Matrix Relative Risk Values versus Relative Economic Values Outcome Relative Risk Value Relative Economic Value 1 life saved K gallon oil spill prevented kg cocaine interdicted undocumented migrants interdicted The above differences highlight the complementary nature of these two approaches and an opportunity to create a more comprehensive consequence equivalency matrix based on a different research basis. The above differences between relative risk value and relative economic value are not sufficient justification to shift resources from one mission area to another. As discussed in Chapter 8, a more thorough understanding of the relative impacts that changes in resource levels dedicated to specific mission areas will have are needed. Table 4-21 summarizes the performance outcome values developed in Chapter 4. All Table 4-21 values have been adjusted for inflation to 2007 dollars using U.S. Department of Labor, Bureau of Labor Statistics conversion factors found at 80
81 Stewardship Security Safety Mission Role Mission Performance Goal Search and Rescue Marine Safety Ports, Waterways, and Coastal Security Illegal Drug Interdiction Undocumented Migrant Interdiction Defense Readiness Other Law Enforcement Marine Environmental Protection Living Marine Resources Aids to Navigation Ice Operations Table 4-21: Economic Value of Coast Guard Mission Outcomes Save mariners in imminent danger on our nation s oceans and waterways. Eliminate maritime fatalities and injuries on our nation s oceans and waterways. Reduce homeland security risk in the maritime domain. Increase the removal rate of cocaine. The percentage of the non-commercial maritime flow of cocaine to the U.S. seized, jettisoned, abandoned, or otherwise destroyed. Increase the interdiction rate of illegal migrants (all nationalities) attempting to enter the U.S. via maritime means. Support our national security and military strategies by ensuring assets are at the level of readiness required by the Combatant Commander. Reduce the number of vessel incursions into the U.S. Exclusive Economic Zone (EEZ). Eliminate oil spills and chemical discharge incidents > 100 gallons. Increase the observed compliance rate of domestic fishing vessels. Eliminate collisions, allisions, and groundings by vessels on our nation s oceans and waterways. Maintain operational channels for navigation, limiting channel closures. Performance Target (FY07) Fundamental Outcome Unit Economic Value (2007$) 86% of mariners saved Life $7,615,000/life 4,721 or fewer fatalities Life & injury or injuries 15% reduction in risk Risk of terrorist attack 26% removal rate Kilogram of cocaine 67% interdiction rate Undocumented migrant 100% readiness Unit readiness level $1,639,000/injury MAIS4/Severe To Be Determined $259,000/kg $32,000/migrant To Be Determined 199 or fewer incursions Vessel incursion To Be Determined 19 or fewer oil spills & chemical discharges 97% observed compliance rate 1,664 or fewer collisions, allisions, & groundings Less than 2 days during average winters, 8 days during severe winters Oil spill, chemical discharge Compliance rate Collisions, allisions, groundings Channel closure days $106,700,000/spill (500K oil spill) To Be Determined Dependent on Current Vessel Risk Profile $2,246,000/closure day (Great Lakes only) 81
82 Chapter 5: Strategic Guidance Strategy without tactics is the slowest route to victory. Tactics without strategy is the noise before defeat. Sun Tzu, b. 500 B.C. Merriam-Webster defines strategy as the science and art of employing the political, economic, psychological, and military forces of a nation or group of nations to afford the maximum support to adopted policies in peace or war. 2 In the military, strategy is the broadest of the three levels of planning that link national strategic objectives to tactical actions. Military planners generally categorize activities into strategic, operational, and tactical levels in order to better organize and logically arrange complex operations, distribute resources, and assign activities to the appropriate entity or unit (Joint Pub ). In a military context, strategy is defined as a prudent idea or set of ideas for employing the instruments of national power in a synchronized and integrated fashion to achieve theater, national, and/or multinational objectives (Joint Pub ). Although it is the broadest of the planning levels, strategic planning is still anchored to national-level strategies, policies, and laws. Strategy is also shaped by service doctrine which includes the underlying beliefs and principles that characterize the organization. Another perspective of doctrine is that it represents what is taught, believed, and advocated as what is right (Joint Pub ). Given that national-level guidance and the Coast Guard service doctrine shapes strategy, objectives are determined, guidance is developed, and potential resources are identified within a 2 Merriam-Webster Online Dictionary. Access March 11, 2008 from 82
83 framework. In short, strategy provides the conceptual framework upon which more detailed courses of action, or series of actions, are developed and refined. The operational level is the second level of planning. The operational level links the conceptual framework established by strategy to the tactical use of forces. Activities at the operational level focus on how to best organize and apportion available forces, and sequence their actions, to achieve stated objectives. Coast Guard operational level planning efforts will be discussed in more detail in Chapter 6. The tactical level is the third and most detail oriented level of planning. At the tactical level of planning, allocated resources are employed in a coordinated fashion for shorter duration efforts to achieve stated objectives. The tactical level of planning is mentioned here primarily for completeness purposes only. Before reviewing and discussing the current strategic guidance in place in the Coast Guard, I will provide a brief overview of how long-term strategy is currently developed in the Coast Guard. The brief history of the Coast Guard provided in Chapter 3 highlights how the Coast Guard s missions and organization have continually evolved to meet the changing needs of the American public. In the mid-1990 s the Coast Guard was faced with the sobering reality that a vast majority of its assets would simultaneously reach the end of their planned service lives within 10 years. This situation, coupled with the macro trends of trade globalization, shifts in global power balances, and seamless information technologies, highlighted the fact that the Coast Guard needed to consider the long-term trends and challenges facing the nation. In addition, the Coast Guard 83
84 needed to incorporate the resulting impacts and consequences of these macro-trends into its long-term planning. To accomplish this, the Coast Guard established the Long View strategic planning exercise to develop a process that would enable the service to better understand the challenges and manage associated risks. The Long View initiative had important cultural implications. The Coast Guard has long been rewarded for its reaction and response expertise. Long View sought to augment these characteristics with a more formalized ability to anticipate and plan. By being able to anticipate large-scale changes in national needs, the Coast Guard would be better positioned to react and respond (Evergreen 2005). The primary output of the Long View exercise was the adoption of scenario-based planning to develop long-term strategies. Although several important over-arching concepts were identified and strategies were developed around five of the sixteen future-world scenario s discussed, few of the strategies were incorporated into Coast Guard budgeting and operational planning activities. This was due to a general lack of integration between the different planning activities (Evergreen 2005). Faced with the challenges of integrating into the newly formed Department of Homeland Security in 2002, the Coast Guard conducted an assessment of the Long View exercise to determine the relative strengths, weaknesses, and applicability of scenario-based strategic planning. Long View s strengths included the continued viability of the five scenarios that were identified and the applicability of the scenario-based process. Long View weaknesses included short-sighted assumptions regarding the duration and indirect impacts of international threats as well as assumptions that indirectly limited the Coast Guard s future role. Based on this assessment of Long View strengths and weaknesses, the Coast Guard initiated Project Evergreen with the goal of providing the Coast Guard with the essential tools, 84
85 knowledge, and insights to act effectively despite much greater uncertainty about the future (Evergreen 2005). This process consisted of the following: Identification and definition of the large-scale dimensions of change. The following four dimensions were identified: Rate of Globalization (increasing or decreasing), Public Perception of Threat to Security and Quality of Life (high or low), U.S. Concept of Sovereignty (traditional or non-traditional), and U.S. Economy Strength (strong or weak). Definition of the sixteen world scenario s that result from applying the four dimensions in their extreme states. Five scenarios that represent the greatest risks and opportunities for the Coast Guard are selected for further development. Identification and refinement of core strategies that best address the risks and opportunities identified in the five scenarios. In total, eleven core strategies were identified. These eleven core strategies were further categorized into the following four strategic imperatives: Shape the global maritime setting to promote U.S. national interests. Know the maritime conditions, anomalies, and threats to prevent, protect, and respond. Create and manage an integrated U.S. maritime domain to preserve and promote the national interest. Position the Coast Guard to act with strategic intent in a complex and uncertain environment (Evergreen 2005). Achievement of the above strategic imperatives can only be accomplished by acting with strategic intent which consists of adopting a systems view, focusing on intent, thinking across time, creating and testing hypotheses, and being intelligently opportunistic (Evergreen 2005). 85
86 Once the Coast Guard had determined a framework for its future direction, it needed to develop the means to achieve it. To address the lack of integration experienced for Long View initiatives, the Evergreen Process has been incorporated into the Coast Guard Commandant s command cycle. It serves as an entering input and evaluation criteria for future budgeting and operational planning initiatives as well as for development of Coast Guard training and education programs. Finally, it serves as a framework for ad hoc decisions that may arise outside the standard planning processes but require a long-term or strategic perspective (Evergreen 2005). The strategic imperatives that result from the Evergreen process are broad and lack the specificity of context. Additional context and limits are provided by several sources of guidance including: presidential directives, federal statutes and acts, international agreements, and statements of national strategy. The significant sources of guidance for development of Coast Guard strategy are listed in figure

87 Figure 5-1: CG Strategy for Maritime Security, Safety, and Stewardship The Coast Guard has established a framework of strategic plans and guidance that spans its eleven missions while taking into account the range of guidance available from outside sources. This framework includes the formation of the Coast Guard s maritime strategy based on inputs from external guidance sources, Coast Guard doctrine (contained in Coast Guard Publication 1), and Coast Guard Evergreen outcomes. The Coast Guard Strategy then feeds the development of Operational Campaign Plans, Budget Strategy, and Readiness Plans which support the tenets of the overarching strategy in a coordinated fashion. Figure 5-2 summarizes this framework of strategic plans and their associated time horizons. 87
88 Figure 5-2: CG Strategy Framework Coast Guard Publication 1 serves as the foundation for Coast Guard doctrine. It summarizes the underlying beliefs and principles that characterize the Coast Guard and anchors development of operational and support doctrines (not shown) which enable consistent execution of Operational Campaign Plans and Readiness Plans, respectively. The following seven principles of Coast Guard operations are identified in Coast Guard Publication 1: clear objective, effective presence, unity of effort, on-scene initiative, flexibility, managed risk, and restraint. Detailed descriptions of each principle are contained in Appendix 2. Due to the Coast Guard s military heritage and membership in the U.S. Armed Forces, the service also incorporates joint military doctrine as part of its strategic guidance. An overview of military principles of war is included in Appendix 3. 88
89 Given external strategic guidance, the Coast Guard s organizational principles/doctrine, and the long-term outlook established by the Evergreen process, an overarching strategy can be developed. The Coast Guard s Strategy for Maritime Safety, Security, and Stewardship contains several important aspects that drive downstream operational, budgetary, and support plans. Building on the organizations character and strengths identified in Coast Guard Publication 1, the Coast Guard Strategy identifies key strengths that are considered essential to meeting future mission challenges (CG Strategy 2007). These key strengths include: Broad authorities and an expansive network of partnerships: Combined, these strengths form the foundation for building layered and multi-faceted safety and security systems. Flexible, adaptable operational capability and presence: The Coast Guard s demonstrated ability to quickly scale prevention and response capabilities to counter recurring and developing maritime threats enables the service to build upon multiagency partnerships. Access and relevant expertise within the international community: The Coast Guard s shared common purpose with many of the world s maritime forces combined with its extensive history of international cooperation enable it to develop global solutions to world-wide problems. These key strengths are needed to counter national and global maritime threats. According to the Coast Guard Strategy, the five most prominent challenges and threats that require increased focus are: 89
90 The increasing complexity and use of the U.S. Exclusive Economic Zone. The growth of the global maritime supply system. The emergence of transnational threats that exploit the complexity of the maritime domain and the vulnerabilities of the global supply system. The increasing scale of and potential for catastrophic incidents, whether caused by nature or weapons of mass destruction. The vastness, anonymity, and limited governance of the global maritime domain. Before action can be taken to address the challenges and threats, Coast Guard leaders must understand the context within which their actions must fit. According to the Coast Guard Strategy, this context, also known as maritime governance, consists of the following three parts: Maritime Regimes: The system of rules that determine acceptable activity. Maritime Domain Awareness: The ability to detect and monitor the maritime environs through situational awareness and intelligence. Operational Capabilities: The systems used to deter, verify, respond to, and counter threats in the maritime domain. The application of the Coast Guard s key strengths to counter challenges and threats within the system of maritime governance resulted in the identification of strategic priorities for incorporation into present and future Coast Guard mission activities. The following six strategies were identified in the published Coast Guard Strategy (2007): 90
91 Strengthen regimes for the U.S. maritime domain that increase transparency of activity, reduce risk, and balance competing uses within the maritime domain. Achieve Awareness in the Maritime Domain: Enhanced abilities to collect, fuse, analyze, and share information about the maritime domain are required. Enhance unity of effort in maritime planning and operations: The Coast Guard must improve the integration of its efforts with those of other government entities and private sector partners through enhanced unity of effort, and where possible, unity of command. Integrate Coast Guard capabilities for national defense: Build upon and extend the National Fleet model to support U.S. national security interests in close partnership with the U.S. Navy along U.S. coasts, the high seas, and deployed abroad. Develop a national capacity for Marine Transportation System recovery: Ensure the continuity of commerce and critical maritime activities through coordinated planning and response to maritime system disruptions. Focus international engagement on improving maritime governance: Assist partner nations and maritime organizations with the development and implementation of enhanced regimes, awareness, and operational capabilities. As shown in Figure 5-2, the Coast Guard Strategy guides the content of operational campaign plans, budget strategy, and readiness plans. These strategies and plans, when executed, further communicate and reinforce the intent of the Coast Guard Strategy. Specifically, strategic intent is communicated by several forms. First, strategic intent is communicated by explicitly stating and communicating the strategy ideas; this was accomplished by the 91
92 publication and distribution of the Coast Guard Strategy. Second, the strategy must be interpreted and implemented into more detailed operational plans; this facet of communicating strategic intent is discussed in detail in Chapter 6. Third, strategic intent is communicated by budgeting and the acquisition of capabilities needed to implement the strategy. To illustrate how the Coast Guard Strategy is carried out through the budget strategy, the following excerpt links the Coast Guard s budget for fiscal year 2008 to the three tenets of maritime governance outlined above: President Bush requested $8.7B for the Coast Guard to: Improve Operational Capability: Improving Coast Guard capabilities is vital to controlling our maritime borders and preserving our multi-mission responsiveness. The budget addresses this need through development of the Strategic Trident Force Structure, controlling and extending our maritime borders, and creating adaptive force packaging. Build Awareness: Greater awareness of people, vessels, and cargo in the maritime domain will help identify threats before they reach our vital ports, waterways and coastline, and aid in risk-based decision-making. The budget addresses this need through Global Maritime Intelligence Integration and Leveraging Partnerships. Create Maritime Regimes: Port security, and the broader concept of maritime security, cannot be reduced to a single threat vector, a single theory. Maritime security impacts, and is impacted by, economic structures, intermodal transportation systems, and the environment. 3 And finally, strategic intent is communicated by promulgating supporting policies and programs, as well as the deletion of conflicting plans and policies. Building organizational unity of effort for the support and execution of strategy enables readiness plans to focus scarce resources on improving and sustaining the most needed capabilities. Since this thesis focuses on the development of operational strategy, further development of the Coast Guard s budget strategy and readiness plans will not be discussed in detail. 3 Source: CG Snapshot Accessed August 14, 2007 from 92
93 Chapter 6: Operational Planning System Failing to plan is planning to fail. Unknown Communicating strategic intent in a multi-mission organization like the Coast Guard is complicated by the interactions and trade-offs that occur when apportioning scarce resources between the competing mission sets. For example, staging a Coast Guard cutter in the Mona Pass off Haiti deters individuals from attempting to illegally migrate to the United States by boat. It also deters the transport and transshipment of illegal substances, such as marijuana, through the Mona Pass resulting in a secondary or even tertiary benefit to the U.S. drug enforcement policy. On the negative side, the cutter s presence in the Mona Pass means that it is not conducting fishery enforcement operations off Georges Banks, not conducting counterdrug operations off the coast of Ecuador, or not screening high interest vessels entering the Port of Houston. The traditional factors of time, geographic distance, number of available resources, and resource effectiveness play critical roles in determining how to best use these resources in a context sensitive setting. To provide this context, the Coast Guard develops multi-year strategies for each of its eleven missions which are then used to develop a crossmission strategy and operational plan. 93
94 A. Operational Campaign Plans In the past, Coast Guard mission program managers, or the teams of individuals responsible for developing policies and obtaining resources needed to implement those policies through the federal budget process, promulgated and communicated mission specific guidance via a variety of policy publications and operating procedures. The result of this approach was a moderately effective system of guidance documents that slowly adapted to changes in strategic direction. The advent of the unified Coast Guard Strategy in 2007 required a more agile and adaptive process to align the efforts of the eleven different missions. As a result, mission program managers were directed to develop mission specific campaign plans compliant with the following criteria: Encompass at least a 5-6 year timeframe. Explicitly define mission statements, guiding principles, and long-term objectives specific to each mission. Identify interagency relationships and applicable strategic management frameworks. Identify mission measures and baseline levels of performance to allow comparisons between mission related risks and results, external performance drivers and trends, and explicit performance targets. Summarize planned performance improvement initiatives including their purpose, scope, major milestones, quantifiable benefits, and costs. At the time this guidance was given, campaign plans that met some of the above criteria existed for eight of the Coast Guard s eleven missions. As a result, three new campaign plans are now being developed and the seven existing campaign plans are being reviewed and updated. Example guidance from one of the better existing campaign plans is included in Appendix D. The quantification of economic values associated with specific mission outcomes detailed in Chapter 4 could be used to prioritize long-term objectives, compare mission related risks and 94
95 results, identify appropriate performance targets, and quantify benefits associated with mission specific initiatives. 95
96 B. The Coast Guard Standard Operational Planning Process In 2005, the Coast Guard began the process of developing an operational planning process that could be standardized across all missions and in all areas of operation. Prior to 2001, the operational planning processes reflected the service s professional communities and were grouped by mission type. Operations related to the marine safety and environmental response missions were generally centrally managed, planned, and resourced with execution occurring at the regional and local levels. Search and rescue programs were centrally planned and resourced, however operational management and execution activities were very dispersed. Due to the Coast Guard s historical culture and organizational biases, assets identified as search and rescue resources were generally set aside to ensure their availability to respond to any future search and rescue missions. Operations related to law enforcement missions were generally more decentralized but required extensive coordination across various operational commanders. As a result of this need for coordination, the law enforcement missions established a centralized operational planning process to ensure a balanced application of resources across all law enforcement missions that reflected national priorities. This planning process focused on the illegal drug interdiction, undocumented migrant interdiction, living marine resources, and other law enforcement missions; some defense operations were included in the process since these missions often competed for the same assets. Following the terrorist attacks of September 11 th 2001, the asset demands for the ports, waterways, and coastal security mission grew substantially thereby driving its inclusion into the law enforcement planning process. Inclusion of the ports, waterways, and coastal security 96
97 mission challenged the traditional operational planning process because this mission was being conducted with assets that traditionally performed law enforcement activities under the authority of the captains of the port, who traditionally focused on marine safety and environmental response activities. In addition, the tremendous resource demands for ports, waterways, and coastal security activities led to a reassessment of the amount of resources held in reserve for traditional search and rescue operations. It soon became clear that a more comprehensive and inclusive operational planning process was required. In 2005, the Coast Guard was in the process of re-organizing to better align its missions and organizational structure to meet the needs posed by a post September 11 th world and the Coast Guard s move to the Department of Homeland Security. These efforts provided the opportunity to revamp and overhaul its operational planning process. In December 2005, the Coast Guard announced a program to develop a new multi-mission operational planning system. The communiqué that announced this effort summarized the current planning situation within the Coast Guard as follows: COAST GUARD PROGRAMMATIC ORGANIZATION HAS OFTEN PRODUCED OPERATIONAL GUIDANCE IN STOVEPIPES THAT SOMETIMES SKIPPED LEVELS OF THE ORGANIZATION. THE INTEGRATION OF THIS PROGRAMMATIC GUIDANCE PRIMARILY OCCURS AT THE TACTICAL LEVEL (FORMER GROUPS AND MSOS). THE VERTICAL ALIGNMENT EFFORT AT THE SECTORS, DISTRICTS, AREAS AND AT HQ PROVIDE AN OPPORTUNITY TO DEVELOP AN ENTERPRISE SOLUTION WHILE PRESERVING THE AUTONOMY OF UNITS TO CONDUCT OPERATIONS AS EVENTS REQUIRE ON-SCENE INITIATIVE AND DECISION-MAKING REMAINS AND WILL REMAIN THE KEY FACTOR IN SUCCESSFUL COAST GUARD OPERATIONS. (CG ALCOAST 613/05) In addition to improving alignment, the communication of strategic intent and allocation of scarce resources would improve under a standard operational planning process as cited below: 97
98 A STANDARD OPERATIONAL PLANNING PROCESS WILL EFFECTIVELY TRANSLATE STRATEGIC INTENT TO THE FIELD THROUGH MISSION PRIORITIZATION, MISSION BALANCE, AND OPTIMAL RESOURCE ALLOCATION. ADDITIONALLY, IT WILL ASSIST IN SYNCHRONIZING AND SEQUENCING MULTIPLE RELATED INITIATIVES, INCLUDING MAJOR PROJECTS LIKE DEEPWATER. (CG ALCOAST 613/05) Finally, a standardized operational planning process was viewed as a future cornerstone process for Coast Guard operations. THE DESIRED OUTCOME OF THIS EFFORT IS TO ESTABLISH A SYSTEMATIC PROCESS BY WHICH WE DEVELOP STANDARD POLICY, DOCTRINE AND PROCESSES FOR USE BY HEADQUARTERS, AREAS, DISTRICTS AND SECTORS AND ENSURE ALIGNMENT WITH DHS INTITIATIVES. THIS PROCESS WILL ALIGN, SYNCHRONIZE AND SEQUENCE INFORMATION FLOW AND PROVIDE ORGANIZATIONAL STANDARDS WHICH WILL REDUCE DUPLICATION OF EFFORT, CREATE TRAINING REQUIREMENTS, INCREASE EFFICIENCIES AND OPERATIONAL EFFECTIVENESS, AND ENABLE INTEROPERABILITY WITH PARTNERS. (CG ALCOAST 613/05) Upon publication of this vision, the Coast Guard set out on a 22 month journey of developing, evaluating, and prototyping a comprehensive operational planning process. In October 2007, the Coast Guard promulgated and put into effect the Coast Guard Standard Operational Planning Process (SOPP) with the deliberate goal of improving communication of strategic intent and translating that intent into mission performance outcomes. Specifically, The principal aim of the SOPP is to ensure effective translation of strategic intent to mission outcomes. This is accomplished by providing mission guidance and direction, priorities, performance targets, and resource apportionment and allocation with constructive feedback distributed throughout the chain of command. (CG Instruction ) The principle framework used to accomplish the translation of strategic intent, as well as the fostering of constructive feedback, is employment of an iterative feedback loop. Figure 6-1 highlights the fundamental feedback loop upon which the standardized operational planning process is built. 98
99 Figure 6-1: Coast Guard Planning and Decision Making Framework (CG SOPP Guide) At first, above framework appears serial in nature. First, direction is given and resources are allocated to prioritized missions. Second, missions are executed and the resulting performance is measured. And finally, various levels of the organization adapt to gaps in performance and proposed possible remedies. In reality, the framework operates in parallel. Direction is initially proposed as the desired end-state and subordinate commands are provided the opportunity to summarize the resources and policies they will need in order to accomplish the stated objectives based on past operational experiences and forecast changes in the resources and the external environment. This feedback loop provides senior managers the opportunity to identify the requisite resources, adapt policies, or adjust their goals accordingly. This process occurs between all levels of the organization as shown in figure 6-2 below. 99

100 Figure 6-2: Coast Guard Planning and Decision Making across Organizational Levels (CG SOPP Guide) This iterative feedback process results in an extended and sometimes complicated flow of proposals, counter proposals, resource requests, directives, status reports, performance assessments, and proposed corrective actions. As a result, operational planning efforts begin one year in advance of the planned performance period. Given that performance assessments are conducted after completion of a performance period, a planning staff will simultaneously be conducting planning efforts spanning three years; performance assessments for the previous period, execution of the current period, and planning for the upcoming period. This dynamic is captured in the graphical summary of information flow shown in figure 6-3 below. 100

101 Figure 6-3: Operational Planning Calendar (CG SOPP Guide) As shown in Figure 6-3, there are four distinct phases of the operational planning process. The initial planning stage seeks to document and understand past and current performance factors and identify internal and external trends that may affect future performance. The second stage is the strategic planning direction development stage. During this stage, mission guidance including overall mission priorities, performance targets, and resource use ceilings are communicated for all missions having taken into account feedback provided from the operational commanders. The third stage of the operational planning process is the plan promulgation stage which focuses on the further development of operational plans to include the apportionment (i.e to distribute or divide available resources between missions) and 101
102 allocation (i.e. assign available resources to specific missions) of all available resources. The fourth and final stage is the operational execution and reporting stage in which operations are conducted and performance is evaluated and communicated back up the chain of command. Use of cross-mission outcome values during the second and third stages of the planning process identified above could result in delivery of improved, or even optimized, overall public service value. I will limit my summary of the Coast Guard Standard Operational Planning Process to the high level overview provided above. Due to the sensitive nature of actual mission planning guidance, I am unable to include an analysis of mission guidance below the strategic level. However, Chapter 7 will discuss observed limitations and potential challenges facing the Coast Guard s Standard Operational Planning Process identified during the course of interviews with operational planning practitioners and subject matter experts. 102
103 Chapter 7: Challenges to the Standard Operations Planning Process This report, by its very length, defends itself against the risk of being read. Winston Churchill, I interviewed ten Coast Guard personnel to learn about the new Standard Operational Planning Process and to better understand how it was actually being applied and used. As indicated in Chapter Two, these ten people represented a variety of roles and responsibilities in all three levels of the operational chain of command. All interviews were conducted in person at their respective places of work. Appendix E contains a listing of questions used to frame the discussion for each interview. Due to the range of personal roles and responsibilities of the individuals being interviewed, I did not ask all interviewees all questions. Instead, I selected specific questions to serve as a starting point to build a conversation that targeted the issues or perspectives directly relevant to the individual being interviewed. The result of these ten interviews was a better understanding of the process improvements achieved through the implementation of the Standard Operational Planning Process as well as the challenges that may lie ahead. Many of these comparisons are made based on my professional experiences as a program analyst at Coast Guard Headquarters during the period and as the senior operations planning analyst at Coast Guard Atlantic Area during the period During these assignments, I became very familiar with the operational planning aspects of the Coast Guard s strategic resource acquisition process and the implementation of the then current operational planning process prior to and following the 103
104 September 11 th terrorist attacks that drove fundamental changes in how the Coast Guard plans operations. Before jumping directly into the discussion of improvements and potential future challenges that await the Coast Guard s Standard Operational Planning Process, it is important to note that the experiences of the interviewees and my own observations are based on a process that has yet to complete its first full planning cycle. The standard operational planning process was only formally implemented in September-October of 2007 after a one-year prototype of limited scope. Improvements will be made as practitioners progress along the learning curve and the organization continuously adapts and adjusts. Similarly, new problems will arise as the process is applied in unanticipated situations. These truths are inevitable. The Standard Operational Planning Process is a significant improvement over previous operational planning processes. It is a truly multi-mission planning process. It was designed as such from the very beginning resulting in a more balanced representation of the competing needs of the Coast Guard s eleven missions. In addition to spanning all of the Coast Guard s missions, it encompasses and accounts for a far greater percentage of the Coast Guard s operational resources. While not every operational resource is accounted for, as discussed below, a critical mass of resources are now managed through the standard operational planning process to make the process relevant to all mission areas and geographic regions. In addition to spanning more missions and resources, the new process better aligns and communicates strategic intent throughout the organization. Alignment between the operational, budget, and resource support strategies is crucial to the long-term viability of the 104
105 process and is arguably the most important improvement of the new process. One reason that this alignment is now possible is the fact that the Coast Guard s organizational structure is better aligned to reduce programmatic and geographically based domains. The Standard Operational Planning Process was not thrust upon the Coast Guard s traditional mission based organization; it was developed in conjunction with a more functionally based organization that emphasizes cross-mission performance and adaptability. And finally, unrelated to its actual content, the standard operational planning process was given significant visibility and senior level support resulting in increased emphasis on deliberate planning processes throughout the organization. Despite these significant successes and improvements, the standard operational planning process is not without future challenges. Most notably, it is a victim of its own success. By encompassing all missions and a greater share of operational resources, the complexity and sheer volume of information that must be communicated has almost doubled. For example, despite the existence of the Coast Guard Maritime Strategy and seven mission campaign plans, the strategic guidance statement for fiscal year 2008 consists of over 45 pages of detailed external and internal threats, performance goals, and resource management ceilings. The operational guidance statement totals 18 single-spaced pages and data tables. At the tactical level, weekly or bi-weekly operations plans that summarize planned operations in a local geographic region routinely exceed four single spaced pages. Managing the volume of information, communications, and the associated administrative burdens, without degrading the communication of strategic intent, will be crucial to the benefit-cost perceived by practitioners of the new process. 105
106 Compounding the problems associated with the volume of communications and associated administrative burdens, operational planning staffs are often required to perform ancillary tasks that prevent the timely completion of operational planning duties. This situation is not unique to the operational planning staffs and is quite common throughout the organization. The unfortunate consequence for operational planning staffs, however, is that delays and compromised work quality that result from the performance of ancillary tasks, ripples throughout the constructed and dependent feedback cycles, growing over time. The standard operational planning process was deliberately designed to provide timely feedback up and down the chain of command. The delay of a single sector performance assessment will either delay the completion of summary assessments conducted at higher levels of the organization or result in summary assessments being completed with incomplete information. Either result erodes the overall process. Another major challenge facing the new process is its ability to objectively prioritize mission goals and planning guidance. This challenge appears to have carried over from the previous operational planning process. For example, the following statement of operational guidance and direction was obtained from the initial planning guidance for fiscal year 2009 operations: OPERATIONAL GUIDANCE AND DIRECTION: OPERATION NEPTUNE SHIELD, MARITIME SENTINEL, OCEAN GUARDIAN, OCEAN STEWARD, SOVEREIGN SHORES, AND STEEL WEB, AS WELL AS MARINE SAFETY AND SECURITY COMPLIANCE WILL CONTINUE TO BE A HIGH PRIORITY. (CG Msg Z Oct 2007) The above listed campaign plans account for eight of the Coast Guard s eleven primary missions. The mission areas that are not covered in the above listing include search and rescue, defense operations, and other law enforcement; search and rescue is arguably of equal or 106
107 higher priority than those listed above and defense operations are tied to external events and national priorities. Without an objective basis that allows operational commanders to compare trade-offs associated with different missions, blanket priority statements as listed above add little value. Incorporation of relative risk measures, such as those contained in the Consequence Equivalency Matrix, or quantitative economic based measures of mission outcomes as detailed in Chapter 4, are needed to provide important context to high-level statements of mission priorities and enable them to be further disaggregated and applied at local levels. Perhaps the most formidable challenge facing the new standard operational planning process is the impending clash of organizational cultures associated with how the various operational resource types are managed. Historically, Coast Guard aircraft have been centrally managed due to their high cost of operation, need for standardization, and regulatory and safety considerations associated with operating aircraft. This is contrasted by the small-boat community which has traditionally been managed in a more distributed or decentralized fashion. Although significant progress has been made to centrally acquire small-boats and standardize their training and material configuration, small-boats, by the nature of their primary missions, have a higher percentage of un-programmed operating time. Managing disparate resource types under the same operational planning process will result in, or at least should force, shifts in organizational sub-cultures. For example, organizational and budgetary pressures to operate existing small-boats more efficiently will likely drive the percentage of unprogrammed operating time down, requiring resource managers to plan operations further in advance or endure administrative approval processes to operate resources above planned 107
108 levels in response to higher than expected resource demands. Over time, these pressures may be sufficient to shift small-boat management practices away from a traditional fire-house model (i.e. emergency response resources held in reserve for the next emergency response) toward a police on patrol model (i.e. fewer emergency resources held in reserve; patrolling resources are diverted to higher priority missions). Building on the challenge presented by shifting organizational sub-cultures, the new operational planning process now encompasses planning efforts for missions that traditionally have not relied on cutters, aircraft, or small-boats. Instead, these missions rely on the efforts of individuals, or teams of individuals, to achieve performance outcomes. Up to this point, the operational planning processes have focused on managing operating platforms or teams of individuals that act like an operational platform (e.g. a law enforcement team that deploys onboard an allied vessel for counter-drug operations). Planning the efforts of individuals responsible for performing mission outcomes (e.g. a marine inspector verifying a vessel s compliance with construction standards) can potentially increase the complexity of planning efforts by an order of magnitude. A deliberate process to identify which job positions or occupational specialties that need to be tracked at an individual level is required. The final challenge facing the operational planning process is the inconsistent interpretation of functional job responsibilities. More specifically, how are trade-offs between competing mission demands to be handled. I interviewed six individuals directly involved in the operational planning process at all levels of the operational chain of command. Interviewees at two of the organizational levels viewed their role in resolving disputes between competing 108
109 mission areas as one of coordination. If two or more mission areas were competing for the same resources, the operational planning staffs viewed their role as bringing this conflict to the attention of the affected mission program managers with the expectation that the mission program managers would resolve the dispute. At the other end of the spectrum, a more authoritative approach was favored. Interviewees at the other two organizational levels assumed a more active role for themselves and recommended, or even determined, a resolution. These two interpretations of the planning staff s role are important. They reflect different interpretations of how organizational power and authority should work. The first more passive approach reflects the traditional role of planning personnel relative to the historically powerful program managers. The second more activist and empowered approach reflects the increased organizational emphasis on operational planning and a view that planning staffs are perhaps better positioned than individual program managers to develop objective and unbiased solutions to resource management issues that span multiple missions. I don t believe that either interpretation is correct for all situations. I do believe, however, that operational commanders should make a deliberate decision regarding how cross-mission issues are to be resolved and resource the affected staff accordingly. Regardless of whether planning staffs perform in a coordination or authoritative capacity, one tool that will help cross-mission communication and possibly resolve issues before they occur is use of objective criteria for determining relative mission outcome values. This is where the mission outcome values outlined in Chapter 4 may be of use. 109
110 Chapter 8: Conclusions To succeed, jump as quickly at opportunities as you do at conclusions. Benjamin Franklin, As indicated in the title, this thesis is but the first in a series of steps needed to better understand the public service value delivered by a multi-mission organization and the potential opportunities that are available with a more complete understanding of the relative, or absolute, trade-offs associated with apportioning scarce resources between those missions. There are several areas which warrant further work and research. First, I was unable to establish the public service value associated with four of the Coast Guard s eleven mission areas. This shortfall can be partially overcome by updating the relative risk rankings of the Consequence Equivalency Matrix, discussed in Chapter 4, and combining these with the absolute mission outcome values established for the other seven mission areas. Updating the Consequence Equivalency Matrix with the absolute missions outcome values will not only reinforce the validity of the relative risk rankings, but will allow more reliable relative risk rankings to be developed for the remaining four mission area performance outcomes until independently developed analysis can be developed and/or located. Additional work is also needed to better quantify the linkages between resources and mission outcomes. The mission performance outcome values contained in Table 4-21, as well as the Consequence Equivalency Matrix, can provide valuable information and a broader perspective to operational commanders and their planning staffs. An objective and quantitative basis of comparison is a powerful tool that can help clarify and guide complex resource apportionment 110
111 decisions in a multi-mission environment. However, simply providing a listing of absolute or relative mission performance outcome values is not sufficient. Improved projections of mission threats and understanding of how specific resource capabilities perform in a variety of mission threat scenarios are needed to truly capitalize on the benefits of understanding cross-mission trade-offs. In addition, the marginal mission outcome impact associated with incremental changes in mission resources must be better quantified. To answer the question, What do I expect to gain and at what cost? is very difficult to quantify. But an efficient and effective multi-mission resource management process must try to answer just that question as objectively as possible. The most important lesson that I learned from this research, however, relates to the communication of strategic intent. The value of communicating strategic intent does not reside in the aspects of who, what, where, or when. The value of communicating strategic intent resides in communicating the why. Why the Coast Guard should invest limited funds to develop one capability over another. Why resources are apportioned to one mission instead of another. Why assets are targeted in one geographic region instead of another. Why cutter crews endure prolonged separation from family in order to patrol a far off quadrant of the ocean or why aircrews and boat-crews need to brave the elements just one last time in the hopes they locate the overdue fishing vessel. Understanding cross-mission trade-offs enables leaders to communicate the why and it enables those who are called to perform to understand why. 111
112 Coast Guard personnel understand that they are the who, their job is the what, where is whereever duty calls, and when is whenever there is a need. They do however need to understand the why. Why provides alignment that transcends simple chains of command and mechanical resource management practices. The why provides the inspiration and motivation that enables ordinary people to achieve extraordinary results. Semper Paratus 112


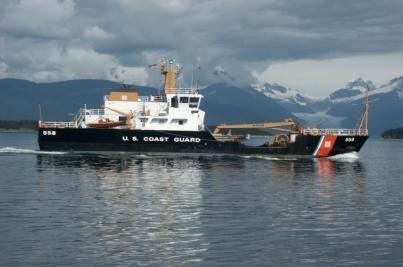
113 Appendix A: Coast Guard Platforms and Units Asset Asset Description Typical Missions 378 High Endurance Cutter; operates far offshore including overseas deployments Counter Drug, Illegal Migration, Homeland Security, Living Marine Resources, Defense Operations, Search and Rescue # in service: Medium Endurance Cutter; operates near to far offshore # in service: 13 Counter Drug, Illegal Migration, Homeland Security, Living Marine Resources, Defense Operations, Search and Rescue 210 Medium Endurance Cutter; operates near to far offshore # in service: Patrol Boat; operates near to far offshore # in service: 45 Counter Drug, Illegal Migration, Homeland Security, Living Marine Resources, Search and Rescue Counter Drug, Illegal Migration, Homeland Security, Living Marine Resources, Search and Rescue 87 Patrol Boat; operates near shore # in service: 66 Counter Drug, Illegal Migration, Homeland Security, Living Marine Resources, Search and Rescue 225 Ocean Going Buoy Tender; operates near shore, occasionally deployed overseas Aids to Navigation, Illegal Migration, Homeland Security, Ice Breaking, Search and Rescue # in service: Coastal Buoy Tender; operates near shore # in service: 14 Aids to Navigation, Illegal Migration, Homeland Security, Search and Rescue 113


 service: 172 25 Response Boat; operates in harbors")


114 140 Harbor Tug; operates in harbors and near shore # in service: 9 Ice Breaking, Homeland Security, Living Marine Resources, Search and Rescue 65 Harbor Tug; operates in harbors # in service: 11 Ice Breaking, Homeland Security, Search and Rescue, Aids to Navigation 47 Motor Life Boat; operates in harbors and near shore (up to 50 miles offshore) Search and Rescue, Homeland Security, Living Marine Resources # in service: Utility Boat; operates in harbors and near shore (up to 25 miles offshore) Search and Rescue, Homeland Security, Living Marine Resources # in service: Response Boat; operates in harbors and near shore (up to 10 miles offshore) Homeland Security, Search and Rescue, Living Marine Resources # in service: 457 HC-130 Airplane # in service: 27 HU-25 Airplane # in service: 41 Search and Rescue, Counter Drug, Illegal Immigration, Homeland Security, Living Marine Resources Search and Rescue, Counter Drug, Illegal Immigration, Homeland Security, Living Marine Resources 114


 # in service: 10 The Nationwide Differential Global Positioning System (DGPS) provides continuous")
; provided free to anyone with a DGPS receiver.")

115 HH-60 Helicopter # in service: 42 Search and Rescue, Counter Drug, Illegal Immigration, Homeland Security, Living Marine Resources HH-65 Helicopter # in service: 94 Search and Rescue, Counter Drug, Illegal Immigration, Homeland Security, Living Marine Resources Coast Guard Command Centers; operate 7X24 managing Coast Guard operations; local, regional, and national focus # in service: 50 Coast Guard Vessel Traffic Service Centers; operate 7X24 managing commercial traffic in high traffic ports; local focus Search and Rescue, Environmental Response and Protection, Counter Drug, Illegal Migration, Homeland Security, Living Marine Resources Mobility (Commercial Traffic Management) # in service: 10 The Nationwide Differential Global Positioning System (DGPS) provides continuous GPS correction signals throughout the U.S. enabling real-time positional errors of 3-10 meters (compared to meters available thru standard GPS); provided free to anyone with a DGPS receiver. More than 50,000 short range aids to navigation include navigational buoys, automated fog signals, navigational range lights, and lighthouse beacons Mobility; interagency project performed in conjunction with the Dept of Defense, Federal Highways Administration, and Federal Railroads Administration Mobility, Marine Safety, Search and Rescue 115
116 Appendix B: Principles of Coast Guard Operations This overview of principles of Coast Guard Operations was excerpted from Publication 1, U.S. Coast Guard: America s Maritime Guardian. Clear Objective: Direct every operation toward a clearly defined and attainable objective. The most significant action a leader can take in planning and executing an operation is to clearly express the overarching objective to subordinates. Effective Presence: At the most basic level, effective presence means having the right assets and capabilities at the right place at the right time. Ensuring an effective presence also requires careful attention to the ability to sustain our assets during normal operations. A key component of effective presence is acceptable presence, which refers to the reality that foreign governments and nonstate actors oftentimes regard Coast Guard forces as less threatening or objectionable than those of the other U.S. armed services. Unity of Effort: Most Coast Guard operations are performed by cooperative effort among a number of different units, or by the Coast Guard working in concert with and coordinating the efforts of a diverse set of governmental and non-governmental entities, to achieve the operational objective. The concept known as the chain of command is an essential element to achieving internal unity of effort Respect for the chain of command, especially when coupled with proper staff coordination, contributes significantly to internal unity of effort. Unity among organizations is the external counterpart to internal unity of effort. This external leadership challenge is in many respects the more demanding, because the external entities we deal with generally are not under the Coast Guard s authority and discerning those organizations lines of authority may be problematic The Coast Guard does not have the final authority in all situations and when necessary refers decisions to the appropriate level. On-Scene Initiative: The nature of our operations demands that Coast Guard men and women be given latitude to act quickly and decisively within the scope of their authority, without waiting for direction from higher levels in the chain of command the concept of allowing the person on scene to take the initiative guided by a firm understanding of the desired tactical objectives and the national interests at stake remains central to the Coast Guard s view of its command relationships. Our ethos is that the person on scene can be depended upon to assess the situation, seize the initiative, and take the action necessary for success. Decisive action requires unity of effort getting all parts of a force to work together. Rapid action, on the other hand, requires a large degree of decentralization, giving those closest to the 116
117 problem the freedom to solve it. To reconcile these seemingly contradictory requirements, we use tools called the commander s intent and concept of operations. The commander s intent conveys the objective and the desired course of action. The concept of operations details the commander s estimated sequence of actions to achieve the objective and contains essential elements of a plan i.e., what is to be done and how the commander plans to do it. A significant change in the situation that requires action will alter the concept of operations, but the commander s intent is overarching and usually remains unchanged. Flexibility: This principle is the operational corollary to our multi-mission character. Arising from a combination of broad authority, diverse responsibilities, and limited resources, the principle means that if we are to succeed in pursuing multiple missions with the same people and assets, we must be able to adjust to a wide variety of tasks and circumstances. This notion of flexibility also is deeply embedded in our heritage of semper paratus. We built our reputation for being always ready to meet just about any maritime challenge by successfully and repeatedly adapting to the situation at hand. The most demanding circumstances today require the Coast Guard to conduct surge operations high-intensity efforts usually launched at short notice in response to an emergency situation. Managed Risk: Just as the unity of effort principle has internal and external dimensions, so too the principle of managed risk operates at two levels. The internal aspect of this principle involves the commander s obligations to ensure the unit is properly trained, equipped, and maintained for the mission and to carefully assess crew and equipment capabilities against the operational scenario when assessing whether and how to execute a given mission. Preparation alone, however, is not enough. Success also requires that our people and equipment be used within the limits of their abilities. Responsible commanders evaluate the capability of crew and equipment against the conditions likely to be encountered when deciding on the proper course of action. Conscious attention to time-tested and time-honored principles of safe operation is a necessity. The idea of managing risks is not limited to Coast Guard response operations. In fact, risk management through prevention (to reduce the probability of an adverse event) and response (to minimize consequences when an adverse event does occur) has long been a fundamental aspect of Coast Guard operations prevention and response activities, while focused on different aspects of the same problem, are inextricably linked. Neither is superior to the other and neither is adequate by itself. More importantly, the Coast Guard s overall effectiveness depends on the synergy between these two very different means of achieving success: our operational strengths in the response arena make us more effective in the prevention arena, and vice versa. Prevention and response are both essential tools for Coast Guard success. Restraint: Coast Guard personnel have always been under a special obligation to exercise their powers prudently and with restraint. Title 14 of the U.S. Code, Section 89, confers on Coast Guard personnel an unparalleled level of law enforcement authority. A lack of restraint in Coast Guard operations, then, would be inconsistent with one of the fundamental and longstanding practices of the Service, as well as potentially violating the 117
118 constitutional protections afforded American citizens. Restraint extends beyond how Coast Guard personnel treat American citizens it also covers how we treat the foreign citizens with whom we come into contact. As the cutting edge of U.S. maritime law enforcement, the Coast Guard must also exercise restraint when dealing with the illegal acts by foreign vessels and their crews. We have a duty to enforce U.S. sovereignty, but in a manner that does honor to the Constitution we took an oath to uphold. 118
119 Appendix C: Principles of War This overview of Principles of War was excerpted from Publication 1, U.S. Coast Guard: America s Maritime Guardian, Appendix B and Joint Publication 3-0, Doctrine For Joint Operations (1995). As a member of the U.S. Armed Forces, the principles of war also apply to the Coast Guard, particularly when we engage in joint military operations with the Navy and the other armed services. Like the broader principles to which the Service adheres, these principles do not constitute a checklist that should be memorized. Rather, they provide a framework for thinking about the requirements of warfare and, when taken out of the context of combat, other types operations as well. The principles are as follows: Objective. The purpose of the objective is to direct every military operation toward a clearly defined, decisive, and attainable objective. The objective of combat operations is the destruction of the enemy armed forces capability and will to fight. The objective of an operation other than war might be more difficult to define; nevertheless, it too must be clear from the beginning. Objective must directly, quickly, and economically contribute to the purpose of the operation. Each operation must contribute to strategic objectives. Avoid actions that do not directly contribute to achieving the objective. Mass. The purpose of mass is to concentrate the effects of combat power at the place and time to achieve decisive results. To achieve mass is to synchronize appropriate joint force capabilities where they will have a decisive effect in a short period of time. Mass must be sustained to have the desired effect. Massing effects, rather than concentrating forces, can enable even numerically inferior forces to achieve decisive results and minimize human losses and waste of resources. Maneuver. The purpose of maneuver is to place the enemy in a position of disadvantage through the flexible application of combat power. Maneuver is the movement of forces in relation to the enemy to secure or retain positional advantage, usually in order to deliver or threaten delivery of the direct and indirect fires of the maneuvering force. Effective maneuver keeps the enemy off balance and thus protects the friendly force. It contributes materially in exploiting successes, preserving freedom of action, and reducing vulnerability by continually posing new problems for the enemy. Offensive. The purpose of an offensive action is to seize, retain, and exploit the initiative. Offensive action is the most effective and decisive way to attain a clearly defined objective. Offensive operations are the means by which a military force seizes and holds the initiative while maintaining freedom of action and achieving decisive results. The importance of offensive action is fundamentally true across all levels of war. 119
120 Economy of Force. The purpose of the economy of force is to allocate minimum essential combat power to secondary efforts. Economy of force is the judicious employment and distribution of forces. It is the measured allocation of available combat power to such tasks as limited attacks, defense, delays, or deception in order to achieve mass elsewhere at the decisive point and time. Unity of Command. The purpose of unity of command is to ensure unity of effort for every objective under one responsible commander for every objective. Unity of command means that all forces operate under a single commander with the requisite authority to direct all forces employed in pursuit of a common purpose. Unity of effort, however, requires coordination and cooperation among all forces toward a commonly recognized objective, although they are not necessarily part of the same command structure. In multi-national and interagency operations, unity of command may not be possible, but the requirement for unity of effort becomes paramount. Unity of effort coordination through cooperation and common interests is an essential complement to unity of command. Simplicity. The purpose of simplicity is to prepare clear, uncomplicated plans and concise orders to ensure thorough understanding. Simplicity contributes to successful operations. Simple plans and clear, concise orders minimize misunderstanding and confusion. When other factors are equal, the simplest plan is preferable. Simplicity in plans allows better understanding and execution planning at all echelons. Simplicity and clarity of expression greatly facilitate mission execution in the stress, fatigue, and other complexities of modern combat and are especially critical to success in combined operations. Surprise. The purpose of surprise is to strike the enemy at a time or place in a manner for which it is unprepared. Surprise can help the commander shift the balance of combat power and thus achieve success well out of proportion to the effort expended. Factors contributing to surprise include speed in decision making, information sharing, and force movement; effective intelligence; deception; application of unexpected combat power; operations security; and variations in tactics and methods of operation. Security. The purpose of security is to never permit the enemy to acquire unexpected advantage. Security enhances freedom of action by reducing our vulnerability to hostile acts, influence, or surprise. Security results from the measures taken by commanders to protect their forces. Staff planning and an understanding of enemy strategy, tactics, and doctrine will enhance security. Risk is inherent in military operations. Application of this principle includes prudent risk management, not undue caution. Protecting the force increases our combat power and preserves freedom of action. 120
.")
121 Appendix D: Example Operational Campaign Plan The following information was excerpted from the Coast Guard s strategic plan for the Living Marine Resources Mission entitled Ocean Guardian (2004). 121

122 Interagency Linkages: Future state outline: Fisheries regulations become more complex in order to balance 10 National Standards 4, respond to court orders as a result of litigation, or become more comprehensive as part of an ecosystem management scheme; More areas of the oceans will be managed by marine protected areas; International emphasis on high seas fisheries management will increase, in areas such as regional fisheries management organizations, Illegal, Unregulated and Unreported (IUU) fishing, deep sea trawling, and sea mount fisheries; Domestic fishing effort is reduced, either through vessel buy-back programs or management schemes that limit effort such as days-at-sea or Individual Fishing Quotas (IFQs); Relatively well managed fish stocks in the U.S. EEZ will provide an enticing target for distant water foreign fishers as worldwide demand for fish increases and opportunities to fish in the EEZs of other nations decrease; Coast Guard capabilities and capacities, such as maritime domain awareness, will improve due to homeland security funding; resulting in improved fisheries enforcement ability; and Recommendations from the 2003 Pew Ocean Commission and 2004 Commission on Ocean Policy reports result in dynamic changes to fisheries management. 4 Any fishery management plan prepared and any regulation promulgated to implement any such plan must be consistent with the 10 national standards defined in the Magnuson-Stevens Fisheries Conservation and Management Act, Public Law as amended through October 11,
This Page Intentionally Left Blank
 This Page Intentionally Left Blank OCEAN SSTEWARD U..SS.. Cooaasst t Guuaar rdd Maar rinnee PPr root teecct teedd SSppeecci ieess SSt traat teeggi icc PPl laann TABLE OFF CONTENTSS Ocean Steward s Purpose
Department of Homeland Security Office of Inspector General
 Department of Homeland Security Office of Inspector General Independent Review of the U.S. Coast Guard's Reporting of the FY 2008 Drug Control Performance Summary Report OIG-09-27 February 2009 Office
COAST GUARD. Actions Needed to Improve Strategic Allocation of Assets and Determine Workforce Requirements
 May 2016 United States Government Accountability Office Report to the Chairman, Subcommittee on Coast Guard and Maritime Transportation, Committee on Transportation and Infrastructure, House of Representatives
December 21, 2004 NATIONAL SECURITY PRESIDENTIAL DIRECTIVE NSPD-41 HOMELAND SECURITY PRESIDENTIAL DIRECTIVE HSPD-13
 8591 December 21, 2004 NATIONAL SECURITY PRESIDENTIAL DIRECTIVE NSPD-41 HOMELAND SECURITY PRESIDENTIAL DIRECTIVE HSPD-13 MEMORANDUM FOR THE VICE PRESIDENT THE SECRETARY OF STATE THE SECRETARY OF THE TREASURY
FUTURE U.S. NAVY AND USCG OPERATIONS IN THE ARCTIC
 Working Document of the NPC Study: Arctic Potential: Realizing the Promise of U.S. Arctic Oil and Gas Resources Made Available March 27, 2015 Paper #7-13 FUTURE U.S. NAVY AND USCG OPERATIONS IN THE ARCTIC
The US Coast Guard. Cognitive Lesson Objective: Know the core missions of the United States Coast Guard (USCG).
.") The US Coast Guard Cognitive Lesson Objective: Know the core missions of the United States Coast Guard (USCG). Cognitive Sample of Behavior: State the USCG s three core missions. Affective Lesson Objective:
The US Coast Guard Cognitive Lesson Objective: Know the core missions of the United States Coast Guard (USCG). Cognitive Sample of Behavior: State the USCG s three core missions. Affective Lesson Objective:
UAV s And Homeland Defense Now More Critical Than Ever. LCDR Troy Beshears UAV Platform Manager United States Coast Guard
 UAV s And Homeland Defense Now More Critical Than Ever LCDR Troy Beshears UAV Platform Manager United States Coast Guard Common Maritime Threats Counter- Terrorism Maritime Food Supply (Fish) Mass Migration
The American Merchant Marine The Missing Link in Cargo Security
 Ver44 The American Merchant Marine The Missing Link in Cargo Security The recent debate on the merits of whether or not a foreign-controlled entity should be allowed to operate terminals in United States
Questions & Answers about the Law of the Sea:
 Questions & Answers about the Law of the Sea: Q: Would the U.S. have to change its laws if we ratified the treaty? A: In 1983, Ronald Reagan directed U.S. agencies to comply with all of the provisions
arine MNews Salvage & Spill Response: Unresolved Issues Hamper Progress Maritime Security Workboats: Stack Emissions: Pollution Response:
 MNews OCTOBER The Information Authority for the Workboat Offshore Inland Coastal Marine Markets arine 2015 www.marinelink.com Salvage & Spill Response: Unresolved Issues Hamper Progress Maritime Security
SENATE APPROPRIATIONS COMMITTEE FY16 HOMELAND SECURITY APPROPRIATIONS U.S. COAST GUARD As of June 22, 2015
 Surface Asset Acquisition Programs ($ in thousands) CAPITAL INVESTMENT PROJECT FY 2016 QTY SAC QTY Δ Δ Request MARK (SAC-PB) (QTY) National Security Cutter (NSC) $ 91,400 $ 731,400 1 +$ 640,000 +1 Offshore
USACE 2012: The Objective Organization Draft Report
 USACE 2012: The Objective Organization Draft Report A Critical Analysis September 2003 On August 25, 2003 the Chief of the U.S. Army Corps of Engineers, General Robert Flowers, released to the public a
History and Missions. Basic Introduction Course (BIC) Lesson 4. Auxiliary University Programs
 Lesson 4. Auxiliary University Programs") History and Missions Basic Introduction Course (BIC) Lesson 4 Core Values at the core of our service Honor Integrity is our standard. We demonstrate uncompromising ethical conduct and moral behavior in
History and Missions Basic Introduction Course (BIC) Lesson 4 Core Values at the core of our service Honor Integrity is our standard. We demonstrate uncompromising ethical conduct and moral behavior in
Northern California Area Maritime Security Committee
 Northern California Area Maritime Security Committee 1. MISSION San Francisco Security Information White Paper The mission of this Area Maritime Security Committee is to help coordinate planning, information
United States Coast Guard U.S. Department of Homeland Security
 Agenda Coast Guard Sector Baltimore Small Vessel Security Metal Theft Past and Present 1790: Revenue Marine created within Treasury 1863: Revenue Cutter Service established 1915: Revenue Cutter Service
Department of Defense INSTRUCTION
 Department of Defense INSTRUCTION NUMBER 4715.6 April 24, 1996 USD(A&T) SUBJECT: Environmental Compliance References: (a) DoD Instruction 4120.14, "Environmental Pollution Prevention, Control and Abatement,"
Anchorage Grounds; Galveston Harbor, Bolivar Roads Channel, Galveston, Texas
 This document is scheduled to be published in the Federal Register on 04/27/2018 and available online at https://federalregister.gov/d/2018-08873, and on FDsys.gov 9110-04-P DEPARTMENT OF HOMELAND SECURITY
U.S. Coast Guard. America s Maritime Guardian
 U.S. Coast Guard America s Maritime Guardian Aug 2011 A few armed vessels, judiciously stationed at the entrances of our ports, might at a small expense be made useful sentinels of the laws. Alexander
The DHS Budget for FY 2008: Time for a Comprehensive Approach to Homeland Security
 The DHS Budget for FY 2008: Time for a Comprehensive Approach to Homeland Security Mackenzie M. Eaglen In the years since the Department of Homeland Security (DHS) was established, the Bush Administration
NOAA FISHERIES (NATIONAL MARINE FISHERIES SERVICE)
") NOAA FISHERIES (NATIONAL MARINE FISHERIES SERVICE) John F. Barylsky SPECIAL AGENT NOAA FISHERIES (NATIONAL MARINE FISHERIES SERVICE) OFFICE OF LAW ENFORCEMENT SOUTHEAST DIVISION About us... OLE & the Office
NOAA FISHERIES (NATIONAL MARINE FISHERIES SERVICE) John F. Barylsky SPECIAL AGENT NOAA FISHERIES (NATIONAL MARINE FISHERIES SERVICE) OFFICE OF LAW ENFORCEMENT SOUTHEAST DIVISION About us... OLE & the Office
SUMMARY: The Coast Guard is establishing a safety zone during the 2015 Fautasi Ocean
 This document is scheduled to be published in the Federal Register on 10/22/2015 and available online at http://federalregister.gov/a/2015-26955, and on FDsys.gov 9110-04-P DEPARTMENT OF HOMELAND SECURITY
Safety and Security Zones; New York Marine Inspection and Captain of the Port
 This document is scheduled to be published in the Federal Register on 04/20/2018 and available online at https://federalregister.gov/d/2018-08323, and on FDsys.gov 9110-04-P DEPARTMENT OF HOMELAND SECURITY
DOD INVENTORY OF CONTRACTED SERVICES. Actions Needed to Help Ensure Inventory Data Are Complete and Accurate
 United States Government Accountability Office Report to Congressional Committees November 2015 DOD INVENTORY OF CONTRACTED SERVICES Actions Needed to Help Ensure Inventory Data Are Complete and Accurate
Advance Questions for Buddie J. Penn Nominee for Assistant Secretary of the Navy for Installations and Environment
 Advance Questions for Buddie J. Penn Nominee for Assistant Secretary of the Navy for Installations and Environment Defense Reforms Almost two decades have passed since the enactment of the Goldwater- Nichols
Department of Homeland Security Office of Inspector General
 Department of Homeland Security Office of Inspector General Independent Review of the U.S. Coast Guard's Reporting of FY 2009 Drug Control Performance Summary Report OIG-10-47 January 2010 Office of Inspector
CHAIRMAN OF THE JOINT CHIEFS OF STAFF INSTRUCTION
 CHAIRMAN OF THE JOINT CHIEFS OF STAFF INSTRUCTION J3 CJCSI 3121.02 DISTRIBUTION: A, C, S RULES ON THE USE OF FORCE BY DOD PERSONNEL PROVIDING SUPPORT TO LAW ENFORCEMENT AGENCIES CONDUCTING COUNTERDRUG
Safety Zones, Facilities on the Outer Continental Shelf in the. SUMMARY: The Coast Guard proposes to establish safety zones
 This document is scheduled to be published in the Federal Register on 04/09/2014 and available online at http://federalregister.gov/a/2014-07838, and on FDsys.gov 9110-04-P DEPARTMENT OF HOMELAND SECURITY
Presentation 8 UNITED STATES COAST GUARD RADM STEVEN H. RATTI, COMMANDER, FIFTH COAST GUARD DISTRICT
 Presentation 8 UNITED STATES COAST GUARD RADM STEVEN H. RATTI, COMMANDER, FIFTH COAST GUARD DISTRICT U.S. Coast Guard Hurricane SANDY Preparation, Operations, and the HMS Bounty rescue RADM Steven H. Ratti
THE WHITE HOUSE Office of the Press Secretary EXECUTIVE ORDER
 FOR IMMEDIATE RELEASE June 19, 2018 THE WHITE HOUSE Office of the Press Secretary EXECUTIVE ORDER - - - - - - - OCEAN POLICY TO ADVANCE THE ECONOMIC, SECURITY, AND ENVIRONMENTAL INTERESTS OF THE UNITED
America s Coast Guard. Commandant s Guiding Principles. U.S. Coast Guard
 America s Coast Guard Commandant s Guiding Principles 2018 2022 U.S. Coast Guard About this document This document shares the Commandant s Guiding Principles. Each principle is interconnected with the
Security Zones; Naval Base Point Loma; Naval Mine Anti Submarine. SUMMARY: The Coast Guard is increasing a portion of an existing
 This document is scheduled to be published in the Federal Register on 12/02/2013 and available online at http://federalregister.gov/a/2013-28035, and on FDsys.gov 9110-04-P DEPARTMENT OF HOMELAND SECURITY
CG-9 Internal Controls Program Overview. CG-9 Rory Souther Association of Government Accountants Audio Conference June 8, 2011
 CG-9 Internal Controls Program Overview CG-9 Rory Souther Association of Government Accountants Audio Agenda 1. USCG / CG-9 Mission and Organization 2. History of Coast Guard 3. Internal Control Program
Exemptions from Environmental Law for the Department of Defense: Background and Issues for Congress
 Order Code RS22149 Updated August 17, 2007 Summary Exemptions from Environmental Law for the Department of Defense: Background and Issues for Congress David M. Bearden Specialist in Environmental Policy
TITLE 14 COAST GUARD This title was enacted by act Aug. 4, 1949, ch. 393, 1, 63 Stat. 495
 (Release Point 114-11u1) TITLE 14 COAST GUARD This title was enacted by act Aug. 4, 1949, ch. 393, 1, 63 Stat. 495 Part I. Regular Coast Guard 1 II. Coast Guard Reserve and Auxiliary 701 1986 Pub. L. 99
Special Local Regulation; Fautasi Ocean Challenge Canoe Race, Pago Pago Harbor,
 This document is scheduled to be published in the Federal Register on 09/27/2017 and available online at https://federalregister.gov/d/2017-20664, and on FDsys.gov 9110-04-P DEPARTMENT OF HOMELAND SECURITY
Systems Engineering Analysis of Unmanned Maritime Vehicles for USCG Mission Threads. LT J.B. Zorn, USCG CRUSER Group February 15, 2013
 Systems Engineering Analysis of Unmanned Maritime Vehicles for USCG Mission Threads LT J.B. Zorn, USCG CRUSER Group February 15, 2013 Bottom-Line Upfront USCG is a unique stakeholder in the maritime domain
April 29, David M. Hay, Chairman Commissioners of Pilotage Lower Coastal Area Post Office Box Charleston, South Carolina 29413
 H ENRY M CM ASTER ATTORNEY G ENERAL April 29, 2009 David M. Hay, Chairman Commissioners of Pilotage Lower Coastal Area Post Office Box 20096 Charleston, South Carolina 29413 Dear Mr. Hay: In a letter to
Marine Emergency Preparedness and Response. Canadian Coast Guard Presentation at the First Nations and Oil Pipeline Development Summit
 Marine Emergency Preparedness and Response Canadian Coast Guard Presentation at the First Nations and Oil Pipeline Development Summit October 27, 2015 1 The Canadian Coast Guard The Canadian Coast Guard
DEPARTMENT OF THE NAVY OFFICE OF THE CHIEF OF NAVAL OPERATIONS 2000 NAVY PENTAGON WASHINGTON, DC
 DEPARTMENT OF THE NAVY OFFICE OF THE CHIEF OF NAVAL OPERATIONS 2000 NAVY PENTAGON WASHINGTON, DC 20350-2000 OPNAVINST 3380.5A N314 OPNAV INSTRUCTION 3380.5A From: Chief of Naval Operations Subj: HIGH-VALUE
WHO'S IN AND WHO'S OUT
 WHO'S IN AND WHO'S OUT The Best Places to Work in the Federal Government rankings, produced by the Partnership for Public Service since 2003, are based almost entirely on data from the Office of Personnel
ADDITIONAL AMENDMENTS RELATING TO TOTAL FORCE MANAGEMENT (SEC. 933)
") ADDITIONAL AMENDMENTS RELATING TO TOTAL FORCE MANAGEMENT (SEC. 933) The House bill contained a provision (sec. 933) that would make conforming amendments to a series of statutes to ensure that the total
ADDITIONAL AMENDMENTS RELATING TO TOTAL FORCE MANAGEMENT (SEC. 933) The House bill contained a provision (sec. 933) that would make conforming amendments to a series of statutes to ensure that the total
U.S. Coast Guard - Locally Based, Nationally Deployed, Globally Connected; Internationally Prepared.
 U.S. Coast Guard - Locally Based, Nationally Deployed, Globally Connected; Internationally Prepared. A Monograph by CDR Lee B. Mynatt U.S. Coast Guard School of Advanced Military Studies United States
For the purpose of executing the duties and functions of the Coast Guard the Secretary may within the limits of appropriations made therefor:
 TITLE 14 - COAST GUARD PART I - REGULAR COAST GUARD CHAPTER 5 - FUNCTIONS AND POWERS 92. Secretary; general powers For the purpose of executing the duties and functions of the Coast Guard the Secretary
Safety Zone; Navy Underwater Detonation (UNDET) Exercise, Apra Outer Harbor, GU
 Exercise, Apra Outer Harbor, GU") This document is scheduled to be published in the Federal Register on 06/08/2017 and available online at https://federalregister.gov/d/2017-11926, and on FDsys.gov 9110-04-P DEPARTMENT OF HOMELAND SECURITY
This document is scheduled to be published in the Federal Register on 06/08/2017 and available online at https://federalregister.gov/d/2017-11926, and on FDsys.gov 9110-04-P DEPARTMENT OF HOMELAND SECURITY
Annual Report 2015 Japan's Actions against Piracy off the Coast of Somalia and in the Gulf of Aden
 March 2016 The Cabinet Secretariat The Government of Japan 1 Annual Report 2015 Japan's Actions against Piracy off the Coast of Somalia and in the Gulf of Aden Somalia and the Surroundings (off the Coast
Department of Defense DIRECTIVE
 Department of Defense DIRECTIVE NUMBER 1330.9 November 27, 2002 Certified Current as of November 21, 2003 SUBJECT: Armed Services Exchange Policy ASD(FMP) References: (a) DoD Directive 1330.9, "Armed Services
SUMMARY: The Coast Guard is establishing a temporary safety zone on the Upper Mississippi
 This document is scheduled to be published in the Federal Register on 08/23/2016 and available online at http://federalregister.gov/a/2016-20084, and on FDsys.gov 9110-04-P DEPARTMENT OF HOMELAND SECURITY
Department of Defense INSTRUCTION
 Department of Defense INSTRUCTION NUMBER 1330.09 December 7, 2005 USD(P&R) SUBJECT: Armed Services Exchange Policy References: (a) DoD Directive 1330.9, "Armed Services Exchange Policy," November 27, 2002
STATEMENT OF GORDON R. ENGLAND SECRETARY OF THE NAVY BEFORE THE SENATE ARMED SERVICES COMMITTEE 10 JULY 2001
 NOT FOR PUBLICATION UNTIL RELEASED BY THE SENATE ARMED SERVICES COMMITTEE STATEMENT OF GORDON R. ENGLAND SECRETARY OF THE NAVY BEFORE THE SENATE ARMED SERVICES COMMITTEE 10 JULY 2001 NOT FOR PUBLICATION
NEPA AND PRIVATE AIDS TO NAVIGATION
 NEPA AND PRIVATE AIDS TO NAVIGATION By Andrew Engle United States Coast Guard Miami, Florida September 26, 2012 Capstone paper submitted in partial fulfillment of the Requirements for the Certificate in
Canadian Coast Guard. Maritime Security Framework
 Canadian Coast Guard Maritime Security Framework Published by: Maritime Security Canadian Coast Guard Fisheries and Oceans Canada Ottawa, Ontario K1A 0E6 Her Majesty the Queen in Right of Canada 2010 Cat.
GAO. OVERSEAS PRESENCE More Data and Analysis Needed to Determine Whether Cost-Effective Alternatives Exist. Report to Congressional Committees
 GAO United States General Accounting Office Report to Congressional Committees June 1997 OVERSEAS PRESENCE More Data and Analysis Needed to Determine Whether Cost-Effective Alternatives Exist GAO/NSIAD-97-133
GENERAL ASSEMBLY OF NORTH CAROLINA SESSION 2013 SESSION LAW HOUSE BILL 484
 GENERAL ASSEMBLY OF NORTH CAROLINA SESSION 2013 SESSION LAW 2013-51 HOUSE BILL 484 AN ACT TO ESTABLISH A PERMITTING PROGRAM FOR THE SITING AND OPERATION OF WIND ENERGY FACILITIES. The General Assembly
APPENDIX A ABBREVIATIONS & DEFINITIONS
 A. ABBREVIATIONS ACOE ACP AOR CAC CAT CBRNE CGD SEVEN CCGDSEVEN CERCLA CFR CMT COMDTINST COMLANTAREA COTP DOD DOJ DOS EOC EOD EPA ERT FAA FBI FEMA FFC U.S. Army Corps of Engineers Alternate Command Post
50 years. of dedicated service. An honoured past, a committed future
 50 years of dedicated service An honoured past, a committed future Contents 1 Messages from the Minister and the Commissioner Published by: 50 th Anniversary Secretariat Fisheries and Oceans Canada Canadian
EVERGREEN IV: STRATEGIC NEEDS
 United States Coast Guard Headquarters Office of Strategic Analysis 9/1/ UNITED STATES COAST GUARD Emerging Policy Staff Evergreen Foresight Program The Program The Coast Guard Evergreen Program provides
Frameworks for Responses to Armed Attack Situations
 Section 2 Frameworks for Responses to Armed Attack Situations It is of utmost importance for the national government to establish a national response framework as a basis for an SDF operational structure
Forty-first Annual Conference of the Center for Oceans Law & Policy. Yogyakarta, Indonesia May 16-19, 2017
 Forty-first Annual Conference of the Center for Oceans Law & Policy Yogyakarta, Indonesia May 16-19, 2017 The Korean Coast Guard's Law Enforcement Concerning Chinese IUU Vessels KIM Wonhee Senior Researcher
Maritime Transport Safety
 Maritime Transport Safety Shen jiaqiang China Maritime Safety Administration 11# Jianguomennei Ave, Beijing, 100736 People's Republic of China Email: shenjiaqiang6@hotmail.com and a lot more.. 1. China
Department of Defense DIRECTIVE
 Department of Defense DIRECTIVE SUBJECT: DoD Foreign Clearance Program (FCP) References: See Enclosure 1 NUMBER 4500.54E December 28, 2009 Incorporating Change 1, May 24, 2017 USD(P) 1. PURPOSE. This Directive:
Final Grant Report Executive Summary. U.S. Coast Guard Nonprofit Grant Awarded to the National Association of State Boating Law Administrators
 Partnering with the U.S. Coast Guard & Recreational Boating Community to Implement the National Recreational Boating Safety Strategic Plan: NASBLA and the States U.S. Coast Guard Nonprofit Grant 1102-15
The Sport Fish Restoration and Boating Trust Fund
 University of Nebraska - Lincoln DigitalCommons@University of Nebraska - Lincoln Congressional Research Service Reports Congressional Research Service 2009 The Sport Fish Restoration and Boating Trust
Direct Component Project Evaluation Form
 Direct Component Project Evaluation Form Please complete the following information needed to evaluate your proposal. In order to be considered, complete evaluation packets must be received by October 31,
Navy Expeditionary Combat Command Executing Navy s Maritime Strategy
 Navy Expeditionary Combat Command Executing Navy s Maritime Strategy RADM Mark Handley NDIA 15 th Annual Expeditionary Warfare Conference 6 OCT 2010 THIS BRIEF CLASSIFIED: UNCLASS Overview Riverine Maritime
Prepared for Members and Committees of Congress
 Prepared for Members and Committees of Congress Œ œ Ÿ The federal role in environmental education has been an ongoing issue. For nearly two decades, EPA has been the primary federal agency responsible
16 Department of the Air Force Department of Veterans Affairs Department of Homeland Security
 OVERALL RANKINGS The overall rankings are determined by the agencies Best Places to Work index scores, which measure employee engagement. The index score is not an combined average of an agency s category
Coast Guard Deployable Operations Group
 Coast Guard Deployable Operations Group 1 11 CG Mission Areas Public Law 107-296 Ports, Waterways & Coastal Security Illegal Drug Interdiction Undocumented Migrant Interdiction Defense Readiness Other
S. ll. To provide for the improvement of the capacity of the Navy to conduct surface warfare operations and activities, and for other purposes.
 TH CONGRESS D SESSION S. ll To provide for the improvement of the capacity of the Navy to conduct surface warfare operations and activities, and for other purposes. IN THE SENATE OF THE UNITED STATES llllllllll
DEPARTMENT OF HOMELAND SECURITY REORGANIZATION PLAN November 25, 2002
 DEPARTMENT OF HOMELAND SECURITY REORGANIZATION PLAN November 25, 2002 Introduction This Reorganization Plan is submitted pursuant to Section 1502 of the Department of Homeland Security Act of 2002 ( the
a GAO GAO COAST GUARD Strategy Needed for Setting and Monitoring Levels of Effort for All Missions
 GAO United States General Accounting Office Report to the Subcommittee on Oceans, Atmosphere, and Fisheries, Committee on Commerce, Science, and Transportation, U.S. Senate November 2002 COAST GUARD Strategy
Contingency Planning, Emergency Management & Marine Transportation Policy Leader
 Contingency Planning, Emergency Management & Marine Transportation Policy Leader Transitioning Coast Guard leader that collaborates with diverse internal and external stakeholders to deliver results in
THE STATE OF THE MILITARY
 THE STATE OF THE MILITARY What impact has military downsizing had on Hampton Roads? From the sprawling Naval Station Norfolk, home port of the Atlantic Fleet, to Fort Eustis, the Peninsula s largest military
HOGANSAC th Annual Harbor Safety Committee Conference Seattle, Washington. Good Afternoon I am TF, chair of HOGANSAC
 HOGANSAC Houston-Galveston Navigation Safety Advisory Committee 2008 10th Annual Harbor Safety Committee Conference Seattle, Washington Good Afternoon I am TF, chair of HOGANSAC 1 HOGANSAC We have an average
Prepared Remarks of the Honorable Ray Mabus Secretary of the Navy Purdue University 8 May 2014
 Prepared Remarks of the Honorable Ray Mabus Secretary of the Navy Purdue University 8 May 2014 Thank you for that introduction. It is an honor for me to be here at Purdue today. Thank you President Daniels
Acquisition. Air Force Procurement of 60K Tunner Cargo Loader Contractor Logistics Support (D ) March 3, 2006
 March 3, 2006") March 3, 2006 Acquisition Air Force Procurement of 60K Tunner Cargo Loader Contractor Logistics Support (D-2006-059) Department of Defense Office of Inspector General Quality Integrity Accountability Report
March 3, 2006 Acquisition Air Force Procurement of 60K Tunner Cargo Loader Contractor Logistics Support (D-2006-059) Department of Defense Office of Inspector General Quality Integrity Accountability Report
CHAIRMAN OF THE JOINT CHIEFS OF STAFF INSTRUCTION
 CHAIRMAN OF THE JOINT CHIEFS OF STAFF INSTRUCTION J-5 CJCSI 2410.01D DISTRIBUTION: A, B, C, JS LAN, S GUIDANCE FOR THE EXERCISE OF RIGHT-OF-ASSISTANCE ENTRY References: a. Department of State policy statement,
TEXAS MARITIME UPDATE
 TEXAS MARITIME UPDATE Texas Transportation Commission Workshop June 25, 2014 Texas Ports Tour First time the state has embarked on a statewide tour and formal indepth examination of Texas ports For some
PART ENVIRONMENTAL IMPACT STATEMENT
 Page 1 of 12 PART 1502--ENVIRONMENTAL IMPACT STATEMENT Sec. 1502.1 Purpose. 1502.2 Implementation. 1502.3 Statutory requirements for statements. 1502.4 Major Federal actions requiring the preparation of
COMPLIANCE WITH THIS PUBLICATION IS MANDATORY
 BY ORDER OF THE SECRETARY OF THE AIR FORCE AIR FORCE INSTRUCTION 65-302 23 AUGUST 2018 Financial Management EXTERNAL AUDIT SERVICES COMPLIANCE WITH THIS PUBLICATION IS MANDATORY ACCESSIBILITY: Publications
THE WHITE HOUSE. Office of the Press Secretary. For Immediate Release January 17, January 17, 2014
 THE WHITE HOUSE Office of the Press Secretary For Immediate Release January 17, 2014 January 17, 2014 PRESIDENTIAL POLICY DIRECTIVE/PPD-28 SUBJECT: Signals Intelligence Activities The United States, like
CANADIAN COAST GUARD SEARCH AND RESCUE AND CANADIAN COAST GUARD AUXILIARY EVALUATION REPORT
 CANADIAN COAST GUARD SEARCH AND RESCUE AND CANADIAN COAST GUARD AUXILIARY EVALUATION REPORT FINAL REPORT FEBRUARY 2012 EVALUATION DIRECTORATE DIRECTION GÉNÉRALE DE L ÉVALUATION TABLE OF CONTENTS TABLE
Navy CVN-21 Aircraft Carrier Program: Background and Issues for Congress
 Order Code RS20643 Updated January 17, 2007 Summary Navy CVN-21 Aircraft Carrier Program: Background and Issues for Congress Ronald O Rourke Specialist in National Defense Foreign Affairs, Defense, and
DEPARTMENT OF THE NAVY OFFICE OF THE CHIEF OF NAVAL OPERATIONS 2000 NAVY PENTAGON WASHINGTON, DC OPNAVINST DNS-3 11 Aug 2011
 DEPARTMENT OF THE NAVY OFFICE OF THE CHIEF OF NAVAL OPERATIONS 2000 NAVY PENTAGON WASHINGTON, DC 20350-2000 OPNAVINST 5450.341 DNS-3 OPNAV INSTRUCTION 5450.341 Subj: MISSION, FUNCTIONS, AND TASKS OF COMMANDER,
Safety Zone; MODU KULLUK; Kiliuda Bay, Kodiak Island, AK to. SUMMARY: The Coast Guard is establishing a temporary safety
 This document is scheduled to be published in the Federal Register on 03/05/2013 and available online at http://federalregister.gov/a/2013-04989, and on FDsys.gov 9110-04-P DEPARTMENT OF HOMELAND SECURITY
Vessel Traffic Service Act (623/2005)
") 1 NB: Unofficial translation Finnish Maritime Administration Chapter 1 General provisions Section 1 Objectives Vessel Traffic Service Act (623/2005) The objectives of this Act are to increase the safety
1 NB: Unofficial translation Finnish Maritime Administration Chapter 1 General provisions Section 1 Objectives Vessel Traffic Service Act (623/2005) The objectives of this Act are to increase the safety
Mississippi Emergency Support Function #10 Oil and Hazardous Materials
 Emergency Support Function #10 Oil and Hazardous Materials ESF #10 Coordinator Department of Environmental Quality Primary Agencies Department of Environmental Quality State Department of Health/Division
Atlantic States Marine Fisheries Commission
 Atlantic States Marine Fisheries Commission Request for Proposals: Marine Aquaculture Pilot Projects Issue Date: December 1, 2017 Deadline for Submissions: February 1, 2018 The Atlantic States Marine Fisheries
Human Capital. DoD Compliance With the Uniformed and Overseas Citizens Absentee Voting Act (D ) March 31, 2003
 March 31, 2003") March 31, 2003 Human Capital DoD Compliance With the Uniformed and Overseas Citizens Absentee Voting Act (D-2003-072) Department of Defense Office of the Inspector General Quality Integrity Accountability
March 31, 2003 Human Capital DoD Compliance With the Uniformed and Overseas Citizens Absentee Voting Act (D-2003-072) Department of Defense Office of the Inspector General Quality Integrity Accountability
The Kingdom of Denmark s Challenges & Opportunities in the Arctic Maritime & Arctic Security & Safety Conference 2015
 The Kingdom of Denmark s Challenges & Opportunities in the Arctic Maritime & Arctic Security & Safety Conference 2015 Assistant Defense Attaché Royal Danish Embassy Jakob D. Rousøe jakrou@um.dk The Kingdom
CONTENTS. Follow us on
 December 19, 2011 CONTENTS FY 2012 Omnibus Spending Package Port Everglades Broward County Beaches Medicaid Reform Pilot Extension Water Quality Standards Chinese Drywall Settlement FY 2012 Omnibus Spending
We Shall Travel On : Quality of Care, Economic Development, and the International Migration of Long-Term Care Workers
 October 2005 We Shall Travel On : Quality of Care, Economic Development, and the International Migration of Long-Term Care Workers by Donald L. Redfoot Ari N. Houser AARP Public Policy Institute The Public
EXECUTIVE ORDER 12333: UNITED STATES INTELLIGENCE ACTIVITIES
 EXECUTIVE ORDER 12333: UNITED STATES INTELLIGENCE ACTIVITIES (Federal Register Vol. 40, No. 235 (December 8, 1981), amended by EO 13284 (2003), EO 13355 (2004), and EO 13470 (2008)) PREAMBLE Timely, accurate,
GAO MILITARY BASE CLOSURES. DOD's Updated Net Savings Estimate Remains Substantial. Report to the Honorable Vic Snyder House of Representatives
 GAO United States General Accounting Office Report to the Honorable Vic Snyder House of Representatives July 2001 MILITARY BASE CLOSURES DOD's Updated Net Savings Estimate Remains Substantial GAO-01-971
Delayed Federal Grant Closeout: Issues and Impact
 Delayed Federal Grant Closeout: Issues and Impact Natalie Keegan Analyst in American Federalism and Emergency Management Policy September 12, 2014 Congressional Research Service 7-5700 www.crs.gov R43726
GULF STATES MARINE FISHERIES COMMISSION FY2018 REQUEST FOR PROPOSALS (RFP)
") GULF STATES MARINE FISHERIES COMMISSION FY2018 REQUEST FOR PROPOSALS (RFP) The Gulf States Marine Fisheries Commission (Commission) is requesting proposals to address the technical and regulatory opportunities
GULF STATES MARINE FISHERIES COMMISSION FY2018 REQUEST FOR PROPOSALS (RFP) The Gulf States Marine Fisheries Commission (Commission) is requesting proposals to address the technical and regulatory opportunities
Executing our Maritime Strategy
 25 October 2007 CNO Guidance for 2007-2008 Executing our Maritime Strategy The purpose of this CNO Guidance (CNOG) is to provide each of you my vision, intentions, and expectations for implementing our
***************************************************************** TQL
 ---------------------------------TQL----------------------------- DEPARTMENT OF THE NAVY VISION, GUIDING PRINCIPLES, AND STRATEGIC GOALS AND STRATEGIC PLAN FOR TOTAL QUALITY LEADERSHIP Published for the
vessel prepares for and actively off-loads two new Post-Panamax gantry cranes to the
 This document is scheduled to be published in the Federal Register on 02/16/2018 and available online at https://federalregister.gov/d/2018-03267, and on FDsys.gov 9110-04-P DEPARTMENT OF HOMELAND SECURITY
Department of Defense DIRECTIVE
 Department of Defense DIRECTIVE NUMBER 4715.1 February 24, 1996 USD(A&T) SUBJECT: Environmental Security References: (a) DoD Directive 5100.50, "Protection and Enhancement of Environmental Quality," May
STATEMENT OF ROGER D. WALDRON PRESIDENT OF THE COALITION FOR GOVERNMENT PROCUREMENT BEFORE THE
 STATEMENT OF ROGER D. WALDRON PRESIDENT OF THE COALITION FOR GOVERNMENT PROCUREMENT BEFORE THE SECTION 809 ADVISORY PANEL ON STREAMLINING AND CODIFYING ACQUISITION REGULATIONS SEPTEMBER 28, 2017 1 Multiple