Integrated Performance Report, December Trust Board, 30 January 2014
|
|
|
- Branden Harrison
- 5 years ago
- Views:
Transcription


1 Page 1 Integrated Performance Report, December 2013 Trust Board, 30 January 2014
2 Page 2 Contents Section Page 1 Performance synopsis 3 2 Integrated Performance dashboards 4 3 Regulatory requirements 9 4 Executive Summary 10 5 Quality performance 15 6 Finance performance 36 7 Operational performance 49 8 Workforce performance 58
3 Page 3 1. Performance synopsis December 2013 Month 8 activity showed elective activity to be 13.7% above plan; non-elective activity broadly in line with plan (+1.0%); A&E activity 8.5% above plan (but year to date in line with plan); outpatient activity was similarly above plan at 9.3% (or 7.1% year to date). This activity has reflected favourably in the Trusts income position, however the additional workload and resulting increase bed occupancy may have impacted on some of the quality metrics as described below. Trust quality indicators highlight: - 7 cases of hospital acquired C.Difficile against a trajectory of 2 - Friends and Family results showed a decline in net promoter score Overall, operational performance standards improved in December. The Trust reported fail of A&E four-hour wait time (87.5%) but an overall improvement (5.7%) for Q3 compared with the same period last year. Referral to treatment Trust aggregate performance was achieved with some specialty fails. Admitted backlog deteriorated, however number of patients waiting >35 weeks continues to improve (13 as at ). All Cancer standards were achieved in December; there were fails of 2-week wait (92.7% against 93%) and 31-day subsequent surgery (92.1% against 94%) for Q3. At month 9 the Trust is reporting a 6.1m deficit on its income and expenditure against a planned position of 3.6m deficit ( 2.5m adverse variance). The variance is partly due to CIP delivery of 6.1m against 13m plan, which includes 4.4m under delivery of workforce savings. This is partly mitigated by over performance of service contract 8.3m. The Trust noted a number of improvements in workforce metrics including; decrease in workforce expenditure and use of temporary staff; 91.4% compliance with essential skills training and 95% information governance; 59.5% of all front line staff have received flu vaccine; and PHT scored 94.6% in the Nice Health and Well-being Audit compared with 67.2% nationally.
4 Page 4 2. Integrated performance dashboards service delivery National & Contractual Targets A&E Patient Impact A&E Timeliness RTT 95% <5% <= 5% <4hrs <15 mins <60 mins Improve % 95% 92% 23 wks 18.3 wks 28 wks Incomplete Patients waiting > 52 wks 0 Diagnostics Diagnostic waits: 6 weeks 99% Cancer Stroke Care NSF Coronary Heart Disease Flow 4 hr arrival to admission/transfer/discharge Unplanned re-attendance rate <7days Left without being seen Total time in A&E (95th percentile) Arrival to Assessment (95th percentile) Median time arrival to treatment Single longest wait arrival to treatment Ambulance delays > 30 mins (SCAS data***) Ambulance delays > 60 mins (SCAS data***) % Admitted % Non-Admitted % Incomplete Pathways < 18 wks 95th percentile for Admitted 95th percentile for Non-Admitted 95th percentile for Incomplete Admitted backlog target 18-week non-admitted backlog Incomplete Patients waiting > 35 wks All 2-week wait referrals Breast symptomatic 2-week wait referrals 31-day diagnosis to treatment 31-day subsequent cancers to treatment 31-day subsequent anti-cancer drugs 31-day subsequent radiotherapy 62-day referral to treatment 62-day screening to treatment 62-day consultant upgrade to treatment 90% of stay on a stroke unit Admission directly to a stroke unit High risk TIA seen and treated: 24-hours Urgent CT within 60 minutes of arrival PPCI within 120 mins of call** PPCI within 90 mins of arrival PPCI within 60 mins of arrival Rapid Access Chest pain clinic: 2 wks Emergency readmissions: 30 days* Cancelled operations: 28-day guarantee Target 0 93% 93% 96% 94% 98% 94% 85% 90% 86% 80% 90% 60% 50% 75% 80% 50% 98% Urgent Operations cancelled for a 2nd time 0 7% 5% 2012/ /14 D J F M A M J J A S O N D TREND F Notes: * 6 weeks in arrears. ** Target changed to 120 mins from April '12

5 Page 5 Integrated performance dashboards quality


6 Page 6 Integrated performance dashboards quality cont.
 Income & Expenditure (forecast OT) Capital Expenditure Cash Balance Savings Delivered (year to date cumulative) Savings Delivered (in month) EBITDA Achieved % EBITDA Margin % Net Return")
7 Page 7 Integrated performance dashboards finance Headline Financial Performance Financial Risk Rating Metrics Finance Dashboard Income & Expenditure (year to date cumulative) Income & Expenditure (in-month) Income & Expenditure (forecast OT) Capital Expenditure Cash Balance Savings Delivered (year to date cumulative) Savings Delivered (in month) EBITDA Achieved % EBITDA Margin % Net Return After Financing % I&E Surplus Margin % Trust Plan Trust Plan Trust Plan >75% Plan Trust Plan Trust Plan Trust Plan 2013/14 A M J J A S O N D TREND 10% Weight % Weight % Weight % weight Liquid Ratio Days 25% Weight Weighted Average Overall Rating Target Single Operating Model (Self Certification) Unplanned decrease in EBITDA Margin Self Certification that FRR may be less than 3 Debtors > 90 days > 5% of total debtors Creditors > 90 days > 5% of total creditors 2 or more changes of Finance Director in 12 months Interim Finance Director in place for >1 qtr end Cash Balance < 10 operating expenditure Capital Expenditure <75% of plan From November 2013 the Financial Risk Rating Metrics are measured where relevant V Trust budget plan. Prior to November 2013 the Financial Risk Rating Metrics were measured where relevant V TDA plan.
8 Page 8 Integrated performance dashboards workforce Workforce Capacity Workforce Expenditure Staff Development Pulse Survey Workforce Workforce Establishment Actual Substantive Workforce Substantive Workforce against Establishment Actual Total Workforce Total Workforce against Establishment Temporary Workforce Rate (%FTE) Staff Turnover Short Term Sickness Absence Long Term Sickness Absence Total Sickness Absence In Month Sickness Absence Equality & Diversity Total Budgetted Workforce Expenditure Total Workforce Expenditure Variance to Budgetted Expenditure Temporary Workforce Expenditure excluding Overtime & Excess Hours Overtime Excess Hours Temporary Workforce Expenditure (% of Total Workforce Expenditure) Appraisal Completion Essential Skills Compliance Pulse Survey - Satisfaction Rating Number of returns Target 95.0% 95.0% 3.0% 12.0% 1.0% 2.0% 3.0% 3.0% 4.4% % 85.0% 85.0% 65.0% 2012/ /14 M A M J J A S O N D TREND ,678,367 19,482,152 21,633,233 21,752,025 20,290,208 20,651,377 20,553,703 20,576,528 20,771,261 20,415,738 20,703,906 20,855,240 21,211,500 21,049,079 21,072,447 20,888,078 21,153,952 21,345,720 21,106,993 21,016,454 1,846,641 1,246,091 1,730,032 1,490,306 1,660,089 1,525,031 1,528,477 1,644,393 1,439,529 1,376,974 45,912 63,575 63,639 57,735 79,106 62,413 58,999 53,017 59,736 54,732 32,163 48,393 38,751 24,461 27,813 31,232 25,481 32,627 33,678 35,
 is")
9 Page 9 3. Shadow Monitor governance risk rating and CQC compliance Shadow Monitor governance risk rating Month 9 performance (as it would apply for foundation trusts against Monitor s Compliance Framework) is weighted 2 : Amber-green for the service performance rating as 2 indicators were not achieved, these were; A&E 4 hr and C difficle. The performance is measured quarterly and for quarter 3 performance is weighted >4 Red due to failure to achieve RTT admitted, A&E 4 hr, cancer 31 day subsequent treatments, cancer 2 wk waits and C Difficile. The governance red rating override also applies as the trust has failed to meet the A&E target twice in any two quarters over the previous twelve month period giving a Governance rating of >=4 Red. This would represent significant concerns against authorisation; the Trust would be required to demonstrate to Monitor during the assessment process that the underlying issues resulting in the persistent breach of this target had been addressed on a sustainable basis. An exception report has been included in relation to the failure of the above metrics with C difficile covered in the quality section of this report. Notes: 1. Monitor requires NHS FTs to report performance quarterly. 2. Performance reported to Monitor relates to the quarter/quarter end, except for: o Non-compliance with CQC essential standards (immediate); Compliance with CQC essential standards A full quarter 2 assessment of compliance with the CQC outcomes has been undertaken across the Trust, registered with the CQC to provide services. Trust is declaring full compliance with all CQC outcomes, except for Medicine CSC who are declaring non-compliance with a minor impact on patients for outcomes 4 (care and welfare of people who use services) and 13 (staffing). Actions are being taken to address the concerns. As part of the changes to the way the CQC intend to inspect regulate and monitor services the CQC have changed their monitoring process for Trusts replacing the Quality and Risk Profile (QRP) with intelligent monitoring. The Trust received its first intelligent monitoring report in October The new system places trust s in bands, with band 1 being the highest risk and band 6 being the lowest risk. The Trust was placed in band 4. The CQC aim to publish this information quarterly.
10 Page Executive summary Performance Theme Quality Key exceptions to note: HCAI: 7 cases of hospital acquired C.Difficile were recorded in December against a monthly trajectory of 2. The cases were within Medicine (x5) and MOPRS (x2). Cases in both CSCs reflect increased acuity and bed occupancy which are having a direct effect on the ability to isolate patients in a timely manner and a negative effect on the standard of cleaning and disinfection in clinical areas. An increase in the number of dirty beds, dirty equipment/mattresses incidents as recorded on Datix may also be a contributory factor. The year-to-date position is 27 against a trajectory of 21 (annual target of 30). Friends and Family: Friends and Family Test results remain a concern with a further decline in the net promoter score in December. Benchmarking data from NHS England is not available as yet, however the likelihood is the Trust will benchmark in the bottom quarter of all providers. Positively the emergency department net promoter score remains in the upper performance levels. The inpatient feedback from patients picks up themes related to the operational pressures facing the organisation at present. The Trust maintains local actions to address issues raised and is reviewing resources to support CSC s going forward in the communication with patients around the Friends and Family Test. The Trust is achieving the overall response rate required for the CQUIN. Dementia: The Trust has achieved all 3 steps for three consecutive months and has therefore achieved the CQUIN requirements. December has seen a decline in compliance and therefore there is re-focus to improve compliance and sustainability. Pressure Ulcers: An internal reduction target of 10% on grade 3 and 4 pressure ulcers with a target of 25 has been set for 2013/14.. A total of 2 grade 3 and 4 avoidable pressure ulcers were reported in December; this compares to 4 in November. 2 unavoidable grade 3 and 4 pressure ulcers were reported in December, this compares to 0 (zero) in November. The year to date total of avoidable grade 3 and 4 pressure ulcers is currently 23 against a trajectory of 19, with a year end target of 25. Falls: There have been 4 amber falls incidents reported in December; 1 over trajectory. However, the Trust year to date position is 24 reported events against a year end target of 34, currently 1 event under trajectory.
11 Page 11 Executive summary Performance Theme Finance Section overview (1 of 2) This Section covers the Trust s financial performance as at the end of December (Month 9 of the 2013/14 financial year). It measures the financial position against a planned year-end income and expenditure deficit of 5m, as formally submitted to the Trust Development Authority (TDA). The expectation of the TDA is that the Trust will deliver a year-end deficit of no worse than this formally submitted plan. Actions to ensure that the Trust achieves it s year end forecast 5m deficit are as follows: The Trust has implemented a Recovery Plan with financial work-streams which include: Eliminating wasted capacity across areas such as theatre utilisation and diagnostics. Medical workforce across areas such as consultant work planning. Nursing workforce across areas such as rostering, non-patient facing efficiencies and allowances. Capacity across areas such as length of stay (LoS) aimed at improving the efficiency and reducing the number of beds. The impact of these have been built into the Trusts year-end forecast, after taking account of risk. Further actions: Work has continued with local commissioners to agree the differences in our year-end forecast contract assumptions and bring these to a resolution and this is expected to conclude shortly. We continue to seek to mitigate identified financial risks and to realise opportunities. Model recurrent impact of actions taken on the underlying financial position and finalise the plan for 2014/15.
12 Page 12 Executive summary Performance Theme Finance Key financial headlines at the end of December (Month 9) (Continued) The Trust has recorded a year-to-date 2.5m adverse variance against plan, a deterioration of 0.1m to the position in the month. The year-to-date income position is 6.8m favourable against plan which is a 1.4m improvement in the month. This is after taking into account the additional elective activity required to meet the Elective RTT target which is within the Trust s income plan, but currently outside of the signed SLA with commissioners. PbR income is 5.5m favourable against plan, an improvement of 1.1m in month. The year-to-date pay position is 3.6m adverse of plan, which is a 0.6m adverse movement in the month. This year-to-date position includes a 4.4m under delivery of CIPs allocated to pay budgets, over-spends on senior medical staff of 1.1m, on junior medical staffing of 1.2m, and nursing 0.3m, offset by underspends on senior management, ancillary & scientific staff and releases from reserves to support activity growth & incremental pay costs. The year-to-date non-pay position is 5.8m adverse, which is a 0.9m deterioration in the month. This includes 3.4m under delivery of CIP allocated to non pay budgets year-to-date and 3.7m adverse variance on clinical supplies, offset by favourable position on depreciation and a release of reserves. At the end of December the Trust delivered 6.1m of CIPs against a plan of 13.0m, a shortfall of 6.9m. This adverse position includes 4.3m relating to unidentified savings and 2.6m relating to under delivery of agreed CIP plans. The Trust has spent 9.3m of a 11.3m capital programme year to date and is within its Capital Resource Limit (CRL). The total plan this year of 17.0m capital expenditure includes a 4.1m charge in relation component accounting on the PFI and 2.2m associated with the Finance Lease for new Da Vinci robot. The Trust s cash position at the end of December was 3.6m, 6.0m behind plan. This reflects the cash impact of the year-to-date income and expenditure deficit and outstanding Commissioner invoices. A short term loan application has been secured in January 2014.
13 Page 13 Executive summary Performance Theme Workforce Workforce expenditure decreased in month by 91k to 21.0m. Temporary workforce usage decreased by 0.8% to 5.8% in December. Appraisal Compliance is just below target at 84.3% in December, an increase of 1.1% from 83.2% and above target in 6 CSCs. All CSCs are compliant with Total Essential Skills Compliance rates and the Trust is currently 91.4%. Information Governance Essential Skills Training remains compliant in December at 95%. Staff Turnover increased to 9.7% in December. In-month sickness absence rate remained at 3.6% in November and 12 month rolling average remained at 3.4%. 59.5% of all front line staff have received the flu vaccine, compared with 46.4% at the end of last years campaign. PHT Scored 94.6% in the NICE Health and Wellbeing Audit, Implementing NICE Public Health Guidance for the Workplace compared to 67.2% nationally. Contract requirements Contract reports are for 1 month in arrears, due to the data timelines involved. This report therefore reflects Month 8 contract performance Final agreement on some adjustment items is still to be achieved as part of 13/14 year-end forecasting. The forecast figure for such items has been adjusted to reflect the level of formal challenge and discussion to date between Trust and CCG. The Trust intends using this data in current discussions over end-of-year forecasting. Having breached various treatment times targets at Trust and specialty level at points throughout the year, the Trust has received formal Contract Query Notices and been asked to develop Remedial Action Plans in regard to both failing Cancer access times and 18-week access times. It is likely that the Trust will receive further Remedial requests for A&E waiting times this week. A&E ambulance handover times have been validated by the Trust, and the results show that fines are due on a fraction of the unvalidated SCAS data. The local CQUIN scheme has reached draft agreement. (total income 6m). A M8 CQUIN detail report is attached in this IPR. The DoF is currently negotiating with Commissioners to de-risk many of the above potential financial risks as the year-end draws closer. The negotiation process for 14/15 has started.
14 Page 14 Executive summary Performance Theme Operational Performance A&E performance deteriorated in December, 87.5% but for Q3 the Trust is reporting 92.85% which is an overall improvement of 5.7% on the same period last year. The Trust achieved Trust aggregate performance for RTT (with subspecialty fails), admitted backlog deteriorated however, the number of patients waiting >35 weeks has continued to improve (20 patients). All Cancer standards were achieved. Diagnostic wait times deteriorated at 98.% against 99% standard. PCI Door to Balloon standards were achieved, however Call to Balloon (pre hospital) was not achieved, 55.6% against target of 75%. The Trust achieved all Stroke performance standards other than Direct admission 88.7% against 90% standard. There were 9 breaches, all of which were due to clinical presentation.
15 24 January 2014 Page Quality performance national targets Healthcare Associated Infections (HCAIs) Incidence of MRSA bacteraemia more than 48 hours after admission Target: 0 (zero) A total of 0 (zero) avoidable MRSA bacteraemia cases were recorded in December. The year-to-date position is 0 (zero) cases against a target of 0 (zero) avoidable cases. Single Sex Accommodation Target: 0 There were no non-clinically justified Single Sex Accommodation breaches in December. Healthcare Associated Infections (HCAIs) Incidence of C.Difficile more than 72 hours from admission Target: 30 7 cases of hospital acquired C.Difficile were recorded in December against a monthly trajectory of 2. The cases were within Medicine (x5) and MOPRS (x2). Cases in both CSCs reflect increased acuity and bed occupancy which are having a direct effect on the ability to isolate patients in a timely manner and a negative effect on the standard of cleaning and disinfection in clinical areas. An increase in the number of dirty beds, dirty equipment/mattresses incidents as recorded on Datix may also be a contributory factor. The year-to-date position is 27 against a trajectory of 21 (annual target of 30).
16 24 January 2014 Page 16 CQUIN High Impact Innovations Innovation Health and Wealth, Accelerating Adoption and Diffusion in the NHS set out that from April 2013 compliance with high impact innovations would become a pre-qualification requirement for CQUIN. Electronic pre-operative assessment pilot (epoa) Target: Commence an electronic pre-operative assessment pilot for the Head and Neck speciality and if fit for purpose roll-out to other specialities. The pilot was suspended on the 31 st December due to software concerns. Trisoft have replicated the error and are investigating. Anticipation re-commencement of pilot by end of January There is no concern regarding delivery of the CQUIN plan as this was dependant upon the success of the pilot and whether the system is fitfor-purpose for further roll-out. On plan to achieve Patient self check-in Target: Introduce a patient self check-in service. Trust-wide patient feedback continues with full feedback due at the end of January. Benchmark on the provision of multi-use language shows English is predominantly the main choice of language followed by Polish for outpatient check-in. Trust wide-roll out according to plan. All departments, with the exception of Rheumatology (a date has yet to be confirmed) are now live. Final testing of patient letters and barcodes to ensure robustness of system is now complete with barcodes working. The improvements identified from staff/patient feedback to improve the look and feel of the system and to enhance the kiosk visuals have now been tested and the system has been updated. Quarter 4 post-implementation milestones to ensure sustained benefit are now underway, with final patient feedback and user testing for interface to PAS due to be completed by the end of January On plan to achieve 3 million lives Increase the use of telehealth / telecare technologies Cardiac telemetry (Pacemaker follow-up) Target: Extend the scope of the current cardiac telemetry applications to incorporate routine pacemaker patients. All tasks identified within the operational plan are progressing as planned. Proposal 1: Extend remote monitoring to include AF devices that are compatible: Completed. Of 109 patients 94 are now using remote monitoring. The remaining 15 have unresolvable issues e.g. inability to use the remote equipment. All patients in future will automatically receive remote monitoring: Completed Proposal 2: Extend remote follow up to aging pacemakers that are compatible: As patients arrive for their 3 monthly face to face visit they are being offered remote follow up to reduce visits until their pacemaker is changed: Completed Proposal 3: Introduce loan scheme to newly implanted devices that require increased follow up: Completed Proposal 4: Planning will begin in January For completion March On plan to achieve
17 24 January 2014 Page 17 CQUIN High Impact Innovations Innovation Health and Wealth, Accelerating Adoption and Diffusion in the NHS set out that from April 2013 compliance with high impact innovations would become a pre-qualification requirement for CQUIN. Intra-operative fluid management (IOFM) To deliver individualised goal directed fluid therapy IOFM usage Target: Full baseline assessment followed by maintenance of uptake above 80%, or reaching 80% averaged across all included procedures in quarter 4. The December percentage of cases where IOFM has been used against the relevant OPCS codes is 75.86%, which is an increase on the 55.81% reported in November. There are still some issues with data entry which continue to be addressed and training continues. Currently Theatreman is configured to allow 'blank' data (as can be seen in the table below); the change by Trisoft continues to be awaited to prevent missing data columns. An issue regarding CEPOD is also being addressed. December (full month) 01/11/13 to 30/11/13 On plan to achieve Total Number of Cases Eligible According To OPCS Codes Total Number Stated as Eligible Total Number stated as Not Eligible Total Number Blank IOFM Used Yes No Blank % of Cases IOFM Used Against OPCS Codes Total Number of Cases Required to Meet Target Total Number of Additional Cases Required to Meet Target Elective Emergency (CEPOD/Trauma) 0 0 Digital appointment reminders Target: Roll-out of a digital appointment reminder system across diagnostics. The Trust agreed a 15% DNA reduction in imaging with the Commissioners in Quarter 1. Implementation of the new imaging system created unforeseen delays in implementing the digital reminder module. The Trust is committed to reducing DNA rates within this specialty and it was agreed with Commissioners that a revised plan be submitted for agreement. A revised plan has been submitted and agreed with the Commissioners. On plan to achieve (revised plan)
18 January 2014 Page 18 CQUIN Venous Thrombo-embolism (VTE) risk assessment Target: 95% average per quarter The VTE risk assessment figure for December is 95.1% (subject to confirmation). This is a slight decrease on Novembers final figure of 95.5%. The year to date VTE risk assessment compliance figure is 95.5%, with a quarterly figure of 95.6%. VTE Root Cause Analysis Target: 100% unless an agreed exception The Trust is required to perform RCA s for all hospital associated VTE s. There has been 100% compliance for RCA s for the last year, this process is to continue, therefore the quarterly CQUIN requirement has been achieved. This is monitored weekly at the VTE panel and monthly at VTE review group.

, food and tea/coffee, staffing levels, waiting for")

19 24 January 2014 Page 19 CQUIN Friends and Family Test (FFT) Target: 15% overall response rate rising to 20% in quarter 4. Results are now published on NHS Choices. Response themes: Positive themes from Inpatient areas: Care, helpful friendly staff, professional, good staff, communication/information, privacy and dignity, safe, cleanliness and food. Negative themes from Inpatient areas: Communication/ information (particularly related to discharge), food and tea/coffee, staffing levels, waiting for care/communication/medications, noise at night, cleanliness, pain relief and delays in receiving medications, bed moves, privacy, staff helpfulness, delays in responding to buzzers and heat in wards. Positive themes from emergency department areas: Good friendly/helpful/polite staff, fast service, communication, care and compassion. Negative themes from emergency department areas: wait to be seen, communication, space, environmental heat, space and car parking charges.

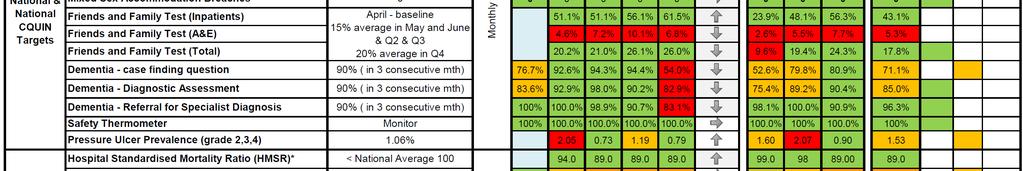
20 24 January 2014 Page 20 CQUIN Friends and Family Test Net promoter score The Friends and Family Test net promoter score is based on the current national methodology: likely responses are not counted. extremely likely responses are counted as positive. neither likely, unlikely or extremely unlikely responses are added together to create a total of not recommend responses. The total percentage of not recommended responses are subtracted from the total extremely likely responses to get the net promoter score. FFT for December has seen a further decline in the net promoter score. Benchmarking data from NHS England is not available as yet, however the likelihood is the Trust will benchmark in the bottom quarter of all providers. Positively the emergency department net promoter score remains in the upper performance levels. The inpatient feedback from patients picks up themes related to the operational pressures facing the organisation at present. The Trust maintains local actions to address issues raised and is reviewing resources to support CSC s going forward in the communication with patients around the Friends and Family Test.
21 24 January 2014 Page 21 CQUIN Friends and Family Test - Maternity Target: From October 2103 the Friends and Family test to be rolled-out within Maternity. The Trust is required to report on the position at the end of October 2013 and April Women are asked to complete a Friends and Family form at four points of contact and respond to four specific questions. Although there are no performance measures or targets around the response rates for Maternity the table shows the response rate for each of the four questions for December: Maternity Friends and Family response rates Question Dec Antenatal care (community based care up to 36 weeks) 8.3% 2. Intrapartum labour care 43.2% 3. Immediate postnatal care 33.3% 4. Postnatal care up to discharge to Health Visitors 11.1% Total response rate 23.97% (responses / eligible mothers) (482 / 2015) The response rate for questions 1 and 4 are low. This is due to the named midwife who has provided care in pregnancy and during the postnatal period not being able to ask the question directly. An app is currently being reviewed with the aim to enable this to happen more effectively. Friends and Family Test Maternity Response themes: The vast majority of responses are positive and the maternity team are monitoring trends in responses to take the appropriate action. Comments outlined below: Positive comments: include great care throughout, lovely midwives, friendly staff, staff are organised attentive and communicate well. Negative comments: There is a trend in women responding negatively to some inpatient/outpatient areas. Key areas of negative feedback relate to the waiting times in outpatient area. There is also a negative response within the inpatient/postnatal areas as women s perception is that staff can be very rushed and busy. This could reflect the operational pressures and staffing pressures in December on the quality of care provided on B7 (postnatal ward area) The actions being taken in response to negative comments include: The Plexus booking in system has been introduced as a tool for updating women about waiting times and staff are proactively engaging with women to ensure they are informed about waiting times and reasons why appointments may be delayed. The lead midwife on the postnatal ward is proactively implementing new ways of working with a trial of end of bed handovers being seen as a way to improve communication with women and make them feel more involved in their care The actions in place should result in improvements in January/February with changes in management of demand and recruitment of staff.
22 24 January 2014 Page 22 CQUIN Dementia Target: Average of 90% or greater in each of the elements each month for 3 consecutive months. These do not need to be the same 3 month period for each of the elements Compliance already achieved with all 3 steps and therefore the CQUIN requirements have been met. December compliance has seen a significant deterioration. Compliance was particularly affected over the Christmas and New Year period which has affected the overall monthly percentage. It is not possible to recover the position on step 1, however, work is currently underway to try to improve compliance with steps 2 and 3. There is renewed focus to achieve compliance and sustainability. Dementia CQUIN compliance Element October 2013 (validated) November 2013 December 2013 Step 1: Case Finding 94.3% 94.4% 54% Step 2: Assessment 98% 90.2% 82.9% Step 3: Onward referral 98.9% 90.7% 83.1% Safety Thermometer Target: 35% reduction in prevalence of grade 2, 3 and 4 new pressure ulcers based on median of 1.06% The Trust achieved 100% data collection for December s Safety Thermometer. The Trust had a prevalence of 0.79% for new pressures ulcers in December which is a decrease on 1.19% in November. This decrease was due to continued work with the tissue viability team and validation of figures. The Safety Thermometer data continues to require monthly validation by the Tissue Viability Specialist Nurse to ensure accuracy of reporting.
23 24 January 2014 Page 23 Local Specialised CQUINs Local specialised CQUINs are used as an incentive to ensure providers of specialised services offer continuous improvement in line with best practice, benchmarked utilisation, appropriate care and quality indicators. NICU TPN Target: Timely administration of total parenteral nutrition in preterm (< gestation and/or <1500 g birth weight) infants (TPN) - by day 2 of life (with some exclusion criteria) Trust to supply baseline data as supporting evidence that 95% of qualifying infants are receiving TPN by day 2. As with Quarter 1 and Quarter 2 the Trust continues to achieve this CQUIN and provide evidence of 100% of infants receiving TPN by day 2 of life. On plan to achieve NICU Complex Discharge Target: To identify babies with a gestational age of under 34+0 wks. who may be suitable for early discharge with the support of an outreach service to allow this to happen. (20% discharge or target to meet or reasons given and special bed days data to be supplied) Quarter 3 is on track to comfortably achieve the required percentages of discharge of this group of babies. All queries from specialist commissioners have now been resolved relating to this CQUIN. On plan to achieve IVIg Database Panel Target: To populate the National IVIg database with the appropriate South Central patient details to demonstrate IVIg is use is clinically and costeffective, and consistent with National Guidance. The Trust submitted the populated database for Quarter 1 and Quarter 2 with 100% of the appropriate patients within the deadline. The Trust confirmed to specialist commissioners that all the relevant columns on the database were populated. Clinician attendance at IVIg panel remains under discussion, however specialist commissioners have stated that attendance can be via dial-in. On plan to achieve
24 24 January 2014 Page 24 Local Specialised CQUINs Local specialised CQUINs are used as an incentive to ensure providers of specialised services offer continuous improvement in line with best practice, benchmarked utilisation, appropriate care and quality indicators. Renal Transplant Cold Ischaemic Time (reported six monthly) Target: To reduce cold ischaemic time for kidney transplant patients, <12 hrs. for DCD and <18 hrs. for DBD patients and submit supporting data. Data captured and provided as requested for Quarter 1. Target of 90% of transplants for the first intended recipient 100% achieved. Exceptions will be recorded as required in the CQUIN for Quarter 3 appropriate supporting information will be submitted to Commissioners however there are not anticipated issues. On plan to achieve Renal Dialysis Target: Increase the use of Renal Patient View (RPV) by all dialysis patients and provide evidence of such Q2 submission was re-submitted following queries from the commissioners and all queries from commissioners have now been resolved. The working group continue to work towards improving numbers of RRT patients accessing RPV via key members of staff working in outpatients and out at peripheral sites talking directly to patients and giving demonstrations of how to use the system. On plan to achieve Clinical dashboards Target: To embed the routine use of specialised services quality dashboards. Populate them and feedback how finalised dashboard information is used within the Trust (Cardiology, Renal, IVIg, NICU and Radiotherapy). There are no anticipated problems with submitting Quarter 3 clinical dashboards. Information will be automated for IVIg and Renal. Quarter 3 submission will include information on how the Trust/departments have used the information produced in the Quarter 2 final dashboards. On plan to achieve

25 24 January 2014 Page 25 Trust and Quality Contract targets Hospital Standardised Mortality Ratio (HSMR) Target: On or below National Average of 100 The Trust HSMR for the first seven months of 2013/14 financial year is 89 using the 2012/13 model, and 98 using the rebased figure for 2013/14 national activity. The monthly figure has fallen for the last 5 months. Palliative care coding is still significantly below the national average which is artificially raising the HSMR in specialties outside MOPRS. Summary Hospital-level Mortality Indicator (SHMI) Target: On or below National Average of 100 There has been no new data published since October. For the 12 months to March 2013, the Trust SHMI was and is classified as as expected. Pneumonia is the only group showing a high relative risk for in-hospital mortality (SHMI IH deaths column). A mortality review of weekend deaths found no clearly avoidable pneumonia deaths. A further audit of pneumonia deaths in January 2014 is planned due to the peak in excess deaths (difference between number of observed and expected deaths). Collection SHMI SHMI (all SHMI (IH Obs Exp Obs Exp Spells deaths) deaths) (12) Cancer of liver and bile duct (18) Cancer of breast (73) Pneumonia (94) Other liver diseases (98) Other gastrointestinal disorders (113) Other connective tissue disease (138) Abdominal pain Relative risk here allows a comparison with the risk adjusted average mortality in NHS England hospitals. It s the ratio of the number of observed deaths to the number of expected deaths expressed as a percentage, where the number of expected deaths is derived from national data. RR of 100 = as expected mortality i.e. same as national average RR of more than 100 = greater than expected mortality. RR of less than 100 = less than expected mortality If the RR is significantly above 100 (using statistical 95% confidence intervals) then the number will turn RED
26 24 January 2014 Page 26 Trust and Quality Contract targets Serious Incidents Requiring Investigation (SIRIs) (including HCAIs and as reported on STEIS) For monitoring A total of 5 SIRIs were reported in December (included 2 unavoidable pressure ulcers).compared to 7 in November. No Never Events reported in December. SIRI CSC 1 x Failure to act on test results MSK 1 x Unavoidable grade 3 plaster pressure ulcer MSK 1 x Unavoidable grade 3 plaster pressure ulcer MSK 1 x Grade 3 pressure ulcer Medicine 1 x Grade 3 pressure ulcer MOPRS SIRIs over 45 day deadline 2 SIRIs due to be submitted in December exceeded their 45/60 day target date. 3 other SIRIs remains overdue however, they have agreed extensions. The delay is due to the complexity of the cases.

27 January 2014 Page 27 Trust and Quality Contract targets Pressure Ulcer SIRIs Target: 25-10% reduction on avoidable grade 3 and 4 pressure ulcers A total of 2 grade 3 and 4 avoidable pressure ulcers were reported in December, compared to 4 in November. 2 unavoidable grade 3 and 4 pressure ulcers were reported in December, this compares to zero in November. An internal reduction target of 25 avoidable grade 3 and 4 avoidable pressure ulcers has been set for 2013/14. Based on the 2012/13 outturn of 27, this will represent a 10% reduction. To date there have been 23 avoidable pressure ulcers against a trajectory of 19. Pressure Ulcers grade 1 and 2 Reporting only A total of 52 grade 1 and 2 pressure ulcers were reported in November, giving a total of 56 pressure ulcers across all grades. This compares to 41 grade 1 and 2 reported in November; please note 37 grade 1 and 2 pressure ulcers were previously reported for November, however there have been an additional 4 grade 1 and 2 pressure ulcers reported since the report was produced.
28 24 January 2014 Page 28 Trust and Quality Contract targets VTE SIRIs and Incidents This is a new reporting requirement agreed with the Commissioners. There have been no reported VTE SIRIs in December resulting in a patient death or major harm. 81 VTE incidents were reported in December compared to 73 in October. Of these, 30 were hospital associated events (HAT), compared to 29 in November and 51 were community associated events (CAT). Coroners recommendations (Rule 43) For monitoring and responding to Coroner within 56 days of receipt of letter No Rule 43 letters have been received in December. Duty of Candour The Trust is required to inform the patient and/or other relevant person within 10 operational days that the safety incident (SIRI) has occurred or is suspected to have occurred. Failure to report could lead to a financial penalty of either recovery of the cost of the episode of care or 10,000 if the cost of the episode of care is unknown. All patients involved in the SIRIs that occurred in December were informed of the incident within the 10 operational day deadline and are aware of the on-going investigation. The delay in notification for the VTE death, as reported in November, has been discussed with the Commissioners and agreed as an exception. CAS Alerts over deadline 16 alerts issued in December of which 2 were applicable to the Trust. 3 alerts are still being assessed by Carillion. 2 alerts remain open of which 1 is now overdue. The overdue alert relates to placement devices for nasogastric tube insertion (NHS/PSA/W/2013/001). An automated system is in place sending weekly reminders of outstanding alerts to the Governance leads.


29 24 January 2014 Page 29 Patient Safety Incidents Patient safety incidents At the time of reporting, the top three reported incidents for December were: Slips, trips and falls. Pressure sores. Implementation of care or on-going monitoring - other. This compares with Slips trips and falls, Administration or supply of a medicine from a clinical area and Pressure Sore/decubitus ulcer in November. This varies from that reported previously due to the receipt and confirmation of additional incidents. Month Incidents Adjusted to include receipt of late reports Previously reported December 396 November October

30 24 January 2014 Page 30 Patient Safety Incidents - Severity Incident severity is coded by the reviewing manager at investigation, therefore it must be noted that December data is not yet complete due to reporting timeframes. This is always updated for each subsequent Board report. This should be considered when interpreting data. A specific task and finish group continues to address any system and process issues. This graph represents the total number of patient safety incidents reported by Trust staff (some will be relating to care pre hospital community incidents.
31 January 2014 Page 31 Patient Safety Incidents Falls and Medication Falls Target: 34, 10% reduction in falls resulting in moderate/severe harm or death There are currently 4 amber events reported in December; 1 over trajectory. The Trust was within the target of 8 events in quarter 3. The year to date position is 24 reported events against a year end target of 34, currently 1 event under trajectory. Medication Errors Monitor/no increase based on 2012/13 outturn of medication incidents which result in moderate/severe harm or death of 13 (subject to validation). There has been one confirmed amber incident in December. There are five incidents currently under investigation or awaiting panel meetings to confirm grading. The investigations have been completed for the 6 events previously reported as being under investigation. There are no falls and safeguarding cases to report in December.


32 24 January 2014 Page 32 Complaints, PALS and Patient Satisfaction Complaints Monitor A total of 47 complaints were received in December compared to 61 in November. Complaints relating to nursing care has decreased by 5, when compared to November. Complaints relating to clinical treatment and admission, discharge and transfer have also significantly reduced. Complaints Received Variance year on year Variance month on month Month 2012/ /14 October November December Complaint theme November December Variance month on month All Aspects of Clinical Treatment Communication to Patients Admission, Discharge and Transfer Arrangements Attitude of Staff

33 24 January 2014 Page 33 Complaints, PALS and Patient Satisfaction Key Issues - National requirements Parliamentary Ombudsman The Trust is aware of 2 referrals to the Parliamentary Ombudsman in December Key Issues - National requirements Complaint Acknowledgement Rate 100% of complaints were acknowledged within the 3 day target in December PALS contacts There were 96 PALS contacts in December compared to 70 in November. There has been a reduction in PALS contacts in relation to Appt Delay/Canx (cancelled) OPD. There has been a significant increase in the number of PALS contacts relating to information and advice. Analysis of the data does not identify specific themes and these cover a variety of CSCs. Patient Satisfaction The satisfaction rating, based on the surveys currently being used through the Elephant system, for December is 86.82% from a total of 318 responses. This is a decrease on the 88.34% (from a total of 562 responses) seen in November. A reminder has been sent to all Heads of Nursing and survey leads that tablets are available to enable real-time data collection. There has been a delay in the installation of a kiosk in the main atrium; all issues have now been resolved and it is envisaged this will be available for all patients and carers to access shortly. The operational pressures across the Trust in December are likely to have effected the overall patient satisfaction score and the number of responses. This will be monitored for January and appropriate action taken.

34 January 2014 Page 34 Patient Moves Patient moves Monitor There has been a reduction in the number of patient moves across all three categories in December Overall there is no significant step change noted on the SPC chart.
35 24 January 2014 Page 35 Quality Indicators Safeguarding adults 73 Adult Safeguarding alerts were raised in December compared to 85 in November. The Trust raised 67 of these alerts, with only 6 being received from an external organisation. 2 of the externally raised alerts came via the CQC. 2 of the of the externally raised alerts were requests for information to support a safeguarding investigation in the community (this includes of 1 of the CQC alerts). In total 61 of the 73 related to care prior to admission and 12 to care provision within the Trust; a decrease by 1 internal care concerns compared to November. Of the 12 alerts relating to Trust provided care 1 was deemed not to be safeguarding, 1* bruising found on discharge and possible physical abuse, 1* allegation of omissions of care in particular treatment delays and hydration, 1* challenging grading of pressure ulcer on discharge and 1 concerning fitness to discharge / unexpected death at home. Additionally, there were 7 potential hospital related pressure ulcers. All alerts are being investigated appropriately and information shared with external Safeguarding partners as required. * externally raised alerts. Deprivation of Liberty Safeguards (DoLS) There were 3 applications for DoLS in December compared to 1 in November. There was also 1 application to extend an existing DoLS authorisation. There were no known instances of unauthorised deprivation of liberty. Safeguarding children 54 referrals to Children s Social Care (CSC) were received by the Safeguarding Children Team (SCT) in December compared with 73 in November: of these the Trust made 42: 25 were made by midwives, 13 by paediatrics/hospital staff and 4 from the Emergency Department. 3 Children and Young People forms (CYPs) were received from the Police (Police automatically forward these to Children s Social Care) in relation to Domestic abuse incidents involving women who are pregnant, the remaining 9 were from external health professionals including Children Social Care. All referrals, notifications received by the Safeguarding Children Team (SCT) are triaged and appropriate actions taken, including feedback to the referrer. No complaints. The SCT were notified of 3 adverse incidents, these were in relation to security (people trying to access the paediatric unit, tail gating). The SCT raised 23 Child Protection alerts (maternity). No allegations received. Serious Case Reviews (SCR): Hampshire s Safeguarding Children Board (HSCB) commissioned a SCR in July The Trust have submitted their response. November 2013; feedback is still awaited. The SCT were informed of an action from an IOW SCR undertaken in 2013 in relation to maternity. This has not been received by the Trust, previously however, is not dissimilar to an action from another SCR and is already being addressed. 1 unexpected child death in December of a child aged 5months (unascertained) this is being dealt with under Child Death Procedures.
36 Page Finance Section overview (1 of 2) This Section covers the Trust s financial performance as at the end of December (Month 9 of the 2013/14 financial year). It measures the financial position against a planned year-end income and expenditure deficit of 5m, as formally submitted to the Trust Development Authority (TDA). The expectation of the TDA is that the Trust will deliver a year-end deficit of no worse than this formally submitted plan. Actions to ensure that the Trust achieves it s year end forecast 5m deficit are as follows: The Trust has implemented a Recovery Plan with financial work-streams which include: Eliminating wasted capacity across areas such as theatre utilisation and diagnostics. Medical workforce across areas such as consultant work planning. Nursing workforce across areas such as rostering, non-patient facing efficiencies and allowances. Capacity across areas such as length of stay (LoS) aimed at improving the efficiency and reducing the number of beds. The impact of these have been built into the Trusts year-end forecast, after taking account of risk. Further actions: Work has continued with local commissioners to agree the differences in our year-end forecast contract assumptions and bring these to a resolution and this is expected to conclude shortly. We continue to seek to mitigate identified financial risks and to realise opportunities. Model recurrent impact of actions taken on the underlying financial position and finalise the plan for 2014/15.
37 Page 37 Finance Section overview (2 of 2) Key financial headlines at the end of December (Month 9) The Trust has recorded a year-to-date 2.5m adverse variance against plan, a deterioration of 0.1m to the position in the month. The year-to-date income position is 6.8m favourable against plan which is a 1.4m improvement in the month. This is after taking into account the additional elective activity required to meet the Elective RTT target which is within the Trust s income plan, but currently outside of the signed SLA with commissioners. PbR income is 5.5m favourable against plan, an improvement of 1.1m in month. The year-to-date pay position is 3.6m adverse of plan, which is a 0.6m adverse movement in the month. This year-to-date position includes a 4.4m under delivery of CIPs allocated to pay budgets, over-spends on senior medical staff of 1.1m, on junior medical staffing of 1.2m, and nursing 0.3m, offset by under-spends on senior management, ancillary & scientific staff and releases from reserves to support activity growth & incremental pay costs. The year-to-date non-pay position is 5.8m adverse, which is a 0.9m deterioration in the month. This includes 3.4m under delivery of CIP allocated to non pay budgets year-to-date and 3.7m adverse variance on clinical supplies, offset by favourable position on depreciation and a release of reserves. At the end of December the Trust delivered 6.1m of CIPs against a plan of 13.0m, a shortfall of 6.9m. This adverse position includes 4.3m relating to unidentified savings and 2.6m relating to under delivery of agreed CIP plans. The Trust has spent 9.3m of a 11.3m capital programme year to date and is within its Capital Resource Limit (CRL). The total plan this year of 17.0m capital expenditure includes a 4.1m charge in relation component accounting on the PFI and 2.2m associated with the Finance Lease for new Da Vinci robot. The Trust s cash position at the end of December was 3.6m, 6.0m behind plan. This reflects the cash impact of the year-to-date income and expenditure deficit and outstanding Commissioner invoices. A short term loan application has been secured in January 2014.

38 Page 38 Finance - Overview Income and Expenditure I&E position The month 9 financial report reflects a planned 5m year end deficit for This is the position that the Trust will be monitored against by the TDA. At month 9 the Trust is reporting a 6.1m deficit on its income and expenditure. This is against a planned position of 3.6m deficit ( 2.5m adverse variance). This variance to plan is primarily due to under delivery of planned or unidentified cost improvements (CIP s). CIP delivered at the end of month 9 is 6.1m against a 13m plan. The resulting adverse variance of 6.9m is in part mitigated by over performance against service contracts. The cumulative budget plan (green line, graph opposite) shows an increase to the planned deficit between February and March 2014, This is as a result of reserves currently held in month 12, whereas the original TDA plan phased reserves across all months. Budget k Actual k Variance k Current Month (838) (973) (135) Year to Date (3,613) (6,108) (2,495) Monitor Financial Risk Ratings The chart opposite shows the Trust s M9 financial performance as assessed using the Monitor risk ratings that are used as part of the FT assessment process. The Trust s weighted average metric currently stands at 2.7 which rounds to an overall score of 3. Over-riding rules limit the Trust to a maximum score of 2.
39 Page 39 Finance Income & Expenditure Overview Portsmouth Hospitals NHS Trust Subjective Summary of Financial Position as at 31st December 2013 Annual Budget December Budget December Actual December Variance Budget to Date Actual to Date Variance to Date '000 '000 '000 '000 '000 '000 '000 Income NHS PbR Income 392,963 31,852 32,930 1, , ,148 5,493 Other Patient Related Income 5, ,535 5, Other Operating Income 52,791 4,346 4, ,796 40, Total Income 451,724 36,676 38,074 1, , ,776 6,791 Operating Expenses Employee Benefit Expenses (246,849) (20,416) (21,057) (641) (186,123) (189,725) (3,602) Drugs Expenses (49,304) (4,062) (4,275) (212) (37,109) (38,549) (1,440) Clinical Supplies (39,351) (3,229) (3,835) (606) (30,062) (33,769) (3,707) Other Non-Pay (86,148) (6,859) (7,142) (283) (61,946) (63,682) (1,737) 0 0 Total Expenditure (421,652) (34,566) (36,309) (1,743) (315,239) (325,725) (10,486) Earnings Before Interest, Taxation, Depreciation and Amortisation (EBITDA) 30,071 2,110 1,765 (345) 22,747 19,051 (3,696) Depreciation (17,126) (1,427) (1,350) 77 (12,845) (12,268) 576 Net Profit/(loss) on disposal of assets (160) (13) 0 13 (120) (41) 79 Impairments Interest receivable/(payable) (16,361) (1,389) (1,388) 2 (12,326) (12,319) 7 Dividends payable (1,465) (122) (31) 91 (1,098) (717) 381 Retained (Surplus)/Deficit (5,040) (842) (1,004) (162) (3,642) (6,295) (2,652) Exclude costs that relate to IFRS impact Exclude costs that relate to Donated Asset Change Revised Retained (Surplus)/Deficit (5,000) (838) (973) (135) (3,613) (6,108) (2,495) +ve= favourable position (-ve) = adverse position
40 Page 40 Finance Contract Performance Overview (1) - Activity Trust Summary Month 8 - Contractual Activity Month 8 - (Activity) YTD - (Activity) Annual Plan Plan Actual Variance Plan Actual Variance % Variance Non-El ecti ve Spell s 57,635 4,802 4, ,025 37,031 (-994) -2.61% Non-El ecti ve XBD 22,448 1,829 1,266 (-563) 14,970 14,246 (-724) -4.84% Electi ve Spel l s 54,130 4,480 5, ,422 38,809 2, % Electi ve XBD 3, ,140 2, % A&E Attenda nces 131,351 9,792 10, ,259 91,224 (-1,035) -1.12% Outpa ti ents - Fi rs ts 125,362 10,310 11, ,809 90,800 5, % Outpa ti ents - Fol low-ups 228,718 18,727 19,868 1, , ,093 1, % Procedures 62,334 5,154 6,314 1,160 41,965 43,068 1, % Di a gnos ti c Imagi ng 43,580 3,603 4,680 1,077 29,340 36,478 7, % Outpa ti ents - Other 47,631 3,941 3,710 (-231) 32,033 28,408 (-3,625) % Chemothera py 25,316 2,093 1,934 (-159) 17,044 15,979 (-1,065) -6.25% Di rect Acces s 4,884, , ,250 (-17,795) 3,256,812 3,114,499 (-142,313) -4.37% Ma ternity Pa thway 19,003 1,595 1,449 (-146) 12,628 12,435 (-193) -1.53% ITU 6, ,135 4, % NICU 9, (-14) 6,069 6, % Renal Di a l ys i s 118,948 9,912 10, ,299 79,226 (-73) -0.09% Rehab 66,566 5,471 5, ,499 47,436 2, % Other 101,157 8,407 8, ,669 65,740 (-1,929) -2.85% Contract Activity Performance (one month in arrears) At the end of November, the Trust saw cumulative activity levels for above plan for baseline elective admissions by 6.55%. This excludes the 3.5m of additional elective activity which is assumed in the financial plan. Non-elective admissions are below activity plan by -2.61%. A&E attendances were cumulatively -1.12% below plan at the end of November. The plan includes anticipated growth in Actual attendances for the first 8 months of were 91,224, up by 1.9% year on year in real terms. For Outpatient activity, new attendances are cumulatively 7.06% above plan at the end of November and follow-up attendances 1.14% cumulatively above plan for
41 Page 41 Finance Contract Performance Overview (2) - Income Trust Summary Month 8 - Contractual Income Month 8 - ( '000s) YTD - ( '000s) Annual Plan Plan Actual Variance Plan Actual Variance % Variance Non-Electi ve Spells 103,108 8,447 8, ,574 70,462 1, % Non-Electi ve XBD 5, (-121) 3,622 3,474 (-148) -4.10% El ective Spel ls 70,233 5,811 6,898 1,087 47,263 51,364 4, % El ective XBD % A&E Attenda nces 14,038 1,074 1, ,751 9,703 (-48) -0.49% Outpa tients - Fi rs ts 19,611 1,610 1, ,284 14,310 1, % Outpa tients - Fol low-ups 22,179 1,817 1, ,054 15, % Procedures 11, , ,832 8, % Dia gnos tic Imagi ng 4, ,106 3, % Outpa tients - Other 3, (-20) 2,359 2,079 (-280) % Chemothera py 15,311 1,266 1,124 (-142) 10,308 9,435 (-873) -8.47% Direct Acces s 15,082 1,281 1,227 (-54) 10,264 10,048 (-216) -2.11% Maternity Pa thwa y 23,894 1,993 1,759 (-235) 15,962 15,524 (-439) -2.75% ITU 9, ,204 7,560 1, % NICU 6, (-33) 4,338 4, % Rena l Dia lys is 15,500 1,292 1, ,333 10, % Reha b 11, , ,852 8, % Other 32,833 2,720 2, ,053 22, % CQUIN 9, ,180 6,134 (-46) -0.75% Non-Electi ve Thres hold (-3,957) (-321) (-337) (-16) (-2,641) (-3,948) (-1,307) 49.49% Other Adjus tments (-6,413) (-534) (-310) 225 (-4,275) (-3,450) % TOTAL CONTRACT VALUE 384,175 31,629 33,704 2, , ,279 8, % Contract Income Performance Detail on contract income performance is available one month in arrears. The baseline over-performance against contract at the end of November is favourable by 8.3m. This over performance is stated before an adjustment which is required to take the contract value to the income value contained in the financial plan. This adjustment includes 2.6m of additional income in the financial plan, as at the end of December, for additional Elective activity to achieve RTT performance. The net PbR income position at December, taking into account an assessment of fines, penalties is 5.5m favourable against plan.


42 Page 42 Finance Detailed CQUIN Financial Performance (Month 8)
43 Page 43 Finance CSC & Corporate Function Positions (Year to Date) Portsmouth Hospitals NHS Trust Income and Expenditure Position as at 31st December 2013 YEAR-TO-DATE Annual Budget INCOME EXPENDITURE NET POSITION Income Expenditure Budget Actual Variance Budget Actual Variance Budget Actual Variance '000 '000 '000 '000 '000 '000 '000 '000 '000 '000 '000 CLINICAL SERVICE CENTRES Cancer & Surgery 2,049 (40,492) 1,584 2, (30,538) (32,474) (1,936) (28,955) (30,451) (1,496) Clinical Support 3,578 (50,581) 2,702 2, (38,382) (39,296) (913) (35,680) (36,347) (667) Emergency Care 8 (19,729) (14,871) (16,077) (1,206) (14,865) (16,021) (1,156) Head & Neck 661 (19,410) (48) (14,654) (15,532) (878) (14,162) (15,087) (925) Medicine 3,186 (39,748) 2,399 2, (30,155) (32,395) (2,241) (27,756) (29,853) (2,097) Medicine for Older People 593 (25,244) (19,114) (20,226) (1,113) (18,669) (19,484) (815) Musculo-Skeletal 53 (20,407) (15,567) (17,735) (2,168) (15,527) (17,670) (2,142) Renal 70 (22,900) (17,291) (19,427) (2,137) (17,238) (19,125) (1,887) Theatres 245 (40,884) (31,139) (33,001) (1,862) (30,956) (32,766) (1,810) Women's & Children 400 (32,699) (64) (24,508) (25,104) (596) (24,259) (24,919) (660) OTHER Pharmacy Trading 14,303 (13,520) 10,694 10,466 (228) (10,139) (10,070) (159) Facilities 3,025 (53,538) 2,269 2,174 (95) (40,194) (40,339) (145) (37,925) (38,165) (240) Corporate Functions 21,503 (33,332) 16,223 16, (24,990) (24,653) 337 (8,767) (8,307) 461 Central Income & Reserves 9,137 (44,329) 7,031 7, (30,122) (24,778) 5,345 (23,091) (17,642) 5,449 SLA Income 392, , ,148 5, , ,148 5,493 Total 451,774 (456,813) 338, ,813 6,790 (341,665) (351,108) (9,442) (3,642) (6,295) (2,652) IFRS / Donated Assets Impact Adjusted Total 451,774 (456,774) 338, ,813 6,790 (341,636) (350,921) (9,285) (3,613) (6,108) (2,495) Memorandum Item SLA Income Split (Provisional) YEAR-TO-DATE Annual Budget INCOME NET POSITION Income Budget Actual Variance Budget Actual Variance '000 '000 '000 '000 '000 '000 '000 CLINICAL SERVICE CENTRES Cancer & Surgery 79,267 59,397 58,809 (588) 59,397 58,809 (588) Clinical Support 16,875 12,892 13, ,892 13, Emergency Care 42,550 32,295 31,730 (565) 32,295 31,730 (565) Head & Neck 32,035 23,932 24, ,932 24, Medicine 51,379 37,789 38,822 1,033 37,789 38,822 1,033 Medicine for Older People 22,851 16,886 18,128 1,242 16,886 18,128 1,242 Musculo-Skeletal 48,876 36,241 37,560 1,320 36,241 37,560 1,320 Renal 29,374 22,037 22, ,037 22, Theatres 10,258 7,700 8, ,700 8, Women's & Children 50,709 37,813 38, ,813 38, OTHER Corporate Functions 8,789 6,672 7, ,672 7, Total 392, , ,148 5, , ,148 5,493 +ve= favourable position (-ve) = adverse position

. Non-Pay Non-Pay expenditure for November was at 18.0m. Drug costs were 4.")
44 Page 44 Finance Income & Expenditure trends Pay Pay Expenditure for the month of December totalled 21.1m, the same figure as seen in November. When comparing figures with 2012/13 there is a need to consider the impact of the auto-enrolment of staff into the pension scheme came into effect in June. This equates to an additional monthly pension cost to the Trust of circa 0.1m per month, year on year. Pay inflation broadly accounts for an increase of 0.2m each month when comparing financial years. Temporary workforce costs were 1.4m, a decrease of 0.06m on the previous months figure (covered in the next slide). Non-Pay Non-Pay expenditure for November was at 18.0m. Drug costs were 4.3m matching the average Trust drug spend seen per month in the course of this year so far. In month 9 PBR exclusion drugs were 1.3m, around 30% of total drug expenditure seen. These have been fully accounted in terms of corresponding income. Clinical supply costs were 3.8m in December. The average cost per month this financial year has been 3.75m. Part of the increase in costs seen in links to the Da Vinci robot. Cumulative supply costs year to date linked to Robotic surgery equate to 0.28m, averaging 40k per month or 2.1k per procedure. Income Overall income levels for the month totalled 38.1m. PBR income was reported as 32.9m in December (based on actual data for April to November performance and known forecast provisions).this was a 1.1m favourable variance to the income plan in month.

45 Page 45 Finance Temporary Staffing Costs Temporary Staffing trends: Expenditure on temporary staffing for the month of December totalled 1.4m. A small decrease of 60k on the November figure. The December figure is higher in real terms as the 1.4m includes an adjustment of 133k related to the transfer of some elements of ICT project management staff costs to the Capital programme, matching them with specific capital development projects. The key elements of cost remain; Medical staffing at 0.6 and Nursing at 0.6m. Expenditure includes additional costs incurred to support enhanced activity supporting RTT performance. This equated to 58k in December. The cost of senior management is included under the heading of administration. Costs in month were valued at 80k combined with administration the total expenditure was 140k. Senior management costs reflect additional support provided to the Surgical cluster CSC s, Internal Medicine and MOPRS.
46 Page 46 Finance Balance Sheet Statement of Financial Position Forecast Assets Non Current Plan Actual Variance Actual Movements Opening Actual Movement Dec-13 Dec-13 Dec-13 Nov-13 In Month Apr-13 Dec-13 Nov-13 Mar-14 Property Plant & Equipment 000s 000s 000s 000s 000s 000s '000s '000s '000s A Total Property Plant & Equipment 305, ,387 (4,442) 302,005 (618) 303, ,387 (2,422) 305,133 Total Fixed Assets 305, ,387 (4,442) 302,005 (618) 303, ,387 (2,422) 305,133 Investments - Non Current E Other Receivables - Non Current 1,959 1, , ,093 1,999 (94) 1,968 F Other Financial Assets - Non Current (52) 557 (52) (178) 505 Total Non Current Assets 308, ,891 (4,454) 304,531 (640) 306, ,891 (2,694) 307,606 Current Assets B Inventories 12,751 13, , ,973 13,045 1,072 12,455 C NHS Trade Receivables - Current 21,359 20,967 (392) 21,378 (411) 7,749 20,967 13,218 20,910 D Non NHS Trade Receivables - Current 2,170 1,810 (360) 2,168 (358) 2,044 1,810 (234) 1,817 E Other Receivables - Current 7,095 4,364 (2,731) 7,269 (2,905) 9,687 4,364 (5,323) 5,064 F Other Financial Assets - Current (eg accrued income) 2,540 2, , ,593 2, ,047 G Provision for bad Debts (605) (605) 0 (605) 0 (642) (605) 37 (605) H Cashbook & Cash Equivalents 1,608 3,640 2,032 2,317 1, ,640 3, I Land Held For Sale Total Current Assets 46,918 46,022 (896) 47,796 (1,774) 33,958 46,022 12,064 43,242 Current Liabilities (less than 1 year) Current Month Previous Month Year to date J Trade Payables - Current (2,160) (1,729) 431 (2,180) 451 (2,311) (1,729) 582 (1,668) M1 NHS Payables - Current (8,223) (9,744) (1,521) (8,488) (1,256) (1,956) (9,744) (7,788) (8,949) M2 Other Payables - Current (25,525) (23,592) 1,933 (25,526) 1,934 (18,484) (23,592) (5,108) (23,061) PDC Dividend Payable (92) (92) 0 (61) (31) (165) (92) 73 0 K Capital Payables - Current (578) (578) 0 (578) 0 (2,292) (578) 1,714 (3,194) L Taxation Payable - Current (4,803) (4,893) (90) (4,840) (53) (867) (4,893) (4,026) (4,781) W Payments on Account - Current (1,151) (1,072) 79 (1,286) 214 (1,228) (1,072) 156 (666) N Accruals - Current (4,032) (4,141) (109) (3,730) (411) (5,625) (4,141) 1,484 (5,046) O Loans - non commercial (1,332) (1,332) 0 (1,332) 0 (1,332) (1,332) 0 (1,332) P Provisions Current (1,519) (1,240) 279 (1,519) 279 (3,140) (1,240) 1,900 (1,240) Q Finance Leases Current (411) (482) (71) (482) 0 (126) (482) (356) (434) R PFI Leases Current (4,504) (4,504) 0 (4,504) 0 (4,504) (4,504) 0 (4,504) Total Current Liabilities (54,330) (53,399) 931 (54,526) 1,127 (42,030) (53,399) (11,369) (54,875) Net Current Assets/Liabilities (7,412) (7,377) 35 (6,730) (647) (8,072) (7,377) 695 (11,633) Total Assets less Current Liabilities 300, ,514 (4,419) 297,801 (1,287) 298, ,514 (1,999) 295,973 Q Finance Leases - Non Current (5,703) (1,461) 4,242 (1,502) 41 (36) (1,461) (1,425) (1,461) P Provisions Liabs/Chgs (1,721) (1,722) (1) (1,722) 0 (1,785) (1,722) 63 (1,721) O Loans - non commercial (3,340) (3,340) 0 (3,340) 0 (4,006) (3,340) 666 (2,674) R PFI Leases - Non Current (245,259) (245,251) 8 (245,634) 383 (248,645) (245,251) 3,394 (243,961) Total Assets Employed 44,910 44,740 (170) 45,603 (863) 44,041 44, ,156 Taxpayers Equity S Public Dividend Capital 48,998 49, , ,798 49,138 6,340 49,464 T Retained Earnings (Accumulated Losses) (43,312) (43,312) 0 (43,312) 0 (43,312) (43,312) 0 (43,312) T Income & Expenditure Account * (5,984) (6,294) (310) (5,291) (1,003) 0 (6,294) (6,294) (5,204) U Revaluation Reserve 45,208 45, , ,555 45, ,208 V Donated Asset Reserve TOTAL FUNDS EMPLOYED 44,910 44,740 (170) 45,603 (863) 44,041 44, ,156 * The I&E balance excludes both the IFRS and donated assets technical adjustment. Traffic Light indicates movements in value of 1000,000 ( Positive or Negative ) from the current plan.


47 Page 47 Finance Capital and Cash Capital The Trust s capital programme for the 2013/14 financial year was originally valued at 22.2m. This has been reviewed as a result of the planned deficit position and subsequently reduced. Additionally the treatment of the PACS lease has been reviewed by Deloittes and is no longer considered to be a Finance Lease. On this basis it has been removed from the Capital programme. The programme is now valued at 17.0m in 2013/14. At the end of December, the Trust has seen capital expenditure of 9.3m. This is 2.0m adverse to plan. A further 1.3m related to the purchase of one of the new MRI scanners is now planned for April The expenditure plans overall also include a 4.1m adjustment for PFI component accounting and 2.2m for the Da Vinci Robot. Cash The Trust s cash balance as at 31st December is 3.6m. This is 6.0m adverse to the cash plan, reflecting the cash impact of the year-to-date I&E deficit and outstanding Commissioner invoices; relating primarily to contract over-performance. The Trust applied for 6.2m of in-year cash support from the TDA in order to mitigate the adverse cash flow consequences of this. This was received in January and will need to be repaid by the 18th March 2014.
48 Page 48 Finance Cost Improvement Plan All workstreams shown by CSC Target 2013/14 M9 Total Pay & Non Pay Savings for PHT Specific Initiatives Total for Finance Savings Plan 2013/14 Variance Planned for the year Of which currently Unallocate d/ Unidentifi ed Planned YTD Actual YTD Plan Actual Variance Year End Forecast Plan Actual Variance k k k k k k k k k k k CSC Savings including Corporate Workstreams CSC Planned Scheme Total CHAT 2, , (573) (53) 2,705 1,757 (948) Clinical Support 2, , (710) (118) 2,710 1,423 (1,286) Corporate 2, ,874 1,738 (136) (36) 2,681 2,471 (210) Emergency Care (574) (74) (818) Head & Neck 1, (383) (47) 1, (537) Internal Medicine 2, ,828 1,017 (811) (126) 2,889 1,623 (1,266) MOPRS 1, , (881) (132) 1, (1,352) MSK 1, (614) (65) 1, (1,011) Renal 1, (635) (80) 1, (897) Surgery & Cancer 1, , (816) (105) 1, (1,155) Womens & Childrens 1, (709) (84) 1, (975) 20,500 5,615 12,983 6,141 (6,842) 1, (919) 20,500 10,047 (10,453) Overview The Trust s cost improvement target for 2013/14, of 20.5m, is required to support achievement of a year end 5m deficit. The total value of CIP schemes within the tracker amount to 14.9m, with 5.6m of CIPs unidentified. In addition, the Trust has a number of income generating schemes amounting to 4.0m that contribute to the Trust Financial Plan. Year to Date Performance The cumulative position at month 9 shows that the Trust has achieved 6.1m savings against planned schemes of 13m resulting in an adverse variance of 6.9m. The 6.8m adverse position includes 4.3m relating to unidentified savings and 2.6m relating to under delivery of agreed CIP plans. The in month position against a plan of 1.9m is 0.9m adverse. Future Performance The forecast for CIP delivery in terms of cost reduction for is 14.3m, linked to both the original programme and a range of additional initiatives now being developed within the Trust via the Trust Recovery Plan.

 Exception reports included as an annex to this report (section 9) A&E service quality standards The national four-hour")
49 Page Service delivery priorities dashboard Service delivery priorities dashboard Service delivery priorities overview, December 2013 Exception reports have been included in relation to: Performance against of the national ED four-hour wait target RTT speciality level failure of targets, and diagnostic 6 week wait Cancer due to on-going risks for 31 and 62 day targets Stroke direct admission PPCI call to needle 120 minutes C Difficle (exception report in quality section) Exception reports included as an annex to this report (section 9) A&E service quality standards The national four-hour wait target was not achieved in month 9. Referral to Treatment (RTT) admitted and non-admitted targets Trust achieved all 3 targets at trust aggregate level but there were fails of the standards at individual speciality level. Admitted standard All specialties with the exception of urology which was a planned fail achieved the standard. Non-admitted standard 2 specialties failed to achieve this standard: Orthopaedics and General Surgery. Incomplete standard 3 specialties failed to achieve this; General Surgery, Orthopaedics and Urology. The planned failures of the standards were discussed with commissioners, to reduce the backlog and start to move to a sustainable position. Cancer standards All 9 national and local cancer standards were achieved in month 9, these targets are measured monthly and quarterly. For quarter 3-2 wk wait and 31 day subsequent surgery did not achieve the standard. Stroke performance targets (internal / contract targets only) 3 of the 4 key stroke performance metrics were achieved in month 9 (provisional performance. PPCI performance standards (internal / contract targets only) 3 out of 4 key PPCI performance standards were achieved in month 9 Diagnostic waits The maximum 6 week waiting time for diagnostics was not achieved in month 9.


50 Page Performance against ED waiting time standards Performance against the 4-hour A&E standard and ambulance handover (December) Performance against the ED 4hr standard was 87.54% in December, compared to 93.96% in November. Performance for the end of Q3 was 92.85%. This compares favourably to Qtr 3, 2012/13 performance which was reported as 87.13% (i.e. a 5.7% improvement this year) Attendances (QAH and GWM combined) did not increased significantly. Issues leading to deterioration in performance for December include: 11% increase in the number of ambulance arrivals; 9% increase in attendance for over 65s; 11% increase in medical admissions, including higher respiratory admissions - demonstrating an increase in patient acuity; and Resulting higher bed occupancy; Increased numbers of medically stable, discharge ready patients occupying acute beds in the lead up to Christmas and New Year (particularly complex discharges) see backdoor tracker on page 51 In the lead-up to and throughout the festive season, previous initiatives remained in situ. These included: additional senior medical cover to ED and on wards, out-of-hours and at weekends; 7-day ambulatory service provision; 7-day urgent care model; community assessment lounge in ED; and multidisciplinary in-reach service. Further mitigating actions discussed in January with CCG colleagues, Community Providers (Southern and Solent) and Hampshire County Council, to improve the transfer of complex health and social care patients to their discharge include: 1) timely response and action with regards to continuing health care funding - CCG; 2) implementation of patient rapid response teams (PRRT) in Hampshire - HCC & Southern. This currently runs in Portsmouth City and is effective in decision-making between health and social care; 3) Review of access to community capacity in Fareham and Gosport Southern & CCG Additional internal mitigating actions: 1) Review of Medical Take Pathway including a new Physician of the Day role increasing the medical presence in the Emergency Corridor, second review of patients later in the day to expedite discharges; and 2) Implementation of ward-level, progress chasers for complex discharges; Ambulance handover performance deteriorated as a result of the above, PHT mitigating actions have been implemented and have improved performance. These include: 1) establishing a contract with UKSAS (paramedic private provider) to support ED with managing patients waiting to go to ED majors; and 2) a revised pathway for Urgent GP referred patients to go direct to MAU; and
51 Page Performance against ED waiting time standards (Contd.) Trust Recovery : Backdoor Tracker Axis Title Sep 4-Oct 11-Oct 18-Oct 25-Oct 1-Nov 8-Nov 15-Nov 22-Nov 29-Nov 6-Dec 13-Dec 20-Dec 27-Dec 3-Jan 10-Jan 17-Jan 27-Sep 04-Oct 11-Oct 18-Oct 25-Oct 01-Nov 08-Nov 15-Nov 22-Nov 29-Nov 06-Dec 13-Dec 20-Dec 27-Dec 03-Jan 10-Jan 17-Jan IDB No Plan IDB No Actual MSDR Plan MSDR Actual Med/MOP Outliers Plan Med/MOP Outliers Actual LOS > 14 Days Plan LOS > 14 Days Actual The Trust has implemented a number of joint initiatives with health and social care partners to improve discharge of patients with complex needs. Delivery and sustainability of these initiatives is monitored through performance against a number of key metrics relating to complex discharges actions that have been agreed with CCGs and community partners. These are built into the whole system CQUIN for These metrics include: the number of patients referred to the integrated discharge bureau (IDB), to support the management of the complex discharge pathway; the numbers of patients who are medically stable and discharge ready (MSDR) i.e. patients who no longer have an acute need, and awaiting something outside of PHT acute provision), the number of patients outlying in another specialty bed; and the >14day LoS. The above tracker demonstrates that since September, patients with >14 day Los reduced, but then began to rise in December. This correlates with increased occupancy in the Trust. Medically stable discharge ready (MSDR) patient numbers also increased early December and then again before Christmas, with a sharp rise between Christmas and the new year. The combined impact of >14 day Los patients and increased MSDR patient numbers, impacted the on the number of patients outlying into other specialty and escalation beds.
 Performance, backlog and sustainability The Trust achieved all 3 key RTT metrics at aggregate level for December, however areas of concern continue to be addressed:")
52 Page Referral to Treatment (RTT) Performance, backlog and sustainability The Trust achieved all 3 key RTT metrics at aggregate level for December, however areas of concern continue to be addressed: Urology failed to achieve 2 of 3 RTT targets in month and continues to target backlog as planned. Additional capacity continues to be sourced and the specialty action plan is being monitored. General Surgery failed to achieve 2 of 3 RTT targets, largely due to growth in the non-admitted backlog position for Colorectal. Additional capacity will address this by end of Q4. Trauma and orthopaedics failed to achieve 2 of 3 RTT targets due to increasing backlogs in sub-specialities. Additional in-house capacity and outsourcing are being used to address the demand capacity mismatch. As per previous briefings the trust has been successfully reducing the number of patients waiting for treatment over 35 weeks. The reported position is not adjusted for patient choice delays and has been held at 20 for December, despite some patients choosing to delay treatment until the New Year. (graph 1)
 Headline performance Provisional performance of the cancer standards demonstrates achievement of all 9 targets for Cancer standards during December, for the first")
53 Page Cancer Performance (provisional) Headline performance Provisional performance of the cancer standards demonstrates achievement of all 9 targets for Cancer standards during December, for the first time in 5 months. The number of long waiting patients (past breach) has continued to reduce (graph 2). If measured year to date (Apr 13-Dec 13), all Cancer standards are being achieved. December 2 Week Waits: two tumour sites failed to achieve the standard in December: Dermatology with 22 breaches (capacity/patient choice) and Urology with 38 breaches (capacity). This was a significant improvement for Urology on the November position of 81 breaches and was the result of daily monitoring of referrals and significant additional clinics. 31 day subsequent surgery: Urology had 1 breach in December due to capacity for robotic surgery Quarter 3 2 Week Waits: this standard was not achieved for the quarter and the main contributor to the failure was Urology breaches. 31 Day subsequent surgery: this standard was not achieved for the quarter and this was in the main due to issues of capacity for complex and robotic surgery in Urology.
 Previous Actions Taken to Improve Performance The strengthening of the management of cancer services and increased daily performance monitoring have delivered improvements in performance as")
54 Page Cancer Performance (Contd.) Previous Actions Taken to Improve Performance The strengthening of the management of cancer services and increased daily performance monitoring have delivered improvements in performance as outlined in last months report. The targeted management of legacy patients has seen the overall waiting times and the experience for patients improve (Graph 2 & table 1) Additional capacity was provided in December across most tumour sites to improve 2 week wait performance and to move the trust back to a sustainable position for this standard. Additional capacity has been provided for Urology robotic surgery which has doubled the capacity for complex patients. Additional surgical capacity for complex patients has also been provided at weekends. On-going Risks (Urology) Urology - there are a legacy of patients waiting for robotic or complex surgery and a further 2 patients per week are choosing robotic surgery. The increased capacity now allows for 2 robotic cases per week, but this does not address the backlog. Each new patient is therefore likely to fail the standard until this is addressed. The additional capacity required is approximately an additional 24 robotic lists before the end of quarter 4 and a similar number of lists for complex patients therefore it is unlikely that these can all be delivered before the end of quarter 4. To address this the specialty continues to look at all options to further increase capacity, including forward planning recruitment for additional cancer surgeons to sustainably increase capacity in line with demand for the service.

55 7.4 Performance against PPCI Target In December 2013, there were 28 patients in total for PPCI (primary percutaneous coronary intervention) admitted via ED / ambulance. The Trust achieved 92.9% against the 90 minute Door to Balloon standard of 80%; indicating that the hospital processes and associated responsiveness exceeds the national standard for our patients. This target has been consistently met with YTD 13/14 performance of 92.3% The Call to Balloon (CtB)120 minute standard takes account of the pre-hospital phase of the pathway for heart attack patients, and records time from the initial call to the ambulance services to balloon. The required standard of 75% was not achieved in December. The entire pathway achieved 55.6% in December, 59.7% for Q3 and 70.8% YTD 13/14. Key factors contributing to non-achievement of Call to Balloon Standard were: 2 ED delays 1 x crew arrived to ED against protocol, 1 x STEMI in ED resulted in complex situation and delay in transfer to Cath Lab 10 Ambulance related delays: 3 SCAS, 4 SECAMB, and 3 air ambulance from the IoW The CSC clinical and management team have discussed with ambulance providers, compliance with CtB protocols and will agree measures for improvement with them. Discussion relating to the specific problems associated with ambulance conveyance are also planned with the Commissioner. 7.5 Performance against Stroke service standards Stroke Direct Admission Performance in December was 88.7% against 90% standard with 80 patients treated. There were 9 breaches of the standard. All 9 breaches were related to their clinical presentations. 1 patient was admitted to MAU with pneumonia and noted on MOPRS ward to have a change in cognition and subsequently CT scanned. Other presentations include confusion, under the influence of alcohol and dizziness with a headache and no associated nausea. One patient was observed as a TIA whilst also presenting with other non stroke symptoms and admitted to MAU. Targets that were met include 90% stay in an acute stroke unit, CT scanning for 1 hour and 24 hour completion.

56 Page Diagnostic 6 week referral to test Diagnostic performance for December The trust failed to achieve the 6 week referral to test target for December Performance was 97.96% against the 99% standard. This was due to demand and capacity issues for Diagnostic Imaging and Endoscopy as outlined below. Overall the Trust carried out an additional 808 diagnostic procedures. Clinical Support: Diagnostic Imaging CT demand The department has seen a 4% increase in demand when comparing the last two quarters, October-December with July-September. December demand was higher than the autumn months September and November MRI demand The department has also seen an increase of 4% when comparing the last two quarters. December demand was in line with August and September. Ultrasound There has been a 1% increase in demand when comparing the last two quarters, with December demand in line with the summer months. Since September, there has been an increase in CT urgent referrals whilst there has also been a surge in demand for all 3 modalities through to the end of December. NHS Providers across the south are experiencing similar trends and are all outsourcing at least one of the three modalities (CT, MRI or Ultrasound). As a result of their similar pressures they have had no capacity to offer us (indeed some have asked PHT for help with additional capacity). PHT have contacted I.O.W., Western Sussex, UHS and Winchester. All additional private sector capacity offered by SPIRE and Nuffield to PHT has been fully utilised. There were 688 additional patients scanned at PHT during December through extra lists, weekend and evening sessions. In addition, 120 scans were outsourced (with the reporting still done at PHT). Therefore overall an additional 808 scans were undertaken during December, 24.3% of the total OP scans for the month. [This number does not include the Inpatient and ED scans]. Despite the additional activity, there were still 58 breaches (1.61% of the total) during the month against a tolerance of 36.
Quality Performance Detailed View March 2015 position
 Page 1 Quality Performance Detailed View March 2015 position Portsmouth Hospitals NHS Trust QAH Hospital Page 2 Quality of Care Key Exceptions to note Quality of Care Executive Summary March performance
Integrated Performance Report December 2015
 Portsmouth Hospitals NHS Trust QAH Hospital Page 1 Integrated Performance Report December 2015 Portsmouth Hospitals NHS Trust QAH Hospital Page 2 Contents Section Page 1 Performance Outcomes 3 2 Quality
Integrated Performance Report
 Integrated Performance Report M06 September 2014 Presented by: Paul Bostock (Chief Operating Officer) Des Holden (Medical Director) Fiona Allsop (Chief Nurse) Paul Simpson (Chief Financial Officer) An
Integrated Performance Report
 Integrated Performance Report M12 March 2015 Presented by: Paul Bostock (Chief Operating Officer) Des Holden (Medical Director) Fiona Alsop (Chief Nurse) Paul Simpson (Chief Financial Officer) An Associated
BSUH INTEGRATED PERFORMANCE REPORT. 1) Responsive Domain 2) Safe Domain 3) Effective Domain 4) Caring Domain 5) Well Led Domain
 Responsive Domain 2) Safe Domain 3) Effective Domain 4) Caring Domain 5) Well Led Domain") BSUH INTEGRATED PERFORMANCE REPORT 1) Responsive Domain 2) Safe Domain 3) Effective Domain 4) Caring Domain 5) Well ed Domain RESPONSIVE DOMAIN RESPONSIVE DOMAIN Metric Defined by Standard Apr-16 May-16
BSUH INTEGRATED PERFORMANCE REPORT 1) Responsive Domain 2) Safe Domain 3) Effective Domain 4) Caring Domain 5) Well ed Domain RESPONSIVE DOMAIN RESPONSIVE DOMAIN Metric Defined by Standard Apr-16 May-16
Integrated Performance Report
 Integrated Performance Report M04 July 2016 Presented by: Angela Stevenson (Chief Operating Officer) Des Holden (Medical Director) Fiona Allsop (Chief Nurse) Paul Simpson (Chief Financial Officer) An Associated
NHS Portsmouth CCG 2013/14 Contract Agreements Summary. Michelle Spandley Deputy Chief Finance Officer May Improving health services
 NHS Portsmouth CCG 2013/14 Contract Agreements Summary Michelle Spandley Deputy Chief Finance Officer May 2013 Contents Contracts Summary Portsmouth Hospitals NHS Trust Solent NHS Trust South Central Ambulance
Quality Improvement Scorecard November 2017
 Mortality: HSMR Performance remained below target in July Nat NB: Each month is a 12 month rolling value. I.e. Mar-16 reports the monthly average of Apr-15 to Mar-16. Mortality: HSMR (weekday) vs. HSMR
Item E1 - Bart s Health Quality Indicators
 Item E1 - Bart s Health Quality Indicators 1.0 Purpose 1.1 The purpose of this report is to provide the CCG Board with an update on quality matters across pertaining to our main local Provider organisations.
Quality Improvement Scorecard June 2017
 Mortality: HSMR Nat NB: Each month is a 12 month rolling value. I.e. Mar-16 reports the monthly average of Apr-15 to Mar-16. Performance remained below target in February. Mortality: HSMR (weekday) vs.
21 March NHS Providers ON THE DAY BRIEFING Page 1
 21 March 2018 NHS Providers ON THE DAY BRIEFING Page 1 2016-17 (Revised) 2017-18 (Revised) 2018-19 2019-20 (Indicative budget) 2020-21 (Indicative budget) Total revenue budget ( m) 106,528 110,002 114,269
The Royal Wolverhampton NHS Trust
 The Royal Wolverhampton NHS Trust Meeting Date: 3 th June 214 Trust Board Report Title: Executive Summary: Action Requested: Report of: Author: Contact Details: Resource Implications: Public or Private:
Quality Improvement Scorecard March 2018
 Mortality: HSMR Nat NB: Each month is a 12 month rolling value. I.e. Mar-16 reports the monthly average of Apr-15 to Mar-16. Performance further improved in October. November data not yet available. Mortality:
SHEFFIELD TEACHING HOSPITALS NHS FOUNDATION TRUST EXECUTIVE SUMMARY REPORT TO THE TRUST BOARD HELD ON 18 NOVEMBER 2015
 SHEFFIELD TEACHING HOSPITALS NHS FOUNDATION TRUST EXECUTIVE SUMMARY REPORT TO THE TRUST BOARD HELD ON 18 NOVEMBER 2015 Subject: Supporting TEG Member: Authors: Status 1 Data Quality Baseline Assessment
Quality Improvement Scorecard December 2017
 Mortality: HSMR Performance improved in August Nat NB: Each month is a 12 month rolling value. I.e. Mar-16 reports the monthly average of Apr-15 to Mar-16. Mortality: HSMR (weekday) vs. HSMR (weekend)
Report to: Trust Board 25 th April Enclosure 4. Title Integrated Performance Report March Sponsoring Executive Director
 Report to: Trust Board 25 th April 2013 Title Integrated Performance Report March 2013 Enclosure 4 Sponsoring Executive Director Author(s) Purpose Previously considered by Peter Herring Chief Executive
Quality & Performance Report. Public Board
 Agenda Item 12.1 Quality & Performance Report Public Board 27 th November 2014 Presented for: Presented by: Author: Previous Committees: Governance Professor Suzanne Hinchliffe CBE Chief Nurse / Interim
Quality Improvement Scorecard February 2017
 Mortality: HSMR Nat Performance continued to improve into Q3 2016/17. NB: Each month is a 12 month rolling value. I.e. Mar-16 reports the monthly average of Apr-15 to Mar-16. Mortality: HSMR (weekday)
WEST HAMPSHIRE PERFORMANCE REPORT. Based on performance data available as at 11 th January 2018
 WEST HAMPSHIRE PERFORMANCE REPORT Based on performance data available as at 11 th January 2018 1 CCG Quality and Performance Executive Summary Introduction: The purpose of this report is to provide an
Operational Focus: Performance
 Operational Focus: Performance Sandra Iskander Changes for 2015/16 Change of focus of 18-weeks and A&E 4-hour wait targets as recommended by Sir Bruce Keogh, Medical Director, NHS England. 18-weeks to
TRUST BOARD. Jo Furley, Interim Chief Nurse Dr Ben Lobo, Medical Director. Jo Hunter, Deputy Chief Nurse. Mary Heritage, Assistant Director of Quality
 TRUST BOARD Document Title: Presenter: Quality Report Jo Hunter, Deputy Chief Nurse Authors: Contact details for further information: Jo Furley, Interim Chief Nurse Dr Ben Lobo, Medical Director Jo Hunter,
Newham Borough Summary report
 Newham Borough Summary report Item K1 September 2013 Prepared on 30/09/2013 by Support team GREEN Finance and Activity Millions AMBER RED Headlines M5 Financial position M4 activity data The QIPP net savings
Performance and Delivery/ Chief Nurse
 Governing Body 26th May 2017 Quality and Performance Report 22nd May 2017 Author: Other contributors: Executive Lead Audience Eileen Clark - Acting Director of Clinical Performance and Delivery/ Chief
Quality Improvement Scorecard December 2016
 Mortality: HSMR Nat The improvement in performance has been maintained in year. NB: Each month is a 12 month rolling value. I.e. Mar-16 reports the average of Apr-15 to Mar-16. Mortality: HSMR (weekday)
Strategic KPI Report Performance to December 2017
 Strategic KPI Report Performance to December 2017 Trust Board 25 th January 2018 Strategic KPI summary SROs: All Directors Objective KPI SRO Target Apr May Jun Jul Aug Sep Oct Nov Success Is Deliver A
Balanced Scorecard. Paper 5.2. TRUST BOARD 24 th September 2015 TITLE EXECUTIVE SUMMARY
 TRUST BOARD 24 th September 2015 TITLE EXECUTIVE SUMMARY Balanced Scorecard The Trust reported an in-month deficit of 0.7m against a deficit budget of 0.6m, resulting in a year to date surplus to 0.2m
INTEGRATED PERFORMANCE REPORT. BOARD OF DIRECTORS 20 September 2017
 INTEGRATED PERFORMANCE REPORT BOARD OF DIRECTORS 20 September 2017 1 S Section Page Executive Summary 4 Trust Performance Overview 7 Trust Performance Report by Exception 9 MSSA Bacteraemia - Actual numbers
Status: Information Discussion Assurance Approval. Claire Gorzanski, Head of Clinical Effectiveness
 Report to: Trust Board Agenda item: Date of Meeting: 2 October 2017 SFT3934 Report Title: Annual quality governance report 2016-2017 Status: Information Discussion Assurance Approval X Prepared by: Executive
Agenda Item number: 9.1. Maggie Bayley, Director of Nursing and Quality
 Board meeting date: 15 December, 2011 Agenda Item number: 9.1 Enclosure: 6 Title Quality report Accountable Director: Authors(name & title): Maggie Bayley, Director of Nursing and Quality Maggie Bayley,
Trust Key Performance Indicators
 Monthly - February 2007 Patient Experience Length of Stay - Overall A Mortality Rate G Cancelled Operations R Elective A Peri-operative Mortality Rate Cancelled Operations (28 day reschedule) A Non-elective
COVENTRY AND RUGBY CLINICAL COMMISSIONING GROUP
 COVENTRY AND RUGBY CLINICAL COMMISSIONING GROUP Report To: Governing Body 11 September 2013 Report From: Title of Report: Purpose of the Report: Jacqueline Barnes, Executive Nurse The Nursing and Quality
July (Month 4) Integrated Performance Report. John Grinnell, Director of Finance. Executive Directors. For Information For Discussion For Approval
 Integrated Performance Report. John Grinnell, Director of Finance. Executive Directors. For Information For Discussion For Approval") BOARD OF DIRECTORS Subject/Title July (Month 4) Integrated Performance Report Executive Responsible Paper prepared by (if different from above) John Grinnell, Director of Finance Executive Directors Nature
BOARD OF DIRECTORS Subject/Title July (Month 4) Integrated Performance Report Executive Responsible Paper prepared by (if different from above) John Grinnell, Director of Finance Executive Directors Nature
SUPPORTING PLANNING 2013/14 FOR CLINICAL COMMISSIONING GROUPs
 SUPPORTING PLANNING 2013/14 FOR CLINICAL COMMISSIONING GROUPs December 2012 SUPPORTING PLANNING 2013/14 FOR CLINICAL COMMISSIONING GROUPS First published: 21 December 2012 2 Contents 1. INTRODUCTION...
SUMMARY OF INDICATOR CHANGES FOR VERSION 3 INTELLIGENT MONITORING REPORTS Acute and Specialist NHS Trusts 23 June Final Draft, Subject to Change
 Never Event incidence Yes: 01 May 2013-30 Apr 2014 Incidence of Clostridium difficile (C.difficile) Incidence of Meticillin-resistant Staphylococcus aureus (MRSA) Dr Foster Intelligence: Mortality rates
Integrated Performance Committee Assurance Reports, January 2016 and December 2015 Crishni Waring, Chair, IPC Committee
 EPB53/825 Title of Report: Prepared By: Sponsor: Action Required: Integrated Performance Committee Assurance Reports, January 2016 and December 2015 Crishni Waring, Chair, IPC Committee Gale Hart, Director
Delivering Improvement in Practice
 v Delivering Improvement in Practice NHS Providers Governance Conference 7 July 2016 Sir Mike Aaronson Chairman, Frimley Health NHS Foundation Trust 2006-2016 Frimley Health FT Comprises: Frimley Park
TRUST BOARD SAFETY AND QUALITY MONTHLY REPORT SEPTEMBER 2013
 TRUST BOARD SAFETY AND QUALITY MONTHLY REPORT SEPTEMBER 2013 1. EXECUTIVE SUMMARY As reported to the Board last month, the reporting on safety and quality to the Trust Board has changed. Each month a summary
RTT Assurance Paper. 1. Introduction. 2. Background. 3. Waiting List Management for Elective Care. a. Planning
 RTT Assurance Paper 1. Introduction The purpose of this paper is to provide assurance to Trust Board in relation to the robust management of waiting lists and timely delivery of elective patient care within
102/14(ii) Bridgewater Board Date. Thursday 5 June Agenda item. Safe Staffing April 2014 Review
 Bridgewater Board Date. Thursday 5 June Agenda item. Safe Staffing April 2014 Review") Bridgewater Board Date Thursday 5 June 2014 Agenda item 102/14(ii) Title Safe Staffing April 2014 Review Sponsoring Director Authors Presented by Purpose Dorian Williams, Executive Nurse/Director of Governance
Bridgewater Board Date Thursday 5 June 2014 Agenda item 102/14(ii) Title Safe Staffing April 2014 Review Sponsoring Director Authors Presented by Purpose Dorian Williams, Executive Nurse/Director of Governance
Richard Wilson, Quality Insight and Intelligence Director
 To: Board For meeting: 24 May 2018 Agenda item: 8 Report by: Richard Wilson, Quality Insight and Intelligence Director Report on: Quality Dashboard Purpose 1. This paper highlights the key observations
Annual General Meeting 17 September 2014
 Annual General Meeting 17 September 2014 Quality Accounts Mike Wright Executive Director of Nursing & Patient Experience Director of Infection Prevention and Control Quality Account 2013/14 2013/14 in
TRUST BOARD PART I SEPTEMBER 2011 Agenda Item Number: 145/11 Enclosure Number: (1)
") TRUST BOARD PART I SEPTEMBER 2011 Agenda Item Number: 145/11 Enclosure Number: (1) Subject: Prepared by: Sponsored by: Presented by: Purpose of paper Why is this paper going to the Trust Board? Key points
TRUST BOARD PART I SEPTEMBER 2011 Agenda Item Number: 145/11 Enclosure Number: (1) Subject: Prepared by: Sponsored by: Presented by: Purpose of paper Why is this paper going to the Trust Board? Key points
Section 1 - Key Performance Indicators
 Clinical Quality Report Month 6 2016/17 period ending 30th September 2016 Section 1 - Key Performance Indicators 1.1 NHS Improvement; Risk Assessment Framework Clostridium difficile Indicator M6 2 YTD
Newham Borough Summary report
 Newham Borough Summary report April 2013 Prepared on 17/04/13 by Commissioning Support team Apr-11 Jun-11 Aug-11 Oct-11 Dec-11 Feb-12 Apr-12 Jun-12 Aug-12 Oct-12 Dec-12 Feb-13 GREE N Finance and Activity
Nottingham University Hospitals Emergency Department Quality Issues Related to Performance
 RCCG/GB/14/123 Nottingham University Hospitals Emergency Department Quality Issues Related to Performance Introduction NUH have failed to meet the 95% 4 hour wait standard for a number of consecutive months.
SUMMARY REPORT TRUST BOARD 1 March 2018 Agenda Number: 07
 SUMMARY REPORT TRUST BOARD 1 March 218 Agenda Number: 7 Title of Report Accountable Officer Author(s) Purpose of Report Recommendation Consultation Undertaken to Date Signed off by Executive Owner Integrated
SOUTHAMPTON UNIVERSITY HOSPITALS NHS TRUST Trust Key Performance Indicators May Regular report to Trust Board
 SOUTHAMPTON UNIVERSITY HOSPITALS NHS TRUST Trust Key Performance Indicators May 20 Report to: Trust Board July 20 Report from: Sponsoring Executive: Aim of Report/Principle Topic: Review History to date:
Overall rating for this trust Good. Inspection report. Ratings. Are services safe? Requires improvement. Are services effective?
 Barnsley Hospital NHS Foundation Trust Inspection report Gawber Road Barnsley South Yorkshire S75 2EP Tel: 01226 730000 www.barnsleyhospital.nhs.uk Date of inspection visit: 17 to 19 October, 15 to 17
Performance and Quality Report Sean Morgan Director of Performance and Delivery Mary Hopper Director of Quality Dino Pardhanani, Clinical Director
 Sutton CCG Clinical Commissioning Group Governing Body Date Thursday, 06 September 2018 Document Title Lead Director (Name and Role) Clinical Sponsor (Name and Role) Performance and Quality Report Sean
Associate Director of Patient Safety and Quality on behalf of the Director of Nursing and Clinical Governance
 APPENDIX 5 BOARD OF DIRECTORS 18 JUNE 2014 Report to: Report from: Subject: Board of Directors Associate Director of Patient Safety and Quality on behalf of the Director of Nursing and Clinical Governance
NHS England London Southside 4th Floor 105 Victoria Street London SW1E 6QT. 24 th July Dear Daniel, Fiona and Louise. Re: CCG Annual Assurance
 NHS England London Southside 4th Floor 105 Victoria Street London SW1E 6QT 24 th July 2014 Dear Daniel, Fiona and Louise Re: CCG Annual Assurance Many thanks for meeting with us on 6 th June 2014 to discuss
Board of Director s Meeting
 Board of Director s Meeting Meeting Date: 15 November 212 Agenda item: 6.1 Title: Purpose: Summary: Recommendation: Author: Presented by: QUALITY AND PATIENT SAFETY ASSURANCE COMMITTEE To provide an exception
Quality Accounts: Corroborative Statements from Commissioning Groups. Nottingham NHS Treatment Centre - Corroborative Statement
 Quality Accounts: Corroborative Statements from Commissioning Groups Quality Accounts are annual reports to the public from providers of NHS healthcare about the quality of services they deliver. The primary
SOUTHAMPTON UNIVERSITY HOSPITALS NHS TRUST Trust Key Performance Indicators April Regular report to Trust Board
 SOUTHAMPTON UNIVERSITY HOSPITALS NHS TRUST Trust Key Indicators April 2011 Report to: Trust Board 24 May 2011 Report from: Sponsoring Executive: Aim of Report / Principle Topic: Review History to date:
RBCH Actions to meet CQC Essential Standards
 RBCH Actions to meet CQC Essential Standards REGULATION 17 How the regulation was not being met Patients, their relatives, and staff told us about incidents where people had not been treated with dignity
Quarter /13 Quality Account (Quality and Safety)
") Airedale NHS Foundation Trust Board of Directors:23 rd January 213 Title: Quarter 2 212/13 Quality Account (Quality and Safety) Author: Alison Fuller, Assistant Director Healthcare Quarter 2 212/13 Quality
Airedale NHS Foundation Trust Board of Directors:23 rd January 213 Title: Quarter 2 212/13 Quality Account (Quality and Safety) Author: Alison Fuller, Assistant Director Healthcare Quarter 2 212/13 Quality
ESHT Our ambition to be outstanding by 2020
 ESHT 2020 Our ambition to be outstanding by 2020 June 2018 1 Contents Page 3 Page 4 Page 6 Page 8 Background 2017/18 progress Vision, values and objectives CQC ratings Page 10 What we will have achieved
2017/18 Trust Balanced Scorecard
 ITEM 8b ENC 9 2017/18 Trust Balanced Scorecard Author: Performance Management Team March 2017 The purpose of this paper is to provide an update on the development of the 2017/18 Balanced Scorecard for
Annual Complaints Report 2014/15
 Annual Complaints Report 2014/15 1.0 Introduction This report provides information in regard to complaints and concerns received by The Rotherham NHS Foundation Trust between 01/04/2014 and 31/03/2015.
Commissioning for quality and innovation (CQUIN): 2013/14 guidance. Draft December 2012
: 2013/14 guidance. Draft December 2012") Commissioning for quality and innovation (CQUIN): 2013/14 guidance Draft December 2012 1 Commissioning for quality and innovation (CQUIN): 2013/14 guidance First published: December 2012 This document
Commissioning for quality and innovation (CQUIN): 2013/14 guidance Draft December 2012 1 Commissioning for quality and innovation (CQUIN): 2013/14 guidance First published: December 2012 This document
NHS Performance Statistics
 NHS Performance Statistics Published: 8 th March 218 Geography: England Official Statistics This monthly release aims to provide users with an overview of NHS performance statistics in key areas. Official
Newham Borough Summary report
 Newham Borough Summary report March 2013 Prepared on 18/03/13 by Commissioning Support team Finance and Activity Millions Apr-11 Jun-11 Aug-11 Oct-11 Dec-11 Newham Headlines March 2013 Feb-12 Apr-12 Jun-12
NHS DORSET CLINICAL COMMISSIONING GROUP GOVERNING BODY MEETING FINANCIAL POSITION AS AT 30TH NOVEMBER C Hickson, Head of Management Accounts
 NHS DORSET CLINICAL COMMISSIONING GROUP GOVERNING BODY MEETING FINANCIAL POSITION AS AT 30TH NOVEMBER 2013 Date of the meeting 15/01/2014 Author Sponsoring GB member Purpose of report Recommendation Resource
NHS performance statistics
 NHS performance statistics Published: 8 th February 218 Geography: England Official Statistics This monthly release aims to provide users with an overview of NHS performance statistics in key areas. Official
Integrated Performance Report August 2017
 Integrated Performance Report Contents Section Page High Level Dashboard Balanced scorecard 3 Domain Scorecards and Director Commentaries Operational Performance 4 Quality and Patient Safety 9 Workforce
Integrated Performance Report Executive Summary (for NHS Fife Board Meeting) Produced in February 2018
 Produced in February 2018") 6b Integrated Performance Report Executive Summary (for NHS Fife Board Meeting) Produced in February 2018 2 Contents Integrated Performance Report: Executive Summary 5 Clinical Governance: Chair and Committee
6b Integrated Performance Report Executive Summary (for NHS Fife Board Meeting) Produced in February 2018 2 Contents Integrated Performance Report: Executive Summary 5 Clinical Governance: Chair and Committee
Governing Body. TITLE OF REPORT: Performance Report for period ending 31st December 2012
 - Governing Body DATE OF MEETING: TITLE OF REPORT: Performance Report for period ending 31st December 2012 KEY MESSAGES: We are responsible for securing improvements in the quality of care and health outcomes.
NHS Ashford Clinical Commissioning Group. Integrated Performance Report. November 2013
 NHS Ashford Clinical Commissioning Group Integrated Performance Report November 2013 Page 1 Contents Executive Summary... 6 Assurance Framework Overview... 10 Are local people getting good quality care?...
Patient Safety & Clinical Quality Committee Chair s Report. Sue Hayter, Governing Body Registered Nurse Member
 Agenda Item: 10.2 Subject: Presented by: Patient Safety & Clinical Quality Committee Chair s Report Sue Hayter, Governing Body Registered Nurse Member Submitted to: NHS West Norfolk CCG Governing Body,
NHS Fylde and Wyre CCG Performance Dashboard
 Governing Body January 2016 NHS Fylde and Wyre CCG Performance Dashboard October 2015 (Month 7) Governing Body This report provides a high level summary of performance and activity and across Fylde and
OPERATIONAL PERFORMANCE REPORT: March Swindon Community Health Services Overview
 OPERATIONAL PERFORMANCE REPORT: March 2018 Swindon Community Health Services Overview 1.0 Introduction This overview brings to the attention of committee members the key areas of Community Health Service
NHS Wales Delivery Framework 2011/12 1
 1. Introduction NHS Wales Delivery Framework for 2011/12 NHS Wales has made significant improvements in targeted performance areas over recent years. This must continue and be associated with a greater
Summarise the Impact of the Health Board Report Equality and diversity
 AGENDA ITEM 4.1 Health Board Report INTEGRATED PERFORMANCE DASHBOARD Executive Lead: Director of Planning and Performance Author: Assistant Director of Performance and Information Contact Details for further
We are the regulator: Our job is to check whether hospitals, care homes and care services are meeting essential standards.
 Inspection Report We are the regulator: Our job is to check whether hospitals, care homes and care services are meeting essential standards. Spire Wellesley Hospital Eastern Avenue, Southend-on-Sea, SS2
Integrated Performance Report
 ENC Bi Integrated Performance Report M1 2014/15 26 June 2014 Contents 1. Structure of the Document... 3 2. Southwark CCG and Providers Performance Summary Dashboard... 4 3. Southwark CCG Dashboard... 5
RTT Recovery Planning and Trajectory Development: A Cambridge Tale
 RTT Recovery Planning and Trajectory Development: A Cambridge Tale Linda Clarke Head of Operational Performance Addenbrooke s Hospital I Rosie Hospital Apr 2014 May 2014 Jun 2014 Jul 2014 Aug 2014 Sep
EAST AND NORTH HERTFORDSHIRE NHS TRUST
 Agenda item: 5 EAST AND NORTH HERTFORDSHIRE NHS TRUST Minutes of the Trust Board meeting held in public on Wednesday 24 July 2013 at 2pm in the Post Graduate Centre, QEII Hospital. Present: Mr Ian Morfett
THE NEWCASTLE UPON TYNE HOSPITALS NHS FOUNDATION TRUST
 THE NEWCASTLE UPON TYNE HOSPITALS NHS FOUNDATION TRUST Agenda item A5(iii) PROVIDING CLINICAL ASSURANCE: CLINICAL ASSURANCE TOOLKIT (CAT), NURSE STAFFING, FRIENDS & FAMILY TEST (FFT) A SUMMARY REPORT EXECUTIVE
TAMESIDE & GLOSSOP INTEGRATED CARE NHS FOUNDATION TRUST
 TAMESIDE & GLOSSOP INTEGRATED CARE NHS FOUNDATION TRUST Report to Public Trust Board meeting of the 25 th May 2017 Agenda Item 7b Title Sponsoring Executive Director Author (s) Purpose Previously considered
Our Achievements. CQC Inspection 2016
 Our Achievements CQC Inspection 2016 Issued February 2017 HOW FAR WE VE COME SAFE Last year, we set out our achievements in a document for staff and patients. It was extremely well received, and as a result,
APPENDIX 7C BENEFITS REALISATION PLAN
 APPENDIX 7C BENEFITS REALISATION PLAN 150804 Shropshire Future Fit SOC v2.2 Appendices APPENDICES Draft Benefits Realisation Plan V0.9 150415 FutureFit Benefits Realisation Plan V0.9 Page 1 The purpose
Trust Board Meeting: Wednesday 13 May 2015 TB
 Trust Board Meeting: Wednesday 13 May 2015 Title Update on Quality Governance Framework Status History For information, discussion and decision This paper has been presented to Quality Committee in April
Quality Framework Healthier, Happier, Longer
 Quality Framework 2015-2016 Healthier, Happier, Longer Telford & Wrekin Clinical Commissioning Group (CCG) makes quality everyone s business. Our working processes are designed to ensure we all have the
Learning from Deaths - Mortality Report
 Learning from Deaths - Mortality Report NHS Improvement and the National Quality Board have requested all NHS Trusts to publish a review of mortality by. This is our Trust report. 1. Background In line
Integrated Performance Report. NHS Rotherham Board 6 July 2011
 Integrated Performance Report NHS Rotherham Board 6 July 2 CONTENTS Introduction Pg 2 Efficiency Pg 3-6 Rotherham Outcomes Pg 7- Contract Performance Pg -13 Finance Pg 14-15 1 INTRODUCTION Report format..
INTEGRATED PERFORMANCE REPORT
 APPENDIX 1 INTEGRATED PERFORMANCE REPORT BOARD OF DIRECTORS 17 FEBRUARY 2016 1 Contents Section Page Executive Summary 3 Trust Performance Overview 7 Trust Performance Report by Exception 9 MSSA bacteraemia
Integrated Quality Report
 Integrated Quality Report Data provided by Patient Services and the Clinical Governance and Risk Department June 2018 Included this month: Health-care Associated Infections Patient Falls Pressure Ulcers
MERTON CLINICAL COMMISSIONING GROUP GOVERNING BODY
 MERTON CLINICAL COMMISSIONING GROUP GOVERNING BODY Date of Meeting: 23 rd March 2017 Agenda No: 9.3 Attachment: 15 Title of Document: CCG Governing Body Assurance Report & Scorecards: Month 9 Quality &
Dudley & Walsall Mental Health Partnership NHS Trust Board
 Dudley & Walsall Mental Health Partnership NHS Trust Board Date of Board Meeting: 29 th July 2 Subject: Performance Corporate Dashboard Month 3 Trust Board Lead: Jacky O Sullivan, Director of Performance
Care Quality Commission (CQC) Inspection Briefing
 Inspection Briefing") Care Quality Commission (CQC) Inspection Briefing The CQC exists to make sure hospitals, care homes, dental and GP surgeries, and all other care services in England provide people with safe, effective,
Care Quality Commission (CQC) Inspection Briefing The CQC exists to make sure hospitals, care homes, dental and GP surgeries, and all other care services in England provide people with safe, effective,
QUALITY REPORT. Part A Patient Experience
 QUALITY REPORT Part A Patient Experience 1 Number of complaints Complaints and Patient Advice and Liaison Report 40 Total number of complaints received 30 20 10 Number of complaints received Trendline
We are the regulator: Our job is to check whether hospitals, care homes and care services are meeting essential standards.
 Inspection Report We are the regulator: Our job is to check whether hospitals, care homes and care services are meeting essential standards. Queen Elizabeth Medical Centre Edgbaston, Birmingham, B15 2TH
Supporting all NHS Trusts to achieve NHS Foundation Trust status by April Ipswich Hospital NHS Trust NHS East of England Department of Health
 TFA document Supporting all NHS Trusts to achieve NHS Foundation Trust status by April 2014 Tripartite Formal Agreement between: Ipswich Hospital NHS Trust NHS East of England Department of Health Introduction
Measuring for improvement The new CQC hospital programme. Professor Sir Mike Richards Chief Inspector of Hospitals King s Fund 6 th November 2013
 Measuring for improvement The new CQC hospital programme Professor Sir Mike Richards Chief Inspector of Hospitals King s Fund 6 th November 2013 1 Our purpose and role Our purpose We make sure health and
Patient Experience Strategy
 Patient Experience Strategy 2013 2018 V1.0 May 2013 Graham Nice Chief Nurse Putting excellent community care at the heart of the NHS Page 1 of 26 CONTENTS INTRODUCTION 3 PURPOSE, BACKGROUND AND NATIONAL
Learning from Deaths Policy A Framework for Identifying, Reporting, Investigating and Learning from Deaths in Care.
 Learning from Deaths Policy A Framework for Identifying, Reporting, Investigating and Learning from Deaths in Care. Associated Policies Being Open and Duty of Candour policy CG10 Clinical incident / near-miss
NHS DUMFRIES AND GALLOWAY ANNUAL REVIEW 2015/16 SELF ASSESSMENT
 NHS DUMFRIES AND GALLOWAY ANNUAL REVIEW 2015/16 SELF ASSESSMENT Chapter 1 Introduction This self assessment sets out the performance of NHS Dumfries and Galloway for the year April 2015 to March 2016.
Performance of the NHS provider sector for the month ended 31 December 2017
 Performance of the NHS provider sector for the month ended 31 December 2017 Contents Overview Performance comparisons 2.4 Employee expenses pay costs 2.5 NHS provider vacancies 1.0 Operational performance
Mortality Report Learning from Deaths. Quarter
 Mortality Report Learning from Deaths Quarter 3 2017 Introduction In December 2016 the CQC report Learning, Candour and accountability: A review of the way NHS Trusts review and investigate the deaths
We are the regulator: Our job is to check whether hospitals, care homes and care services are meeting essential standards.
 Inspection Report We are the regulator: Our job is to check whether hospitals, care homes and care services are meeting essential standards. Spire Gatwick Park Hospital Povey Cross Road, Horley, RH6 0BB