MBQIP Quality Measure Trends, Data Summary Report #20 November 2016
|
|
|
- Joseph Russell
- 5 years ago
- Views:
Transcription


1 MBQIP Quality Measure Trends, Data Summary Report #20 November 2016 Tami Swenson, PhD Michelle Casey, MS University of Minnesota Rural Health Research Center
2 ABOUT This project was supported by the Federal Office of Rural Health Policy (FORHP), Health Resources and Services Administration (HRSA), U.S. Department of Health and Human Services (HHS) under PHS Grant No. U27RH The information, conclusions and opinions expressed in this paper are those of the authors and no endorsement by FORHP, HRSA, HHS, or the University of Minnesota is intended or should be inferred. For more information on this study, please contact Tami Swenson at THE MEDICARE RURAL HOSPITAL FLEXIBILITY PROGRAM The Medicare Rural Hospital Flexibility Program (Flex Program) is a Federal initiative that provides funding to State Governments to strengthen rural health. It allows small hospitals the flexibility to be licensed as Critical Access Hospital (CAHs); offers cost-based reimbursement for Medicare acute inpatient and outpatient services; encourages the development of rural health networks; and offers grants to States to help implement a CAH program in the context of broader initiatives to strengthen the rural health care infrastructure. The Flex Program was created by Congress in Participating states are required to develop a State rural health care plan that provides for the creation of one or more rural health networks; promotes regionalization of rural health services in the State; and improves access to hospital and other health services for rural residents of the State. Consistent with their rural health care plans, states may designate rural facilities as CAHs. CAHs must be located in a rural area (or an area treated as rural); be more than 35 miles (or 15 miles in areas with mountainous terrain or only secondary roads available) from another hospital or be certified before January 1, 2006 by the State as being a necessary provider of health care services. CAHs are required to make available 24-hour emergency care services that a State determines are necessary. CAHs may have a maximum of 25 acute care and swing beds, and must maintain an annual average length of stay of 96 hours or less for their acute care patients. CAHs are reimbursed by Medicare on a cost basis, i.e., for the reasonable costs of providing inpatient, outpatient and swing bed services. The legislative authority for the Flex Program and cost-based reimbursement for CAHs are described in the Social Security Act, Title XVIII, Sections 1814 and 1820, available at i
3 TABLE OF CONTENTS Key Findings... 1 Introduction... 3 Approach... 3 Patient Engagement Quality... 6 HCAHPS - Composite 1: Communication with Nurses... 8 HCAHPS - Composite 2: Communication with Doctors HCAHPS - Composite 3: Responsiveness of Hospital Staff HCAHPS - Composite 4: Pain Management HCAHPS - Composite 5: Communication about Medicines HCAHPS - Composite 6: Discharge Information HCAHPS - Composite 7: Care Transitions HCAHPS - Question 8: Cleanliness of Hospital Environment HCAHPS - Question 9: Quietness of Hospital Environment HCAHPS - Question 21: Overall Rating of Hospital HCAHPS - Question 22: Willingness to Recommend Care Transitions Quality EDTC-1: Administrative Communication EDTC-2: Patient Information EDTC-3: Vital Signs EDTC-4: Medication Information EDTC-5: Physician or Practitioner Generated Information EDTC-6: Nurse Generated Information EDTC-7: Procedures and Tests Outpatient Quality OP-1: Cardiac Care-Median Time to Fibrinolysis OP-2: Cardiac Care-Fibrinolytic Therapy Received Within 30 Minutes OP-3b: Cardiac Care-Median Time to Transfer for ACI (patients without contraindication) OP-4: Cardiac Care-Aspirin at Arrival OP-5: Cardiac Care-Median Time to ECG OP-6: Surgical Care-Appropriately-Timed Antibiotic Prophylaxis OP-7: Surgical Care-Prophylactic Antibiotic Selection for surgical Patients in Surgery OP-18: ED Throughput-Median Time from Arrival to Departure for Discharged ED Patients OP-20: ED Throughput-Median Time Door to Diagnostic Evaluation OP-21: Pain Management-Median Time to Pain Management for Long Bone Fracture Patient Safety Quality IMM-2: Immunization for Influenza OP-27 / IMM-3: Influenza Vaccination Coverage among Health Personnel Inpatient Quality HF-1: Heart Failure-Discharge Instructions HF-2: Heart Failure-Evaluation of LVS Function HF-3: Heart Failure-ACE Inhibitor/ARB for LVS PN-3b: Pneumonia-Blood Culture Prior to Antibiotic PN-6: Pneumonia-Appropriate First Antibiotic Acronym List References ii
4 KEY FINDINGS Patient Engagement Domain Quarterly trends in CAH national performance showed significant improvement from Q through Q on nine of the original ten Hospital Consumer Assessment of Healthcare Providers and Systems (HCAHPS) measures. The cleanliness of hospital environment measure did not show significant change over this time. The HCAHPS care transitions composite measure, added in Q2 2014, is a potential area for improvement. National CAH performance on this measure from Q through Q was lower than for the other HCAHPS measures and did not change significantly over time. Five of the ten HCAHPS measures had statistically significant improvement in the percent of CAHs performing at the benchmark level. Care Transitions Domain For all CAHs nationally, quarterly trends show significant improvement in performance on all seven Emergency Department Transfer Communication (EDTC) measures from Q through Q EDTC-6, Nurse-generated information, is the EDTC measure with the most room for improvement among CAHs nationally. Five of the seven EDTC measures had statistically significant improvement in the percent of CAHs performing at the benchmark level. Outpatient Domain Six AMI/chest pain outpatient measures (OP-1, OP-2, OP-3b, and OP-5) did not show significant change in quarterly performance for CAHs nationally or in the percent of CAHs performing at the benchmark rate from Q to Q OP-4, aspirin on arrival, showed small but statistically significant declines in performance and in the percent of CAHs performing at the benchmark rate. Quarterly trends in CAH national performance showed significant improvement in performance and the percent of CAHs performing at the benchmark rate for the two outpatient surgical improvement measures, OP-6 and OP-7, from Q to Q These measures have been retired by CMS and consequently from MBQIP. Quarterly trends in CAH national performance and in the percent of CAHs performing at the benchmark rate did not show any significant changes from Q through Q for the two Emergency Department throughput measures, OP-18 and OP-20, or for OP-21, pain management for long bone fractures. 1
5 Patient Safety Domain CAH national performance on IMM-2, the influenza immunization measure, declined from 92.1% in Q to 85.6% in Q4 2015, but then improved to 88.9% in Q Only one quarter of MBQIP data is available for OP-27/IMM-3, the influenza vaccination coverage among health personnel measure. Inpatient Domain Quarterly trends showed significant improvement at the national level for the three inpatient heart failure process of care measures: HF-1 discharge instructions and HF-3 ACEI/ARB for LVS (both Q to Q4 2014) and HF-2 evaluation of LVS function (Q to Q3 2015). Two of the three heart failure measures had statistically significant improvement in the percent of CAHs performing at the benchmark level. All three measures have been retired by CMS and consquently from MBQIP. CAH quarterly performance on the two pneumonia process of care measures, PN-3b blood culture prior to antibiotic (Q to Q4 2014) and PN-6 appropriate initial antibiotic (Q to Q3 2015) did not show significant change at the national level. Both pneumonia measures had statistically significant improvement in the percent of CAHs performing at the benchmark level. The PN measures have been retired by CMS and consequently from MBQIP. Conclusions The number of CAHs reporting MBQIP measures increased significantly from 2011 to Therefore, the performance trends in this report may reflect both changes in which CAHs are reporting data and changes in performance for CAHs that previously reported the measures. Overall, CAH performance nationally has significantly improved on the HCAHPS and EDTC measures. Performance on the inpatient and outpatient measures was mixed. Outpatient surgical improvement and inpatient heart failure measures showed significant improvement, while other outpatient measures and inpatient pneumonia showed no significant changes. The percent of CAHs nationally performing at the benchmark rate varies considerably by measure. Regional trends in performance do not show a clear pattern. A region with the best performance on a measure may not show significant improvement because their performance is at a constant high level. 2
6 INTRODUCTION The Medicare Beneficiary Quality Improvement Project (MBQIP) began in 2011 with the primary goal of assisting Critical Access Hospitals (CAHs) with their quality improvement (QI) initiatives to improve patient care. 1 The voluntary reporting of rural-relevant quality measures had phased implementation stages during its first three years. Phase 1 of MBQIP (Sept Aug.2012) focused on reporting inpatient pneumonia and heart failure measures from the Centers for Medicare and Medicaid Services (CMS) Hospital Compare inpatient core. 2 Phase 2 (Sept Aug.2013) added CMS Hospital Consumer Assessment of Healthcare Providers and Systems (HCAHPS) 3 and outpatient Acute Myocardial Infarction (AMI)/chest pain and surgical care improvement measures. 4 Phase 3 (Sept Aug.2014) added measures focused on Emergency Department Transfer Communications (EDTC) 5 and pharmacist verification of medication orders. For FY 2015 (Sept Aug. 2016) and FY 2016 (Sept Aug. 2017), MBQIP reporting and quality improvement activities were grouped into four quality domains: outpatient care, patient safety, care transitions, and patient engagement. 6 New outpatient and patient safety measures were added to MBQIP, and inpatient and outpatient measures retired by CMS were also retired from MBQIP. PURPOSE This purpose of this report is to examine the trends in MBQIP quality measures from 2011 through The analysis compares quarterly performance rates and trends in benchmark performance at the national and regional levels for 37 MBQIP quality measures. APPROACH The MBQIP data used in this report were submitted by CAHs via a variety of methods, including: QualityNet through CART (the CMS Abstraction and Reporting Tool) or a vendor, QualityNet via secure login, the National Healthcare Safety Network, and State Flex Programs (for the EDTC measures). The data are provided to the Federal Office of Rural Health Policy (FORHP) through a contract with Telligen, the CMS Quality Improvement Organization data warehouse contractor. Summary measures were calculated to compare trends in quarterly performance and reporting. Reporting trends are measured by the number of CAHs reporting at least one of the quality measures within the domain by quarter. Performance trends are calculated by quarter as a percentage rate, median time, or average rate depending on the measure specification and data provided. Performance rates are calculated by summing the numerator count that meet the quality performance conditions for the measure and dividing by the total number that meet the denominator eligibility count at the national, regional, and state levels. For example from the care transitions domain, the performance rate is the sum of the number of ED discharges that completed the recommended communication divided by the total number of eligible ED discharges. Details 3
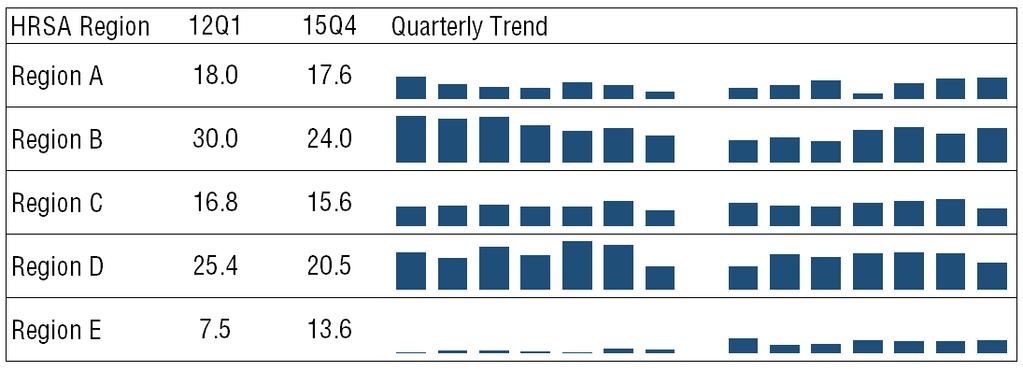
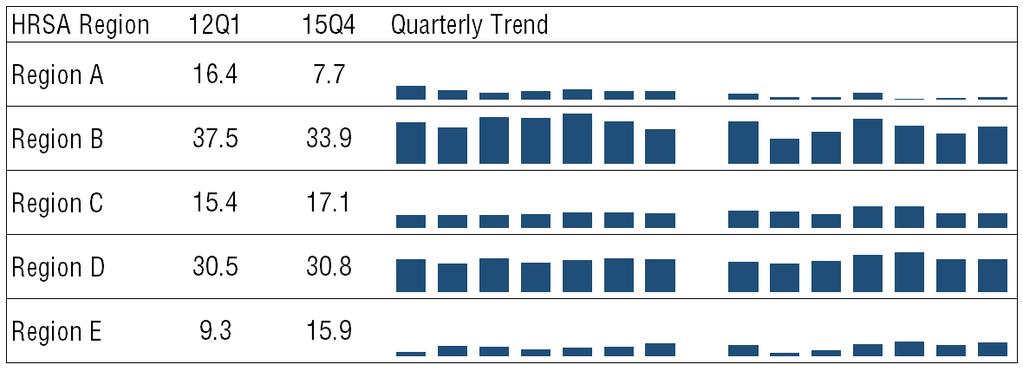
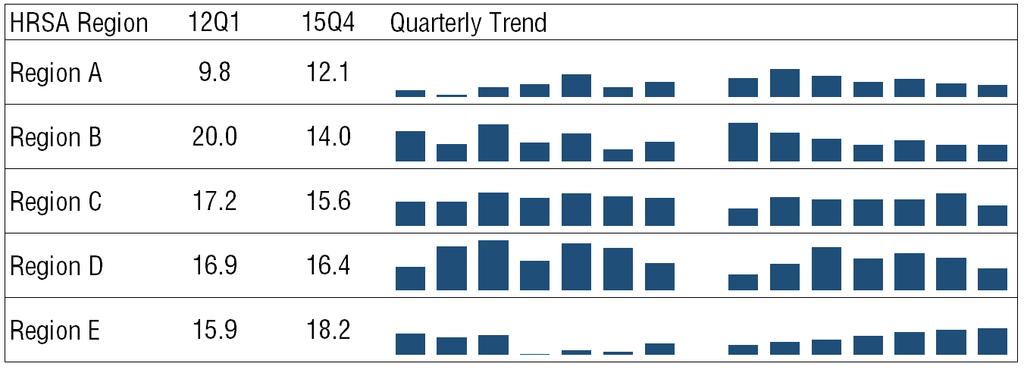
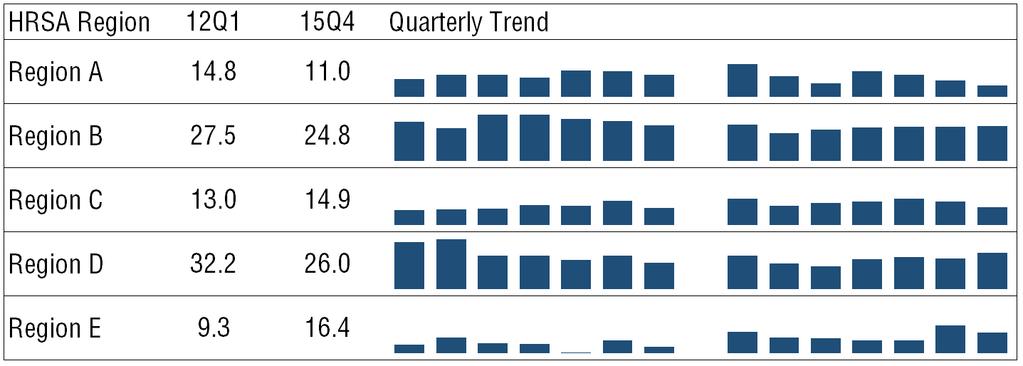
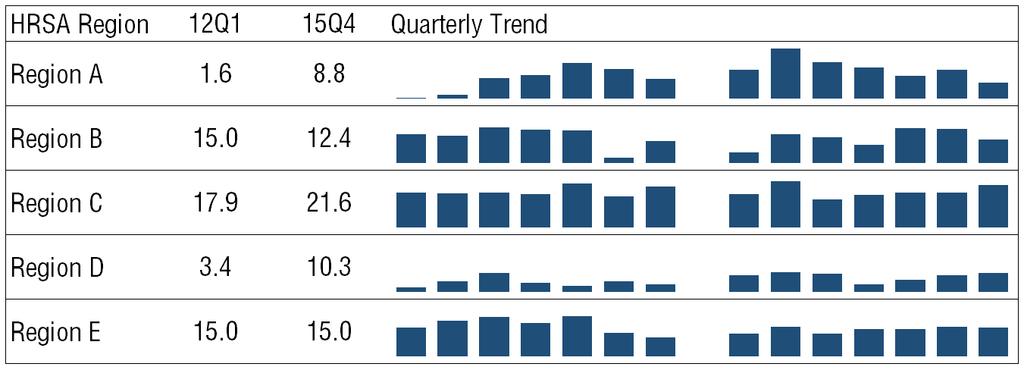
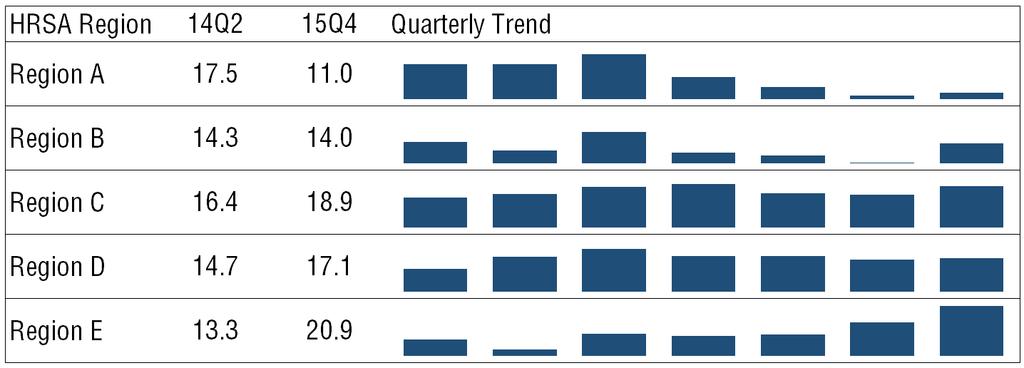
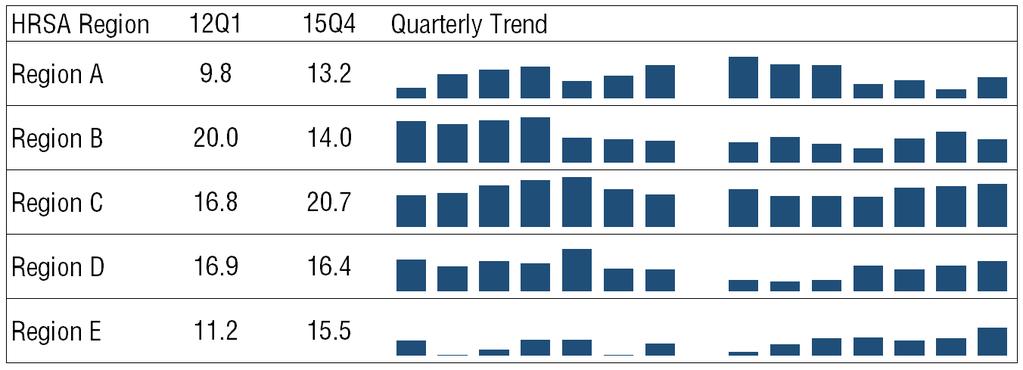
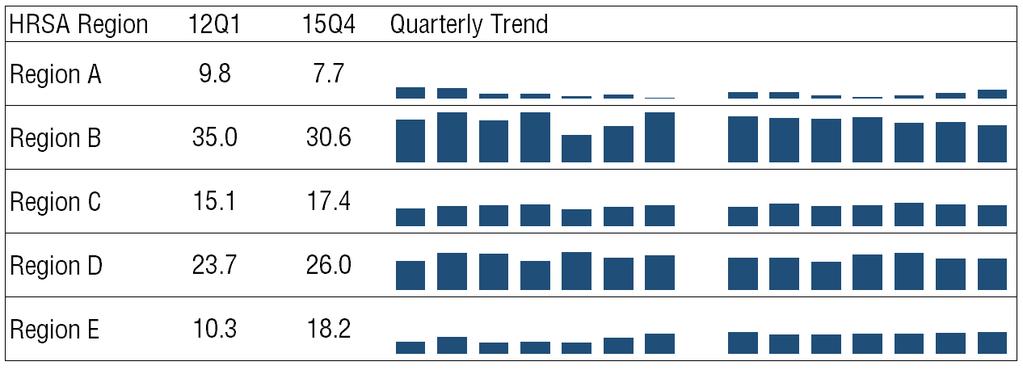
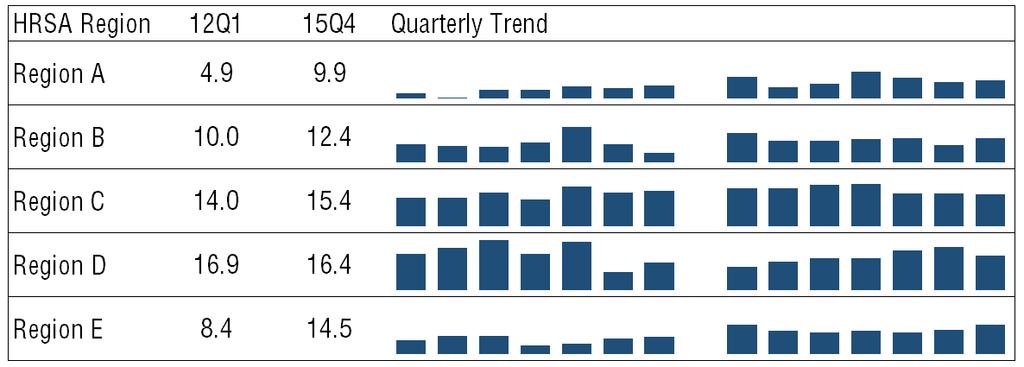
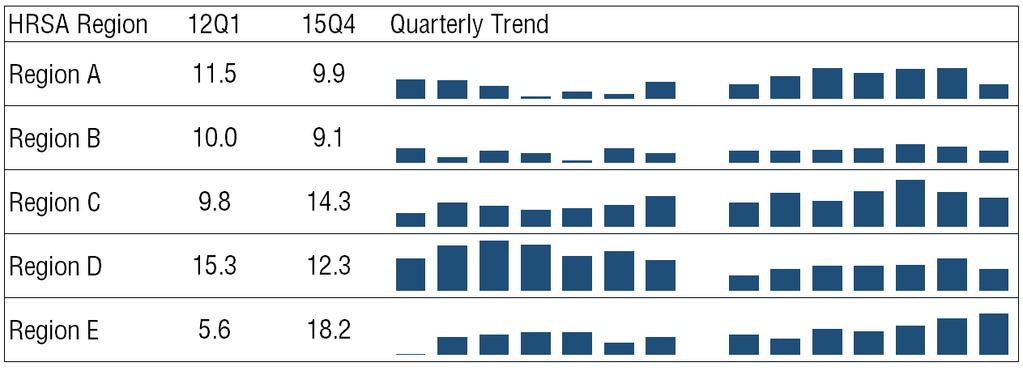
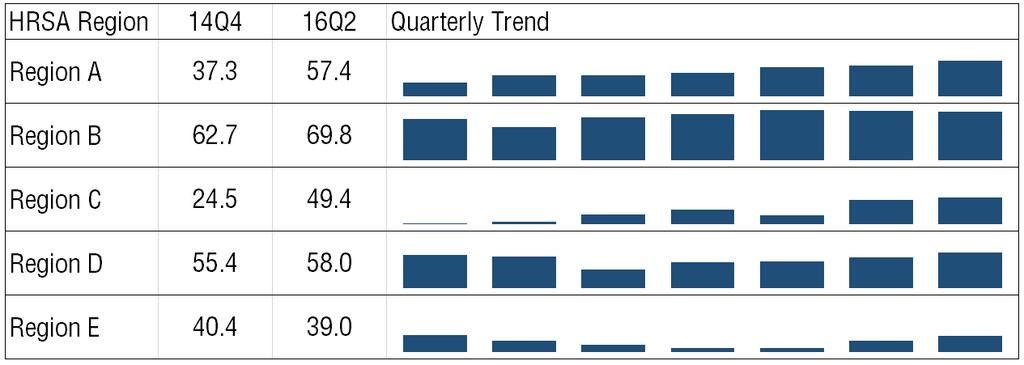
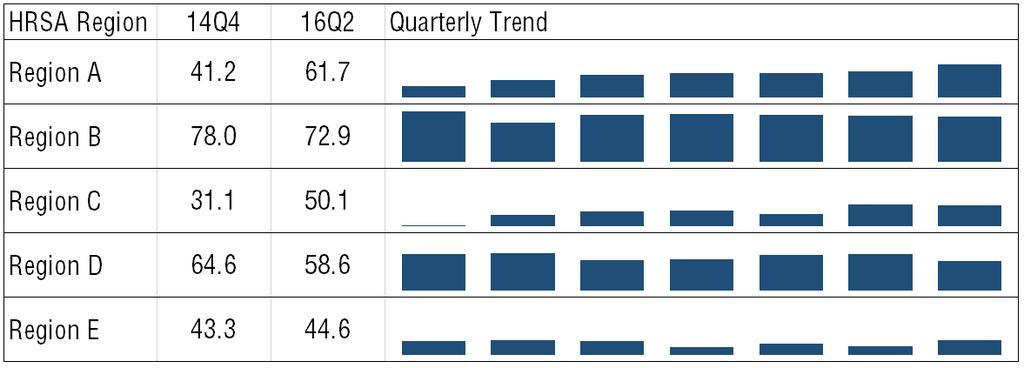
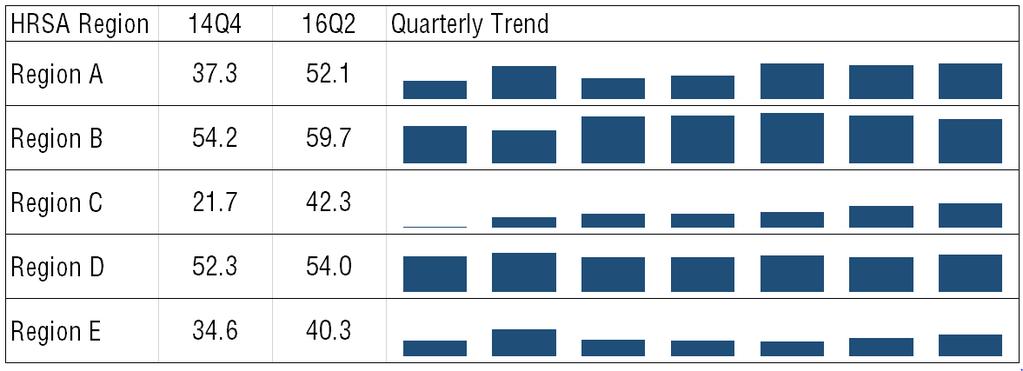
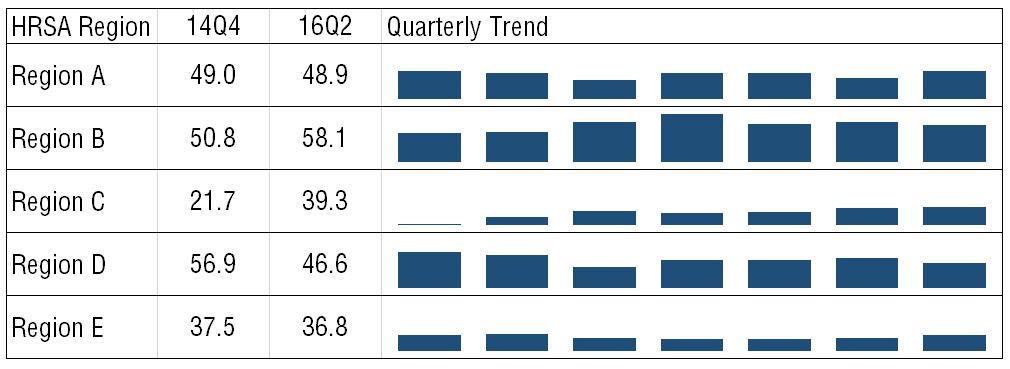
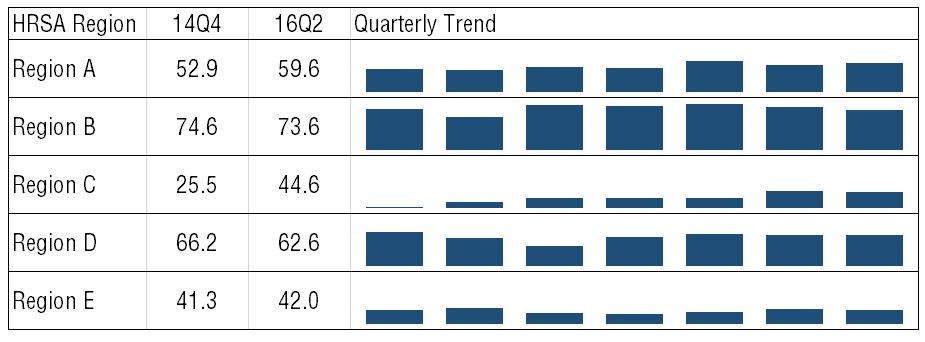
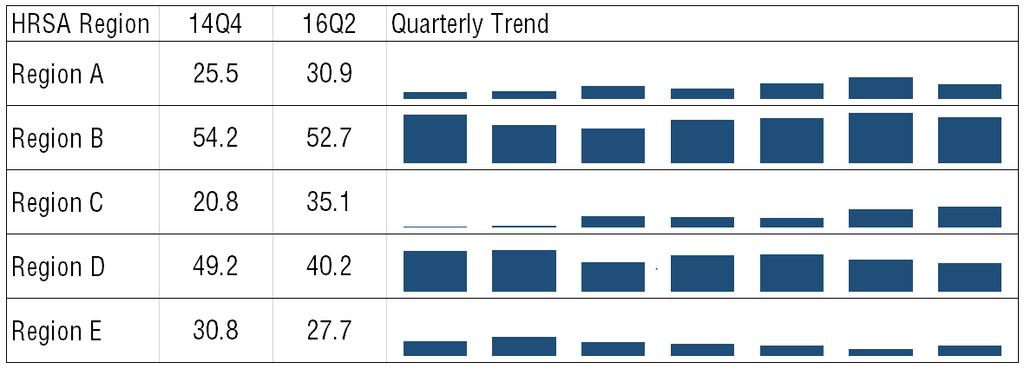
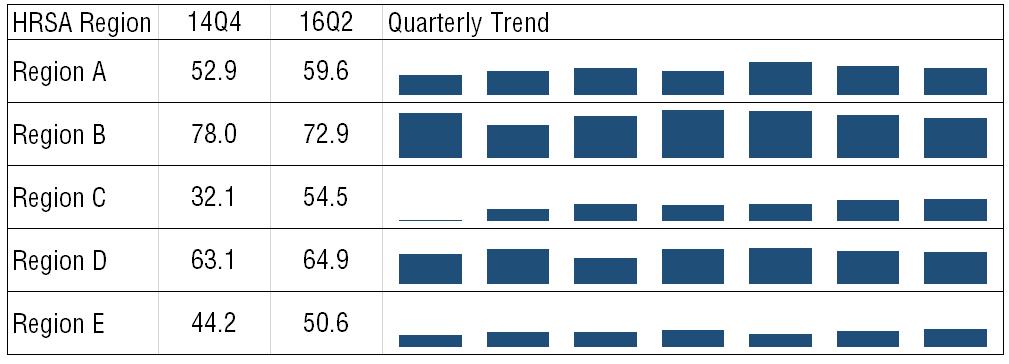
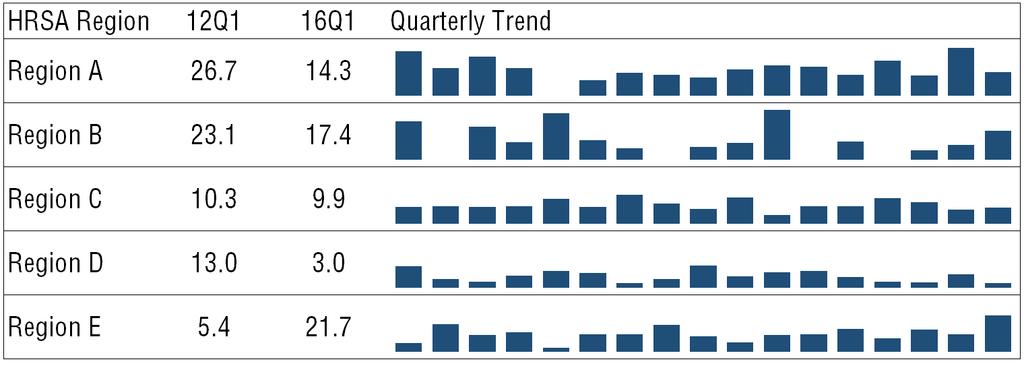
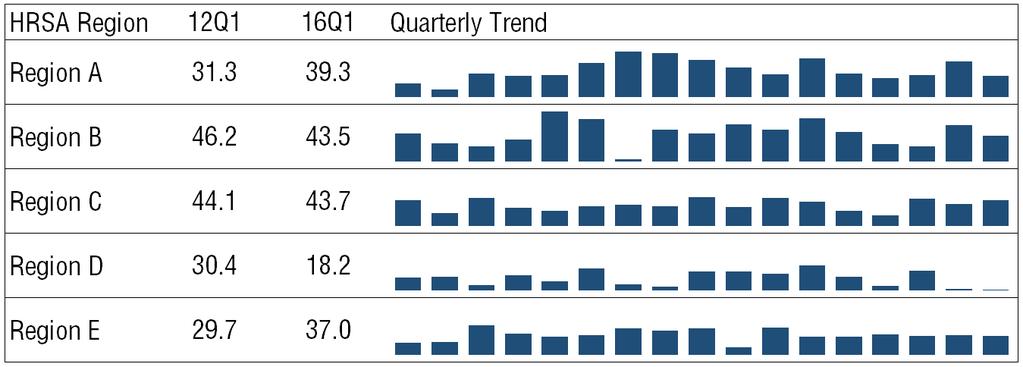
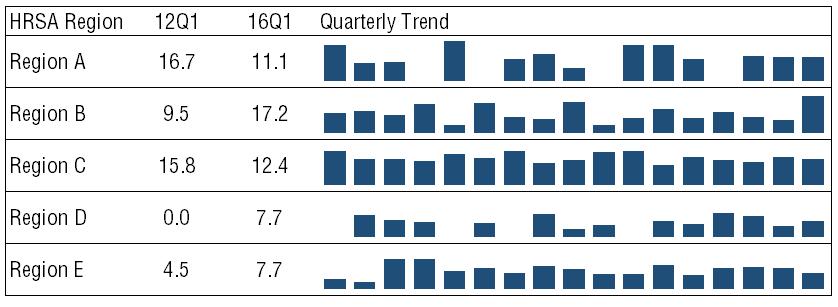
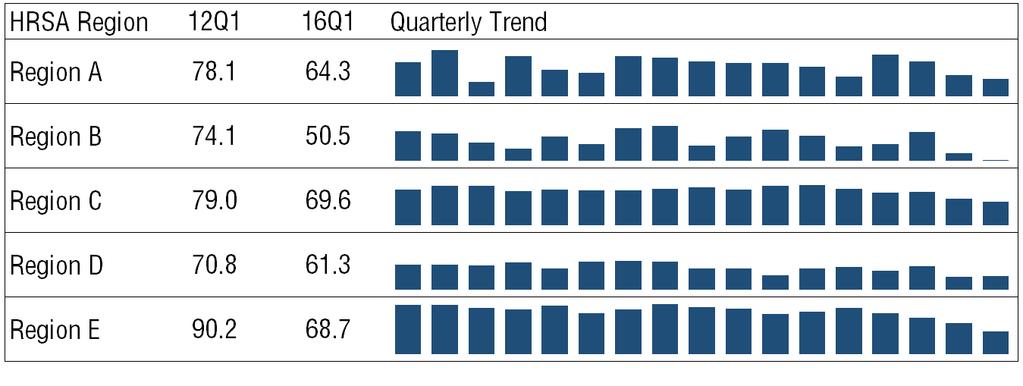
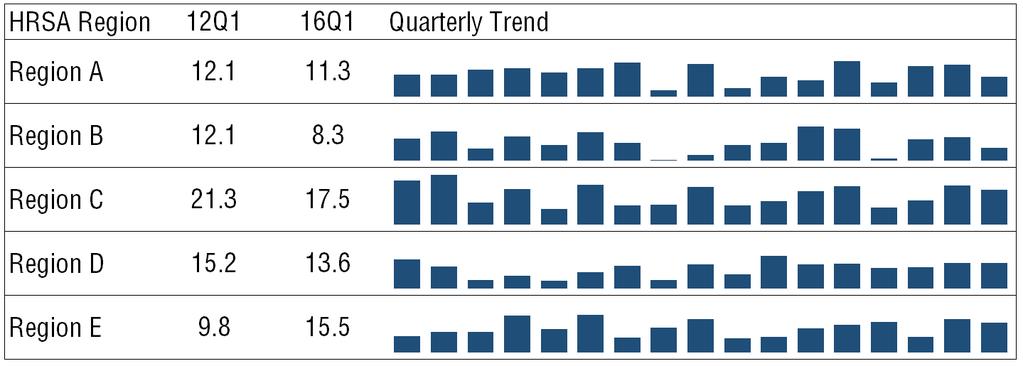
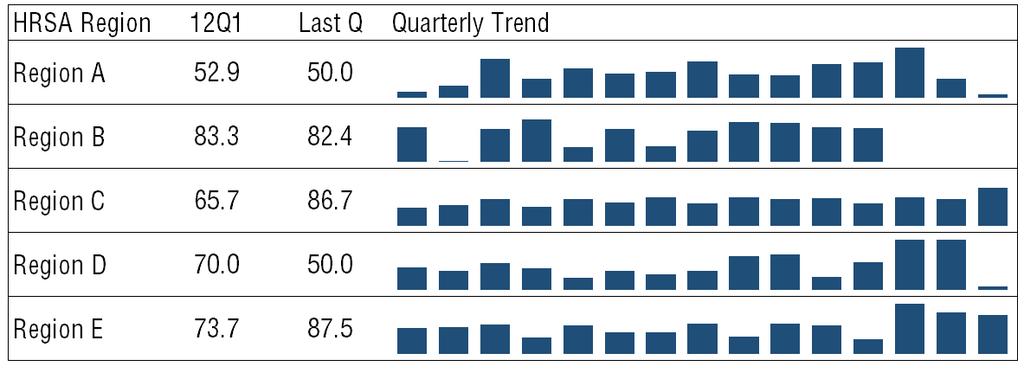
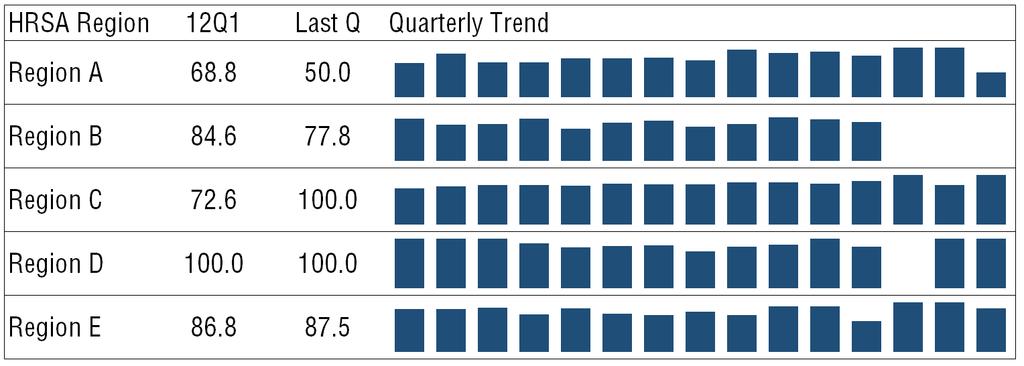
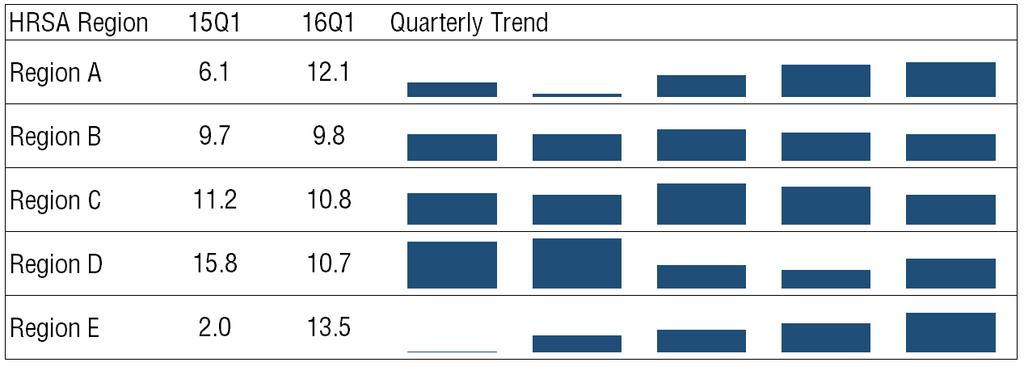
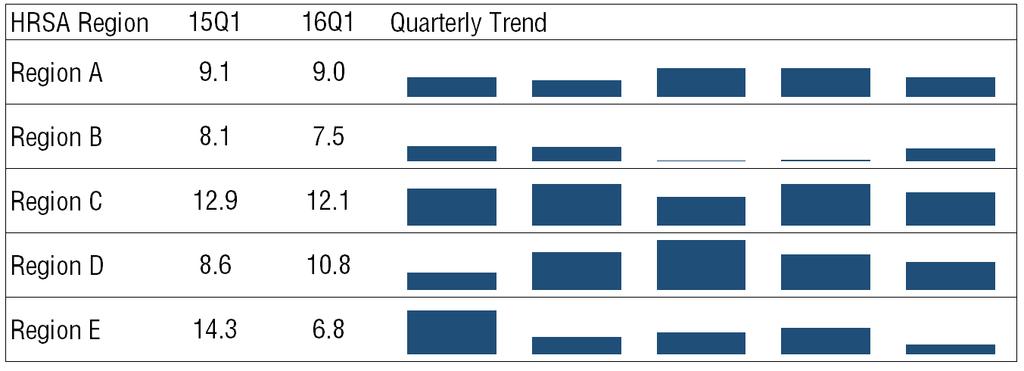
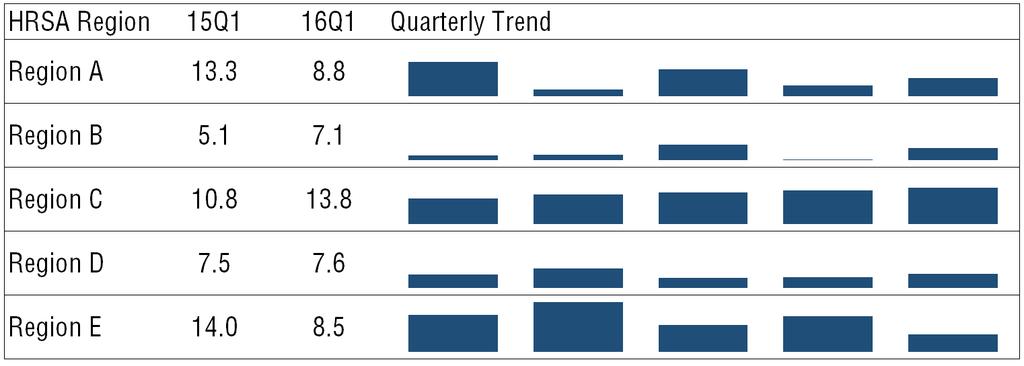
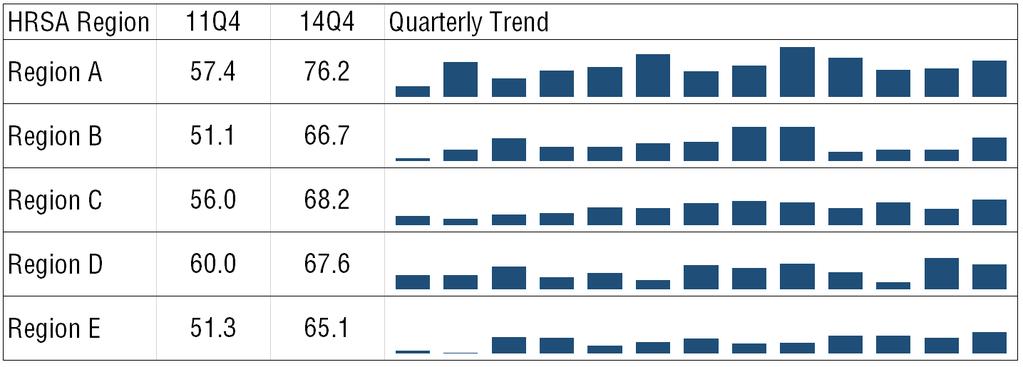
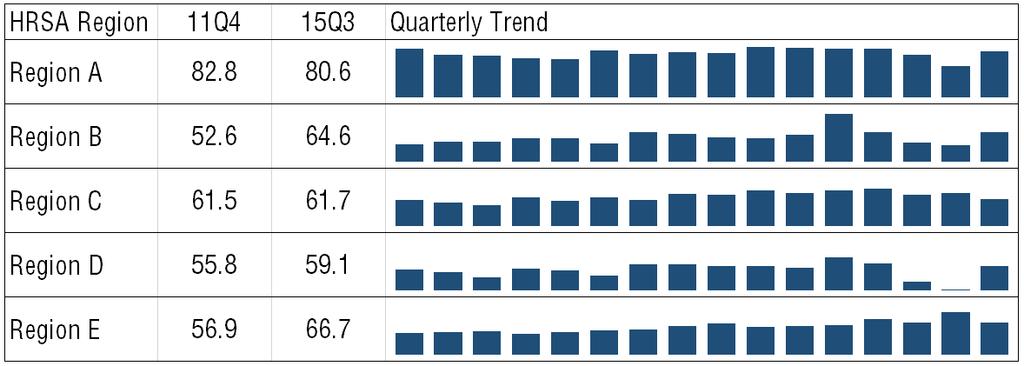
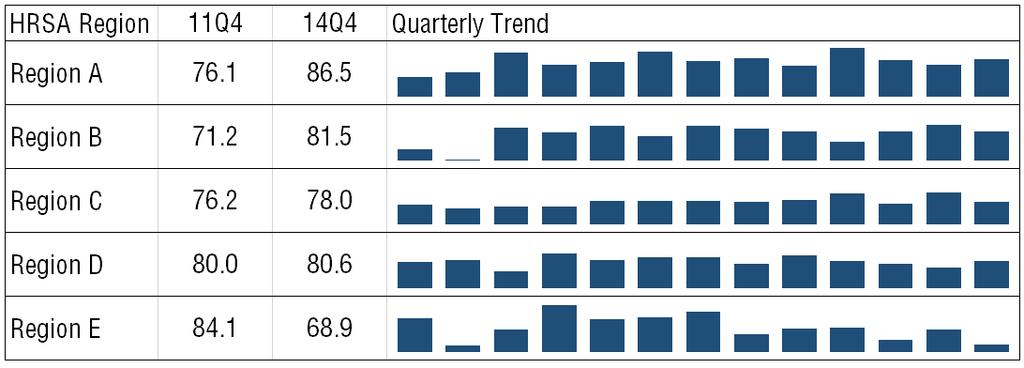
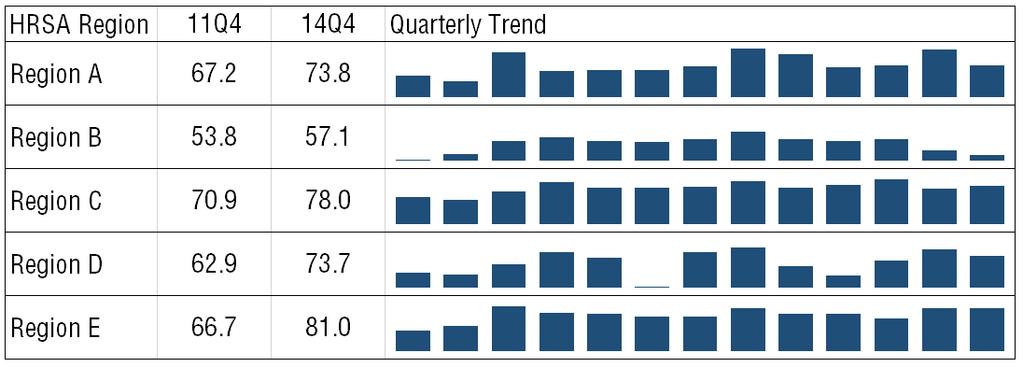
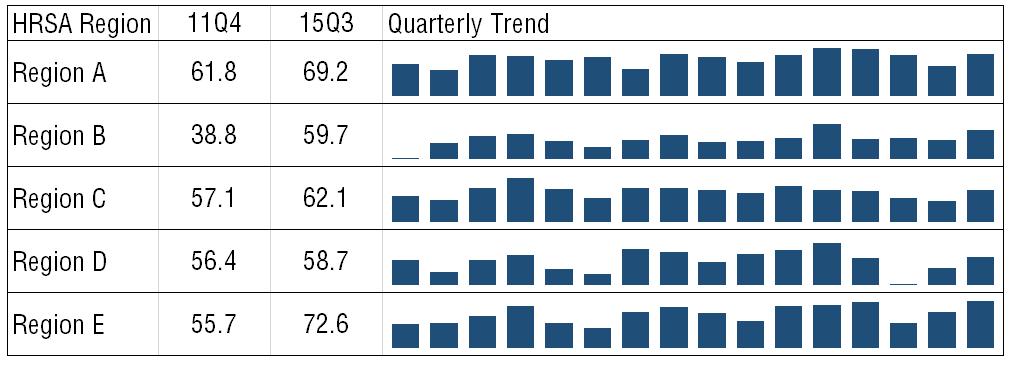
7 for numerator and denominator conditions are provided with the measure descriptions in each domain section. Performance for eight outpatient quality measures that report time processes are calculated by arranging the times by quarter for all CAHs and selecting the median or 50th percentile value, based on the weighted number of patients, for CAHs within the state, region, or nation by quarter. The MBQIP data available for patient safety measure OP-27 / IMM-3 (Influenza Vaccination Coverage among Health Personnel) are computed rates for each CAH. It is not possible to construct a national, regional, or state performance measure similar to the other rate variables because the numerator and denominator CAH-level data for the rate are not provided in the MBQ- IP data file. For this measure, the averages of the CAH performance rates are calculated for the state, regional, or national performance levels. Zero values (or 0%) for the performance rate measures indicate that none of the denominatoreligible count received the recommended care or met the numerator condition of the quality measure. Zero values within the 8 outpatient median time measures are treated as missing data. The national benchmark for each quality measure is defined as the performance level for the top 10% of all CAHs for each reporting quarter. For quality measures that are performance rates, the benchmark level is the 90 th performance percentile. For the outpatient median time measures, the benchmark level is the 10 th percentile because lower values indicate better performance. The report groups CAHs within the 45 Flex Program states in the following HRSA geographical regions: Region A: Maine, Massachusetts, New Hampshire, New York, Pennsylvania, Vermont, Virginia, West Virginia Region B: Alabama, Florida, Georgia, Kentucky, Mississippi, North Carolina, South Carolina, Tennessee Region C: Illinois, Indiana, Iowa, Kansas, Michigan, Minnesota, Missouri, Nebraska, Ohio, Wisconsin Region D: Arizona, Arkansas, California, Hawaii, Louisiana, Nevada, New Mexico, Oklahoma, Texas Region E: Alaska, Colorado, Idaho, Montana, North Dakota, Oregon, South Dakota, Utah, Washington, Wyoming The tables and figures are organized to allow in-depth comparisons of the national, regional, and state trends for each MBQIP measure. The report divides the measures into sections for their respective quality domain groups of patient experience (11 measures), care transitions (7measures), outpatient (12 measures), patient safety (2 measures), and inpatient (5 measures). For each measure, the first set of figures present quarterly performance for the national rate, the top 10% of CAHs benchmark rate, and the regional rates. The second set of figures is the national and regional percentages of CAHs performing at or above the benchmark rate by quarter. The final table for each measure is a comparison of state performance trends. 4
8 For each measure, all quarters of reported performance are included. The trend line for each specific measure starts at the first quarter of CAH reporting and ends with the latest available or last quarter of CAH reporting in the data. Gaps in a trend line indicate that no CAH performance was reported for that quarter, with the exception of two quarters in the patient experience measures and the patient safety influenza immunization measure, IMM-2. No HCAHPS data are available for 4th Quarter, 2013 or 1st Quarter, All patient experience quality measures at the national, regional, and state levels have a gap for these two quarters. For IMM-2, quarterly data are not collected for 2nd and 3rd quarters during the year, and all state, regional, and national performance trends for this measure have gaps for these two quarters. Quarterly HCAHPS data presented in the patient experience section are from surveys during the previous four quarters, which makes comparisons overtime an analysis of a rolling four quarters of data. The tables and figures list the ending quarter. For example, 4Q14 represents HCAHPS survey responses from quarters 1-4 or January through December, 2014, and 1Q15 represents HCAHPS survey responses from 2nd quarter, 2014 through 1st quarter, 2015 or April 2014 through March All other quality measures are for care provided during the reported quarter without any data overlap. Performance rates on the regional and state trend tables for the first and last reporting quarters are provided as reference for scale as the trendline endpoints. The reporting quarters for the regional tables are the same for each region and identified in the table heading. For the state trends, however, the first and last reported quarter for the measure may differ by state for the measure depending on CAH reporting in the state. Quarter markers are delineated on the state trendline so it is possible to determine lead and lag in first and last reporting quarters by comparing states. The Cochran-Armitage trend statistic was calculated to determine if quarterly performance was statistically significant (p<0.05) improvement, decline, or no trend across all quarters of reported data for each measure. For the 8 outpatient quality measures that report a median time for performance, the nonseasonal Mann-Kendall trend statistic was used to test if the quarterly performance trend was statistically significant (p<0.05) or not. The Cochran-Armitage and Mann- Kendall trend tests are descriptive statistics and do not determine the magnitude or distribution (e.g., linearity) of performance trend. For example, quarterly change from 70.1% to 70.2% would measure improvement from one quarter to the next, as does a change from 55% to 70%. The magnitude of change in these two examples is vastly different, but the trend statistic is comparing increases or decreases from one quarter to the next and not amount of change. 5
9
10


11

12
13


14

15
16

17

18

19

20
21 The quarterly trend in national performance shows statistically-significant improvement.
22
23

24


25
26


27
28
29

30


31

32
33
34
35
36

37
38

39
40

41
42
43


44


45 The quarterly trend in the percent of CAHs performing at the EDTC-6 benchmark rate shows no statistically-significant change.


46


47
48 Q1 12Q2 12Q3 12Q4 13Q1 13Q2 13Q3 13Q4 14Q1 14Q2 14Q3 14Q4 15Q1 15Q2 15Q3 15Q4 16Q1
49
50


51
52
53


54
55


56
57


58
59
60

61


62

63

64
65
66
67

68

69
70

71
72
73
74
75


76


77

78
79
80

81


82
83
84
85
86 ACRONYM LIST ACE AMI ARB CAH CMS ECG ED EDTC FORHP HCAHPS HCP HF HRSA IMM LVS LVSD MBQIP OP PN Q QI Angiotensin Converting Enzyme Acute myocardial infarction Angiotensin II Receptor Blocker Critical Access Hospital Centers for Medicare & Medicaid Services Electrocardiogram Emergency Department Emergency Department Transfer Communication Federal Office of Rural Health Policy Hospital Consumer Assessment of Healthcare Providers & Systems Health Care Personnel Heart Failure Health Resources and Services Administration Immunization Left Ventricular Systolic Left Ventricular Systolic Dysfunction Medicare Beneficiary Quality Improvement Project Outpatient Pneumonia Quarter Quality Improvement REFERENCES 1. Federal Office of Rural Health Policy. MBQIP Overview for Flex Coordinators. 2. Centers for Medicare & Medicaid Services QualityNet. Hospital Inpatient Quality Reporting Program Questions and Answers. 3. Centers for Medicare & Medicaid Services. HCAHPS Hospital Quality Initiative Overview. 4. Centers for Medicare & Medicaid Services QualityNet. Hospital Outpatient Quality Reporting Program Questions and Answers. 5. StratisHealth. Rural Emergency Department Transfer Communication Resources. 6. National Rural Health Resource Center. FY 2016 MBQIP Measures Matrix. For more information on this study, please contact Tami Swenson at tswenson@umn.edu This study was conducted by the Flex Monitoring Team with funding from the Federal Office of Rural Health Policy (FORHP), Health Resources and Services Administration (HRSA), U.S. Department of Health and Human Services (HHS), under PHS Grant No. U27RH The information, conclusions, and opinions expressed in this document are those of the authors and no endorsement by FORHP, HRSA, or HHS is intended or should be inferred.
Critical Access Hospitals and HCAHPS
 Critical Access Hospitals and HCAHPS Michelle Casey, MS Senior Research Fellow and Deputy Director University of Minnesota Rural Health Research Center June 12, 2012 Overview of Presentation Why is HCAHPS
 3+ 3+ N = 155, 442 3+ R 2 =.32 < < < 3+ N = 149, 685 3+ R 2 =.27 < < < 3+ N = 99, 752 3+ R 2 =.4 < < < 3+ N = 98, 887 3+ R 2 =.6 < < < 3+ N = 52, 624 3+ R 2 =.28 < < < 3+ N = 36, 281 3+ R 2 =.5 < < < 7+
TABLE 3c: Congressional Districts with Number and Percent of Hispanics* Living in Hard-to-Count (HTC) Census Tracts**
 Census Tracts**") living Alaska 00 47,808 21,213 44.4 Alabama 01 20,661 3,288 15.9 Alabama 02 23,949 6,614 27.6 Alabama 03 20,225 3,247 16.1 Alabama 04 41,412 7,933 19.2 Alabama 05 34,388 11,863 34.5 Alabama 06 34,849 4,074
living Alaska 00 47,808 21,213 44.4 Alabama 01 20,661 3,288 15.9 Alabama 02 23,949 6,614 27.6 Alabama 03 20,225 3,247 16.1 Alabama 04 41,412 7,933 19.2 Alabama 05 34,388 11,863 34.5 Alabama 06 34,849 4,074
WA Flex Program Medicare Beneficiary Quality Improvement Program
 WA Flex Program Medicare Beneficiary Quality Improvement Program Medicare Rural Hospital Flexibility Grant Program Assist CAHs by providing funding to state governments to encourage quality and performance
TABLE 3b: Congressional Districts Ranked by Percent of Hispanics* Living in Hard-to- Count (HTC) Census Tracts**
 Census Tracts**") Rank State District Count (HTC) 1 New York 05 150,499 141,567 94.1 2 New York 08 133,453 109,629 82.1 3 Massachusetts 07 158,518 120,827 76.2 4 Michigan 13 47,921 36,145 75.4 5 Illinois 04 508,677 379,527
Rank State District Count (HTC) 1 New York 05 150,499 141,567 94.1 2 New York 08 133,453 109,629 82.1 3 Massachusetts 07 158,518 120,827 76.2 4 Michigan 13 47,921 36,145 75.4 5 Illinois 04 508,677 379,527
2015 State Hospice Report 2013 Medicare Information 1/1/15
 2015 State Hospice Report 2013 Medicare Information 1/1/15 www.hospiceanalytics.com 2 2013 Demographics & Hospice Utilization National Population 316,022,508 Total Deaths 2,529,792 Medicare Beneficiaries
Index of religiosity, by state
 Index of religiosity, by state Low Medium High Total United States 19 26 55=100 Alabama 7 16 77 Alaska 28 27 45 Arizona 21 26 53 Arkansas 12 19 70 California 24 27 49 Colorado 24 29 47 Connecticut 25 32
The American Legion NATIONAL MEMBERSHIP RECORD
 The American Legion NATIONAL MEMBERSHIP RECORD www.legion.org 2016 The American Legion NATIONAL MEMBERSHIP RECORD 1920-1929 Department 1920 1921 1922 1923 1924 1925 1926 1927 1928 1929 Alabama 4,474 3,246
Hospital Compare Quality Measures: 2008 National and Florida Results for Critical Access Hospitals
 Hospital Compare Quality Measures: National and Results for Critical Access Hospitals Michelle Casey, MS, Michele Burlew, MS, Ira Moscovice, PhD University of Minnesota Rural Health Research Center Introduction
The Medicare Beneficiary Quality Improvement Project (MBQIP) Monthly Performance Improvement Call
 Monthly Performance Improvement Call") The Medicare Beneficiary Quality Improvement Project (MBQIP) Monthly Performance Improvement Call April 16, 2015 Amber Theel, Executive Director Patient Safety Susan Rivera-Lee, WSHA Consultant MBQIP MBQIP
The Medicare Beneficiary Quality Improvement Project (MBQIP) Monthly Performance Improvement Call April 16, 2015 Amber Theel, Executive Director Patient Safety Susan Rivera-Lee, WSHA Consultant MBQIP MBQIP
Unemployment Rate (%) Rank State. Unemployment
 Rank State. Unemployment") States Ranked by February 2018 Unemployment Rate Seasonally Adjusted Unemployment Unemployment Unemployment 1 Hawaii 2.1 19 Alabama 3.7 33 Ohio 4.5 2 New Hampshire 2.6 19 Missouri 3.7 33 Rhode Island 4.5
States Ranked by February 2018 Unemployment Rate Seasonally Adjusted Unemployment Unemployment Unemployment 1 Hawaii 2.1 19 Alabama 3.7 33 Ohio 4.5 2 New Hampshire 2.6 19 Missouri 3.7 33 Rhode Island 4.5
Unemployment Rate (%) Rank State. Unemployment
 Rank State. Unemployment") States Ranked by November 2015 Unemployment Rate Seasonally Adjusted Unemployment Unemployment Unemployment 1 North Dakota 2.7 19 Indiana 4.4 37 Georgia 5.6 2 Nebraska 2.9 20 Ohio 4.5 37 Tennessee 5.6
States Ranked by November 2015 Unemployment Rate Seasonally Adjusted Unemployment Unemployment Unemployment 1 North Dakota 2.7 19 Indiana 4.4 37 Georgia 5.6 2 Nebraska 2.9 20 Ohio 4.5 37 Tennessee 5.6
Unemployment Rate (%) Rank State. Unemployment
 Rank State. Unemployment") States Ranked by April 2017 Unemployment Rate Seasonally Adjusted Unemployment Unemployment Unemployment 1 Colorado 2.3 17 Virginia 3.8 37 California 4.8 2 Hawaii 2.7 20 Massachusetts 3.9 37 West Virginia
States Ranked by April 2017 Unemployment Rate Seasonally Adjusted Unemployment Unemployment Unemployment 1 Colorado 2.3 17 Virginia 3.8 37 California 4.8 2 Hawaii 2.7 20 Massachusetts 3.9 37 West Virginia
Unemployment Rate (%) Rank State. Unemployment
 Rank State. Unemployment") States Ranked by August 2017 Unemployment Rate Seasonally Adjusted Unemployment Unemployment Unemployment 1 North Dakota 2.3 18 Maryland 3.9 36 New York 4.8 2 Colorado 2.4 18 Michigan 3.9 38 Delaware 4.9
States Ranked by August 2017 Unemployment Rate Seasonally Adjusted Unemployment Unemployment Unemployment 1 North Dakota 2.3 18 Maryland 3.9 36 New York 4.8 2 Colorado 2.4 18 Michigan 3.9 38 Delaware 4.9
Unemployment Rate (%) Rank State. Unemployment
 Rank State. Unemployment") States Ranked by March 2016 Unemployment Rate Seasonally Adjusted Unemployment Unemployment Unemployment 1 South Dakota 2.5 19 Delaware 4.4 37 Georgia 5.5 2 New Hampshire 2.6 19 Massachusetts 4.4 37 North
States Ranked by March 2016 Unemployment Rate Seasonally Adjusted Unemployment Unemployment Unemployment 1 South Dakota 2.5 19 Delaware 4.4 37 Georgia 5.5 2 New Hampshire 2.6 19 Massachusetts 4.4 37 North
Unemployment Rate (%) Rank State. Unemployment
 Rank State. Unemployment") States Ranked by September 2017 Unemployment Rate Seasonally Adjusted Unemployment Unemployment Unemployment 1 North Dakota 2.4 17 Indiana 3.8 36 New Jersey 4.7 2 Colorado 2.5 17 Kansas 3.8 38 Pennsylvania
States Ranked by September 2017 Unemployment Rate Seasonally Adjusted Unemployment Unemployment Unemployment 1 North Dakota 2.4 17 Indiana 3.8 36 New Jersey 4.7 2 Colorado 2.5 17 Kansas 3.8 38 Pennsylvania
Unemployment Rate (%) Rank State. Unemployment
 Rank State. Unemployment") States Ranked by December 2017 Unemployment Rate Seasonally Adjusted Unemployment Unemployment Unemployment 1 Hawaii 2.0 16 South Dakota 3.5 37 Connecticut 4.6 2 New Hampshire 2.6 20 Arkansas 3.7 37 Delaware
States Ranked by December 2017 Unemployment Rate Seasonally Adjusted Unemployment Unemployment Unemployment 1 Hawaii 2.0 16 South Dakota 3.5 37 Connecticut 4.6 2 New Hampshire 2.6 20 Arkansas 3.7 37 Delaware
Unemployment Rate (%) Rank State. Unemployment
 Rank State. Unemployment") States Ranked by September 2015 Unemployment Rate Seasonally Adjusted Unemployment Unemployment Unemployment 1 North Dakota 2.8 17 Oklahoma 4.4 37 South Carolina 5.7 2 Nebraska 2.9 20 Indiana 4.5 37 Tennessee
States Ranked by September 2015 Unemployment Rate Seasonally Adjusted Unemployment Unemployment Unemployment 1 North Dakota 2.8 17 Oklahoma 4.4 37 South Carolina 5.7 2 Nebraska 2.9 20 Indiana 4.5 37 Tennessee
Unemployment Rate (%) Rank State. Unemployment
 Rank State. Unemployment") States Ranked by November 2014 Unemployment Rate Seasonally Adjusted Unemployment Unemployment Unemployment 1 North Dakota 2.7 19 Pennsylvania 5.1 35 New Mexico 6.4 2 Nebraska 3.1 20 Wisconsin 5.2 38 Connecticut
States Ranked by November 2014 Unemployment Rate Seasonally Adjusted Unemployment Unemployment Unemployment 1 North Dakota 2.7 19 Pennsylvania 5.1 35 New Mexico 6.4 2 Nebraska 3.1 20 Wisconsin 5.2 38 Connecticut
Unemployment Rate (%) Rank State. Unemployment
 Rank State. Unemployment") States Ranked by July 2018 Unemployment Rate Seasonally Adjusted Unemployment Unemployment Unemployment 1 Hawaii 2.1 19 Massachusetts 3.6 37 Kentucky 4.3 2 Iowa 2.6 19 South Carolina 3.6 37 Maryland 4.3
States Ranked by July 2018 Unemployment Rate Seasonally Adjusted Unemployment Unemployment Unemployment 1 Hawaii 2.1 19 Massachusetts 3.6 37 Kentucky 4.3 2 Iowa 2.6 19 South Carolina 3.6 37 Maryland 4.3
NEW JERSEY HOSPITAL PERFORMANCE REPORT 2012 DATA PUBLISHED 2015 TECHNICAL REPORT: METHODOLOGY RECOMMENDED CARE (PROCESS OF CARE) MEASURES
 MEASURES") NEW JERSEY HOSPITAL PERFORMANCE REPORT 2012 DATA PUBLISHED 2015 TECHNICAL REPORT: METHODOLOGY RECOMMENDED CARE (PROCESS OF CARE) MEASURES New Jersey Department of Health Health Care Quality Assessment
NEW JERSEY HOSPITAL PERFORMANCE REPORT 2012 DATA PUBLISHED 2015 TECHNICAL REPORT: METHODOLOGY RECOMMENDED CARE (PROCESS OF CARE) MEASURES New Jersey Department of Health Health Care Quality Assessment
MEDICARE BENEFICIARY QUALITY IMPROVEMENT PROJECT (MBQIP)
") MEDICARE BENEFICIARY QUALITY IMPROVEMENT PROJECT (MBQIP) Began in September 2011 Key quality improvement activity within the Medicare Rural Hospital Flexibility grant program Goal of MBQIP: to improve
MEDICARE BENEFICIARY QUALITY IMPROVEMENT PROJECT (MBQIP) Began in September 2011 Key quality improvement activity within the Medicare Rural Hospital Flexibility grant program Goal of MBQIP: to improve
Interstate Pay Differential
 Interstate Pay Differential APPENDIX IV Adjustments for differences in interstate pay in various locations are computed using the state average weekly pay. This appendix provides a table for the second
5 x 7 Notecards $1.50 with Envelopes - MOQ - 12
 5 x 7 Notecards $1.50 with Envelopes - MOQ - 12 Magnets 2½ 3½ Magnet $1.75 - MOQ - 5 - Add $0.25 for packaging Die Cut Acrylic Magnet $2.00 - MOQ - 24 - Add $0.25 for packaging 2535-22225 California AM-22225
MAP 1: Seriously Delinquent Rate by State for Q3, 2008
 MAP 1: Seriously Delinquent Rate by State for Q3, 2008 Seriously Delinquent Rate Greater than 6.93% 5.18% 6.93% 0 5.17% Source: MBA s National Deliquency Survey MAP 2: Foreclosure Inventory Rate by State
State of the State: Hospital Performance in Pennsylvania October 2015
 State of the State: Hospital Performance in Pennsylvania October 2015 1 Measuring Hospital Performance Progress in Pennsylvania: Process Measures 2 PA Hospital Performance: Process Measures We examined
Introduction. Current Law Distribution of Funds. MEMORANDUM May 8, Subject:
 MEMORANDUM May 8, 2018 Subject: TANF Family Assistance Grant Allocations Under the Ways and Means Committee (Majority) Proposal From: Gene Falk, Specialist in Social Policy, gfalk@crs.loc.gov, 7-7344 Jameson
NEW JERSEY HOSPITAL PERFORMANCE REPORT 2014 DATA PUBLISHED 2016 TECHNICAL REPORT: METHODOLOGY RECOMMENDED CARE (PROCESS OF CARE) MEASURES
 MEASURES") NEW JERSEY HOSPITAL PERFORMANCE REPORT 2014 DATA PUBLISHED 2016 TECHNICAL REPORT: METHODOLOGY RECOMMENDED CARE (PROCESS OF CARE) MEASURES New Jersey Department of Health Health Care Quality Assessment
NEW JERSEY HOSPITAL PERFORMANCE REPORT 2014 DATA PUBLISHED 2016 TECHNICAL REPORT: METHODOLOGY RECOMMENDED CARE (PROCESS OF CARE) MEASURES New Jersey Department of Health Health Care Quality Assessment
Sentinel Event Data. General Information Copyright, The Joint Commission
 Sentinel Event Data General Information 1995 2015 Data Limitations The reporting of most sentinel events to The Joint Commission is voluntary and represents only a small proportion of actual events. Therefore,
Medicare Beneficiary Quality Improvement Project (MBQIP)
") Medicare Beneficiary Quality Improvement Project (MBQIP) Karla Weng, MPH, CPHQ November 14, 2017 Nebraska CAH Conference on Quality Kearney, NE Stratis Health Independent, nonprofit, Minnesota-based organization
Medicare Beneficiary Quality Improvement Project (MBQIP) Karla Weng, MPH, CPHQ November 14, 2017 Nebraska CAH Conference on Quality Kearney, NE Stratis Health Independent, nonprofit, Minnesota-based organization
HOME HEALTH AIDE TRAINING REQUIREMENTS, DECEMBER 2016
 BACKGROUND HOME HEALTH AIDE TRAINING REQUIREMENTS, DECEMBER 2016 Federal legislation (42 CFR 484.36) requires that Medicare-certified home health agencies employ home health aides who are trained and evaluated
Sentinel Event Data. General Information Q Copyright, The Joint Commission
 Sentinel Event Data General Information 1995 2Q 2014 Data Limitations The reporting of most sentinel events to The Joint Commission is voluntary and represents only a small proportion of actual events.
Hospital Compare Quality Measure Results for Oregon CAHs: 2015
 KEY FINDINGS: Flex Monitoring Team STATE DATA REPORT February 2017 Hospital Compare Quality Measure Results for Oregon : 2015 Michelle Casey, MS; Tami Swenson, PhD; Alex Evenson, MA University of Minnesota
Current Medicare Advantage Enrollment Penetration: State and County-Level Tabulations
 Current Advantage Enrollment : State and County-Level Tabulations 5 Slide Series, Volume 40 September 2016 Summary of Tabulations and Findings As of September 2016, 17.9 million of the nation s 56.1 million
Rutgers Revenue Sources
 Rutgers Revenue Sources 31.2% Tuition and Fees 27.3% State Appropriations with Fringes 1.0% Endowment and Investments.5% Federal Appropriations 17.8% Federal, State, and Municipal Grants and Contracts
Table 6 Medicaid Eligibility Systems for Children, Pregnant Women, Parents, and Expansion Adults, January Share of Determinations
 Table 6 Medicaid Eligibility Systems for Children, Pregnant Women, Parents, and Expansion Adults, January 2017 Able to Make Share of Determinations System determines eligibility for: 2 State Real-Time
STATE INDUSTRY ASSOCIATIONS $ - LISTED NEXT PAGE. TOTAL $ 88,000 * for each contribution of $500 for Board Meeting sponsorship
 Exhibit D -- TRIP 2017 FUNDING SOURCES -- February 3, 2017 CORPORATE $ 12,000 Construction Companies $ 5,500 Consulting Engineers Equipment Distributors Manufacturer/Supplier/Producer 6,500 Surety Bond
Benefits by Service: Outpatient Hospital Services (October 2006)
") Page 1 of 8 Benefits by Service: Outpatient Hospital Services (October 2006) Definition/Notes Note: Totals include 50 states and D.C. "Benefits Covered" Totals "Benefits Not Covered" Totals Is the benefit
Page 1 of 8 Benefits by Service: Outpatient Hospital Services (October 2006) Definition/Notes Note: Totals include 50 states and D.C. "Benefits Covered" Totals "Benefits Not Covered" Totals Is the benefit
CRMRI White Paper #3 August 2017 State Refugee Services Indicators of Integration: How are the states doing?
 CRMRI White Paper #3 August 7 State Refugee Services Indicators of Integration: How are the states doing? Marci Harris, Julia Greene, Kilee Jorgensen, Caren J. Frost, & Lisa H. Gren State Refugee Services
Rankings of the States 2017 and Estimates of School Statistics 2018
 Rankings of the States 2017 and Estimates of School Statistics 2018 NEA RESEARCH April 2018 Reproduction: No part of this report may be reproduced in any form without permission from NEA Research, except
Medicare Beneficiary Quality Improvement Project. March 11, Chillicothe, Mo.
 Medicare Beneficiary Quality Improvement Project March 11, 2015 - Chillicothe, Mo. 1 Welcome and MBQIP Overview 2 Introductions Dana Downing, B.S., MBA, CPHQ Jim Mikes, ScD, MPH Melissa VanDyne, B.S. CAHs
2014 ACEP URGENT CARE POLL RESULTS
 2014 ACEP URGENT CARE POLL RESULTS PREPARED FOR: PREPARED BY: 2014 Marketing General Incorporated 625 North Washington Street, Suite 450 Alexandria, VA 22314 800.644.6646 toll free 703.739.1000 telephone
PRESS RELEASE Media Contact: Joseph Stefko, Director of Public Finance, ;
 PRESS RELEASE Media Contact: Joseph Stefko, Director of Public Finance, 585.327.7075; jstefko@cgr.org Highest Paid State Workers in New Jersey & New York in 2010; Lowest Paid in Dakotas and West Virginia
Iowa Critical Access Hospital. Financial Indicators. Performance Improvement Kickoff Webinar
 Iowa Critical Access Hospital Financial Indicators Performance Improvement Kickoff Webinar 1 Agenda Project Summary Transition Framework Presentation Overview: Financial & Operational Improvement Overview:
Nielsen ICD-9. Healthcare Data
 Nielsen ICD-9 Healthcare Data Healthcare Utilization Model The Nielsen healthcare utilization model has three primary components: demographic cohort population counts, cohort-specific healthcare utilization
Medicare Beneficiary Quality Improvement Project
 Rural Hospital Performance Improvement Medicare Beneficiary Quality Improvement Project Paul Moore, DPh Senior Health Policy Advisor Department of Health and Human Services Health Resources and Services
Child & Adult Care Food Program: Participation Trends 2017
 Child & Adult Care Food Program: Participation Trends 2017 February 2018 About FRAC The Food Research and Action Center (FRAC) is the leading national organization working for more effective public and
Voter Registration and Absentee Ballot Deadlines by State 2018 General Election: Tuesday, November 6. Saturday, Oct 27 (postal ballot)
") Voter Registration and Absentee Ballot Deadlines by State 2018 General Election: All dates in 2018 unless otherwise noted STATE REG DEADLINE ABSENTEE BALLOT REQUEST DEADLINE Alabama November 1 ABSENTEE
Voter Registration and Absentee Ballot Deadlines by State 2018 General Election: All dates in 2018 unless otherwise noted STATE REG DEADLINE ABSENTEE BALLOT REQUEST DEADLINE Alabama November 1 ABSENTEE
Percent of Population Under Age 65 Uninsured, 2013, 2014, and 2015
 Exhiit 1 Percent of Population Under Age 65 Uninsured, 13, 14, and 15 13 14 15
2016 INCOME EARNED BY STATE INFORMATION
 BY STATE INFORMATION This information is being provided to assist in your 2016 tax preparations. The information is also mailed to applicable Columbia fund non-corporate shareholders with their year-end
How North Carolina Compares
 How North Carolina Compares A Compendium of State Statistics March 2017 Prepared by the N.C. General Assembly Program Evaluation Division Preface The Program Evaluation Division of the North Carolina General
Estimated Economic Impacts of the Small Business Jobs and Tax Relief Act National Report
 Regional Economic Models, Inc. Estimated Economic Impacts of the Small Business Jobs and Tax Relief Act National Report Prepared by Frederick Treyz, CEO June 2012 The following is a summary of the Estimated
Statutory change to name availability standard. Jurisdiction. Date: April 8, [Statutory change to name availability standard] [April 8, 2015]
![Statutory change to name availability standard. Jurisdiction. Date: April 8, [Statutory change to name availability standard] [April 8, 2015]](/thumbs/83/87461560.jpg "Statutory change to name availability standard. Jurisdiction. Date: April 8, [Statutory change to name availability standard] [April 8, 2015]") Topic: Question by: : Statutory change to name availability standard Michael Powell Texas Date: April 8, 2015 Manitoba Corporations Canada Alabama Alaska Arizona Arkansas California Colorado Connecticut
Topic: Question by: : Statutory change to name availability standard Michael Powell Texas Date: April 8, 2015 Manitoba Corporations Canada Alabama Alaska Arizona Arkansas California Colorado Connecticut
Critical Access Hospital Quality
 Critical Access Hospital Quality Current Performance and the Development of Relevant Measures Ira Moscovice, PhD Mayo Professor & Head Division of Health Policy & Management School of Public Health, University
Child & Adult Care Food Program: Participation Trends 2016
 Child & Adult Care Food Program: Participation Trends 2016 March 2017 About FRAC The Food Research and Action Center (FRAC) is the leading national organization working for more effective public and private
FY 2014 Per Capita Federal Spending on Major Grant Programs Curtis Smith, Nick Jacobs, and Trinity Tomsic
 Special Analysis 15-03, June 18, 2015 FY 2014 Per Capita Federal Spending on Major Grant Programs Curtis Smith, Nick Jacobs, and Trinity Tomsic 202-624-8577 ttomsic@ffis.org Summary Per capita federal
Rural-Relevant Quality Measures for Critical Access Hospitals
 Rural-Relevant Quality Measures for Critical Access Hospitals Ira Moscovice PhD Michelle Casey MS University of Minnesota Rural Health Research Center Minnesota Rural Health Conference Duluth, Minnesota
Percentage of Enrolled Students by Program Type, 2016
 Percentage of Enrolled Students by Program Type, 2016 Doctorate 4% PN/VN 3% MSN 15% ADN 28% BSRN 22% Diploma 2% BSN 26% n = 279,770 Percentage of Graduations by Program Type, 2016 MSN 12% Doctorate 1%
Table 8 Online and Telephone Medicaid Applications for Children, Pregnant Women, Parents, and Expansion Adults, January 2017
 Table 8 Online and Telephone Medicaid Applications for Children, Pregnant Women, Parents, and Expansion Adults, January 2017 State Applications Can be Submitted Online at the State Level 1 < 25% 25% -
MBQIP Measures Fact Sheets December 2017
 December 2017 This project is supported by the Health Resources and Services Administration (HRSA) of the U.S. Department of Health and Human Services (HHS) under grant number U1RRH29052, Rural Quality
Benefits by Service: Inpatient Hospital Services, other than in an Institution for Mental Diseases (October 2006) Definition/Notes
 Definition/Notes") Page 1 of 9 Benefits by Service: Inpatient Hospital Services, other than in an Institution for Mental Diseases (October 2006) Definition/Notes Note: Totals include 50 states and D.C. "Benefits Covered"
Page 1 of 9 Benefits by Service: Inpatient Hospital Services, other than in an Institution for Mental Diseases (October 2006) Definition/Notes Note: Totals include 50 states and D.C. "Benefits Covered"
THE METHODIST CHURCH (U.S.)
") THE METHODIST LIBRARY CONFERENCE JOURNALS COLLECTION PAGE: 1 ALABAMA 1939-58 ALABAMA WEST FLORIDA 1959-1967 ALASKA MISSION 1941, 1949-1967 ATLANTA 1939-1951 BALTIMORE CALIFORNIA ORIENTAL MISSION 1939-1952
THE METHODIST LIBRARY CONFERENCE JOURNALS COLLECTION PAGE: 1 ALABAMA 1939-58 ALABAMA WEST FLORIDA 1959-1967 ALASKA MISSION 1941, 1949-1967 ATLANTA 1939-1951 BALTIMORE CALIFORNIA ORIENTAL MISSION 1939-1952
Child & Adult Care Food Program: Participation Trends 2014
 Child & Adult Care Food Program: Participation Trends 2014 1200 18th St NW Suite 400 Washington, DC 20036 (202) 986-2200 / www.frac.org February 2016 About FRAC The Food Research and Action Center (FRAC)
YOUTH MENTAL HEALTH IS WORSENING AND ACCESS TO CARE IS LIMITED THERE IS A SHORTAGE OF PROVIDERS HEALTHCARE REFORM IS HELPING
 2 3 4 MENTAL HEALTH AND SUBSTANCE USE CONDITIONS ARE COMMON MOST AMERICANS LACK ACCESS TO CARE OF AMERICAN ADULTS WITH A MENTAL ILLNESS DID NOT RECEIVE TREATMENT ONE IN FIVE REPORT AN UNMET NEED NEARLY
HOPE NOW State Loss Mitigation Data September 2014
 HOPE NOW State Loss Mitigation Data September 2014 Table of Contents Page Definitions 2 Data Overview 3 Table 1 - Delinquencies 4 Table 2 - Foreclosure Starts 7 Table 3 - Foreclosure Sales 8 Table 4 -
November 24, First Street NE, Suite 510 Washington, DC 20002
 820 First Street NE, Suite 510 Washington, DC 20002 Tel: 202-408-1080 Fax: 202-408-1056 center@cbpp.org www.cbpp.org November 24, 2008 TANF BENEFITS ARE LOW AND HAVE NOT KEPT PACE WITH INFLATION But Most
Is this consistent with other jurisdictions or do you allow some mechanism to reinstate?
 Topic: Question by: : Forfeiture for failure to appoint a resident agent Kathy M. Sachs Kansas Date: January 8, 2015 Manitoba Corporations Canada Alabama Alaska Arizona Arkansas California Colorado Connecticut
Table 1 Elementary and Secondary Education. (in millions)
") Revised February 22, 2005 WHERE WOULD THE CUTS BE MADE UNDER THE PRESIDENT S BUDGET? Data Table 1 Elementary and Secondary Education Includes Education for the Disadvantaged, Impact Aid, School Improvement
Revised February 22, 2005 WHERE WOULD THE CUTS BE MADE UNDER THE PRESIDENT S BUDGET? Data Table 1 Elementary and Secondary Education Includes Education for the Disadvantaged, Impact Aid, School Improvement
FORTIETH TRIENNIAL ASSEMBLY
 FORTIETH TRIENNIAL ASSEMBLY MOST PUISSANT GENERAL GRAND MASTER GENERAL GRAND COUNCIL OF CRYPTIC MASONS INTERNATIONAL 1996-1999 -
 Page 1 of 7 Medicaid Benefits Services Covered, Limits, Copayments and Reimbursement Methodologies For 50 States, District of Columbia and the Territories (as of January 2003) CHOOSE SERVICE Go CHOOSE
Medicare Beneficiary Quality Improvement Project (MBQIP) Quality Guide
 Quality Guide") Medicare Beneficiary Quality Improvement Project (MBQIP) Quality Guide April 2015 600 East Superior Street, Suite 404 Duluth, Minnesota 55802 218-727-9390 info@ruralcenter.org Get to know us better: www.ruralcenter.org
Medicare Beneficiary Quality Improvement Project (MBQIP) Quality Guide April 2015 600 East Superior Street, Suite 404 Duluth, Minnesota 55802 218-727-9390 info@ruralcenter.org Get to know us better: www.ruralcenter.org
States Ranked by Annual Nonagricultural Employment Change October 2017, Seasonally Adjusted
 States Ranked by Annual Nonagricultural Employment Change Change (Jobs) Change (Jobs) Change (Jobs) 1 Texas 316,100 19 Nevada 36,600 37 Hawaii 7,100 2 California 256,800 20 Tennessee 34,800 38 Mississippi
How North Carolina Compares
 How North Carolina Compares A Compendium of State Statistics January 2013 Prepared by the N.C. General Assembly Program Evaluation Division Program Evaluation Division North Carolina General Assembly Legislative
Fiscal Year 1999 Comparisons. State by State Rankings of Revenues and Spending. Includes Fiscal Year 2000 Rankings for State Taxes Only
 Fiscal Year 1999 Comparisons State by State Rankings of Revenues and Spending Includes Fiscal Year 2000 Rankings for State Taxes Only January 2002 1 2 published annually by: The Minnesota Taxpayers Association
WikiLeaks Document Release
 WikiLeaks Document Release February 2, 2009 Congressional Research Service Report 98-968 The Hill-Burton Uncompensated Services Program Barbara English, Knowledge Services Group May 9, 2006 Abstract. The
Weights and Measures Training Registration
 Weights and Measures Training Registration Please fill out the form below to register for Weights and Measures training and testing dates. NIST Handbook 44, Specifications, Tolerances and other Technical
HOPE NOW State Loss Mitigation Data December 2016
 HOPE NOW State Loss Mitigation Data December 2016 Table of Contents Page Definitions 2 Data Overview 3 Table 1 - Delinquencies 4 Table 2 - Foreclosure Starts 7 Table 3 - Foreclosure Sales 8 Table 4 - Repayment
National Collegiate Soils Contest Rules
 National Collegiate Soils Contest Rules Students of Agronomy, Soils, and Environmental Sciences (SASES) Revised September 30, 2008 I. NAME The contest shall be known as the National Collegiate Soils Contest
Design for Nursing Home Compare 5-Star Rating System: Users Guide
 Design for Nursing Home Compare 5-Star Rating System: Users Guide December 2008 Contents Introduction...1 Methodology...3 Survey Domain...3 Scoring Rules...3 Rating Methodology...4 Staffing Domain...5
Interstate Turbine Advisory Council (CESA-ITAC)
") Interstate Turbine Advisory Council (CESA-ITAC) Mark Mayhew NYSERDA for Val Stori Clean Energy States Alliance SWAT 4/25/12 Today CESA ITAC, LLC - What, who and why The Unified List - What, why, how and
Interstate Turbine Advisory Council (CESA-ITAC) Mark Mayhew NYSERDA for Val Stori Clean Energy States Alliance SWAT 4/25/12 Today CESA ITAC, LLC - What, who and why The Unified List - What, why, how and
STATE ENTREPRENEURSHIP INDEX
 University of Nebraska - Lincoln DigitalCommons@University of Nebraska - Lincoln Business in Nebraska Bureau of Business Research 12-2013 STATE ENTREPRENEURSHIP INDEX Eric Thompson University of Nebraska-Lincoln,
REGIONAL AND STATE EMPLOYMENT AND UNEMPLOYMENT MAY 2013
 For release 10:00 a.m. (EDT) Friday, June 21, USDL-13-1180 Technical information: Employment: Unemployment: Media contact: (202) 691-6559 sminfo@bls.gov www.bls.gov/sae (202) 691-6392 lausinfo@bls.gov
Fiscal Research Center
 January 2016 Georgia s Rankings Among the States: Budget, Taxes and Other Indicators ABOUT THE FISCAL RESEARCH CENTER Established in 1995, the (FRC) provides nonpartisan research, technical assistance
TENNESSEE TEXAS UTAH VERMONT VIRGINIA WASHINGTON WEST VIRGINIA WISCONSIN WYOMING ALABAMA ALASKA ARIZONA ARKANSAS
 ALABAMA ALASKA ARIZONA ARKANSAS CALIFORNIA COLORADO CONNECTICUT DELAWARE DISTRICT OF COLUMBIA FLORIDA GEORGIA GUAM MISSOURI MONTANA NEBRASKA NEVADA NEW HAMPSHIRE NEW JERSEY NEW MEXICO NEW YORK NORTH CAROLINA
Colorado River Basin. Source: U.S. Department of the Interior, Bureau of Reclamation
 The Colorado River supports a quarter million jobs and produces $26 billion in economic output from recreational activities alone, drawing revenue from the 5.36 million adults who use the Colorado River
EXHIBIT A. List of Public Entities Participating in FEDES Project
 EXHIBIT A List of Public Entities Participating in FEDES Project Alabama Alabama Department of Economic and Community Affairs Alabama Department of Industrial Relations Alaska Department of Labor and Workforce
REGIONAL AND STATE EMPLOYMENT AND UNEMPLOYMENT JUNE 2010
 For release 10:00 a.m. (EDT) Tuesday, July 20, USDL-10-0992 Technical information: Employment: Unemployment: Media contact: (202) 691-6559 sminfo@bls.gov www.bls.gov/sae (202) 691-6392 lausinfo@bls.gov
Date: 5/25/2012. To: Chuck Wyatt, DCR, Virginia. From: Christos Siderelis
 1 Date: 5/25/2012 To: Chuck Wyatt, DCR, Virginia From: Christos Siderelis Chuck Wyatt with the DCR in Virginia inquired about the classification of state parks having resort type characteristics and, if
HIGH SCHOOL ATHLETICS PARTICIPATION SURVEY
 2011-12 HIGH SCHOOL ATHLETICS PARTICIPATION SURVEY Conducted By THE NATIONAL FEDERATION OF STATE HIGH SCHOOL ASSOCIATIONS Based on Competition at the High School Level in the 2011-12 School Year BOYS GIRLS
Acm762 AG U.S. VITAL STATISTICS BY SECTION, 2017 Page 1
 Acm762 AG U.S. VITAL STATISTICS BY SECTION, 2017 Page 1 District Summary Major Worship Total Total -------------------- Adherents -------------------- Service District Churches Membership Boys Girls Men
Fiscal Research Center
 January 2018 Georgia s Rankings Among the States: Budget, Taxes and Other Indicators ABOUT THE FISCAL RESEARCH CENTER Established in 1995, the (FRC) provides nonpartisan research, technical assistance
Fiscal Research Center
 January 2017 Georgia s Rankings Among the States: Budget, Taxes and Other Indicators ABOUT THE FISCAL RESEARCH CENTER Established in 1995, the (FRC) provides nonpartisan research, technical assistance
THE STATE OF GRANTSEEKING FACT SHEET
 1 THE STATE OF GRANTSEEKING FACT SHEET ORG ANIZATIONAL COMPARISO N BY C ENSUS DIV ISION S PRING 2013 The State of Grantseeking Spring 2013 is the sixth semi-annual informal survey of nonprofits conducted
Supplemental Nutrition Assistance Program. STATE ACTIVITY REPORT Fiscal Year 2016
 Supplemental Nutrition Assistance Program ACTIVITY REPORT Fiscal Year 2016 Food and Nutrition Service Supplemental Nutrition Assistance Program Program Accountability and Administration Division September
 Page 1 of 5 Health Reform Medicaid/CHIP Medicare Costs/Insurance Uninsured/Coverage State Policy Prescription Drugs HIV/AIDS Medicaid Benefits Services Covered, Limits, Copayments and Reimbursement Methodologies
STATE AGRICULTURAL ORGANIZATIONS SUPPORTING S. 744 AS APPROVED BY THE SENATE AGRICULTURE COMMITTEE
 STATE AGRICULTURAL ORGANIZATIONS SUPPORTING S. 744 AS APPROVED BY THE SENATE AGRICULTURE COMMITTEE ALABAMA ALASKA ARIZONA Alabama Department of Agriculture & Industries* Alabama Poultry & Egg Association
Hospital Outpatient Quality Reporting Back to the Basics: Critical Access Hospitals
 Hospital Outpatient Quality Reporting Back to the Basics: Critical Access Hospitals Sophia Cherry, RPh, MPH Quality Improvement Specialist Health Services Advisory Group (HSAG) November 9, 2017 HSAG and
NMLS Mortgage Industry Report 2016 Q1 Update
 NMLS Mortgage Industry Report 2016 Q1 Update Released June 10, 2016 Conference of State Bank Supervisors 1129 20 th Street, NW, 9 th Floor Washington, D.C. 20036-4307 NMLS Mortgage Industry Report: 2016Q1
*ALWAYS KEEP A COPY OF THE CERTIFICATE OF ATTENDANCE FOR YOUR RECORDS IN CASE OF AUDIT
 State Alabama Alaska Arizona Arkansas California INSTRUCTIONS FOR CLE ATTENDANCE REPORTING AT IADC 2012 TRIAL ACADEMY Attorney Reporting Method After the CLE activity, fill out the Certificate of Attendance
NMLS Mortgage Industry Report 2017Q2 Update
 NMLS Mortgage Industry Report 2017Q2 Update Released September 18, 2017 Conference of State Bank Supervisors 1129 20 th Street, NW, 9 th Floor Washington, D.C. 20036-4307 NMLS Mortgage Industry Report: