State of Maryland Department of Health and Mental Hygiene
|
|
|
- Monica Mason
- 5 years ago
- Views:
Transcription
1 John M. Colmers Chairman Herbert S. Wong, Ph.D. Vice-Chairman George H. Bone, M.D. Stephen F. Jencks, M.D., M.P.H. Jack C. Keane Bernadette C. Loftus, M.D. Thomas R. Mullen State of Maryland Department of Health and Mental Hygiene Health Services Cost Review Commission 4160 Patterson Avenue, Baltimore, Maryland Phone: Fax: Toll Free: hscrc.maryland.gov Donna Kinzer Executive Director Stephen Ports Principal Deputy Director Policy and Operations David Romans Director Payment Reform and Innovation Gerard J. Schmith Deputy Director Hospital Rate Setting Sule Calikoglu, Ph.D. Deputy Director Research and Methodology 515th MEETING OF THE HEALTH SERVICES COST REVIEW COMMISSION Jan 14, 2015 EXECUTIVE SESSION 12:30 p.m. (The Commission will begin in public session at 12:30 p.m. for the purpose of, upon motion and approval, adjourning into closed session. The open session will resume at 1PM.) 1. Status of Medicare Data Submission and Reconciliation Authority General Provisions Article, PUBLIC SESSION OF THE HEALTH SERVICES COST REVIEW COMMISSION 1:00 p.m. 1. Review of the Minutes from the Executive Session and Public Meeting on December 10, Executive Director s Report 3. New Model Monitoring 4. Docket Status Cases Closed 2278A Johns Hopkins Health System 2280A Johns Hopkins Health System 2279A MedStar Health 2281A Riverside Health 5. Docket Status Cases Open 2265A Holy Cross Hospital 2282A University of Maryland Medical Center 2283A - Johns Hopkins Health System 2284R Garrett County Memorial Hospital 2285R Johns Hopkins Bayview Medical Center 2286A - Johns Hopkins Health System 6. Final Recommendation for Modifications to the MHAC program for FY Final Recommendation on the NSPII Program 8. MHA Letter and Staff Comments regarding Mid-Year Update and Staff 9. Work Group Updates 10. Hearing and Meeting Schedule
2 Executive and Public Session Minutes The minutes will be posted after they are approved at the January 14 th meeting.
3 Executive Director s Report The Executive Director s Report will be distributed during the Commission Meeting
4 New Model Monitoring Report The Report will be distributed during the Commission Meeting
5 Cases Closed The closed cases from last month are listed in the agenda
6 H.S.C.R.C's CURRENT LEGAL DOCKET STATUS (OPEN) AS OF JANUARY 6, 2015 A: PENDING LEGAL ACTION : NONE B: AWAITING FURTHER COMMISSION ACTION: NONE C: CURRENT CASES: Rate Order Docket Hospital Date Decision Must be Analyst's File Number Name Docketed Required by: Issued by: Purpose Initials Status 2265A Holy Cross Hospital 9/5/2014 N/A N/A N/A DNP OPEN 2282A University of Maryland Medical Center 12/4/2014 N/A N/A N/A DNP OPEN 2283A Johns Hopkins Health System 12/8/2014 N/A N/A N/A DNP OPEN 2284R Garrett County Memorial Hospital 12/23/2014 1/22/2015 5/22/2015 IRC CK OPEN 2285R Johns Hopkins Bayview Medical Center 12/23/2014 1/22/2015 5/22/2015 RAT CK OPEN 2286A Johns Hopkins Health System 12/23/2014 N/A N/A N/A DNP OPEN PROCEEDINGS REQUIRING COMMISSION ACTION - NOT ON OPEN DOCKET
7 IN RE: THE APPLICATION FOR * BEFORE THE MARYLAND HEALTH ALTERNATIVE METHOD OF RATE * SERVICES COST REVIEW DETERMINATION * COMMISSION UNIVERSITY OF MARYLAND * DOCKET: 2014 MEDICAL CENTER * FOLIO: 2092 BALTIMORE, MARYLAND * PROCEEDING: 2282A Staff Recommendation January 14, 2015
8 I. INTRODUCTION The University of Maryland Medical Center ( Hospital ) filed an application with the HSCRC on December 4, 2014 requesting approval to continue its participation in a global rate arrangement with BlueCross and BlueShield Association Blue Distinction Centers for selected solid organ transplant services for a period of one year beginning January 3, II. OVERVIEW OF APPLICATION The contract will be held and administered by University Physicians, Inc. (UPI), which is a subsidiary of the University of Maryland Medical System. UPI will manage all financial transactions related to the global price contract including payments to the Hospital and bear all risk relating to services associated with the contract. III. FEE DEVELOPMENT The hospital portion of the global rates was developed by calculating historical charges for patients receiving the procedures for which global rates are to be paid. The remainder of the global rate is comprised of physician service costs. Additional per diem payments were calculated for cases that exceed a specific length of stay outlier threshold. IV. IDENTIFICATION AND ASSESSMENT OF RISK The Hospital will submit bills to UPI for all contracted and covered services. UPI is responsible for billing the payer, collecting payments, disbursing payments to the Hospital at its full HSCRC approved rates, and reimbursing the physicians. The Hospital contends that the arrangement between UPI and the Hospital holds the Hospital harmless from any shortfalls in payment from the global price contract. V. STAFF EVALUATION arrangement. Staff believes that the Hospital can achieve favorable performance under this VI. STAFF RECOMMENDATION The staff recommends that the Commission approve the Hospital s application for an
9 alternative method of rate determination for blood and bone marrow transplant services, for a one year period commencing January 3, The Hospital will need to file a renewal application for review to be considered for continued participation. Consistent with its policy paper regarding applications for alternative methods of rate determination, the staff recommends that this approval be contingent upon the execution of the standard Memorandum of Understanding ("MOU") with the Hospital for the approved contract. This document would formalize the understanding between the Commission and the Hospital, and would include provisions for such things as payments of HSCRC-approved rates, treatment of losses that may be attributed to the contract, quarterly and annual reporting, confidentiality of data submitted, penalties for noncompliance, project termination and/or alteration, on-going monitoring, and other issues specific to the proposed contract. The MOU will also stipulate that operating losses under the contract cannot be used to justify future requests for rate increases.
10 IN RE: THE APPLICATION FOR * BEFORE THE MARYLAND HEALTH ALTERNATIVE METHOD OF RATE * SERVICES COST REVIEW DETERMINATION * COMMISSION JOHNS HOPKINS HEALTH * DOCKET: 2014 SYSTEM * FOLIO: 2093 BALTIMORE, MARYLAND * PROCEEDING: 2283A Staff Recommendation January 14, 2015
11 I. INTRODUCTION On December 8, 2014, Johns Hopkins Health System ( System ) filed a renewal application on behalf of its member hospitals (the Hospitals ) requesting approval from the HSCRC to continue participation in a revised global rate arrangement for cardiovascular procedures with Global Excel Management, Inc. The Hospitals request that the Commission approve the arrangement for an additional year beginning February 1, II. OVERVIEW OFAPPLICATION The contract will continue to be held and administered by Johns Hopkins HealthCare, LLC ("JHHC"), which is a subsidiary of the System. JHHC will continue to manage all financial transactions related to the global price contract including payments to the Hospitals and bear all risk relating to regulated services associated with the contract. III. FEE DEVELOPMENT The hospital portion of the global rates was developed by calculating mean historical charges for patients receiving the procedures for which global rates are to be paid. The remainder of the global rate is comprised of physician service costs. Additional per diem payments were calculated for cases that exceed a specific length of stay outlier threshold. IV. IDENTIFICATION AND ASSESSMENTOF RISK The Hospitals will continue to submit bills to JHHC for all contracted and covered services. JHHC is responsible for billing the payer, collecting payments, disbursing payments to the Hospitals at their full HSCRC approved rates, and reimbursing the physicians. The System contends that the arrangement among JHHC, the Hospitals, and the physicians holds the Hospitals harmless from any shortfalls in payment from the global price contract. JHHC maintains it has been active in similar types of fixed fee contracts for several years, and that JHHC is adequately capitalized to bear the risk of potential losses.
12 V. STAFF EVALUATION Staff found that there was no experience under the arrangement for the last year. However, staff believes that the Hospitals can achieve favorable performance under this arrangement. VI. STAFF RECOMMENDATION The staff recommends that the Commission approve the Hospitals application for an alternative method of rate determination for cardiovascular services for a one year period commencing February 1, The Hospitals will need to file a renewal application for review to be considered for continued participation. Consistent with its policy paper regarding applications for alternative methods of rate determination, the staff recommends that this approval be contingent upon the execution of the standard Memorandum of Understanding ("MOU") with the Hospitals for the approved contract. This document would formalize the understanding between the Commission and the Hospitals, and would include provisions for such things as payments of HSCRC-approved rates, treatment of losses that may be attributed to the contract, quarterly and annual reporting, confidentiality of data submitted, penalties for noncompliance, project termination and/or alteration, on-going monitoring, and other issues specific to the proposed contract. The MOU will also stipulate that operating losses under the contract cannot be used to justify future requests for rate increases.
13 IN RE: THE APPLICATION FOR * BEFORE THE MARYLAND HEALTH ALTERNATIVE METHOD OF RATE * SERVICES COST REVIEW DETERMINATION * COMMISSION JOHNS HOPKINS HEALTH * DOCKET: 2014 SYSTEM * FOLIO: 2096 BALTIMORE, MARYLAND * PROCEEDING: 2286A Staff Recommendation January 14, 2015
14 I. INTRODUCTION Johns Hopkins Health System ( System ) filed an application with the HSCRC on December 23, 2014, on behalf of its member hospitals, Johns Hopkins Hospital, Johns Hopkins Bayview Medical Center, and Howard County General Hospital (the Hospitals ) for an alternative method of rate determination, pursuant to COMAR The System requests approval from the HSCRC to continue to participate in a revised global rate arrangement for solid organ and bone marrow transplants with Optum Health, a division of United HealthCare Services, for a period of one year beginning February 1, II. OVERVIEW OF APPLICATION The contract will continue to be held and administered by Johns Hopkins HealthCare, LLC ("JHHC"), which is a subsidiary of the System. JHHC will manage all financial transactions related to the global price contract including payments to the System hospitals and bear all risk relating to regulated services associated with the contract. III. FEE DEVELOPMENT The hospital portion of the global rates was developed by calculating mean historical charges for patients receiving the procedures for which global rates are to be paid. The remainder of the global rate is comprised of physician service costs. Additional per diem payments were calculated for cases that exceed a specific length of stay outlier threshold. IV. IDENTIFICATION ANDASSESSMENT OF RISK The Hospitals will continue to submit bills to JHHC for all contracted and covered services. JHHC is responsible for billing the payer, collecting payments, disbursing payments to the Hospitals at their full HSCRC approved rates, and reimbursing the physicians. The System contends that the arrangement among JHHC, the Hospitals, and the physicians holds the Hospitals harmless from any shortfalls in payment from the global price contract. JHHC
15 maintains it has been active in similar types of fixed fee contracts for several years, and that JHHC is adequately capitalized to bear risk of potential losses. V. STAFF EVALUATION The staff reviewed the experience under this arrangement for the last year and found it to be slightly unfavorable. However, after review of the revised arrangement, staff believes that the Hospitals will be able to achieve a favorable outcome moving forward. VI. STAFF RECOMMENDATION The staff recommends that the Commission approve the Hospitals' application for an alternative method of rate determination for solid organ and bone marrow transplant services for a one year period commencing February 1, The Hospitals will need to file a renewal application for review to be considered for continued participation. Consistent with its policy paper regarding applications for alternative methods of rate determination, the staff recommends that this approval be contingent upon the execution of the standard Memorandum of Understanding ("MOU") with the Hospitals for the approved contract. This document would formalize the understanding between the Commission and the Hospitals, and would include provisions for such things as payments of HSCRC-approved rates, treatment of losses that may be attributed to the contract, quarterly and annual reporting, confidentiality of data submitted, penalties for noncompliance, project termination and/or alteration, on-going monitoring, and other issues specific to the proposed contract. The MOU will also stipulate that operating losses under the contract cannot be used to justify future requests for rate increases.
16 Final Recommendation for Modifying the Maryland Hospital Acquired Conditions Program for FY 2017 Health Services Cost Review Commission 4160 Patterson Avenue Baltimore, MD (410) January 14, 2015 This document contains the final staff recommendations for updating the Maryland Hospital Acquired Conditions (MHAC) Program for FY 2017.
17 Final Staff Recommendation for Modifying the Maryland Hospital Acquired Conditions Program A. Introduction The HSCRC quality-based payment methodologies are important policy tools for providing strong incentives for hospitals to improve their quality performance over time. The MHAC program was implemented in state FY In order to enhance our ability to incentivize hospital care improvements and meet the MHAC reduction targets in the CMMI All-payer model demonstration contract that began on January 1, 2014, Commission staff developed recommendations with significant changes to the MHAC existing policy within the context of the Performance Measurement and Payment Models Workgroup activity. The Commission approved the updated recommendations at the April 2014 meeting that modified the measurement, scoring and payment scaling methodologies to translate scores into rate adjustments for the MHAC initiative. These updates were effective for performance in calendar year 2014 (beginning January 1, 2014) and are to be applied to FY 2016 rates for each hospital. Among these changes were measuring hospital performance using observed to expected ratio values for each PPC rather than the additional incremental cost of the PPCs measured at each hospital, and shifting from relative scaling to pre-established PPC performance targets for payment adjustments. The revised approach also established a statewide MHAC improvement target with tiered amounts of revenue at risk based on whether or not the target is met, and the allocation of rewards for FY 2016 consistent with the amount of revenue in penalties collected. This recommendation proposes to continue with the current MHAC initiative methodology for FY 2017 with updates to the policy that allow for rewards not limited to the penalties collected, and to the statewide improvement target for applying tiered scaling amounts. B. Background 1. Centers for Medicare & Medicaid Services (CMS) Hospital Acquired Conditions (HAC) Program The federal HAC program began in FFY 2012 when CMS disallowed an increase in DRG payment for cases with added complications in 14 narrowly defined categories. Beginning in FFY 2015, CMS established a second HAC program, which reduces payments of hospitals with scores in the top quartile for the performance period on their rate of Hospital Acquired Conditions as compared to the national average. In FY 2015, the maximum reduction is one percent of total DRG payments. The CMS HAC measures for FY 2016 are listed in Appendix I. 2. MHAC Measures, Scaling and Magnitude at Risk to Date The MHAC program currently uses 65 Potentially Preventable Complications (PPCs) developed by 3M Health Information Systems. In the process of developing the MHAC updated recommendations for FY 2016, staff vetted several guiding principles for the revised MHAC program that overlap significantly with those identified by the MHA. They include: 1
18 Final Staff Recommendation for Modifying the Maryland Hospital Acquired Conditions Program Program must improve care for all patients, regardless of payer. Breadth and impact of the program must meet or exceed the Medicare national program in terms of measures and revenue at risk. Program should identify predetermined performance targets and financial impact. First year target for the program must be established in context of the trends of complication reductions seen in the previous years as well as the need to achieve the new All-payer model goal of a 30% cumulative reduction by Program should prioritize high volume, high cost, opportunity for improvement and areas of national focus. Program design should encourage cooperation and sharing of best practices. Program scoring method should hold hospitals harmless for lack of improvement if attainment is highly favorable. Hospitals should have ability to track progress during the performance period. To achieve a policy that supports the guiding principles, staff s approved recommendations effective for CY 2014 performance and applied to rate year FY 2016 (see detailed description in Appendix II) included: Using Observed (O)/Expected (E) value for each PPC to measure each hospitals performance Establishing appropriate exclusion rules to enhance measurement fairness and stability. Prioritizing PPCs that are high cost, high volume, have opportunity to improve, and are of national concern in the final hospital score through grouping the PPCs and weighting the scores of PPCs in each group commensurate with the level of priority. Calculating rewards/penalties using preset positions on the scale based on the base year scores. Based on performance trends and CMMI contract goals, establishing annual statewide targets with tiered scaling, with a statewide target set at 8% improvement with 1% of permanent revenue at risk if the target is met, and 4% at risk and no rewards paid if the target is missed; penalties were limited to 0.5% of permanent inpatient revenue statewide. C. Assessment HSCRC continues to solicit input from stakeholder groups comprising the industry and payers to determine appropriate direction regarding areas of needed updates to the programs. These include the measures used, and the program s methodology components. The Performance Measurement Workgroup has deliberated pertinent issues and potential changes to Commission policy for FY 2017 that may be necessary to enhance our ability to continue to improve quality of care and reduce costs caused by hospital acquired complications, as well as to achieve the reduction target set forth in the contract with CMMI a 30% reduction in MHACs over five years. In its October to December meetings, the Workgroup discussed issues related to: PPC measurement trends, Present on admission (POA) auditing, The stability of the PPC measures themselves over time, 2
19 Final Staff Recommendation for Modifying the Maryland Hospital Acquired Conditions Program The appropriate time period for establishing norms and benchmarks for FY 2017, The reward and penalty structure of the program, and, Setting and use of a statewide reduction target for the MHAC program on which to base tiered payment of rewards and penalties. In addition to the meeting discussions, HSCRC received four comment letters from the Maryland Hospital Association (MHA), CareFirst BlueCross BlueShield, the Johns Hopkins Health System (JHHS), and Medstar Health on the draft MHAC recommendation. The four MHAC comment letters as well as four additional letters commenting on the draft recommendation updates to the Readmissions Reduction Program and Aggregate Revenue Amounts at Risk for Quality Programs are in the attachments to this recommendation In general, all the comment letters support continuing the current MHAC methodology with the changes implemented for FY 2016 where prospective benchmarks are provided and hospitals can monitor their performance real time. However, other specific comments, as outlined in the sections below, suggest changes to the recommendations. 1. Updated PPC Measurement Trends As illustrated in Figure 1 below, Maryland has seen a significant drop from year to year from 2010 to 2014 in the statewide PPC rates with a total rate per 1,000 decrease of 60.8% unadjusted, and an average annual risk adjusted decrease of 13.9%. Figure 1. PPC Reduction Trends FY 10 to FY 14 Potentially Preventable Complication (PPC) Rates in Maryland- State FY2010-FY2014 Annual Change (CY2013 PPC RATES (FY2010 NORMS, vs. 30) PPC RATES (CY2013 NORMS, vs. 31) Annual Change (FY2010 Norms, vs. 30) Norms, vs. 31) FY2010 Norms, vs. 30 FY10 FY11 FY12 FY13 FY13 FY14 FY11 FY12 FY13 FY14 TOTAL NUMBER OF COMPLICATIONS 53,494 48,416 42,118 34,200 34,143 26, % -13.0% -18.8% -21.2% -15.6% 50.4% UNADJUSTED COMPLICATION RATE PER 1,000 AT RISK CASES % -9.3% -14.5% -17.1% -11.6% 60.8% RISK ADJUSTED COMPLICATION RATE PER 1,000 AT RISK CASES % -10.7% -17.7% -19.3% -13.9% 54.7% In addition to the annual change in PPC rates, staff also analyzed monthly year to date PPC Medicare and all-payer changes and discussed the findings at a public Commission meeting and with the Workgroup. As Figure 2 below illustrates, there was a sharp decrease in the rate in January 2014, but the linear trend line decrease is constant and consistent for September 2013 year to date (YTD) compared to September 2014 YTD. Annual Change Total Change 3
 1.20 1.00 0.80 0.60 0.40 Note: Based on final data for January 20")
20 Final Staff Recommendation for Modifying the Maryland Hospital Acquired Conditions Program Figure and 2014 Monthly YTD PPC Rate Comparisons New Waiver Start Date All-Payer Medicare FFS Linear (All-Payer) Note: Based on final data for January September Present on Admission (POA) Auditing To a very large extent, POA coding drives MHAC assignment. Auditing POA, then, is important in order to validate or discover to what extent that change in PPC rates is related to clinical care rather than hospital coding practices. Staff discussed with the Workgroup modifying the plans for auditing POA in For FY 2014, the HSCRC is primarily focusing on auditing 10 hospitals that have had significant improvements in PPC rates. Cases selected for audit (N = 230) o o 50% random sample for ICD-9 Audits 50% for POA audits (used to be 30%); select from a file of discharges at-risk for PPC s with large improvements and those where the PPC status changed between the preliminary and final data submission. Other hospital selection factors include hospital size, date of last audit (not auditing in 2013 or 2014), percent change between preliminary and final data submission. Related to both the PPC reduction trends and POA coding driving MHAC performance, in their comment letters, MHA, JHHS and CareFirst all acknowledge and concur with staff that the PPC reductions are likely due to a combination of clinical documentation, coding and actual reduced complications. CareFirst also raised concerns that the implementation of Global Budget Rate arrangements may provide a disincentive to fully code complications. Staff notes that under-coding complications will still require hospitals to provide the additional care needed by patients with complications from their global budgets, and that monitoring 4
21 Final Staff Recommendation for Modifying the Maryland Hospital Acquired Conditions Program shifts in case mix index (CMI) will continue to be important under GBR. Staff will present findings of the ongoing POA audits as well as the routine APR-DRG coding audits in public Workgroup meetings in 2015 and discuss any implications for considering adjustments to the MHAC program based on the findings. 3. Stability of PPC Measures Over Time Workgroup members expressed concern over the stability of individual PPC measures, in particular noting that some PPCs rates could potentially increase rather than decrease over time as definitions for the PPCs are potentially interpreted differently from hospital to hospital, and measurement practices evolve over time. The more you look, the more you find was an example raised for infection PPCs, as an example. To explore the question of hospital-specific PPC stability and also that of hospital PPC scores, staff analyzed the correlations for the following performance results: Individual PPC rates for FY2012, FY2013, FY2014 Hospital PPC scores for FY2013 and FY2014, for both improvement and attainment. Appendix III contains the individual PPC rates per 1,000 correlation results that indicate majority of the PPC rates for hospitals were statistically significantly correlated from FY2012 through FY2014. Figure 3 below illustrates the correlation in improvement and attainment scores that the staff modelled. The results indicate that there was statistically significant correlation for attainment but not for improvement. Based upon these results, staff are less concerned about the stability of measurement of the PPCs but this must continue to be monitored to ensure that the measure is reliable and valid. Figure 3. Correlation of FY2013 and FY2014 Improvement and Attainment Scores Correlation Coefficient p-value Attainment Scores FY13 and FY < Improvement Scores FY13 and FY Setting PPC Benchmarks for FY 2017 The Workgroup discussed issues to consider in setting the base year performance benchmarks. Because of the sharp decrease in PPC rates in January 2014, staff initially supported the position of setting PPC benchmarks using FY 2014 performance data with an adjustment that recognized the sharp one month decrease; this would entail weighting more heavily the results in the latter 6 months of the fiscal year in setting the benchmarks. Alternatively, the Johns Hopkins Health System comment letter advocates keeping constant CY 2013 benchmarks for calculating hospital scores. To balance the Workgroup s desire to lower the benchmarks and concern about sustainability of the current improvement results, and staff concerns about continuing the momentum with improving on MHACs and establishing reasonable benchmarks, the staff 5
22 Final Staff Recommendation for Modifying the Maryland Hospital Acquired Conditions Program supports a revised middle approach which is to use the full FY 2014 rates to set benchmarks for FY MHAC Reward and Penalty Structure Staff reviewed with the Workgroup modeling of the rewards and penalties for FY 2016 using data for the first 9 months of CY 2014 (FY2014 Qtrs 3 and 4, and FY2015 Qtr 1). A table with hospital specific results can be found in Appendix IV. Workgroup members discussed the impact of a revenue neutrality adjustment to the MHAC program, specifically noting that limiting the rewards to the penalties collected did not recognize the effort expended to achieve the performance levels for the better performing hospitals. As was discussed, Figure 4 below illustrates that total rewards are reduced to ~5% of what would have been earned if they were not capped at the penalties collected. Staff supports removing the cap on rewards based on discussions at the payment and performance workgroup meetings. Figure 4. MHAC Modeling of Total Rewards and Penalties Using FY 2014 Qtrs 3 and 4 Data Count of Hospitals receiving Reduction or Reward Total Revenue Revenue Neutral Adjustment Total Reduction 2 $ (449,188) $ (449,188) Total Reward 18 $9,468,894 $449, Annual Statewide MHAC Reduction Target and Score Scaling FY 2017 The Workgroup discussed options for the revised annual MHAC reduction target. Some participants noted that the state has achieved ~27% of that required by the All-payer Model contract with CMMI in the first year. Staff noted the need to continue to improve care and reduce cost. Staff also noted that using FY 2014 to set benchmarks and base period rates does not account for the additional 6 months from July to December 2014 where the MHAC rates would continue to improve. Several comments were received on targets and scaling. In their comment letters, MHA and Medstar advocate for little or no increase in the improvement target for FY2017, arguing that it does not impact the state negatively in achieving the 30% MHAC reduction over five years. In their comment letter, CareFirst also expressed concern regarding the use of a tiered approach with more revenue at risk if a statewide target is not met versus met, as well as non-continuous scaling where there is a hold harmless neutral zone. CareFirst supports using one scale for payment adjustments where each hospital s performance is directly proportionate to the rewards and penalties they receive. Alternatively, MHA and JHHS indicate in their comment letters that they believe the statewide target with tiered scaling provides an incentive for hospitals to work collaboratively on reducing complications. 6
23 Final Staff Recommendation for Modifying the Maryland Hospital Acquired Conditions Program Staff continues to advocate for a target of 7% improvement from FY2015 to CY2015, which is equal to 5% annual improvement rate and on par with the improvement trends the state has been observing and reduced from last year s annual improvement target of 8%. Staff also advocates for no change in the scaling approach by keeping constant the tiered score scaling with no rewards if the statewide target is not met (Appendix V). Using a tiered approach provides strong incentives for collaboration between hospitals to share best practices and continue to improve to ensure the statewide target is achieved. While MHAC scaling is based on rewards and penalties for hospitals at the tail end of the scores and holds hospitals with scores in the middle harmless, revenue reduction programs (Potentially Avoidable Utilization, and Readmission Shared Savings) are based on a continuous scale where all hospitals receive reductions in proportion to their performance. D. Recommendations Based on the work completed to date on updating the MHAC program for FY 2017, staff makes the following recommendations: 1. The statewide reduction target should be set at 7 % comparing FY2014 to CY2015 risk adjusted PPC rates. 2. The program should continue to use a tiered approach where a lower level of revenue at risk is set if the statewide target is met versus not met as modelled in FY2016 policy. 3. Rewards should be distributed only if the statewide target is met, and should not be limited to the penalties collected. 7
24 Final Staff Recommendation for Modifying the Maryland Hospital Acquired Conditions Program Appendix I. CMS HAC Measures for FY 2016 CMS HAC MEASURES Implemented Since FY 2012 HAC 01: Foreign Object Retained After Surgery HAC 02: Air Embolism HAC 03: Blood Incompatibility HAC 04: Stage III & Stage IV Pressure Ulcers HAC 05: Falls and Trauma HAC 06: Catheter-Associated Urinary Tract Infection HAC 07: Vascular Catheter-Associated Infection HAC 08: Surgical Site Infection - Mediastinitis After Coronary Artery Bypas Graft (CABG) HAC 09: Manifestations of Poor Glycemic Control HAC 10: Deep Vein Thrombosis/Pulmonary Embolism with Total Knee Replacement or Hip Replacement HAC 11: Surgical Site Infection Bariatric Surgery HAC 12: Surgical Site Infection Certain Orthopedic Procedure of Spine, Shoulder, and Elbow HAC 13: Surgical Site Infection Following Cardiac Device Procedures HAC 14: Iatrogenic Pneumothorax w/venous Catheterization CMS HAC Measures Implemented FY 2015 Domain 1- the Agency for Health Care Research and Quality (AHRQ) composite PSI #90 which includes the following indicators: o Pressure ulcer rate (PSI 3); o Iatrogenic pneumothorax rate (PSI 6); o Central venous catheter-related blood stream infection rate (PSI 7); o Postoperative hip fracture rate (PSI 8); o Postoperative pulmonary embolism (PE) or deep vein thrombosis rate (DVT) (PSI 12); o Postoperative sepsis rate (PSI 13); o Wound dehiscence rate (PSI 14); and o Accidental puncture and laceration rate (PSI 15). Domain 2- two healthcare-associated infection measures developed by the Centers for Disease Control and Prevention s (CDC) National Health Safety Network: o Central Line-Associated Blood Stream Infection and o Catheter-Associated Urinary Tract Infection. 8
25 Final Staff Recommendation for Modifying the Maryland Hospital Acquired Conditions Program Definitions Appendix II: PPC Measurement Definitions, Points Calculation, The PPC measure would then be defined as: PPC Tiers and Weighting Observed (O)/Expected (E) value for each measure The threshold value is the minimum performance level at which a hospital will be assigned points and is defined as: Weighted mean of all O/E ratios (O/E =1) (Mean performance is measured at the case level. In addition, higher volume hospitals have more influence on PPCs means.) The benchmark value is the performance level at which a full ten points would be assigned for a PPC and is defined as: Weighted mean of top quartile O/E ratio For PPCs that are serious reportable events, the benchmark will be set at 0. Performance Points Performance points are given based on a range between Benchmark and a Threshold, which are determined using the base year data. The Benchmark is a reference point defining a high level of performance, which is equal to the mean of the top quartile. Hospitals whose rates are equal to or above the benchmark receive 10 full Attainment points. The Threshold is the minimum level of performance required to receive minimum Attainment points, which is set at the weighted mean of all the O/E ratios which equals to 1. The Improvement points are earned based on a scale between the hospital s prior year score (baseline) on a particular measure and the Benchmark and range from 0 to 9. The formulas to calculate the Attainment and Improvement points are as follows: Attainment Points: [9 * ((Hospital s performance period score - threshold)/ (benchmark threshold))] +.5, where the hospital performance period score falls in the range from the threshold to the benchmark Improvement Points: [10 * ((Hospital performance period score -Hospital baseline period score)/(benchmark - Hospital baseline period score))] -.5, where the hospital performance score falls in the range from the hospital s baseline period score to the benchmark. 9

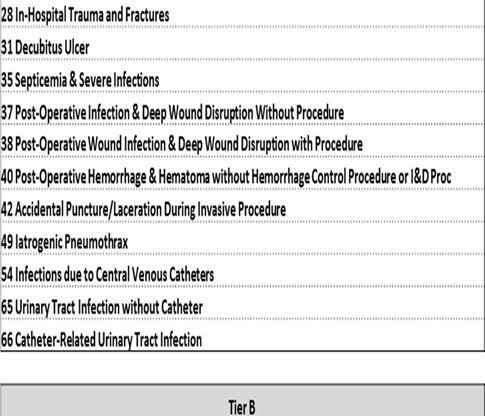
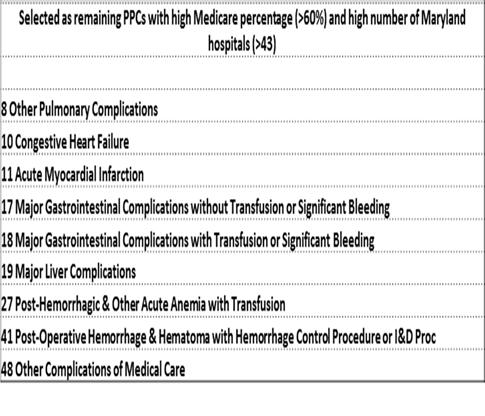
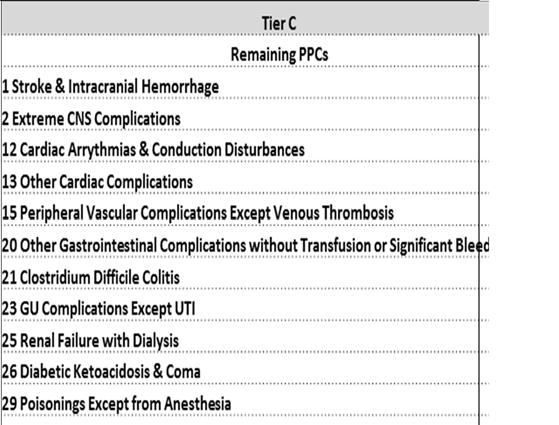
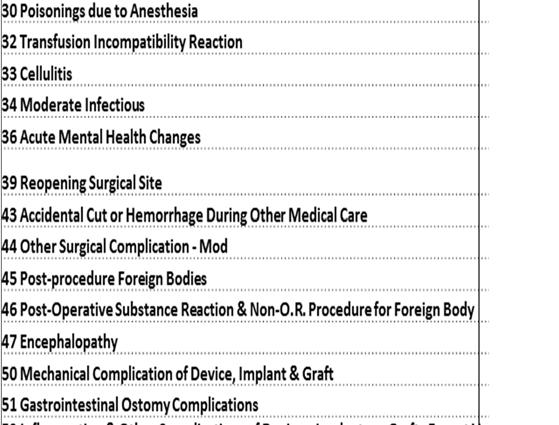
26 Final Staff Recommendation for Modifying the Maryland Hospital Acquired Conditions Program PPC Tiers: Tier A Scores Weighted 60%, Tier B 40% and Tier C 20% 10
27 Final Staff Recommendation for Modifying the Maryland Hospital Acquired Conditions Program APPENDIX III. Hospital PPC Rate per 1,000 Correlation Results PPC Number PPC Description Correlation Coefficient FY12-FY13 Correlation Coefficient FY13-FY14 Correlation Coefficient FY12-FY14 1 Stroke & Intracranial Hemorrhage Extreme CNS Complications Acute Pulmonary Edema and Respiratory Failure without Ventilation Acute Pulmonary Edema and Respiratory Failure with Ventilation Pneumonia & Other Lung Infections Aspiration Pneumonia Pulmonary Embolism Other Pulmonary Complications Shock Congestive Heart Failure Acute Myocardial Infarction Cardiac Arrythmias & Conduction Disturbances Other Cardiac Complications Ventricular Fibrillation/Cardiac Arrest Peripheral Vascular Complications Except Venous Thrombosis Venous Thrombosis Major Gastrointestinal Complications without Transfusion or Significant Bleeding Major Gastrointestinal Complications with Transfusion or Significant Bleeding Major Liver Complications Other Gastrointestinal Complications without Transfusion or Significant Bleeding Clostridium Difficile Colitis GU Complications Except UTI Renal Failure without Dialysis Renal Failure with Dialysis Diabetic Ketoacidosis & Coma Post-Hemorrhagic & Other Acute Anemia with Transfusion In-Hospital Trauma and Fractures Poisonings Except from Anesthesia Decubitus Ulcer Transfusion Incompatibility Reaction Cellulitis
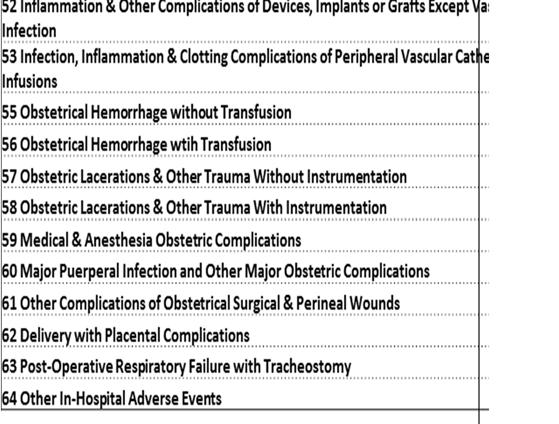
28 Final Staff Recommendation for Modifying the Maryland Hospital Acquired Conditions Program 34 Moderate Infectious Septicemia & Severe Infections Acute Mental Health Changes Post-Operative Infection & Deep Wound Disruption Without Procedure Post-Operative Wound Infection & Deep Wound Disruption with Procedure Reopening Surgical Site Post-Operative Hemorrhage & Hematoma without Hemorrhage Control Procedure or I&D Proc Post-Operative Hemorrhage & Hematoma with Hemorrhage Control Procedure or I&D Proc Accidental Puncture/Laceration During Invasive Procedure Accidental Cut or Hemorrhage During Other Medical Care Other Surgical Complication - Mod Post-procedure Foreign Bodies Post-Operative Substance Reaction & Non-O.R. Procedure for Foreign Body Encephalopathy Other Complications of Medical Care Iatrogenic Pneumothrax Mechanical Complication of Device, Implant & Graft Gastrointestinal Ostomy Complications Inflammation & Other Complications of Devices, Implants or Grafts Except Vascular Infection Infection, Inflammation & Clotting Complications of Peripheral Vascular Catheters & Infusions Infections due to Central Venous Catheters Obstetrical Hemorrhage without Transfusion Obstetrical Hemorrhage wtih Transfusion Obstetric Lacerations & Other Trauma Without Instrumentation Obstetric Lacerations & Other Trauma With Instrumentation Medical & Anesthesia Obstetric Complications Major Puerperal Infection and Other Major Obstetric Complications Other Complications of Obstetrical Surgical & Perineal Wounds Delivery with Placental Complications Post-Operative Respiratory Failure with Tracheostomy Other In-Hospital Adverse Events
29 Final Staff Recommendation for Modifying the Maryland Hospital Acquired Conditions Program 65 Urinary Tract Infection without Catheter Catheter-Related Urinary Tract Infection Statistically Significant at p < 0.05 Results for PPC30 not presented and McGready was removed from analysis. 13
30 Final Staff Recommendation for Modifying the Maryland Hospital Acquired Conditions Program APPENDIX IV. 2b. CY2014 Jan-September Final Data- MHAC Scaling Modeling Estimated % HOSPITAL Inpatient Base Year Final Score Improvement % Scaling $ Scaling HOSPITAL NAME ID Revenue Score Jan-Sept in Base Adjustment Adjustment (FY15*2.6%) Scores SOUTHERN MARYLAND $ 163,208, % -0.21% (337,672) WASHINGTON ADVENTIST $ 161,698, % -0.07% (111,516) DOCTORS COMMUNITY $ 136,225, % 0.00% ANNE ARUNDEL $ 310,117, % 0.00% SUBURBAN $ 181,410, % 0.00% CARROLL COUNTY $ 138,209, % 0.00% HOWARD COUNTY $ 167,386, % 0.00% HARBOR $ 124,002, % 0.00% G.B.M.C. $ 201,533, % 0.00% LAUREL REGIONAL $ 77,501, % 0.00% - BALTIMORE WASHINGTON MEDICAL CENTER $ 223,155, % 0.00% FREDERICK MEMORIAL $ 189,480, % 0.00% HOLY CROSS $ 319,596, % 0.00% UPPER CHESAPEAKE HEALTH $ 148,917, % 0.00% SHADY GROVE $ 228,731, % 0.00% GARRETT COUNTY $ 18,724, % 0.00% MONTGOMERY GENERAL $ 87,652, % 0.00% UNION MEMORIAL $ 242,505, % 0.00% FRANKLIN SQUARE $ 285,691, % 0.00% DORCHESTER $ 25,127, % 0.00% HARFORD $ 47,089, % 0.00% UNIVERSITY OF MARYLAND $ 863,843, % 0.00% SYSTEM $ 184,484, % 0.00% GOOD SAMARITAN $ 180,861, % 0.00% MERCY $ 233,163, % 0.00% UMMC MIDTOWN $ 133,787, % 0.00% PRINCE GEORGE $ 177,243, % 0.00% ST. AGNES $ 239,121, % 0.00% JOHNS HOPKINS $ 1,292,515, % 0.05% 680, PENINSULA REGIONAL $ 233,728, % 0.11% 246, UNION HOSPITAL OF CECIL COUNT $ 67,852, % 0.21% 142, SINAI $ 429,154, % 0.32% 1,355, MERITUS $ 187,434, % 0.32% 591, EASTON $ 94,828, % 0.32% 299, CHARLES REGIONAL $ 76,338, % 0.37% 281, REHAB & ORTHO $ 69,104, % 0.37% 254, UM ST. JOSEPH $ 216,335, % 0.42% 910, HOPKINS BAYVIEW MED CTR $ 356,396, % 0.42% 1,500, ATLANTIC GENERAL $ 38,640, % 0.42% 162, NORTHWEST $ 142,186, % 0.63% 898, ST. MARY $ 69,520, % 0.68% 475, BON SECOURS $ 78,212, % 0.74% 576, CHESTERTOWN $ 29,416, % 0.79% 232, FT. WASHINGTON $ 17,776, % 0.84% 149, CALVERT $ 67,385, % 1.00% 673, MCCREADY $ 3,734, % 1.00% 37,346 % Revenue $ Revenue Neutral Neutral Scaling Adjustmen Adjustment t $ -0.21% $ (337,672) $ $ (111,516) -0.07% $ $ % $ $ % $ $ % $ $ % $ $ % $ $ % $ $ % $ $ % $ $ % $ $ % $ $ % $ $ % $ $ % $ $ % $ $ % $ $ % $ $ % $ $ % $ $ % $ $ % $ $ % $ $ % $ $ % $ $ % $ $ % $ $ % $ $ 32, % $ $ 11, % $ $ 6, % $ $ 64, % $ $ 28, % $ $ 14, % $ $ 13, % $ $ 12, % $ $ 43, % $ $ 71, % $ $ 7, % $ $ 42, % $ $ 22, % $ $ 27, % $ $ 11, % $ $ 7, % $ $ 31, % $ $ 1, % Total Reduct $ (449,188) $ (449,188) Total Award $ 9,468,894 $ 449,
31 Final Staff Recommendation for Modifying the Maryland Hospital Acquired Conditions Program Appendix V. MHAC Score Tiered Scaling of Final MHAC Scores Final MHAC Score Below State Quality Target 15 Exceed State Quality Target Scores less than or equal to % -1.00% % -0.97% % -0.93% % -0.90% % -0.86% % -0.83% % -0.79% % -0.76% % -0.72% % -0.69% % -0.66% % -0.62% % -0.59% % -0.55% % -0.52% % -0.48% % -0.45% % -0.41% % -0.38% % -0.34% % -0.31% % -0.28% % -0.24% % -0.21% % -0.17% % -0.14% % -0.10% % -0.07% % -0.03% % 0.00% % 0.00% % 0.00% % 0.00% % 0.00% % 0.00% % 0.00% % 0.00% % 0.00%
32 Final Staff Recommendation for Modifying the Maryland Hospital Acquired Conditions Program % 0.00% % 0.00% % 0.00% % 0.00% % 0.00% % 0.00% % 0.00% % 0.05% % 0.11% % 0.16% % 0.21% % 0.26% % 0.32% % 0.37% % 0.42% % 0.47% % 0.53% % 0.58% % 0.63% % 0.68% % 0.74% % 0.79% % 0.84% % 0.89% % 0.95% Scores greater than or equal to % 1.00% Penalty threshold: Reward Threshold No rewards 0.61 *Minimum and maximum scaling scores based on CY 2013 Final Data Attainment Scores. Not changed for RY17 MHAC Program. 16
33 See MHAC Final Policy Figures Excel File posted or sent separately.
34 January 5, 2015 Dianne Feeney Associate Director, Quality Initiatives Health Services Cost Review Commission 4160 Patterson Avenue Baltimore, Maryland Dear Ms. Feeney: On behalf of the 64 hospital and health system members of the Maryland Hospital Association (MHA), we appreciate the opportunity to comment on the proposed changes to the Draft Recommendation for Modifying the Maryland Hospital Acquired Conditions Program for FY We are pleased with the progress the hospital field has made over calendar year 2014 and want to continue working to make the improvements that have been gained in 2014 more deeply embedded in routine practice. The reductions in complications over the past year demonstrate that the policy is well structured to support hospitals efforts to reduce patient harm, and as such we support your recommendation that the structure of the program remain essentially unchanged. Setting the scoring targets and associated payment impacts at the start of the year allows hospitals to track progress throughout the year and clearly understand the payment impacts. Considering the substantial improvement hospitals have made in complications over the first three quarters of this calendar year, we believe that the improvement target should be lower, and the revenue at risk should shift toward readmissions, where it s not clear we are achieving our goal. At most hospitals, quality and care management leaders are responsible for both Maryland Hospital Acquired Conditions (MHACs) and readmissions, so holding steady on the complication reductions achieved this year without pushing for more would allow hospitals to direct more of their shared resources to readmissions reduction. Over the coming months we will convene physicians, nurses, coders, and documentation specialists to share care practices that have been successful in reducing complications, and to review the internal hospital guidelines physicians use to identify conditions or diagnoses that could result in assignment of a complication to a case. For example, when determining whether a patient is experiencing kidney injury, some hospitals may use the Acute Kidney Injury Network s modified RIFLE (risk, injury, failure, loss, and end-stage kidney disease) staging system, while others may base the diagnosis on blood levels of important markers of kidney function such as creatinine or cystatin C. This work differs from the present on admission coding reviews in that it is a more fundamental look at the criteria hospitals use to determine when a complication is diagnosed. Our goal with these clinical groups is twofold: to attempt to come to agreement on the criteria that are used to identify conditions, and to spread the implementation of practices that have reduced patient harm. To the extent that hospitals adopt or implement the successful practices, we will see further reductions in complications. The work to agree upon standard definitions for conditions that trigger assignment of a complication could lower or increase complication rates. Both the adoption of uniform guidelines
35 Dianne Feeney January 5, 2015 Page 2 and the spread of successful practices are important steps toward our longer term goal of reducing complications, particularly those that cause the most harm to patients. Several potentially preventable complications (PPC) have very low expected values either because the number of cases at risk is small, or the nature of the occurrence is rare. If the expected value is very low the occurrence of a single complication disproportionately affects the hospital s score. At a recent Performance Measurement Work Group meeting, the possibility of grouping those PPCs into a single combined measurement was mentioned. We believe that idea has merit and would support pursuing such an approach. Thank you for the opportunity to participate in this process and to comment on this recommendation. If you have any questions, please contact me. Sincerely, Traci La Valle Vice President
36
37
38


39
40
41
42
43
44
45
46
47 January 5, 2015 Dianne Feeney Associate Director, Quality Initiatives Health Services Cost Review Commission 4160 Patterson Avenue Baltimore, Maryland Dear Ms. Feeney: On behalf of the 64 hospital and health system members of the Maryland Hospital Association (MHA), we appreciate the opportunity to comment on the proposed changes to the Draft Recommendation for Updating the Hospital Readmission Reduction Incentive Program for FY Crafting a payment policy recommendation is difficult at a time when significant questions remain about the difference between Maryland s readmissions rate and the national rate in both the calendar year 2013 base period and in the calendar year 2014 performance period. We support the Health Services Cost Review Commission (HSCRC) staff s intention to postpone setting the readmissions target until calendar year 2013 base year data is validated, likely by March, and we appreciate the recent decision to postpone until February a final readmission payment policy recommendation to allow time for additional analysis. However, we believe that a decision on a final readmission payment policy should be postponed beyond February to allow time to complete the necessary analyses. Our primary concern is that a revised readmissions payment policy must not slow the good work underway at Maryland s hospitals to address the root causes of hospital readmissions. In this comment letter, we will outline what we know about readmission rates, and Maryland s rates in particular; what we don t yet know about the drivers of readmissions and the opportunities to improve; and, we will propose a way to develop a payment policy with incentives that reward hospitals for providing the best care for patients and supports hospitals focus on areas where there is the most opportunity and need to improve. Our recommendation is that we postpone final approval of a fiscal year 2017 readmissions payment policy until we ve been able to answer these important questions. What We Know about Readmission Rates Maryland s historic readmissions rate is higher than the nation. From June 2009 through June 2012, the most recent period available on Medicare readmission rates at the Medicare website Hospital Compare, readmission rates for heart failure, pneumonia, and heart attack across Maryland s hospitals in the aggregate were among the highest in the nation. In that same period, Maryland s mortality rates for the same conditions were the second lowest in the nation. This finding is consistent with what has been reported in the literature. 1 1 Divergent trends in survival and readmission following a hospitalization for heart failure in the Veterans Affairs health care system 2002 to Journal of the American College of Cardiology (7/2010); In a study of hospitals within the Veteran Affairs health care system, reported that at the patient level, mortality after an admission for HF declined from 2002 to 2006 while readmission increased. Are All Readmissions Bad Readmissions? New England Journal of Medicine (7/2010); A higher occurrence of readmissions after index admissions for heart failure was associated with lower risk-adjusted 30-day mortality. Our

48 Dianne Feeney January 5, 2015 Page 2 Maryland s readmission rate has been improving faster than the nation. We also know from Medicare data published by Delmarva, the Quality Improvement Organization at the time, that Maryland s all-cause readmission rate improved by 10 percent from October 2010 through September From January 2011 to December 2013, Maryland s 30-day Medicare readmission rate for people admitted with heart attack, heart failure, diabetes, chronic kidney disease, chronic obstructive pulmonary disease, and pneumonia improved faster than the nation. Maryland s hospitals have significantly increased the focus and amount of resources dedicated to reducing readmissions this year, in response to the new waiver s requirements and incentives. While some of the nation s hospitals have significantly reduced readmissions for targeted, high risk populations, very few have reduced their hospital-wide readmissions rate in the way Maryland s hospitals have. There is substantial difference between designing an intervention to reduce readmissions in a relatively small, well-defined target population, such as a pilot for congestive heart failure patients and designing a strategy to reduce overall hospital readmissions. Maryland s hospitals are using a robust portfolio of strategies to address this challenge. Sample Portfolio Strategy: While every hospital is investing in evidence-based interventions that are tailored to their local communities, still more work can be done. The investments are significant, involve numerous partners and require time and actionable data to realize their full potential. Examples of hospital strategies are included as links in Appendix 1. findings suggest that readmissions could be adversely affected by a competing risk of death a patient who dies during the index episode of care can never be readmitted. Hence, if a hospital has a lower mortality rate, then a greater proportion of its discharged patients are eligible for readmission. As such, to some extent, a higher readmission rate may be a consequence of successful care. Furthermore, planned readmissions for procedures or surgery may represent appropriate care that decreases the risk of death, but this is not accounted for in Hospital Compare. Looking forward, looking back: assessing variations in hospital resource use and outcomes for elderly patients with heart failure. Circulation: Cardiovascular Quality and Outcomes (10/2009); This study examines the association between mortality and resource use at the hospital level, when all Medicare beneficiaries hospitalized for heart failure are examined. Findings: California teaching hospitals that used more resources caring for patients hospitalized for heart failure had lower mortality rates.
49 Dianne Feeney January 5, 2015 Page 3 What We Don t Know about Readmission Rates We do not yet know the magnitude of the difference in Maryland s readmissions rate compared to the nation, for the calendar year 2013 base period or for any part of the calendar year 2014 measurement period. Data sources put the gap between 1.55 to 2.56 percentage points. The Delmarva Foundation for Medical Care as the Medicare Quality Improvement Organization produced quarterly utilization reports using Medicare data as required under the Centers for Medicare & Medicaid Services (CMS) contract Scope of Work. Based on data released in their June 6, 2014 report, Maryland s 30-day all cause annual readmission rate for calendar year 2013 was percent compared to the nation s rate of percent; a difference of less than 9 percent or 1.55 percentage points. However, recent comparisons HSCRC staff shared at a Performance Measurement Work Group meeting based on calendar year 2013 data received from the Center for Medicare and Medicaid Innovation (CMMI) indicate Maryland readmission rates were at percent in Maryland compared to percent nationally--a base year gap just over 14 percent or 2.56 percentage points. Between the two data sources, the discrepancy in the Maryland to national base year gap is more than 5 percent. More recent data from CMMI indicates that the base year gap is closer to the Delmarva data than the data shared with the Performance Measurement Work Group. The recent CMMI data indicates the base year gap is percent or 1.94 percentage points. Looking at the recent CMMI data on the performance year, Maryland is continuing to reduce readmission rates faster than the nation and is close to or may have outpaced the national rate of improvement by one-fifth of the base year gap, thereby possibly meeting the calendar year 2014 readmissions waiver target. We do not yet know how much of the gap between Maryland and national rates is due to errors or differences in measurement method. The difference between Maryland and national readmissions rates may be due, at least in part, to the inclusion of a larger proportion of high-risk individuals in the data set. Most concerning is that the state does not yet have sufficient data to verify base year readmission rates, nor 2014 performance year results. Further, it is not clear whether the data provided by the CMMI has appropriately handled Maryland s psychiatric units within acute care hospitals that are paid under the Maryland hospital payment system, but would not be paid under the Inpatient Prospective Payment System (IPPS) were they located outside of Maryland. Because the national data includes only hospitals paid under IPPS but not those cases receiving psychiatric care and associated with the claims paid under the Medicare Inpatient Psychiatric Prospective Payment System, we believe there is a higher proportion of people with behavioral health conditions in Maryland s readmission data, and the presence of a behavioral health condition significantly increases the risk of readmission. It s also not clear to what extent Maryland s reduced admissions should be accounted for in a readmissions payment policy. There are many moving parts to the incentives in the new waiver. Maryland s hospitals have significantly reduced admissions and lowered costs for all payers. With this change, hospitals also recognize that the patients who remain in the hospital are sicker and often have more comorbidities. While reducing readmissions for this population is an imperative, data analysis needs to inform payment policies that are consistent with the goals of the waiver and enable an accurate assessment of performance. While patients are more complex, our hospitals have not wavered from their commitment to innovate beyond their four walls to address patient needs, as shown in the examples we highlight in the Appendix. As a field, we also recognize that focusing on all-payer readmissions, not just Medicare readmissions, is simply the right thing to do. As HSCRC analysis shows, all-payer readmissions is consistent with the trends in Medicare readmissions and solidly linked to waiver success not only for the Medicare readmissions metric, but the limits on all-payer spending growth. Recognition that Maryland s hospitals could be lowering costs and improving quality, and just not meeting an arbitrary readmissions reduction goal (not informed by data), is concerning in light of the agreement hospitals
50 Dianne Feeney January 5, 2015 Page 4 signed on to and the field s unwavering passion to get it right. We do not know how to best structure readmissions performance incentives beyond those that exist in the global budget. The existing HSCRC readmissions payment policy adjusts expected readmissions rates for severity of illness and accounts for planned readmissions. However, because readmissions are also strongly associated with factors that we cannot yet measure well at the hospital level, such as health literacy, support at home, and the income and resources of the neighborhood in which a person lives, we don t know which Maryland hospitals have the most opportunity to reduce readmission rates and which are performing well relative to other hospitals with similar patient characteristics. 2 Well-developed community partnerships, particularly those with primary care physicians, are critical to reducing readmissions. Brian Jack, MD, Professor and Vice Chair, Department of Family Medicine, Boston University School of Medicine, Boston Medical Center, and founder of Project RED said, Safe readmission reduction can only happen if hospitals have well developed community-based partners, particularly primary care partners, willing and able to care for patients in the community. More effort to ensuring that this primary care safety net is available for patients is needed. 3 The concern with the proposed policy is that applying penalties--potentially large penalties--to hospitals because they did not improve at the uniform targeted rate is that the Commission could inadvertently harm a hospital s ability to provide services and interventions to the high-risk individuals who most need support. In federal Value-Based Purchasing, Hospital Acquired Conditions and in Maryland s comparable programs, it is broadly accepted that outcome measures should be adjusted for clinical severity and comorbidities, including conditions that are present on admission, as these affect outcomes independent of the quality of care provided. Sociodemographic factors, like poverty, limited English proficiency, and homelessness, are also present on admission. Unlike pre-existing medical conditions, these social factors are not directly affected by health care interventions, but will directly affect certain outcomes, such as 30-day 2 Neighborhood Socioeconomic Disadvantage and 30-Day Rehospitalization (Annals of Internal Medicine, 12/2014); Living in a severely disadvantaged neighborhood predicts rehospitalization as powerfully as the presence of illnesses, such as peripheral vascular disease or chronic pulmonary disease, and more powerfully than being on Medicaid or having diabetes. Hospital Readmissions: Necessary Evil or Preventable Target for Quality Improvement (Annals of Surgery, 10/2014); High volume cancer centers have higher readmission rates.and may not be an appropriate marker for quality improvement. The Medicare Hospital Readmissions Reduction Program: Potential Unintended Consequences for Hospitals Serving Vulnerable Populations. (Health Services Research, 6/2014); Both dual eligible status and share of MC discharges have a positive effect on risk adjusted readmission rates. Socioeconomic status and readmissions: Evidence from an urban teaching hospital. (Health Affairs, 5/2014); Patients living in high-poverty neighborhoods were 24 percent more likely than others to be readmitted, after demographic characteristics and clinical conditions were adjusted for. Variation in the Risk of Readmission Among Hospitals: The Relative Contribution of Patient, Hospital and Inpatient Provider Characteristics. (Journal of General Internal Medicine, 12/2013); Patient characteristics are the dominant contributor to the variation in risk of readmissions among hospitals findings add to the accumulating evidence that hospitals may not be the appropriate sole target for placing accountability for excess readmissions. 3 Readmission News (August 2014 )
51 Dianne Feeney January 5, 2015 Page 5 readmissions. This concern is clearly reflected in the National Quality Forum s Expert Panel report on the need for sociodemographic adjustments for payment programs: Just as quality measures for readmission aim to account for differences between patients in disease severity that affect repeat hospitalization, the Panel thought that factors related to social disadvantage that affect risk for readmission should also be accounted for. A measure of true performance accounts for the level of challenge posed by the patient to achieve an outcome, whether clinical or sociodemographic. Moving Forward Maryland s hospitals are committed to improving care for all patients while they are inside the hospital walls and as they transition to home and to lower levels of care. Performing well on readmissions demonstrates our commitment to this important outcome, and helps us achieve the financial savings required under the waiver demonstration. We recommend that HSCRC staff and hospitals work together to answer the data and measurement questions, and to better understand the patient and hospital characteristics that may help to identify for targeted improvement efforts subpopulations with relatively high readmission rates. The results of the data validation and analysis should then inform the structure of incentives within a readmissions payment policy so that hospital payment adjustments are commensurate with successful levels of effort. In addition to closely following the work on socio-demographic factors that the National Quality Forum and CMS are pursuing, we recommend an analysis that begins with the data that we can access. MHA recommends no change to the current readmissions payment policy until MHA and HSCRC have the opportunity to: 1. Analyze a combination of variables for their potential use to classify and assign Maryland s hospitals to peer groups. We believe an analysis that includes socio-economic and demographic indicators (by linking resident zip codes with data sets in the public domain such as census data on urbanicity, and poverty levels) will inform payment policies that have the right incentives and that recognizes the variations in hospitals opportunity to improve. While we appreciate HSCRC s efforts to consider Medicaid status, we think the analysis was incomplete. Specifically, the analysis does not address whether having a higher percentage of Medicaid patients impacts a hospital s readmission rate. The analysis is simply focused on whether readmission rates at Maryland hospitals with a larger Medicaid population changed more (or less) over one year. That is a different question from whether those that care for more Medicaid patients tend to have higher readmissions rates. The HSCRC analysis is not sufficient for constructing a payment policy in a state where readmission rates have been steadily declining over the last several years. 2. Given Maryland s strong performance with mortality and the financial savings already realized, an analysis using the Charlson Comorbidity Index (CCI) could be informative. CCI is considered a gold standard as a risk adjustment variable and is commonly used to account for severity of illness and multiple chronic conditions (similar to APR-DRGs), and can also be used to estimate comorbidityadjusted life expectancy.
52 Dianne Feeney January 5, 2015 Page 6 3. While we understand and appreciate the need for safeguarding protected health information, transparency of CMMI readmission data is needed to appropriately compare Maryland with the nation. It would be helpful if MHA could review the SAS code used to pull the national readmissions data so that, when we have questions of what types of hospitals and cases are included, the detailed methodology contained in the SAS code can inform our validation process. Considering the investments hospitals have made in their communities to reduce readmissions, the potential harm that would be done by imposing more financial risks, the uncertainties around the base year readmissions gap, uncertainties about Maryland s rate of improvement relative to the nation thus far in calendar year 2014, and the significant incentives under global budgets, we recommend the rewardonly policy continue for a second year while we address the socio-demographic questions, the data validation issues, and the best path forward. Implementing a more aggressive penalty structure before validating our performance creates a ham-fisted corrective action plan that does not identify or target areas that need focus, and does it before knowing whether corrective action is even required. While we recognize the critical importance of payment polices supporting success under the waiver, changing this policy without adequate data, analysis, and a reasonable amount of time for hospitals to analyze and respond to the changes is not helpful to the state s overall success, nor to the collaborative nature that has allowed us to accomplish so much in such a short time. We appreciate the Commission s consideration of our comments and look forward to continuing to work with HSCRC staff toward our shared goals. Sincerely, Traci La Valle Vice President
53 Dianne Feeney January 5, 2015 Page 7 Appendix 1 Examples of Hospital Strategies to Reduce Hospital Wide All Payer Readmissions Frederick Memorial Hospital Hospital.pdf Johns Hopkins Health System HSCRC-Presentation.pdf Sinai Hospital M%20Presentation.pdf Additional resources and examples
54
55
56 January 5, 2015 Dianne Feeney Associate Director, Quality Initiatives Health Services Cost Review Commission 4160 Patterson Avenue Baltimore, Maryland Dear Ms. Feeney: On behalf of the 64 hospital and health system members of the Maryland Hospital Association (MHA), we appreciate the opportunity to comment on the proposed changes to the Draft Recommendation for Aggregate Revenue Amount at Risk under Maryland Hospital Quality Programs for FY The 8.86 percent of all-payer revenue that the Health Services Cost Review Commission (HSCRC) is proposing to place at risk for quality-related programs is far above the amount at risk in the rest of the nation. This change would subject Maryland s hospitals to an extraordinarily large risk at a time when they are already assuming exceptional risk under global budgets. For performance year 2015, which impacts fiscal year 2017 rates, the HSCRC staff s proposal to place 8.86 percent of inpatient revenue at risk, without counting any of the utilization at risk under global budgets, compares to less than 6 percent of Medicare inpatient revenue, or about 2 percent of all-payer inpatient revenue, at risk nationally, assuming 40 percent of the nation s payer mix is Medicare. Figure 1 shows the significantly greater financial risk to a $200 million Maryland hospital under the December HSCRC proposal to the same hospital in another state. Figure 1 The % at Risk Between MD and the Nation is Dissimilar When the Dollar Value is Considered For Maryland, penalties affect all inpatient revenue under global budgets For hospitals in the rest of the nation, penalties only affect Medicare inpatient revenue Example Maryland Hospital with $200M in Revenue* $120M in Inpatient Revenue 2017 Program % at Risk Dollar Value MHAC 4.00% $4.8M Readmissions 2.86% $3.4M QBR 2.00% $2.4M Example National Hospital With $200M in Annual Revenue* $120M in Inpatient Revenue $48M (40% of Inpatient Revenue) from Medicare $29M (~60% of Medicare inpatient Revenue) from base DRG *Readmission penalties apply to full Medicare payment 2017 Program % at Risk Dollar Value HAC 1.00% $0.29M Readmissions* 3.00% $1.44M VBP 2.00% $0.58M Total Without PAU 8.86% $10.6M Total 6.00% $2.31M When the dollar value of potential penalties is considered against total annual revenue, the Maryland hospital in this example would have $10.6 million or 8.8 percent of revenue at risk versus $2.31 million or 1.9 percent of revenue at risk for the hospital located elsewhere in the nation *Revenues are hypothetical and roughly based on known proportions of inpatient revenue, Medicare inpatient revenue and base MS DRG revenue relative to total hospital revenue
57 Dianne Feeney January 5, 2015 Page 2 The HSCRC staff recommendation seeks to justify this greater financial risk in two ways: The Center for Medicare and Medicaid Innovation (CMMI) requires Maryland to reallocate revenue based on quality performance on a similar scale with the nation; and By contract, Maryland s aggregate amounts at risk for quality-related programs must be on par with the nation over a cumulative period that extends beyond the years in which the new waiver demonstration would be in place. The cumulative period would begin with a performance period in 2012, which corresponds to fiscal year 2014, and presumably extend through the calendar year 2018 performance period which would apply to fiscal year 2020 payment adjustments. We strongly disagree. Neither assertion is supported by the language or the spirit of the agreement between the state of Maryland and CMMI and, as mentioned earlier, this interpretation places an unduly large amount of revenue at risk for Maryland s hospitals. Attempting to shoehorn Maryland s demonstration into the confines of the national payment system with this overly aggressive policy is out of step with the Advisory Council s recommendations that hospital budgets and related policies be set to include incentives for hospitals to manage patients, and allow hospitals flexibility to achieve targets without heavy regulatory intervention. Furthermore, failure to achieve quality programs risk amounts commensurate with national risk amounts is not one of the events that trigger a consequence within the waiver agreement. To uphold the good faith and cooperation required for a successful demonstration, we strongly believe that input from the hospital field is required when interpreting the language of the waiver demonstration contract. It is important to reconcile the revenue at risk assumptions for quality programs with CMMI and the hospital field before any decisions are made by Commissioners about the fiscal year 2017 quality program at risk amounts. In addition, Maryland hospitals utilization risk under global budgets needs to be accounted for in the same way that the national efficiency measure used in the Value-Based Purchasing Program counts towards the sum of the aggregate amount at risk. A fair accounting of the avoidable utilization risk in global budgets is not only appropriate, it helps lower the risk on the other measures in Quality-Based Reimbursement, which are not directly tied to the readmissions and complications metrics under the waiver agreement. It also mitigates concerns with the metric itself, as mentioned in our September 22 comment letter on Quality-Based Reimbursement program recommendations. We also recommend shifting a portion of the revenue at risk from Maryland Hospital Acquired Conditions to readmissions, to reflect Maryland s performance on hospital acquired conditions over the past year and the less clear performance on readmissions relative to our target. Thank you for the opportunity to participate in this process and to comment on this recommendation. If you have any questions, please contact me. Sincerely, Michael B. Robbins Senior Vice President
58
59

60 John M. Colmers Chairman Herbert S. Wong, Ph.D. Vice-Chairman George H. Bone, M.D. Stephen F. Jencks, M.D., M.P.H. Jack C. Keane Bernadette C. Loftus, M.D. Thomas R. Mullen State of Maryland Department of Health and Mental Hygiene Health Services Cost Review Commission 4160 Patterson Avenue, Baltimore, Maryland Phone: Fax: Toll Free: hscrc.maryland.gov Donna Kinzer Executive Director Stephen Ports Principal Deputy Director Policy and Operations David Romans Director Payment Reform and Innovation Gerard J. Schmith Deputy Director Hospital Rate Setting Sule Calikoglu, Ph.D. Deputy Director Research and Methodology To: HSCRC Commissioners From: Claudine Williams, Associate Director, Policy Analysis Re: Modifications to the Draft Recommendation for NSPII Outcome Evaluation FY FY2015 and Recommendations for Future Funding Date: January 7, 2015 This is to advise the Commissioners of the most recent changes to the NSP II Outcomes Evaluation and Recommendations for Future Funding based on inquiries made by the Commissioners. Please note the following changes: Data from the MBON was replaced with data from HRSA regarding nurse workforce supply and demand. HRSA is considered a more reliable source of healthcare workforce data (Pages 3 and 23). Language was added to highlight the importance of subsidizing nurse faculty (Page 5, first paragraph). In addition, salary data comparing nurse faculty to clinical nurses was added to illustrate the discrepancy (Page 9). Chart 3 and 4 were added to illustrate trends in graduate degree production between (Pages 10-11). These tables were missing in the draft report. Data comparing National and Maryland growth in RN supply between (Pages 15-16) and data comparing National and Maryland growth in nurse graduates between , was added to address questions from Commissioners regarding how Maryland compares to the nation (Pages 13-14). Data regarding the change in nursing roles at Maryland hospitals was added to address questions from Commissioners (Pages 19-20).
61 Nurse Support Program II (NSP II) Outcomes Evaluation FY FY 2015 and Recommendations for Future Funding Health Services Cost Review Commission 4160 Patterson Avenue Baltimore, MD January 14, 2015 These recommendations are for Commission action at the January 2015 Public Commission Meeting. 1 P age
62 EXECUTIVE SUMMARY Nurse Support Program II (NSP II) Outcomes Evaluation FY 2006 FY 2015 and Recommendations for Future Funding The Nurse Support Program II (NSP II) is designed to increase the number of hospital bedside nurses by mitigating barriers to nursing education enrollments and graduation. This goal is achieved by expanding academic capacity, including the number of faculty available to teach in Maryland s nursing programs while simultaneously supporting student success. The NSP II has two components, a competitive institutional grant and statewide initiatives. Nine rounds of Competitive Institutional Grant awards totaling $63,374,650 were awarded between fiscal years 2006 and Statewide initiatives provided $27,997,338 to 950 graduate nursing students and faculty across the State in the forms of scholarships, fellowships, or grants to help them begin or enrich careers as faculty in Maryland schools/departments of nursing. Fifteen community colleges and eleven universities across all geographic regions and types of programs participated in the NSP II. All Maryland nursing programs received one or more institutional grant awards. Notable program outcomes include: New Nursing Faculty Fellowships resulted in the recruitment and retention of 245 new faculty members (lecture and clinical) at 12 universities and 7 community colleges. Forty-four percent (44%) were from underrepresented groups in nursing. The retention of new full-time faculty is 88%. Bachelor degree program (BSN) enrollments were 4,086 in 2005 rising to 6,832 in 2013, a 67% increase. Associate degree (ADN) enrollments rose 27% from 9,507 in 2005 to 12,971 in 2013 with assistance from NSP II programs. BSN graduates steadily increased from 1,127 graduates in 2006 to 1,615 graduates in ADN graduates steadily increased from 1,090 in 2006 to 1,726 graduates in Over 5,800 or 27% of 20,967 total Maryland new pre-licensure nurse graduates can be directly tied to competitive institutional grant program outcomes from The number of new pre-licensure nurse graduates passing the National Council Licensure Examination for Registered Nurses (NCLEX-RN) exam on the first attempt has steadily increased from 1,566 in 2005 to 2,598 in Just as important, the first attempt pass rates have remained consistent even as access to programs increased indicating 2 Page
63 maintenance and improvements in Maryland s nursing education programs during a time of unprecedented expansion. According to the U.S. Department of Health and Human Services Health Resources and Services Administration (HRSA) report released mid December 2014 (after the December 10, 2014 Commission meeting), the Maryland nurse workforce increased 38% between Nationally, the increase was 28%. Even with these gains, Maryland is one of 16 states projected to have a significant shortfall of RNs by 2025 (HRSA, 2014). HRSA data is generally considered the most reliable available healthcare workforce data for national comparisons. The NSP II has been successful in increasing the number of available hospital bedside nurses. However, there are indicators that suggest the nursing workforce shortage in Maryland is not fully resolved. Current issues impacting the State s nursing workforce include predicted nurse retirements especially those delayed by economic recession that is now correcting, changes in patient care related to the State s Medicare waiver and the federal Affordable Care Act, hospital migration to magnet status which is associated with better patient outcomes, and changes in hospital health care delivery to a care coordination model. We recommend that the Health Services Cost Review Commission consider five actions, regarding the future direction of the NSP II. 1. Renew NSP II funding at 0.1% of hospital regulated gross patient revenue for five years, FY 2016 through FY Establish a work group to develop updated, specific goals for a competitive institutional grant program and statewide initiatives. 3. Adopt goals and metrics that address the following Institutes of Medicine (IOM) recommendations: #4, #5, #6, & #7 (Refer to the Recommendations Section for full detail on the IOM recommendations). 4. Purchase software to manage and report on outcomes data. 5. Review current NSP II statute, particularly the term bedside nurses to ensure that the statute meets the current needs of health care and movement to coordinated care models. 3 P age
64 EXECUTIVE BRIEF Nurse Support Program II (NSP II) Outcomes Evaluation FY and Recommendations for Future Funding INTRODUCTION The Health Services Cost Review Commission (HSCRC) established the Nurse Support Program II (NSP II) on May 4, The NSP II, administered by the Maryland Higher Education Commission (MHEC) in collaboration with the HSCRC, is designed to increase the State s academic capacity to graduate more nursing students, and is complementary to the Nurse Support Program I (NSP I), a hospital based program. The NSP II is funded through pooled assessments totaling up to 0.1% of hospital regulated gross patient revenue over a ten year period ending June 30, The NSP II employs an effective three-prong strategy for increasing the number of nurses in the State with the ultimate goal of reducing hospital costs. These goals were achieved by increasing the number of nursing lecture and clinical faculty, supporting schools and departments of nursing in expanding academic capacity and curriculum, and providing supports to enhance nursing enrollments and graduation. This Executive Brief describes program outcomes including program impact on the State s nursing workforce. Findings related to nurse supply and demand, the State s academic capacity to increase enrollments and graduation in nursing programs, entry to practice, and the preparation of teaching and clinical faculty are presented. An examination of current and future nurse workforce issues, post NSP II, is presented as well. The Executive Brief concludes with recommendations for the future of the program. Program Inception and Purpose Maryland was one of five states to be granted a Medicare waiver in 1977 which exempted the State from traditional Medicare payments (codified in Section 1814 (b) of the Social Security Act). The HSCRC was established as an independent state agency with full rate setting authority over all general acute care hospitals in Maryland. The HSCRC has the authority to adapt the rate system to changing dynamics within health care. As such, it provides a flexible and stable funding source for the NSP I for hospitals and NSP II for Schools/Departments of Nursing, as part of its larger mission to control costs and ensure the quality of health services. Today, Maryland is the only state that continues to set its own hospital rates for all payers. 4 P age
65 In 2003, the nursing shortage in Maryland was worsening despite the efforts of the NSP I hospital based programs. Vacancy rates exceeded 15%, and the cost of agency nurses was over $144 million (Heller & Sweeney, 2003). There were not enough new nursing graduates to meet hospital workforce demand. Leaders from hospitals and educational institutions realized that a shortage of nursing faculty was restricting the capacity of schools to admit and educate more nurses to meet market demand. The shortage of faculty was due, in part, to the significant salary discrepancy between nurses in practice and nurse faculty/educators, and incentives would be necessary to attract clinical nurses to academic positions. A group of stakeholders interested in statewide solutions helped establish NSP II to satisfy the needs of hospitals for bedside nurses through education focused programs that would grow capacity by increasing the numbers of nursing faculty and nursing students. In 2006, MHEC and the Maryland Board of Nursing (MBON) completed The Maryland Nursing Program Capacity Study requested by Senate Bill 511 (Chapter 487, Acts of 2005). This study built upon the work of the Center for Health Workforce Development and the Statewide Commission on Nursing, which concluded its work in The Nurse Support Program II was established in State statute (Annotated Code of Maryland, Education Article , Nurse Support Program Assistance Fund) and funded through HSCRC rates. A Memorandum of Understanding (MOU) between the HSCRC and the Maryland Higher Education Commission was established, whereby MHEC was charged to administer the NSP II programs under the auspices of the HSCRC. The MOU identified the purpose of the NSP II to: 1) increase the number of bedside nurses in Maryland hospitals; and 2) expand the capacity of Maryland nursing schools to produce qualified nurses to work in Maryland. These goals were achieved through a competitive institutional grant program and statewide initiatives. Statewide initiatives include activities supporting students and faculty while the competitive institutional grant program increased capacity of the nursing programs (HSCRC and MHEC MOU, 2006). Creating a diverse nursing faculty and workforce are also goals for the program. Competitive Institutional Grant Program and Statewide Initiatives Two types of programs are supported by the NSP II. These include the Competitive Institutional Grant Program and Statewide Initiatives. A brief description of each type of program follows. Competitive Institutional Grant Program. Competitive institutional grants are 5 P age
66 designed to increase the structural capacity of Maryland nursing schools through shared resources, innovative educational designs, and streamlined processes to produce more nurse faculty, and nursing undergraduate and graduate nurses. Grants support activities such as the establishment of new degree programs, curriculum enhancement and redesign, student retention initiatives, and simulation and other productivity enhancing instructional technologies. The grants also contribute to the creation of a more diverse nursing faculty and workforce. Many grant projects prepare more graduate level nurses qualified to serve as lecturers and/or clinical faculty at Maryland's higher education institutions. Statewide Initiatives. Statewide initiatives include the New Nurse Faculty Fellowships (NNFF), the Nurse Educator Doctoral Grants for Practice and Dissertation Research (NEDG), and the Hal and Jo Cohen Graduate Nursing Faculty Scholarship and Living Expenses Grant (GNF/LEG). The NNFF provides funding for newly hired nursing faculty to support their research and teaching. Funds assist faculty with the work necessary to gain tenure, and support faculty retention. The NEDG provides funds to support doctoral nursing students during their critical final phase of graduate study the dissertation or capstone project. Research suggests that this is a critical retention junction as many students drop out at this point. The NEDG, a relatively new program, appears to positively impact retention and completion. The Hal and Jo Cohen graduate financial aid programs provide powerful incentives for currently practicing nurses, and others to pursue graduate level education and pursue faculty positions in both classroom and/or clinical settings. Program Sunset and Evaluation Methodology New funding that supports the NSP II ends in FY At the request of the HSCRC, MHEC and HSCRC staff conducted a comprehensive program review. Assistance was provided by a Nursing Faculty Advisory Group, representatives of the Maryland Hospital Association, and NSP I Nurse Residency leaders with the Maryland Organization of Nurse Executives. NSP II competitive institutional grant recipients were instrumental in the collection of project outcomes data and collaborated with nurse executive leaders on hospital based measures. Data was collected and compiled for all NSP II funded projects for all years of activity where data was available. Excel and SPSS were used to compile and analyze the data. Both quantitative and qualitative data analysis was applied, most notably descriptive statistics, case 6 P age
67 study, and thematic analysis. Outcomes were compared to project goals. A summary of important outcomes is discussed in the following section. Findings on the most successful strategies utilized by NSP II and suggested revisions for improvement are included in the review of activities and outcomes. NSP II PROGRAM EVALUATION AND OUTCOMES Competitive Institutional Grants Overview Nine rounds of institutional competitive grants were awarded between July 1, 2005 and June 30, 2014, totaling $63,374,650. A total of 109 institutional multi-year grants were awarded through a competitive review process. Fifteen community colleges and eleven universities received funding. Grant recipients included schools or departments of nursing at public universities including the State's four historically black institutions, independent colleges and universities, and community colleges. The distribution of awards was geographically diverse with three institutions in Western Maryland, two institutions on the Eastern Shore, three institutions in Northern Maryland, and one institution in Southern Maryland. The remaining institutions are located in the central region of the state and Baltimore City. Grant recipients received funds in installments over the life of the grant contingent upon adequate yearly progress. Forty-one (41) projects have successfully concluded allowing for a detailed analysis of the strategies used by the most successful awardees. Sixty-eight (68) awards remain open, some with annual payments extending into FY 2017 (with funds accrued through FY 2015). While these projects have not yet concluded, annual outcomes to date are included in the data analysis. Statewide Initiatives Overview There were eight funding cycles for the NNFF and GNF/LEG. There were two funding cycles for the NEDG. A total of $27,997,338 has been disbursed to date through these programs. Nurses either committed to become nursing faculty through attainment of graduate education, or advanced their careers (tenure-track) as faculty by earning a doctorate, or joined an institution as a new faculty member. A description of each program within the Statewide Initiatives follows. New Nursing Faculty Fellowships (NNFF). The Nurse Support Program II provides funding for New Nursing Faculty Fellowships to newly hired faculty. These fellowships assisted Maryland nursing programs in recruiting and retaining new nursing faculty to produce the additional nursing graduates required by Maryland's hospitals. Since FY 2007, 245 new faculty members have been 7 P age
68 recruited through this program and received a total $4,105,000. Each fellowship is funded for three years. The retention rate for these faculty members is presently 88%. Overall, 44% (n=108) were from underrepresented groups in nursing (ethnic and racial minorities and males). The participating Academic Deans and Directors unequivocally stated that this was an effective tool that helped them recruit and retain new highly qualified professors. The NNFF recipients were allowed to use funds to pay down student loans, attend and present at professional conferences, conduct research, develop publications for refereed journals (a tenure-track requirement), and other professional development activities. Nurse Educator Doctoral Grants for Practice and Dissertation Research (NEDG). The NEDG provides grants to doctoral students, some of whom may be serving as nursing instructors or assistant professors, to complete the final phase of their doctoral program, the dissertation (Doctorate of Philosophy, PhD) or capstone (Doctorate of Nursing Practice, DNP). Funds may be used to offset research, tuition, and other educational costs related to expediting degree completion. Since inception in 2012, at the request of the HSCRC, there have been 26 awards totaling $630,000. After doctoral completion, the newly conferred PhDs and DNPs provide the abstracts and citations of their dissertations, capstone project papers, and any published work or other scholarly projects. Many doctoral projects are focused on educational issues in nursing; i.e. simulation, medication errors, student retention, faculty shortage and teaching modalities which inform best practices in nursing education and clinical practice. Hal and Jo Cohen Graduate Nursing Faculty Scholarship and Living Expenses Grant (GNF/LEG). The GNF and LEG supported registered nurses to enter graduate nursing programs in Maryland and to complete the coursework to be qualified as nurse faculty. The scholarship is contingent upon a service obligation to teach nursing in nursing program in Maryland. Recipients who are unable to meet the service obligation must repay the GNF through a bond repayment plan. The scholarship supports Masters and Doctoral degree enrollment, as well as, a postgraduate teaching certificate. Since FY 2007, a total of 679 nurses have been awarded $19,068,978 in scholarships for tuition and living expense grants. Most of these recipients were nurses pursuing Masters Degrees (a pre-requisite for doctoral level study). Nine recipients have completed their teaching service obligation, 159 are working as Maryland nursing faculty in fulfillment of the service obligation, 156 recent graduates are seeking teaching positions, 30 are 8 P age
69 in repayment and 10 have completed repayment. The remaining students are enrolled in graduate degree programs (Masters or Doctoral level). Post-Nursing Licensure Masters and Doctoral Degree Enrollments The most salient goal of the NSP II program is to increase the academic capacity of nursing programs in order to produce more qualified nurses. One way that this goal is being achieved is by "growing our own" nursing faculty. The competitive institutional grant and statewide initiatives support projects that expand the pool of nurses and nursing students with the graduate credentials necessary to become faculty members. These programs also provide incentives to pursue teaching versus practice given that nursing practice commands much higher salaries than college-level teaching. In Maryland, the median salary for a registered staff nurse is $71,017, compared to the median salary of $61,725 for newly hired Assistant Professor in Nursing (Salary.com, 2015). These glaring discrepancies between clinical salaries and administrative salaries as compared to academic salaries are disincentives for nurses contemplating a move to educator roles, (HRSA, 2010). Four new Master s Degree programs and four new Doctorate of Nursing Practice (DNP) degree programs are directly attributable to the NSP II. These new programs have enrolled 1,445 new Masters and 526 new Doctoral students since opening for business from Simultaneously, enrollments in existing programs were significantly expanded. Graduate nursing student enrollments have increased by 219% between 2005 and 2013 with support from NSP II funds. Total doctoral enrollments have increased from 87 in 2005 to 229 in 2013, representing a 245% increase. In addition, many students completed teaching certificates specifically designed to prepare nursing educators developed through the support of NSP II. Refer to the tables below. 2,000 1,500 1, Masters of Science, Nursing (MSN) Enrollments Enrollments ,078 1,296 1,397 1,483 1,644 1,700 1,691 Chart 1 9 P age
70 Doctoral Level Nursing Enrollments (PhD, DNP) PhD DNP Chart 2 Source: Maryland Higher Education Commission Enrollment Data System (Charts 1 and 2) Post-Nursing Licensure Masters and Doctoral Degree Production Graduates from Masters programs have increased by 219% between 2005 and 2013 with support from NSP II funds (Chart 3). Doctoral degree conferment has increased as well (Chart 4). Since the first graduates in 2006, 621 new Masters and 203 new Doctoral degrees can be directly attributed to the grant from measurable outcomes reported by project directors on annual and final reports. In addition, 38 Nurse Educator Teaching Certificates were completed at post-graduate programs. Chart 3 10 P age
71 Doctoral Degrees Conferred Chart 4 Source: Maryland Higher Education Commission Degree Information System (Charts 3 and 4) NSP II Impact on Enrollments in Undergraduate Nursing Programs The NSP II strives to increase student enrollments and degree production in all levels of undergraduate nursing programs - both two- and four-year degrees. By increasing the number of nursing faculty through the production of graduate level preparation, undergraduate programs can likewise grow. Associate Degree Nursing (ADN) program enrollments were 9,670 in 2006 compared to 12,071 in 2013 (45% increase). ADN enrollments leveled off after 2010 due to increasing emphasis on student retention in the ADN program, changes to the federal Pell Grant program, and increasing demand for Bachelor of Science in Nursing (BSNs) as hospitals sought Magnet status. Refer to the table below. New graduate RNs complete either ADN or BSN programs prior to the licensing examination. After gaining licensure, the ADN RNs may continue to BSN completion. All BSN nurses may then continue in post-graduate Masters or Doctoral programs. There is a growing demand for seamless progression from the ADN to the BSN. Recently, NSP II funded new models for dual enrollment are increasing the RN to BSN options available to current registered nurses holding two-year degrees. During the same time period, enrollments in BSN programs increased from 4,571 in 2006 to 6,832 in 2013 (67%). After a brief leveling between 2011 and 2012, BSN student enrollments appear to be increasing again. 11 P age
72 Chart 5 Source: Maryland Higher Education Commission Enrollment Data System Degree Production (ADN and BSN) In 2013, 1,726 ADNs were awarded compared to 1,090 in 2006 (58% increase). Furthermore, ADNs increased steadily each year from 2007 forward as the NSP II program implementations gained strength. These same associate degree trained nurses are able to take advantage of ADN to BSN programs supported by NSP II funds. Similarly, in 2013, there were 1,615 BSN degrees awarded compared to 1,127 in This is a 43% increase. BSN production increased most dramatically in 2011, 2012, and 2013 reflecting new students who entered BSN programs in 2008 or later as NSP II supported programs were fully ramped up. 12 P age
73 Chart 6 Source: Maryland Higher Education Commission, Degree Information System The overall number of nursing graduates in Maryland has increased by 43%, compared to a national increase of 21% between 2008 and 2013 (Chart 7). While some undergraduate nursing degree increase is attributable to natural growth, data provided by NSP II competitive institutional grant project directors suggest that over 5,800 or 27% of all undergraduate nursing degrees produced between are directly attributable to the NSP II competitive institutional grant program focused on student retention initiatives, redesigned curriculum options, and new programs. This number does not include the number of new students admitted and graduated due to an increase in the number of faculty recruited through statewide initiatives. In addition, a new NSP II funded RN (ADN) to BSN program in western Maryland and expansion of similar existing programs produced 506 new BSNs who were formerly RNs with two-year degree credentials. 13 P age
74 Chart 7 Source: Maryland Higher Education Commission Degree Information System. HRSA. (2014). The Future of the Nursing Workforce: National-and State-Level Projections, NCLEX Pass Rates The number of Maryland nursing graduates passing NCLEX exams on the first attempt has steadily increased over the course of the NSP II Program from a baseline of 1,566 in 2005 to 2,598 in This represents a 66% increase in the number of newly licensed RNs passing licensure on the first attempt across the state. The percentage of students passing the NCLEX in one or more attempts was 87% in 2005 and 86% in 2013 suggesting that even as access to nursing programs expanded, quality as demonstrated by the NCLEX pass rate has been reasonably maintained. 14 P age
75 Number of Nursing Students Passing NCLEX-RN on the First Attempt 3,000 2,500 2,000 1,500 1,000 Source: Maryland Board of Nursing Chart 8 NSP II Impact on the Nursing Workforce - Diversity, Nurse Vacancy Rates, Agency Nurse Use and Cost The Maryland nursing workforce shortage has been mitigated by NSP II educational interventions targeting institutions and individuals. At the institutional level, competitive grants increased educational capacity of schools to enroll and graduate new nurses. At the individual level, financial aid and fellowships were awarded to nurses who committed to become and/or be retained as nursing faculty in Maryland. In addition to increasing the number of nurses, NSP II programs helped to educate a more diverse cadre of nurses by engaging Maryland's historically black colleges and universities (HBCU) and urban and rural serving community colleges. While MHEC and the HSCRC have not been able to collect needed demographic workforce data, it is well understood that Maryland's HBCUs and community colleges serve a highly diverse student body by race/ethnicity, age and socioeconomic status. The NSP II has also impacted hospital nurse vacancy rates, agency nurse use, and costs. A more detailed discussion of the impact on vacancy rates, agency nurse use and costs follows. Based on recent HRSA nursing workforce supply data from 2000 through 2012, Maryland s rate of increase between 2008 and 2012 outpaced the national rate of increase in the supply of registered nurses (Chart 9). Nonetheless, Maryland is projected to experience a nursing workforce shortage into 2025 (HRSA, 2014). This suggests that Maryland may have started at a greater workforce deficit than the national average. This data also suggests that 15 P age
76 the NSP II investments in expanded academic capacity have contributed to the remarkable growth in not only graduates but the workforce. Chart 9 Source: HRSA. (2000). The Registered Nurse Population, HRSA. ( ). The Future of the Nursing Workforce: National-and State-Level Projections, Nurse Vacancy Rates. In 2002, prior to the NSP II, the Maryland hospital nurse vacancy rate was 15.6%, according to the Maryland Hospital Association Annual Hospital Personnel Survey. By 2007, after the NSP II was implemented, the Maryland hospital nurse vacancy rate had dropped to 10.2%. In 2011, it dropped to 5.6% and hovered around 5.3% through 2012 (MHA, 2012). To compensate for nurse vacancies, hospitals were forced to use costly strategies such as overtime, agency staff, and travel nurses. These strategies also had the potential to negatively affect quality, safety, the patient experience, physician satisfaction, and hospital employee job satisfaction. Data on Maryland agency nurse use shows a sharp upward trend, which suggests that nurse vacancy rates are on the rise again (Chart 10). 16 P age
.")
77 Agency Nurse Use. The NSP II appears to have had some positive impact on the costly use of agency nurses by Maryland hospitals. Agency nurse use declined sharply between 2008 and 2011 but is currently on the rise (HSCRC, 2014). Agency nurse use increases costs to hospitals struggling to permanently fill positions and meet patient service levels. Current agency nurse rates range from $55 to $78 per hour depending on area of practice, contract status and schedule. This is a sharp contrast with the average staff nurse s base salary of approximately $36 to $40 per hour. Maryland hospitals vary in full time nurses and nursing hours. In 2012, there were 22,365 RNs employed at 67 hospitals (AHA 2012). Using an average of 334 RNs, the difference in the average cost of nurse hours between agency RNs and full time employee RNs at an average hospital could be $16,673,280. In the three years since the NSP I evaluation report, agency nurse use has risen substantially, due in part to hospital s efforts to adjust to the new Medicare waiver requirement. As nurses left positions, hospitals were more selective in hiring replacement nurses. Furthermore, hospital nurse leaders report hiring is increasing this year, after the contractions of services and changes within the industry in the last two years (HSCRC & MHEC meeting, 10/27/14). Statewide Agency Nurse Use: Costs and FTEs Source: HSCRC Wage and Salary Survey Chart P age
78 FUTURE DIRECTIONS FOR THE NSP II Evolving Issues Impacting Maryland s Hospital Nursing Workforce In considering Maryland s hospital nursing workforce needs and implications for the possible renewal and revision of the NSP II program, several changes in the healthcare landscape are noted. These include changes in the federal healthcare programs, best practice recommendations from the Institutes of Medicine, the changing roles of nurses, and the increased emphasis on quality and patient satisfaction. A discussion of the impact of these changes, the projected job openings through 2022, potential nursing shortages, and changing demographics will follow. Federal Programs. In 2010, the federal Affordable Care Act (ACA) was signed into law. It represents the most significant change to national health care laws since the 1965 enactment of Medicare and Medicaid programs. The ACA currently provides insurance coverage to 67,000 Marylanders who previously lacked health insurance; however, this number is expected to grow. This estimate does not include newly eligible Medicaid recipients from the expanded income requirements, or the estimated 90,000 primary adult care eligible citizens that were not covered for non-emergent hospital services before the ACA was enacted. The ACA will increase demand for nurses as it strives to build a health care system that meets the national Triple Aim for healthcare better health, better care, and lower cost. The HSCRC collaborated with the Centers for Medicare and Medicaid Services to modernize the State s Medicare waiver in January Hospitals now operate on value of services model rather than a volume model. Rates are tied to improvements in the health care quality, population health, and per-capita cost growth. As a result, unnecessary and potentially avoidable services and procedures that formerly brought revenue now increase cost; preventative services and primary care now become key to reducing avoidable utilization. This means that developing strategies that help individuals stay healthy, reduce hospital readmissions, and prevent avoidable adverse outcomes are essential in the ultimate success of the new All-payer model. Hospital-based nurses providing interventions to improve coordinated recovery and transition to home can make dramatic differences in care, and at the same time reduce cost. As the largest group of health professionals, nurses have many opportunities to influence patient outcomes. This shift also requires new training in the form of continuing education, nurse preparation program curriculum revisions, and nurse educator knowledge. 18 P age
79 IOM Recommendations for Nursing. In 2010, The Future of Nursing: Leading Change, Advancing Health report was released by the Institutes of Medicine (IOM) in partnership with the Robert Wood Johnson Foundation. The report articulated the importance of nurses in providing safe, quality, accessible, affordable, and patient-centered care, and offered eight recommendations for action by states. Nursing leaders in Maryland formed the Maryland Action Coalition to promote the implementation of the recommendations as a blueprint for the nursing profession. Since the 2010 release of the IOM report recommending an increase in the number of BSN prepared nurses to 80% of all RNs by 2020, it has taken three years to improve from 50% to 55%. Beginning in 2014, hospitals seeking magnet hospital recognition must have an action plan and demonstrate progress toward achieving the 80% of nursing staff with BSN goal. The push behind more highly educated nurses is based on recent studies that suggest higher levels of nurse education are linked to better patient outcomes. For example, one study showed a 10% increase in the BSN workforce proportion reduced the odds of patient mortality by 10.9% (Yakusheva, et al., 2014). Changing Role of Nurses and Hospital Nurses in Particular. Hospital nurses are at the forefront of moving from practices based purely on acute care admission frameworks, towards models based on health promotion and population health. Hospitals have or are restructuring to provide for whole person health care delivery. Continuity of care across acute and chronic conditions can be managed through a partnership among providers, payers and patients/families. The care coordination models demonstrate improved outcomes in the acute care inpatient settings when RN care coordinators, primary care physicians, other members of the health team and patient/family interact openly and participate in decision-making. Collaboration between patient and provider partners leads to better self-care management, improved functional health and reduced readmissions. Nurses are central to care coordination for their clinical expertise, critical thinking, and organizational skills (Hajewski & Shirey, 2014). Nurses are positioned to coordinate transitions to home because they are the largest group of care providers, spend the most time interacting with patients, and are integral to safe discharge planning through identifying specific factors that may require attention within the patient s home environment. According to a recent survey of hospital nursing executives, over half (N=17/32; 53%) of the respondents plan to create new nursing job classifications in the coming year. The anticipated new roles included hiring of Care Navigator (N=9/14; 64%), Clinical Documentation Specialist 19 P age
80 (N=9/14; 64%), Care Coordinator (N=7/14; 50%), and Quality and Patient Safety Specialist (N=7/14; 50%) (MONE Survey, 2015). Emphasis on Quality and Data. The Department of Health and Human Services (DHHS, 2014) reported on data from the National Database of Nursing Quality Indicators (NDNQI) on nurses impact on patients. Through quality focused initiatives, nurses saved $4 billion in health care spending, decreased the hospital acquired conditions by 9%, reduced readmissions for Medicare patients by 8%, prevented 560,000 patient injuries, and saved 15,000 lives. Maryland is one of 14 states that increased the number of data points collected to be reported nationally. The nurse sensitive quality measures link nursing services with quality of care, patient outcomes and cost of care. The Magnet designation through the American Nurses Credentialing Center (ANCC) recognizes hospitals for nursing excellence. Hospitals commitment to staffing with highly trained nurses and putting them in leadership positions which allow them to have substantial input into patient safety issues is a benchmark for consumers seeking care. Patient experience as measured by Maryland HCAHPS scores for CY 2012 was compared among Magnet designated and non-magnet designated acute care hospitals. As seen below, Magnet designated hospitals HCAHPS scores were consistently higher than non- Magnet designated hospitals. For 2012, Magnet designated hospitals scores ranged from 1.64% to 7.92% higher. Statistically significant differences were found for overall hospital rating, willingness to recommend the hospital and discharge teaching indicating patients had a better experience at a hospital with Magnet designation. 20 P age


81 Table 1 Funds Supporting Nursing Programs. The Nurse Support Program I, implemented in 2001, was designed to support hospital based nursing workforce initiatives for acute care nurses and serves as a companion and complementary program to the NSP II. Due to program success in creating hospital savings, the HSCRC renewed the NSP I in June of 2012 for five years to continue this successful program. Economy and Demographics. The recession of 2008 prompted nurses to delay retirements, increase hours of work, and/or return to work. As a result, hospitals and other employers experienced reduced turnover in nursing staff (Auerbach, et al., 2013). Nursing vacancy rates trended downwards and have held steady around 5% (MHA, 2012). Retiring baby boomers, rising chronicity, accelerating acuity, and the implementation of the ACA are cited among the reasons that have combined to make nursing the top occupation for job growth through 2022 (BLS, 2013). The following figures illuminate the specific need for additional nurses and nursing faculty in Maryland. 1. RN employment is projected to grow 22.3% in Maryland between 2008 and 2018 (DLLR, 2010). An estimated 19,450 RN job openings are expected in Maryland between (DLLR, 2014) 2. In Health Care 2020, the Governor s Workforce Investment Board called for an increase of up to 25% in the state s health care workforce before 2020 to accommodate expanded access to coverage for an estimated 290,000 Marylanders under the ACA (GWIB, 2011). 21 P age
82 3. The Health Resources and Services Administration (HRSA) reported in April 2013 that one third of the current national nursing workforce is older than 50 and will reach retirement age over the next years. Maryland ranks 25 th among states in its per capita RN workforce with RNs per 100,000 population (HRSA, 2013). 4. The Bureau of Labor Statistics Employment Projections indicates the RN workforce will grow from 2.71 million in 2012 to 3.24 million in 2022, an increase of 526,800 or 19%. The job openings for nurses due to growth and replacements will require an additional 525,000 RNs to meet the need for 1.05 million RNs by 2022 (BLS, 2013). 5. Maryland is one of the sixteen states projected to experience a smaller growth in RN supply relative to state-specific demand, resulting in a shortage of RNs by 2025 (Table 2). Maryland is the only state within the neighboring geographic states of Delaware, Virginia, West Virginia, and Pennsylvania expected to see large declines in the adequacy of the RN workforce. (HRSA, December, 2014). Table 2: Statewide Current and Projected Nursing Supply and Demand Projected State Supply & Demand Demand Supply Difference Maryland 60,600 72,000 59,900-12,100 Virginia 69,900 87, , ,400 Pennsylvania 145, , , ,800 Delaware 10,600 12,500 16,200 +3,700 West Virginia 20,600 21,100 29,000 +7,900 US 2,897,000 3,509,000 3,849, ,000 Source: HRSA (2014).The Future of the Nursing Workforce: National and State Level Projections, Notes: Projections assume demand and supply are equal in 2012 and nurses remain in their state of training. 22 P age
83 STAFF RECOMMENDATIONS FOR THE NSP II GOING FORWARD Recommendation 1: Renew NSP II funding for five years, FY 2016 through FY The NSP II has been a successful strategy for increasing and sustaining the State s academic capacity to produce nursing graduates while simultaneously maintaining the quality of those graduates as indicated by NCLEX pass rates. This goal has been achieved by increasing nursing faculty ranks through a grow your own program, adding new graduate level nursing programs, creating an educator certificate to help practitioners become effective nursing teachers, and by providing the necessary academic support and financial aid to attract nurses to graduate level education. At the same time, undergraduate programs including ADN to BSN programs have been implemented to ensure a strong supply of entry level nurses into the workforce. Even so, with today s healthcare landscape it is unclear that nursing workforce demands have been met. In fact, based on the considerations outlined in the evolving issues section above, data suggest the need for more highly trained nurses will continue to escalate which in turn will challenge nurse preparation programs to update curriculum, offer innovative instructional delivery, and increase enrollments. According to a sample of 50% (n=13) of Maryland Nursing Programs 2012 reports, 1,120 qualified nursing applicants are still turned away due to enrollment limits (Maryland Deans and Directors, 2014). The NSP I, which was recently renewed, supports ongoing education for staff nurses with the goal of increasing nursing quality placing further pressure on nursing education programs. Therefore, MHEC and HSCRC jointly propose to renew the NSP II funding at 0.1% of hospital regulated gross patient revenue for five years, FY 2016 through FY 2020, with the following recommendations. Recommendation 2: Establish a work group to develop specific goals for a competitive institutional grant program and statewide initiatives based on IOM recommendations. Assuming a renewal for the NSP II, the program content of a new NSP II Phase 2 should be changed to address the evolving needs of hospitals and healthcare providers in Maryland. In developing revised and possibly new NSP II programs, it is imperative to take the changes in healthcare, as noted in the previous sections, into account. The ACA, in particular will have significant impact on the role of nurses in hospitals (and other settings) as hospitals move toward care coordination and improving health management models. Furthermore, selected 23 P age
84 recommendations from the IOM can serve as guidelines to enhance the quality of care. The key messages in the IOM report suggest that states should strive to 1) Improve education systems so that they promote seamless academic progression across broadly independent community college systems and university systems for nurses to achieve higher levels of education and training; and 2) Engage in effective workforce planning and policy making that requires better data collection and an improved information infrastructure. We recommend that although the program should still contain competitive institutional grants and statewide initiatives, the goals and initiatives should be updated to address these issues. These new goals should be set through a collaborative workgroup established by the HSCRC and MHEC. Recommendation 3: Adopt goals and metrics that address the following Institutes of Medicine (IOM) recommendations: #4, #5, #6, & #7 The following IOM Recommendations should serve as drivers for a new NSP II Phase 2. IOM Recommendation #4: Increase the proportion of nurses with a baccalaureate degree to 80 % of all RNs in the workforce. As reported above, Maryland nursing programs are expanding enrollments and graduates, but the number of seats available in RN-BSN programs is unclear. A concerted effort in the Competitive Institutional Grants needs to be directed through a specific initiative to address the 58% of Maryland s new nurse graduates with Associate Degrees. Meeting the goal of 80% BSN by 2020 will take seamless academic progression. NSP II has funded several models for dual enrollment to assist students in connecting with a university BSN program while enrolled in the community college. Metrics need to be developed to track the number of RN-BSN completions and the number of RN-BSN openings across Maryland. At present, graduations are not always identified as either new undergraduate BSN or RN to BSN completions. Efforts to increase BSN prepared nurses should take into consideration strategies to increase the diversity of the nursing workforce in race/ethnicity, gender and geographic distribution. NSP II statute clearly supports increasing underrepresented groups in nursing to more closely mirror the population for whom they provide health services. IOM Recommendation #5: Double the number of nurses with a doctorate by Adding to the cadre of nurse faculty, nurse researchers and advanced practice nurses is important to the future of the nursing workforce. A broad goal is ensuring at least 10% of all BSN graduates matriculate into a master s or doctoral level program within five years of graduation. Continued funding for scholarships for tuition and all fees, faculty fellowships and grants for educational 24 P age
85 loan repayments, and completion of doctoral dissertations are key to maintaining the growth in graduate programs reflected in this report. Identifying promising undergraduates at earlier career points and guiding them into faculty roles is a specific goal for faculty as they mentor the younger generation of nurses. IOM Recommendation #6: Ensure that nurses engage in lifelong learning. Academic administration should provide support for all nursing faculty members to participate in continuing professional development. Demonstrations of educational excellence include obtaining and maintaining credentials and evidence of competence in practice, teaching and research. Foster a culture of lifelong learning and provide resources for inter-professional education. IOM Recommendation #7: Prepare and enable nurses to lead change to advance health. Nursing education programs and nursing associations should prepare the nursing workforce to assume leadership roles across all levels. Healthcare decision makers should make room for nurses on boards and commissions to help make health decisions. Recommendation 4: Purchase software to manage and report on outcomes data. There are several administrative and operational issues to be considered as part of the administration of a new NSP II Phase 2. These recommendations stem from lessons learned in the administration of both the NSP I and NSP II, as well as emerging needs for evidence based practice in nursing education and workforce outcomes. One way to address some of these issues may be through a small competitive research grant program. Outcomes measures and data management are critical to making informed policy and programmatic decisions. In addition, software tools are needed to manage and analyze a high volume of outcomes data from the NSP II (and NSP I) projects. An investment in such software could also improve staff productivity by increasing ease of analysis and reporting. Effort must be made to identify metrics that link the Triple Aim with nurse sensitive measures and nursing workforce programs to demonstrate the connection of nursing professionals with population health delivery. Over the last 3 years, several multi-hospital studies added substantial support for a hospital-level association of nurse educational levels with patient outcomes. It was found that hospitals with a 10% higher BSN proportion had a 4% 7% lower 30-day mortality, reduced complication rates and better outcomes on length-of-stay (LOS), 25 P age
86 measures of failure to rescue, congestive heart failure mortality, pressure ulcers, postoperative deep vein thrombosis or pulmonary embolism (Yakusheva, et al., 2014). MHEC and the HSCRC should investigate and possibly purchase the Efforts to Outcomes software or some similar software for the evaluation of NSP II over the next five year period. Recommendation 5: Review current NSP II statute, particularly the term bedside nurses to ensure that it meets the move toward a coordinated care model. Determine whether amended statutory language needs to be submitted to the Governor and Legislature particularly the definition of bedside nurses given the shift towards coordinated care approaches. The relevant statute is found at General Assembly Education Article, Section CONCLUSION The NSPII program has been successful in improving the pipeline for nurses and reducing the need for hospitals to depend on expensive nurse staff agencies. However, a combination of the recovery in the economy, the implementation of the Affordable Care Act, and the recent approval of the new All-payer model in Maryland, nursing functions and demands are changing. The NSP II program can be one tool to help Maryland alter its nurse workforce to meet these new demands. During the course of this evaluation, it became clearly evident that there is a continued need for coordinated nursing related data. Recommendations in two key reports in 2011, Health Care 2020 and the Sunset Review: Evaluation of the State Board of Nursing, focused on improved nursing data infrastructure in Maryland. The current Maryland Longitudinal Data System for education may serve as a model for this type of coordinated data collection. Although there was much discussion on IOM Recommendation 8 (build an infrastructure for the collection and analysis of inter-professional health care workforce data), this was not an issue that the NSP II can tackle alone. While outside the scope of the NSP II, but nonetheless related to its work, the State should charge agencies within the state such as DHMH, MBON, MHEC, DLLR and GWIB to determine the best method of addressing data infrastructure. It represents a larger need within health workforce management and should be reviewed by a task force composed of representatives from multiple agencies and organizations. 26 P age
87 REFERENCES American Hospital Association (2012). AHA Annual Survey. Received September, Allan, J., Crowley, C., Ports, S., & Aldebron, J. (2010). Developing a statewide solution to the faculty shortage in Maryland. Journal of Nursing Regulation, 1(3), Auerbach, D.I., Staiger, D.O., Muench, U. & Buerhaus, P.I. (2013). The nursing workforce in an era of health reform. New England Journal of Medicine, 368(16), Doi: /NEJMMpl Governor s Workforce Investment Board (November, 2011). Preparing Maryland s Workforce for Health Reform: Health Care Accessed at Hajewski, C. & Shirey,M. (2014). Care coordination: a model for the acute care hospital setting. Journal of Nursing Administration, 44(11), Health Services Cost Review Commission, Maryland s All Payer Hospital Payment System, Executive Summary, Dr. Hal Cohen. Accessed at /MarylandAll-PayorHospitalSystem.pdf Health Services Cost Review Commission, Wage and Salary Report Heller, B & Sweeney, D. (2003. Maryland s Nursing Shortage: A Workforce Crisis. Center for Health Workforce Development, University of Maryland, Baltimore, M.D. Accessed at Institute for Health Care Improvement, IHI Triple Aim, Accessed at Institute of Medicine. (2010). The Future of Nursing: leading change advancing health. Washington, DC: The National Academies Press. Maryland Board of Nursing (2013). NCLEX Pass/Fail Rates by Education Program in the State of Maryland. Accessed at Maryland Department of Labor, Licensing and Regulation, Healthcare Practitioners and Technical Occupations- Maryland Occupational Projections Accessed at Maryland Higher Education Commission (2014). Nurse Support Program II. Accessed at Maryland Hospital Association, Annual Hospital Personnel Survey Report, CY P age
88 Maryland Organization of Nurse Executives, Workforce Survey, completed January 5, 2015 Nurse Support Program II Advisory Group, meeting at HSCRC on October 27, 2014, personal communication of members with HSCRC and MHEC staff on nursing data and implications. Median Salaries for Nursing Positions in Maryland. Salary.com Accessed at Sunset Review: Evaluation of the State Board of Nursing (October, 2011). Maryland Department of Legislative Services, Office of Policy Analysis, Annapolis, Maryland. Accessed at Salary.com Salary Wizard - Do you know what you're worth? (2015, January 7). Retrieved from MD.aspx?&yearsofexperience=0 Salary.com Salary Wizard - Do you know what you're worth? (2015, January 7).Retrieved from MD.aspx?&yearsofexperience=0 The Maryland Nursing Program Capacity Study (2006) Maryland Higher Education Commission and Maryland Board of Nursing, Report requested by Senate Bill 511. Accessed at U.S. Department of Health and Human Services, Health Resources and Services Administration, National Advisory Council on Nurse Education and Practice. The Impact of the Nursing Faculty Shortage on Nursing Education and Practice. Rockville, Maryland U.S. Department of Health and Human Services, Health Resources and Services Administration, National Center for Health Workforce Analysis. The Future of the Nursing Workforce: National- and State-Level Projections, Rockville, Maryland, ions.pdf U.S. Department of Health and Human Services. Health Resources and Services Administration, The Registered Nurse Population, Findings from the 2008 National Sample Survey of Registered Nurses, September, 2010, Rockville, Maryland U.S. Department of Health and Human Services, Health Resources and Services Administration, Bureau of Health Professions, National Center for Health Workforce Analysis. (2013). The US Nursing Workforce: Trends in Supply and Education. Washington, D.C. Accessed at 28 P age
89 U.S. Department of Health and Human Services (May, 2014). New HHS Data Shows Major Strides Made in Patient Safety, Leading to Improved Care and Savings, Accessed at U.S. Department of Labor, Bureau of Labor Statistics, Occupational Outlook Handbook, Registered Nurses, Accessed at Yakusheva, O., Lindrooth, R. & Weiss, M. (2014). Economic evaluation of the 80% baccalaureate nurse workforce recommendation: a patient-level analysis. Medical Care, 52(10), P age
, we appreciate the opportunity to comment in support of the Nurse Support Program II (NSP II) Outcomes Evaluation FY 2006")
90 January 6, 2015 Steve Ports Deputy Directory, Policy and Operations Health Services Cost Review Commission 4160 Patterson Avenue Baltimore, Maryland Dear Mr. Ports: On behalf of the 64 members of the Maryland Hospital Association (MHA), we appreciate the opportunity to comment in support of the Nurse Support Program II (NSP II) Outcomes Evaluation FY 2006 FY 2015 and Recommendations for Future Funding. Since its inception, NSP II has positively impacted nursing programs by expanding capacity and supporting student success. MHA s Who Will Care? Fund for Nurse Education, established in 2006, shared these goals and worked to double the number of RN graduates in Maryland. Despite these investments and significant achievements, we know that the nursing workforce shortage in Maryland is not fully resolved. According to the Health Resources and Services Administration, Maryland currently ranks 25 th among states in its per capita RN workforce. Maryland s modernized waiver committed our hospitals to leading the nation and achieving the elusive Triple Aim of healthier communities, better care, and lower costs. If it is successful, Maryland s system will serve as a model for the nation; accordingly, our investment in the health care professionals who are integral to our success should match our commitment to these goals. We must develop and invest in programs that keep individuals healthy, reduce hospital readmissions, improve patient experience of care, and prevent avoidable complications. We were pleased to see staff s recognition of the need to prepare nurses for work involving population health, including patient centered medical home models, home care, care management, nursing homes, and other care settings. In order to ensure that the transformation efforts continue to progress, we believe it is necessary to continue to support these vital health care professionals as they work to meet the needs of a dynamic and evolving health care delivery system. Thank you for the opportunity to comment on this recommendation. If you have any questions, please contact me. Sincerely, Nicole Dempsey Stallings Vice President, Policy & Data Analytics
91
 is a proud recipient of Nurse Support Program II (NSP II) funding.")
92 December 22, 2014 John Colmers Health Services Cost Review Commission 4160 Patterson Avenue Baltimore, MD Mr. Colmers: Washington Adventist University (WAU) is a proud recipient of Nurse Support Program II (NSP II) funding. Funding from this program has enabled WAU to increase the number and diversity of didactic and clinical faculty, as well as the number and diversity of nursing graduates. Programmatic funding resulted in a partnership between the University and Dimensions Healthcare System and Doctor s Community Hospital. WAU writes this letter in support of the continuation of the Nurse Support Program. Since 1904, the nursing program at Washington Adventist University (formerly Columbia Union College) has delivered undergraduate nursing instruction. NSP II Program funding has allowed the institution to: 1. increase the qualifications of beside RNs 2. provide mentoring support and financial assistance to RNs enrolled in both BSN and MSN programs, and 3. increase the number of didactic and/or clinical nursing faculty As a grant recipient that has benefited significantly from NSP II funding, it is difficult to imagine the impact of a lack of funding to the NSP II program. Funding through this program has enabled programs, such as ours to help address the nursing shortage in the State of Maryland. It is our hope that funding support will continue for the Nurse Support Program II so that nursing programs throughout the State of Maryland will have the opportunity to shape the future of the nursing workforce. Karen Benn Marshall Karen Benn Marshall, Ed.D. Dean, School of Health Professions, Science and Wellness Gateway to Service 7600 FLOWER AVENUE, TAKOMA PARK, MD P F


93


94


95


96

97 10901 Little Patuxent Pkwy. Columbia, MD MD Relay January 5, 2015 Mr. John Colmers, Chairman Health Services Cost Review Commission 4160 Patterson Avenue Baltimore, Maryland Dear Mr. Colmers, I am writing today to express my support of continued funding for NSPII through FY2020. The NSP II grants have been instrumental in the development of pathways for academic progression and increasing the number of registered nurses in Maryland. The Nurse Education Program at Howard Community College is a recipient of a competitive institutional grant to develop a Military to Associate Degree Nursing Pathway Sequence. This project is designed to increase the number of registered nurses at the bedside by creating a Military to ADN Pathway Sequence that capitalizes on the healthcare training and vast experiences of the medics and corpsmen. This initiative is projected to increase enrollment into the associate degree nursing program by up to 16 students annually. Continued funding will help nurse educators to offer nursing programs that meet the needs of the community and provide for an educated workforce. Thank you. Sincerely, Patricia A. Sipe, RN, M.Ed., CNE Director, Nurse Education Program Professor, Nursing Howard Community College psipe@howardcc.edu


98

99
100 January 7, 2015 John Colmers, Chairman, HSCRC 4160 Patterson Avenue Baltimore, MD Dear Mr. Colmers, Anne Arundel Community College would like to express its ongoing support for the NSP II program. Thanks to the previous grants received, the nursing program has been able to expand its simulation capabilities and retention initiatives to assist students in their success. We have increased our enrollments over the last 8 years by 42% and the grants received have enabled us to continue our success as demonstrated by our high NCLEX pass rates and improving graduation rates. Anne Arundel Community College is committed to educating nurses for the future of Maryland s health and we feel that continuation of the NSP II program provides institutions with funds to expand and improve our capabilities. Sincerely, Beth Batturs Martin, RN, MSN Director of Nursing and Healthcare Initiatives Anne Arundel Community College 101 College Parkway Arnold, MD babatturs@aacc.edu
101 December 6, 2014 To: Mr. John Colmers, Chairman Health Services Cost Review Commission (HSCRC) From: Judith E. Stetson, Ph.D., RN. Director of Chesapeake College/MGW Nursing Re: Support for Continuation of Nurse Support Program II (NSP II) I am writing in full support of continuing the efforts made possible through the HSCRC Nurse Support II Program (NSP II). These funds have had a major positive impact on the entire nursing community at state and local levels. As Director of Nursing at a small community college serving five counties on the eastern mid-shore region of Maryland, I welcome the opportunity to share specifically how the generous funding has benefited our program. Funding provided a full time retention specialist and many resources to support student success. For example, funds were utilized to purchase a software package developed by Unbound Medicine to place information related to pharmacology, illnesses, signs and symptoms, teaching plans and the latest research literally at the students fingertips. The program also flagged essential information that students could expect to find on the NCLEX exam. The program provided students with an excellent resource to acquire, manage and share essential nursing knowledge. Retention rates in the program improved from 50% to 76% over the five year period of the grant. NCLEX first time pass rates over the period of the grant were stable between 90% and 97.6%. Equally significant is the positive impact NSP II funds have had on our nursing faculty. We have a total of 9 full time nursing faculty. Over the course of the grant period, six full-time nursing faculty received New Nurse Faculty Fellowships. The purpose of that funding was to recruit talented young nurses into the educator role and off-set the large number of nurse educators near retirement age. The average age of nursing faculty at Chesapeake College has decreased while ethnic diversity among our faculty has increased. In addition, NSP II funds have made it possible for four of our full time faculty to pursue their education at the doctoral level. Currently, two of the nine full-time nursing faculty have earned doctoral degrees. In the next two years, it is projected that six of our nine full time faculty (66%) will be prepared at the doctoral level. This academic progression significantly benefits the particular individual, the entire profession and most importantly, health care in the global community. In summary, the efforts of NSP II are timely and visionary. I fully support continuing this initiative, and offer support on behalf of the entire Chesapeake College/MGW Nursing Program. Chesapeake College highly values the partnership we shared with NSP II, and deeply appreciates the many benefits these funds have provided our students and our program.


102
103


104
105
106
107

108 November 26, 2014 Mr. John Colmers, Chairman Health Services Cost Review Commission 4160 Patterson Avenue Baltimore, Maryland Dear Mr. Colmers, I am writing on behalf of the Department of Nursing at Salisbury University in support of the continuation of the NSP-II programs. The NSP-II programs have been instrumental in recruitment and retention of new nurse faculty to support expanded enrollments in our accelerated 2 nd BS degree program and the development and launch of our DNP program, the only one located on the Eastern Shore of Maryland and the first post-bs to DNP entry option in the State of Maryland. Eight new nursing faculty have been supported by the New Nurse Faculty Fellowship (38% of our faculty), and three have received Nurse Educator Doctoral Grants expediting completion of their doctoral education. The NSP-II program has also funded several institutional grants including a collaborative with two area hospitals (Peninsula Regional Medical Center and Atlantic General Hospital) to create shared hospital clinical faculty positions moving clinical experts into positions as educators with responsibilities for teaching students and staff. We were also the recipients of a second institutional grant collaborative with Chesapeake and Sojourner-Douglass Colleges to develop the Eastern Shore Faculty Academy and Mentoring Initiative. This project trains expert bachelor s prepared registered nurses to become part-time clinical faculty using online instruction, simulations and mentoring activities. To date, thirty nine new part-time clinical faculty have graduated from the Academy and are prepared for teaching assignments with one of the partner schools. Finally, we received a generous NSP-II grant to expand the availability of doctoral education in nursing to those on the Eastern Shore and throughout Maryland. As a result of this grant, we were able to launch our post-ms to DNP in Fall 2012 and our post-bs to DNP in Fall 2014, all in a distance accessible format with very limited trips to campus. We will graduate nine new DNPs in May 2015, two of whom are also completing requirements for certification as family nurse practitioners. All of these initiatives have been aimed at addressing the nursing shortage in Maryland, through creating new roles in education, increasing the supply of part-time clinical faculty, and increasing availability and access to doctoral education. Each of these projects has connected directly to increased student enrollments and graduations, at both the undergraduate and graduate levels. None of the projects would have been HENSON SCHOOL OF SCIENCE AND TECHNOLOGY Department of Nursing Salisbury, MD TTY FAX
109 possible without the NSP-II program. It is a forward-thinking program that has benefitted the citizens of the State immeasurably. As you know, the gray tsunami has not yet arrived so our needs for highly qualified registered nurses in Maryland will only continue to grow. I heartily endorse continuation of the NSP-II program and hope you will too-it is vital to our ability to respond to the workforce needs of the State. Sincerely, Lisa A. Seldomridge, PhD, RN Chair and Professor of Nursing Salisbury University Salisbury, Maryland laseldomridge@salisbury.edu CC: Oscar.Ibarra@maryland.gov. HENSON SCHOOL OF SCIENCE AND TECHNOLOGY Department of Nursing Salisbury, MD TTY FAX


110
111 Office of the Dean 655 West Lombard Street Suite 505 Baltimore, MD November 14, 2014 John Colmers Chairman, Health Services Cost Review Commission 3910 Keswick Road Suite N-2200 Baltimore, MD Dear Chairman Colmers, As Dean of the University of Maryland School of Nursing (UMSON), I would like to take this opportunity to thank the Health Services Cost Review Commission and the Maryland Higher Education for the funding support provided to our faculty and students through the Nurse Support Program II (NSPII). To date, our School of Nursing has been awarded over $10.6 million in funding to support new educational programming, clinical site expansion, and faculty development initiatives. We are especially proud of the impact that the current funding has had on nursing education at our School and our ability to increase the pipeline of nurses who hold a baccalaureate degree or higher. But more remains to be done. The Affordable Care Act, described as the biggest overhaul of the U.S. health care system since the passage of Medicare and Medicaid in 1965, is aimed at increasing health care coverage to all Americans while also cutting costs and improving efficiency of the country s health care system. Its success may well depend on nurses. We need to know how we can be part of the solution to achieve better patient outcomes at a more reasonable cost. We need to do more to prevent disease; provide chronic care management to an aging, sicker, and more diverse population; and offer end-of-life care that emphasizes comfort and compassion. Across all settings, we must do more to prepare ourselves for the future. Nursing has a central role to play in realizing the promise of health reform a transformed health system that provides wide access to essential health services while improving quality and controlling costs. Simply put, these national goals cannot be achieved without maximizing the contributions of nurses. There are ongoing and future needs for a well-educated nursing workforce, including faculty. We need to continue to emphasize the need for doctorally-prepared nursing faculty. The evolving nursing shortage, the greying of the nursing faculty, and a large brain drain of experienced faculty expected in the next 5-10 years as retirements dramatically increase (those who stayed during the recent economic downturn are now seriously ready to retire!) are all reasons we need to have well-educated nursing faculty to prepare the next generation of nurses who will care for populations, communities, individuals and families within the new models of care delivery. This education should span initial academic preparation for teaching as well as ongoing professional development of current faculty to assure currency with contemporary educational practices and to optimize maximizing of technologic resources to support learning. It appears that although the NSP II grants were originally conceptualizing bedside nursing to hospital based nursing, there is now an opportunity to potentially broaden future funding to go across the care continuum, from population/community to ambulatory to hospital to nursing homes and beyond.
112 As you evaluate the current NSPII Program, I would like to respectfully offer some suggestions for future areas of focus for NSPII funding: Advancing nurse led care coordination across the continuum. Care coordination is central to training BS, CNL and advanced practice students. Support for education at the DNP advanced practice level with a focus on primary care (including mental health). For example, 1) funds to secure optimal primary care clinical rotations which are critical to capacity building in the FNP, PNP and AGPCNP programs and 2) funds to recruit and retain faculty in those programs. Support for academic/clinical practice partnerships (in particular practice focused faculty positions at the RN and NP level) to increase clinical learning sites. Support to start a nurse managed health center for the purposes of clinical education at all levels (focusing on issues needed to support the Maryland Medicare Waiver transitions, chronic disease, care management, population health). Development of an educational focus on care management and care coordination either within the CPH curriculum or the HSLM curriculum; as a certificate program; or as a focus area in the post-master s DNP program. Focusing part of the NSP call on clinical simulation as an avenue to increase capacity. The recent outcomes from the National Council of State Boards of Nursing s s longitudinal multi-site study on the efficacy of simulation as a replacement for traditional clinical hours. Promoting care collaboratives between academic and clinical partnerships to focus on improving nurse sensitive outcomes, transitions of care and nursing processes. Initiatives that include preparation for teaching as part of doctoral programs in nursing. Health promotion and disease prevention by (a) supporting doctoral level nursing education for population health care (community and public health) and primary care for underserved, and (b) supporting systems which hire doctorally-prepared community/public health and primary care nurses through faculty practice arrangements in which faculty will precept doctoral students in these roles. Opportunities for interprofessional learning and practice. Thank you for this opportunity to comment. Sincerely, Jane Kirschling, PhD, RN, FAAN Dean and Professor, School of Nursing University Director Interprofessional Education University of Maryland, Baltimore
113
114
115
116
117
118 Staff Comments Regarding MHA Letter Requesting a Mid-Year Rate Increase Overview Maryland Hospital Association has requested an across the board rate increase for Maryland Hospitals effective January 1, This amount is requested to support additional infrastructure investments of hospitals to advance the changes that will be required for the success of the All Payer Model that was initiated on January 1, HSCRC Rate Setting Since the Initiation of the All Payer Model By July 1, 2014, all hospitals had entered into a global budget agreement with HSCRC. These agreements provide a stable revenue base for hospitals, assuring that the maximum revenue growth requirement can be assured and that hospitals will be able to reinvest savings accrued under the Model. Effective July 1, 2014, the HSCRC approved a rate increase that provided a full inflation update to hospitals of 2.41% 1, a population adjustment, an infrastructure adjustment for global budget hospitals 2 of.325% (for a total of.65% including the adjustment provided at the time of initiating the global budget) and a reduction for readmissions savings of.2%. The opening of Holy Cross Germantown Hospital is also expected to increase hospital revenues in the State by an estimated.4% for the year. In total, this provided approximately 3.67% in expected revenue increases, prior to considering any unforeseen adjustments. Offsetting these increases were two reductions-- a reduction of.45% related to reducing the MHIP assessment effective October 1, and a net reduction in uncompensated care of approximately.64%. (The uncompensated care adjustment reflected a 1.02% reduction in expected uncompensated care due to increased enrollment in Medicaid partially offset an increase of.38% based on hospitals' actual 2013 uncompensated care levels over 2012 levels.) The approved increase was within the all payer revenue growth limit and also within a range that could result in savings to Medicare, based on national Medicare hospital growth projections per beneficiary obtained from the Office of the Actuary. Analysis Performance Monitoring HSCRC staff has been monitoring performance under the All Payer Model, including: Hospital financial performance 1 Unlike prior years, there was no offset for expected productivity improvement, because hospitals would be expected to reduce utilization, thereby creating savings for consumers and purchasers 2 Total Patient Revenue hospitals did not receive an infrastructure adjustment, but were provided an incentive for adopting the model at the time of initiation of their agreements.
119 All Payer revenue increases The impact of Medicaid and other enrollment expansion under ACA Performance relative to quality improvement targets Hospital utilization levels Hospital financial performance has improved and operating margins for FY 2014 averaged 2.52% percent. For FY 2015, operating margins have averaged 2.67 percent through November These performance levels are an improvement relative to recent levels of profitability. All Payer revenue is within model limits and quality is improving, although hospitals are falling short of the readmission reduction targets that were set for the calendar year 2014 by HSCRC. HSCRC staff has been monitoring the impact of the expansion of ACA. Based on our evaluation of the reduction in self pay and charity revenues, hospitals are overfunded for uncompensated care since coverage is well beyond the amount included in the uncompensated care offset. However, there is a "pop up" in utilization that may be attributed to the expansion. HSCRC staff is currently analyzing the extent of the increase and will continue to monitor whether it is a temporary increase representing pent up demand or of a more permanent nature. Staff is also focused on hospital utilization trends, including factors that may be epidemic in nature. While we were informed that there may be requirements to fund Ebola costs, we have not yet been presented with any such requests. Influenza has the potential to drive admissions and costs above expected levels. Staff is monitoring reports of the Center for Disease Control. Influenza for is above levels to date, on par with levels. Hospitals benefitted from lower influenza levels in FY 2014 under their global budgets. HSCRC staff will continue to track influenza levels and monitor the impact on hospital utilization. It is too early to tell what, if any, relief hospitals will need for influenza burden. Monitoring of Medicare Savings Staff has been working with Center for Medicare and Medicaid Innovation (CMMI) staff to obtain Medicare performance reports. CMMI reports hospital payments and beneficiaries on a monthly basis, but these reports have the expected lag of about three months due to claims processing timelines. HSCRC was recently granted a data use agreement (DUA), that will allow verification and analysis of these reports. On December 17, the State approved a contract with a third party vendor to help HSCRC staff conduct this analysis. Based on approved rate levels for FY 2014, HSCRC staff expected favorable performance relative to Medicare for January through June of The July through December performance levels versus Medicare are uncertain, with the rate increase that occurred July 1 for Maryland hospitals and the inpatient rate decrease that occurred for Medicare effective October 1. By the end of March 2015,
120 HSCRC staff expects to see relatively complete claims data from Medicare. Staff will be initiating work with contractors in January to evaluate the data CMMI has provided. Infrastructure Requirements Maryland Hospital Association has suggested a.75% across the board rate increase for infrastructure. No analytic support has been provided to justify additional infrastructure needs beyond the.65% provided to most hospitals, along with the funds that should be freed up for infrastructure from reduced avoidable utilization. In past Commission meetings and in the recent Advisory Council meetings, Commissioners expressed an interest in regional cooperation, including a focus on integrating efforts with physicians, long-term care facilities, and community based organizations. Under the direction of the Commission, the staff has initiated three multi-stakeholder efforts to make recommendations on care coordination and infrastructure, provider alignment, and consumer education and outreach. Under the BRFA, there was $15 million earmarked for potential efforts to support the new All Payer Model. HSCRC and DHMH expect to use approximately $2 million for regional planning efforts. HSCRC staff will seek recommendations from the Care Coordination Work Group and Alignment Work Group regarding infrastructure requirements to support state-wide initiatives. Regional planning efforts may shed more light on infrastructure needs. Maryland's Economy According to the Bureau of Economic Analysis 3, Maryland's expected GDP growth for 2013 is estimated to be 1.8%, making it 47th in the nation. The growth in the local economy does not appear to be a driver for increased hospital rates. A mid-year rate increase would also further erode the Medicaid budget. Staff Assessment of Request HSCRC staff appreciates the efforts that hospitals and others are making to ensure the success of the new All Payer Model. HSCRC staff appreciates the tremendous opportunity in front of us to improve care for Marylanders and moderate costs for purchasers. Changing delivery models and integrating provider and community resources will take both focus and investment. This will require all parties working together to be agile and to succeed while achieving the goals of the new All Payer Model. HSCRC staff does not support granting a mid-year rate increase since there is no financial crisis, hospitals were provided full funding of inflation without productivity offset for FY 2015, the impact of ACA on uncompensated care and hospital utilization is under evaluation, the recent State economic performance is worse than expected, and there are other unanticipated factors that require evaluation. 3
121 Furthermore, it is also too early to assess the Medicare results and the trend line that will develop from the rate increase approved July 1, HSCRC should continue to work with stakeholders to understand infrastructure needs. Infrastructure resources from hospital savings as well as resources outside of hospitals should be considered, in addition to those that might be funded from rate increases. HSCRC may want to consider approaches to funding that support collaboration among hospitals in regional areas, as well as collaborations with other providers and community resources.

122 December 5, 2014 John M. Colmers Chairman, Health Services Cost Review Commission 3910 Keswick Road Suite N-2200 Baltimore, Maryland Dear Chairman Colmers: At its June 11, 2014 public meeting, the Health Services Cost Review Commission (HSCRC) voted to establish the update factor for a 6 month period to allow for consideration of calendar year performance (to) monitor and review results on an ongoing basis and make changes as needed on January 1 st. Furthermore, the Commissioners decided to postpone additional infrastructure funding until January, when better information will be available on the first year status of the waiver and the effectiveness of the initial infrastructure funding can be evaluated. 1 As we near completion of the first full year under the state s new all-payer demonstration model, it is important to recall the final recommendations from the HSCRC s Advisory Council, which advised the Commission to...strike a balance between near-term cost control, which is paramount, and making the required investments in physical and human infrastructure necessary for success. If we do not meet the near-term targets, there will be no long-term program. But, if we fail to make the needed infrastructure investments, we will not have the toolkit of reforms necessary to achieve lasting success and (g)iven the challenging targets in this initiative, goals should be set in the aggregate as close to the targets as practicable based on the degree of comfort that individual targets will be met. 2 There is sufficient information now available to the Commission to re-visit its original action. On behalf of our 65 hospital and health system members, the Maryland Hospital Association (MHA) requests that the Commission increase rates statewide, by 0.75 percent, effective January 1, We make this request in light of the following: 1) Maryland s hospitals have outperformed the limits Maryland s hospitals will significantly outperform the all-payer model limits in the first calendar year. Projected Maryland hospital spending per capita for the year is 2.01 percent - 44 percent below the waiver s 3.58% per capita limit. Further, although the five-year cumulative savings requirement of $330 million did not anticipate savings in the first year of the new model, Center for Medicare & Medicaid Innovation data show Maryland s hospitals on target to generate between $30 million and $40 million of savings this year alone. The 1 Minutes of the 509 th meeting of the Health Services Cost Review Commission, June 11, Advisory Council final report dated January 31, 2014, p.6
123 John M. Colmers December 5, 2014 Page 2 results of calendar year 2014 are clear: Maryland s hospitals are outperforming the financial targets of the new model. 2) A January 1 rate adjustment creates no risk of exceeding the waiver s financial limits Aggregate Maryland hospital revenue is capped under the Global Budget Revenue /Total Patient Revenue (GBR/TPR) payment model. Under the old waiver, hospital revenues increased as volume increased, so limiting hospital rates did not guarantee hospital revenue control. This is no longer the case: hospital revenues cannot exceed the collective GBR/TPR caps. A January 1 increase in rates does not threaten Maryland s ability to meet the new waiver s revenue ceiling. The GBR/TPR methodologies cap revenue, both prices and volume, providing stable and predictable costs for payers no longer at risk for increased hospital volume. Moreover, when the original update was considered last June, not all hospitals had completed individual global budget contracts with the Commission that would ensure individual spending ceiling compliance; those agreements are now in place in every hospital in the state, with all applicable Maryland hospital revenues capped. 3) Investing in care coordination and population health infrastructure is essential to waiver success The spending limits included in the new waiver along with the global budget limits were intended to be aggressive, creating incentives for hospitals and health systems to dramatically change the way they provide hospital care and health care in their communities. And that is exactly what is happening in Maryland. But moving rapidly from volume-based to valuebased payment requires significant and immediate change and investment in new health care delivery models. A January 1 rate adjustment would help ensure and speed the needed investments. The HSCRC Advisory Council underscored to this Commission the essential investment in care coordination activities needed for Maryland to be successful under the new waiver, including activities outside the regulated hospital environment. Care coordinators, community health workers, transportation services, behavioral health services, population health-related information technology and data analytics are just a few examples of the new investments required for the five year success under the new model. The need for these investments was acknowledged by the Commission, when GBR hospitals received slightly higher global budgets to help fund needed new infrastructure. As Maryland s hospitals will significantly outperform the all-payer financial requirements this year, now is the time to release additional funds by way of a mid-year rate increase to facilitate those investments. 4) Hospital margins have improved, but remain vulnerable As reflected in the attached chart, hospital operating margins have increased this year, but previous declines in 2012 and 2013, forced severe operational cutbacks and created for hospitals an unstable financial footing. As Maryland s hospitals embrace the new valuebased model, they must do better with less, controlling health care spending in accordance
124 John M. Colmers December 5, 2014 Page 3 with the triple aim. However, hospitals are only beginning to recover from these recent downturns and a six-year history of below-inflation updates. Maryland s hospitals are doing their part to meet the objectives of the waiver and lower health care costs for everyone. But all stakeholders, including health plans and the public, share responsibility for transforming care in Maryland. A 0.75 percent mid-year rate increase balances population health investment needs with cost containment. Maryland hospital financial performance is well below the waiver s ceiling. We ask the state and the HSCRC to partner with hospitals to invest now to leverage even greater savings and performance improvement as the new waiver model evolves. We appreciate the Commission s consideration of this critically important issue. If you have any questions, please contact me. Sincerely, Carmela Coyle President & CEO Maryland Hospital Association Attachment cc: Herbert Wong, PhD, Vice Chairman George H. Bone, MD Stephen F. Jencks, MD, MPH Jack C. Keane Donna Kinzer, Executive Director Bernadette Loftus, MD Thomas R. Mullen
125 December 30, 2014 John M. Colmers Chairman, Health Services Cost Review Commission 3910 Keswick Road Suite N-2200 Baltimore, Maryland Dear Chairman Colmers: Following up on Maryland hospitals' December 5 request for a 0.75 percent hospital rate increase effective January 1, 2015, we ask the Commission to act on this request at your January 14, 2015 public meeting. Commissioners did not consider our request at your December public meeting. Instead, staff asked the HSCRC s Payment Models Workgroup to "analyze" our request and make a recommendation to the Commission. Delegation of this issue to this workgroup is inappropriate. We ask that the Commission act promptly and approve our request in January. The authority to determine updates and timing rests solely with the Commission. The Payment Models Workgroup was created to make recommendations on the structure of new payment models and how the Commission might change its historic approach to annual rate updates. Important guidance was provided by the workgroup to the Commission in the spring of Maryland hospitals' request is not for new structures or payment policies. In fact, off cycle update adjustments have been made by the Commission in the past. Our request is that the Commission honor its June 11, 2014 commitment to revisit at mid year the approved annual update amount, considering strong calendar year 2014 waiver performance and hospitals' additional critical infrastructure investment needs. Waiver performance for 2014 is now clear: Maryland hospitals will save Medicare some $53 million to $65 million in the first year of the new model, exceeding both the first and second year savings goal; Maryland hospital spending will grow at about 2.0 percent per capita, well below the 3.58 percent per capita ceiling. Every hospital in the state is now governed by a global budget -- a goal not expected to be achieved for years -- and, as a result, the Commission has certainty today over statewide hospital revenue growth. The fact that every hospital selected a global budget approach demonstrates that Maryland hospitals are all in on a new way to pay for and provide hospital and health care in our state. But that new approach challenges Maryland s hospitals, and requires them -- and no other stakeholder -- to assume significant financial and organizational risk in transforming the delivery system. In order for Maryland to succeed, hospitals need to invest in new services, new staff, new data analytics capabilities and more. Maryland hospitals must retool to address not only the acute care needs of patients, but the broader health care needs and non-clinical barriers that must be overcome to meet the tight constraints of the new waiver. Now is the time for the state and the Commission to be our partner and invest a small portion of the return
126 John M. Colmers December 30, 2014 Page 2 already generated to allow for the investments hospitals need to make now to ensure Maryland's future success under the waiver. The Commission s own Advisory Council recommended setting rates as close to the per capita ceiling as possible to allow hospitals to make investments that will ensure long term success. Maryland's hospitals are exceeding all of the financial goals of the new waiver. Our ability to succeed on the more difficult goal of reducing Maryland's readmissions rate will depend on new investments, new relationships, new partnerships and new ways of coordinating care in the community, outside of the hospital. Success in Maryland will only become more difficult, because our pace of improvement must continue to outpace the rest of the nation. That won't happen unless we invest in change now. We urge the Commission to act on our request at the January public meeting. If you have any questions, please contact me or Mike Robbins. Sincerely, Carmela Coyle President & CEO Maryland Hospital Association Attachment cc: Herbert Wong, PhD, Vice Chairman George H. Bone, MD Stephen F. Jencks, MD, MPH Jack C. Keane Bernadette Loftus, MD Thomas R. Mullen Donna Kinzer, Executive Director
127 Operating Margins Hospital operating margins are below the traditional 2.75 percent target Neither one year (FY 2014), nor three months (FY 2015), are sufficient to reflect stable profitability Maryland Hospital Operating Profit: YTD 2015 Operating Margin 3.5% 3.0% 2.5% 2.0% 1.5% 1.0% 0.5% 2.3% 0.8% 2.5% 2.9% 0.0% FY2012 FY2013 Unaudited FY2014 Year Sept. YTD FY2015 1
128 All-Payer per Capita Growth Maryland s hospitals are significantly below the 3.58 percent limit, and will continue below the limit through FY 2015 Actual Maryland All-Payer per Capita Hospital Spending Growth versus All-Payer per Capita Limit All-Payer per Capita Growth 4.00% 3.50% 3.00% 2.50% 2.00% 1.50% 1.00% 0.50% 0.00% 3.58% Limit 2.01% 1.94% 1.60% FY2014 Projected CY2014 Projected FY2015 Year 2

129 Growth in Medicare Hospital Payment per Beneficiary Maryland Medicare Hospital Payment per Beneficiary is growing slower than the national average. Maryland s hospitals are expected to generate savings in year one, exceeding the model s requirement for year one. CYTD August 2014 vs. CYTD August 2013 Hospital Payment per Medicare Beneficiary Growth 0.00% Hospital Payment per Benefciary Growth -0.50% -1.00% -1.50% -2.00% -2.50% -2.33% -1.21% Maryland Nation 3

130 Update on Work Groups Consumer Engagement Care Coordination Payment Models Work Group GBR Market Shift Draft Principles GBR Transfer Adjustment
STATE OF MARYLAND DEPARTMENT OF HEALTH AND MENTAL HYGIENE
 STATE OF MARYLAND DEPARTMENT OF HEALTH AND MENTAL HYGIENE John M. Colmers Chairman Herbert S. Wong, Ph.D. Vice-Chairman George H. Bone, M.D. Stephen F. Jencks, M. D., M.P.H. Jack C. Keane Bernadette C.
Understanding HSCRC Quality Programs and Methodology Updates
 Understanding HSCRC Quality Programs and Methodology Updates Kristen Geissler, MS, PT, CPHQ, MBA Managing Director Beth Greskovich - Director Berkeley Research Group August 19, 2016 Maryland Waiver and
Final Recommendation for the Potentially Avoidable Utilization Savings Policy for Rate Year 2018
 Final Recommendations for the Potentially Avoidable Utilization Policy Final Recommendation for the Potentially Avoidable Utilization Policy for Rate Year 2018 June 14, 2017 Health Services Cost Review
4160 Patterson Avenue, Baltimore, Maryland Phone: Fax: Toll Free: hscrc.maryland.
 4160 Patterson Avenue, Baltimore, Maryland 21215 Phone: 410-764-2605 Fax: 410-358-6217 Toll Free: 1-888-287-3229 hscrc.maryland.gov 536th MEETING OF THE HEALTH SERVICES COST REVIEW COMMISSION December
State of Rural Healthcare In US
 State of Rural Healthcare In US According to the American Hospital Association (AHA): There are 5564 registered hospital in US 4862 are considered community hospitals 1829 are rural hospitals Aging Population
The Nexus of Quality and Finance
 The Nexus of Quality and Finance Kristen Geissler Pat Ercolano March 4, 2014 Transition from Volume to Value: IHI Triple Aim IHI Triple Aim Improve patient experience of care (quality & satisfaction) Improve
Clinical Documentation: Beyond The Financials Cheryll A. Rogers, RHIA, CDIP, CCDS, CCS Senior Inpatient Consultant 3M HIS Consulting Services
 Clinical Documentation: Beyond The Financials Cheryll A. Rogers, RHIA, CDIP, CCDS, CCS Senior Inpatient Consultant 3M HIS Consulting Services Clinical Documentation: Beyond The Financials Key Points of
2016 HCPro, a division of BLR. All rights reserved. These materials may not be duplicated without express written permission.
 Potentially Preventable Complications: Getting the Whole Picture Cheryl Manchenton, RN, BSN, CCDS Project Manager/Quality Services Lead 3M HIS Consulting Services Atlanta, GA 1 Learning Objectives At the
Medicare Value Based Purchasing August 14, 2012
 Medicare Value Based Purchasing August 14, 2012 Wes Champion Senior Vice President Premier Performance Partners Copyright 2012 PREMIER INC, ALL RIGHTS RESERVED Premier is the nation s largest healthcare
CMS Quality Program- Outcome Measures. Kathy Wonderly RN, MSEd, CPHQ Consultant Developed: December 2015 Revised: January 2018
 CMS Quality Program- Outcome Measures Kathy Wonderly RN, MSEd, CPHQ Consultant Developed: December 2015 Revised: January 2018 Philosophy The Centers for Medicare and Medicaid Services (CMS) is changing
August 1, 2012 (202) CMS makes changes to improve quality of care during hospital inpatient stays
 CMS makes changes to improve quality of care during hospital inpatient stays") DEPARTMENT OF HEALTH & HUMAN SERVICES Centers for Medicare & Medicaid Services Room 352-G 200 Independence Avenue, SW Washington, DC 20201 FACT SHEET FOR IMMEDIATE RELEASE Contact: CMS Media Relations
DEPARTMENT OF HEALTH & HUMAN SERVICES Centers for Medicare & Medicaid Services Room 352-G 200 Independence Avenue, SW Washington, DC 20201 FACT SHEET FOR IMMEDIATE RELEASE Contact: CMS Media Relations
Reimbursement Policy Subject: Present on Admission Indicator for Health Care-Acquired Conditions 01/01/14 Administration 05/02/16
 Anthem BlueCross BlueShield Medicaid Reimbursement Policy Subject: Committee Approval Obtained: Effective Date: 01/01/14 Section: Administration 05/02/16 ***** The most current version of our reimbursement
Provider Preventable Conditions: Health Care Acquired Conditions and Present on Admission Policy
 Provider Preventable Conditions: Health Care Acquired Conditions and Present on Admission Policy Policy Number 2018F7002A Annual Approval Date 3/14/2018 Approved By Reimbursement Policy Oversight Committee
P4P Programs 9/13/2013. Medicare P4P Programs. Medicaid P4P Programs
 P4P Programs Medicare P4P Programs Hospital Quality Reporting Programs (IQR and OQR) Hospital Value-Based Purchasing (VBP) Program Hospital Readmissions Reduction Program (HRRP) Hospital-Acquired Conditions
Hospital Acquired Conditions: using ACS-NSQIP to drive performance. J Michael Henderson Jackie Matthews Nirav Vakharia
 Hospital Acquired Conditions: using ACS-NSQIP to drive performance J Michael Henderson Jackie Matthews Nirav Vakharia Your Team: Quality & Patient Safety Institute Cleveland Clinic Mike Henderson: Chief
(202) or CMS Proposals to Improve Quality of Care during Hospital Inpatient Stays
 or CMS Proposals to Improve Quality of Care during Hospital Inpatient Stays") DEPARTMENT OF HEALTH & HUMAN SERVICES Centers for Medicare & Medicaid Services Room 352-G 200 Independence Avenue, SW Washington, DC 20201 FACT SHEET FOR IMMEDIATE RELEASE April 30, 2014 Contact: CMS Media
DEPARTMENT OF HEALTH & HUMAN SERVICES Centers for Medicare & Medicaid Services Room 352-G 200 Independence Avenue, SW Washington, DC 20201 FACT SHEET FOR IMMEDIATE RELEASE April 30, 2014 Contact: CMS Media
3M Potentially Preventable Complications (PPCs) Version 31.0 (effective 10/01/2013) Methodology Overview
 Version 31.0 (effective 10/01/2013) Methodology Overview") 3M Potentially Preventable Complications (PPCs) Version 31.0 (effective 10/01/2013) Methodology Overview 3 Copyright 2013 2008, 3M. All rights reserved. This product contains material and information that
3M Potentially Preventable Complications (PPCs) Version 31.0 (effective 10/01/2013) Methodology Overview 3 Copyright 2013 2008, 3M. All rights reserved. This product contains material and information that
Scoring Methodology FALL 2017
 Scoring Methodology FALL 2017 CONTENTS What is the Hospital Safety Grade?... 4 Eligible Hospitals... 4 Measures... 5 Measure Descriptions... 9 Process/Structural Measures... 9 Computerized Physician Order
Scoring Methodology FALL 2016
 Scoring Methodology FALL 2016 CONTENTS What is the Hospital Safety Grade?... 4 Eligible Hospitals... 4 Measures... 5 Measure Descriptions... 7 Process/Structural Measures... 7 Computerized Physician Order
Medicare Quality Based Payment Reform (QBPR) Program Reference Guide Fiscal Years
 Program Reference Guide Fiscal Years") julian.coomes@flhosp.orgjulian.coomes@flhosp.org Medicare Quality Based Payment Reform (QBPR) Program Reference Guide Fiscal Years 2018-2020 October 2017 Table of Contents Value Based Purchasing (VBP)
julian.coomes@flhosp.orgjulian.coomes@flhosp.org Medicare Quality Based Payment Reform (QBPR) Program Reference Guide Fiscal Years 2018-2020 October 2017 Table of Contents Value Based Purchasing (VBP)
Reimbursement Policy Subject: Present on Admission Indicator for Health Care-Acquired Conditions 06/01/12 05/02/16 Administration Policy
 Reimbursement Policy Subject: Present on Admission Indicator for Health Care-Acquired Conditions Committee Approval Obtained: Section: Effective Date: 06/01/12 05/02/16 Administration *****The most current
Reimbursement Policy Subject: Present on Admission Indicator for Health Care-Acquired Conditions 04/01/14 Administration 05/02/16
 Reimbursement Policy Subject: Present on Admission Indicator for Health Care-Acquired Conditions Committee Approval Obtained: Effective Date: 04/01/14 Section: Administration 05/02/16 ***** The most current
FY 2014 Inpatient Prospective Payment System Proposed Rule
 FY 2014 Inpatient Prospective Payment System Proposed Rule Summary of Provisions Potentially Impacting EPs On April 26, 2013, the Centers for Medicare and Medicaid Services (CMS) released its Fiscal Year
Analysis of Final Rule for FY 2009 Revisions to the Medicare Hospital Inpatient Prospective Payment System
 Analysis of Final Rule for FY 2009 Revisions to the Medicare Hospital Inpatient Prospective Payment System The final rule regarding fiscal year (FY) 2009 revisions to the Medicare hospital inpatient prospective
Minnesota Statewide Quality Reporting and Measurement System: Appendices to Minnesota Administrative Rules, Chapter 4654
 This document is made available electronically by the Minnesota Legislative Reference Library as part of an ongoing digital archiving project. http://www.leg.state.mn.us/lrl/lrl.asp Minnesota Statewide
1. Recommended Nurse Sensitive Outcome: Adult inpatients who reported how often their pain was controlled.
 Testimony of Judith Shindul-Rothschild, Ph.D., RNPC Associate Professor William F. Connell School of Nursing, Boston College ICU Nurse Staffing Regulations October 29, 2014 Good morning members of the
Scoring Methodology SPRING 2018
 Scoring Methodology SPRING 2018 CONTENTS What is the Hospital Safety Grade?... 4 Eligible Hospitals... 4 Measures... 6 Measure Descriptions... 9 Process/Structural Measures... 9 Computerized Physician
National Provider Call: Hospital Value-Based Purchasing
 National Provider Call: Hospital Value-Based Purchasing Fiscal Year 2015 Overview for Beneficiaries, Providers, and Stakeholders Centers for Medicare & Medicaid Services 1 March 14, 2013 Medicare Learning
Value-Based Purchasing & Payment Reform How Will It Affect You?
 Value-Based Purchasing & Payment Reform How Will It Affect You? HFAP Webinar September 21, 2012 Nell Buhlman, MBA VP, Product Strategy Click to view recording. Agenda Payment Reform Landscape Current &
Additional Considerations for SQRMS 2018 Measure Recommendations
 Additional Considerations for SQRMS 2018 Measure Recommendations HCAHPS The Hospital Consumer Assessments of Healthcare Providers and Systems (HCAHPS) is a requirement of MBQIP for CAHs and therefore a
CHAPTER 12 -QUALITY MANAGEMENT AND PERFORMANCE IMPROVEMENT
 CHAPTER 12 -QUALITY MANAGEMENT AND PERFORMANCE IMPROVEMENT 12.0 QUALITY MANAGEMENT REQUIREMENTS Health Choice Integrated Care works in partnership with providers to continuously monitor and improve the
Overview of the HSCRC
 Overview of the HSCRC William J. Mooney, Jr. Memorial Education Series December 4, 2014 Arin Foreman Manager KPMG LLP What is the HSCRC? Health Services Cost Review Commission State regulatory commission
Subject: Hospital-Acquired Conditions (Page 1 of 5)
") Subject: Hospital-Acquired Conditions (Page 1 of 5) Objective: I. To facilitate safe patient care for all Health Share/Tuality Health Alliance (THA) members. II. To encourage and support provider efforts
Subject: Hospital-Acquired Conditions (Page 1 of 5) Objective: I. To facilitate safe patient care for all Health Share/Tuality Health Alliance (THA) members. II. To encourage and support provider efforts
Inpatient Quality Reporting Program
 Hospital Value-Based Purchasing Program: Overview of FY 2017 Questions & Answers Moderator: Deb Price, PhD, MEd Educational Coordinator, Inpatient Program SC, HSAG Speaker(s): Bethany Wheeler, BS HVBP
SCORING METHODOLOGY APRIL 2014
 SCORING METHODOLOGY APRIL 2014 HOSPITAL SAFETY SCORE Contents What is the Hospital Safety Score?... 4 Who is The Leapfrog Group?... 4 Eligible and Excluded Hospitals... 4 Scoring Methodology... 5 Measures...
Impacting Quality Initiatives through Documentation Improvement. Fran Jurcak, MSN, RN, CCDS Vice President of Clinical Innovation Iodine Software
 Impacting Quality Initiatives through Documentation Improvement Fran Jurcak, MSN, RN, CCDS Vice President of Clinical Innovation Iodine Software Objectives The learner will be able to: Articulate the goals
CME Disclosure. HCAHPS- Hardwiring Your Hospital for Pay-for-Performance Success. Accreditation Statement. Designation of Credit.
 CME Disclosure Accreditation Statement Studer Group is accredited by the Accreditation Council for Continuing Medical Education (ACCME) to provide continuing medical education for physicians. Designation
Accreditation, Quality, Risk & Patient Safety
 Accreditation, Quality, Risk & Patient Safety Accreditation The Joint Commission (TJC) Centers for Medicare & Medicaid Services (CMS) Wyoming Department of Health (DOH) Joint Commission: - Joint Commission
UNIVERSITY OF ILLINOIS HOSPITAL & HEALTH SCIENCES SYSTEM HOSPITAL DASHBOARD
 UNIVERSITY OF ILLINOIS HOSPITAL & HEALTH SCIENCES SYSTEM HOSPITAL DASHBOARD January 19, 2017 UI Health Metrics FY17 Q1 Actual FY17 Q1 Target FY Q1 Actual Ist Quarter % change FY17 vs FY Discharges 4,836
Medicare P4P -- Medicare Quality Reporting, Incentive and Penalty Programs
 Medicare P4P -- Medicare Quality Reporting, Incentive and Penalty Programs Presenter: Daniel J. Hettich King & Spalding; Washington, DC dhettich@kslaw.com 1 I. Introduction Evolution of Medicare as a Purchaser
The dawn of hospital pay for quality has arrived. Hospitals have been reporting
 Value-based purchasing SCIP measures to weigh in Medicare pay starting in 2013 The dawn of hospital pay for quality has arrived. Hospitals have been reporting Surgical Care Improvement Project (SCIP) measures
UNIVERSITY OF ILLINOIS HOSPITAL & HEALTH SCIENCES SYSTEM HOSPITAL DASHBOARD
 September 8, 20 UNIVERSITY OF ILLINOIS HOSPITAL & HEALTH SCIENCES SYSTEM HOSPITAL DASHBOARD UI Health Metrics FY Q4 Actual FY Q4 Target FY Q4 Actual 4th Quarter % change FY vs FY Average Daily Census (ADC)
NOTICE OF WRITTEN COMMENT PERIOD
 NOTICE OF WRITTEN COMMENT PERIOD Notice is hereby given that the public and interested parties are invited to submit written comments to the Commission on any or all of the following staff draft recommendations
Quality Reporting in the Public Domain
 Quality Reporting in the Public Domain Disclaimer This material is designed and provided to communicate information about inpatient coding, clinical documentation, and/or compliance in an educational format
Quality Based Impacts to Medicare Inpatient Payments
 Quality Based Impacts to Medicare Inpatient Payments Overview New Developments in Quality Based Reimbursement Recap of programs Hospital acquired conditions Readmission reduction program Value based purchasing
Medicare s Inpatient Final Rule for Claire Kapilow, Director, Regulatory Affairs
 Medicare s Inpatient Final Rule for 2013 Claire Kapilow, Director, Regulatory Affairs Publisher Notice Although we have tried to include accurate and comprehensive information in this presentation, please
Hospital Inpatient Quality Reporting (IQR) Program Measures (Calendar Year 2012 Discharges - Revised)
 Program Measures (Calendar Year 2012 Discharges - Revised)") The purpose of this document is to provide a reference guide on submission and Hospital details for Quality Improvement Organizations (QIOs) and hospitals for the Hospital Inpatient Quality Reporting (IQR)
The purpose of this document is to provide a reference guide on submission and Hospital details for Quality Improvement Organizations (QIOs) and hospitals for the Hospital Inpatient Quality Reporting (IQR)
Clinical Documentation Improvement: Best Practice
 Revenue Cycle Solutions Consulting and Management Services Clinical Documentation Improvement: Best Practice Our mission: To help you finance yours. 2 Managing Your Audio Use Telephone Use Microphone and
National Patient Safety Goals & Quality Measures CY 2017
 National Patient Safety Goals & Quality Measures CY 2017 General Clinical Orientation 2017 January National Patient Safety Goals 1. Identify Patients Correctly 2. Improve Staff Communication 3. Use Medications
FINAL RECOMMENDATION REGARDING MODIFYING THE QUALITY- BASED REIMBURSEMENT INITIATIVE AFTER STATE FY 2010
 FINAL RECOMMENDATION REGARDING MODIFYING THE QUALITY- BASED REIMBURSEMENT INITIATIVE AFTER STATE FY 2010 Health Services Cost Review Commission 4160 Patterson Avenue Baltimore, MD 21215 (410) 764-2605
UI Health Hospital Dashboard September 7, 2017
 UI Health Hospital Dashboard September 20 September 7, 20 UI Health Metrics FY Q4 Actual FY Q4 Target FY Q4 Actual 4th Quarter % change FY vs FY Discharges 4,558 4,680 4,720 Combined Observation Cases
REQUEST FOR COMMENT: Recommendations of the Acute Renal Failure (ARF) / Acute Kidney Injury (AKI) Workgroup
 / Acute Kidney Injury (AKI) Workgroup") 1 2 3 4 5 6 7 8 9 10 11 12 13 14 15 16 17 18 19 20 21 22 23 24 25 26 27 28 29 REQUEST FOR COMMENT: Recommendations of the Acute Renal Failure (ARF) / Acute Kidney Injury (AKI) Workgroup The Maryland Hospital
1 2 3 4 5 6 7 8 9 10 11 12 13 14 15 16 17 18 19 20 21 22 23 24 25 26 27 28 29 REQUEST FOR COMMENT: Recommendations of the Acute Renal Failure (ARF) / Acute Kidney Injury (AKI) Workgroup The Maryland Hospital
Performance Measurement Work Group Meeting 10/18/2017
 Performance Measurement Work Group Meeting 10/18/2017 Welcome to New Members QBR RY 2020 DRAFT QBR Policy Components QBR Program RY 2020 Snapshot QBR Consists of 3 Domains: Person and Community Engagement
What should board members know about new health care reform payment structures?*
 What should board members know about new health care reform payment structures?* Passage and implementation of the Patient Protection and Affordable Care Act (ACA) has driven America s health care system
2013 Health Care Regulatory Update. January 8, 2013
 2013 Health Care Regulatory Update January 8, 2013 Quality-Based Payment Reform, ACOs and Clinical Integration Bruce Johnson and Tom Donohoe Overview Quality-based payment reform programs Major programs
Staff Draft Recommendations for Updating the Quality-Based Reimbursement Program for Rate Year 2020
 RY 2020 Draft Recommendation for QBR Policy Staff Draft Recommendations for Updating the Quality-Based Reimbursement Program for Rate Year 2020 November 13, 2017 Health Services Cost Review Commission
Overview of Final Rule for FY 2011 Revisions to the Medicare Hospital Inpatient Prospective Payment System
 Overview of Final Rule for FY 2011 Revisions to the Medicare Hospital Inpatient Prospective Payment System The final rule regarding fiscal year (FY) 2011 revisions to the Medicare hospital inpatient prospective
Mastering the Mandatory Elements of the Affordable Care Act. Melinda Hancock Walter Coleman
 Mastering the Mandatory Elements of the Affordable Care Act Melinda Hancock Walter Coleman 1 ACA Gains through 2019 Amounts in Billions Source:CBO and Joint Committee on Taxation, 2010 Projection 2 Current
University of Illinois Hospital and Clinics Dashboard May 2018
 May 17, 2018 University of Illinois Hospital and Clinics Dashboard May 2018 Combined Discharges and Observation Cases for the nine months ending March 2018 are 1.6% below budget and 4.9% lower than last
Report to the Governor
 Report to the Governor Health Services Cost Review Commission 4160 Patterson Avenue Baltimore, Maryland 21215 (410) 764-2605 October 2016 Table of Contents Introduction... 1 The New All-Payer Model with
Value Based Purchasing
 Value Based Purchasing Baylor Health Care System Leadership Summit October 26, 2011 Sheri Winsper, RN, MSN, MSHA Vice President for Performance Measurement & Reporting Institute for Health Care Research
Star Rating Method for Single and Composite Measures
 Star Rating Method for Single and Composite Measures CheckPoint uses three-star ratings to enable consumers to more quickly and easily interpret information about hospital quality measures. Composite ratings
Hospital-Acquired Condition Reduction Program. Hospital-Specific Report User Guide Fiscal Year 2017
 Hospital-Acquired Condition Reduction Program Hospital-Specific Report User Guide Fiscal Year 2017 Contents Overview... 4 September 2016 Error Notice... 4 Background and Resources... 6 Updates for FY 2017...
Healthcare Reform Hospital Perspective
 Healthcare Reform Hospital Perspective Susan DeVore President and CEO, Premier, Inc. March 8, 2010 1 The end of an illusion 2 Current landscape for healthcare reform 3 Specific policies require a paradigm
Disclosure of Proprietary Interest
 HomeTown Health HCCS Hospital Consortium Project: Track 3- Clinical Documentation: Strategies for Sharpening Focus Jenan Custer RHIT, CCS, CPC, CDIP AHIMA Approved ICD-10-CM/PCS Trainer Director of Coding
Improving quality of care during inpatient hospital stays
 DEPARTMENT OF HEALTH & HUMAN SERVICES Centers for Medicare & Medicaid Services Room 352-G 200 Independence Avenue, SW Washington, DC 20201 Office of Communications FACT SHEET FOR IMMEDIATE RELEASE Contact:
FY 2014 Inpatient PPS Proposed Rule Quality Provisions Webinar
 FY 2014 Inpatient PPS Proposed Rule Quality Provisions Webinar May 23, 2013 AAMC Staff: Scott Wetzel, swetzel@aamc.org Mary Wheatley, mwheatley@aamc.org Important Info on Proposed Rule In Federal Register
K-HEN Acute Care/Critical Access Hospitals Measures Alignment with PfP 40/20 Goals AEA Minimum Participation Full Participation 1, 2
 Outcome Measure for Any One of the Following: Outcome Measures Meeting Either A or B: Adverse Drug Events (ADE) All measures are surveillance data Hospital Collected Anticoagulant (ADE-12) Opioid (ADE-111)
HCAHPS. Presented by: Bill Sexton. Proudly recognized as one of the Nation s Top 100 Critical Access Hospitals - ivantage Health Analytics
 HCAHPS Presented by: Bill Sexton HCAHPS results will impact your organization's reimbursement in the era of health care reform HCAPHS results are a quality metric, not just a patient satisfaction metric
Any other findings required by other provisions of law as precondition to adoption or effectiveness of rule? Yes No If Yes, explain:
 RULE-MAKING ORDER Agency: Health Care Authority, Medicaid Program CR-103P (May 2009) (Implements RCW 34.05.360) Permanent Rule Only Effective date of rule: Permanent Rules 31 days after filing. Other (specify)
(1) Provides a brief overview of CMS Medicare payment policy for selected HACs;
 Provides a brief overview of CMS Medicare payment policy for selected HACs;") DEPARTMENT OF HEALTH & HUMAN SERVICES Centers for Medicare & Medicaid Services 7500 Security Boulevard, Mail Stop S2-26-12 Baltimore, Maryland 21244-1850 Center for Medicaid and State Operations SMDL #08-004
DEPARTMENT OF HEALTH & HUMAN SERVICES Centers for Medicare & Medicaid Services 7500 Security Boulevard, Mail Stop S2-26-12 Baltimore, Maryland 21244-1850 Center for Medicaid and State Operations SMDL #08-004
Hospital Value-Based Purchasing (VBP) Program
 Program") Healthcare-Associated Infection (HAI) Measures Reminders and Updates Questions & Answers Moderator Maria Gugliuzza, MBA Project Manager, Hospital Value-Based Purchasing (VBP) Program Hospital Inpatient
Healthcare-Associated Infection (HAI) Measures Reminders and Updates Questions & Answers Moderator Maria Gugliuzza, MBA Project Manager, Hospital Value-Based Purchasing (VBP) Program Hospital Inpatient
Essentials for Clinical Documentation Integrity 2017
 Essentials for Clinical Documentation Integrity 2017 Prepared and Published By: MedLearn Publishing A Division of Panacea Healthcare Solutions, Inc. 287 East Sixth Street, Suite 400 St. Paul, MN 55101
Quality Based Impacts to Medicare Inpatient Payments
 Quality Based Impacts to Medicare Inpatient Payments Brian Herdman Operations Manager, CBIZ KA Consulting Services, LLC July 30, 2015 Overview How did we get here? Summary of IPPS Quality Programs Hospital
HACs, Readmissions and VBP: Hospital Strategies for Turning Lemons into Lemonade
 HACs, Readmissions and VBP: Hospital Strategies for Turning Lemons into Lemonade Jennifer Faerberg AAMCFMOLHS Jolee Bollinger Andy Ruskin Morgan Lewis 1 Value Based Purchasing Transforming Medicare from
Performance Payment: Never Pay for Never Events: Including Readmissions in Medicare s s (non-payment for) Hospital Acquired Conditions Policy
 Hospital Acquired Conditions Policy") Performance Payment: Never Pay for Never Events: Including Readmissions in Medicare s s (non-payment for) Hospital Acquired Conditions Policy Peter McNair and Hal Luft Palo Alto Medical Foundation Research
Performance Payment: Never Pay for Never Events: Including Readmissions in Medicare s s (non-payment for) Hospital Acquired Conditions Policy Peter McNair and Hal Luft Palo Alto Medical Foundation Research
Connecting the Revenue and Reimbursement Cycles
 Connecting the Revenue and Reimbursement Cycles Tuesday, August 19 th, 2014 Toni G. Cesta, Ph.D., RN, FAAN Consultant and Partner Case Management Concepts New York Office And Bev Cunningham, MS, RN Vice
Medicare Value Based Purchasing Overview
 Medicare Value Based Purchasing Overview Washington State Hospital Association Apprise Health Insights / Oregon Association of Hospitals and Health Systems DataGen Susan McDonough Lauren Davis Bill Shyne
Transitions Through the Care Continuum: Discussions on Barriers to Patient Care, Communications, and Advocacy
 Transitions Through the Care Continuum: Discussions on Barriers to Patient Care, Communications, and Advocacy Scott Matthew Bolhack, MD, MBA, CMD, CWS, FACP, FAAP April 29, 2017 Disclosure Slide I have
OHA HEN 2.0 Partnership for Patients Letter of Commitment
 OHA HEN 2.0 Partnership for Patients Letter of Commitment To: Re: Request to Participate in the Ohio Hospital Association Hospital Engagement Contract Date: September 24, 2015 We have reviewed the information
2016 HCPro, a division of BLR. All rights reserved. These materials may not be duplicated without express written permission.
 To Err Is Human: CDI Impact on Patient Safety Indicators Kathleen Shindle, RN, BSN, CCDS, CDIP Allison Clerval, RN, BSN, CCDS, CDIP Clinical Supervisors Thomas Jefferson University Hospital Philadelphia,
Managing Healthcare Payment Opportunity Fundamentals CENTER FOR INDUSTRY TRANSFORMATION
 Managing Healthcare Payment Opportunity Fundamentals dhgllp.com/healthcare 4510 Cox Road, Suite 200 Glen Allen, VA 23060 Melinda Hancock PARTNER Melinda.Hancock@dhgllp.com 804.474.1249 Michael Strilesky
MHA S 2018 VALUE REPORT TO MEMBERS
 FOR Patients FOR Communities FORward $30 million reduction in Medicaid sick tax $75 million avoidance of hospital assessment to stabilize insurance markets $36 million full funding for Institutions for
OVERVIEW OF THE FALL 2017 LEAPFROG HOSPITAL SAFETY GRADE
 OVERVIEW OF THE FALL 2017 LEAPFROG HOSPITAL SAFETY GRADE September 20, 2017 Missy Danforth Vice President of Health Care Ratings, The Leapfrog Group Presentation Overview 2 About the Leapfrog Hospital
Recommendation to Adopt a Severity-Adjusted Grouper
 Recommendation to Adopt a Severity-Adjusted Grouper Health Services Cost Review Commission 4160 Patterson Avenue Baltimore, MD 21215 (410) 764-2605 Fax (410) 358-6217 June 2, 2004 This recommendation is
Policies for Controlling Volume January 9, 2014
 Policies for Controlling Volume January 9, 2014 The Maryland Hospital Association Policies for controlling volume Introduction Under the proposed demonstration model, the HSCRC will move from a regulatory
HOSPITAL QUALITY MEASURES. Overview of QM s
 HOSPITAL QUALITY MEASURES Overview of QM s QUALITY MEASURES FOR HOSPITALS The overall rating defined by Hospital Compare summarizes up to 57 quality measures reflecting common conditions that hospitals
Dianne Feeney, Associate Director of Quality Initiatives. Measurement
 HSCRC Quality Based Reimbursement Program Dianne Feeney, Associate Director of Quality Initiatives Sule Calikoglu, Associate Director of Performance Measurement 1 Quality Initiative Timeline Phase I: Quality
Program Summary. Understanding the Fiscal Year 2019 Hospital Value-Based Purchasing Program. Page 1 of 8 July Overview
 Overview This program summary highlights the major elements of the fiscal year (FY) 2019 Hospital Value-Based Purchasing (VBP) Program administered by the Centers for Medicare & Medicaid Services (CMS).
Clinical Operations. Kelvin A. Baggett, M.D., M.P.H., M.B.A. SVP, Clinical Operations & Chief Medical Officer December 10, 2012
 Clinical Operations Kelvin A. Baggett, M.D., M.P.H., M.B.A. SVP, Clinical Operations & Chief Medical Officer December 10, 2012 Forward-looking Statements Certain statements contained in this presentation
Reducing Readmissions: Potential Measurements
 Reducing Readmissions: Potential Measurements Avoid Readmissions Through Collaboration October 27, 2010 Denise Remus, PhD, RN Chief Quality Officer BayCare Health System Overview Why Focus on Readmissions?
Surgeon Champion: Getting Started, What You Need to Know
 Surgeon Champion: Getting Started, What You Need to Know Ninh T. Nguyen, MD, FACS Professor of Surgery Surgeon Champion Vice-Chair, Dept Surgery University of California, Irvine, Medical Center, Orange,
Baptist Health System Jacksonville, FL
 Baptist Health System Jacksonville, FL Baptist Health System Community Leader in Healthcare Five (5) Hospital System Serving greater Jacksonville area and SE Georgia Children s Hospital Primary Care Facilities
MEDICARE FFY 2017 PPS PROPOSED RULES OVERVIEW OHA Finance/PFS Webinar Series. May 10, 2016
 MEDICARE FFY 2017 PPS PROPOSED RULES OVERVIEW 2016 OHA Finance/PFS Webinar Series May 10, 2016 Spring is Medicare PPS Proposed Rules Season Inpatient Hospital Long-Term Acute Care Hospital Inpatient Rehabilitation
The 5 W s of the CMS Core Quality Process and Outcome Measures
 The 5 W s of the CMS Core Quality Process and Outcome Measures Understanding the process and the expectations Developed by Kathy Wonderly RN,BSPA, CPHQ Performance Improvement Coordinator Developed : September
Objectives. Integrating Performance Improvement with Publicly Reported Quality Metrics, Value-Based Purchasing Incentives and ISO 9001/9004
 Integrating Performance Improvement with Publicly Reported Quality Metrics, Value-Based Purchasing Incentives and ISO 9001/9004 Session: C658 2013 ANCC National Magnet Conference Thursday, October 3, 2013
Maryland s Public Behavioral Health System (PBHS) Emergency Petition Billing Manual
 Emergency Petition Billing Manual") Maryland s Public Behavioral Health System (PBHS) Emergency Petition Billing Manual TABLE OF CONTENTS Introduction... 1 Claims from a Facility for Emergency Room Services... 1 Claims from a Physician for
Maryland s Public Behavioral Health System (PBHS) Emergency Petition Billing Manual TABLE OF CONTENTS Introduction... 1 Claims from a Facility for Emergency Room Services... 1 Claims from a Physician for
Bellagio, Las Vegas November 26-28, 2012 Claire Kapilow, Director, Regulatory Affairs Medicare s Inpatient Final Rule for 2013
 Bellagio, Las Vegas November 26-28, 2012 Claire Kapilow, Director, Regulatory Affairs Medicare s Inpatient Final Rule for 2013 Scan this image for a copy of this presentation to load to your QR enabled
GHS Quality and Safety Report
 GHS Quality and Safety Report January 2012 Core Measures Background The Center for Medicare and Medicaid Services (CMS) and The Joint Commission (TJC) have developed process of care measures for Acute
Regulatory Advisor Volume Eight
 Regulatory Advisor Volume Eight 2018 Final Inpatient Prospective Payment System (IPPS) Rule Focused on Quality by Steve Kowske WEALTH ADVISORY OUTSOURCING AUDIT, TAX, AND CONSULTING 2017 CliftonLarsonAllen