266 QUALITY MANAGEMENT IN HEALTH CARE/VOLUME 19, ISSUE 3, JULY SEPTEMBER 2010
|
|
|
- Nelson Chase
- 5 years ago
- Views:
Transcription
1
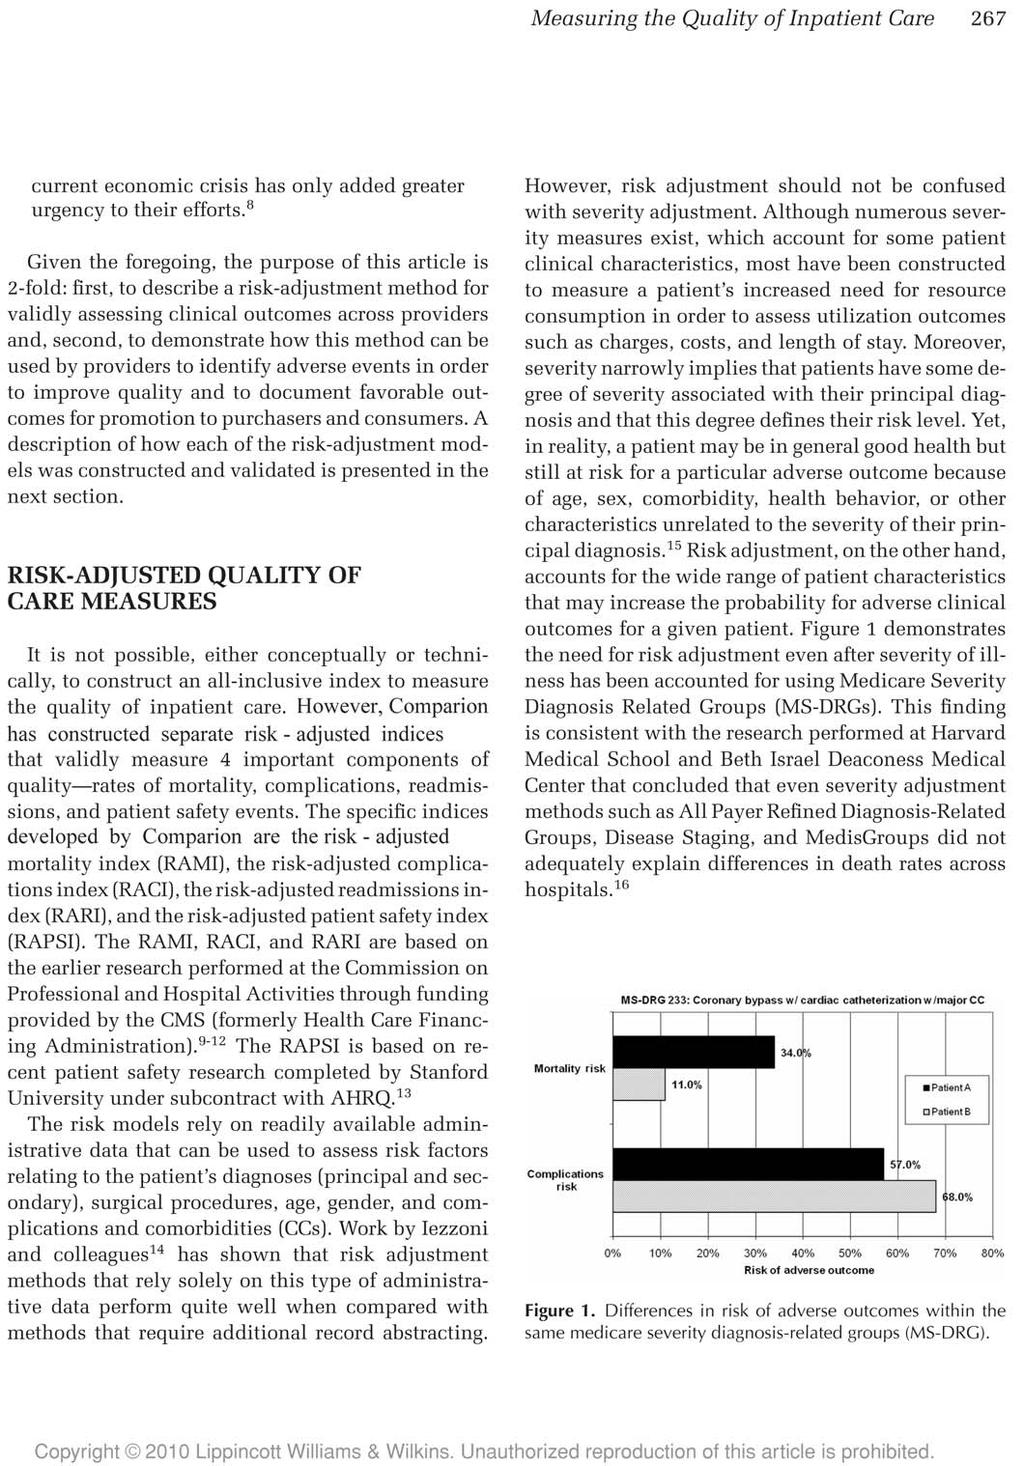
2 266 QUALITY MANAGEMENT IN HEALTH CARE/VOLUME 19, ISSUE 3, JULY SEPTEMBER 2010 federal quality standards. In 2003, the CMS instituted a pay-for-performance pilot program to reward hospitals with exemplary quality performance and penalize those with substandard performance. 2 Furthermore, the Agency for Healthcare Research and Quality (AHRQ) is now required to report to Congress on the state of the nation s health care quality. A report of these findings is now released annually to the public in the form of a National Health Care Quality Report. The intent of the report is to measure safety, effectiveness, timeliness, and patient centeredness. In 1999, the National Quality Forum was created in response to the national quality improvement agenda proposed by the President s Advisory Commission on Consumer Protection and Quality. The National Quality Forum was founded to develop and implement a national strategy for health care quality measurement and reporting. The CMS is supporting National Quality Forum to develop quality indicators that can be reported and measured at a national level. The American Hospital Association, the Federation of American Hospitals, and the Association of American Medical Colleges have also embarked on a national initiative to collect and report hospital quality performance information on a voluntary basis. 3 The CMS, along with the JCAHO, and the AHRQ support the initiative as the beginning of an ongoing effort to make hospital performance information more accessible to consumers, payers, and providers of care. From an employer s perspective, increased accountability and public awareness have been established with the formation of the Leapfrog Group, founded in 2000 by the Business Round Table, a national association of Fortune 500 companies representing 150 public and private organizations that provide health benefits to more than 34 million consumers across all 50 states. The Business Round Table launched the Leapfrog initiative to address patient safety and quality issues in the US health care system and to recognize health plans and hospitals that implement the Leapfrog s quality standards. 4 As with the other national initiatives, the JCAHO and the CMS are working with the Leapfrog group to consistently accomplish these objectives. Other organizations such as CareChex, HealthGrades, WebMD, and Consumer Reports have joined the campaign through the release of hospital report cards and various awards designed to recognize providers who achieve commendable levels of quality performance. 5 Similarly US News & World Report 5 and Modern Healthcare, 6 as well as other media organizations, continue to promote public awareness through the publication of annual hospital rankings. It would be difficult to imagine that a more pervasive culmination of efforts could exist to press the issue of publicly available hospital quality reporting. However, with all this reporting activity, it is imperative to recognize that since significant differences in demographic and clinical risk factors exist among patients treated across providers, a medically meaningful and statistically reliable risk adjustment tool is needed to make accurate comparisons of clinical outcomes. As Localio et al state, Organizations seeking to compare the quality of hospitals and physicians through outcome data need to recognize that simplistic methods applicable to large samples fail when applied to the outcomes of typical patients such as those admitted for pneumonia. Although these comparisons are much in demand, careful attention must be paid to their statistical methods to ensure validity and fairness. 7(p126) Although the usefulness and validity of the various quality measures deployed across the industry may vary, they nonetheless point to a growing desire for the public to make more informed choices regarding the selection of health care providers. In fact, a recent study performed by GE Healthcare indicates that one of the most important trends that should be considered in a hospital s strategy development is that quality reporting is shifting from value-add to essential. In this study, Vachon maintains, Metrics around quality and performance will drive everything that matters in health care going forward, from payer reimbursement and consumer choice to investment strategies that deliver results. Consumers and payers want to get the best care possible for their dollar, and the
3
4 268 QUALITY MANAGEMENT IN HEALTH CARE/VOLUME 19, ISSUE 3, JULY SEPTEMBER 2010 Risk-adjustment methodology Risk factors for calculating the mortality model, complications model, readmissions model, and patient safety model were independently applied within clusters of MS-DRGs using binary logistic regression. The predictive variables for mortality, complications, and readmissions include the patient s age, gender, the number of major chronic conditions, and the number of other significant comorbidities. The list of major chronic conditions covers 1229 diagnosis codes and represents illnesses such as emphysema, diabetes, and cancer. The list of other significant comorbidities encompasses 1374 diagnosis codes and comprises illnesses such as acute appendicitis, bacterial pneumonia, and encephalitis. The risk factors for predicting the occurrence of patient safety events include MS-DRG cluster, age, gender, and number of AHRQ-specified comorbidities. The 1254 comorbidities identified by AHRQ to significantly increase the risk of patient safety events include conditions such as aortic valve disorders, endocarditis, and congestive heart failure. A summary of the predictive variables used for each of the aforementioned risk models is displayed in Table 1. Logistic regression was selected since each of the outcomes to be predicted (ie, death, presence of a complication, and readmission) could only be classified into 1 of 2 categories (either they occurred or they did not occur). The logistic regression model estimated the risk of each outcome for each patient at risk using a nationally representative database composed of 27 million discharges from general, acute, and nonfederal hospitals across 39 states. The database was nationally representative with respect to hospital bed size, teaching status, urban/rural designation, and geographic location. This risk estimate for each outcome was accomplished by weighting patient records using the beta coefficients associated with the corresponding predictive variables in the regression model and the intercept term. This produced the overall probability value for each outcome based on the normative experience of patients with similar clinical characteristics. The clustering of MS-DRGs was necessary because many of the risk factors associated with an increased risk of death or complications for a clinical condition were used as the basis for MS-DRG patient classification (eg, presence or absence of CCs and discharge status). For instance, simple pneumonia and pleurisy are assigned to MS-DRGs on the basis of the designation of with major CC, with CC, or without CC. Similarly, MS-DRGs represent acute myocardial infarction cases, but the MS- DRG assignments vary by discharge status (alive or expired) and are further stratified on the basis of the presence or absence of CCs. Consequently, MS-DRGs were combined into clinically related clusters to Table 1 SUMMARY OF PREDICTIVE VARIABLES BY RISK MODEL Mortality Complications Readmissions Patient Safety Predictive Variables Model Model Model Model Demographic Age Gender Clinical Medicare Severity Diagnosis-Related Groups cluster No. of major chronic conditions No. of other significant comorbidities No. of Agency for Healthcare Research and Quality-specified comorbidities

5 Measuring the Quality of Inpatient Care 269 Figure 2. Structure of specific medicare severity diagnosis-related groups (MS-DRG) clusters. CC indicates complications and comorbidities. determine how CCs and other factors were associated with an increased risk of adverse outcomes within each disease category. The clustering process was applied across all MS-DRGs that resulted in 746 distinct clinical categories. For ease of analysis, once the models were applied to the MS-DRG clusters, most of the results were unbundled and summarized at the individual MS-DRG level. The method used to cluster MS-DRGs was essentially the same as the CMS adjacent diagnosis related group (DRG) methodology developed by the Health Systems Management Group at Yale University to combine DRGs with and without CCs. 17 The actual structure of specific MS-DRG clusters is shown in Figure 2.
6 270 QUALITY MANAGEMENT IN HEALTH CARE/VOLUME 19, ISSUE 3, JULY SEPTEMBER 2010 Hospital facility characteristics such as ownership type, bed size, teaching status, residency training program status, rural or urban designation, and occupancy level were not used in the regression models since these characteristics do not adjust for a patient s legitimate clinical risk. 18 Instead, they represent the institutional risk associated with being admitted to a particular type of facility. The importance of excluding hospital characteristics cannot be overstated since the inclusion of these characteristics would grossly distort each of the risk models by lowering and raising the standard of care across hospitals when the demographic and clinical characteristics of the patients are the same. Furthermore, since institutional risk is one of the residual variables that should be carefully evaluated by purchasers and providers, the use of hospital characteristics is counterintuitive and therefore lacks face validity with employers, payers, and the medical community at large. 11 Risk-adjusted mortality index The RAMI was developed to measure to what extent a provider s inpatient mortality rate is higher or lower than expected for specific diagnoses and procedures given the risk factors of the patient population, where an index of 1.00 indicates that the actual mortality rate equals the expected rate. The RAMI model excludes all patients with do-not-resuscitate and palliative care codes as well as all MS-DRG clusters with fewer than 300 cases nationally (because of insufficient statistical power). In addition, complications of care were excluded as risk factors so the patient s illness level at the time of admission could be measured to assess the risk of the patient s primary medical problem and related comorbidities prior to medical intervention. Clinicians designated 48 postsurgical and 110 postobstetrical conditions on the CMS major CC and CC list to be complications of care or iatrogenic events. This list includes problems such as accidental operative laceration, postoperative infection, and obstetrical shock. Risk-adjusted complications index The RACI was developed to identify the extent to which a provider s postsurgical and postobstetrical complication rates during a hospital stay are higher or lower than expected for particular diagnoses and procedures, given the risk factors of the patient population, where an index of 1.00 indicates that the actual complication rate is equal to the expected rate. The RACI model excludes newborns, all cases that died, all cases that were transferred to other shortterm hospitals, and MS-DRG clusters with less than 300 cases nationally. A list of the postsurgical and postobstetrical complications screened by the RACI is displayed in Table 2. Risk-adjusted readmissions index The risk-adjusted readmissions index was developed to measure the extent to which a provider s actual readmission rate is higher or lower than expected for specific diagnoses and procedures, given the risk factors of the patient population, where an index of 1.00 indicates that the actual readmission rate is equal to the expected rate. Importantly, the RARI measures only unanticipated readmissions to the same hospital within 30 days of discharge. Since the purpose of the readmissions model is to identify adverse outcomes, certain types of readmissions were excluded such as readmissions that would ordinarily be either scheduled (eg, chemotherapy) or unavoidable (eg, multiple admissions for AIDS patients and cancer patients). In addition, cases that were transferred to another short-term hospital, cases that died during the first admission, and newborns were excluded from the model. Moreover, a case was considered a readmission only if the patient s subsequent hospital stay was in the same MS-DRG or related service line as the first admission. Lastly, MS-DRG clusters with fewer than 300 cases nationally were excluded from analysis. Risk-adjusted patient safety index The risk-adjusted patient safety index was developed to identify the extent to which a provider s actual rate of patient safety events during a hospital stay for particular diagnoses and procedures is higher or lower than expected, given the risk factors of the patient population, where an index of 1.00 indicates the actual rate of patient safety events equals the
7 Measuring the Quality of Inpatient Care 271 Table 2 LIST OF POSTSURGICAL AND POSTOBSTETRICAL COMPLICATIONS 1. Accidental cut in medical care necrotizing endocarditis (NEC) 2. Accidental cut in medical care not otherwise specified (NOS) 3. Accidental cut/hemorrhage in infusion 4. Accidental cut/hemorrhage in injection 5. Accidental cut/hemorrhage in surgery 6. Accidental cut/hemorrhage with catheterization 7. Accidental cut/hemorrhage with enema 8. Accidental cut/hemorrhage with heart catheter 9. Accidental cut/hemorrhage with scope exam 10. Accidental cut/hemorrhage, perfusion NEC 11. Accidental operative laceration 12. Accidental puncture or laceration during a procedure 13. Cataract fragment from cataract surgery 14. Complications due to cardiac device, implant, or graft 15. Complications due to renal dialysis device, graft 16. Complications due to vascular access device, implant, graft 17. Disruption external wound 18. Disruption internal wound 19. Emphysema resulting from procedure 20. Foreign body accidentally left in during procedure 21. Hematoma complication procedural 22. Hemorrhage complication procedural 23. Iatrogenic cardiovascular infarction/hemorrhage 1. Acute renal failure, delivered with 2. Acute renal failure, 3. Amniotic embolism, 4. Amniotic embolism, delivered 5. Amniotic embolism, delivered with 6. Cerebrovascular disorder, delivered with 7. Cerebrovascular disorder, 8. Central nervous system complication in delivery, 9. Central nervous system complication labor/delivery, delivered 10. Central nervous system complication, delivered with 11. Complicated delivery NEC, delivered with 12. Complicated delivery NEC, 13. Complicated delivery NOS, delivered with 14. Complicated delivery NOS, 15. Complicated labor/delivery NOS, delivered Postsurgical complications Postobstetrical complications 24. Iatrogenic pulmonary embolism/infarction 25. Iatrogenic pneumothorax 26. Infected postoperative seroma 27. Nonhealing surgical wound 28. Other specific complication procedural NEC 29. Other postoperative infection 30. Other respiratory complications 31. Persistent postoperative fistula 32. Postoperative complication NOS 33. Postoperative reaction to foreign substance accidentally left in 34. Postoperative shock 35. Postoperative wound disruption 36. Postoperative respiratory failure 37. Reaction other vascular device/graft 38. Seroma complicating procedure 39. Surgical complication hypertension 40. Surgical complication body system NEC 41. Surgical complication digestive 42. Surgical complication nervous system 43. Surgical complication peripheral vascular system 44. Surgical complication respiratory 45. Surgical complication urinary tract 46. Surgical complication heart 47. Vascular complications of medical care 48. Ventilator associated pneumonia 16. Complication of anesthesia NOS, delivered 17. Complication of anesthesia NOS, delivered with 18. Complication of anesthesia, 19. Complication of anesthesia, 20. Complication of anesthesia NEC, delivered 21. Complication of anesthesia NEC, delivered with 22. Damage to pelvic joint, delivered 23. Damage to pelvic joint, 24. Damage to pelvic joint, unspecified 25. Deep vein thrombosis, 26. Delivery with 3-degree laceration, delivered 27. Delivery with 3-degree laceration, 28. Deliver with 3-degree laceration, unspecified 29. Delivery with 4-degree laceration, delivered 30. Delivery with 4-degree laceration, 31. Delivery with 4-degree laceration, unspecified (continues)
8 272 QUALITY MANAGEMENT IN HEALTH CARE/VOLUME 19, ISSUE 3, JULY SEPTEMBER 2010 Table 2 LIST OF POSTSURGICAL AND POSTOBSTETRICAL COMPLICATIONS (Continued ) Postobstetrical complications (continued ) 32. Delayed hemorrhage, delivered with P/P 33. Delayed hemorrhage, 34. Disrupted C-section wound, delivered with 35. Disrupted C-section wound, 36. Disrupted C-section wound, unspecified 37. Disrupted perineum, delivered with 38. Disruption perineum, 39. Heart complication in delivery, delivered 40. Heart complication, delivered with 41. Heart complication, 42. High vaginal laceration, delivered 43. High vaginal laceration, 44. High vaginal laceration, unspecified 45. Injury, pelvic organ NEC, 46. Inversed uterus, 47. Laceration of cervix, delivered 48. Laceration of cervix, 49. Laceration of cervix, unspecified 50. Major puerperal infection, delivered with 51. Major puerperal infection, 52. Major puerperal infection, unspecified 53. Maternal hypotension syndrome, delivered 54. Maternal hypotension syndrome, delivered with 55. Maternal hypotension syndrome, 56. Obstetrical air embolism, delivered 57. Obstetrical air embolism, delivered with 58. Obstetrical air embolism, 59. Obstetrical injury, pelvic organ NEC, delivered 60. Obstetrical injury, pelvic organ NEC, unspecified 61. Obstetrical perineal laceration NOS, delivered 62. Obstetrical perineal laceration NOS, unspecified 63. Obstetrical perineal trauma NEC, delivered 64. Obstetrical perineal trauma NEC, unspecified 65. Obstetrical perineal trauma NOS, delivered 66. Obstetrical perineal trauma NOS, unspecified 67. Obstetrical pyemic embolism, delivered 68. Obstetrical pyemic embolism, delivered with 69. Obstetrical pyemic embolism, 70. Obstetrical shock, delivered 71. Obstetrical shock, delivered with 72. Obstetrical shock, 73. Obstetrical surgical complication, delivered with 74. Obstetrical trauma NEC, antepartum 75. Obstetrical trauma NEC, delivered 76. Obstetrical trauma NEC, delivered with 77. Obstetrical trauma NEC, 78. Obstetrical trauma NEC, unspecified 79. Obstetrical trauma NOS, antepartum 80. Obstetrical trauma NOS, delivered 81. Obstetrical trauma NOS, delivered with 82. Obstetrical trauma NOS, 83. Obstetrical trauma NOS, unspecified 84. Other obstetrical complications, delivered 85. Other obstetrical complications, delivered with 86. Other obstetrical surgical complications, 87. Postpartum coagulation deficiency, delivered with 88. Perineal laceration NOS, 89. Perineal trauma NEC, 90. Perineal trauma NOS, 91. Postpartum coagulation deficit, 92. Postpartum hemorrhage NEC, delivered with 93. Postpartum hemorrhage NEC, 94. Puerperal cerebrovascular disorder, delivered 95. Pulmonary complication in delivery, delivered 96. Pulmonary complication, 97. Pulmonary complication, delivered with 98. Pulmonary embolism NEC, delivered 99. Pulmonary embolism NEC, delivered with 100. Pulmonary embolism NEC, 101. Pulmonary embolism NOS, delivered 102. Pulmonary embolism NOS, delivered with 103. Pulmonary embolism NOS, 104. Rupture uterus NOS, delivered 105. Third-stage hemorrhage, delivered with 106. Third-stage hemorrhage, 107. Thrombosis NEC, delivered 108. Thrombosis NEC, delivered with 109. Thrombosis NEC, 110. Thrombosis, delivered with
9 Measuring the Quality of Inpatient Care 273 expected rate. Given that AHRQ s patient safety indicator (PSI) methodology is limited to only evaluating an individual PSI occurrence (eg, PSI 6: Iatrogenic Pneumothorax) across a broad range of unrelated MS- DRG clusters aggregately, a notable benefit of RAPSI is that it allows for the global screening of all PSIs at risk at the individual MS-DRG level as well as the clinical category level (eg, cardiac care, orthopedic care). Without the use of the RAPSI methodology, important evaluations of this type are not possible. The RAPSI model excludes the following AHRQ PSIs due to inconsistent coding practices among hospitals or the prevalence of false positives: complications of anesthesia, accidental puncture and laceration, transfusion reaction, and death in low mortality DRGs. The model also excludes MS-DRG clusters with fewer than 300 cases nationally. A list of the 16 patient safety events screened by RAPSI is provided in Table 3 and includes adverse events such as iatrogenic pneumothorax, postoperative respiratory failure, and postoperative sepsis. Table 3 LIST OF PATIENT SAFETY EVENTS SCREENED BY THE RISK-ADJUSTED PATIENT SAFETY INDEX 1. Failure to rescue 2. Decubitus ulcer 3. Foreign body left in during procedure 4. Iatrogenic pneumothorax 5. Selected infections due to medical care 6. Postoperative hip fracture 7. Postoperative hemorrhage or hematoma 8. Postoperative physiologic and metabolic derangements 9. Postoperative respiratory failure 10. Postoperative pulmonary embolism or deep-vein thrombosis 11. Postoperative sepsis 12. Postoperative wound dehiscence in abdominopelvic surgical patients 13. Birth trauma injury to neonate 14. Obstetric trauma vaginal delivery with instrument 15. Obstetric trauma vaginal delivery without instrument 16. Obstetric trauma cesarean delivery Validation of the risk models Significant effort was taken to construct medically meaningful and statistically reliable models for riskadjusting comparisons of mortality, complications, readmissions, and patient safety events. A summary of the steps taken to ensure the validity of each of the risk models is as follows. 1. Only demographic and clinical characteristics of patients were used as predictive variables in each of the risk models. 2. Risk factors were modeled for RAMI, RACI, RARI, and RAPSI, using a large, representative database that covered all payer classifications and case types except neonates. 3. Statistical analysis was performed on each of the models using an R-square (R 2 ) and C-statistic. Specifically, the R 2 was calculated by comparing observed rates to predicted rates across an independent data set that was not used to fit the models. The resultant R 2 values for the models were shown to be 0.94 for RAMI, 0.93 for RACI, 0.97 for RARI, and 0.93 for RAPSI; where 1.0 would indicate a perfect linear relationship between observed and predicted rates. Models with R 2 values greater than 0.50 are generally considered to have good predictive power. Although R 2 values are commonly reported for dichotomous data, they are referred to as pseudo-r 2 s since the statistic was specifically designed to identify the amount of variation explained using continuous data. Hence, the findings derived from pseudo-r 2 s can be less reliable for determining the actual predicative capability of dichotomous models. Consequently, a C-statistic was calculated from the receiver-operator characteristic curve to determine the extent to which each model correctly predicted their respective dichotomous outcome, where a C-statistic of 0.50 or less indicates poor predictive power. The resultant C-statistics yielded 0.87 for RAMI, 0.68 for RACI, 0.59 for RARI, and 0.54 for RAPSI. A summary of the statistical measures used for validating each model s predictive capability is provided in Table 4. An overview of the various outcome
10 274 QUALITY MANAGEMENT IN HEALTH CARE/VOLUME 19, ISSUE 3, JULY SEPTEMBER 2010 Table 4 SUMMARY OF R-SQUARES AND C-STATISTICS BY RISK MODEL a Category by Statistic Mortality Model Complications Model Readmissions Model Patient Safety Model Overall R C-statistic Medical R C-statistic Surgical R C-statistic a Ellipses indicate not available (complications model only reports on postsurgical and postobstetrical cases). analyses that can be performed using the risk models is discussed in the next section. CLINICAL QUALITY ANALYSIS There are various databases available for conducting valid comparisons of provider outcomes (for both hospitals and physicians). The databases rely on patient discharge abstracts and include the following. Centers for Medicare & Medicaid Services Medicare Provider Analysis and Review files, which represent all Medicare discharges from shortterm, general, nonfederal US hospitals. Public domain all payer statewide databases that include Arizona, Arkansas, California, Colorado, Connecticut, Florida, Georgia, Illinois, Iowa, Louisiana, Maine, Maryland, Missouri, Massachusetts, Nevada, New Hampshire, New Jersey, New York, North Carolina, Ohio, Oregon, Pennsylvania, Rhode Island, South Carolina, Tennessee, Texas, Utah, Vermont, Virginia, Washington, West Virginia, Wisconsin, and Wyoming (certain restrictions may apply regarding data access and reporting in each state). Proprietary universal billing (UB) data from individual hospitals and consortia (including networks, alliances, and multihospital systems). Application of the risk models for analysis of hospital outcomes is displayed in Table 5, using Medicare data from the CMS Medicare Provider Analysis and Review file. Actual and expected rates of mortality, complications, and patient safety events for coronary bypass with cardiac catheterization with major CC (MS-DRG 233) are shown, along with the respective risk-adjusted indices for each hospital (actual hospital names are available on the Medicare Provider Analysis and Review file but were omitted for the sake of a generalized example). The expected rates represent the national rates for patients with similar demographic and clinical characteristics as those of the hospital under analysis. The risk-adjusted indices were calculated by taking the actual rates for mortality, complications, and patient safety events for each hospital and dividing them by the expected rates generated from the respective regression models. Hence, an index greater than 1.0 indicates that the actual rate is higher than expected (eg, an index of 1.20 indicates that the actual rate is 20% higher than expected), whereas an index less than 1.0 indicates that the actual rate is lower than expected (eg, an index of 0.80 indicates that the actual rate is 20% lower than expected). A 95%confidence interval was also calculated for each index to determine whether the difference between a hospital s performance and the national norm was statistically significant or merely due to normal variation in the data. The benchmarks were derived by ranking all hospitals in the national database from lowest to
11 Measuring the Quality of Inpatient Care 275 Table 5 MORTALITY AND COMPLICATIONS COMPARISON BY PROVIDER FOR MS-DRG 233: CORONARY BYPASS WITH CARDIAC CATHETERIZATION WITH MAJOR CC a Risk- Effect of Actual Expected Risk-Adjusted Actual Expected Adjusted Actual Expected Risk-Adjusted RACI Patient Patient Patient Number Mortality Mortality Mortality Complication Complication Complications Benchmark Safety Event Safety Event Safety Index Provider of Cases Rate, % Rate, % Index Rate, % Rate, % Index (RACI) b Variance on $ Rate, % Rate, % Index (RAPSI) b A b $11, B b $104, C b $12, D b $87, b E b $14, b Peer group $178, Benchmark National norm a From Centers for Medicare & Medicaid Services Medicare Provider Analysis and Review file. b Risk-adjusted index is statistically significant at a confidence level of 95%.
12 276 QUALITY MANAGEMENT IN HEALTH CARE/VOLUME 19, ISSUE 3, JULY SEPTEMBER 2010 Figure 3. Control chart for hospital risk-adjusted readmissions index by month. CC indicates complications and comorbidities; RARI, risk-adjusted readmissions index. highest on each risk-adjusted index and then identifying a cluster of providers that were performing at the 75th percentile. Thus, the benchmark represents providers whose performance is better than 75% of the providers in the database for the particular outcome. An analysis of Table 5 shows that all hospitals have mortality indices that are higher than expected nationally. However, these findings are not shown to be statistically significant. Consequently, the variation in mortality should be attributed to random variation rather than to poor quality of care. With regard to complications, hospitals A, C, and E have RACIs that are lower than expected nationally for bypass surgery, while RACIs for both hospital B and hospital D are higher than expected nationally. Each of these indices is shown to be statistically significant at a confidence level of 95%, which suggests that quality improvement opportunities exist since variation can be attributed to special causes. Comparison of all hospitals to the RACI benchmark reveals that providers A and E are performing better than the benchmark indicating that they are among the top performing providers in the nation. On the other hand, hospitals B and D are incurring more than $ and $87 000, respectively, in additional resource consumption because of complication rates that are much higher than the benchmark. The opportunity for hospitals B and D to reduce their cost of care by improving their rates of complications demonstrates a well-known continuous quality improvement principle that better quality can actually cost less. Additional analysis reveals that hospitals D and E are shown to have rates of patient safety events that are significantly higher than expected nationally. Another important measure of quality is the hospital s readmission rate. Figure 3 displays a particular hospital s RARI performance using a control chart that reveals that readmissions were lower in March 2008 than expected, but higher in August The fact that the corresponding data points are outside the upper and lower control limits indicates that the observations are statistically significant. If possible, differences in the pattern of care should be evaluated between the 2 months to identify the special causes of variation and uncover the underlying processes
13 Measuring the Quality of Inpatient Care 277 that led to a better than expected readmission rate in March. CONCLUSION This type of risk-adjusted approach to outcomes assessment allows purchasers to validly assess the relative performance of hospitals and physicians on important measures of quality. It also enables hospitals to identify and statistically validate adverse events, establish improvement priorities and objectives, develop quality improvement plans, assess compliance with pay-for-performance initiatives, and identify favorable outcomes for marketing to payers, employers, and consumers. In addition, it offers an effective process for monitoring new treatment protocols to ensure that cost containment does not compromise the quality of care. REFERENCES 1. Braun BI, Koss RG, Loeb JM. Integrating performance measure data into the Joint Commission accreditation process. Eval Health Prof. 1999;3: Darr K. The Centers for Medicare and Medicaid Services proposal to pay for performance. Hosp Top. 2003;2: Tide rises on pay for performance with voluntary reporting initiative. Healthc Financ Manag. 2004;58(3): Milstein A, Galvin RS, Delbanco SF, Salber P, Buck CR, Jr. Improving the safety of health care: the leapfrog initiative. Eff Clin Pract. 2000;3(6): Comaro A. America s best hospitals. US News World Rep. 2003;28: Burda D. They just do it better. Mod Healthc. 2003; 29(suppl):6. 7. Localio RA, Hamory BH, Sharp TJ, Weaver SL, TenHave TR, Landis JR. Comparing hospital mortality in adult patients with pneumonia: a case study of statistical methods in a managed care program. Ann Intern Med. 1995;122(2): Vachon M. Six trends for your next strategy session agenda. Healthc Executive. 2009;24(3)(Suppl.):1. 9. DesHarnais SI, McMahon LF Jr, Wroblewski RT. Measuring outcomes of hospital care using multiple risk-adjusted indexes. Health Serv Res. 1991;26(4): DesHarnais SI. Current uses of large data sets to assess the quality of providers: construction of risk-adjusted indexes of hospital performance. Int J Technol Assess Health Care. 1990;6: DesHarnais SI, McMahon LF Jr, Wroblewski RT, Hogan AJ. Measuring hospital performance: the development and validation of risk-adjusted indexes of mortality, readmissions, and complications. Med Care. 1990;28(12): DesHarnais SI, Chesney JD, Wroblewski RT, Fleming ST, McMahon LF Jr. The risk-adjusted mortality index: a new measure of hospital performance. Med Care. 1988;26(12): Patient Safety Indicators Overview. AHRQ Quality Indicators., Rockville, MD: Agency for Healthcare Research and Quality; Iezzoni LI, Ash AS, Shwartz M, Daly J, Hughs JS, Mackiernan YD. Predicting who dies depends on how severity is measured: implications for evaluating patient outcomes. Ann Intern Med. 1995;123: Pine M, Pine J. Standardization of terms and analytical methods for performance evaluation: achievable goal or impossible dream? Manag Care Q. 1995;3(3): Iezzoni LI. The risk of risk adjustment. J Am Med Assoc. 1997;278(19): Edwards N, Honemann D, Burley D, Navarro M. Refinement of the Medicare diagnosis-related groups to incorporate a measure of severity. Health Care Financ Rev. 1994;16(2): Iezzoni LI, ed. Risk Adjustment for Measuring Health Care Outcomes. Ann Arbor, MI: Health Administration Press; 1994;30 32, 200.
Clinical Documentation: Beyond The Financials Cheryll A. Rogers, RHIA, CDIP, CCDS, CCS Senior Inpatient Consultant 3M HIS Consulting Services
 Clinical Documentation: Beyond The Financials Cheryll A. Rogers, RHIA, CDIP, CCDS, CCS Senior Inpatient Consultant 3M HIS Consulting Services Clinical Documentation: Beyond The Financials Key Points of
CMS Quality Program- Outcome Measures. Kathy Wonderly RN, MSEd, CPHQ Consultant Developed: December 2015 Revised: January 2018
 CMS Quality Program- Outcome Measures Kathy Wonderly RN, MSEd, CPHQ Consultant Developed: December 2015 Revised: January 2018 Philosophy The Centers for Medicare and Medicaid Services (CMS) is changing
Minnesota Statewide Quality Reporting and Measurement System: Appendices to Minnesota Administrative Rules, Chapter 4654
 This document is made available electronically by the Minnesota Legislative Reference Library as part of an ongoing digital archiving project. http://www.leg.state.mn.us/lrl/lrl.asp Minnesota Statewide
Quality Reporting in the Public Domain
 Quality Reporting in the Public Domain Disclaimer This material is designed and provided to communicate information about inpatient coding, clinical documentation, and/or compliance in an educational format
(202) or CMS Proposals to Improve Quality of Care during Hospital Inpatient Stays
 or CMS Proposals to Improve Quality of Care during Hospital Inpatient Stays") DEPARTMENT OF HEALTH & HUMAN SERVICES Centers for Medicare & Medicaid Services Room 352-G 200 Independence Avenue, SW Washington, DC 20201 FACT SHEET FOR IMMEDIATE RELEASE April 30, 2014 Contact: CMS Media
DEPARTMENT OF HEALTH & HUMAN SERVICES Centers for Medicare & Medicaid Services Room 352-G 200 Independence Avenue, SW Washington, DC 20201 FACT SHEET FOR IMMEDIATE RELEASE April 30, 2014 Contact: CMS Media
Additional Considerations for SQRMS 2018 Measure Recommendations
 Additional Considerations for SQRMS 2018 Measure Recommendations HCAHPS The Hospital Consumer Assessments of Healthcare Providers and Systems (HCAHPS) is a requirement of MBQIP for CAHs and therefore a
Hospital data to improve the quality of care and patient safety in oncology
 Symposium QUALITY AND SAFETY IN ONCOLOGY NURSING: INTERNATIONAL PERSPECTIVES Hospital data to improve the quality of care and patient safety in oncology Dr Jean-Marie Januel, PhD, MPH, RN MER 1, IUFRS,
Comparing Patient Safety in Rural Hospitals by Bed Count
 Comparing Patient Safety in Rural Hospitals by Bed Count Stephenie L. Loux, Susan M. C. Payne, Astrid Knott Abstract Objectives: Patient safety is an important national issue. To date, there has been little
Nielsen ICD-9. Healthcare Data
 Nielsen ICD-9 Healthcare Data Healthcare Utilization Model The Nielsen healthcare utilization model has three primary components: demographic cohort population counts, cohort-specific healthcare utilization
Hospital Acquired Conditions: using ACS-NSQIP to drive performance. J Michael Henderson Jackie Matthews Nirav Vakharia
 Hospital Acquired Conditions: using ACS-NSQIP to drive performance J Michael Henderson Jackie Matthews Nirav Vakharia Your Team: Quality & Patient Safety Institute Cleveland Clinic Mike Henderson: Chief
FY 2014 Inpatient Prospective Payment System Proposed Rule
 FY 2014 Inpatient Prospective Payment System Proposed Rule Summary of Provisions Potentially Impacting EPs On April 26, 2013, the Centers for Medicare and Medicaid Services (CMS) released its Fiscal Year
August 1, 2012 (202) CMS makes changes to improve quality of care during hospital inpatient stays
 CMS makes changes to improve quality of care during hospital inpatient stays") DEPARTMENT OF HEALTH & HUMAN SERVICES Centers for Medicare & Medicaid Services Room 352-G 200 Independence Avenue, SW Washington, DC 20201 FACT SHEET FOR IMMEDIATE RELEASE Contact: CMS Media Relations
DEPARTMENT OF HEALTH & HUMAN SERVICES Centers for Medicare & Medicaid Services Room 352-G 200 Independence Avenue, SW Washington, DC 20201 FACT SHEET FOR IMMEDIATE RELEASE Contact: CMS Media Relations
National Provider Call: Hospital Value-Based Purchasing
 National Provider Call: Hospital Value-Based Purchasing Fiscal Year 2015 Overview for Beneficiaries, Providers, and Stakeholders Centers for Medicare & Medicaid Services 1 March 14, 2013 Medicare Learning
Scoring Methodology FALL 2016
 Scoring Methodology FALL 2016 CONTENTS What is the Hospital Safety Grade?... 4 Eligible Hospitals... 4 Measures... 5 Measure Descriptions... 7 Process/Structural Measures... 7 Computerized Physician Order
AHRQ Quality Indicators. Maryland Health Services Cost Review Commission October 21, 2005 Marybeth Farquhar, AHRQ
 AHRQ Quality Indicators Maryland Health Services Cost Review Commission October 21, 2005 Marybeth Farquhar, AHRQ Overview AHRQ Quality Indicators Current Uses of the Quality Indicators Case Studies of
1. Recommended Nurse Sensitive Outcome: Adult inpatients who reported how often their pain was controlled.
 Testimony of Judith Shindul-Rothschild, Ph.D., RNPC Associate Professor William F. Connell School of Nursing, Boston College ICU Nurse Staffing Regulations October 29, 2014 Good morning members of the
Analysis of Final Rule for FY 2009 Revisions to the Medicare Hospital Inpatient Prospective Payment System
 Analysis of Final Rule for FY 2009 Revisions to the Medicare Hospital Inpatient Prospective Payment System The final rule regarding fiscal year (FY) 2009 revisions to the Medicare hospital inpatient prospective
Benefits by Service: Inpatient Hospital Services, other than in an Institution for Mental Diseases (October 2006) Definition/Notes
 Definition/Notes") Page 1 of 9 Benefits by Service: Inpatient Hospital Services, other than in an Institution for Mental Diseases (October 2006) Definition/Notes Note: Totals include 50 states and D.C. "Benefits Covered"
Page 1 of 9 Benefits by Service: Inpatient Hospital Services, other than in an Institution for Mental Diseases (October 2006) Definition/Notes Note: Totals include 50 states and D.C. "Benefits Covered"
STATISTICAL BRIEF #9. Hospitalizations among Males, Highlights. Introduction. Findings. June 2006
 HEALTHCARE COST AND UTILIZATION PROJECT STATISTICAL BRIEF #9 Agency for Healthcare Research and Quality June 2006 Hospitalizations among Males, 2003 C. Allison Russo, M.P.H. and Anne Elixhauser, Ph.D.
2016 HCPro, a division of BLR. All rights reserved. These materials may not be duplicated without express written permission.
 Potentially Preventable Complications: Getting the Whole Picture Cheryl Manchenton, RN, BSN, CCDS Project Manager/Quality Services Lead 3M HIS Consulting Services Atlanta, GA 1 Learning Objectives At the
SCORING METHODOLOGY APRIL 2014
 SCORING METHODOLOGY APRIL 2014 HOSPITAL SAFETY SCORE Contents What is the Hospital Safety Score?... 4 Who is The Leapfrog Group?... 4 Eligible and Excluded Hospitals... 4 Scoring Methodology... 5 Measures...
Scoring Methodology FALL 2017
 Scoring Methodology FALL 2017 CONTENTS What is the Hospital Safety Grade?... 4 Eligible Hospitals... 4 Measures... 5 Measure Descriptions... 9 Process/Structural Measures... 9 Computerized Physician Order
2015 State Hospice Report 2013 Medicare Information 1/1/15
 2015 State Hospice Report 2013 Medicare Information 1/1/15 www.hospiceanalytics.com 2 2013 Demographics & Hospice Utilization National Population 316,022,508 Total Deaths 2,529,792 Medicare Beneficiaries
Value-Based Purchasing & Payment Reform How Will It Affect You?
 Value-Based Purchasing & Payment Reform How Will It Affect You? HFAP Webinar September 21, 2012 Nell Buhlman, MBA VP, Product Strategy Click to view recording. Agenda Payment Reform Landscape Current &
Health Economics Program
 Health Economics Program Issue Brief 2006-02 February 2006 Health Conditions Associated With Minnesotans Hospital Use Health care spending by Minnesota residents accounts for approximately 12% of the state
CENTERS OF EXCELLENCE/HOSPITAL VALUE TOOL 2011/2012 METHODOLOGY
 A CENTERS OF EXCELLENCE/HOSPITAL VALUE TOOL 2011/2012 METHODOLOGY Introduction... 2 Surgical Procedures/Medical Conditions... 2 Patient Outcomes... 2 Patient Outcomes Quality Indexes... 3 Patient Outcomes
Reimbursement Policy Subject: Present on Admission Indicator for Health Care-Acquired Conditions 06/01/12 05/02/16 Administration Policy
 Reimbursement Policy Subject: Present on Admission Indicator for Health Care-Acquired Conditions Committee Approval Obtained: Section: Effective Date: 06/01/12 05/02/16 Administration *****The most current
Reducing Readmissions: Potential Measurements
 Reducing Readmissions: Potential Measurements Avoid Readmissions Through Collaboration October 27, 2010 Denise Remus, PhD, RN Chief Quality Officer BayCare Health System Overview Why Focus on Readmissions?
Beyond Severity of Illness: Evaluating Differences in Patient Intensity and Complexity for Valid Assessment of Medical Practice Pattern Variation
 Beyond Severity of Illness: Evaluating Differences in Patient Intensity and Complexity for Valid Assessment of Medical Practice Pattern Variation M. Thane Forthman, Henry G. Dove, Christopher L. Forthman,
Subject: Hospital-Acquired Conditions (Page 1 of 5)
") Subject: Hospital-Acquired Conditions (Page 1 of 5) Objective: I. To facilitate safe patient care for all Health Share/Tuality Health Alliance (THA) members. II. To encourage and support provider efforts
Subject: Hospital-Acquired Conditions (Page 1 of 5) Objective: I. To facilitate safe patient care for all Health Share/Tuality Health Alliance (THA) members. II. To encourage and support provider efforts
Inpatient Quality Reporting Program
 Hospital Value-Based Purchasing Program: Overview of FY 2017 Questions & Answers Moderator: Deb Price, PhD, MEd Educational Coordinator, Inpatient Program SC, HSAG Speaker(s): Bethany Wheeler, BS HVBP
 Page 1 of 7 Medicaid Benefits Services Covered, Limits, Copayments and Reimbursement Methodologies For 50 States, District of Columbia and the Territories (as of January 2003) CHOOSE SERVICE Go CHOOSE
Accreditation, Quality, Risk & Patient Safety
 Accreditation, Quality, Risk & Patient Safety Accreditation The Joint Commission (TJC) Centers for Medicare & Medicaid Services (CMS) Wyoming Department of Health (DOH) Joint Commission: - Joint Commission
Surgeon Champion: Getting Started, What You Need to Know
 Surgeon Champion: Getting Started, What You Need to Know Ninh T. Nguyen, MD, FACS Professor of Surgery Surgeon Champion Vice-Chair, Dept Surgery University of California, Irvine, Medical Center, Orange,
Hospital-Acquired Condition Reduction Program. Hospital-Specific Report User Guide Fiscal Year 2017
 Hospital-Acquired Condition Reduction Program Hospital-Specific Report User Guide Fiscal Year 2017 Contents Overview... 4 September 2016 Error Notice... 4 Background and Resources... 6 Updates for FY 2017...
CME Disclosure. HCAHPS- Hardwiring Your Hospital for Pay-for-Performance Success. Accreditation Statement. Designation of Credit.
 CME Disclosure Accreditation Statement Studer Group is accredited by the Accreditation Council for Continuing Medical Education (ACCME) to provide continuing medical education for physicians. Designation
Understanding HSCRC Quality Programs and Methodology Updates
 Understanding HSCRC Quality Programs and Methodology Updates Kristen Geissler, MS, PT, CPHQ, MBA Managing Director Beth Greskovich - Director Berkeley Research Group August 19, 2016 Maryland Waiver and
Scoring Methodology SPRING 2018
 Scoring Methodology SPRING 2018 CONTENTS What is the Hospital Safety Grade?... 4 Eligible Hospitals... 4 Measures... 6 Measure Descriptions... 9 Process/Structural Measures... 9 Computerized Physician
Case-mix Analysis Across Patient Populations and Boundaries: A Refined Classification System
 Case-mix Analysis Across Patient Populations and Boundaries: A Refined Classification System Designed Specifically for International Quality and Performance Use A white paper by: Marc Berlinguet, MD, MPH
The dawn of hospital pay for quality has arrived. Hospitals have been reporting
 Value-based purchasing SCIP measures to weigh in Medicare pay starting in 2013 The dawn of hospital pay for quality has arrived. Hospitals have been reporting Surgical Care Improvement Project (SCIP) measures
Understanding Patient Choice Insights Patient Choice Insights Network
 Quality health plans & benefits Healthier living Financial well-being Intelligent solutions Understanding Patient Choice Insights Patient Choice Insights Network SM www.aetna.com Helping consumers gain
Objectives 2/23/2011. Crossing Paths Intersection of Risk Adjustment and Coding
 Crossing Paths Intersection of Risk Adjustment and Coding 1 Objectives Define an outcome Define risk adjustment Describe risk adjustment measurement Discuss interactive scenarios 2 What is an Outcome?
Impacting Quality Initiatives through Documentation Improvement. Fran Jurcak, MSN, RN, CCDS Vice President of Clinical Innovation Iodine Software
 Impacting Quality Initiatives through Documentation Improvement Fran Jurcak, MSN, RN, CCDS Vice President of Clinical Innovation Iodine Software Objectives The learner will be able to: Articulate the goals
Medicare Value Based Purchasing August 14, 2012
 Medicare Value Based Purchasing August 14, 2012 Wes Champion Senior Vice President Premier Performance Partners Copyright 2012 PREMIER INC, ALL RIGHTS RESERVED Premier is the nation s largest healthcare
FY 2014 Per Capita Federal Spending on Major Grant Programs Curtis Smith, Nick Jacobs, and Trinity Tomsic
 Special Analysis 15-03, June 18, 2015 FY 2014 Per Capita Federal Spending on Major Grant Programs Curtis Smith, Nick Jacobs, and Trinity Tomsic 202-624-8577 ttomsic@ffis.org Summary Per capita federal
 Page 1 of 5 Health Reform Medicaid/CHIP Medicare Costs/Insurance Uninsured/Coverage State Policy Prescription Drugs HIV/AIDS Medicaid Benefits Services Covered, Limits, Copayments and Reimbursement Methodologies
Cigna Centers of Excellence Hospital Value Tool 2016 Methodology
 Cigna Centers of Excellence Hospital Value Tool 2016 Methodology For Hospitals September 2015 Contents Introduction... 2 Surgical Procedures and Medical Conditions... 2 Patient Outcomes Data Sources...
Reimbursement Policy Subject: Present on Admission Indicator for Health Care-Acquired Conditions 04/01/14 Administration 05/02/16
 Reimbursement Policy Subject: Present on Admission Indicator for Health Care-Acquired Conditions Committee Approval Obtained: Effective Date: 04/01/14 Section: Administration 05/02/16 ***** The most current
Reimbursement Policy Subject: Present on Admission Indicator for Health Care-Acquired Conditions 01/01/14 Administration 05/02/16
 Anthem BlueCross BlueShield Medicaid Reimbursement Policy Subject: Committee Approval Obtained: Effective Date: 01/01/14 Section: Administration 05/02/16 ***** The most current version of our reimbursement
Ambulatory-care-sensitive admission rates: A key metric in evaluating health plan medicalmanagement effectiveness
 Milliman Prepared by: Kathryn Fitch, RN, MEd Principal, Healthcare Management Consultant Kosuke Iwasaki, FIAJ, MAAA Consulting Actuary Ambulatory-care-sensitive admission rates: A key metric in evaluating
Healthgrades 2016 Report to the Nation
 Healthgrades 2016 Report to the Nation Local Differences in Patient Outcomes Reinforce the Need for Transparency Healthgrades 999 18 th Street Denver, CO 80202 855.665.9276 www.healthgrades.com/hospitals
Provider Preventable Conditions: Health Care Acquired Conditions and Present on Admission Policy
 Provider Preventable Conditions: Health Care Acquired Conditions and Present on Admission Policy Policy Number 2018F7002A Annual Approval Date 3/14/2018 Approved By Reimbursement Policy Oversight Committee
Association between organizational factors and quality of care: an examination of hospital performance indicators
 University of Iowa Iowa Research Online Theses and Dissertations 2010 Association between organizational factors and quality of care: an examination of hospital performance indicators Smruti Chandrakant
Benefits by Service: Outpatient Hospital Services (October 2006)
") Page 1 of 8 Benefits by Service: Outpatient Hospital Services (October 2006) Definition/Notes Note: Totals include 50 states and D.C. "Benefits Covered" Totals "Benefits Not Covered" Totals Is the benefit
Page 1 of 8 Benefits by Service: Outpatient Hospital Services (October 2006) Definition/Notes Note: Totals include 50 states and D.C. "Benefits Covered" Totals "Benefits Not Covered" Totals Is the benefit
Prepared for North Gunther Hospital Medicare ID August 06, 2012
 Prepared for North Gunther Hospital Medicare ID 000001 August 06, 2012 TABLE OF CONTENTS Introduction: Benchmarking Your Hospital 3 Section 1: Hospital Operating Costs 5 Section 2: Margins 10 Section 3:
Disclosure of Proprietary Interest
 HomeTown Health HCCS Hospital Consortium Project: Track 3- Clinical Documentation: Strategies for Sharpening Focus Jenan Custer RHIT, CCS, CPC, CDIP AHIMA Approved ICD-10-CM/PCS Trainer Director of Coding
TABLE 3c: Congressional Districts with Number and Percent of Hispanics* Living in Hard-to-Count (HTC) Census Tracts**
 Census Tracts**") living Alaska 00 47,808 21,213 44.4 Alabama 01 20,661 3,288 15.9 Alabama 02 23,949 6,614 27.6 Alabama 03 20,225 3,247 16.1 Alabama 04 41,412 7,933 19.2 Alabama 05 34,388 11,863 34.5 Alabama 06 34,849 4,074
living Alaska 00 47,808 21,213 44.4 Alabama 01 20,661 3,288 15.9 Alabama 02 23,949 6,614 27.6 Alabama 03 20,225 3,247 16.1 Alabama 04 41,412 7,933 19.2 Alabama 05 34,388 11,863 34.5 Alabama 06 34,849 4,074
National Patient Safety Goals & Quality Measures CY 2017
 National Patient Safety Goals & Quality Measures CY 2017 General Clinical Orientation 2017 January National Patient Safety Goals 1. Identify Patients Correctly 2. Improve Staff Communication 3. Use Medications
3M Potentially Preventable Complications (PPCs) Version 31.0 (effective 10/01/2013) Methodology Overview
 Version 31.0 (effective 10/01/2013) Methodology Overview") 3M Potentially Preventable Complications (PPCs) Version 31.0 (effective 10/01/2013) Methodology Overview 3 Copyright 2013 2008, 3M. All rights reserved. This product contains material and information that
3M Potentially Preventable Complications (PPCs) Version 31.0 (effective 10/01/2013) Methodology Overview 3 Copyright 2013 2008, 3M. All rights reserved. This product contains material and information that
The Nexus of Quality and Finance
 The Nexus of Quality and Finance Kristen Geissler Pat Ercolano March 4, 2014 Transition from Volume to Value: IHI Triple Aim IHI Triple Aim Improve patient experience of care (quality & satisfaction) Improve
K-HEN Acute Care/Critical Access Hospitals Measures Alignment with PfP 40/20 Goals AEA Minimum Participation Full Participation 1, 2
 Outcome Measure for Any One of the Following: Outcome Measures Meeting Either A or B: Adverse Drug Events (ADE) All measures are surveillance data Hospital Collected Anticoagulant (ADE-12) Opioid (ADE-111)
Star Rating Method for Single and Composite Measures
 Star Rating Method for Single and Composite Measures CheckPoint uses three-star ratings to enable consumers to more quickly and easily interpret information about hospital quality measures. Composite ratings
SANTA ROSA MEMORIAL HOSPITAL AND AFFILIATED ENTITIES ONGOING PROFESSIONAL PRACTICE EVALUATION POLICY (OPPE)
") SANTA ROSA MEMORIAL HOSPITAL AND AFFILIATED ENTITIES ONGOING PROFESSIONAL PRACTICE EVALUATION POLICY (OPPE) Discussion Draft August 6, 2017 Horty, Springer & Mattern, P.C. 250979.8 ONGOING PROFESSIONAL
SANTA ROSA MEMORIAL HOSPITAL AND AFFILIATED ENTITIES ONGOING PROFESSIONAL PRACTICE EVALUATION POLICY (OPPE) Discussion Draft August 6, 2017 Horty, Springer & Mattern, P.C. 250979.8 ONGOING PROFESSIONAL
TABLE 3b: Congressional Districts Ranked by Percent of Hispanics* Living in Hard-to- Count (HTC) Census Tracts**
 Census Tracts**") Rank State District Count (HTC) 1 New York 05 150,499 141,567 94.1 2 New York 08 133,453 109,629 82.1 3 Massachusetts 07 158,518 120,827 76.2 4 Michigan 13 47,921 36,145 75.4 5 Illinois 04 508,677 379,527
Rank State District Count (HTC) 1 New York 05 150,499 141,567 94.1 2 New York 08 133,453 109,629 82.1 3 Massachusetts 07 158,518 120,827 76.2 4 Michigan 13 47,921 36,145 75.4 5 Illinois 04 508,677 379,527
Baptist Health System Jacksonville, FL
 Baptist Health System Jacksonville, FL Baptist Health System Community Leader in Healthcare Five (5) Hospital System Serving greater Jacksonville area and SE Georgia Children s Hospital Primary Care Facilities
 3+ 3+ N = 155, 442 3+ R 2 =.32 < < < 3+ N = 149, 685 3+ R 2 =.27 < < < 3+ N = 99, 752 3+ R 2 =.4 < < < 3+ N = 98, 887 3+ R 2 =.6 < < < 3+ N = 52, 624 3+ R 2 =.28 < < < 3+ N = 36, 281 3+ R 2 =.5 < < < 7+
Rankings of the States 2017 and Estimates of School Statistics 2018
 Rankings of the States 2017 and Estimates of School Statistics 2018 NEA RESEARCH April 2018 Reproduction: No part of this report may be reproduced in any form without permission from NEA Research, except
Sentinel Event Data. General Information Copyright, The Joint Commission
 Sentinel Event Data General Information 1995 2015 Data Limitations The reporting of most sentinel events to The Joint Commission is voluntary and represents only a small proportion of actual events. Therefore,
SEP Memorandum Report: "Trends in Nursing Home Deficiencies and Complaints," OEI
 DEPARTMENT OF HEALTH &. HUMAN SERVICES Office of Inspector General SEP 18 2008 Washington, D.C. 20201 TO: FROM: Kerry Weems Acting Administrator Centers for Medicare & Medicaid Services Daniel R. Levinson~
Design for Nursing Home Compare 5-Star Rating System: Users Guide
 Design for Nursing Home Compare 5-Star Rating System: Users Guide December 2008 Contents Introduction...1 Methodology...3 Survey Domain...3 Scoring Rules...3 Rating Methodology...4 Staffing Domain...5
FY 2014 Inpatient PPS Proposed Rule Quality Provisions Webinar
 FY 2014 Inpatient PPS Proposed Rule Quality Provisions Webinar May 23, 2013 AAMC Staff: Scott Wetzel, swetzel@aamc.org Mary Wheatley, mwheatley@aamc.org Important Info on Proposed Rule In Federal Register
Date: 5/25/2012. To: Chuck Wyatt, DCR, Virginia. From: Christos Siderelis
 1 Date: 5/25/2012 To: Chuck Wyatt, DCR, Virginia From: Christos Siderelis Chuck Wyatt with the DCR in Virginia inquired about the classification of state parks having resort type characteristics and, if
Critical Access Hospitals and HCAHPS
 Critical Access Hospitals and HCAHPS Michelle Casey, MS Senior Research Fellow and Deputy Director University of Minnesota Rural Health Research Center June 12, 2012 Overview of Presentation Why is HCAHPS
P4P Programs 9/13/2013. Medicare P4P Programs. Medicaid P4P Programs
 P4P Programs Medicare P4P Programs Hospital Quality Reporting Programs (IQR and OQR) Hospital Value-Based Purchasing (VBP) Program Hospital Readmissions Reduction Program (HRRP) Hospital-Acquired Conditions
Scottish Hospital Standardised Mortality Ratio (HSMR)
") ` 2016 Scottish Hospital Standardised Mortality Ratio (HSMR) Methodology & Specification Document Page 1 of 14 Document Control Version 0.1 Date Issued July 2016 Author(s) Quality Indicators Team Comments
` 2016 Scottish Hospital Standardised Mortality Ratio (HSMR) Methodology & Specification Document Page 1 of 14 Document Control Version 0.1 Date Issued July 2016 Author(s) Quality Indicators Team Comments
Sentinel Event Data. General Information Q Copyright, The Joint Commission
 Sentinel Event Data General Information 1995 2Q 2014 Data Limitations The reporting of most sentinel events to The Joint Commission is voluntary and represents only a small proportion of actual events.
Quality Based Impacts to Medicare Inpatient Payments
 Quality Based Impacts to Medicare Inpatient Payments Overview New Developments in Quality Based Reimbursement Recap of programs Hospital acquired conditions Readmission reduction program Value based purchasing
Definitions/Glossary of Terms
 Definitions/Glossary of Terms Submitted by: Evelyn Gallego, MBA EgH Consulting Owner, Health IT Consultant Bethesda, MD Date Posted: 8/30/2010 The following glossary is based on the Health Care Quality
Healthcare Reform Hospital Perspective
 Healthcare Reform Hospital Perspective Susan DeVore President and CEO, Premier, Inc. March 8, 2010 1 The end of an illusion 2 Current landscape for healthcare reform 3 Specific policies require a paradigm
Medicare s Inpatient Final Rule for Claire Kapilow, Director, Regulatory Affairs
 Medicare s Inpatient Final Rule for 2013 Claire Kapilow, Director, Regulatory Affairs Publisher Notice Although we have tried to include accurate and comprehensive information in this presentation, please
Frequently Asked Questions (FAQ) The Harvard Pilgrim Independence Plan SM
 The Harvard Pilgrim Independence Plan SM") Frequently Asked Questions (FAQ) The Harvard Pilgrim Independence Plan SM Plan Year: July 2010 June 2011 Background The Harvard Pilgrim Independence Plan was developed in 2006 for the Commonwealth of Massachusetts
Frequently Asked Questions (FAQ) The Harvard Pilgrim Independence Plan SM Plan Year: July 2010 June 2011 Background The Harvard Pilgrim Independence Plan was developed in 2006 for the Commonwealth of Massachusetts
2016 HCPro, a division of BLR. All rights reserved. These materials may not be duplicated without express written permission.
 To Err Is Human: CDI Impact on Patient Safety Indicators Kathleen Shindle, RN, BSN, CCDS, CDIP Allison Clerval, RN, BSN, CCDS, CDIP Clinical Supervisors Thomas Jefferson University Hospital Philadelphia,
Community Performance Report
 : Wenatchee Current Year: Q1 217 through Q4 217 Qualis Health Communities for Safer Transitions of Care Performance Report : Wenatchee Includes Data Through: Q4 217 Report Created: May 3, 218 Purpose of
How North Carolina Compares
 How North Carolina Compares A Compendium of State Statistics March 2017 Prepared by the N.C. General Assembly Program Evaluation Division Preface The Program Evaluation Division of the North Carolina General
Transitions Through the Care Continuum: Discussions on Barriers to Patient Care, Communications, and Advocacy
 Transitions Through the Care Continuum: Discussions on Barriers to Patient Care, Communications, and Advocacy Scott Matthew Bolhack, MD, MBA, CMD, CWS, FACP, FAAP April 29, 2017 Disclosure Slide I have
The Home Health Chartbook: Updated Data and Trends for Home Health Care in the United States. December 11, 2013
 The Home Health Chartbook: Updated Data and Trends for Home Health Care in the United States December 11, 2013 About the Alliance 501(c)(3) non-profit research foundation Mission: To support research and
Home Health Chartbook 2018: Prepared for the Alliance for Home Health Quality and Innovation
 Home Health Chartbook 2018: Prepared for the Alliance for Home Health Quality and Innovation Avalere Health An Inovalon Company September 2018 Table of Contents 2018 Chartbook 1. Demographics of Home Health
MBQIP Quality Measure Trends, Data Summary Report #20 November 2016
 MBQIP Quality Measure Trends, 2011-2016 Data Summary Report #20 November 2016 Tami Swenson, PhD Michelle Casey, MS University of Minnesota Rural Health Research Center ABOUT This project was supported
Central Valley/West Valley Care Coordination Coalitions. Quarterly Community Meeting
 Central Valley/West Valley Care Coordination Coalitions Ettie Lande, MS, RN Associate Director, Care Coordination (HSAG) Today s Agenda Welcome and Introduction Spotlight on Social Determinant of Health
Frequently Asked Questions (FAQ) Updated September 2007
 Updated September 2007") Frequently Asked Questions (FAQ) Updated September 2007 This document answers the most frequently asked questions posed by participating organizations since the first HSMR reports were sent. The questions
Frequently Asked Questions (FAQ) Updated September 2007 This document answers the most frequently asked questions posed by participating organizations since the first HSMR reports were sent. The questions
What should board members know about new health care reform payment structures?*
 What should board members know about new health care reform payment structures?* Passage and implementation of the Patient Protection and Affordable Care Act (ACA) has driven America s health care system
Medicare Quality Based Payment Reform (QBPR) Program Reference Guide Fiscal Years
 Program Reference Guide Fiscal Years") julian.coomes@flhosp.orgjulian.coomes@flhosp.org Medicare Quality Based Payment Reform (QBPR) Program Reference Guide Fiscal Years 2018-2020 October 2017 Table of Contents Value Based Purchasing (VBP)
julian.coomes@flhosp.orgjulian.coomes@flhosp.org Medicare Quality Based Payment Reform (QBPR) Program Reference Guide Fiscal Years 2018-2020 October 2017 Table of Contents Value Based Purchasing (VBP)
Troubleshooting Audio
 Welcome Audio for this event is available via ReadyTalk Internet streaming. No telephone line is required. Computer speakers or headphones are necessary to listen to streaming audio. Limited dial-in lines
Cigna Centers of Excellence Hospital Value Tool 2015 Methodology
 Cigna Centers of Excellence Hospital Value Tool 2015 Methodology For Hospitals Updated: February 2015 Contents Introduction... 2 Surgical Procedures and Medical Conditions... 2 Patient Outcomes Data Sources...
Minnesota Statewide Quality Reporting and Measurement System: Appendices to Minnesota Administrative Rules, Chapter 4654
 This document is made available electronically by the Minnesota Legislative Reference Library as part of an ongoing digital archiving project. http://www.leg.state.mn.us/lrl/lrl.asp Minnesota Statewide
Topics. Overview of the Medicare Recovery Audit Contractor (RAC) Understanding Medicaid Integrity Contractor
 Understanding Medicaid Integrity Contractor") RACS, ZPICS & MICS John Falcetano, CHC-F, CCEP-F, CHPC, CHRC, CIA Chief Audit and Compliance Officer University Health Systems of Eastern Carolina jfalceta@uhseast.com Topics Overview of the Medicare Recovery
RACS, ZPICS & MICS John Falcetano, CHC-F, CCEP-F, CHPC, CHRC, CIA Chief Audit and Compliance Officer University Health Systems of Eastern Carolina jfalceta@uhseast.com Topics Overview of the Medicare Recovery
Medicare P4P -- Medicare Quality Reporting, Incentive and Penalty Programs
 Medicare P4P -- Medicare Quality Reporting, Incentive and Penalty Programs Presenter: Daniel J. Hettich King & Spalding; Washington, DC dhettich@kslaw.com 1 I. Introduction Evolution of Medicare as a Purchaser
How North Carolina Compares
 How North Carolina Compares A Compendium of State Statistics January 2013 Prepared by the N.C. General Assembly Program Evaluation Division Program Evaluation Division North Carolina General Assembly Legislative
2014 Inova Fairfax Medical Campus Quality Report
 2014 Inova Fairfax Medical Campus Quality Report Overview Inova Fairfax Medical Campus is comprised of Inova Fairfax Hospital and Inova Children s Hospital. Inova Fairfax Hospital is a top-rated tertiary
Objectives. Integrating Performance Improvement with Publicly Reported Quality Metrics, Value-Based Purchasing Incentives and ISO 9001/9004
 Integrating Performance Improvement with Publicly Reported Quality Metrics, Value-Based Purchasing Incentives and ISO 9001/9004 Session: C658 2013 ANCC National Magnet Conference Thursday, October 3, 2013