Design for Nursing Home Compare 5-Star Rating System: Users Guide
|
|
|
- Agatha Townsend
- 6 years ago
- Views:
Transcription

1 Design for Nursing Home Compare 5-Star Rating System: Users Guide December 2008
2 Contents Introduction...1 Methodology...3 Survey Domain...3 Scoring Rules...3 Rating Methodology...4 Staffing Domain...5 Case Mix Adjustment...5 Scoring Rules...6 Rating Methodology...6 Quality Measure Domain...7 Scoring Rules...9 Missing Data and Imputation...9 Rating Methodology...10 Overall Nursing Home Rating (Composite Measure)...11 Appendix: NH Compare: 5-star Nursing Home Ratings Cutpoints Used in Construction of Ratings...1 Abt Associates Inc. Contents i
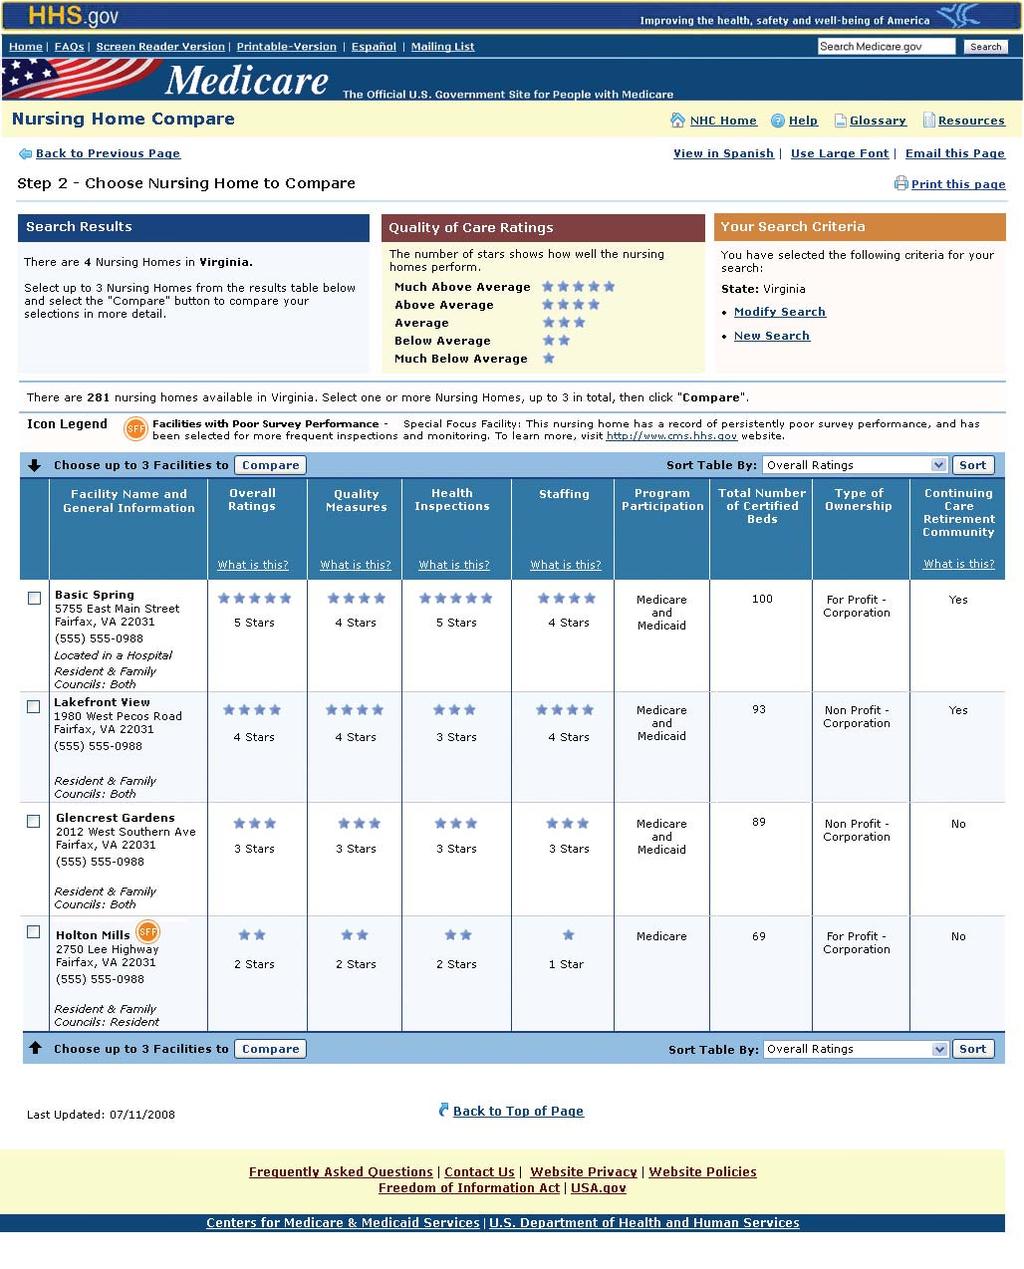
3 Introduction The Centers for Medicare & Medicaid Services (CMS) is enhancing its Nursing Home Compare public reporting site to include several star ratings for each nursing home. The primary goal in launching this rating system is to provide residents and their families with an easy way to understand assessment of nursing home quality, making meaningful distinctions between high and low performing nursing homes. The purpose of this document is to provide a comprehensive description of the design for the Nursing Home Compare Five-Star Rating System. This design was developed based on weekly discussions with the CMS Long-Term Care Task Force, input from the project s Technical Expert Panel (TEP), and extensive data analysis. The initial version of the rating system will include an overall 5-star rating that is based on facility performance on three types of performance measures, each of which will also have its own associated 5-star rating: Measures based on outcomes from state survey inspections: Facility ratings for the survey domain will be based on a count of the number of deficiencies, with deficiencies weighted by scope and severity and the number of revisits required to ensure that major deficiencies are corrected. Measures based on nursing home staffing levels: Facility ratings on the staffing domain will be based on two measures: RN hours per resident day and total staffing hours (RN, LPN, nurse aide) per resident day. Other types of nursing home staff such as clerical, administrative, or housekeeping staff are not included in these staffing numbers. These staffing measures are derived from the CMS Online Survey and Certification Reporting (OSCAR) system and will be case mix adjusted based on the distribution of MDS assessments by RUG-III group. Measures based on MDS quality measures (QMs): Facility ratings for the quality measures will be based on performance on a subset of 10 QMs that are posted on the Nursing Home Compare web site. These include 7 long-stay measures and 3 short-stay measures. In recognition of the multi-dimensional nature of nursing home quality, Nursing Home Compare will display information on facility ratings on each of these domains alongside the overall performance rating. Further, in addition to the overall staffing 5-star rating mentioned above, a 5-star rating for RN staffing will also be displayed on the new NH Compare website, when users seek more information on the staffing component. An example of the rating information included on Nursing Home Compare is shown in the figure below. Note that users of the web site will be able to drill down on each domain to get additional details on facility performance. 1
4 2
5 Methodology Survey Domain Scoring Rules Scoring rules are based on a slightly modified version of the CMS Special Focus Facility (SFF) Algorithm (Tables 1 and 2). CMS developed this algorithm for identifying nursing homes with a history of serious problems that are candidates for its SFF program. To select candidates for the SFF program, CMS references each active provider's current standard survey and two prior surveys as well as three years of complaints. Survey deficiencies: Points are assigned to individual health citations according to their scope and severity more points are assigned for more serious, widespread deficiencies, fewer points for less serious, isolated deficiencies (see Table 1). If the citation generates a finding of substandard quality of care, additional points are assigned. Note that the points associated with different scope/severity combinations have been changed slightly to increase the relative importance of D-I level deficiencies. Number of revisits required to confirm correction of deficiencies at scope and severity level F or greater: Points are assigned for the second, third, and fourth revisits (Table 2). If a provider fails to correct major deficiencies at the time of the first revisit, then these additional revisit points are assigned. There are no points for the first revisit and the points increase to 100 for the fourth revisit. We calculate a total survey score for facilities based on their deficiencies and revisits. Note that a lower survey score corresponds to fewer deficiencies and revisits and thus better performance on the survey domain. In calculating the total survey score, more recent surveys are weighted more heavily than earlier surveys. The most recent period is assigned a weighting factor of 1/2, the previous period has a weighting factor of 1/3, and the second prior survey has a weighting factor of 1/6. The weighted time period scores are then summed to create the survey score for each facility. For facilities missing data for one period, the survey score is determined based on the periods for which data are available, using the same relative weights, with the missing (third) survey weight distributed proportionately to the existing two surveys. Specifically, when there are only 2 standard health surveys, the most recent will receive 60% weight and the prior will receive 40% weight. Facilities with only one standard survey are considered not to have sufficient data to determine a survey rating and are set to missing for the survey domain. For these facilities, no composite rating will be assigned and no ratings will be reported for the staffing or QM domains even if these are available. 3
6 Table 1 Survey Deficiency Score: Weights for Different Types of Deficiencies Severity Scope Isolated Pattern Widespread Immediate jeopardy to resident health or safety J 50 points (75 points) K 100 points (125 points) L 150 points (175 points) Actual harm that is not immediate jeopardy G 20 points H 35 points (40 points) I 45 points (50 points) No actual harm with potential for more than minimal harm that is not immediate jeopardy D 4 points E 8 points F 16 points (20 points) No actual harm with potential for minimal harm A 0 point B 0 points C 0 points Note: Figures in parentheses indicate points for deficiencies that are for substandard quality of care. Shaded cells denote deficiency scope/severity levels that constitute substandard quality of care if the requirement which is not met is one that falls under the following federal regulations:42 CFR resident behavior and nursing home practices; 42 CFR quality of life; 42 CFR quality of care. Source: Centers for Medicare & Medicaid Services Table 2 CMS Special Focus Facility Algorithm: Weights for Different Types of Deficiencies Revisit Number Noncompliance Points First 0 Second 50 points Third 75 additional points Fourth 100 additional points Rating Methodology Facility ratings on the survey domain are based on the relative performance of facilities within a state. This approach helps to control for variation between state surveys and regulatory systems. Facility ratings are determined using these criteria: The top 10 percent (lowest 10 percent in terms of survey deficiency score) in each state receive a 5-star rating. The middle 70 percent of facilities receive a rating of two, three, or four stars, with an equal number (approximately percent) in each rating category. The bottom 20 percent receive a one-star rating. This distribution is based on discussions with CMS and the Project s TEP. The cut points will be reset each month so that the distribution of star ratings within states remains fixed over time. This is to reduce the likelihood that the rating process will affect the survey process. As a consequence, 4
7 however, it is possible for a facility s rating to change from month to month even without a new survey in that facility because of new surveys in other facilities that affect the statewide distribution. Note that three U.S. territories (Guam, Puerto Rico, and the Virgin Islands) have fewer than 5 facilities upon which to generate the cutpoints. For facilities in these territories, the national distribution is used. Cutpoints for the data that will be displayed when the 5-star website becomes active (based on data reported to CMS as of 11/4/2008) are shown in the Appendix (Table A1). Staffing Domain The rating for staffing is based on two case mix adjusted measures: Total nursing hours per resident day (RN, LPN, and nurse aide) RN hours per resident day The source data for the staffing measures is OSCAR. The data are subject to the same exclusion criteria as is currently used on Nursing Home Compare. These are intended to exclude facilities with unreliable OSCAR staffing data and exclude facilities with outlier staffing levels (less than 1.5 or more than 12 total nursing hours per resident day, facilities with large changes in reported staffing levels over time, and facilities that appear to report incomplete resident census information.) 1 Note that the OSCAR staffing data include both facility employees and contracted staffing agency hours. Consistent with the specifications on Nursing Home Compare, the RN measure includes hours for RN directors of nursing and nurses with administrative duties. Nurse aide hours include nurse aides in training and medication aides. Case Mix Adjustment The measures are adjusted for case mix differences based on the Resource Utilization Group (RUG- III) case-mix system. We used data from the CMS Staff Time Measurement Studies to measure the number of RN, LPN, and nurse aide minutes associated with each RUG-III group (using the 53 group version of RUG-III) 2. Case- mix adjusted measures of hours per resident day were calculated for each facility for each staff type using this formula: Hours Adjusted = (Hours Reported /Hours Expected ) * Hours National Average where Hours NationalAverage is the mean across all facilities of the reported hours per resident day for a given staff type. The expected values are based on the average case-mix across four quarters of RUG III data. 1 The resident census information in OSCAR is based on residents in certified beds and may not include residents in non-certified beds. 2 Note that we expect to use a case mix index based on the Staff Time and Resource Intensity Verification (STRIVE) study once these data are available. STRIVE is a national staff time measurement study that will provide data and analysis to update the Medicare Skilled Nursing Facility Prospective Payment System (SNF PPS). 5
8 Scoring Rules The two staffing measures are given equal weight. For each of RN staffing and total staffing, a 1 to 5 rating is assigned based on a combination of the percentile-based method (where percentiles are based on the distribution for freestanding facilities 3 ) and staffing thresholds identified in the CMS staffing study (Table 3) 4. For each facility, we assign a total staffing score that is based on the combination of the two staffing ratings (Table 4). The percentile cut points will be determined using the most recent data available at the time that the Nursing Home Compare 5-star website goes live. The cut points will be held constant for an initial two-year period after which CMS will review results. The advantage of fixed cut-points is that it better tracks facility improvement (or decline) over time. Table 3: Scoring Method and Thresholds 1 for Proposed Staffing Measures Rating Definition Range (adjusted hours per resident day) RN Total 1 <25 th percentile of distribution for freestanding facilities 2 at least 25 th percentile but less than median of the distribution for freestanding facilities 3 greater than or equal to the median but less the 75 th percentile of the distribution for freestanding facilities 4 greater than or equal to the median of the distribution for freestanding facilities but less than the CMS staffing study threshold <0.220 < at or exceeding the thresholds identified in the CMS staffing study 2 > > Except for the top cut point (to achieve a 5-star rating), the cut points shown are based on the distribution in the test data. The cutpoints that will be used at the time public reporting begins are based on data reported to CMS as of 11/4/2008, are shown in the Appendix (Table A2), and will be maintained at that fixed baseline level for two years. 2 Note that the 0.55 RN threshold was identified for potentially avoidable hospitalizations (short-stay measures); the 4.08 threshold is the sum of the NA (2.78) and licensed staff (1.30) threshold for long-stay measures. Rating Methodology Facility rating for overall staffing is based on the combination of RN and total staffing (RNs, LPNs, LVNs, CNAs) ratings as shown in Table 4. To receive a 5-star rating, facilities must meet both RN and total nursing thresholds from the CMS Staffing Study. Note that the columns 3 and 4 are identical as are rows 3 and 4. 3 Note that we use the distribution for freestanding facilities because of concerns about the reliability of staffing data for some hospital-based facilities. 4 Kramer AM, Fish R. The Relationship Between Nurse Staffing Levels and the Quality of Nursing Home Care. Chapter 2 in Appropriateness of Minimum Nurse Staffing Ratios in Nursing Homes: Phase II Final Report. Abt Associates, Inc. Winter
9 Table 4 Staffing Points and Rating RN rating and hours Total staffing rating and hours (RN, LPN and aide) <25 th pctl >25 th pctl, < median > median, <75 th pctl >75 th pctl, < 4.08 > <25 th pctl 2 >25 th pctl, < median 3 > median, <75 th pctl 4 >75 th pctl, < > 0.55 hours Quality Measure Domain Facility rating for the QM domain is based on performance on a subset of ten of the measures posted on Nursing Home Compare. The measures were selected based on their validity and reliability, the extent to which the measure is under the facility s control, statistical performance, and importance. Long-Stay Residents: Percent of residents whose need for help with daily activities has increased Percent of residents whose ability to move about in and around their room got worse Percent of high risk residents who have pressure sores Percent of residents who had a catheter inserted and left in their bladder Percent of residents who were physically restrained Percent of residents with urinary tract infection Percent of residents with moderate to severe pain Short-stay residents: Percent of residents with pressure sores Percent of residents with moderate to severe pain Percent of residents with delirium The long-stay measures are similar to those used for the Nursing Home Value-Based Purchasing (NHVBP) demonstration except that NHVBP does not include the urinary tract infection measure or pain measure. Note that the two ADL-related long-stay measures (percent of residents whose need for help with daily activities has increased, percent of residents whose ability to move about in and around their room got worse) are incidence measures that are based on change across two MDS assessments. Table 5 contains more information on these measures. 7
10 Ratings for the QM domain will be calculated using the three most recent quarters for which data are available. This time period specification was selected to increase the number of assessments available for calculating the QM rating, increasing the stability of estimates and reducing the amount of missing data. Table 5 MDS-Based Quality Measures Measure Comments Long-Stay Measures: Percent of residents whose This is a change measure that was endorsed by the National Quality Forum need for help with daily (NQF). Maintenance of ADLs is also related to an environment in which activities has increased 1 the resident is up and out of bed and engaged in activities. The CMS Staffing Study found that higher staffing levels were associated with lower rates of increasing dependence in activities of daily living. Percent of residents whose ability to move about in and around their room got worse 1 Percent of high-risk residents who have pressure sores Percent of residents who have/had a catheter inserted and left in their bladder Percent of residents who were physically restrained Percent of residents with urinary tract infection Percent of residents with moderate to severe pain Short-Stay Measures Percent of residents with pressure sores Percent of residents with moderate to severe pain Percent of residents with delirium This is a change measure that measures nursing home rules/practices related to use of mobility aides. Residents who lose mobility may also lose the ability to perform other activities of daily living, like eating, dressing, or getting to the bathroom. The QM Validation Study identified a number of nursing home care practices that were associated with lower pressure sore prevalence rates including more frequent scheduling of assessments for suspicious skin areas, observations on the environmental assessment of residents, and care practices related to how the nursing home manages clinical, psychosocial, and nutritional complications. Using a catheter may result in complications, like urinary tract or blood infections, physical injury, skin problems, bladder stones, or blood in the urine. A resident who is restrained daily can become weak, lose his or her ability to go to the bathroom by themselves, and develop pressure sores or other medical complications. Urinary tract infections can often be prevented through hygiene and drinking enough fluid. Urinary tract infections are relatively minor but can lead to more serious problems and cause complications like delirium if not treated. This measure examines whether patients are in moderate to severe pain every day over the last 7 days. Many nursing home residents have poorly controlled pain, and this pain can be managed by nursing homes through appropriate medications and other types of therapy. Poor pain management can have a significant impact on resident quality of life. Pressure sores can lead to complications such as skin and bone infections. This measure examines whether patients are in moderate to severe pain every day over the last 7 days. Many nursing home residents have poorly controlled pain, and this pain can be managed by nursing homes through appropriate medications and other types of therapy. Poor pain management can have a significant impact on resident quality of life. Delirium is not a normal part of aging and residents with delirium should receive emergency medical attention. Facility practices can help prevent delirium. 1 Indicates ADL QMs as referenced in scoring rules Sources: Based on information from the AHRQ Measures Clearinghouse and the NHVBP Draft Design Report 8
11 Scoring Rules Consistent with the specifications used for Nursing Home Compare, we will include long-stay measures if the measure can be calculated for at least 30 assessments (summed across three quarters of data to enhance stability). We will include the short-stay measures only if data are available for at least 20 assessments. For each measure, points are assigned based on the facility quintile. Based on input from the project s TEP, performance on the two ADL-related measures is weighted times as high as the other measures. This higher weighting reflects the greater importance of these measures to many nursing home residents and ensures that the two ADL measures count for 40 percent of the overall weight on the long-stay measures. Table 6 shows the points assigned for each category for the ADL QMs and for the other QMs. The points are summed across all QMs to create a total score for each facility. Note that the total possible score ranges between 0 and 136 points. Note that the percentiles are based on the national distribution for all of the QMs except for the two ADL measures, for which percentiles are set on a state-specific basis using the state distribution. For the ADL QMs, these cut points will be reset with each quarterly update of the QM data based on the state-specific distribution of these measures. For the other QMs, these cutpoints will remain fixed at the baseline national values for a period of two years. Note that the cut points are determined prior to any imputation for missing data (see discussion below). Also, the state-specific cut points for the ADL QMs are created for states/territories that have at least 5 facilities with a non-imputed value for that QM. In the rare case a state does not satisfy this criterion, we use the national distribution for that QM to set the cut points for that state. The cutpoints that will be used when public reporting begins are shown in the Appendix (Tables A4-A6). Table 6 Points received for QMs based on the QMs percentile 1 ADL QMs Other QMs <20 th percentile th - <40 th percentile th - <60 th percentile th - <80 th th percentile or greater Note that percentiles are determined on a statewide basis for ADL QMs and on a national basis for all other QMs. Missing Data and Imputation Some facilities have missing data for one or more measure, usually because of an insufficient number of residents available for calculating the QM. Missing values are imputed based on the statewide average for the measure. The imputation strategy for these missing values depends on the pattern of missing data. For facilities that have data for at least four of the seven long-stay QMs, missing values will be imputed based on the statewide average for the measure. Points are assigned as shown in 9
12 Table 6, meaning that facilities will typically receive the middle number of points (10 for the ADL measures and 6 for the other measures) for QMs for which values are imputed. Similarly, for facilities that had data on at least 2 out of 3 post-acute QMs, missing values are imputed based on the state average for the QM and points are assigned as shown in Table 6. The QM rating for facilities with data on 3 or fewer long-stay QMs is based only on the short-stay measures. Mean values for the missing long-stay QMs are not imputed. Similarly, the QM rating for facilities with data with zero or 1 short-stay QM is based only on the long-stay measures. Mean values for the missing short-stay QMs are not imputed. Based on these rules, after imputation, facilities will be in one of three categories: They will have points for all of the QMs. They will have points only for the 7 long-stay QMs (long-stay facilities). They will have points only for the 3 short-stay QMs (short-stay facilities) So that all facilities will be scored on the same 136 point scale, points are rescaled for long and shortstay facilities: If the facility has data only for the three short-stay measures (total of 36 possible points), its score is multiplied by 136/36. If the facility has data for only the seven long-stay measures (total of 100 possible points), its score is multiplied by 136/100. For states or territories with a small number of facilities, it may be impossible to impute the state average for a particular QM for which we would otherwise impute, because all the facilities in that state or territory are missing values for that QM. For example, a facility in the Virgin Islands may have information on all of its QMs except for % Long stay residents with ADL worsening. If no facility in the Virgin Islands has information on that QM then we cannot impute the state average. Instead we add up the points the facility earned for the 9 QMs it does report. Next, we divide by the total number of points (in this case, 116) it could have received for having those 9 QMs. Finally, we multiply by 136 points to calculate its adjusted number of points. Rating Methodology Once the summary QM score is computed for each facility as described above, the 5-star QM rating is assigned based on the nationwide distribution of these scores, as follow: The top 10 percent receive a 5-star rating. The middle 70 percent of facilities receive a rating of two, three, or four stars, with an equal number (23.33 percent) in each rating category. 10
13 The bottom 20 percent receive a one-star rating. The cut points associated with these star ratings will be held constant for a period of two years, allowing the distribution of the QM rating to change over time. The cut points are shown in the Appendix (Table A7). Overall Nursing Home Rating (Composite Measure) Based on the 5-star rating for the survey domain, the direct care staffing domain and the MDS quality measure domain, the overall 5-star rating is assigned in four steps as follows: Step 1: Start with the survey deficiency 5-star rating. Step 2: Add one star to the Step 1 result if staffing rating is 4 or 5 stars and greater than the deficiency rating; subtract 1 star if staffing is 1 star. The composite rating cannot be more than 5 stars or less than 1 star. Step 3: Add one star to the Step 2 result if MDS rating is 5 stars; subtract 1 star if MDS rating is 1 star. The composite rating cannot be more than 5 stars or less than 1 star. Step 4: If the rating after step 3 is 4 or 5 stars and the facility is a special focus facility that has not graduated, the overall rating is downgraded to 3 stars. The rationale for upgrading facilities in step 2 that receive either a 4- or 5-star rating for staffing is the quite stringent criteria for the staffing rating. To earn 4 stars on the staffing measure, a facility must meet or exceed the CMS staffing study thresholds for RN or total staffing; to earn 5 stars on the staffing measure, a facility must meet or exceed the CMS staffing study thresholds for both RN and total staffing. However, requiring that the staffing rating be greater than the deficiency rating in order for the score to be upgraded ensures that a facility with 4 stars on deficiencies and 4 stars on staffing (and more than 1 star on MDS) will not receive a 5-star overall rating. This method of determining the overall nursing home rating does not assign specific weights to the survey, staffing, and QM domains. The survey rating is the most important dimension in determining the overall rating, but, depending on their performance on the staffing and QM domains, a facility s overall rating may be up to two stars higher or lower than their survey rating. If the facility has no survey deficiency rating, no overall rating will be assigned. If the facility has no survey deficiency rating because it is too new to have two standard surveys, no ratings for any domain will be displayed. 11
14 Appendix: NH Compare: 5-star Nursing Home Ratings Cutpoints Used in Construction of Ratings Table A1. Star Cutpoints for Health Inspections - by State - ( ) 1 State 1/2 star (80th %-ile) 2/3 star (56.66 %-ile) 3/4 star (33.33 %-ile) 4/5 star (10th %-ile) Number of facilities *=National Cutpoints Used 2 Alaska Alabama Arkansas Arizona California Colorado Connecticut District of Columbia Delaware Florida Georgia Guam * Hawaii Iowa Idaho Illinois Indiana Kansas Kentucky Louisiana Massachusetts Maryland Maine Michigan Minnesota Missouri Mississippi Montana North Carolina North Dakota
15 Table A1. Star Cutpoints for Health Inspections - by State - ( ) 1 *=National 1/2 star 2/3 star 3/4 star 4/5 star Number of Cutpoints State (80th %-ile) (56.66 %-ile) (33.33 %-ile) (10th %-ile) facilities Used 2 Nebraska New Hampshire New Jersey New Mexico Nevada New York Ohio Oklahoma Oregon Pennsylvania Puerto Rico Rhode Island South Carolina South Dakota Tennessee Texas Utah Virginia Virgin Islands * Vermont Washington Wisconsin West Virginia Wyoming Cutpoints for Health Inspection Scores used as follows: 5 stars: < 10 th percentile; 4 stars: >10 th percentile and < rd percentile; 3 stars: >33.33 rd percentile and < th percentile; 2 stars: >56.66 th percentile and <80 th percentile; 1 star: >80 th percentile 2 Cutpoints based on national distribution are used when fewer than 5 facilities in state/territory have data available 2
16 Table A2. National Cutpoints for Staffing Measures ( ) 1 Staff type 1/2 points (25th %-ile) 2/3 points (50th %-ile) 3/4 points (75th %-ile) 4/5 points (CMS staffing study) RN Total Cutpoints for RN 5-star and Total staffing (RN,LPN, and CNA) used as follows based on case-mix adjusted hours per resident day: 5 points: > CMS staffing study threshold; 4 points: <CMS staffing study threshold and >75 th percentile; 3 points: <75 th percentile and >50 th percentile (median); 2 points: <50 th percentile and >25 th percentile; 1 point: <25 th percentile. The RN staffing 5-star is then simply assigned as 1 star per point. The overall Staffing (combined RN and total staffing) 5-star rating is constructed as shown in Table A3. Table A3. Assignment of Staffing 5-star Rating Based on RN and Total Staffing Ratings RN rating and hours Total staffing rating and hours (RN, LPN and aide) <25 th percentile >25 th percentile and < median > median and <75 th percentile >75 th percentile and < CMS staffing study threshold > CMS staffing study threshold 1 <25 th percentile >25 th percentile & <median > median & <75 th percentile >75 th percentile & <CMS staffing study threshold > CMS staffing study threshold 3
17 Table A4. National Quintile Cutpoints for Non-ADL QMs ( ) 1 Quality Measure 20th %-ile 40th %-ile 60th %-ile 80th %-ile LS: Moderate to Severe Pain LS: High Risk Pressure Ulcers LS: Indwelling Catheter LS: Urinary Tract Infections LS: Restraints PA: Delirium PA: Moderate to Severe Pain PA: Pressure Ulcers LS = Long-stay; PA = Post-acute 1 Quintiles for these cutpoints used to assign points towards the summary score as follows: 12 points: <20 th percentile; 9 points: >20 th percentile and <40 th percentile; 6 points: >40 th percentile and <60 th percentile; 3 points: >60 th percentile and <80 th percentile; 0 points: >80 th percentile. 4
18 Table A5. Quintile Cutpoints for ADL QM Late Loss ADL Worsening ( ) State 20th %-ile 40th %-ile 60th %-ile 80th %-ile Number of facilities *=National Cutpoints Used Alaska Alabama Arkansas Arizona California Colorado Connecticut District of Columbia Delaware Florida Georgia Guam * Hawaii Iowa Idaho Illinois Indiana Kansas Kentucky Louisiana Massachusetts Maryland Maine Michigan Minnesota Missouri Mississippi Montana North Carolina North Dakota Nebraska New Hampshire
19 Table A5. Quintile Cutpoints for ADL QM Late Loss ADL Worsening ( ) State 20th %-ile 40th %-ile 60th %-ile 80th %-ile Number of facilities *=National Cutpoints Used New Jersey New Mexico Nevada New York Ohio Oklahoma Oregon Pennsylvania Puerto Rico * Rhode Island South Carolina South Dakota Tennessee Texas Utah Virginia Virgin Islands * Vermont Washington Wisconsin West Virginia Wyoming LS = Long-stay 1 Quintiles for these cutpoints used to assign points towards the summary score as follows: 20 points: <20 th percentile; 15 points: >20 th percentile and <40 th percentile; 10 points: >40 th percentile and <60 th percentile; 5 points: >60 th percentile and <80 th percentile; 0 points: >80 th percentile. 6
20 Table A6. Quintile Cutpoints for ADL QM Worsening Locomotion ( ) State 20th %-ile 40th %-ile 60th %-ile 80th %-ile Number of facilities *=National Cutpoints Used Alaska Alabama Arkansas Arizona California Colorado Connecticut District of Columbia Delaware Florida Georgia Guam * Hawaii Iowa Idaho Illinois Indiana Kansas Kentucky Louisiana Massachusetts Maryland Maine Michigan Minnesota Missouri Mississippi Montana North Carolina North Dakota Nebraska New Hampshire
21 Table A6. Quintile Cutpoints for ADL QM Worsening Locomotion ( ) State 20th %-ile 40th %-ile 60th %-ile 80th %-ile Number of facilities *=National Cutpoints Used New Jersey New Mexico Nevada New York Ohio Oklahoma Oregon Pennsylvania Puerto Rico * Rhode Island South Carolina South Dakota Tennessee Texas Utah Virginia Virgin Islands * Vermont Washington Wisconsin West Virginia Wyoming LS = Long-stay 1 Quintiles for these cutpoints used to assign points towards the summary score as follows: 20 points: <20 th percentile; 15 points: >20 th percentile and <40 th percentile; 10 points: >40 th percentile and <60 th percentile; 5 points: >60 th percentile and <80 th percentile; 0 points: >80 th percentile. 8
22 Table A7. Star Cutpoints for MDS Quality Measure Summary Score ( ) 1/2 star 2/3 star 3/4 star 4/5 star 20 th percentile rd percentile th percentile (90 th percentile) Cutpoints for MDS Quality Measure Scores (which have a point range) used as follows: 5 stars: > 90 th percentile; 4 stars: <90 th percentile and > th percentile; 3 stars: <66.67 th percentile and > rd percentile; 2 stars: <43.33 rd percentile and >20 th percentile; 1 star: <20 th percentile 9
Design for Nursing Home Compare Five-Star Quality Rating System: Technical Users Guide
 Design for Nursing Home Compare Five-Star Quality Rating System: Technical Users Guide July 2016 Note: In July 2016, the Centers for Medicare & Medicaid Services (CMS) is making several changes to the
Design for Nursing Home Compare Five-Star Quality Rating System: Technical Users Guide
 Design for Nursing Home Compare Five-Star Quality Rating System: Technical Users Guide April 2018 April 2018 Revisions Beginning with the April 2018 update of the Nursing Home Compare website and the Five-Star
 3+ 3+ N = 155, 442 3+ R 2 =.32 < < < 3+ N = 149, 685 3+ R 2 =.27 < < < 3+ N = 99, 752 3+ R 2 =.4 < < < 3+ N = 98, 887 3+ R 2 =.6 < < < 3+ N = 52, 624 3+ R 2 =.28 < < < 3+ N = 36, 281 3+ R 2 =.5 < < < 7+
Design for Nursing Home Compare Five-Star Quality Rating System: Technical Users Guide
 Design for Nursing Home Compare Five-Star Quality Rating System: Technical Users Guide February 2018 Note: On November 28, 2017 the Centers for Medicare and Medicaid Services (CMS) instituted a new Health
TABLE 3c: Congressional Districts with Number and Percent of Hispanics* Living in Hard-to-Count (HTC) Census Tracts**
 Census Tracts**") living Alaska 00 47,808 21,213 44.4 Alabama 01 20,661 3,288 15.9 Alabama 02 23,949 6,614 27.6 Alabama 03 20,225 3,247 16.1 Alabama 04 41,412 7,933 19.2 Alabama 05 34,388 11,863 34.5 Alabama 06 34,849 4,074
living Alaska 00 47,808 21,213 44.4 Alabama 01 20,661 3,288 15.9 Alabama 02 23,949 6,614 27.6 Alabama 03 20,225 3,247 16.1 Alabama 04 41,412 7,933 19.2 Alabama 05 34,388 11,863 34.5 Alabama 06 34,849 4,074
TABLE 3b: Congressional Districts Ranked by Percent of Hispanics* Living in Hard-to- Count (HTC) Census Tracts**
 Census Tracts**") Rank State District Count (HTC) 1 New York 05 150,499 141,567 94.1 2 New York 08 133,453 109,629 82.1 3 Massachusetts 07 158,518 120,827 76.2 4 Michigan 13 47,921 36,145 75.4 5 Illinois 04 508,677 379,527
Rank State District Count (HTC) 1 New York 05 150,499 141,567 94.1 2 New York 08 133,453 109,629 82.1 3 Massachusetts 07 158,518 120,827 76.2 4 Michigan 13 47,921 36,145 75.4 5 Illinois 04 508,677 379,527
Design for Nursing Home Compare Five-Star Quality Rating System: Technical Users Guide. February 2015
 Design for Nursing Home Compare Five-Star Quality Rating System: Technical Users Guide February 2015 Introduction In December 2008, The Centers for Medicare & Medicaid Services (CMS) enhanced its Nursing
Unemployment Rate (%) Rank State. Unemployment
 Rank State. Unemployment") States Ranked by February 2018 Unemployment Rate Seasonally Adjusted Unemployment Unemployment Unemployment 1 Hawaii 2.1 19 Alabama 3.7 33 Ohio 4.5 2 New Hampshire 2.6 19 Missouri 3.7 33 Rhode Island 4.5
States Ranked by February 2018 Unemployment Rate Seasonally Adjusted Unemployment Unemployment Unemployment 1 Hawaii 2.1 19 Alabama 3.7 33 Ohio 4.5 2 New Hampshire 2.6 19 Missouri 3.7 33 Rhode Island 4.5
Unemployment Rate (%) Rank State. Unemployment
 Rank State. Unemployment") States Ranked by November 2015 Unemployment Rate Seasonally Adjusted Unemployment Unemployment Unemployment 1 North Dakota 2.7 19 Indiana 4.4 37 Georgia 5.6 2 Nebraska 2.9 20 Ohio 4.5 37 Tennessee 5.6
States Ranked by November 2015 Unemployment Rate Seasonally Adjusted Unemployment Unemployment Unemployment 1 North Dakota 2.7 19 Indiana 4.4 37 Georgia 5.6 2 Nebraska 2.9 20 Ohio 4.5 37 Tennessee 5.6
Unemployment Rate (%) Rank State. Unemployment
 Rank State. Unemployment") States Ranked by April 2017 Unemployment Rate Seasonally Adjusted Unemployment Unemployment Unemployment 1 Colorado 2.3 17 Virginia 3.8 37 California 4.8 2 Hawaii 2.7 20 Massachusetts 3.9 37 West Virginia
States Ranked by April 2017 Unemployment Rate Seasonally Adjusted Unemployment Unemployment Unemployment 1 Colorado 2.3 17 Virginia 3.8 37 California 4.8 2 Hawaii 2.7 20 Massachusetts 3.9 37 West Virginia
Unemployment Rate (%) Rank State. Unemployment
 Rank State. Unemployment") States Ranked by August 2017 Unemployment Rate Seasonally Adjusted Unemployment Unemployment Unemployment 1 North Dakota 2.3 18 Maryland 3.9 36 New York 4.8 2 Colorado 2.4 18 Michigan 3.9 38 Delaware 4.9
States Ranked by August 2017 Unemployment Rate Seasonally Adjusted Unemployment Unemployment Unemployment 1 North Dakota 2.3 18 Maryland 3.9 36 New York 4.8 2 Colorado 2.4 18 Michigan 3.9 38 Delaware 4.9
Unemployment Rate (%) Rank State. Unemployment
 Rank State. Unemployment") States Ranked by March 2016 Unemployment Rate Seasonally Adjusted Unemployment Unemployment Unemployment 1 South Dakota 2.5 19 Delaware 4.4 37 Georgia 5.5 2 New Hampshire 2.6 19 Massachusetts 4.4 37 North
States Ranked by March 2016 Unemployment Rate Seasonally Adjusted Unemployment Unemployment Unemployment 1 South Dakota 2.5 19 Delaware 4.4 37 Georgia 5.5 2 New Hampshire 2.6 19 Massachusetts 4.4 37 North
Unemployment Rate (%) Rank State. Unemployment
 Rank State. Unemployment") States Ranked by September 2017 Unemployment Rate Seasonally Adjusted Unemployment Unemployment Unemployment 1 North Dakota 2.4 17 Indiana 3.8 36 New Jersey 4.7 2 Colorado 2.5 17 Kansas 3.8 38 Pennsylvania
States Ranked by September 2017 Unemployment Rate Seasonally Adjusted Unemployment Unemployment Unemployment 1 North Dakota 2.4 17 Indiana 3.8 36 New Jersey 4.7 2 Colorado 2.5 17 Kansas 3.8 38 Pennsylvania
Unemployment Rate (%) Rank State. Unemployment
 Rank State. Unemployment") States Ranked by December 2017 Unemployment Rate Seasonally Adjusted Unemployment Unemployment Unemployment 1 Hawaii 2.0 16 South Dakota 3.5 37 Connecticut 4.6 2 New Hampshire 2.6 20 Arkansas 3.7 37 Delaware
States Ranked by December 2017 Unemployment Rate Seasonally Adjusted Unemployment Unemployment Unemployment 1 Hawaii 2.0 16 South Dakota 3.5 37 Connecticut 4.6 2 New Hampshire 2.6 20 Arkansas 3.7 37 Delaware
Unemployment Rate (%) Rank State. Unemployment
 Rank State. Unemployment") States Ranked by September 2015 Unemployment Rate Seasonally Adjusted Unemployment Unemployment Unemployment 1 North Dakota 2.8 17 Oklahoma 4.4 37 South Carolina 5.7 2 Nebraska 2.9 20 Indiana 4.5 37 Tennessee
States Ranked by September 2015 Unemployment Rate Seasonally Adjusted Unemployment Unemployment Unemployment 1 North Dakota 2.8 17 Oklahoma 4.4 37 South Carolina 5.7 2 Nebraska 2.9 20 Indiana 4.5 37 Tennessee
Unemployment Rate (%) Rank State. Unemployment
 Rank State. Unemployment") States Ranked by November 2014 Unemployment Rate Seasonally Adjusted Unemployment Unemployment Unemployment 1 North Dakota 2.7 19 Pennsylvania 5.1 35 New Mexico 6.4 2 Nebraska 3.1 20 Wisconsin 5.2 38 Connecticut
States Ranked by November 2014 Unemployment Rate Seasonally Adjusted Unemployment Unemployment Unemployment 1 North Dakota 2.7 19 Pennsylvania 5.1 35 New Mexico 6.4 2 Nebraska 3.1 20 Wisconsin 5.2 38 Connecticut
Unemployment Rate (%) Rank State. Unemployment
 Rank State. Unemployment") States Ranked by July 2018 Unemployment Rate Seasonally Adjusted Unemployment Unemployment Unemployment 1 Hawaii 2.1 19 Massachusetts 3.6 37 Kentucky 4.3 2 Iowa 2.6 19 South Carolina 3.6 37 Maryland 4.3
States Ranked by July 2018 Unemployment Rate Seasonally Adjusted Unemployment Unemployment Unemployment 1 Hawaii 2.1 19 Massachusetts 3.6 37 Kentucky 4.3 2 Iowa 2.6 19 South Carolina 3.6 37 Maryland 4.3
Interstate Pay Differential
 Interstate Pay Differential APPENDIX IV Adjustments for differences in interstate pay in various locations are computed using the state average weekly pay. This appendix provides a table for the second
The American Legion NATIONAL MEMBERSHIP RECORD
 The American Legion NATIONAL MEMBERSHIP RECORD www.legion.org 2016 The American Legion NATIONAL MEMBERSHIP RECORD 1920-1929 Department 1920 1921 1922 1923 1924 1925 1926 1927 1928 1929 Alabama 4,474 3,246
Design for Nursing Home Compare Five-Star Quality Rating System: Technical Users Guide
 Design for Nursing Home Compare Five-Star Quality Rating System: Technical Users Guide July 2012 Introduction In December 2008, The Centers for Medicare & Medicaid Services (CMS) enhanced its Nursing Home
Current Medicare Advantage Enrollment Penetration: State and County-Level Tabulations
 Current Advantage Enrollment : State and County-Level Tabulations 5 Slide Series, Volume 40 September 2016 Summary of Tabulations and Findings As of September 2016, 17.9 million of the nation s 56.1 million
2016 INCOME EARNED BY STATE INFORMATION
 BY STATE INFORMATION This information is being provided to assist in your 2016 tax preparations. The information is also mailed to applicable Columbia fund non-corporate shareholders with their year-end
HOME HEALTH AIDE TRAINING REQUIREMENTS, DECEMBER 2016
 BACKGROUND HOME HEALTH AIDE TRAINING REQUIREMENTS, DECEMBER 2016 Federal legislation (42 CFR 484.36) requires that Medicare-certified home health agencies employ home health aides who are trained and evaluated
SEP Memorandum Report: "Trends in Nursing Home Deficiencies and Complaints," OEI
 DEPARTMENT OF HEALTH &. HUMAN SERVICES Office of Inspector General SEP 18 2008 Washington, D.C. 20201 TO: FROM: Kerry Weems Acting Administrator Centers for Medicare & Medicaid Services Daniel R. Levinson~
Index of religiosity, by state
 Index of religiosity, by state Low Medium High Total United States 19 26 55=100 Alabama 7 16 77 Alaska 28 27 45 Arizona 21 26 53 Arkansas 12 19 70 California 24 27 49 Colorado 24 29 47 Connecticut 25 32
Reading the Stars: Nursing Home Quality Star Ratings, Nationally and by State
 Reading the Stars: Nursing Home Quality Star Ratings, Nationally and by State Cristina Boccuti, Giselle Casillas, Tricia Neuman About 1.3 million people receive care each day in over 15,500 nursing homes
Introduction. Current Law Distribution of Funds. MEMORANDUM May 8, Subject:
 MEMORANDUM May 8, 2018 Subject: TANF Family Assistance Grant Allocations Under the Ways and Means Committee (Majority) Proposal From: Gene Falk, Specialist in Social Policy, gfalk@crs.loc.gov, 7-7344 Jameson
MAP 1: Seriously Delinquent Rate by State for Q3, 2008
 MAP 1: Seriously Delinquent Rate by State for Q3, 2008 Seriously Delinquent Rate Greater than 6.93% 5.18% 6.93% 0 5.17% Source: MBA s National Deliquency Survey MAP 2: Foreclosure Inventory Rate by State
2015 State Hospice Report 2013 Medicare Information 1/1/15
 2015 State Hospice Report 2013 Medicare Information 1/1/15 www.hospiceanalytics.com 2 2013 Demographics & Hospice Utilization National Population 316,022,508 Total Deaths 2,529,792 Medicare Beneficiaries
Rankings of the States 2017 and Estimates of School Statistics 2018
 Rankings of the States 2017 and Estimates of School Statistics 2018 NEA RESEARCH April 2018 Reproduction: No part of this report may be reproduced in any form without permission from NEA Research, except
5 x 7 Notecards $1.50 with Envelopes - MOQ - 12
 5 x 7 Notecards $1.50 with Envelopes - MOQ - 12 Magnets 2½ 3½ Magnet $1.75 - MOQ - 5 - Add $0.25 for packaging Die Cut Acrylic Magnet $2.00 - MOQ - 24 - Add $0.25 for packaging 2535-22225 California AM-22225
Table 6 Medicaid Eligibility Systems for Children, Pregnant Women, Parents, and Expansion Adults, January Share of Determinations
 Table 6 Medicaid Eligibility Systems for Children, Pregnant Women, Parents, and Expansion Adults, January 2017 Able to Make Share of Determinations System determines eligibility for: 2 State Real-Time
Voter Registration and Absentee Ballot Deadlines by State 2018 General Election: Tuesday, November 6. Saturday, Oct 27 (postal ballot)
") Voter Registration and Absentee Ballot Deadlines by State 2018 General Election: All dates in 2018 unless otherwise noted STATE REG DEADLINE ABSENTEE BALLOT REQUEST DEADLINE Alabama November 1 ABSENTEE
Voter Registration and Absentee Ballot Deadlines by State 2018 General Election: All dates in 2018 unless otherwise noted STATE REG DEADLINE ABSENTEE BALLOT REQUEST DEADLINE Alabama November 1 ABSENTEE
PRESS RELEASE Media Contact: Joseph Stefko, Director of Public Finance, ;
 PRESS RELEASE Media Contact: Joseph Stefko, Director of Public Finance, 585.327.7075; jstefko@cgr.org Highest Paid State Workers in New Jersey & New York in 2010; Lowest Paid in Dakotas and West Virginia
Estimated Economic Impacts of the Small Business Jobs and Tax Relief Act National Report
 Regional Economic Models, Inc. Estimated Economic Impacts of the Small Business Jobs and Tax Relief Act National Report Prepared by Frederick Treyz, CEO June 2012 The following is a summary of the Estimated
FY 2014 Per Capita Federal Spending on Major Grant Programs Curtis Smith, Nick Jacobs, and Trinity Tomsic
 Special Analysis 15-03, June 18, 2015 FY 2014 Per Capita Federal Spending on Major Grant Programs Curtis Smith, Nick Jacobs, and Trinity Tomsic 202-624-8577 ttomsic@ffis.org Summary Per capita federal
Sentinel Event Data. General Information Copyright, The Joint Commission
 Sentinel Event Data General Information 1995 2015 Data Limitations The reporting of most sentinel events to The Joint Commission is voluntary and represents only a small proportion of actual events. Therefore,
States Ranked by Annual Nonagricultural Employment Change October 2017, Seasonally Adjusted
 States Ranked by Annual Nonagricultural Employment Change Change (Jobs) Change (Jobs) Change (Jobs) 1 Texas 316,100 19 Nevada 36,600 37 Hawaii 7,100 2 California 256,800 20 Tennessee 34,800 38 Mississippi
Rutgers Revenue Sources
 Rutgers Revenue Sources 31.2% Tuition and Fees 27.3% State Appropriations with Fringes 1.0% Endowment and Investments.5% Federal Appropriations 17.8% Federal, State, and Municipal Grants and Contracts
Sentinel Event Data. General Information Q Copyright, The Joint Commission
 Sentinel Event Data General Information 1995 2Q 2014 Data Limitations The reporting of most sentinel events to The Joint Commission is voluntary and represents only a small proportion of actual events.
STATE ENTREPRENEURSHIP INDEX
 University of Nebraska - Lincoln DigitalCommons@University of Nebraska - Lincoln Business in Nebraska Bureau of Business Research 12-2013 STATE ENTREPRENEURSHIP INDEX Eric Thompson University of Nebraska-Lincoln,
Child & Adult Care Food Program: Participation Trends 2017
 Child & Adult Care Food Program: Participation Trends 2017 February 2018 About FRAC The Food Research and Action Center (FRAC) is the leading national organization working for more effective public and
Center for Medicaid, CHIP, and Survey & Certification/Survey & Certification Group. Memorandum Summary
 DEPARTMENT OF HEALTH & HUMAN SERVICES Centers for Medicare & Medicaid Services 7500 Security Boulevard, Mail Stop S2-12-25 Baltimore, Maryland 21244-1850 Center for Medicaid, CHIP, and Survey & Certification/Survey
Disclaimer. Learning Objectives
 Data Analysis in Today s Skilled Nursing Facilities: How Data is Driving Reimbursement and 5-Star Ratings Presented by: Reinsel Kuntz Lesher Senior Living Services Consulting 0 Disclaimer The information
Critical Access Hospitals and HCAHPS
 Critical Access Hospitals and HCAHPS Michelle Casey, MS Senior Research Fellow and Deputy Director University of Minnesota Rural Health Research Center June 12, 2012 Overview of Presentation Why is HCAHPS
Nielsen ICD-9. Healthcare Data
 Nielsen ICD-9 Healthcare Data Healthcare Utilization Model The Nielsen healthcare utilization model has three primary components: demographic cohort population counts, cohort-specific healthcare utilization
Benefits by Service: Outpatient Hospital Services (October 2006)
") Page 1 of 8 Benefits by Service: Outpatient Hospital Services (October 2006) Definition/Notes Note: Totals include 50 states and D.C. "Benefits Covered" Totals "Benefits Not Covered" Totals Is the benefit
Page 1 of 8 Benefits by Service: Outpatient Hospital Services (October 2006) Definition/Notes Note: Totals include 50 states and D.C. "Benefits Covered" Totals "Benefits Not Covered" Totals Is the benefit
STATE INDUSTRY ASSOCIATIONS $ - LISTED NEXT PAGE. TOTAL $ 88,000 * for each contribution of $500 for Board Meeting sponsorship
 Exhibit D -- TRIP 2017 FUNDING SOURCES -- February 3, 2017 CORPORATE $ 12,000 Construction Companies $ 5,500 Consulting Engineers Equipment Distributors Manufacturer/Supplier/Producer 6,500 Surety Bond
YOUTH MENTAL HEALTH IS WORSENING AND ACCESS TO CARE IS LIMITED THERE IS A SHORTAGE OF PROVIDERS HEALTHCARE REFORM IS HELPING
 2 3 4 MENTAL HEALTH AND SUBSTANCE USE CONDITIONS ARE COMMON MOST AMERICANS LACK ACCESS TO CARE OF AMERICAN ADULTS WITH A MENTAL ILLNESS DID NOT RECEIVE TREATMENT ONE IN FIVE REPORT AN UNMET NEED NEARLY
Statutory change to name availability standard. Jurisdiction. Date: April 8, [Statutory change to name availability standard] [April 8, 2015]
![Statutory change to name availability standard. Jurisdiction. Date: April 8, [Statutory change to name availability standard] [April 8, 2015]](/thumbs/83/87461560.jpg "Statutory change to name availability standard. Jurisdiction. Date: April 8, [Statutory change to name availability standard] [April 8, 2015]") Topic: Question by: : Statutory change to name availability standard Michael Powell Texas Date: April 8, 2015 Manitoba Corporations Canada Alabama Alaska Arizona Arkansas California Colorado Connecticut
Topic: Question by: : Statutory change to name availability standard Michael Powell Texas Date: April 8, 2015 Manitoba Corporations Canada Alabama Alaska Arizona Arkansas California Colorado Connecticut
NURSING HOME STATISTICAL YEARBOOK, 2015
 NURSING HOME STATISTICAL YEARBOOK, 2015 C. MCKEEN COWLES COWLES RESEARCH GROUP Acknowledgments We extend our appreciation to Craig Dickstein of Tamarack Professional Services, LLC for optimizing the SAS
Department of Defense INSTRUCTION
 Department of Defense INSTRUCTION NUMBER 4715.02 August 28, 2009 Incorporating Change 2, August 31, 2018 USD(A&S) SUBJECT: Regional Environmental Coordination References: (a) DoD Instruction 4715.2, DoD
 Page 1 of 11 NOAA Technical Memorandum NWS SR-193, Section 4 Section 4 Table of Contents: 4. Variations by State Weighted by Population A. Death and Injury (Casualty) Rate per Population B. Death Rate
Improving Nursing Home Compare for Consumers. Five-Star Quality Rating System
 Improving Nursing Home Compare for Consumers Five-Star Quality Rating System Improving Nursing Home Compare Major Revision to Nursing Home Compare Mid-December Improved Navigation - Similar to Hospital
HOPE NOW State Loss Mitigation Data December 2016
 HOPE NOW State Loss Mitigation Data December 2016 Table of Contents Page Definitions 2 Data Overview 3 Table 1 - Delinquencies 4 Table 2 - Foreclosure Starts 7 Table 3 - Foreclosure Sales 8 Table 4 - Repayment
HOPE NOW State Loss Mitigation Data September 2014
 HOPE NOW State Loss Mitigation Data September 2014 Table of Contents Page Definitions 2 Data Overview 3 Table 1 - Delinquencies 4 Table 2 - Foreclosure Starts 7 Table 3 - Foreclosure Sales 8 Table 4 -
2014 ACEP URGENT CARE POLL RESULTS
 2014 ACEP URGENT CARE POLL RESULTS PREPARED FOR: PREPARED BY: 2014 Marketing General Incorporated 625 North Washington Street, Suite 450 Alexandria, VA 22314 800.644.6646 toll free 703.739.1000 telephone
Understanding the Five Star Quality Rating System Design For Nursing Home Compare
 Understanding the Five Star Quality Rating System Design For Nursing Home Compare Nathan Shaw RN, BSN, MBA, LHRM, RAC CT 3.0 Director of Clinical Reimbursement March 23rd, 2015 Objectives Objectives Provide
Table 8 Online and Telephone Medicaid Applications for Children, Pregnant Women, Parents, and Expansion Adults, January 2017
 Table 8 Online and Telephone Medicaid Applications for Children, Pregnant Women, Parents, and Expansion Adults, January 2017 State Applications Can be Submitted Online at the State Level 1 < 25% 25% -
 Page 1 of 7 Medicaid Benefits Services Covered, Limits, Copayments and Reimbursement Methodologies For 50 States, District of Columbia and the Territories (as of January 2003) CHOOSE SERVICE Go CHOOSE
Child & Adult Care Food Program: Participation Trends 2016
 Child & Adult Care Food Program: Participation Trends 2016 March 2017 About FRAC The Food Research and Action Center (FRAC) is the leading national organization working for more effective public and private
Table 1 Elementary and Secondary Education. (in millions)
") Revised February 22, 2005 WHERE WOULD THE CUTS BE MADE UNDER THE PRESIDENT S BUDGET? Data Table 1 Elementary and Secondary Education Includes Education for the Disadvantaged, Impact Aid, School Improvement
Revised February 22, 2005 WHERE WOULD THE CUTS BE MADE UNDER THE PRESIDENT S BUDGET? Data Table 1 Elementary and Secondary Education Includes Education for the Disadvantaged, Impact Aid, School Improvement
NMLS Mortgage Industry Report 2016 Q1 Update
 NMLS Mortgage Industry Report 2016 Q1 Update Released June 10, 2016 Conference of State Bank Supervisors 1129 20 th Street, NW, 9 th Floor Washington, D.C. 20036-4307 NMLS Mortgage Industry Report: 2016Q1
Percentage of Enrolled Students by Program Type, 2016
 Percentage of Enrolled Students by Program Type, 2016 Doctorate 4% PN/VN 3% MSN 15% ADN 28% BSRN 22% Diploma 2% BSN 26% n = 279,770 Percentage of Graduations by Program Type, 2016 MSN 12% Doctorate 1%
Child & Adult Care Food Program: Participation Trends 2014
 Child & Adult Care Food Program: Participation Trends 2014 1200 18th St NW Suite 400 Washington, DC 20036 (202) 986-2200 / www.frac.org February 2016 About FRAC The Food Research and Action Center (FRAC)
Interstate Turbine Advisory Council (CESA-ITAC)
") Interstate Turbine Advisory Council (CESA-ITAC) Mark Mayhew NYSERDA for Val Stori Clean Energy States Alliance SWAT 4/25/12 Today CESA ITAC, LLC - What, who and why The Unified List - What, why, how and
Interstate Turbine Advisory Council (CESA-ITAC) Mark Mayhew NYSERDA for Val Stori Clean Energy States Alliance SWAT 4/25/12 Today CESA ITAC, LLC - What, who and why The Unified List - What, why, how and
NMLS Mortgage Industry Report 2017Q2 Update
 NMLS Mortgage Industry Report 2017Q2 Update Released September 18, 2017 Conference of State Bank Supervisors 1129 20 th Street, NW, 9 th Floor Washington, D.C. 20036-4307 NMLS Mortgage Industry Report:
NMLS Mortgage Industry Report 2018Q1 Update
 NMLS Mortgage Industry Report 2018Q1 Update Released July 5, 2018 Conference of State Bank Supervisors 1129 20 th Street, NW, 9 th Floor Washington, D.C. 20036-4307 NMLS Mortgage Industry Report: 2018Q1
NMLS Mortgage Industry Report 2017Q4 Update
 NMLS Mortgage Industry Report 2017Q4 Update Released March 9, 2018 Conference of State Bank Supervisors 1129 20 th Street, NW, 9 th Floor Washington, D.C. 20036-4307 NMLS Mortgage Industry Report: 2017Q4
Is this consistent with other jurisdictions or do you allow some mechanism to reinstate?
 Topic: Question by: : Forfeiture for failure to appoint a resident agent Kathy M. Sachs Kansas Date: January 8, 2015 Manitoba Corporations Canada Alabama Alaska Arizona Arkansas California Colorado Connecticut
TENNESSEE TEXAS UTAH VERMONT VIRGINIA WASHINGTON WEST VIRGINIA WISCONSIN WYOMING ALABAMA ALASKA ARIZONA ARKANSAS
 ALABAMA ALASKA ARIZONA ARKANSAS CALIFORNIA COLORADO CONNECTICUT DELAWARE DISTRICT OF COLUMBIA FLORIDA GEORGIA GUAM MISSOURI MONTANA NEBRASKA NEVADA NEW HAMPSHIRE NEW JERSEY NEW MEXICO NEW YORK NORTH CAROLINA
Senior American Access to Care Grant
 Senior American Access to Care Grant Grant Guidelines SENIOR AMERICAN (age 62 plus) ACCESS TO CARE GRANT GUIDELINES: The (ADAF) is committed to supporting U.S. based organizations exempt from taxation
National Collegiate Soils Contest Rules
 National Collegiate Soils Contest Rules Students of Agronomy, Soils, and Environmental Sciences (SASES) Revised September 30, 2008 I. NAME The contest shall be known as the National Collegiate Soils Contest
REGIONAL AND STATE EMPLOYMENT AND UNEMPLOYMENT MAY 2013
 For release 10:00 a.m. (EDT) Friday, June 21, USDL-13-1180 Technical information: Employment: Unemployment: Media contact: (202) 691-6559 sminfo@bls.gov www.bls.gov/sae (202) 691-6392 lausinfo@bls.gov
How North Carolina Compares
 How North Carolina Compares A Compendium of State Statistics March 2017 Prepared by the N.C. General Assembly Program Evaluation Division Preface The Program Evaluation Division of the North Carolina General
Supplemental Nutrition Assistance Program. STATE ACTIVITY REPORT Fiscal Year 2016
 Supplemental Nutrition Assistance Program ACTIVITY REPORT Fiscal Year 2016 Food and Nutrition Service Supplemental Nutrition Assistance Program Program Accountability and Administration Division September
State Authority for Hazardous Materials Transportation
 Appendixes Appendix A State Authority for Hazardous Materials Transportation Hazardous Materials Transportation: Regulatory, Enforcement, and Emergency Response* Alabama E Public Service Commission ER
How North Carolina Compares
 How North Carolina Compares A Compendium of State Statistics January 2013 Prepared by the N.C. General Assembly Program Evaluation Division Program Evaluation Division North Carolina General Assembly Legislative
 Page 1 of 5 Health Reform Medicaid/CHIP Medicare Costs/Insurance Uninsured/Coverage State Policy Prescription Drugs HIV/AIDS Medicaid Benefits Services Covered, Limits, Copayments and Reimbursement Methodologies
FORTIETH TRIENNIAL ASSEMBLY
 FORTIETH TRIENNIAL ASSEMBLY MOST PUISSANT GENERAL GRAND MASTER GENERAL GRAND COUNCIL OF CRYPTIC MASONS INTERNATIONAL 1996-1999 -
national assembly of state arts agencies
 STATE ARTS AGENCY GRANT MAKING AND FUNDING Each of America's 50 states and six jurisdictions has a government that works to make the cultural, civic, economic and educational benefits of the available
Session Objectives. Long Term Care Luncheon: The CMS Five-Star Quality Rating System. Quality Ratings of U.S. Nursing Homes on Nursing Home Compare
 April 12, 2018 Long Term Care Luncheon: The CMS Five-Star Quality Rating System Quality Ratings of U.S. Nursing Homes on Nursing Home Compare Jennifer Pettis, MS, RN, WCC Nurse Researcher / Associate Abt
Weekly Market Demand Index (MDI)
") VOL. 8 NO. 28 JULY 13, 2015 LOAD AVAILABILITY Up 7% compared to the Weekly Market Demand Index (MDI) Note: MDI Measures Relative Truck Demand LOAD SEARCHING Up 18.3% compared to the TRUCK AVAILABILITY
VOL. 8 NO. 28 JULY 13, 2015 LOAD AVAILABILITY Up 7% compared to the Weekly Market Demand Index (MDI) Note: MDI Measures Relative Truck Demand LOAD SEARCHING Up 18.3% compared to the TRUCK AVAILABILITY
Benefits by Service: Inpatient Hospital Services, other than in an Institution for Mental Diseases (October 2006) Definition/Notes
 Definition/Notes") Page 1 of 9 Benefits by Service: Inpatient Hospital Services, other than in an Institution for Mental Diseases (October 2006) Definition/Notes Note: Totals include 50 states and D.C. "Benefits Covered"
Page 1 of 9 Benefits by Service: Inpatient Hospital Services, other than in an Institution for Mental Diseases (October 2006) Definition/Notes Note: Totals include 50 states and D.C. "Benefits Covered"
NAFCC Accreditation Annual Update
 NAFCC Accreditation Annual Update 1st year 2nd year First MI Last Co-provider (if applicable) Address on License, Registration or Certificate Phone Fax Mailing Address Email City State Zip County Country
Date: 5/25/2012. To: Chuck Wyatt, DCR, Virginia. From: Christos Siderelis
 1 Date: 5/25/2012 To: Chuck Wyatt, DCR, Virginia From: Christos Siderelis Chuck Wyatt with the DCR in Virginia inquired about the classification of state parks having resort type characteristics and, if
Weights and Measures Training Registration
 Weights and Measures Training Registration Please fill out the form below to register for Weights and Measures training and testing dates. NIST Handbook 44, Specifications, Tolerances and other Technical
CRMRI White Paper #3 August 2017 State Refugee Services Indicators of Integration: How are the states doing?
 CRMRI White Paper #3 August 7 State Refugee Services Indicators of Integration: How are the states doing? Marci Harris, Julia Greene, Kilee Jorgensen, Caren J. Frost, & Lisa H. Gren State Refugee Services
REGIONAL AND STATE EMPLOYMENT AND UNEMPLOYMENT JUNE 2010
 For release 10:00 a.m. (EDT) Tuesday, July 20, USDL-10-0992 Technical information: Employment: Unemployment: Media contact: (202) 691-6559 sminfo@bls.gov www.bls.gov/sae (202) 691-6392 lausinfo@bls.gov
Percent of Population Under Age 65 Uninsured, 2013, 2014, and 2015
 Exhiit 1 Percent of Population Under Age 65 Uninsured, 13, 14, and 15 13 14 15
HIGH SCHOOL ATHLETICS PARTICIPATION SURVEY
 2011-12 HIGH SCHOOL ATHLETICS PARTICIPATION SURVEY Conducted By THE NATIONAL FEDERATION OF STATE HIGH SCHOOL ASSOCIATIONS Based on Competition at the High School Level in the 2011-12 School Year BOYS GIRLS
STATUTORY/REGULATORY NURSE ANESTHETIST RECOGNITION
 Alabama NPA and SBON R&R CRNAs are a type of advanced practice nurse. Advanced practice nurses are "certified by the Board of Nursing to engage in the practice of advanced practice nursing." [Alabama Nurse
RECERTIFICATION REQUIREMENTS
 Alabama Yes The Council on Recertification of Nurse Anesthetists. [Alabama Board of Nursing Admin. Code, sec. 610-X-9-.01(1)(d)] Alaska Yes Current national certification. [Professional Regulations, Board
National Study of Nonprofit-Government Contracts and Grants 2013: State Profiles
 www.urban.org Study of Nonprofit-Government Contracts and Grants 2013: State Profiles Sarah L. Pettijohn, Elizabeth T. Boris, and Maura R. Farrell Data presented for each state: Problems with Government
STATE ARTS AGENCY GRANT MAKING AND FUNDING
 STATE ARTS AGENCY GRANT MAKING AND FUNDING Each of America's 50 states and six jurisdictions has a government that works to make the cultural, civic, economic and educational benefits of the available
*ALWAYS KEEP A COPY OF THE CERTIFICATE OF ATTENDANCE FOR YOUR RECORDS IN CASE OF AUDIT
 State Alabama Alaska Arizona Arkansas California INSTRUCTIONS FOR CLE ATTENDANCE REPORTING AT IADC 2012 TRIAL ACADEMY Attorney Reporting Method After the CLE activity, fill out the Certificate of Attendance
CONNECTICUT: ECONOMIC FUTURE WITH EDUCATIONAL REFORM
 CONNECTICUT: ECONOMIC FUTURE WITH EDUCATIONAL REFORM This file contains detailed projections and information from the article: Eric A. Hanushek, Jens Ruhose, and Ludger Woessmann, It pays to improve school
Food Stamp Program State Options Report
 United States Department of Agriculture Food and Nutrition Service Fourth Edition Food Stamp Program State s Report September 2004 vember 2002 Program Development Division Program Design Branch Food Stamp
FOOD STAMP PROGRAM STATE ACTIVITY REPORT
 FOOD STAMP PROGRAM ACTIVITY REPORT Federal Fiscal Year 2004 Food Stamps Make America Stronger United States Department of Agriculture Food and Nutrition Service Program Accountability Division February
Food Stamp Program State Options Report
 United States Department of Agriculture Food and Nutrition Service Fifth Edition Food Stamp Program State s Report August 2005 vember 2002 Program Development Division Food Stamp Program State s Report