Implementation of the 2016 Ohio Nursing Home and Residential Care Facility Family Satisfaction Survey
|
|
|
- Buck Francis Mathews
- 5 years ago
- Views:
Transcription
1 Implementation of the 2016 Ohio Nursing Home and Residential Care Facility Family Satisfaction Survey JANE K. STRAKER, JYOTSANA PARAJULI, DANIELLE EYNON-BLACK, MATT NELSON, RYAN SHANLEY, KARL CHOW Scripps Gerontology Center An Ohio Center of Excellence
2 Implementation of the 2016 Ohio Nursing Home and Residential Care Facility Family Satisfaction Surveys Jane K. Straker, MGS, PhD Jyotsana Parajuli, MGS Danielle Eynon-Black, MEd Matt Nelson, MGS Ryan Shanley, MGS Karl Chow, MBA Scripps Gerontology Center Miami University Oxford, Ohio June 2017
3 This study was funded through a contract with the Ohio Department of Aging. To download or print additional copies of this report go to scripps.miamioh.edu/publications.
4 TABLE OF CONTENTS List of Tables... i List of Figures... ii Acknowledgments... iii Executive Summary... iv Background Updates... 1 Implementation... 3 Survey Distribution to Families... 5 Survey Assistance... 7 Calls from Families... 9 Facility Participation Nursing Homes Residential Care Facilities Results from the 2016 Family Survey Technical Processes Survey Processing: Testing Scanner Accuracy and Consistency Survey Processing: The Production Run Survey Data Management and Analysis Data Coding Margin of Error Statewide Averages Satisfaction Results Respondent and Resident Characteristics Satisfaction Results Family Comments Survey Psychometrics Short-Stay Residents Statewide Quality Making Quality Improvements Recommendations For Conclusions References Appendix A Family Survey Forms and Instructions Appendix B Facility List Instructions... 41
5 LIST OF TABLES Table and 2015 Nursing Home Family Survey Domain Comparison... 2 Table 2. Calls and s to the Toll-Free Help Line in Table 3. Number of 2016 Help Line Calls and s by Month... 8 Table 4. Topics Raised in Calls and s from Facilities... 9 Table 5. Topics Covered in Calls and s from Families Table 6. Nursing Home Participation Rates Table 7. Nursing Home and RCF Participation, Table 8. Demographic Characteristics of 2016 Respondents and their Residents Table 9. Level of Family Activities, Table 10. Residents in Nursing Homes, Table 11. Item Frequencies and Averages for Nursing Home and RCF Family Survey Items, Table 12. Internal Reliability of Domains on Nursing Home and RCF Surveys Table 13. Priority Areas for Improvement among Nursing Homes and RCFs, Table 14. Areas of Best Performance among Nursing Homes and Residential Care Facilities, i
6 LIST OF FIGURES Figure 1. Survey Process Figure 2. Call Volume, Figure 3. Number of Nursing Home Families Participating, Figure 4. Proportion of Nursing Homes Participating, Meeting Margin of Error, and Average Facility Response Rate, Figure 5. Priority Index Report ii
7 ACKNOWLEDGMENTS A number of people assisted us in the implementation of the eighth Ohio Nursing Home Family Satisfaction Survey and the first Ohio Residential Care Facility Family Satisfaction Survey. Erin Pettegrew, project manager at ODA provided excellent project support, advice and problemsolving assistance. Her team continued their work with nursing homes and RCFs to implement the survey and gather family lists. Her continued enthusiasm for improving the family surveys and the survey process are invaluable to providing excellent information to Ohio s nursing homes and potential residents and families. A great deal of thanks goes to Scripps Gerontology Center staff member Tonya Barger who created and managed a great process to keep a large data processing task moving forward. Her willingness to take on whatever is needed is much appreciated. Lisa Grant, Becky Thompson, and our Miami University student employees Ellie Hodges, Audrianna Nigg, Sydney Phillips, Michael Siedlecki, and Dean Ahrens spent hours opening, sorting, and scanning returned surveys. They also provided excellent customer service on our survey helpline and helped us with our first research mentorship project. Craig Heard and Mike Hughes from Miami s Statistical Consulting Center provided incredibly helpful advice and analyses to assist with decisions regarding scoring strategies for the new surveys. Finally, Miami s Campus Mail service worked very hard to deliver over 34,000 survey packets to our door. Without their help and others (whom we may not have mentioned), this project would not have been successfully completed. iii
8 EXECUTIVE SUMMARY The Ohio Long-Term Care Consumer Guide (OLTCCG), a web-based guide to nursing homes and residential care facilities, was developed in 2000 in response to the passage of H.B The OLTCCG includes data on resident and family satisfaction with Ohio s nursing homes and residential care facilities (RCFs) as well as inspection reports, quality measures, and other information useful to consumers. Ohio Revised Code requires the collection of family and resident nursing home satisfaction data in alternating years, beginning with the family survey in This year, for the first time, RCF families were included in the survey process. This report presents information about the eighth implementation of the Ohio Nursing Home Family Satisfaction Survey and the first RCF family survey in The survey implementation was conducted by the Scripps Gerontology Center at Miami University, Oxford, Ohio with a subcontract to Scantron, Inc. This year Scantron created and mailed survey packets to over 50,000 (50,533) family members and friends of Ohio nursing home residents and over 24,000 (24,208) families of RCF residents. Since the first administration of the family survey in 2001, the number of nursing homes participating has shown dramatic increases. In 2001, 687 facilities participated, compared to 904 in 2008, 933 in 2010, 947 in 2012 and 2014, and 945 in The number of families responding has increased from 20,226 to a high of 29,873 in 2010 followed by 27,008 in 2012, 23,639 in 2014, and 20,945 in Six-hundred twenty-seven RCFs and 12,559 families participated in the first RCF survey. On average, in each nursing home, about four in 10 (41.4%) of family members contacted completed a survey on paper or online. The characteristics of family respondents have remained consistent over time. The majority of those who respond are female, adult children of nursing home residents who are very involved with the residents. Over half (56.1%) visit several times per week or daily. Many also assist their residents in the nursing home; for example over two-thirds (68.1%) assist their family member with going to activities. About 10% (9.1%) expect their resident s stay to be less than three months; nine in 10 (90.9%) say longer than three months. Our RCF respondents are similar to the nursing home family and friends. The RCF response rate was much higher with over half (53.2%) of families responding to the survey. They are also female, adult children who visit often. Over half (53.3%) visit daily or several times per week. Almost all (97.9%) expect their resident to be in the RCF longer than three months. In 2015, we did extensive work to refine all of the nursing home and RCF surveys and develop a new survey for RCF families who had not been included in the survey process in prior years. The new surveys, based on interviews and focus groups with residents and families across Ohio, reflect changing preferences, and include many more items that reflect a desire for personcentered care practices. This process and survey refinements are described in a separate report (Straker, McGrew, Dibert, Burch, & Raymore, 2016). iv
9 Ohio s consumer guide website ( provides comprehensive information about Ohio nursing homes and RCFs as well as other aspects of long-term care. Family satisfaction is one important component to assist prospective residents and their caregivers in choosing a nursing home or an RCF. Family satisfaction also provides an important starting point for facilities to improve their care. After 15 years in existence the consumer guide now contains information for all facility families that reflects new consumer expectations for Ohio facilities. v
10 BACKGROUND The Ohio Long-Term Care Consumer Guide (OLTCCG, a web-based guide to nursing homes and residential care facilities, was developed in 2000 in response to the passage of H.B Implemented in 2001, the OLTCCG includes data on resident and family satisfaction with Ohio s nursing homes and residential care facilities (RCFs) as well as inspection reports, quality measures, and other information useful to consumers. Ohio Revised Code requires the collection of family and resident nursing home and residential care facility satisfaction data in alternating years. This report presents information about the eighth implementation of the Ohio Nursing Home Family Satisfaction Survey in 2016 and the first implementation of the family residential care facility survey. The survey implementation was conducted by the Scripps Gerontology Center (Scripps) at Miami University, Oxford, Ohio with a sub-contract to Scantron, Inc. The process of implementing the mailed survey to family members of nursing home and residential care facility residents throughout Ohio began in March 2016, with estimations of survey volume for production planning UPDATES In 2015, the Scripps Gerontology Center contracted with the Ohio Department of Aging (ODA) to develop a new survey for family members of residential care facility residents, and updates the surveys for nursing home families and RCF and nursing home residents. Previous surveys were developed in 2001, and ODA felt that consumer expectations have changed and a new emphasis on person-centered care practices was not adequately reflected in the items on the previous surveys. Their concerns were borne out as researchers at Scripps conducted a number of focus groups with residents, families, providers, and stakeholders during the summer of
11 Table and 2014 Nursing Home Family Survey Domain Comparison Table and 2015 Nursing Home Family Survey Domain Comparison 2016 Revised Family Survey Domains 2014 Nursing Home Family Survey Domains Moving In (3 items) Admissions (3 items) Social Services (3 items) Spending Time (6 NH, 7 RCF) Activities (4 items) Care and Services (3 items; 1 item differs between Choice (7 items) NH and RCF) Caregivers (5 NH, 6 RCF) Direct Care & Nursing (6 items) Therapy (2 items) Administration (2 items) Meals & Dining (3 items) Meals & Dining (4 items) Laundry (2 items) Environment (NH 4 items, RCF 3 items) Resident Environment (4 items) Facility Environment (5 items) Facility Culture (8 items) General (7 items) Total (NH 32 items, RCF 33 items) Total 49 items As the revised domains suggest, the new surveys focus more on practices and experiences than departments and people. For example, the old survey asked whether the social worker followed up and responded quickly to concerns. The new survey asks in the facility culture domain whether you are encouraged to speak up when you have a problem, and whether your concerns are addressed in a timely way. The changes recognize that with person-centered care, many of the staff participate in problem solving and are also empowered to make decisions to resolve issues. In focus groups, families indicated that they liked being able to problem solve with many staff, and most of their concerns weren t something they needed a specific staff person to address. A copy of the 2016 family survey forms with instructions and cover letters are included in Appendix A. 2
12 IMPLEMENTATION The distribution process for family surveys is designed to assure the integrity of results, and comparability among all facilities by ensuring that the same process is followed for all facilities. Nursing homes and RCFs compile and submit names of family members and friends, and all additional steps are undertaken by ODA, Scripps Gerontology Center, and Scantron. Facilities create lists using an Excel template, ODA draws random samples of family names from the lists in larger facilities, monitors the number of names submitted, and compares against estimated census totals to ensure that enough family names are on the lists. Scantron prints and distributes surveys to families, and Scripps Gerontology Center receives completed surveys, scans the data, and compiles statewide and individual facility reports. The survey process is completely anonymous with ODA and Scantron having family names but no data, and Scripps Gerontology Center having family data but no lists of family names. 3
13 Figure 1 summarizes the process as implemented in Figure 1. Survey Process 2016 Figure 1. Survey Process 2016 ODA requires facilities to provide a mailing list of family members. Facilities provide lists to ODA. ODA receives and formats list, draws random samples and provides to Scantron. Scantron prints and ships survey packets to families. Scantron provides serial numbers and passwords to Scripps for online survey. Families receive & complete survey, then return to Scripps or complete online. Scripps receives & scans surveys, calculates response rates and whether facilities meet the required margin of error, then submits final results to ODA. Modified from: E. Pettergrew, ODA 4
14 SURVEY DISTRIBUTION TO FAMILIES The distribution process for family surveys is designed to assure the integrity of results, and comparability among all facilities by ensuring that the same process is followed for all facilities. Nursing homes and RCFs create lists of family and friend names and submit them to ODA using a password-protected Excel template. ODA draws random samples of family names from the lists in larger facilities, monitors the number of names submitted, and compares against estimated census totals to ensure that a reasonable number of family names are on the lists. This includes checking against previous census numbers from the resident surveys and against the number of licensed beds. For facilities with a nursing home and an RCF it s important to assure that the lists submitted on the nursing home and the RCF templates are submitted correctly. Scantron prints and distributes surveys to families, and Scripps receives completed surveys, scans the data, and compiles statewide and individual facility reports. The survey process is completely anonymous with ODA and Scantron having family names but no data, and Scripps having family data but no lists of family names. Beginning in April 2016, facility master lists of 969 nursing homes and 655 RCFs were developed from lists sent from ODA. Facility census numbers from the 2015 resident surveys were used to estimate the likely number of family surveys needed in each facility. Based on assumptions from previous years about the proportion of residents with family, we estimated a total statewide mailing of 60,000 nursing home surveys and 28,000 RCF surveys. The facility lists were sorted by zip code and facilities were grouped into geographically sorted batches to allow Scantron to realize postage economies. Every two weeks, s were sent to a batch of nursing homes and RCFs. Administrators were given instructions for choosing the most involved family member or friend for each resident, and were provided with an Excel template for family lists to be submitted to ODA two weeks later. The number of facilities in the batch was determined based on the facility s estimated census with the goal of dividing each mailing into about 8,600 surveys for nursing homes and 4,000 for RCFs. Nine survey mailings were eventually needed to complete survey distribution. Along with family and friend names and addresses, facilities included their own facility information and their current resident census on the information they sent to ODA. Where the number of family/friend names submitted for survey was significantly less than the resident census, ODA followed up to determine whether there were only a few residents with surveyable family members or friends or if the facility had misunderstood the instructions (e.g., not included those who manage their own affairs or not including short-term residents). ODA staff called for clarification and asked facilities to resubmit their lists if instructions were not properly followed. The number of surveys to be mailed for each facility was based on the number of returned surveys needed to meet the margin of error for their population of surveyable families, assuming a response rate of 30%. This assumed rate is lower than statewide rates achieved in previous years. We hoped that most facilities would achieve a higher response rate and mailing extra surveys would allow them to meet the threshold needed for public reporting and to be eligible for the quality point. Instructions to facilities and family list materials are included in Appendix B. 5
15 Every nursing home and RCF is required to participate in the survey process; however, no penalties are assessed if they fail to comply. Several facilities closed during the survey preparation process. The final number of nursing homes used to calculate the participation rates was 964. Unfortunately, we have not been able to determine good estimates for the proportion of family names and addresses that will be deleted due to incorrect addresses. In actuality, 56,836 family and friend names had accurate mailing addresses for printing and mailing nursing home survey packets (we estimated 60,000) and 25,881 RCF survey packets (we estimated 28,000) were mailed. Where necessary (facilities with census greater than or equal to 84 residents) ODA drew random samples from the list of family names. ODA then submitted family name lists, sorted by zip code, to Scantron bi-weekly. At Scantron, each name on the list was assigned a serial number according to the facility they were responding about and a unique seven-character login ID. Families could use the login ID and the serial number to complete an Internet version of the survey instead of completing and returning the paper one. Each survey was printed with the facility name and address, the facility identifier and the unique serial number and login ID. Envelopes were printed for each family name and the survey with that family s serial number was placed in the proper envelope for mailing. RCF and nursing home surveys and envelopes were printed on different color papers to ensure that returned surveys were scanned into the proper files. After mailing, Scantron provided Scripps with Excel files indicating the survey serial numbers and login passwords that were assigned to each facility. These were loaded into the online surveys to allow family members to access the internet survey if they preferred. Families were directed to the online surveys via a URL on the paper survey cover. They could then login to the online survey using the serial number and password printed on their paper survey. The first survey lists were due from ODA to Scantron on May 13; surveys were mailed to families beginning May 31, and every two weeks thereafter, through September 6. Each mailing list was checked against the National Change of Address system and family addresses were updated. Addresses that could not be reconciled were not mailed, eliminating unnecessary postage costs by preventing mailing of undeliverable surveys. Reminder postcards were mailed to each batch of families two weeks after the surveys were mailed. Despite ODA advance instructions to facilities to update mailing lists, on average about 9% of nursing facility and 7% of RCF address lists were deleted because the addresses could not be verified or reconciled. Only 38 of the nursing homes had no bad addresses compared to 103 RCFs with completely accurate address lists. In every facility, the more families that can be contacted, the greater the odds that a survey will be returned. Improving these lists would be one simple way for facilities to begin. 6
16 SURVEY ASSISTANCE In order to assist family members and facilities with questions or issues during the 2016 Ohio Nursing Home Family Satisfaction Survey process, a toll-free phone line was set up at the Scripps Gerontology Center. The phone line was staffed Monday through Friday between the hours of 8:30 a.m. and 4:30 p.m. and had voice mail capability so callers could leave a message 24-hours a day, seven days a week. In addition, families and facilities could request help or ask questions via at familysurvey@miamioh.edu. ODA maintained a familysurvey@age.state.oh.us account to assist facilities with the operational issues in submitting their family lists. The helpline and account were managed by two doctoral associates who each worked 20 hours per week. Four undergraduate student workers and one Scripps support staff member assisted as needed for phone coverage. A training manual and a list of frequently asked questions continued to be expanded in order to assist all staff in giving reliable answers. The phone line was regularly staffed from April 21, 2016 through October 31, Family members made 921 calls, 477 were from facilities and 36 were from ODA staff. Table 2 and Figure 2 show helpline volume during all years of survey administration. Despite increasing the number of facilities by about one-third by adding the RCFs this year, call and volume increased only 24% over the previous year. Table 2. Calls and s to the Toll-Free Help Line in Table 2. Calls and s to the Toll-Free Help Line in Year Total 1, ,130 1,398 Families 1, Facilities Note: There were 36 s from ODA staff that are not included in the table above. 7
17 Figure 2. Call Volume, Figure 2. Call Volume, ,600 1,400 1,200 1, Total Families Facilities Because mailings to families didn t begin until mid-may, almost all the calls in the first two months are facility calls with questions about creating and submitting their lists of family names. Table 3. Number of 2016 Help Line Calls and s by Month Table 3. Number of 2016 Help Line Calls and s by Month Month Numbers of calls & s Percent April May June July August September October Total 1,
18 The list submission process posed challenges for some facilities either because they were unable to work with the family list template provided by ODA or they were unable to password protect their document prior to ing it to ODA. A number of facilities called to confirm family list submissions or to find out if they could still submit their family lists when it was past their due date. Table 4 shows the distribution of facility calls among broad topic areas. Table 4. Topics Raised in Calls and s from Facilities Table 4. Topics Raised in Calls and s from Facilities Subject Number of calls & Percent s Questions on access/format/password protection issues about the family list template Confirmations about the family list submission Asking if they can still send in the family list Questions on family lists (selection criteria for the list; how to submit the list) Communication issues between ODA and the facilities (e.g., facilities received no information from ODA about survey) General questions and concern about survey Guardianship issues Reliability concerns because of small facility Asking if the survey is mandatory Miscellaneous Total Note: The number of topics totals more than the number of contacts from facilities since some calls or s addressed more than one issue. CALLS FROM FAMILIES The breakdown of the communications from families is shown in Table 5. The majority of the calls from family members were requests for new surveys, usually in response to receiving a reminder postcard but not having received a survey. Some family calls were in response to the reminder postcards when a survey had already been returned. Despite the instruction to disregard the reminder if their survey had been returned, these families were inquiring whether their survey could be tracked to ensure its receipt. As shown below, this year a number of families called with online survey questions. Most of them needed confirmation of submission of survey or had complaints about the online survey links not working. While we were not able to determine a cause, these problems were quickly corrected. 9
19 Table 5. Topics Covered in Calls and s from Families Table 5. Topics Covered in Calls and s from Families Subject Number of calls Percent & s Needed a replacement survey Online survey questions Need referral to ODA Needed to know if it is too late to return survey Sampling issues (who is survey for, don t know anyone in nursing home) Survey question wording and response category issues Confidentiality concern Received survey after relative s death Requested confirmation of receiving the survey More than one family member in a facility Asking if it is mandatory Refused to participate Asking for a second survey General questions and comments Complaints about the facility Questions about survey results Want space/place for comments Guardianship issues Miscellaneous Total Note: The number of topics totals more than the number of contacts from facilities since some calls or s addressed more than one issue. FACILITY PARTICIPATION Before the beginning of the survey process ODA sent a mailing to every nursing home and residential care facility in Ohio, informing them about the upcoming family survey. In order for facility data to be included on the consumer guide the number of returns for the facility must meet a plus or minus 10% margin of error. This number represents the probability that the actual responses, if every family responded, would fall between plus or minus 10% of the average score on the responses received. We used the number of surveys mailed by Scantron to determine the surveyed population at each facility. This number excluded those families whose names and addresses were sent by the facilities for survey distribution but whose addresses could not be adjusted via the national address update system. 10
20 Rather than computing whether each item on the survey meets the margin of error, we base the margin of error on the number of surveys returned for a facility since not all items are relevant to all residents. The following sections of the report will consider the continuing trends in nursing home participation and responses followed by the results for residential care facilities. Nursing Homes This year s statewide nursing home response rate (40.4%) is four percentage points lower than in 2014 and also reflects the third lowest number of families responding since the surveys began. Table 6 shows that the number of facilities participating is similar to previous years, suggesting the reduced numbers come from lower responses within facilities. Table 6. Nursing Home Participation Rates Table 6. Nursing Home Participation Rates Number of facilities on mailing list Number of facilities with surveys returned 736 (77%) 849 (87%) 904 (94%) 931 (97%) 947 (99%) 947 (98%) 943 (97%) Number of facilities meeting +- 10% 436 (59% of participants) 605 (71% of participants) 633 (70% of participants) 711 (76% of participants) 721 (76% of participants) 595 (63% of participants) 542 (58% of participants) Average response rate in all participating facilities 44% 50% 52% 47% 45% 41% 40% Number of facilities not participating 222 (23%) 123 (13%) 61 (6.0%) 31 (3.0%) 6 (0.5%) 17 (1.7%) 25 (2.6%) Total number of families responding 16,955 23,633 24,572 29,873 27,008 23,639 20,945 11
21 As shown in Figures 3 and 4, response rates and family participation continue to pose challenges for Ohio s nursing homes. We had a lower rate of facilities that met margin of error than in 2014 (58% vs. 63%). In addition, 40% of the 401 facilities not meeting the MOE needed three or fewer surveys. Forty-five (compared to 43 in 2014) needed only one more survey. When facilities don t meet the margin of error required for representative data they do not have results posted on the Ohio Consumer Guide which limits the usefulness of the guide for the public. Data collection was extended into February this year and facilities that needed only one additional survey to meet were approached and some additional surveys were sent to families who indicated they could complete the survey. Despite this extensive time and effort, only an additional seven nursing homes and RCFs achieved MOE. Most of the facilities that do not meet MOE are smaller, where a higher proportion of responses are required to assure representative data. And as more facilities focus on sub-acute care for short-stay residents, more and more families do not feel invested in encouraging facility improvements by providing consumer feedback. Their family members may already have returned home by the time their survey is received. Figure 3. Number of Nursing Home Families Participating, Figure 3. Number of Nursing Home Families Participating, ,000 30,000 29,873 25,000 20,000 20,226 23,633 24,572 27,008 23,639 20,945 15,000 16,955 10,000 5,
22 Figure 4. Proportion of Nursing Homes Participating, Meeting Margin of Error, and Average Facility Response Rate, Figure 4. Proportion of Nursing Homes Participating, Meeting Margin of Error, and Average Facility Response Rate, % Participate % Meet MOE % Family Response RESIDENTIAL CARE FACILITIES RCFs had a higher response rate than nursing homes, with an average of 53% of families responding, statewide. Interestingly, this rate is similar to the rates of 50% and 52% found in nursing homes in the early years of survey administration. As shown in Table 7, this year the RCFs exceeded nursing homes in all participation rates except for the percentage of facilities participating where they exhibited lower proportion of facilities with surveys returned. It s likely that RCFs who were doing this process for the first time may have experienced challenges that made it difficult for them to participate. Similar to nursing homes, as they become familiar with the survey and its importance for public information and improvement in their facilities they will become participants. The participation rates in RCFs also support our assumption that families whose residents stay longer are more invested in the facilities and may be more likely to return surveys. 13
23 Table 7. Nursing Home and RCF Participation, 2016 Table 7. Nursing Home and RCF Participation, Nursing Homes 2016 RCFs Number of facilities on mailing list Number of facilities with surveys returned 943 (97%) 614 (92%) Number of facilities meeting +/- 10% 542 (58% of participants) 453 (74% of participants) Average response rate in all participating facilities 40% 53% Number of facilities not participating 25 (2.6%) 54 (8.1%) Total number of families responding 20,945 12,559 RESULTS FROM THE 2016 FAMILY SURVEY TECHNICAL PROCESSES The survey was created using a software package, SNAP, developed by the Mercator Corporation of Great Britain. The finished survey was sent to Scantron for printing surveys, creating survey packets, and mailing to families. The survey was printed with a perforated binding edge, which only required that the binding be removed to make the survey ready for scanning. Families were invited to provide comments on a separate sheet of paper and to return them with their surveys and a number of families did so. As returned survey packets were opened, survey pages with family comments were photocopied, marked with the provider ID and survey serial number, and given to a graduate assistant for scanning, data entry, and coding. Relevant portions from each set of comments were entered into an Excel spreadsheet with a numeric code corresponding to the type/topic of the comment. Survey booklets were disassembled and prepared for scanning. Batches of surveys were scanned and filed according to scanning date. There were major changes to the survey in 2016: 1. Residential Care Facilities were surveyed for the first time, resulting in a process duplicated from the Nursing Facility-only process from previous years. This entailed a new RCF scanning survey and 10 versions of the online survey (one for each batch of surveys mailed by Scantron). 2. Almost all questions and sections were changed from the previous surveys (with the exception of the Demographics section, which remained the same), along with response categories. 14
24 In order to maximize scanning accuracy and minimize manual data input, all questions were multiple-choice with check boxes (the most accurate format for scanning purposes). The only manual input fields on the survey were the Facility ID and the survey serial number. The scanner and associated software were located at Scripps and allowed Scripps staff to implement and fully monitor the scanning process. In 2016 we continued the online version of the survey, also created using SNAP software. The online survey required that respondents log in using their seven character login printed on the paper survey. This made it possible to identify the facility that respondents were reporting about. The web address for the online version was included in the instructions on the paper survey. There were 10 identical versions of the online survey, in order to accommodate the nine batches (plus extras assigned by Scripps as replacement surveys) in which the paper surveys were sent to the respondents, and an eighth batch of serial numbers assigned to replacement surveys. As in 2014, a web page was created on the Scripps website, with a simple URL, which made it easier for respondents to access. That web page contained pointers to 10 separate links for nursing facilities and residential care facilities, each organized according to the serial numbers printed on the paper surveys. Respondents selected the appropriate link according to the serial number on their survey. Despite having an online survey process for the fourth time, there are still very few families who complete the tool online. This year, about 4.5% (949) of the nursing facility and about 6.2% (778) of the RCF surveys were completed online. Data from the online surveys were compared to scanned survey data to ensure that families completed only an online or paper survey, but not both. In order to accommodate the high volume of returned surveys, Scripps operated three separate scanners running the same scanning program. At the completion of the survey, all 13 sources of data (from the three scanners and the 10 online versions) for each survey (nursing facility and RCF) were combined into the final dataset for processing and analysis. SURVEY PROCESSING: TESTING SCANNER ACCURACY AND CONSISTENCY To test scanner accuracy and consistency, 50 surveys were scanned two times each. The scanned results were compared against the actual surveys to check for accuracy of scanning hardware and software. To test for consistency, the scanned data were analyzed using statistical software to ensure that the two separate scans of the same survey produced the same results. Scanner accuracy testing was critical since the survey had changed from the 2014 version. This was performed on both the nursing facility and RCF surveys. The data analysis revealed that the calibration performed was sufficiently accurate to proceed without further adjustment. The scanning testing revealed an accuracy rate of 99.6% (three errors divided by (70 questions X 100 surveys), which is well within the industry standard. SURVEY PROCESSING: THE PRODUCTION RUN Scanning of surveys began in July of 2016 and continued through December, Late returned surveys were entered into the combined data files manually and those were completed by mid-february, Surveys were scanned primarily by student employees, who were trained in the scanning procedure by the research associate who created the survey in the Snap software. Due 15
25 to the design of the survey (using only multiple-choice questions) and the favorable results of the accuracy testing, the only data verification required was for the Facility ID, password, and survey serial number fields. On a weekly basis, a Scripps research associate selected a small sample of scanned surveys to check for accuracy of scanned results. No problems were detected. The scanned results were exported to statistical analysis software and then all electronic files associated with the scanning process were backed up to the network server on a daily basis. The scanned surveys were boxed, labeled with the scan date, and placed in storage. At the peak of survey processing, over 600 surveys were scanned per day. At completion of scanning an electronic image file was created which captures the scanned picture of each survey. These files were provided to ODA for record retention purposes. Scanned paper surveys were shredded per ODA instructions. SURVEY DATA MANAGEMENT AND ANALYSIS Survey data were exported to a spreadsheet application, where the data were cleaned (e.g., formatting of date variables, assignment of variable names) and arranged in a form suitable for statistical analysis. A large part of the data cleaning process involved verification of facility IDs. Due to the fact that those IDs required hand-entering (made necessary by the Snap software s limitations in accurately scanning alphanumeric fields), errors in entering that field were inevitable. In cases where a survey s facility ID does not match the master facility list, that survey s scanned image was viewed and the facility ID was corrected in the Snap software. The data were then run through SAS programs developed for the purpose of aggregating data at the facility level. Additional analyses was run using SPSS 24.0, a second statistical program. A random sample of RCF and NF facility results were selected for checking numerical results. Both analytical processes produced identical results, indicating that the calculations included the proper groups of facilities, (e.g., only those that met margin of error for statewide averages) and the calculations provided identical results. The analytical results were then fed back into an Excel spreadsheet and formatted into individual facility reports. In previous years, two years of results were shown in each report for comparison purposes. Because the items changed so extensively between 2014 and 2016, the 2014 data were dropped and only 2016 results were shown in the reports. Again, a random sample of RCF and NF facilities were selected for checking, to verify that data results loaded in the proper locations on the facility reports. Upon completion of analysis, each Excel report was saved as a PDF file, and provided to ODA for uploading on their website. An Excel file of overall statewide results also provides information about statewide averages, highs and lows for the consumer guide website. 16
26 Data Coding Satisfaction question items were scored as follows: 1=Definitely no 2=Probably no 3=Probably yes 4=Definitely yes 5=Don t know/not Applicable All items were recoded to a 101-point scale as follows: Margin of Error 1=0 2=33 3=67 4=100 5=Missing A list of sample sizes needed in facilities with differing numbers of residents with involved family/friend/person was created in a lookup table in order to determine whether a facility met the plus or minus 10% margin of error (Noble, Bailer, Kunkel, and Straker, 2006). Facilities that did not have enough returned surveys to meet the margin of error were excluded from calculation of statewide average scores and counts of facilities having the highest and lowest statewide scores. However, every facility with returned surveys receives a report of the data collected for their facility to use for quality improvement purposes. In an attempt to increase the number of facilities meeting the margin of error a list of facilities that did not have any returned surveys nor completed audit forms was prepared and sent to ODA in October As previously described, additional efforts were made early in 2017 to increase the number of facilities meeting the MOE. STATEWIDE AVERAGES Statewide averages were computed on each item and on each domain. Facilities with two or fewer surveys were excluded from these calculations. The same calculation decisions used in previous years were used in However, in calculating domain scores, extensive SAS coding changes were required to accommodate the survey changes. Averages are reported for each item and domain on facility reports. The averages are the average of each facility s average score on each item, rather than the average of all family responses among all facilities. Overall satisfaction is the average of all items in each facility. 17
27 SATISFACTION RESULTS RESPONDENT AND RESIDENT CHARACTERISTICS In order to build a profile of those who responded to the family satisfaction surveys, and the residents they were responding about, the following demographic questions were included: information about the family member/respondent, respondent s relationship to the resident, some information about the resident, and the kinds of things the family member/respondent does when visiting the nursing home. Demographic information is provided in Tables In general, the characteristics of the residents and family members are in keeping with national data on nursing home residents and their caregivers. The majority of involved family members in the survey are adult children. They are very involved in the nursing home, visiting quite often, talking to a variety of staff members, and providing some personal assistance to their family members. In short, the respondents are likely to be a group that is very informed and able to make judgments about the care their family member receives. Comments received with blank surveys that were returned to Scripps indicated that in some cases family members did not feel qualified to evaluate the facility. This was usually because they did not visit often, or their family member had been a resident for such a brief time that they felt unable to make a fair judgment about the care. As shown, the majority of residents for whom family members reported are long-stay rather than short-stay residents. Respondent and resident characteristics in nursing homes have been quite stable over time. The only change of note over time regards the staff that families talk to. The proportion who always or sometimes talk to the administrator increased from 56.8% to 73.1% in 2010, from 73.1% to 81.9% in 2012 and an additional point to 82.9% in In 2016, that number declined to 74.9%. In 2012, we examined whether talking to the administrator is a positive or negative activity (e.g., families make a point of talking to the administrator because they have problems or concerns). We examined the association between frequency of speaking with the administrator and whether the family member would recommend the facility and whether they liked it overall. At that time it appeared that talking to the administrator is a positive point. Statistically, a significant relationship was shown between frequency of speaking with the administration and overall satisfaction, whether one liked the facility and whether one would recommend the facility. About three in four of those who always spoke with the administrator would always recommend the facility (74.7%) or always like the facility overall (75.3%), compared to 42.0% who would always recommend and 45.2% who overall like the facility among those who never speak with the administration. 18
28 Table 8. Demographic Characteristics of 2016 Respondents and their Residents Table 8. Demographic Characteristics of 2016 Respondents and their Residents Average Age (SD) Race (Percent) Caucasian African American Asian Other Native American Hispanic Nursing Home Families 64.7 (11.7) (3.9% missing) (3.0%missing) Female (Percent) 68.4 (2.4% missing) Relationship to Resident (Percent) Child 44.3 Spouse 12.5 Sibling 9.8 Guardian 6.6 Parent 5.1 Son/daughter-in-law 4.2 Niece/Nephew 3.8 Other 3.0 Friend 1.8 Grandchild 1.0 (7.7% missing) Educational Level Less than high school Completed high school Completed college Master s or higher (3.6% missing) Nursing Home Residents 81.9 (13.9) (2.8% missing) 70.4 (1.5% missing) RCF Families 63.8 (9.1) (2.3% missing) (2.2% missing) 65.8 (2.0% missing) (6.3% missing) (2.2% missing) RCF Residents 87.7 (9.8) (1.5% missing) 77.8 (1.2% missing) N = 20,945 nursing home families and 12,559 RCF families. Note: Percentages are based on those who answered the questions. Family member ages below age 18 were considered recording errors and counted as missing. 19
29 The new RCF family survey provides some interesting comparisons among respondents and residents in both kinds of facilities. While the average nursing home resident is younger, nursing home family respondents are slightly older (64.7%) than RCF families (63.8%). RCF families are also more likely to be white and female. They are also more likely to have higher education with nearly two-thirds (64.3%) have a college education or higher, compared to less than half (46.2%) of nursing home families having similar education. These differences probably reflect the largely private pay clientele of Assisted Living facilities, reflecting a more affluent resident base. Table 9. Level of Family Activities, 2016 Table 9. Level of Family Activities, 2016 Frequency of Visits (Percent) Nursing Home RCF Daily Several times a Week Once a Week Two or Three Times per Month Once a Month Few times per Year (1.8% missing) (1.1% missing) Helps with (Percent) Eating Dressing Toileting Grooming Going to Activities Talks to (Percent) Nurse aides Nurses Social Workers Physician Administrator Other N = 20,945 nursing home families and 12,559 RCF families. Note: Percentages are based on those who answered the questions. Never Sometimes Always Nursing Home RCF Nursing Home RCF Nursing Home RCF
30 Nursing home families are also providing more help in facilities, with a lower proportion of RCF families saying they always provide assistance and a higher proportion saying they never provide assistance. Only in going to activities are RCF families less likely to say they never help, and more likely to say they always help. Interestingly, similar proportions of nursing home and RCF families (68.2 and 70.1) say they never help with toileting. Nursing home families have far more communication with nurse aides than do RCF families, and nursing home families are also more frequent visitors. This may be due to the different relationships to the residents, with nearly two-thirds of RCF families being adult children, compared to less than half of our nursing home family respondents. Table 10. Residents in Nursing Homes, 2016 Table 10. Residents in Nursing Homes, 2016 Resident s Expected Length of Stay (Percent) Nursing Home RCF less than 30 days more than (2.7% missing) No Help Some A Great Deal Totally Dep. Nursing Home Resident Needs Help With (Percent) Medication (2.1% missing) Toileting (2.1% missing) Dressing (1.8% missing) Transferring (1.6% missing) No Help Some A Great Deal Totally Dep. RCF Resident Needs Help With (Percent) Eating (1.3% missing) Toileting (1.5% missing) Dressing (1.3% missing) Transferring (1.2% missing) N = 20,945 nursing home families and 12,559 RCF families. Note: Percentages are based on those who answered the questions. As shown above in Table 10, these RCF and nursing home residents show quite different levels of impairment, with more than four in 10 nursing home residents being completely dependent in all ADLs, while fewer than 15% of RCF residents were completely impaired in any ADL. While there is a general perception that RCF residents are becoming more impaired, only dressing shows fewer than half of the RCF residents needing no assistance. Another striking difference is in the length of stay for these residents, with the RCF respondents reporting about family members who are much more likely to be long-stayers. 21
31 SATISFACTION RESULTS Table 11 shows the frequency of responses for each questionnaire item, along with the statewide means for each item. Although the statewide frequencies reflect the proportion of individual families that answered in each category, the statewide means are calculated by averaging the data within each facility then averaging each item across all facilities. These are the same mean scores shown as statewide scores on the individual facility reports and on the consumer guide website. Table 11. Item Frequencies and Averages for Nursing Home and RCF Family Survey Items, 2016 Table 11. Item Frequencies and Averages for Nursing Home and RCF Family Survey Items, 2016 Items & Domains (RCF data are in bold) Definitely No Probably No Probably Yes Definitely Yes Don t Know/ Not applicable Nursing Home RCF Moving In When the resident moved in, were you given thorough information to help you know what to expect? Was the resident given a thorough orientation to the nursing home/rcf? Did you feel warmly welcomed as a new family member? Spending Time Does the resident have something enjoyable to look forward to most days? 5. Do the staff do a good job keeping the resident connected to the community? 6. Does the resident have plenty of opportunities to do things that are meaningful to them? 7. (RCF item only.) Does the residential care facility have enough opportunities for your resident to go on special outings and events? /8. Does the resident like the provided activities? /9. Does the nursing home/rcf provide things the resident enjoys doing on the weekend?
32 Items & Domains (RCF data are in bold) Definitely No 9/10. Do you have plenty of opportunities to be involved in the nursing home/rcf? Probably No 23 Probably Yes Definitely Yes Don t Know/ Not applicable Nursing Home RCF Care and Services (RCF item only.) Does this living arrangement help the resident maintain their independence? (NF item only.) Are the resident s preferences about daily routine carried out (e.g., time and place for meals and time and type of bath)? /12. Do you have enough opportunities for input into decisions about your resident s care? 12/13. Do you get enough information to make decisions with or about your resident? Caregivers /14. Do you feel confident the staff is knowledgeable about the resident s medical condition(s) and treatment(s)? /15. Do the staff know what the resident likes and doesn t like? 15/16. Do the staff regularly check to see if the resident needs anything? 16/17. Have you gotten to know the staff who care for your resident? 18. (RCF item only.) Do the staff encourage your resident to be as independent as they are able to be? /19. Do the staff come quickly (RCF item--do you feel confident the staff would come quickly) anytime your resident needs help? Meals and Dining /20. Is there a lot of variety in the meals? /21. Are you included in mealtimes if you want to be?
33 Items & Domains (RCF data are in bold) Definitely No Probably No Probably Yes Definitely Yes Don t Know/ Not applicable Nursing Home RCF 20/22. Is the food good? Environment /23. Is the nursing home (RCF) thoroughly clean? /24. Can the resident get outside often enough? (NF item only.) Do you have a good place to visit privately? /25. Are the resident s belongings safe? Facility Culture /26. Are you encouraged to speak up when you have a problem? /27. Are your concerns addressed in a timely way? /28. Are you kept well informed about how things are going with your resident? /29. Do the staff seem happy to work at the nursing home/rcf? 29/30. Do the staff go above and beyond to give your resident a good life? 30/31. Do you feel confident that staff would help your resident beyond their personal care needs if you could not (e.g., things like completing paperwork, purchasing clothing)? 31/32. Do you have peace of mind about the care your resident is getting when you aren t at the nursing home? 32/33. Would you highly recommend this nursing home/rcf to a family member or friend? Note: Frequencies are based on individual data statewide. N = 20,945 for nursing facilities (NF) and 12,559 for residential care facilities (RCFs). The top lines in each cell are NF numbers, RCF numbers are in bold. Means are based on the average among all facility s item averages
34 Domain scores were computed by averaging the scores on all the items in the domain. In order for a respondent to be included in the domain average, he/she had to answer at least all but two of the domain items. For example, where six items are in a domain, respondents had to answer at least four. While this criteria is important in keeping respondents who did not know about many of the items from influencing the data, it did result in several cases where facilities did not have any respondents who answered enough domain items to compute a domain score. In previous years we have provided extensive comparisons to previous survey years. This year because the items were changed so extensively for nursing facilities any comparisons over time would be invalid. The next survey will provide comparative data to observe any changes over time. FAMILY COMMENTS In 2014, any comment that family members included on their surveys were documented, counted, and coded. These comments were entered into an Excel spreadsheet, assigned a code corresponding to the topic(s) addressed in their comment, and then categorized into larger constructs. Scanned originals and the Excel files were forwarded to ODA weekly since some families specifically requested interventions and assistance. This year, families were instructed to place any additional comments on the back of the survey form, and were informed that the comments would be forwarded to facilities, unless otherwise instructed. Comments were scanned, and forwarded to ODA weekly. ODA kept the comments for each facility and at the end of the data collection period forwarded the files to the appropriate facilities. However, because of the numerous survey changes this year we felt it was worthwhile to track comments made about any of the questions, responses or overall survey issues even though we were no longer recording facility-specific issues. These are often written inside the survey as explanations for particular responses on specific items. The internal comments included comments that the respondents raised on some issues about the survey. One set of common explanations include the reasons that some questions were skipped or marked as not applicable. These included comments like: Not applicable, resident has severe dementia, Not applicable for the patient, She has dementia, My mother has end stage Alzheimer s, The resident is blind, Too many questions. Some are too personal. Some you could not answer unless you actually lived there yourself, Generalized questions are not so reliable. Do I have input? As in previous years, numerous respondents wished for a different set of responses that more closely reflected their answers. This survey doesn t have appropriate response categories. Some suggested including response categories like sometimes, most of the time, mostly, maybe, not always, somewhat, etc. instead of responses provided in the surveys such as definitely yes, probably yes. The answers choice do not match my response, can I add another response?, These choices are hard to determine because of the word probably. I think the word usually might be better than probably. 25
35 Few comments raised issues on questions about background information mostly on age and race questions. Comments on background information include: These questions are offensive and should not be on any form, What difference does it make?, Why is this important?, What is Caucasian anyway?, Caucasian is an offensive term, This survey is not anonymous. A few comments suggested adding "some college" to the responses to the educational status question. Some comments suggested they were not sure what certain wordings in the survey exactly meant. Some comments suggested requiring clarification on the questions asked. A couple examples include: Not sure how to describe this above and beyond ( Do the staff go above and beyond to give your resident a good life? ), "What is plenty?" ( Does the resident have plenty of opportunities to do things that are meaningful to them? ). These comments suggest that respondents care about the significance/conclusions of the survey. These comments imply that respondents took the time to reflect on the survey itself and to offer suggestions to improve the survey in the future. Some of the comments were just elaborations of the answers provided. Respondents answered those questions in words and made complaints about various things in the facility rather than choosing the options provided. Complaints about many different areas were noted including majority of the complaints about specific services (food, activities), staffing, and facility s environment. By identifying these specific areas, it suggests that family members make sure that these areas are addressed accordingly. Complaints about specific services such as food include: No diabetic menu, Most of the time no, All the food is blended due to swallowing issues, The food preparation has really gone downhill. They need to make some changes or bring in new chefs, Soft food often not available in unit, All meals are very poor, There are a lot of dislikes in the menu. They should be removed, Too much salt on processed food, The food is horrible, Too much cabbage, corn, beans. Food not digestible by elderly. No fresh fruits or vegetables. Most food offerings do not meet needs of resident s monitoring diets for health reasons i.e., diabetes, cholesterol, weight. Comments on activities included: None provided, Activities are held but nothing off the grounds, Mom has Alzheimer s, so she doesn t really know what is going on activities wise or participate in activities, The resident is blind and cannot participate in many activities. Complaints about staffing include: Not enough staff, Understaffing in help, Not enough help in dementia units. Staff that does good is overworked, A lot of time they are short staffed, Not enough aid especially at night. Found out they give baths at 3-4 am because of only one aid in unit 3- stupid! Waited for over 1 hour for someone to come and help him to the bathroom, Help is not available particularly in the evenings and weekend, The general scheduling of staff could be much better. The person who does it is not effective and communicates poorly and discourages staff from talking honestly about problems. She prefers to keep it in the house. Under staffed at times. Some staff members are knowledgeable but others are not. The staff is stretched too thin especially in the nights and weekends. We would prefer that he keeps the same caregivers that he knows but often times they are scheduled elsewhere for whatever reason. They have had a lot of turnover and some good people are no longer there. 26
36 Complaints about the facility s environment included comments mostly about security of the resident s belongings. Comments about resident s belonging being unsafe include: Theft is not a problem but sometimes clothes are lost or misplaced, Two stuffed bears taken from her room, There was a recent theft from her room w/ items replaced and numerous loss of marked clothing, They stole my son s shoes and clothes. Half of all toiletries and clothes have been stolen, Things stolen in multiple occasions. Police called in the last time, The resident s expensive hearing aid was lost the second week of care, Money was taken. Some comments also included physical structure of the building which included: The smell in the hallways 80% of the time is human waste, Carpet is old and badly stained smells, Air conditioning is totally inefficient and often various areas are much too warm, At times the room smell of urine and bedding was not changed after accidents right away. Even though many family members were dissatisfied with the facility, staff, or services where their family members resided, some of the family members recommended the facility to other people. We always recommend and have had some we have made recommendations to move their loved ones into (facility name). This is by far the best facility its type in our county, I recommend (facility name) to everyone, staff is awesome and can t say enough about all the workers, Our facility is outstanding, It s as good as you can expect under the circumstances. Most of the aides work very hard. Much better care than the last place where my mother fell out of bed 8 times landing in a hospital after last fall. These comments suggest that respondents were very pleased with the care and services their family members received from the respective nursing homes. While many families would recommend their facilities to others, some expressed: For the cost of the facility, I find care, food, cleanliness could be better, This place is severely understaffed and cannot do everything they could or should, Staff is continuous changing over the last year- all positions turn over every time I visit. Retention is very poor, I would not recommend this facility to anyone, There s no good nursing home! Short-handed staff. But then I hear this goes on all over, After my husband s stay, I told my family if I got to that point, give me a gun or a bottle of pills. Often, family members offered complaint comments alongside praise for their facility. It s probably the best in (city name) but not as good since personnel changes were made, For the most part they do an ok job, a lot of time it appears they are short staffedespecially on weekends, Better than a lot but not the best. Some family members commented on the changes in the facility s administration. They express: I have tried to talk to the administrator but he always has the telephone receptionist deal with me and convey message occasionally. He never returns my call (my mother has been there for 14 months), Staff not extremely happy with the management/ staffing lately management is changed 3x my mother been there since 1.5 years. Interestingly, despite having resident family members who were deceased, some of the respondents expressed their thoughts on the nursing home facilities where their family members had resided. One comment included: Sorry this is late. Dad passed away May 20, so everything was in hold for a while. (Facility name) was a nice place. The staff was very good to my dad. 27
37 This suggests that respondents have a sense of social accountability for future families needing the services of nursing home facilities, despite knowing that any changes or improvements will not benefit their own family members. In summary, the internal survey comments provide a rich source of information about issues related to construction of the survey including the family member perceptions of nursing home life. Comments that raised issues on construction of the survey will help refine the survey in the future whereas comments on family members perceptions make a valuable addition to the reports provided to facilities. The Ombudsman s office provided these comments to the facilities for the first time this year. They said that seeing the comments combined into one facility report was really enlightening in helping facilities understand some of the quantitative responses about their facilities. SURVEY PSYCHOMETRICS As previously mentioned, the 2016 nursing home family survey was substantially modified from previous years, while the RCF family survey was new this year for the first time. Since this is the first opportunity to have a significant amount of data available it is important to conduct analyses on the internal reliability of the instrument and its domain structures. Table 12 shows the domain coefficient alphas for nursing homes and RCFs and item-total correlations for each item. To control for within-facility correlations, aggregated data from each nursing home and RCF was used for these analyses. The results show high reliability of the domains and stability of the instrument across both settings. George and Mallory (2003) suggest that alphas above.90 are excellent and.80 are good. Alphas of.70 and above are acceptable with alphas of.60 and smaller being questionable and.50 and below unacceptable. All alphas from both the NF and RCF scales are excellent. The correlation of individual items with the other year in the scale indicates how well all of them are measuring a similar construct. Gliem and Gliem suggest that these should be at least.40 or above. This standard is met by all of the individual items in both surveys. 28
38 Table 12. Internal Reliability of Domains on Nursing Home and RCF Surveys Table 12. Internal Reliability of Domains on Nursing Home and RCF Surveys Domain (RCF responses are in bold) Nursing Home Item- Total Correlation RCF Item- Total Correlation Nursing Home Domain Alpha RCF Domain Alpha Moving In When the resident moved in, were you given thorough information to help you know what to expect? Was the resident given a thorough orientation to the nursing home /RCF? Did you feel warmly welcomed as a new family member? Spending Time Does the resident have something enjoyable to look forward to most days? Do the staff do a good job keeping the resident connected to the community? Does the resident have plenty of opportunities to do things that are meaningful to them? (RCF item only.) Does the residential care facility have enough opportunities for your resident to go on special outings and events? Alpha would improve to.934 if this item dropped 7/8. Does the resident like the provided activities? /9. Does the nursing home/rcf provide things the resident enjoys doing on the weekend? /10. Do you have plenty of opportunities to be involved in the nursing home/rcf? Care and Services (RCF item only.) Does this living arrangement help the resident maintain their independence? (NF item only.) Are the resident s preferences about daily routine carried out (e.g., time and place for meals and time and type of bath)? /12. Do you have enough opportunities for input into decisions about your resident s care? /13. Do you get enough information to make decisions with or about your resident? Alpha would improve to.948 if this item dropped Alpha would improve to.947 if this item dropped 29
39 Domain (RCF responses are in bold) Nursing Home Item- Total Correlation RCF Item- Total Correlation Nursing Home Domain Alpha RCF Domain Alpha Caregivers /14. Do you feel confident the staff is knowledgeable about the resident s medical condition(s) and treatment(s)? /15. Do the staff know what the resident likes and doesn t like? /16. Do the staff regularly check to see if the resident needs anything? Alpha would improve to.934 if this item dropped /17. Have you gotten to know the staff who care for your resident? (RCF item only.) Do the staff encourage your resident to be as independent as they are able to be? /19. Do the staff come quickly (RCF item--do you feel confident the staff would come quickly) anytime your resident needs help? Meals and Dining /20. Is there a lot of variety in the meals? /21. Are you included in mealtimes if you want to be? Alpha would improve to.917 if this item dropped Alpha would improve to.919 if this item dropped /22. Is the food good? Environment /23. Is the nursing home (RCF) thoroughly clean? /24. Can the resident get outside often enough? (NF item only.) Do you have a good place to visit privately? /25. Are the resident s belongings safe? Facility Culture /26. Are you encouraged to speak up when you have a problem? /27. Are your concerns addressed in a timely way? /28. Are you kept well informed about how things are going with your resident? Alpha would improve to.969 if this item dropped 30
40 Domain (RCF responses are in bold) Nursing Home Item- Total Correlation RCF Item- Total Correlation 28/29. Do the staff seem happy to work at the nursing home/rcf? /30. Do the staff go above and beyond to give your resident a good life? /31. Do you feel confident that staff would help your resident beyond their personal care needs if you could not (e.g., things like completing paperwork, purchasing clothing)? /32. Do you have peace of mind about the care your resident is getting when you aren t at the nursing home? /33. Would you highly recommend this nursing home/rcf to a family member or friend? Nursing Home Domain Alpha RCF Domain Alpha Alpha for all nursing home items is.985; RCF is.979. As shown in the previous table, four items on the nursing home survey and three items on the RCF survey could be dropped from their domains to improve the alpha of the domain. Only one Are you included in mealtimes if you want to be? appeared as an item to be dropped from the Meals & Dining domain across both surveys. The item Does this living arrangement help the resident maintain their independence? also shows the lowest item-total correlation of either survey, suggesting it might be considered for elimination from the survey altogether. In general, the few items that might be moved to another domain to improve an existing domain seem reasonable. For example, the item Are you included in mealtimes if you want to be? is conceptually not related to menus and food quality, but says more about how family members are treated by the facilities both nursing homes and RCFs. Additional work on survey items could include confirmatory factor analysis to consider other domain structures. However, the results from these analyses do not suggest an immediate need to make revisions prior to the administration of the resident surveys later this year. Short-Stay Residents One area of continuing interest is the increasing number of short-stay residents in nursing homes. As noted in Table 9, nearly 10% of the nursing home families were responding for residents who were expected to be in the facility less than 90 days. The number of short-stay families in RCFs was slightly over 2%. An analysis of the facilities who failed to meet margin of error indicated that most of those were small facilities and smaller facilities may also be more likely to focus on short-stay sub-acute care. The families of short-stay residents may have less of an interest in providing input about the facility, and they may have different concerns than families 31
41 of long-stay residents. During survey development we heard from families of short-stay residents as well as long-stay, and we also heard provider perspectives about short- and long-stay residents. Issues are in two areas; about whether long- and short-stay residents and families have similar concerns about facilities, and whether the process of surveying short-stay families while their residents are still receiving rehabilitation care at the facility may not truly get at the full short-stay experience. Providers felt that short-stay residents influence facility results in negative ways because their concerns are different, and some suggested that short-stay residents be excluded from the satisfaction surveys altogether. In order to examine what effect, if any, short-stay residents had on nursing home facility outcomes, we undertook two analyses: 1) mean comparisons of individual items for all short- and long-stay families, and analyses of statewide facility means using only long-stay residents. Using t-tests to compare all short-stay families with all long-stay families, we found 27 items out of 32 where long- and short-stay families showed mean item scores that were significantly different. On all of these, the short-stay families had lower scores than long-stay. However, because short-stay residents are distributed across many facilities and represented only 10% of our respondents overall we wondered whether these differences would result in statewide item means based on facility averages. For our second analysis we selected only the long-stay residents and examined statewide items scores and the overall statewide scores. First, we noted that removing short-stay families resulted in a very few facilities not having valid responses on some items. And we noted that the statewide average increased from 77.9 based on all families, to 78.1 based only on long-stay. An examination of the means found that long-stay residents only showed higher statewide averages than averages based on all families, on 27 out of 32 items. On all of the environment items, longstay families showed lower scores. However, these differences are small, with most having a magnitude of about.5 such as 77.9 for all families having peace of mind, compared to a 78.6 average for only long-stay families. Our results suggest that long-stay and short-stay residents show differences that result in different results for the groups as a whole, with short-stay families having significantly lower ratings. However, because the proportion of short-stay families is small across the state they are not influencing statewide scores in any discernable way. Providers and families told us that some of the things that are important are the discharge process, the care set up for someone at home, and the overall time from rehab to discharge. None of these can be assessed with the current satisfaction survey process. STATEWIDE QUALITY One of the reasons for providing consumers with information about nursing homes is to provide an impetus for facilities to improve quality. Consumer satisfaction information, particularly when it is objective and specific as most of the items in the Ohio Nursing Home Family Satisfaction Survey are, also tells facilities where to target their quality improvement efforts. 32
42 Results from previous years had been tracked, with a focus on examining which items were areas of concern for facilities, and which items showed areas of excellence. A score of 75 or less indicated a problem item, while a score of 90 or higher showed an area of excellence. In 2014, three items on the nursing home surveys (activities, taste of the food, getting foods one likes) showed scores of 75 or lower. As shown in Table 13 below, with the new survey items, 15 nursing home items and five RCF items show statewide average scores of 75 or below. Table 13. Priority Areas for Improvement among Nursing Homes and RCFs, 2016 Table 13. Priority Areas for Improvement among Nursing Homes and RCFs, 2016 Domains Items Nursing RCFs Homes Moving In Was the resident given a thorough orientation to the nursing home? 73.3 Spending Time Does the resident have something enjoyable to look forward to most days? 66.9 Do the staff do a good job of keeping the resident connected to the community? 68.5 Does the resident have plenty of opportunities to do things that are meaningful to them? 70.1 Does the resident like the provided activities? Does the nursing home/rcf provide things the resident enjoys doing on the weekend? Caregivers Do the staff regularly check to see if the resident needs anything? 71.8 Do the staff come quickly anytime your resident needs help? 65.7 Meals and Dining Is there a lot of variety in the meals? Is the food good? Environment Can the resident get outside often enough? 68.1 Are the resident s belongings safe? 71.1 Facility Culture Do the staff seem happy to work at the nursing home? 73.3 Do the staff go above and beyond to give your resident a good life? 73.0 Do you feel confident that staff would help your resident beyond their personal care needs if you could not (e.g., things like completing paperwork, purchasing clothing)?
43 As shown on page 33, all of the RCF problem areas are also problems in nursing homes. Some of the problem areas may be intractable for facilities to address; food items have always appeared on the problem lists. Cooking in quantity and producing a variety of tasty foods for people on special diets is notoriously difficult. However, when facilities undertake the culture change process the dining experience is often one of the first modifications made. We might hope that as more facilities offer a wider variety of menu options residents will find choices that they find good food. In 2014, we reported 14 areas of nursing home excellence items with statewide averages of 90 and over. Seven items four of which were being treated with respect by a variety of staff members were included. The current data found only one item with a statewide average of 90 or above in the RCF survey and none among the nursing homes. In an effort to continue to focus on things facilities do well, we lowered the benchmark to 85 and above and report those items in Table 14. Table 14. Areas of Best Performance among Nursing Homes and Residential Care Facilities, 2016 Table 14. Areas of Best Performance among Nursing Homes and Residential Care Facilities, 2016 Domains Items Nursing Homes RCFs Moving In When the resident moved in, were you given thorough information to help you know what to expect? 88.6 Did you feel warmly welcomed as a new family member? Care and Services Does this living arrangement help the resident maintain their independence? (RCF item only.) 87.7 Caregivers Have you gotten to know the staff who care for your resident? 86.5 Do the staff encourage your resident to be as independent as they are able to be? 86.3 Meals and Are you included in mealtimes if you want to be? Dining 88.3 Environment Is the residential care facility thoroughly clean? 86.5 Facility Are you encouraged to speak up when you have a problem? Culture Do you have peace of mind about the care your resident is getting when you aren t at the nursing home/residential care facility? 86.7 TOTALS 2 Areas of Excellence 9 Areas of Excellence 34
44 One of the goals for the revisions to the resident and family facility surveys was to raise the bar for Ohio nursing homes to tap the areas of care that distinguish great facilities from average ones, and poor ones from average. In addition, we wanted to also tap new areas that focused on person-centered practices where facilities may be early in the process of embracing that culture change. It appears that both of these goals were achieved with the new tool. And, we learned from our work with families and residents around tool development that what we are also seeing are increasingly savvy consumers with heightened expectations. Ohio families often have experience with numerous facilities and know what facilities can and should be. The higher performance of residential care facilities in a number of areas shows that institutional settings can provide care that families highly approve of. However, the different resources available and resident characteristics in these two different settings suggest that overall comparisons between the industries would be objectively unfair. MAKING QUALITY IMPROVEMENTS A new feature in the facility reports was a priority index. To calculate the priority index for a facility, we correlated each domain with the item on whether someone would recommend the facility. The domains most highly correlated and having the lowest scores in a facility provide the greatest opportunities for facilities to make improvements. After indicating priority scores for all domains, individual items within each of the top two domains were shown, with the highest scores on each indicating areas of greatest priority for improvement. An example of a facility priority index is shown in Figure 5. 35
45 Figure 5. Priority Index Report Figure 5. Priority Index Report 36
46 RECOMMENDATIONS FOR 2018 The nursing home consumer guide is a work in progress by mandate; aside from work to develop newly revised tools for 2016, the practices and procedures used this year resulted from methods used and improved over the last few years. The lower number of facilities meeting the margin of error and overall statewide response rate reductions cause some concern and suggest some additional ideas for improvements. 1. Continue to use mailings from ODA to prepare facilities for survey participation in advance of survey implementation dates. Include promotional materials such as high-quality posters, pre-printed bill stuffers, news releases, or other materials to encourage family participation. Consider a statewide ad campaign or public service announcements directly to families to encourage them to participate. 2. Continue to use advance notices from ODA regarding preparation for family list compilation and list uploads. 3. Work with trade associations to place reminders in their regular newsletters and e- newsletters. Facilities that have not received a request for family list submission should be alerted to timing for survey participation. 4. Reinforce confidentiality issues in the cover letter to families stating that no one at the nursing home or the residential care facility will ever see individual results. 5. Encourage short-term families and families who are not knowledgeable about certain issues to complete as much of the survey as possible. 6. Interview administrators from facilities with high response rates and create a list of Best Practices to Encourage Family Participation. 7. Continue the use of the Family Survey web page for facilities and families on the ODA web site. This would increase the transparency of the process and encourage facilities and families who have questions about the process to participate. 8. Begin the survey process earlier in the calendar year to take advantage of student availability beginning in May for survey support. 9. Provide ODA with lists of facilities with no surveys from first three batches beginning in August, and facilities with no surveys from all batches in September. 10. Add the number of duplicates removed from the family lists to ensure an accurate number of involved families and friends to use for margin of error. 11. Explore strategies to assist smaller facilities in meeting margin of error. 12. Continue to explore scoring changes that provide a valid description that will be accurately interpreted by facilities and families. 37
47 CONCLUSIONS This report on the eighth family survey implementation provides guidance for further refinements to the family satisfaction survey process in future years. Ohio leads the nation in providing the most comprehensive consumer satisfaction information about nursing homes and residential care facilities. Work conducted with Ohio s data in relationship to Nursing Home Compare has illustrated the importance of family and resident information as a distinct aspect of overall facility quality (Williams, Straker, and Applebaum, 2015). We continue to implement a rigorous survey process that results in robust survey data for important consumer decision-making and quality improvement by facilities. 38
48 REFERENCES George, D., & Mallery, P. (2003). SPSS for Windows step by step: A simple guide and reference update (4 th ed.) Boston: Allyn & Bacon. Gliem, J. A., & Gliem, R. R. (2003). Calculating, Interpreting, and Reporting Cronbach s Alpha Reliability Coefficient for Likert-Type Scales. Midwest Research to Practice Conference in Adult, Continuing, and Community Education. Columbus, OH. Noble, R., Bailer, A. J., Kunkel, S. R., & Straker, J. K. (2006). Sample size requirements for studying small populations in gerontology research. Health Services and Outcomes Research Methodology, 6, Straker, J. K., McGrew, K. B., Dibert, J. L., Burch, C. E., & Raymore, A. N. (2016). Ohio s Nursing Home and Residential Care Facility Satisfaction: Survey Testing and Development for Residents and Families. Oxford, OH: Scripps Gerontology Center, Miami University. Williams, A., Straker, J. K., & Applebaum, R. (2016). The nursing home five-star rating: How does it compare to resident and family views of care? The Gerontologist, 56(2), doi: /geront/gnu04. 39
49 APPENDIX A FAMILY SURVEY FORMS AND INSTRUCTIONS 40
50
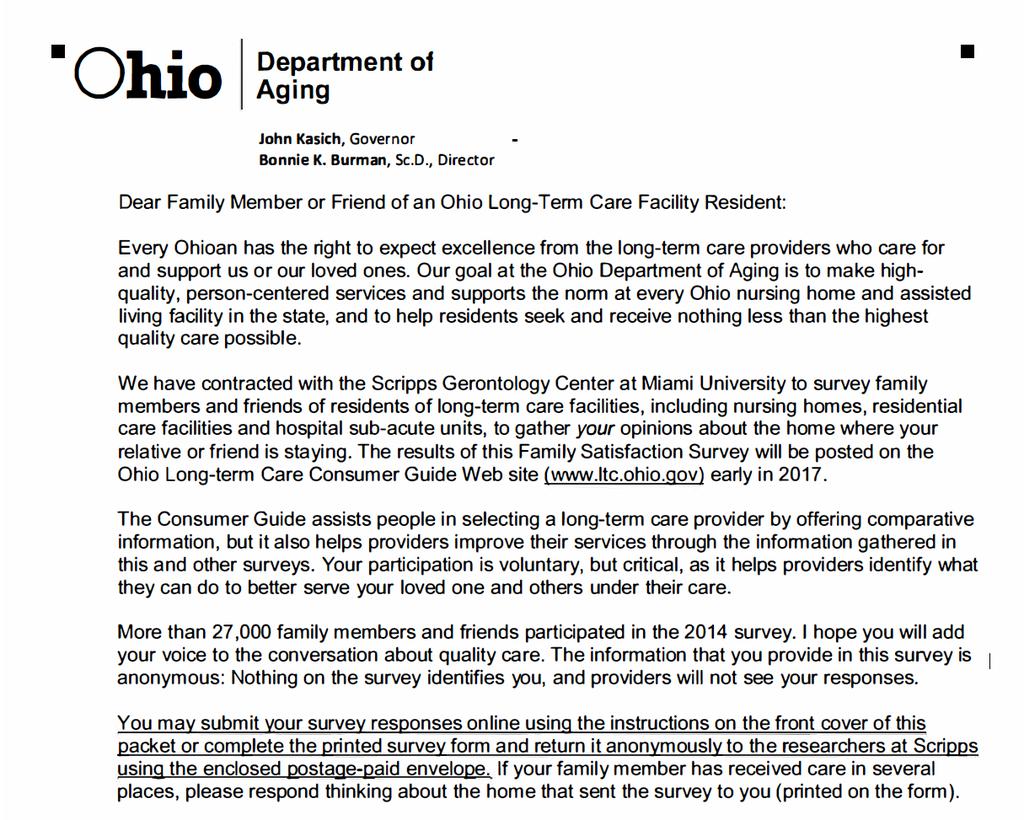
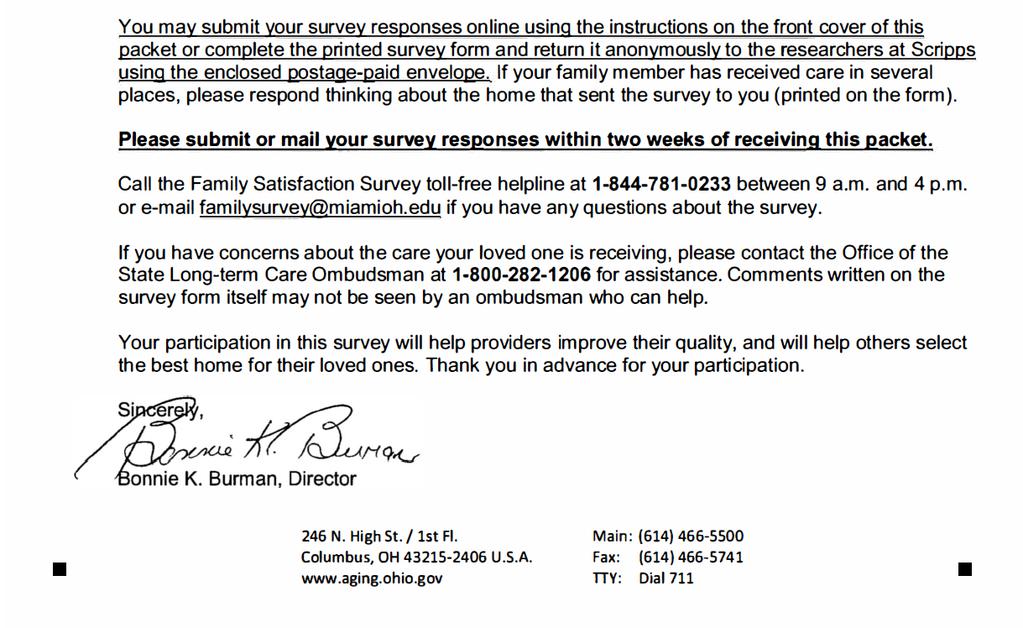
51
52
53
54
55
56
57
58 APPENDIX B FACILITY LIST INSTRUCTIONS 41
59
60
Nursing Home Resident Satisfaction Survey 2017 Final Results ASHTABULA COUNTY NURSING AND REHABILITATION CENTER
 DOMAIN SATISFACTION SCORE HIGH TO LOW The Ohio Department of Aging and the Office of the State Long-Term Care Ombudsman conduct a biennial satisfaction survey of residents in long-term care facilities
Oklahoma Health Care Authority. ECHO Adult Behavioral Health Survey For SoonerCare Choice
 Oklahoma Health Care Authority ECHO Adult Behavioral Health Survey For SoonerCare Choice Executive Summary and Technical Specifications Report for Report Submitted June 2009 Submitted by: APS Healthcare
A REVIEW OF NURSING HOME RESIDENT CHARACTERISTICS IN OHIO: TRACKING CHANGES FROM
 A REVIEW OF NURSING HOME RESIDENT CHARACTERISTICS IN OHIO: TRACKING CHANGES FROM 1994-2004 Shahla Mehdizadeh Robert Applebaum Scripps Gerontology Center Miami University March 2005 This report was funded
Ohio s Nursing Home and Residential Care Facility Satisfaction: Survey Testing and Development for Residents and Families
 Ohio s Nursing Home and Residential Care Facility Satisfaction: Survey Testing and Development for Residents and Families JANE K. STRAKER, KATHRYN MCGREW, JENNIFER DIBERT, CANDACE BURCH, & AVIELLE RAYMORE
Licensed Nurses in Florida: Trends and Longitudinal Analysis
 Licensed Nurses in Florida: 2007-2009 Trends and Longitudinal Analysis March 2009 Addressing Nurse Workforce Issues for the Health of Florida www.flcenterfornursing.org March 2009 2007-2009 Licensure Trends
An Overview of Ohio s In-Home Service Program For Older People (PASSPORT)
") An Overview of Ohio s In-Home Service Program For Older People (PASSPORT) Shahla Mehdizadeh Robert Applebaum Scripps Gerontology Center Miami University May 2005 This report was produced by Lisa Grant
An Overview of Ohio s In-Home Service Program For Older People (PASSPORT) Shahla Mehdizadeh Robert Applebaum Scripps Gerontology Center Miami University May 2005 This report was produced by Lisa Grant
2016 REPORT Community Care for the Elderly (CCE) Client Satisfaction Survey
 Client Satisfaction Survey") 2016 REPORT Community Care for the Elderly (CCE) Client Satisfaction Survey Program Services, Direct Service Workers, and Impact of Program on Lives of Clients i Florida Department of Elder Affairs, 2016
2016 REPORT Community Care for the Elderly (CCE) Client Satisfaction Survey Program Services, Direct Service Workers, and Impact of Program on Lives of Clients i Florida Department of Elder Affairs, 2016
2017 National NHS staff survey. Results from The Newcastle Upon Tyne Hospitals NHS Foundation Trust
 2017 National NHS staff survey Results from The Newcastle Upon Tyne Hospitals NHS Foundation Trust Table of Contents 1: Introduction to this report 3 2: Overall indicator of staff engagement for The Newcastle
Participant Satisfaction Survey Summary Report Fiscal Year 2012
 Participant Satisfaction Survey Summary Report Fiscal Year 2012 Prepared by: SPEC Associates Detroit, Michigan www.specassociates.org Introduction Since 2003, Area Agency on Aging 1-B (AAA 1-B) 1 has been
2016 National NHS staff survey. Results from Wirral University Teaching Hospital NHS Foundation Trust
 2016 National NHS staff survey Results from Wirral University Teaching Hospital NHS Foundation Trust Table of Contents 1: Introduction to this report 3 2: Overall indicator of staff engagement for Wirral
Health and Long-Term Care Use Patterns for Ohio s Dual Eligible Population Experiencing Chronic Disability
 Health and Long-Term Care Use Patterns for Ohio s Dual Eligible Population Experiencing Chronic Disability Shahla A. Mehdizadeh, Ph.D. 1 Robert A. Applebaum, Ph.D. 2 Gregg Warshaw, M.D. 3 Jane K. Straker,
Fleet and Marine Corps Health Risk Assessment, 02 January December 31, 2015
 Fleet and Marine Corps Health Risk Assessment, 02 January December 31, 2015 Executive Summary The Fleet and Marine Corps Health Risk Appraisal is a 22-question anonymous self-assessment of the most common
2011 National NHS staff survey. Results from London Ambulance Service NHS Trust
 2011 National NHS staff survey Results from London Ambulance Service NHS Trust Table of Contents 1: Introduction to this report 3 2: Overall indicator of staff engagement for London Ambulance Service NHS
2016 National NHS staff survey. Results from Surrey And Sussex Healthcare NHS Trust
 2016 National NHS staff survey Results from Surrey And Sussex Healthcare NHS Trust Table of Contents 1: Introduction to this report 3 2: Overall indicator of staff engagement for Surrey And Sussex Healthcare
Research Brief IUPUI Staff Survey. June 2000 Indiana University-Purdue University Indianapolis Vol. 7, No. 1
 Research Brief 1999 IUPUI Staff Survey June 2000 Indiana University-Purdue University Indianapolis Vol. 7, No. 1 Introduction This edition of Research Brief summarizes the results of the second IUPUI Staff
2017 National NHS staff survey. Results from Dorset County Hospital NHS Foundation Trust
 2017 National NHS staff survey Results from Dorset County Hospital NHS Foundation Trust Table of Contents 1: Introduction to this report 3 2: Overall indicator of staff engagement for Dorset County Hospital
South Carolina Nursing Education Programs August, 2015 July 2016
 South Carolina Nursing Education Programs August, 2015 July 2016 Acknowledgments This document was produced by the South Carolina Office for Healthcare Workforce in the South Carolina Area Health Education
Contents. Page 1 of 42
 Contents Using PIMS to Provide Evidence of Compliance... 3 Tips for Monitoring PIMS Data Related to Standard... 3 Example 1 PIMS02: Total numbers of screens by referral source... 4 Example 2 Custom Report
2017 National NHS staff survey. Results from London North West Healthcare NHS Trust
 2017 National NHS staff survey Results from London North West Healthcare NHS Trust Table of Contents 1: Introduction to this report 3 2: Overall indicator of staff engagement for London North West Healthcare
NursingCAS Learning & Networking Day
 Welcome San Diego, CA University of San Diego July 26, 2016 Presenters: Caroline Allen, NursingCAS Director, the American Association of Colleges of Nursing Ann Donnelly, Account Management Director for
Employee Telecommuting Study
 Employee Telecommuting Study June Prepared For: Valley Metro Valley Metro Employee Telecommuting Study Page i Table of Contents Section: Page #: Executive Summary and Conclusions... iii I. Introduction...
CITY OF GRANTS PASS SURVEY
 CITY OF GRANTS PASS SURVEY by Stephen M. Johnson OCTOBER 1998 OREGON SURVEY RESEARCH LABORATORY UNIVERSITY OF OREGON EUGENE OR 97403-5245 541-346-0824 fax: 541-346-5026 Internet: OSRL@OREGON.UOREGON.EDU
National Patient Safety Foundation at the AMA
 National Patient Safety Foundation at the AMA National Patient Safety Foundation at the AMA Public Opinion of Patient Safety Issues Research Findings Prepared for: National Patient Safety Foundation at
Charlotte Banks Staff Involvement Lead. Stage 1 only (no negative impacts identified) Stage 2 recommended (negative impacts identified)
 Stage 2 recommended (negative impacts identified)") Paper Recommendation DECISION NOTE Reporting to: Trust Board are asked to note the contents of the Trusts NHS Staff Survey 2017/18 Results and support. Trust Board Date 29 March 2018 Paper Title NHS Staff
Paper Recommendation DECISION NOTE Reporting to: Trust Board are asked to note the contents of the Trusts NHS Staff Survey 2017/18 Results and support. Trust Board Date 29 March 2018 Paper Title NHS Staff
2017 National NHS staff survey. Results from Nottingham University Hospitals NHS Trust
 2017 National NHS staff survey Results from Nottingham University Hospitals NHS Trust Table of Contents 1: Introduction to this report 3 2: Overall indicator of staff engagement for Nottingham University
KY Kids Recovery Program (KKRP) and AHARTT Client Information System
 and AHARTT Client Information System") KY Kids Recovery Program (KKRP) and AHARTT Client Information System A Collaboration between the Department for Behavioral Health, Developmental and Intellectual Disabilities, the University of Kentucky
KY Kids Recovery Program (KKRP) and AHARTT Client Information System A Collaboration between the Department for Behavioral Health, Developmental and Intellectual Disabilities, the University of Kentucky
2017 National NHS staff survey. Results from Salford Royal NHS Foundation Trust
 2017 National NHS staff survey Results from Salford Royal NHS Foundation Trust Table of Contents 1: Introduction to this report 3 2: Overall indicator of staff engagement for Salford Royal NHS Foundation
Transforming Data Into Practical Information: Using Consumer Input to Improve Home-Care Services
 The Gerontologist Vol. 47, No. 1, 116 122 PRACTICE CONCEPTS Copyright 2007 by The Gerontological Society of America Transforming Data Into Practical Information: Using Consumer Input to Improve Home-Care
Impact of OK AuthentiCare Electronic Visit Verification (EVV) on ADvantage Program Budget
 on ADvantage Program Budget") Impact of OK AuthentiCare Electronic Visit Verification (EVV) on ADvantage Program Budget May 1, 2013 Prepared by: Michael Lester, Ph.D. LTCA of Enid Consultant The preparation of this Report was financed
Impact of OK AuthentiCare Electronic Visit Verification (EVV) on ADvantage Program Budget May 1, 2013 Prepared by: Michael Lester, Ph.D. LTCA of Enid Consultant The preparation of this Report was financed
Quality Management Building Blocks
 Quality Management Building Blocks Quality Management A way of doing business that ensures continuous improvement of products and services to achieve better performance. (General Definition) Quality Management
A Comparison of Job Responsibility and Activities between Registered Dietitians with a Bachelor's Degree and Those with a Master's Degree
 Florida International University FIU Digital Commons FIU Electronic Theses and Dissertations University Graduate School 11-17-2010 A Comparison of Job Responsibility and Activities between Registered Dietitians
FY 2017 Continuum of Care Priority Listing
 FY 2017 Continuum of Care Priority Listing e-snaps Instructional Guide Version 1 Table of Contents Introduction... 1 Objectives... 2 Overview of this Instructional Guide... 2 Highlights in e-snaps in FY
Maximizing the Power of Your Data. Peggy Connorton, MS, LNFA AHCA Director, Quality and LTC Trend Tracker
 Maximizing the Power of Your Data Peggy Connorton, MS, LNFA AHCA Director, Quality and LTC Trend Tracker Objectives Explore selected LTC Trend Tracker reports & features including: re-hospitalization,
HEALTH WORKFORCE SUPPLY AND REQUIREMENTS PROJECTION MODELS. World Health Organization Div. of Health Systems 1211 Geneva 27, Switzerland
 HEALTH WORKFORCE SUPPLY AND REQUIREMENTS PROJECTION MODELS World Health Organization Div. of Health Systems 1211 Geneva 27, Switzerland The World Health Organization has long given priority to the careful
SUMMARY REPORT TRUST BOARD IN PUBLIC 3 May 2018 Agenda Number: 9
 SUMMARY REPORT TRUST BOARD IN PUBLIC 3 May 2018 Agenda Number: 9 Title of Report Accountable Officer Author(s) Purpose of Report Recommendation Consultation Undertaken to Date Signed off by Executive Owner
2017 National NHS staff survey. Results from Royal Cornwall Hospitals NHS Trust
 2017 National NHS staff survey Results from Royal Cornwall Hospitals NHS Trust Table of Contents 1: Introduction to this report 3 2: Overall indicator of staff engagement for Royal Cornwall Hospitals NHS
2017 National NHS staff survey. Results from North West Boroughs Healthcare NHS Foundation Trust
 2017 National NHS staff survey Results from North West Boroughs Healthcare NHS Foundation Trust Table of Contents 1: Introduction to this report 3 2: Overall indicator of staff engagement for North West
2017 National NHS staff survey. Results from Oxleas NHS Foundation Trust
 2017 National NHS staff survey Results from Oxleas NHS Foundation Trust Table of Contents 1: Introduction to this report 3 2: Overall indicator of staff engagement for Oxleas NHS Foundation Trust 5 3:
Community Care Statistics : Referrals, Assessments and Packages of Care for Adults, England
 Community Care Statistics 2006-07: Referrals, Assessments and Packages of Care for Adults, England 1 Report of the 2006-07 RAP Collection England, 1 April 2006 to 31 March 2007 Editor: Associate Editors:
Development and Testing of a Resident Satisfaction Survey for Ohio s Residential Care Facilities:
 Development and Testing of a Resident Satisfaction Survey for Ohio s Residential Care Facilities: Final Report Jane K. Straker 1, Jessie A. Leek 1, Kathryn B. McGrew 1, Farida K. Ejaz 2, and Brenda Peters
Prepared for North Gunther Hospital Medicare ID August 06, 2012
 Prepared for North Gunther Hospital Medicare ID 000001 August 06, 2012 TABLE OF CONTENTS Introduction: Benchmarking Your Hospital 3 Section 1: Hospital Operating Costs 5 Section 2: Margins 10 Section 3:
System Performance Measures:
 April 2017 Version 2.0 System Performance Measures: FY 2016 (10/1/2015-9/30/2016) Data Submission Guidance CONTENTS 1. Purpose of this Guidance... 3 2. The HUD Homelessness Data Exchange (HDX)... 5 Create
Nursing and Personal Care: Funding Increase Survey
 Nursing and Personal Care: Funding Increase Survey Prepared for: Ministry of Health and Long-Term Care Long Term Care Facilities Branch 5 th Floor, Hepburn Block 80 Grosvenor Street Toronto, Ontario Prepared
Instructions for Application Submission Sylvia Lawry Physician Fellowship
 Instructions for Application Submission Sylvia Lawry Physician Fellowship INTRODUCTION Please read these instructions and follow them carefully. Applications that are incomplete exceed the page limitations,
2018 AANS Annual Scientific Meeting Abstract Instructions
 1. Visit MyAANS and login. Enter in your user ID and password. If you forgot your user ID and/or password, please use the Login Help link. 2. Click the My Meetings icon for the dropdown box, and select
Employers are essential partners in monitoring the practice
 Innovation Canadian Nursing Supervisors Perceptions of Monitoring Discipline Orders: Opportunities for Regulator- Employer Collaboration Farah Ismail, MScN, LLB, RN, FRE, and Sean P. Clarke, PhD, RN, FAAN
The Centers for Medicare & Medicaid Services (CMS) strives to make information available to all. Nevertheless, portions of our files including
 strives to make information available to all. Nevertheless, portions of our files including") The Centers for Medicare & Medicaid Services (CMS) strives to make information available to all. Nevertheless, portions of our files including charts, tables, and graphics may be difficult to read using
The Centers for Medicare & Medicaid Services (CMS) strives to make information available to all. Nevertheless, portions of our files including charts, tables, and graphics may be difficult to read using
National Cancer Patient Experience Survey National Results Summary
 National Cancer Patient Experience Survey 2016 National Results Summary Index 4 Executive Summary 8 Methodology 9 Response rates and confidence intervals 10 Comparisons with previous years 11 This report
RETRIEVAL AND CRITICAL HEALTH INFORMATION SYSTEM
 RETRIEVAL AND CRITICAL HEALTH INFORMATION SYSTEM USER GUIDE November 2014 Contents Introduction... 4 Access to REACH... 4 Homepage... 4 Roles within REACH... 5 Hospital Administrator... 5 Hospital User...
Uniform Data System for Medical Rehabilitation
 Uniform Data System for Medical Rehabilitation 270 Northpointe Parkway, Suite 300, Amherst, New York 14228 tel: 716-817-7800 fax: 716-568-0037 The Functional Assessment Specialists UDSMR Credentialing
Patient survey report Mental health acute inpatient service users survey gether NHS Foundation Trust
 Patient survey report 2009 Mental health acute inpatient service users survey 2009 The mental health acute inpatient service users survey 2009 was coordinated by the mental health survey coordination centre
The HIPAA privacy rule and long-term care : a quick guide for researchers
 Scripps Gerontology Center Scripps Gerontology Center Publications Miami University Year 2005 The HIPAA privacy rule and long-term care : a quick guide for researchers Jane Straker Patricia Faust Miami
Instructions for Submission: Pilot Grant Applications National Multiple Sclerosis Society 2018
 Instructions for Submission: Pilot Grant Applications National Multiple Sclerosis Society 2018 INTRODUCTION Please read these instructions and follow them carefully. Applications that are incomplete, exceed
Patient survey report Survey of adult inpatients in the NHS 2010 Yeovil District Hospital NHS Foundation Trust
 Patient survey report 2010 Survey of adult inpatients in the NHS 2010 The national survey of adult inpatients in the NHS 2010 was designed, developed and co-ordinated by the Co-ordination Centre for the
CACFP : Conducting Five-Day Reconciliation in the Child and Adult Care Food Program, with Questions and Answers
 Food and Nutrition Service Park Office Center 3101 Park Center Drive Alexandria VA 22302 DATE: April 4, 2018 SUBJECT: TO: : Conducting Five-Day Reconciliation in the Child and Adult Care Food Program,
Integrated Urgent Care Minimum Data Set Specification Version 1.0
 Integrated Urgent Care Minimum Data Set Specification Version 1.0 1. Document control Audience Document Title Document Status Integrated Urgent Care and NHS 111 service providers and commissioners Integrated
Summary Report of Findings and Recommendations
 Patient Experience Survey Study of Equivalency: Comparison of CG- CAHPS Visit Questions Added to the CG-CAHPS PCMH Survey Summary Report of Findings and Recommendations Submitted to: Minnesota Department
General Practice Extended Access: September 2017
 General Practice Extended Access: September 2017 General Practice Extended Access September 2017 Version number: 1.0 First published: 31 October 2017 Prepared by: Hassan Ismail, NHS England Analytical
Overview What is effort? What is effort reporting? Why is Effort Reporting necessary?... 2
 Effort Certification Training Guide Contents Overview... 2 What is effort?... 2 What is effort reporting?... 2 Why is Effort Reporting necessary?... 2 Effort Certification Process: More than just Certification...
Teacher Guide to the Florida Department of Education Roster Verification Tool
 Teacher Guide to the 2016-17 Florida Department of Education Roster Verification Tool Table of Contents Overview... 1 Timeline... 1 Contact and Help Desk... 1 Teacher Login Instructions... 2 Teacher Review,
User Guide OCHA August 2011
 ONLINE PROJECTS SYSTEM for Consolidated and Flash Appeals User Guide OCHA August 2011 http://ops.unocha.org 1 TABLE OF CONTENTS 1. WHAT IS OPS? 2 1.1 WHO CAN ACCESS OPS?... 3 1.2 WHAT CAN YOU DO IN OPS?...
Instructions for Submission: Research Grant Applications National Multiple Sclerosis Society 2018
 Instructions for Submission: Research Grant Applications National Multiple Sclerosis Society 2018 INTRODUCTION Please read these instructions and follow them carefully. Applications that are incomplete
2016 Survey of Michigan Nurses
 2016 Survey of Michigan Nurses Survey Summary Report November 15, 2016 Office of Nursing Policy Michigan Department of Health and Human Services Prepared by the Michigan Public Health Institute Table of
The adult social care sector and workforce in. North East
 The adult social care sector and workforce in 2015 Published by Skills for Care, West Gate, 6 Grace Street, Leeds LS1 2RP www.skillsforcare.org.uk Skills for Care 2016 Copies of this work may be made for
Appendix A Registered Nurse Nonresponse Analyses and Sample Weighting
 Appendix A Registered Nurse Nonresponse Analyses and Sample Weighting A formal nonresponse bias analysis was conducted following the close of the survey. Although response rates are a valuable indicator
Physiotherapy outpatient services survey 2012
 14 Bedford Row, London WC1R 4ED Tel +44 (0)20 7306 6666 Web www.csp.org.uk Physiotherapy outpatient services survey 2012 reference PD103 issuing function Practice and Development date of issue March 2013
Chapter 12 Waiting List
 Chapter 12 Waiting List Table of Contents Revision History------------------------------------------------------------------------------------------------ 12-1 Substance Abuse Waiting List Information-----------------------------------------------------------
2019 AANS Annual Scientific Meeting Abstract Instructions
 Visit MyAANS and login. Login Enter in your user ID and password. If you forgot your user ID and/or password, please use the Login Help link. Do not create another account if you cannot remember your password.
National Inpatient Survey. Director of Nursing and Quality
 Reporting to: Title Sponsoring Director Trust Board National Inpatient Survey Director of Nursing and Quality Paper 6 Author(s) Sarah Bloomfield, Director of Nursing and Quality, Sally Allen, Clinical
Surveyors Ombudsman Service. Customer Satisfaction 2010
 Surveyors Ombudsman Service Customer Satisfaction 00 A Research Report For Prepared By DJS Research Ltd July 00 Prepared by: James Hinde, Research Director T: 066 7 7; E: jhinde@djsresearch.com http://www.djsresearch.com/
Patient survey report Survey of people who use community mental health services Boroughs Partnership NHS Foundation Trust
 Patient survey report 2013 Survey of people who use community mental health services 2013 The survey of people who use community mental health services 2013 was designed, developed and co-ordinated by
HOSPITAL SURVEY ON PATIENT SAFETY CULTURE
 HOSPITAL SURVEY ON PATIENT SAFETY CULTURE USER S GUIDE PATIENT SAFETY AHRQ Hospital Survey on Patient Safety Culture: User s Guide Prepared for: Agency for Healthcare Research and Quality U.S. Department
Patient survey report Survey of adult inpatients 2016 Chesterfield Royal Hospital NHS Foundation Trust
 Patient survey report 2016 Survey of adult inpatients 2016 NHS patient survey programme Survey of adult inpatients 2016 The Care Quality Commission The Care Quality Commission is the independent regulator
RETRIEVAL AND CRITICAL HEALTH INFORMATION SYSTEM
 RETRIEVAL AND CRITICAL HEALTH INFORMATION SYSTEM USER GUIDE May 2017 Contents Introduction... 3 Access to REACH... 3 Homepage... 3 Roles within REACH... 4 Hospital Administrator... 4 Hospital User... 4
LONDON COMMUNITY GRANTS. Online Application Guide
 LONDON COMMUNITY GRANTS 2017 Online Application Guide This application guide is intended to be used with ALL streams of the London Community Grants Program. Pictures shown in this guide are from the Multi-Year
FY 2016 PERFORMANCE PLAN
 Walter Reed Adult Day Health Care Center ADSD Michael DiGeronimo x0965 Program Purpose Program Information Improve the quality of life for adults with age-related or developmental disabilities and their
New Jersey s Single Entry Program NJ EASE: A Survey of Callers
 The Institute for Health, Health Care Policy and Aging Research New Jersey s Single Entry Program NJ EASE: A Survey of Callers Sandra Howell-White, Ph.D. Winifred V. Quinn, M.A. September 2005 New Jersey
Long-Term Care in Ohio: A Longitudinal Perspective
 Long-Term Care in Ohio: A Longitudinal Perspective Robert Applebaum Shahla Mehdizadeh Scripps Gerontology Center Miami University September 1, 2001 SGC0076 Background A well known principle of today s
Survey of people who use community mental health services Leicestershire Partnership NHS Trust
 Survey of people who use community mental health services 2017 Survey of people who use community mental health services 2017 National NHS patient survey programme Survey of people who use community mental
State Policy in Practice
 July 2005 State Policy in Practice Community Living Exchange Funded by Centers for Medicare & Medicaid Services (CMS) South Carolina s Care Call Susan Reinhard Ann Bemis This document was prepared by Susan
Patient survey report Survey of adult inpatients in the NHS 2009 Airedale NHS Trust
 Patient survey report 2009 Survey of adult inpatients in the NHS 2009 The national survey of adult inpatients in the NHS 2009 was designed, developed and co-ordinated by the Acute Surveys Co-ordination
PEONIES Member Interviews. State Fiscal Year 2012 FINAL REPORT
 PEONIES Member Interviews State Fiscal Year 2012 FINAL REPORT Report prepared for the Wisconsin Department of Health Services Office of Family Care Expansion by Sara Karon, PhD, PEONIES Project Director
PELI PAL Card Project Training. Katy Abbott, Alex Heppner, Morgan Liddic
 PELI PAL Card Project Training Katy Abbott, Alex Heppner, Morgan Liddic Agenda Introductions Overview PAL Card Project Review Project Checklist Q&A Communicating Resident Preferences We have heard from
Patient survey report Inpatient survey 2008 Royal Devon and Exeter NHS Foundation Trust
 Patient survey report 2008 Inpatient survey 2008 Royal Devon and Exeter NHS Foundation Trust The national Inpatient survey 2008 was designed, developed and co-ordinated by the Acute Surveys Co-ordination
Robert Applebaum Valerie Wellin Cary Kart J. Scott Brown Heather Menne Farida Ejaz Keren Brown Wilson. Miami University Oxford, Ohio
 EVALUATION OF OHIO S ASSISTED LIVING MEDICAID WAIVER PROGRAM: FINAL SUMMARY REPORT Robert Applebaum Valerie Wellin Cary Kart J. Scott Brown Heather Menne Farida Ejaz Keren Brown Wilson Miami University
Housing with Services
 Housing with Services Housing with Services A joint handbook of the Minnesota Board on Aging and the Office of Ombudsman for Long-Term Care 1 Table of Contents Overview of Housing with Services... 1 HWS
2017 Family Satisfaction Survey Aldaview Services. Prepared by: Geetha Van den Daele & Lynn Dare
 2017 Family Satisfaction Survey Aldaview Services Prepared by: Geetha Van den Daele & Lynn Dare Table of Contents Table of Figures... 3 Introduction... 4 Methodology... 4 Respondents Profile... 4 Key Findings...
The Criminal Justice Information System at the Department of Public Safety and the Texas Department of Criminal Justice. May 2016 Report No.
 An Audit Report on The Criminal Justice Information System at the Department of Public Safety and the Texas Department of Criminal Justice Report No. 16-025 State Auditor s Office reports are available
Homelessness Prevention & Rapid Re-Housing Program (HPRP) Quarterly Performance Reporting Updated April 2010
 Quarterly Performance Reporting Updated April 2010") Homelessness Prevention & Rapid Re-Housing Program (HPRP) Quarterly Performance Reporting Updated April 2010 Version 3.0 Table of Contents Introduction... 1 Module Objectives... 1 HPRP Quarterly Reporting
Homelessness Prevention & Rapid Re-Housing Program (HPRP) Quarterly Performance Reporting Updated April 2010 Version 3.0 Table of Contents Introduction... 1 Module Objectives... 1 HPRP Quarterly Reporting
Catalogue no G. Guide to Job Vacancy Statistics
 Catalogue no. 72-210-G Guide to Job Vacancy Statistics 2015 How to obtain more information For information about this product or the wide range of services and data available from Statistics Canada, visit
A Qualitative Study of Master Patient Index (MPI) Record Challenges from Health Information Management Professionals Perspectives
 Record Challenges from Health Information Management Professionals Perspectives") A Qualitative Study of Master Patient Index (MPI) Record Challenges from Health Information Management Professionals Perspectives by Joe Lintz, MS, RHIA Abstract This study aimed gain a better understanding
A Qualitative Study of Master Patient Index (MPI) Record Challenges from Health Information Management Professionals Perspectives by Joe Lintz, MS, RHIA Abstract This study aimed gain a better understanding
Instructions for Application Submission National MS Society-American Brain Foundation (ABF) Clinician Scientist Development Award
 Clinician Scientist Development Award") Instructions for Application Submission National MS Society-American Brain Foundation (ABF) Clinician Scientist Development Award INTRODUCTION Please read these instructions and follow them carefully.
Instructions for Application Submission National MS Society-American Brain Foundation (ABF) Clinician Scientist Development Award INTRODUCTION Please read these instructions and follow them carefully.
Survey of Nurses 2015
 Survey of Nurses 2015 Prepared by Public Sector Consultants Inc. Lansing, Michigan www.pscinc.com There are an estimated... 104,351 &17,559 LPNs RNs onehundredfourteenthousdfourhundredtwentyregisterednursesactiveinmichigan
Sheffield. Juventa 4 Care Ltd. Overall rating for this service. Inspection report. Ratings. Good
 Juventa 4 Care Ltd Sheffield Inspection report 26 Halsall Drive Sheffield South Yorkshire S9 4JD Tel: 07908635025 Date of inspection visit: 15 September 2017 18 September 2017 Date of publication: 11 October
Valley Metro TDM Survey Results Spring for
 Valley Metro TDM Survey Results 2017 Spring 2017 for P a g e ii Table of Contents Section: Page #: Executive Summary... iv Conclusions... viii I. Introduction... 1 A. Background and Methodology... 1 B.
System of Records Notice (SORN) Checklist
 Checklist") System of Records Notice (SORN) Checklist Do not use any tabs, bolding, underscoring, or italicization in the system of records notice submissions to the Defense Privacy Office. Use this as a checklist
System of Records Notice (SORN) Checklist Do not use any tabs, bolding, underscoring, or italicization in the system of records notice submissions to the Defense Privacy Office. Use this as a checklist
Rapid Recovery Therapy Program. GTA Rehab Network Best Practices Day 2017 Joan DeBruyn & Helen Janzen
 Rapid Recovery Therapy Program GTA Rehab Network Best Practices Day 2017 Joan DeBruyn & Helen Janzen $1 Million Photo credit: Physi-med.org Agenda About the Program Description of the Rapid Recovery Therapy
Department of Health. Managing NHS hospital consultants. Findings from the NAO survey of NHS consultants
 Department of Health Managing NHS hospital consultants Findings from the NAO survey of NHS consultants FEBRUARY 2013 Contents Introduction 4 Part One 5 Survey methodology 5 Part Two 9 Consultant survey
Psychiatric Consultant Guide CMTS. Care Management Tracking System. University of Washington aims.uw.edu
 Psychiatric Consultant Guide CMTS Care Management Tracking System University of Washington aims.uw.edu rev. 8/13/2018 Table of Contents TOP TIPS & TRICKS... 1 INTRODUCTION... 2 PSYCHIATRIC CONSULTANT ACCOUNT
EFFICIENCY MAINE TRUST REQUEST FOR PROPOSALS FOR TECHNICAL SERVICES TO DEVELOP A SPREADSHEET TOOL
 EFFICIENCY MAINE TRUST REQUEST FOR PROPOSALS FOR TECHNICAL SERVICES TO DEVELOP A SPREADSHEET TOOL RFP EM-007-2018 Date Issued: January 31,2017 Closing Date: February 16, 2018-3:00 pm local time TABLE OF