Net Promoter - Ward Breakdown - March Feb - 2 Ward
|
|
|
- Jade Pitts
- 6 years ago
- Views:
Transcription
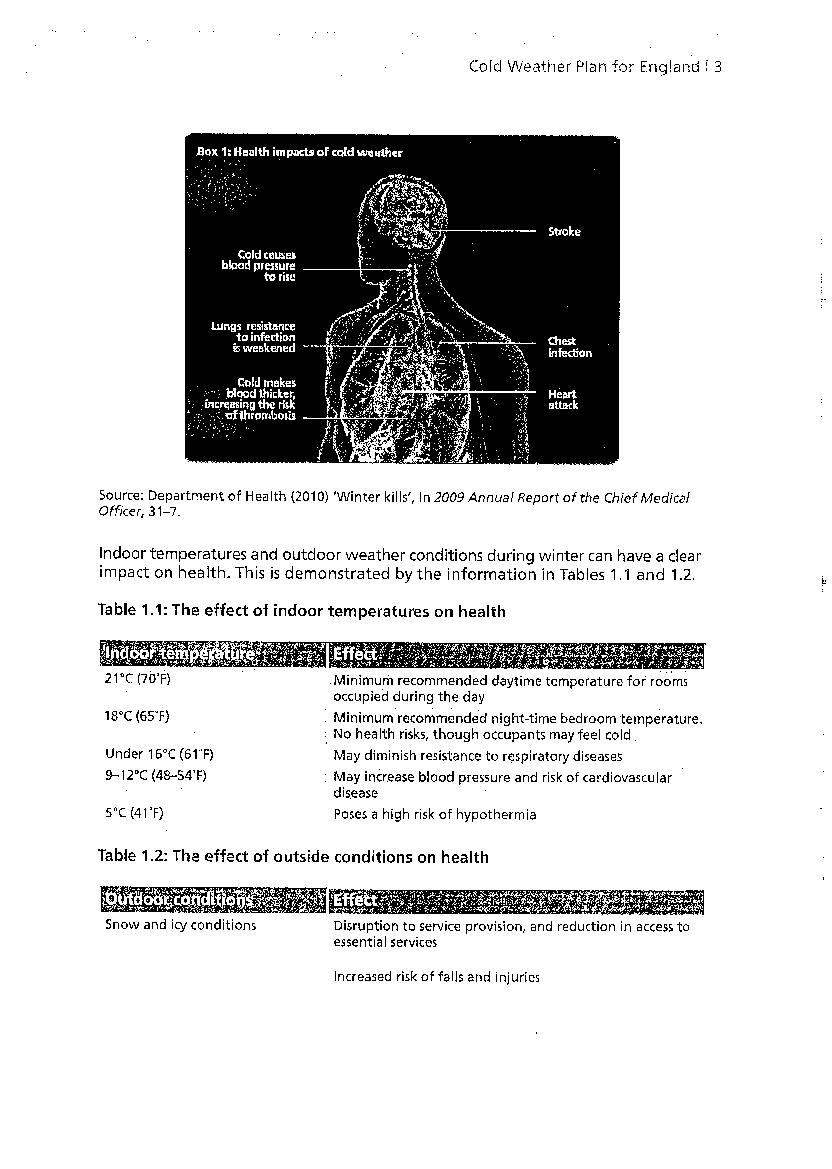
1 Net Promoter - Ward Breakdown - March Feb - 2 Ward 3-9 Mar 1-16 Mar Mar TOTAL Mar Surgery Medicine Women's CSS Cancer APPENDIX Princes Princes Codicote A B BN A B BN ITU/HDU SURGERY AAU SSU MAU Digswell Stanborough 6A B A B S&N B Isolation 1 BS Pirton Barley MEDICINE A Gynae Dacre Gloucester Consultant Led Midwife Led Unit WOMEN'S Elizabeth House CLINICAL SS MSH CANCER TOTAL TRUST NOTE: * For the purpose of reporting, the net promoter question responses made at the end of a patients care, eg on the day of discharge or up to 48 hours post discharge are included. Throughout the Trust an additional 357 Meridian inpatient surveys were completed during the patients stay; the responses to the net promoter question for these surveys cannot be included in the SHA reporting template. * If the number of 'detractors' exceeds the number of 'promoters' a negative net promoter score is achieved. Ext. Likely Likely Detractors Total Responses Net Promoter 23 Feb-2 Mar Mar Mar Mar Mar TRUST TOTAL % response rate (target 1%)
2 212/13 Health & Safety Performance Indicators - March 213 Yearly RAG Threshold Monthly Target April May June July August Financial Year September October November December January February March YTD Patient Incidents Visitor Incidents The Workforce (Including Contractors) Incidents RIDDOR incidents H&S public liability claims Red > 4 Amber 2-4 Green < 2 Red > 2 Amber 2 Green < 2 Red > 2 Amber Slips, Trips & Falls(not including in Green < 2 patient falls) Red > 69 Physical assault Amber Green < Red > 2 RIDDOR Amber 2 incidents Green < 2 Red > 2 H&S public Amber 2 liability claims Green < 2 Red > 11 Slips, Trips & Amber 11 Falls Green < 11 Red > 35 RIDDOR Amber incidents Green < 33 Red > 77 Slips, Trips & Amber Falls Green < 74 Red > 23 Employer liability Amber claims Green < 21 Red > Sharps incidents Workplace stress Amber Green < 118 Red > 219 Amber Green < Red > TBA Contact Amber > TBA dermatitis/latex Green > TBA Red > 84 Musculoskeletal Amber injuries Green < 78 Red > 188 TBC Physical assault Amber Green < Red < 9% Mandatory Amber > N/A training Green => 9% Red > 2 Significant Amber 2 workplace fires Green < 2 9.%.17 TBC TBC TBC TBC TBC TBC 8.1% 1.6% 11.5% 12.4% 13.3% 12.3% 12.3%
3 Abc Performance Exception Report Month 12 Target / Core Standard: HSMR (Medicine) HSMR (Women & Childrens) The current red rating is triggered when HSMR (Medicine) 1 HSMR (Women & Childrens) 1 The Issue HSMR Medicine The latest rolling 12 months is 1.9 which is very similar to last month and the second lowest value reported within the past year. HSMR Women & Childrens This is the first time there has been an exception report for this division. The latest rolling 12 months is The number of actual deaths reported is very small which does result in significant variability. There have been a total of 8 HSMR deaths reported. Only one of these is within Womens which results in a mortality lower than expected for this casemix. There have been 4 deaths in Neonatal paediatrics and 3 within Acute Paediatrics. Any deaths within the next 3 months will cause the HSMR to rise further before it declines. Comments and Actions All 5 CQUIN pathways were implemented by the end of Q4 12/13. Each has entailed a publicity campaign and pathways / guidelines on the newly created Patient Safety webpage of the Knowledge Centre. Further 3 pathways being agreed for 13/14 Continuing mortality review group with CCG and Public Health who yesterday congratulated the Trust on the quality of work undertaken over the past year. Specific case-note review of 7 deaths within Paediatrics Directorate focus on HSMR at monthly rolling half days. Improved dissemination of Learning points through revised rolling half day programme. Knowledge Centre Content & Management group established and business case approved for Document Manager Medical records project to improve access to case notes and relevant information to facilitate clinical management and accurate coding. Clinical coding review group with increased frequency of meetings(every 2 weeks) Business case for Encoder software that provides coding decision support approved LEAD DIRECTOR Medical Director
4 Abc Performance Exception Report March 213 Target / Core Standard: Statutory and Mandatory Training Trust Target: The target for staff compliance in the 9 competencies of statutory training is 1% by September 214 Current Position and Progress Performance at March 213 is 12.27% against a projection of 14.3% of staff compliant in all 9 competencies. The graph below shows the planned capacity trajectory and the actual number of staff trained as of March 213. Percentage staff trained Total Statutory Training Capactiy Trajectory & Actual Performance (6 months) Oct-12 Nov-12 Dec-12 Jan-13 Feb-13 Mar-13 Month Planned % Actual % Planned number Actual number Number staff trained (data source: ESR March 213) The Issues There is a reduced growth rate of compliance, this can be explained by the following reasons: 1. Staff are waiting to attend the new one stop training commencing in May. 2. A large amount of staff taking annual leave in March. 3. Cancelations of training at the cancer centre by external trainers which are being investigated. 1
5 Actions Taken Ensure all data is uploaded by the end of the month; explore options of uploading data live at the time of training. All data input staff to have training to ensure standardisation. Next Steps Communication of the new training via ward communication, screen savers and a branded approach to the training now called Vital. New landing page on the knowledge centre. Refurbishment of the resource room with extra computers to accommodate e-learning within the days and facilitated e-learning. MVCC days to commence in June. LEAD DIRECTOR Director of Nursing 2
6 Performance Exception Report March 213 Cultural Indicator Quality of Appraisals NB: In month performance for March 213 (month 12) = Red The Issue Cultural indicators have been updated in April using the data from the National Staff Survey 212. The floodlights have been populated with the national data and have been benchmarked against the thresholds used in the previous floodlight reports. The following indicator has seen a decrease: Quality of Appraisals Please note that taken in the context of the national survey, our Trust scored 44% which is a slight increase from last year s 42% and we are higher than the average of 36% for all Acute Trusts in England. Nationally this is a good result. Actions Taken The development and implementation of a new Appraisal Framework, Process and Policy is a key workforce initiative for to achieve the overall trust standard of 9% appraisal completion. The new approach will be: reflective of organisational staff performance and development needs; developed in partnership and; linked to organisational objectives and values. The new approach will meet nationally agreed changes to Agenda for Change in relation to performance related pay progression. Consideration will also be given to linking the new approach to statutory and mandatory training compliance. An outline appraisal paper reflective of the nationally agreed agenda for change performance related pay progression was discussed by the executive team. Further consideration needs to be given to the overall approach and timescale of implementation. Next Steps. An appraisal paper for the executive team to consider 3 options on the implementation of a new process will be completed Associate Director of Organisational Development, working with ARC steering group, will refresh the thresholds and the selected topics for to ensure we are focusing on the right cultural indicators to monitor our progress against. A refreshed Finger on the pulse survey will be completed during May / June to inform the July to September floodlights report. Use of hand held devises to collect responses as well as online survey will be trialled. LEAD DIRECTOR Director of Workforce and OD
7 def FINANCE REPORT MONTH 12 INDEX TO APPENDICES Page no. Appendix 1 Financial metrics 2 Appendix 2 Summary income and expenditure position 3 Appendix 3 Contract income by source 4 Appendix 4 Contract income by patient type 5 Appendix 5 Service line report 6 Appendix 6 Expenditure by Division 7 Appendix 7 Cashflow (rolling 12 month forecast) 8 Appendix 8 Cashflow (graphs) 9 Appendix 9 Balance sheet 1 Appendix 1 Capital Programme 11 Appendix 11 CIP delivery 12 Appendix 12 Phasing of Forecast 13 Appendix 13 Phasing of FRR 14 Appendix 14 Agency Expenditure 15 Appendix 15 Phasing of Division's forecast trajectories 16
8 Appendix 1 def FINANCE REPORT MONTH 12 FINANCIAL METRICS Financial Criteria Metric to be scored Weight Rating categories Trust YTD figure Score Target Underlying performance EBITDA margin %.25 11% 9% 5% 1% <1% 3.7% 2 3 Achievement of plan EBITDA % of plan achieved.1 1% 85% 7% 5% <5% 76.4% 3 5 Financial Efficiency Net return after financing.2 >3% 2% -.5% -5% <-5%.2% 3 3 I&E surplus margin.2 3% 2% 1% -2% < -2%.2% 2 3 Liquidity Liquidity ratio (days) <1 Financial Risk rating is the weighted average of financial criteria scores after applying adjustment factors. This gives an indicative risk rating of: Overriding rules If yes, maximum overall score One financial criterion scored at '1' No One financial criterion scored at '2' Yes Two financial criteria scored at '2' No Two financial criteria at '1' No Less than 1 year as an Foundation Trust Yes Overriding rules rating 3 3 Page 2 of 16
9 Appendix 2 FINANCE REPORT MONTH 12 TRUST INCOME AND EXPENDITURE def Current Month Year to Date F u l l Y e a r Budget Actual Variance Budget Actual Variance Budget Forecast Variance Income Income from NHS activities 23,351 24,431 1,8 28,647 28, ,647 28, Income from non NHS activities ,458 5,355-2,13 7,458 5,355-2,13 Other operating income 8,569 8, ,95 64,533 2,438 62,95 64,533 2,438 Total Income 32,544 33, ,199 35, ,199 35, ` Expenditure within Divisions Pay -18,896-19, , ,9-3, , ,9-3,768 Non-Pay -1,226-1, ,81-114,715-2, ,81-114,715-2,914 Unallocated Budgets -2,134-1, , ,658-3, ,658 Total expenditure within Divisions -31,256-31, , ,393-4,24-333, ,393-4,24 EBITDA 1,288 1, ,83 12,863-3,967 16,83 12,863-3,967 PDC Dividends payable ,683-3, ,683-3, Depreciation & minor impairments -68-1, ,3-7, ,3-7, Investment Revenue Finance Costs ,272-1, ,272-1, NET SURPLUS / (DEFICIT) , ,68 3, ,68 Fixed Asset Impairment -12,648-12,648-12,648 Donated Assets NET SURPLUS / (DEFICIT) INC MEA. -12,55-12,46-12,46 EBITDA % delivered = 12,863 /16,83 = 76.4% EBITDA margin = 12,863 / 35,256 = 3.7% I&E surplus margin = 532 / 35,256 =.2% Income and Expenditure Surplus 212/13 5, 4, 3, 2, 1, 212/13 Actual surplus / (deficit) cum -1, -2, Apr May Jun Jul Aug Sep Oct Nov Dec Jan Feb Mar 211/12 Actual surplus / (deficit) cum -3, 212/13 Planned surplus / (deficit) cum Page 3 of 16
10 Appendix 3 def FINANCE REPORT MONTH 12 ANALYSIS OF CONTRACT INCOME BY SOURCE Current Period Year to Date F u l l Y e a r Plan Actual Variance Plan Actual Variance Plan Forecast Variance Income from activities - NHS NHS Hertfordshire 17,292 18,327 1,35 214,297 21,854-3, ,297 21,854-3,443 NHS Bedfordshire 1,686 1, ,421 21, ,421 21, Specialist Commissioning 2,23 1, ,84 17, ,84 17, Hillingdon PCT ,78 7, ,78 7, Luton PCT ,257 4, ,257 4, Non Contracted Activity (other PCTs) ,575 7,81 2,56 4,575 7,81 2,56 Harrow PCT ,343 4, ,343 4,6 663 Barnet PCT ,992 1, ,992 1, Buckinghamshire PCT ,813 1, ,813 1, Berkshire East PCT ,146 1, ,146 1,43-13 Brent PCT ,597 1, ,597 1,197-4 Ealing PCT West Essex PCT Enfield PCT Total income from activities - NHS 23,351 24,431 1,8 28,647 28, ,647 28, Income from non-nhs activities Private Patients ,863 3,34-1,524 4,863 3,34-1,524 Road Traffic Act , , Non NHS Other ,185 1, ,185 1, Total income from non-nhs activities ,458 5,355-2,13 7,458 5,355-2,13 Other operating income Education, Training and Research 1,173 1, ,437 12, ,437 12, Distinction / Merit Awards , , Hosted Services SLAs ,554 3, ,554 3, Non Patient Care Services ,41 2, ,41 2, R&D Income 1,333 1, ,366 4, ,366 4, Other Income 3,848 3, ,662 19,857 1,195 18,662 19,857 1,195 ISTC: SLAs ,55 1, ,55 1, ISTC: Transitional Relief ,12 1,7 1,58 9,12 1,7 1,58 Total other operating income 8,569 8, ,95 64,533 2,438 62,95 64,533 2,438 Grand Total 32,544 33, ,199 35, ,199 35, Page 4 of 16
11 Appendix 4 def FINANCE REPORT MONTH 12 ANALYSIS OF CONTRACT INCOME BY TYPE OF ACTIVITY Current Period Year to Date F u l l Y e a r Plan Actual Variance Plan Actual Variance Plan Forecast Variance Income from activities - NHS Accident & emergency 1,14 1, ,432 14, ,432 14, Non-elective short stay ,983 2, ,983 2,986 3 Non-elective standard (incl excess bed days) 5,56 6,717 1,157 65,879 66, ,879 66, Total Non-Elective Inpatients 5,813 6,982 1,168 68,862 69, ,862 69, Day Case ,155 1,155 1,155 1,155 Elective standard (incl excess bed days) 1,46 1, ,33 16,87-1,163 18,33 16,87-1,163 Total Elective Inpatients/Day Case 2,282 2, ,188 27,25-1,163 28,188 27,25-1,163 PbR outpatient consultant led first attendances 1,342 1, ,573 16, ,573 16, PbR outpatient consultant led follow up attendances 1,336 1, ,479 16, ,479 16, Outpatient - other ,97 5, ,97 5,4 133 Outpatient procedures ,568 4, ,568 4, Total Outpatient 3,389 3, ,527 42,633 1,16 41,527 42,633 1,16 Direct access pathology ,458 7, ,458 7, Direct access radiology ,512 3, ,512 3, Renal dialysis services ,45 11, ,45 11, Neonatal & SCBU ,441 4, ,441 4, Intensive care ,316 8, ,316 8, Chemotherapy HCD ,97 5, ,97 5, PbR drug exclusions ,491 4, ,491 4, Ward attenders ,261 3, ,261 3, Maternity pathway 1,934 1, ,77 21,535-1,235 22,77 21,535-1,235 Other Non-PbR Cost & volume services ,818 4, ,818 4, Non-PbR block services ,247 6,247 6,247 6,247 Total Non-PbR cost & volume 6,847 6, ,735 81, ,735 81, CQUIN ,2 4, ,2 4, QIPP Savings Target Total Acute Services 19,891 2, , , , , Mount Vernon PBR ,117 11,117 11,117 11,117 Non PBR 2,481 2, ,82 29, ,82 29, CQUIN Total Mount Vernon 3,46 3, ,883 41, ,883 41, Total income from activities - NHS 23,351 24,431 1,79 28,647 28, ,647 28, Income from non-nhs activities Private Patients ,863 3,34-1,524 4,863 3,34-1,524 Road Traffic Act , , Non NHS Other ,185 1, ,185 1, Total income from non-nhs activities ,458 5,355-2,13 7,458 5,355-2,13 Other operating income Education, Training and Research 1,173 1, ,437 12, ,437 12, Distinction / Merit Awards , , Hosted Services SLAs ,554 3, ,554 3, Non Patient Care Services ,41 2, ,41 2, R&D Income 1,333 1, ,366 4, ,366 4, Other Income 3,848 3, ,662 19,857 1,195 18,662 19,857 1,195 ISTC: SLAs ,55 1, ,55 1, ISTC: Transitional Relief ,12 1,7 1,58 9,12 1,7 1,58 Total other operating income 8,569 8, ,95 64,533 2,438 62,95 64,533 2,438 Grand Total 32,544 33, ,2 35, ,199 35, Page 5 of 16
12 Appendix 5 SERVICE LINE REPORT MONTH 12 ANALYSIS OF INCOME AND EXPENDITURE BY DIVISION def Cancer Medicine Surgery Plan Actual Diff Plan Actual Diff Plan Actual Diff Income NHS Activities 55,41 54,792 (249) 96,5 97,774 1,77 74,624 73,443 (1,181) Income reported in Divisions 7,47 7,71 (336) 1,398 1,313 (85) 1, (329) Other Operating 6,182 5,883 (299) 19,38 19, ,91 19, Total Income 68,63 67,746 (884) 116, ,924 2,483 94,811 94,143 (668) Expenditure Net Direct (45,326) (45,913) (587) (63,896) (66,368) (2,471) (62,827) (65,228) (2,41) Income reported in Divisions (7,47) (7,71) 336 (1,398) (1,313) 85 (1,277) (948) 329 Direct (52,733) (52,984) (251) (65,294) (67,681) (2,386) (64,14) (66,16) (2,56) Indirect Clinical Costs (7,474) (7,474) (11,881) (11,881) (6,634) (6,634) Indirect Overhead Costs (7,63) (7,319) 311 (33,87) (32,351) 735 (3,517) (29,65) 913 Total Expenditure (67,837) (67,777) 6 (11,263) (111,913) (1,651) (11,255) (12,398) (1,143) Net Surplus/Deficit 793 (3) (824) 6,179 7,1 832 (6,444) (8,255) (1,811) Contribution 2,241 1,45 (836) 2,227 19,525 (72) 5,163 1,597 (3,566) W&C Clinical Services Grand Total Plan Actual Diff Plan Actual Diff Plan Actual Diff Income NHS Activities 44,82 43,357 (1,445) 1,176 11, ,647 28,369 (278) Income reported in Divisions 967 1, ,711 3,229 (482) 14,76 13,599 (1,161) Other Operating 9,32 9, ,63 1,492 (138) 54,792 56,288 1,496 Total Income 54,8 53,719 (1,82) 15,517 15, ,199 35, Expenditure Net Direct (29,957) (29,95) 7 (45,187) (47,122) (1,934) (247,194) (254,58) (7,386) Income reported in Divisions (967) (1,38) (71) (3,711) (3,229) 482 (14,76) (13,599) 1,161 Direct (3,924) (3,988) (64) (48,898) (5,351) (1,452) (261,954) (268,163) (6,29) Indirect Clinical Costs (4,58) (4,58) 3,496 3,496 Indirect Overhead Costs (17,77) (16,686) 391 3,665 4,4 735 (84,645) (81,56) 3,85 Total Expenditure (52,58) (52,181) 327 (14,737) (15,454) (718) (346,599) (349,724) (3,125) Net Surplus/Deficit 2,292 1,537 (755) (51) 3,6 532 (3,68) Contribution 1,337 8,899 (1,438) (4,515) (5,622) (1,17) 33,453 25,84 (7,649) Page 6 of 16
13 Appendix 6 FINANCE REPORT MONTH 12 def EXPENDITURE BY DIVISION AND SPECIALTY/DEPARTMENT Current Month Year to Date F u l l Y e a r Budget Actual Variance Budget Actual Variance Budget Forecast Variance Division Medical Division Emergency Care -1,98-2, ,97-29,363-1,266-28,97-29,363-1,266 A&E -89-1, ,683-12,1-1,317-1,683-12,1-1,317 Renal ,684-12, ,684-12, Speciality Medicine ,677-4, ,677-4, Cardiology ,755-7, ,755-7, Total Medical Division -4,888-5, ,896-66,368-2,471-63,896-66,368-2,471 Surgical Division General Surgery & Urology & Gastroenterology -1,312-1, ,761-17,47-1,79-15,761-17,47-1,79 Orthopaedics , ,632-11, ,632-11, Surgical Specialities ,98-8, ,98-8,21-42 Anaesthetics & Theatres -1,58-1, ,38-18, ,38-18, Critical Care ,417-9, ,417-9, Total Surgical Division -5,226-5, ,827-65,221-2,394-62,827-65,221-2,394 Women's & Children's Division Obstetrics & Gynaecology -1,393-1, ,79-16, ,79-16, Paediatrics -1,15-1, ,248-13, ,248-13, Total Women's & Children's Division -2,498-2, ,957-29, ,957-29,95 7 Cancer Services Division Mount Vernon Cancer Services -3,139-3, ,325-37, ,325-37, Oncology & Haematology ,2-8, ,2-8,96-95 Total Cancer Services Division -3,68-3,6 8-45,326-45, ,326-45, Clinical Support Division Pathology & EBME & QC -1,57-1, ,686-18,754-1,68-17,686-18,754-1,68 Pharmacy ,759-9, ,759-9, Radiology , ,597-12, ,597-12, Elizabeth House PP Patient Access & Occupational Health ,931-7, ,931-7, Total Clinical Support Division -3,823-4, ,187-47,122-1,934-45,187-47,122-1,934 ISTC ,822 3, ,822 3, Corporate Directorates Finance -1,21-1, ,472-9, ,472-9, Personnel ,836-4, ,836-4,2-183 Estates & Strategic Development&Facilities -1,851-1, ,59-22, ,59-22, Trust Management ,638-7, ,638-7, Nursing ,778-9, ,778-9, Education ,932-1, ,932-1, Total Corporate Departments -5,4-4, ,716-54, ,716-54, Reserves R&D Unallocated Budgets - general reserves -2,134-1, , ,658-3, ,658 Total Unallocated Budgets -2,195-1, ,187-1,528 2,658-4,187-1,528 2,658 Income reported in Divisions -4,224-4, ,95-3,89 2,6-32,95-3,89 2,6 Total Expenditure within Divisions -31,256-31, , ,41-4,32-333, ,41-4,32 Page 7 of 16
14 Appendix 7 FINANCE REPORT MONTH 12 ROLLING 12 MONTHS CASHFLOW def Mar-13 Apr-13 May-13 Jun-13 Jul-13 Aug-13 Sep-13 Oct-13 Nov-13 Dec-13 Jan-13 Feb-13 TOTAL Actual Forecast Forecast Forecast Forecast Forecast Forecast Forecast Forecast Forecast Foreacst Forecast BALANCE 15,185 1,93 6,756 4,48 8,95 7,969 6,553 8,651 7,17 5,687 4,24 4,721 4,24 RECEIPTS NHS ACUTE ACTIVITY INCOME 38,742 22,736 22,736 23,236 22,736 22,736 22,736 22,736 22,736 22,736 22,736 22,736 35,981 EDUCATION/MERIT AWARDS/R&D 637 1,225 1,225 1,225 1,225 1,225 1,225 1,225 1,225 1,225 1,225 1,225 14,389 OTHER INCOME 497 3,777 3,777 3,777 3,777 3,777 3,777 3,777 3,777 3,777 3,777 3,777 36,212 INTEREST LOAN RECEIVED 5,99 5,156 2,64 6,412 24,564 SUB-TOTAL RECEIPTS 45,869 27,74 27,74 33,396 29,84 27,74 34,152 27,74 27,74 27,74 27,74 27,74 381,17 PAYMENTS SALARIES & WAGES -TRUST 9,95 9,649 9,649 9,649 9,649 9,649 9,649 9,649 9,649 9,649 9,649 9, ,982 SALARIES & WAGES - OTHER ,624 PAYE/ SUPERN/ NI - TRUST 6,962 7,129 7,129 7,129 7,129 7,129 7,129 7,129 7,129 7,129 7,129 7,129 85,342 PAYE/ SUPN/ NI - OTHER CREDITORS 19,376 1,846 9,846 9,842 9,842 8,842 8,842 8,842 8,842 8,842 6,842 6, ,782 CREDITORS- CAPITAL 6,81 3,27 3,29 2,977 3,125 3,35 3,411 3,412 3,412 3,412 3,412 3,412 38,523 DIVIDEND PAID 1,564 1,688 3,252 INTEREST ON DH LOANS DH LOAN REPAYMENTS 5, ,729 SUB-TOTAL PAYMENTS 5,961 31,77 3,16 29,781 29,93 29,156 32,54 29,221 29,223 29,223 27,223 27, ,773 Month end actual and forecast 1,93 6,756 4,48 8,95 7,969 6,553 8,651 7,17 5,687 4,24 4,721 5,238 7,61 Trust Cash plan 1,366 1,366 1,366 1,366 1,366 1,366 1,366 1,366 1,366 1,366 1,366 1,366 Page 8 of 16
15 Appendix 8 def FINANCE REPORT MONTH 12 CASHFLOW PERFORMANCE 212/13 16, Cashflow performance against plan Planned month end balance Actual cashflow Forecast cashflow 25, Cashflow performance against plan excluding capital Planned month end balance exc cap Actual cashflow excl capital Forecast excl capital 14, 12, 2, 's 1, 8, 's 15, 6, 1, 4, 5, 2, Mar Apr May Jun Jul Aug Sep Oct Nov Dec Jan Feb Mar Apr May Jun Jul Aug Sep Oct Nov Dec Jan Feb Mar Aged Creditors / Debtors at Mth 12 Aged Creditors Aged Debtors Prompt payment of invoices against target by volume (BPPC) Target 9 1% Achieved - cumulative 8 95% 's paid within 3 days 9% 85% 8% 75% 7% 65% 6% 2 55% 1 5% 45% % Apr May Jun Jul Aug Sep Oct Nov Dec Jan Feb Mar Days Page 9 of 16
16 Appendix 9 FINANCE REPORT MONTH 12 BALANCE SHEET 212/13 def Restated Opening Balance Balance Sheet as at 1/4/12 as at 31/3/13 FIXED ASSETS Property, Plant Equipment 17, ,678 Trade & Other Receivables N-Current 1,325 1,485 TOTAL FIXED ASSETS 171,83 146,163 CURRENT ASSETS Inventories 4,738 4,865 Cash & Cash Equivalents 9,62 1,93 Trade & Other Receivables - Current 2,54 24,422 TOTAL CURRENT ASSETS 34,844 39,38 Creditors: Amounts Falling Due Within One Year (43,127) (42,627) NET CURRENT ASSETS / (LIABILITIES) (8,283) (3,247) FIXED & NET CURRENT ASSETS LESS CURRENT LIABILITIES 163,52 142,916 Creditors: Amounts Falling Due More Than One Year (38,65) (5,8) Provisions For Liabilities & Charges (1,79) (962) NET ASSETS 124,376 91,154 FINANCED BY TAXPAYERS EQUITY: Public Dividend Capital 151, ,14 Revaluation Reserve 68,171 47,622 Retained Earnings (95,329) (17,68) TOTAL TAXPAYERS EQUITY 124,376 91,154
17 Appendix 1 def FINANCE REPORT MONTH 12 CAPITAL PROGRAMME 212/213 Scheme Scheme Approved Budget YTD Plan YTD Expenditure YTD Variance YE Forecast Code Description as at 31/3/13 as at 31//3/13 as at 31/3/13 as at 31/3/13 as at 28/2/13 211/12 projects 2672 Medical Equipment 1/ IM&T E-Learning CT Scanner (38) (27) Cardiology - Cath lab Electrical Infrastructure CHP Other Infrastructure costs Maternity MV CQC cancer centre (63) 35 Total b/f 211/ Additional capital allocation MRI scanner - works component Endoscopy decontamination - works component (183) Linacs software Dalkia -1,119 1,119-1, /13 projects 1,339 1, , Essential Schemes 269 Staff Recharges 2, 2, , (758) 487 HCH - PFI Asset (69) 88 2,88 2,88 2,6 (512) 2,575 New Schemes 2672 Medical Equipment IM&T (221) Maintenance (7) 789 Other 292 (292) COPD CQUIN Chemotherapy chairs Car Park QEII OCH IT (43) TPP 71 (71) 74 CHP inclusion in Trust Assets 2,44 2, , Mattress replacements 26 Estates Time Management 26 (26) Occupational Health Relocation 4 (4) Main Entrance 5 (5) 1 Complaints Improving Birthing Environments Linear Accelerator Total New Schemes 5,666 5,666 6,27 (361) 6,48 OCH Phase 4 - A&E 5,917 5,917 4, , Phase 4 - enabling 1,266 1, , Phase 4-11a (2) Phase 4-11a Enabling 2665 Phase 4-7a (117) Phase 4 - Ward Block Phase 4 - Theatres 3,52 3, , Phase 4 - Chemo Phase 4 - Pathology Phase 4 - critical Care 1,825 1,825 1, , Phase 4 - Medical Records Funding & CRL Phase 4 - Mortuary (7) Phase 4 - Occupational health move 8 (8) Fracture Clinic 153 (153) Phase 4 - Paeds Opthamology 1 (1) Depreciation 6, Decant Staff 16 (16) Loan - Phase 4 13,74 Total OCH 14,713 14,713 8,946 5,767 9,876 Internally Generated 3,288 PDC repayment -394 Undercommitted CHP 2,44 Improving Birthing Env 186 Programme Total 212/13 24,258 24,258 17,664 6,594 19,12 Total 24,675 Page 11 of 16
18 Appendix 11 FINANCE REPORT MONTH 12 SUMMARY OF CIP DELIVERY BY DIVISION def Current Period Year to Date F u l l Y e a r Plan Actual Variance Plan Actual Variance Plan Forecast Variance Medical Division ,843 2, ,843 2,843 Surgical Division ,978 2, ,978 2,978 Women & Children's Division ,629 1, ,629 1,629 Cancer Services Division ,819 1, ,819 1,82 1 Clinical Support Division ,26 2, ,26 2,4 14 Corporate Directorates ,169 3, ,169 3, Trust wide Total 1,438 1, ,21 14, ,21 15, % 99.1% 11% SUMMARY OF PHASING BY DIVISION M1 M2 M3 M4 M5 M6 M7 M8 M9 M1 M11 M12 Total Medical Division Surgical Division Women & Children's Division Cancer Services Division Clinical Support Division Corporate Directorates Trust wide Total ,8 1,29 1,293 1,323 1,429 1,433 1,434 1,449 1,448 1,437 15,21 Total % 5.1% 5.3% 6.7% 8.% 8.6% 8.8% 9.5% 9.5% 9.5% 9.6% 9.6% 9.6% 1% Page 12 of 16
19 Appendix 12 FINANCE REPORT MONTH /13 MONTHLY FORECAST TRAJECTORY def In Month Surplus Apr May Jun Jul Aug Sept Oct Nov Dec Jan Feb Mar Total Original Planned Net Surplus/(Deficit) -1, ,16 1,334 1, ,94 1, , Actual Net Surplus/(Deficit) -1,136 1,12-1,141 1, Month 7 Forecast Net Surplus In month variance from forecast In Month Actual/Forecast Surplus/(Deficit) compared with Plan 2,5 2, 1,5 1, , -1,5-2, Apr May Jun Jul Aug Sept Oct Nov Dec Jan Feb Mar Original Planned Net Surplus/(Deficit) Actual Net Surplus/(Deficit) Month 7 Forecast Net Surplus Apr May Jun Jul Aug Sept Oct Nov Dec Jan Feb Mar Planned Cumulative Surplus/(Deficit) -1, , ,56 1,73 3,13 4,16 3,158 4,349 3,413 3,6 Actual Cumulative Surplus/(Deficit) -1, , Month 7 Forecast Net Surplus Cumulative variance from forecast Cumulative Actual/Forecast Surplus/(Deficit) compared with Plan 5, 4, 3, 2, Planned Cumulative Surplus/(Deficit) 1, Actual Cumulative Surplus/(Deficit) -1, -2, Apr May Jun Jul Aug Sept Oct Nov Dec Jan Feb Mar Page 13 of 16 Month 7 Forecast Net Surplus
20 Appendix 13 def FINANCE REPORT MONTH /13 FORECAST FINANCIAL RISK RATING Rating categories Financial Criteria Metric to be scored Weight Target Month 1 Month 2 Month 3 Month 4 Month 5 Month 6 Month 7 Month 8 Month 9 Month 1 Month 11 Month Actual Actual Actual Actual Actual Actual Actual Actual Actual Actual Actual Actual Underlying performance EBITDA margin %.25 11% 9% 5% 1% <1% Achievement of plan EBITDA % of plan achieved.1 1% 85% 7% 5% <5% Financial Efficiency Net return after financing.2 8% 2% -.5% -5% <-5% I&E surplus margin.2 3% 2% 1% -2% < -2% Liquidity Liquidity ratio (days) <1 Financial Risk rating is the weighted average of financial criteria scores after applying adjustment factors. This gives an indicative risk rating of: Overriding rules rating Overriding rules - if answer is yes, then a maximum overall score is applied One financial criterion scored at '1' Yes, max = 2 One financial criterion scored at '2' Yes, max = 3 Two financial criteria scored at '2' Yes, max = 2 Two financial criteria at '1' Yes, max = 1 Less than 1 year as an Foundation Trust Yes. max = 4 Page 14 of 16
21 Appendix 14 FINANCE REPORT MONTH /13 AGENCY EXPENDITURE AGAINST TRAJECTORY def Apr May Jun Jul Aug Sep Oct Nov Dec Jan Feb Mar 212/13 Agency trajectory /13 Agency expenditure /12 Agency expenditure /13 Agency worked WTE Agency Expenditure 212/13 1, 8 s Apr May Jun Jul Aug Sep Oct Nov Dec Jan Feb Mar Month 212/13 Agency trajectory 212/13 Agency expenditure 211/12 Agency expenditure Page 15 of 16
22 Appendix 15 FINANCE REPORT MONTH /13 MONTHLY FORECAST TRAJECTORY - BY DIVISION def Actual/Forecast Variance Actual Actual Actual Actual Actual Actual Forecast Forecast Forecast Forecast Forecast Forecast Apr May Jun Jul Aug Sept Oct Nov Dec Jan Feb Mar Year-End Medicine - forecast Surgery - forecast Women's & Childrens - forecast Cancer - forecast Clinical Support - forecast Total In Month Actual/Forecast Variance compared with Plan Apr May Jun Jul Aug Sept Oct Nov Dec Jan Feb Mar Medicine - forecast Surgery - forecast Women's & Childrens - forecast Cancer - forecast Clinical Support - forecast -25 Page 16 of 16
23 East & North Hertfordshire NHS Trust :Board Performance Report (212-13) - Month 12 Publication Date: 12/4/213 Monitor Compliance Framework and SHA Provider Management Regime Monitor Compliance Framework - Performance Thresholds for Achieve Under-achieve Fail Weighting Area Indicator Lead Director Q4 Q1 Q2 Q3 Q4 Jan-13 Feb-13 Month Year to date Qtr-end PF RR 14 >14 1. Safety Clostridium Difficile AT >3 1. Safety MRSA AT >96% - <96%.5 Quality *All Cancers: 31-day wait from diagnosis to treatment 96% (1month in arrears) JW 98.3% 97.5% 98.% 98.4% 96.6% 96.2% 97.% 97.% 97.8% Quality *All Cancers: 31-day wait for second or subsequent treatment - Surgery 94% (1month in arrears) JW 97.7% 96.8% 98.1% 98.1% 96.6% 97.9% 95.2% 95.2% 97.6% All 3 targets 1 or more target *All Cancers: 31-day wait for second or subsequent treatment - Drug 98% (1month in - 1. Quality met failed arrears) JW 99.7% 1.% 99.7% 1.% 99.2% 98.2% 1.% 1.% 99.8% Quality *All Cancers: 31-day wait for second or subsequent treatment - Radiotherapy 94% (1month in arrears) JW 99.3% 99.2% 99.6% 99.9% 95.7% 94.9% 96.4% 96.4% 98.8% *All Cancers: 62-day wait for first treatment - Urgent GP referral 85% (1month in Quality JW 87.6% 87.9% 86.7% 85.3% 82.7% 78.9% 87.3% 87.3% 86.% Both targets 1 or more target arrears) - 1. met failed *All Cancers: 62-day wait for first treatment - Consultant Screening Service 9% Quality JW 1.% 94.7% 92.4% 9.3% 1.% 1.% 1.% 1.% 93.2% (1month in arrears) *Cancer 2-week wait from referral to date first seen - All cancers 93% (1month in Quality JW 99.2% 99.3% 98.3% 98.% 98.3% 98.3% 98.2% 98.2% 98.5% Both targets 1 or more target arrears) -.5 met failed *Cancer 2-week wait from referral to date first seen - Symptomatic breast patients Quality JW 99.6% 96.5% 96.3% 96.1% 98.5% 95.6% 97.4% 97.4% 96.3% 93% (1month in arrears) 9% - < 9% 1. Patient Experience Maximum Waiting Time of 18-weeks from Referral to Treatment - Admitted JW 91.3% 91.8% 9.6% 92.1% 94.6% 95.% 94.9% 97.% 92.2% 95% - < 95% 1. Patient Experience Maximum Waiting Time of 18-weeks from Referral to Treatment - Non-Admitted JW 97.9% 97.8% 97.1% 96.7% 96.8% 97.1% 96.1% 97.1% 97.1% 92% - < 92% 1. Patient Experience Maximum Waiting Time of 18-weeks from Referral to Treatment - Incomplete JW 95.3% 96.5% 95.6% 94.9% 94.9% 95.3% 95.2% 94.9% 94.9% 95% - <95% 1. Quality A&E: Maximum Waiting Time of four hours from Arrival to Discharge or Admission JW 95.3% 97.4% 97.% 94.6% 94.7% 93.5% 96.2% 93.3% 95.8% Compliant - Non-compliant.5 Certification against compliance with requirements regarding Patient Experience access to healthcare for people with a learning disability AT *cancer performance figures are not finalised until 6-weeks after month-end and may therefore be subject to change. Monitor Compliance Framework GRR - Quality Overrides Level 2 MCF Override NHS Litigation Authority Level 1-3 JMc Level 1 MCF Override CNST Level 1-3 (Against Plan Level 1 > April 212) AT MCF Override Other Certification - Financial Compliance, Cooperation with Other NHS Bodies & Local Authorities, Information Governance, Cooperation & Competition Panel PT Department of Health Operating Framework measures (Excludes Indicators already covered above) Monitor Compliance Framework Quarterly Risk Rating (43) Amber / Green 1. SHA Provider Management Regime Monthly Governance Risk Rating (GRR) Amber / Green 1. Service Performance Indicators for Achieve Under-achieve Fail Weighting Area Indicator Lead Director Q Q Q Q Q4 Jan-13 Feb-13 Month Year to date Qtr-end 2 >2 RTT Delivery in all Specialties Patient Experience (Treatment Functions not delivered (average Admitted, Non-Admitted & Incomplete JW Pathways) 1% 5% >5% Patient Experience Diagnostic Test Waiting Times (patients waiting >6-weeks for 15 key diagnostic tests) JW.35% 1.9%.96%.81%.65%.68%.28% 1.% 1.4% 3.5% 5% >5% Quality Delayed Transfers of Care - DTCs JW 2.4% 2.7% 2.4% 2.2% 4.% 3.5% 4.2% 4.3% 2.8% %.5% >.5% Patient Experience MSA breaches - Numbers of unjustified breaches AT 98% 93% <93% Safety VTE Risk Assessment JM 98.2% 99.6% 99.3% 99.4% 98.4% 98.7% 98.1% 98.3% 99.2% Trust Clinical Efficiency KPIs (Excludes Indicators already covered above) Performance Thresholds for Achieve Under-achieve Fail Weighting Area Indicator Lead Director Q4 Q1 Q2 Q3 Q4 Jan-13 Feb-13 Month Year to date Qtr-end Plan Plan +1% > Plan +1% Productivity DNA rate JW 8.2% 7.7% 6.9% 7.2% 7.7% 7.9% 8.% 7.4% 7.1% <=1.75 <=2.27 >2.27 Productivity New to Follow-up outpatient appointment ratio JW <=6.% <=12.% >12% Productivity *Pre-op bed-days JW 4.% 9.% 6.3% 7.4% 4.% 5.% 4.7% 1.5% 7.3% Within Plan >2% Variance >5% Variance Resources *Occupied Bed Days (OBDs) JW -3.8% 18.3% -26.1% -9.2% -11.2% 5.8% -8.7% -3.6% -1.4% Resources Spells JW -1.7% -2.7% -5.1% -2.4% -.1% 7.2% -5.8% -1.3% -2.3% <=4.5 <=6 >6 Resources Length of Stay (Overall) JW >=87.5% >=75% <75% Productivity Theatre Utilisation (1month in arrears) JW 93.1% 93.8% 95.6% 95.3% 94.9% 94.% 95.8% 95.8% 94.9% <=9% <=13% >13% Productivity Readmissions(2mths in arrears) JW 11.2% 1.1% 9.6% 11.% 11.% TBC 15.5% 11.% *Figures are provisional and are subject to change.
24 East & North Hertfordshire NHS Trust :Board Performance Report (212-13) - Month 12 Publication Date: 12/4/213 Key Contract Requirements (Excludes Indicators already covered above) Performance Thresholds for Achieve Under-achieve Fail Weighting Area Indicator Lead Director Q4 Q1 Q2 Q3 Q4 Jan-13 Feb-13 Month Year to date Qtr-end 4-hours Quality A&E Quality Indicator - Total Time in A&E (95th percentile) JW From Q2 1 From Q (failing 1 1 'Timeliness' 'Timeliness' 1 'Timeliness' 'Timeliness' 15 minutes Timeliness Quality A&E Quality Indicator - Time to initial assessment (95th percentile) JW 'Timeliness' 1 'Timeliness' 'Timeliness' 'Timeliness' 1 'Timeliness' Timeliness indicator to 3 or more) indicator indicator indicator indicator indicator to be indicator indicator achieved indicator indicator indicator achieved be achieved 6 minutes achieved OR achieved achieved achieved achieved Quality A&E Quality Indicator - Time to treatment decision (median) JW achieved achieved achieved.5 (failing 5% From Q2 1 2 or Quality A&E Quality Indicator - Unplanned reattendance rate JW 1 'Impact' 1 'Impact' 1 'Impact' 1 'Impact' 1 'Impact' 1 'Impact' From Q2 1 'Impact' 1 'Impact' 1 'Impact' 1 'Impact' 'Impact' indicator less) indicator indicator indicator indicator indicator indicator 5% indicator achieved Quality A&E Quality Indicator - Left without being seen JW indicator achieved indicator achieved indicator achieved achieved achieved achieved achieved achieved achieved achieved 15 minutes > 15 minutes Ambulance Turnaround (To Apply from Q2) Quality JW 72.7% 72.2% 66.6% 68.7% 65.1% 66.% 7.8% <5% >5 % <EoE >EoE Avg Quality Choose & Book Slot issues under 5% JW 8.5% 12.2% 11.9% 9.17% 1.49% 4.93% 17.1% 11.34% 11.2% <.8% >.8% <1.5% >1.5% Quality Cancelled Operations - on the day JW.78%.64%.34%.4%.8%.66%.88%.97%.58% 1% >98% <98% Quality Cancelled Operations - readmitted <28-days JW 1.% 97.7% 1.% 1.% 1.% 1.% 1.% 1.% 99.% Quality Cancelled Operations - on the day (No of Patients) JW NYE Quarterly target* <9% Local Priorities (Excludes Indicators already covered above) Performance Thresholds for Quality Admissions to a Stroke Bed <4-hours from Arrival at A&E (1 month in arrears)* (*Q1 5% pts, Q2 7% pts, Q3 9% pts, Q4-9% pts) *As at 2/12/212 Achieve Under-achieve Fail Weighting Area Indicator >=8% <7% Local Priority JW 4.% 53.7% 47.1% 4.4% 32.% 46.9% 46.9% 46.5% Lead Director Q Q Q Q Q4 Jan-13 Feb-13 Month Year to date Qtr-end Stroke Care - % of patients spending 9% of hospital stay on a specialist stroke unit (1mth in arrears) JW 8.2% 83.2% 81.7% 78.8% 7.% 7.4% 69.7% 69.7% 79.8% >=6% <54% Local Priority Stroke Care - % patients with high risk TIA seen and scanned/treated within 24 hours (1mth in arrears) JW 33.3% 62.5% 54.5% 37.8% 55.3% 51.6% 62.5% 62.5% 51.2% >=8% <75% Local Priority PPCI 15 minute call to balloon time JW 1.% 85.7% 87.5% 9.% 9.5% 1.% 75.% 83.3% 88.5% >=98% <98% Local Priority Two-week wait access for Rapid Access Chest Pain Clinics. JW 1.% 1.% 1.% 1.% 1.% 1.% 1.% 1.% 1.% 1% >=99% <99% Local Priority MRSA Elective screening AT 99.7% 99.96% 99.9% 1.% 1.% 1.% 99.9% 1.% 99.9% 1% >=95% <95% Local Priority MRSA Emergency screening (*provisional figures) AT 9.2% 88.8% 93.3% 91.% 9.1% 9.3% 92.4% 9.9%
25 CQC Outcomes Summary Registration Position 11/12 Registration position 12/13 Outcome Regulation CQC ESSENTIAL STANDARDS OF QUALITY & S DIRECTOR LEAD Current Registration Position April ʹ13 Lister QEII MVCC Hertford Bedford renal Anticipated Full Year Position 212/ 13 All locations /Regulatory Activities Section 1: Involvement and Communication C C 1 17 Respecting and involving people who use services Director of Nursing C C C C C Compliant No compliance conditions C C 2 18 Consent to care and treatment Medical Director C C 3 21 Fees etc. (applies to people how pay for their care) Director of Finance Section 2: Personalised Care Treatment and Support C C 4 9 Care and welfare of people who use services Director of Nursing C C C C C Compliant No compliance conditions C C C C C Compliant (No declaration required) C C C C C Compliant No compliance conditions C C 5 14 Meeting nutritional needs Director of C C C C C Compliant No compliance conditions Nursing C C 6 24 Cooperating with other providers Director of Operations C C C C C Compliant No compliance conditions Section 3: Safeguarding and Safety Safeguarding vulnerable service users Director of C x 3 sites C 7 11 Nursing C C C C C Compliant No compliance conditions Lister site Minor concern Q4 only C C 8 12 Cleanliness and infection control Director of Nursing C C C C C Compliant No compliance conditions C C 9 13 Management of medicines Medical Director C C 1 15 Safety and suitability of premises Director of Strategic C C Safety, availability and suitability of equipment Director of Nursing Section 4: Suitability of Staffing C C C C C Compliant No compliance conditions C C C C C Compliant No compliance conditions C C C C C Compliant No compliance conditions C C Requirements relating to workers Director of HR C C C C C Compliant No compliance conditions C C Staffing Director of HR C x 3 sites C Supportng workers Director of HR Lister site Minor concern Q4 only Section 5: Quality and management C C C C C Compliant No compliance conditions C C C C C Compliant No compliance conditions C C 15 8 Statement of Purpose Director of Finance C C 16 9 Assessing and monitoring the quality of service Medical Director provision C C 17 Complaints Director of Nursing C C Notification of Death of a Service User Director of Nursing C C Notification of death or unauthorised absence of a service user who is detailed or liable to be detailed under the Mental Health Act 1983 C C 2 29 Notification of other incidents Diector of Nursing C C 21 2 Records Director of Operations Section 6: Suitability of management Compliant C C C C C C C C C C C C C C C Director of Nursing C C C C C C C C C C C C C C C Compliant Compliant No compliance conditions Compliant No compliance conditions Compliant Compliant Compliant Compliant No compliance conditions N/A 22 4 Requirements where the service provider is an individual of partnership C C 23 5 Requirement where the service provider is a body other than a partnership (nominated individual) Not applicable to NHS Director of HR N/A 24 6 Requirements relating to registered managers Not applicable to NHS C C 25 7 Registered Person: training Director of HR N/A Financial position Not applicable to Trust Nominated Individual is the C Chief Executive N/A N/A Compliant Compliant NHS C C Notice of absence Director of Finance C C Notice of changes Director of Finance C C C C C C C C C C N/A Compliant Compliant From 1st April 21 the Trust has been formally registered with the CQC under the Health and Social Care Act 28 to provide the following regulated activities at the specified locations. REGULATORY ACTIVITY LOCATIONS LISTER HOSPITAL QEII MVCC HERTFORD BEDFORD RENAL Treatment of disease, disorder or injury Registered Registered Registered Registered Registered Surgical procedures Registered Registered Registered Diagnostic and screening procedures Maternity and midwifery services Registered Registered Registered Registered Registered Registered Registered Registered Termination of pregnancies Registered Registered Family Planning Services Registered Registered Registered Assessment or medical treatment of people detained under the Mental Health Act 1983 Registered Registered Registered
26 QUALITY Information to inform the discussion meeting East and North Hertfordshire NHS Trust Insert Performance in Month Refresh Data for new Month Criteria Unit Apr-12 May-12 Jun-12 Jul-12 Aug-12 Sep-12 Oct-12 Nov-12 Dec-12 Dec-12 Jan-13 Mar-13 Board Action 1 SHMI - latest data Score Period: July 11 - June Venous Thromboembolism (VTE) Screening % 99.4% 99.7% 99.59% 99.45% 99.2% 99.3% 99.3% 99.5% 99.5% 98.7% 98.1% 98.3% 99.16% YTD 3a Elective MRSA Screening % 1% 1% 99.86% 99.89% 99.8% 1.% 1.% 99.9% 1.% 1.% 1.% 1.% 99.9% YTD 3b Non Elective MRSA Screening % 87.8% 92.4% 9.5% 87.69% 88.7% 91.8% 93.5% 95.3% 91.6% 9.1% 9.3% 92.4% 9.94% YTD 4 5 Single Sex Accommodation Breaches Open Serious Incidents Requiring Investigation (SIRI) Number Number "Never Events" occurring in month Number CQC Conditions or Warning Notices Number Progressing on time Lister Hospital CQC report received from December 212 inspection - compliant with standards inspected Open Central Alert System (CAS) Alerts RED rated areas on your maternity dashboard? Falls resulting in severe injury or death Number Dealt with appropriately Number f Red flags: C section, IOL: RCA's in progress Number Grade 3 or 4 pressure ulcers Number G2 x2, G3 x 2, G4 x 12 1% compliance with WHO surgical checklist Y/N Y N N N N N N N Y Y Y Y 1% for March 213, in main theatres. New methodology checking 1% WHO checklist to commenced 1 Jan Formal complaints received Number Agency as a % of Employee Benefit Expenditure % 3.9% 3.3% 3.% 2.5% 1.7% 1.7% 2.8% 2.8% 2.3% 2.7% 3.8% 3.6% 2.9 YTD 15 Sickness absence rate % 3.1% 3.27% 3.3% 3.4% 3.5% 3.6% 3.5% 3.5% 3.9% 4.% 3.8% 3.6% 16 Consultants which, at their last appraisal, had fully completed their previous years PDP % N/A N/A N/A N/A N/A N/A N/A N/A N/A N/A N/A N/A New database to support revalidation in place - will be fully operational by April 213; will enable capture of fully completed PDP's as revalidation is rolled out ; trajectory to be agreed
27 GOVERNANCE RISK RATINGS East and North Hertfordshire NHS Trust See 'Notes' for further detail of each of the below indicators Effectiveness Patient Experience Area Ref Indicator Sub Sections Threshold Referral to treatment information 5% 1a Data completeness: Community services Referral information 5% comprising: Treatment activity information 5% Weighting Qtr to Jun- 12 Historic Data Qtr to Sep-12 Qtr to Dec-12 Jan-13 Feb-13 Mar-13 Patient identifier information 5% N/a N/a N/a N/a N/a N/a N/a 1b Data completeness, community services: (may be introduced later) Patients dying at home / care home 5% N/a N/a N/a N/a N/a N/a N/a 1c Data completeness: identifiers MHMDS 97%.5 N/a N/a N/a N/a N/a N/a N/a 1c Data completeness: outcomes for patients on CPA 5%.5 N/a N/a N/a N/a N/a N/a N/a 2a From point of referral to treatment in aggregate (RTT) admitted Maximum time of 18 weeks 9% 1. Yes Yes Yes Yes Yes Yes 2b 2c 2d From point of referral to treatment in aggregate (RTT) non-admitted From point of referral to treatment in aggregate (RTT) patients on an incomplete pathway Certification against compliance with requirements regarding access to healthcare for people with a learning disability 1. N/a Maximum time of 18 weeks 95% 1. Yes Yes Yes Yes Yes Yes Maximum time of 18 weeks 92% 1. Yes Yes Yes Yes Yes Yes N/a Insert YES, NO or N/A (as appropriate) N/A.5 Yes Yes Yes Yes Yes Yes N/a N/a Current Data N/a N/a Qtr to Mar-13 N/a Refresh GRR for New Quarter Board Action 93.8% - Mar % - Mar % - Mar13 Quality 3a 3b All cancers: 62-day wait for first treatment: 3c 3d 3e 3f 3g 3h All cancers: 31-day wait for second or subsequent treatment, comprising: All Cancers: 31-day wait from diagnosis to first treatment Cancer: 2 week wait from referral to date first seen, comprising: A&E: From arrival to admission/transfer/discharge Care Programme Approach (CPA) patients, comprising: Minimising mental health delayed transfers of care Admissions to inpatients services had access to Crisis Resolution/Home Treatment teams Surgery 94% Anti cancer drug treatments 98% Radiotherapy 94% From urgent GP referral for suspected cancer From NHS Cancer Screening Service referral 85% 9% all urgent referrals 93% for symptomatic breast patients (cancer not initially suspected 96%.5 Yes Yes Yes Yes Yes Yes 93% Maximum waiting time of four hours 95% 1. Yes Yes No No Yes No Receiving follow-up contact within 7 days of discharge Having formal review within 12 months 95% 95% Yes Yes Yes N/a Yes Yes Yes N/a Yes Yes Yes 7.5% 1. N/a N/a N/a N/a N/a N/a N/a N/a 95% 1. N/a N/a N/a N/a N/a N/a N/a Yes Yes Yes N/a Yes Yes Yes N/a Yes Yes Yes N/a N/a 96.99% - Feb % - Feb % - Feb13 1% - Feb % - Feb % - Feb13 1% - Feb % - Feb % - Feb13 3i Meeting commitment to serve new psychosis cases by early intervention teams 95%.5 N/a N/a N/a N/a N/a N/a N/a 3j Category A call emergency response within 8 minutes Red 1 8%.5 N/a N/a N/a N/a N/a N/a N/a Red 2 75%.5 N/a N/a N/a N/a N/a N/a N/a 3k Category A call ambulance vehicle arrives within 19 minutes 95% 1. N/a N/a N/a N/a N/a N/a N/a 4a Clostridium Difficile Is the Trust below the de minimus 12 Yes Yes Yes No Yes Yes 1. Is the Trust below the YTD ceiling 14 Yes No No Yes Yes Yes YTD: 13 (Mar - 1 ). 4b MRSA Is the Trust below the de minimus 6 Yes Yes Yes Yes Yes Yes 1. Is the Trust below the YTD ceiling 3 No Yes Yes Yes Yes Yes YTD: 2 (Mar - ) Safety CQC Registration Non-Compliance with CQC Essential A Standards resulting in a Major Impact on Patients 2. Yes No No No No No B Non-Compliance with CQC Essential Standards resulting in Enforcement Action 4. No No No No No No C NHS Litigation Authority Failure to maintain, or certify a minimum published CNST level of 1. or have in place appropriate alternative arrangements 2. No No No No No No TOTAL RAG RATING : AR G AG AR G AG G GREEN = Score less than 1 AMBER/GREEN = Score greater than or equal to 1, but less than 2 AMBER / RED = Score greater than or equal to 2, but less than 4 RED = Score greater than or equal to 4
28 GOVERNANCE RISK RATINGS East and North Hertfordshire NHS Trust See 'Notes' for further detail of each of the below indicators Historic Data Insert YES, NO or N/A (as appropriate) Current Data Refresh GRR for New Quarter Overriding Rules - Nature and Duration of Override at SHA's Discretion Greater than six cases in the year to date, and breaches the i) Meeting the MRSA Objective No No No No No No cumulative year-to-date trajectory for three successive quarters Greater than 12 cases in the year to date, and either: ii) Meeting the C-Diff Objective Breaches the cumulative year-to-date trajectory for three successive quarters Reports important or signficant outbreaks of C.difficile, as defined by the Health Protection Agency. No No No No No No Breaches: iii) RTT Waiting Times The admitted patients 18 weeks waiting time measure for a third successive quarter The non-admitted patients 18 weeks waiting time measure for a third successive quarter No No No No No No The incomplete pathway 18 weeks waiting time measure for a third successive quarter Fails to meet the A&E target twice in any two quarters over a 12- iv) A&E Clinical Quality Indicator month period and fails the indicator in a quarter during the No No No No No No subsequent nine-month period or the full year. Breaches either: v) Cancer Wait Times the 31-day cancer waiting time target for a third successive quarter the 62-day cancer waiting time target for a third successive quarter No No No No No No Breaches either: vi) Ambulance Response Times the category A 8-minute response time target for a third successive quarter the category A 19-minute response time target for a third successive quarter N/a N/a N/a N/a N/a N/a N/a either Red 1 or Red 2 targets for a third successive quarter Fails to maintain the threshold for data completeness for: referral to treatment information for a third successive quarter; vii) Community Services data completeness service referral information for a third successive quarter, or; N/a N/a N/a N/a N/a N/a N/a treatment activity information for a third successive quarter viii) Any other Indicator weighted 1. Breaches the indicator for three successive quarters. No No No No No No Adjusted Governance Risk Rating AR G AG AR G AG G

29
30
31
32
33
34
35
36
37
38
39
40
41
42
43
44
45
46
47
48
49
50
51
52
53
54
55 Appendix 1 Graph 1: Establishment V LTFM V Contracted WTE Staff in Post Table 1: Trust recruitment need against vacancy and turnover 12/13 13/14 14/15 15/16 16/17 17/18 18/19 LTFM - July 12 4,995 4,615 4,277 4,11 4,34 3,97 3,97 In Post Vacancies % Turnover % Total recruitment need


56 Appendix 2 Graph 1: Trust Staffing V LTFM and Establishment Graph 2: Workforce Worked against LTFM Target 2
SOUTHAMPTON UNIVERSITY HOSPITALS NHS TRUST Trust Key Performance Indicators May Regular report to Trust Board
 SOUTHAMPTON UNIVERSITY HOSPITALS NHS TRUST Trust Key Performance Indicators May 20 Report to: Trust Board July 20 Report from: Sponsoring Executive: Aim of Report/Principle Topic: Review History to date:
Integrated Performance Report
 Integrated Performance Report M06 September 2014 Presented by: Paul Bostock (Chief Operating Officer) Des Holden (Medical Director) Fiona Allsop (Chief Nurse) Paul Simpson (Chief Financial Officer) An
Integrated Performance Report
 Integrated Performance Report M12 March 2015 Presented by: Paul Bostock (Chief Operating Officer) Des Holden (Medical Director) Fiona Alsop (Chief Nurse) Paul Simpson (Chief Financial Officer) An Associated
BSUH INTEGRATED PERFORMANCE REPORT. 1) Responsive Domain 2) Safe Domain 3) Effective Domain 4) Caring Domain 5) Well Led Domain
 Responsive Domain 2) Safe Domain 3) Effective Domain 4) Caring Domain 5) Well Led Domain") BSUH INTEGRATED PERFORMANCE REPORT 1) Responsive Domain 2) Safe Domain 3) Effective Domain 4) Caring Domain 5) Well ed Domain RESPONSIVE DOMAIN RESPONSIVE DOMAIN Metric Defined by Standard Apr-16 May-16
BSUH INTEGRATED PERFORMANCE REPORT 1) Responsive Domain 2) Safe Domain 3) Effective Domain 4) Caring Domain 5) Well ed Domain RESPONSIVE DOMAIN RESPONSIVE DOMAIN Metric Defined by Standard Apr-16 May-16
Newham Borough Summary report
 Newham Borough Summary report April 2013 Prepared on 17/04/13 by Commissioning Support team Apr-11 Jun-11 Aug-11 Oct-11 Dec-11 Feb-12 Apr-12 Jun-12 Aug-12 Oct-12 Dec-12 Feb-13 GREE N Finance and Activity
The Royal Wolverhampton NHS Trust
 The Royal Wolverhampton NHS Trust Meeting Date: 3 th June 214 Trust Board Report Title: Executive Summary: Action Requested: Report of: Author: Contact Details: Resource Implications: Public or Private:
2017/18 Trust Balanced Scorecard
 ITEM 8b ENC 9 2017/18 Trust Balanced Scorecard Author: Performance Management Team March 2017 The purpose of this paper is to provide an update on the development of the 2017/18 Balanced Scorecard for
Integrated Performance Report
 Integrated Performance Report M04 July 2016 Presented by: Angela Stevenson (Chief Operating Officer) Des Holden (Medical Director) Fiona Allsop (Chief Nurse) Paul Simpson (Chief Financial Officer) An Associated
July (Month 4) Integrated Performance Report. John Grinnell, Director of Finance. Executive Directors. For Information For Discussion For Approval
 Integrated Performance Report. John Grinnell, Director of Finance. Executive Directors. For Information For Discussion For Approval") BOARD OF DIRECTORS Subject/Title July (Month 4) Integrated Performance Report Executive Responsible Paper prepared by (if different from above) John Grinnell, Director of Finance Executive Directors Nature
BOARD OF DIRECTORS Subject/Title July (Month 4) Integrated Performance Report Executive Responsible Paper prepared by (if different from above) John Grinnell, Director of Finance Executive Directors Nature
Section 1 - Key Performance Indicators
 Clinical Quality Report Month 6 2016/17 period ending 30th September 2016 Section 1 - Key Performance Indicators 1.1 NHS Improvement; Risk Assessment Framework Clostridium difficile Indicator M6 2 YTD
Quality & Performance Report. Public Board
 Agenda Item 12.1 Quality & Performance Report Public Board 27 th November 2014 Presented for: Presented by: Author: Previous Committees: Governance Professor Suzanne Hinchliffe CBE Chief Nurse / Interim
WEST HAMPSHIRE PERFORMANCE REPORT. Based on performance data available as at 11 th January 2018
 WEST HAMPSHIRE PERFORMANCE REPORT Based on performance data available as at 11 th January 2018 1 CCG Quality and Performance Executive Summary Introduction: The purpose of this report is to provide an
SUMMARY OF INDICATOR CHANGES FOR VERSION 3 INTELLIGENT MONITORING REPORTS Acute and Specialist NHS Trusts 23 June Final Draft, Subject to Change
 Never Event incidence Yes: 01 May 2013-30 Apr 2014 Incidence of Clostridium difficile (C.difficile) Incidence of Meticillin-resistant Staphylococcus aureus (MRSA) Dr Foster Intelligence: Mortality rates
SHEFFIELD TEACHING HOSPITALS NHS FOUNDATION TRUST EXECUTIVE SUMMARY REPORT TO THE TRUST BOARD HELD ON 18 NOVEMBER 2015
 SHEFFIELD TEACHING HOSPITALS NHS FOUNDATION TRUST EXECUTIVE SUMMARY REPORT TO THE TRUST BOARD HELD ON 18 NOVEMBER 2015 Subject: Supporting TEG Member: Authors: Status 1 Data Quality Baseline Assessment
Integrated Quality and Performance Report
 Integrated Quality and Performance Report Agenda Item No: 12.1 The Royal Wolverhampton NHS Trust Meeting Date: 28 th April 214 Trust Board Report Title: Executive Summary: Action Requested: Report of:
Report to: Trust Board 25 th April Enclosure 4. Title Integrated Performance Report March Sponsoring Executive Director
 Report to: Trust Board 25 th April 2013 Title Integrated Performance Report March 2013 Enclosure 4 Sponsoring Executive Director Author(s) Purpose Previously considered by Peter Herring Chief Executive
COVENTRY AND RUGBY CLINICAL COMMISSIONING GROUP
 COVENTRY AND RUGBY CLINICAL COMMISSIONING GROUP Report To: Governing Body 11 September 2013 Report From: Title of Report: Purpose of the Report: Jacqueline Barnes, Executive Nurse The Nursing and Quality
Governing Body. TITLE OF REPORT: Performance Report for period ending 31st December 2012
 - Governing Body DATE OF MEETING: TITLE OF REPORT: Performance Report for period ending 31st December 2012 KEY MESSAGES: We are responsible for securing improvements in the quality of care and health outcomes.
Newham Borough Summary report
 Newham Borough Summary report Item K1 September 2013 Prepared on 30/09/2013 by Support team GREEN Finance and Activity Millions AMBER RED Headlines M5 Financial position M4 activity data The QIPP net savings
Operational Focus: Performance
 Operational Focus: Performance Sandra Iskander Changes for 2015/16 Change of focus of 18-weeks and A&E 4-hour wait targets as recommended by Sir Bruce Keogh, Medical Director, NHS England. 18-weeks to
Quality & Performance Report Author: John Adler Sponsor: Chief Executive Date: FIC, PPP + QAC 28 th September Executive Summary from CEO
 UNIVERSITY HOSPITALS OF LEICESTER NHS TRUST PAGE 1 OF 2 Quality & Performance Report Author: John Adler Sponsor: Chief Executive Date: FIC, PPP + QAC 28 th September 2017 Executive Summary from CEO Paper
Balanced Scorecard. Paper 5.2. TRUST BOARD 24 th September 2015 TITLE EXECUTIVE SUMMARY
 TRUST BOARD 24 th September 2015 TITLE EXECUTIVE SUMMARY Balanced Scorecard The Trust reported an in-month deficit of 0.7m against a deficit budget of 0.6m, resulting in a year to date surplus to 0.2m
Newham Borough Summary report
 Newham Borough Summary report March 2013 Prepared on 18/03/13 by Commissioning Support team Finance and Activity Millions Apr-11 Jun-11 Aug-11 Oct-11 Dec-11 Newham Headlines March 2013 Feb-12 Apr-12 Jun-12
Strategic KPI Report Performance to December 2017
 Strategic KPI Report Performance to December 2017 Trust Board 25 th January 2018 Strategic KPI summary SROs: All Directors Objective KPI SRO Target Apr May Jun Jul Aug Sep Oct Nov Success Is Deliver A
NHS performance statistics
 NHS performance statistics Published: 8 th February 218 Geography: England Official Statistics This monthly release aims to provide users with an overview of NHS performance statistics in key areas. Official
RTT Recovery Planning and Trajectory Development: A Cambridge Tale
 RTT Recovery Planning and Trajectory Development: A Cambridge Tale Linda Clarke Head of Operational Performance Addenbrooke s Hospital I Rosie Hospital Apr 2014 May 2014 Jun 2014 Jul 2014 Aug 2014 Sep
SOUTHAMPTON UNIVERSITY HOSPITALS NHS TRUST Trust Key Performance Indicators April Regular report to Trust Board
 SOUTHAMPTON UNIVERSITY HOSPITALS NHS TRUST Trust Key Indicators April 2011 Report to: Trust Board 24 May 2011 Report from: Sponsoring Executive: Aim of Report / Principle Topic: Review History to date:
Summarise the Impact of the Health Board Report Equality and diversity
 AGENDA ITEM 4.1 Health Board Report INTEGRATED PERFORMANCE DASHBOARD Executive Lead: Director of Planning and Performance Author: Assistant Director of Performance and Information Contact Details for further
NHS Performance Statistics
 NHS Performance Statistics Published: 8 th March 218 Geography: England Official Statistics This monthly release aims to provide users with an overview of NHS performance statistics in key areas. Official
INTEGRATED PERFORMANCE REPORT. BOARD OF DIRECTORS 20 September 2017
 INTEGRATED PERFORMANCE REPORT BOARD OF DIRECTORS 20 September 2017 1 S Section Page Executive Summary 4 Trust Performance Overview 7 Trust Performance Report by Exception 9 MSSA Bacteraemia - Actual numbers
Board of Director s Meeting
 Board of Director s Meeting Meeting Date: 15 November 212 Agenda item: 6.1 Title: Purpose: Summary: Recommendation: Author: Presented by: QUALITY AND PATIENT SAFETY ASSURANCE COMMITTEE To provide an exception
Supporting all NHS Trusts to achieve NHS Foundation Trust status by April Ipswich Hospital NHS Trust NHS East of England Department of Health
 TFA document Supporting all NHS Trusts to achieve NHS Foundation Trust status by April 2014 Tripartite Formal Agreement between: Ipswich Hospital NHS Trust NHS East of England Department of Health Introduction
Question 1 a) What is the Annual net expenditure on the NHS from 1997/98 to 2007/08 in Scotland? b) Per head of population
 What is the Annual net expenditure on the NHS from 1997/98 to 2007/08 in Scotland? b) Per head of population") NHS SPENDING - SCOTLAND Question 1 a) What is the Annual net expenditure on the NHS from 1997/98 to 2007/08 in Scotland? b) Per head of population Question 2 a) Annual real (GDP deflated) increase in net
NHS SPENDING - SCOTLAND Question 1 a) What is the Annual net expenditure on the NHS from 1997/98 to 2007/08 in Scotland? b) Per head of population Question 2 a) Annual real (GDP deflated) increase in net
TRUST BOARD MEETING 24 JULY 2013 PERFORMANCE REPORT MONTH 3 DIRECTOR OF OPERATIONS DIRECTOR OF OPERATIONS DIRECTOR OF OPERATIONS
 TRUST BOARD MEETING 24 JULY 2013 PERFORMANCE REPORT MONTH 3 def Agenda Item: 10c PURPOSE PREVIOUSLY CONSIDERED BY Objective(s) to which issue relates * Risk Issues (Quality, safety, financial, HR, legal
EAST AND NORTH HERTFORDSHIRE NHS TRUST
 Agenda item: 5 EAST AND NORTH HERTFORDSHIRE NHS TRUST Minutes of the Trust Board meeting held in public on Wednesday 24 July 2013 at 2pm in the Post Graduate Centre, QEII Hospital. Present: Mr Ian Morfett
Integrated Performance Report August 2017
 Integrated Performance Report Contents Section Page High Level Dashboard Balanced scorecard 3 Domain Scorecards and Director Commentaries Operational Performance 4 Quality and Patient Safety 9 Workforce
Ayrshire and Arran NHS Board
 Paper 12 Ayrshire and Arran NHS Board Monday 26 March 2018 Financial Management Report for the 11 months to 28 February 2018 Author: Bob Brown, Assistant Director of Finance Governance and Shared Services
NHS performance statistics
 NHS performance statistics Published: 14 th December 217 Geography: England Official Statistics This monthly release aims to provide users with an overview of NHS performance statistics in key areas. Official
Integrated Quality and Performance Report
 Item 6 Integrated Quality and Performance Report Herts Valleys CCG Board 1 st August 2013 Period of {MONTH HERE} 1 Introduction to the Integrated Performance Report 1. Purpose of this Report 1.1 This report
Delivering Improvement in Practice
 v Delivering Improvement in Practice NHS Providers Governance Conference 7 July 2016 Sir Mike Aaronson Chairman, Frimley Health NHS Foundation Trust 2006-2016 Frimley Health FT Comprises: Frimley Park
NHS BOLTON CLINICAL COMMISSIONING GROUP Public Board Meeting AGENDA ITEM NO: 10. Date of Meeting:.24 th March 2017.
 NHS BOLTON CLINICAL COMMISSIONING GROUP Public Board Meeting AGENDA ITEM NO: 10 Date of Meeting:.24 th March 2017. TITLE OF REPORT: CCG Corporate Performance Report AUTHOR: Melissa Laskey Director of Service
MERTON CLINICAL COMMISSIONING GROUP GOVERNING BODY
 MERTON CLINICAL COMMISSIONING GROUP GOVERNING BODY Date of Meeting: 23 rd March 2017 Agenda No: 9.3 Attachment: 15 Title of Document: CCG Governing Body Assurance Report & Scorecards: Month 9 Quality &
Safe Nurse Staffing Levels. June 2017
 Safe Nurse Staffing Levels Executive Summary June 2017 The purpose of this report is: 1. To provide an assurance with regard to the management of safe nursing and midwifery staffing for the month of June
Quality Improvement Scorecard November 2017
 Mortality: HSMR Performance remained below target in July Nat NB: Each month is a 12 month rolling value. I.e. Mar-16 reports the monthly average of Apr-15 to Mar-16. Mortality: HSMR (weekday) vs. HSMR
DELIVERING THE LONDON QUALITY STANDARDS AND 7 DAY SERVICES
 Enclosure I DELIVERING THE LONDON QUALITY STANDARDS AND 7 DAY SERVICES Trust Board Meeting Item: 13 Date: 25 th May 2016 Purpose of the Report: Enclosure: I To update the Board on the Trust s current performance
Appendix A: University Hospitals Birmingham NHS Foundation Trust Draft Action Plan in Response to CQC Recommendations
 No. Domain CQC Recommendation Lead Operational Lead Current Status 1 Appendix A: University Hospitals Birmingham NHS Foundation Trust Draft Action Plan in Response to CQC Recommendations Wording in long
April Clinical Governance Corporate Report Narrative
 April 14 - Clinical Governance Corporate Report Narrative ITEM 7B Narrative has been provided where there is something of note in relation to a specific metric; this could be positive improvement, decline
Item E1 - Bart s Health Quality Indicators
 Item E1 - Bart s Health Quality Indicators 1.0 Purpose 1.1 The purpose of this report is to provide the CCG Board with an update on quality matters across pertaining to our main local Provider organisations.
Dudley & Walsall Mental Health Partnership NHS Trust Board
 Dudley & Walsall Mental Health Partnership NHS Trust Board Date of Board Meeting: 29 th July 2 Subject: Performance Corporate Dashboard Month 3 Trust Board Lead: Jacky O Sullivan, Director of Performance
WAITING TIMES AND ACCESS TARGETS
 NHS Board Meeting Tuesday 17 February 2015 Chief Officer (Acute Services) Board Paper No.15/08 WAITING TIMES AND ACCESS TARGETS Recommendation: The NHS Board is asked to note progress against the national
November NHS Rushcliffe CCG Assurance Framework
 November 2015 NHS Rushcliffe CCG Assurance Framework ASSURANCE FRAMEWORK SUMMARY No. Lead & Sub Committee Date placed on Assurance Framework narrative Residual rating score L I rating in 19 March 2015
Trust Key Performance Indicators
 Monthly - February 2007 Patient Experience Length of Stay - Overall A Mortality Rate G Cancelled Operations R Elective A Peri-operative Mortality Rate Cancelled Operations (28 day reschedule) A Non-elective
Integrated Performance Report. NHS Rotherham Board 6 July 2011
 Integrated Performance Report NHS Rotherham Board 6 July 2 CONTENTS Introduction Pg 2 Efficiency Pg 3-6 Rotherham Outcomes Pg 7- Contract Performance Pg -13 Finance Pg 14-15 1 INTRODUCTION Report format..
Quality Improvement Scorecard March 2018
 Mortality: HSMR Nat NB: Each month is a 12 month rolling value. I.e. Mar-16 reports the monthly average of Apr-15 to Mar-16. Performance further improved in October. November data not yet available. Mortality:
Reporting to: Trust Board Meeting - 26 th June Title Integrated Performance Report - May 2014/15. Previously considered by Not Applicable
 Reporting to: Trust Board Meeting - 26 th June 2014 Paper 6 Title Integrated Performance Report - May 2014/15 Sponsoring Director Author(s) Peter Herring - Chief Executive Directors Previously considered
Supporting all NHS Trusts to achieve NHS Foundation Trust status by April 2014
 TFA document Supporting all NHS Trusts to achieve NHS Foundation Trust status by April 2014 Tripartite Formal Agreement between: Hertfordshire Community NHS Trust NHS East of England Department of Health
NHS England London Southside 4th Floor 105 Victoria Street London SW1E 6QT. 24 th July Dear Daniel, Fiona and Louise. Re: CCG Annual Assurance
 NHS England London Southside 4th Floor 105 Victoria Street London SW1E 6QT 24 th July 2014 Dear Daniel, Fiona and Louise Re: CCG Annual Assurance Many thanks for meeting with us on 6 th June 2014 to discuss
Nottingham University Hospitals Emergency Department Quality Issues Related to Performance
 RCCG/GB/14/123 Nottingham University Hospitals Emergency Department Quality Issues Related to Performance Introduction NUH have failed to meet the 95% 4 hour wait standard for a number of consecutive months.
Annual General Meeting 17 September 2014
 Annual General Meeting 17 September 2014 Quality Accounts Mike Wright Executive Director of Nursing & Patient Experience Director of Infection Prevention and Control Quality Account 2013/14 2013/14 in
2016/17 Activity Report April August/September 2016
 Due to a change in national hospital data flows (SUS) and also a delay in processing September 2016 Practice-level finance data, the latest information on hospital activity and spend is still up to August
Mortality Report Learning from Deaths. Quarter
 Mortality Report Learning from Deaths Quarter 3 2017 Introduction In December 2016 the CQC report Learning, Candour and accountability: A review of the way NHS Trusts review and investigate the deaths
Integrated Quality and Performance Report (IQPR)
") Management Board 28 th November 2012 Trust Public Board 29 th November 2012 Integrated Quality and Performance Report (IQPR) M07 October 2012 Presented by: Bernie Bluhm (Chief Operating Officer) Author:
Management Board 28 th November 2012 Trust Public Board 29 th November 2012 Integrated Quality and Performance Report (IQPR) M07 October 2012 Presented by: Bernie Bluhm (Chief Operating Officer) Author:
Integrated Performance Report Executive Summary (for NHS Fife Board Meeting) Produced in February 2018
 Produced in February 2018") 6b Integrated Performance Report Executive Summary (for NHS Fife Board Meeting) Produced in February 2018 2 Contents Integrated Performance Report: Executive Summary 5 Clinical Governance: Chair and Committee
6b Integrated Performance Report Executive Summary (for NHS Fife Board Meeting) Produced in February 2018 2 Contents Integrated Performance Report: Executive Summary 5 Clinical Governance: Chair and Committee
Prime Contractor Model King s Fund Nick Boyle Consultant Surgeon 27 March 2014
 Prime Contractor Model King s Fund Nick Boyle Consultant Surgeon 27 March 2014 Current Referral Route options - Information 1. Horizon Health Choices Horizon Musculoskeletal Triage & Treatment Chronic
21 March NHS Providers ON THE DAY BRIEFING Page 1
 21 March 2018 NHS Providers ON THE DAY BRIEFING Page 1 2016-17 (Revised) 2017-18 (Revised) 2018-19 2019-20 (Indicative budget) 2020-21 (Indicative budget) Total revenue budget ( m) 106,528 110,002 114,269
Hard Truths Public Board 29th September, 2016
 Hard Truths Public Board 29th September, 2016 Presented for: Presented by: Author Previous Committees Governance Professor Suzanne Hinchliffe CBE, Chief Nurse/Deputy Chief Executive Heather McClelland
Integrated Performance Report
 ENC Bi Integrated Performance Report M1 2014/15 26 June 2014 Contents 1. Structure of the Document... 3 2. Southwark CCG and Providers Performance Summary Dashboard... 4 3. Southwark CCG Dashboard... 5
N/A N/A. 60% No data No data No data 40.0% 81.3% No data No data No data No data
 Acute Quality and Performance Metrics For the period ending 31st May 2013 APPENDIX 1 Measures Target M1 M2 YTD Weston UHB NBT Exception RAG / DoT M1 M2 YTD RAG / DoT M1 M2 YTD RAG / DoT Reference RTT:
EXECUTIVE SUMMARY REPORT TO THE BOARD OF DIRECTORS HELD ON 22 MAY Anne Gibbs, Director of Strategy & Planning
 EXECUTIVE SUMMARY D REPORT TO THE BOARD OF DIRECTORS HELD ON 22 MAY 2018 Subject Supporting TEG Member Author Status 1 A review of progress against Corporate Objectives 2017/18 and planned Corporate Objectives
WAITING TIMES 1. PURPOSE
 Agenda Item Meeting of Lanarkshire NHS Board 28 April 2010 Lanarkshire NHS board 14 Beckford Street Hamilton ML3 0TA Telephone 01698 281313 Fax 01698 423134 www.nhslanarkshire.org.uk WAITING TIMES 1. PURPOSE
Health Board Report INTEGRATED PERFORMANCE DASHBOARD
 AGENDA ITEM 4.2 27 th January 2016 Health Board Report INTEGRATED PERFORMANCE DASHBOARD Executive Lead: Director of Planning and Performance Author: Assistant Director of Performance and Information Contact
University Teaching Trust. Salford Royal NHS Foundation Trust
 University Teaching Trust Salford Royal NHS Foundation Trust Annual Report and Accounts 1 April 215 to 31 March 216 Salford Royal NHS Foundation Trust Annual Report and Accounts 1 April 215 to 31 March
Reducing Elective Waits: Delivering 18 week pathways for patients. Programme Director NHS Elect Caroline Dove.
 Reducing Elective Waits: Delivering 18 week pathways for patients Programme Director NHS Elect Caroline Dove What I will cover 1. Why 18 Weeks is different 2. Where are we now 3. New models of delivery
Quality Improvement Scorecard December 2017
 Mortality: HSMR Performance improved in August Nat NB: Each month is a 12 month rolling value. I.e. Mar-16 reports the monthly average of Apr-15 to Mar-16. Mortality: HSMR (weekday) vs. HSMR (weekend)
Agenda Item: 10.1 (3) HR & OD Monthly Trust Report (September 2016)
 HR & OD Monthly Trust Report (September 2016)") Agenda Item: 10.1 (3) HR & OD Monthly Trust Report (September 2016) Prepared by: Karen Taylor, Assistant Director of HR & Kyriacos Kyriacou, Interim Deputy Director of HR & OD Presented by: Louise Ludgrove,
Agenda Item: 10.1 (3) HR & OD Monthly Trust Report (September 2016) Prepared by: Karen Taylor, Assistant Director of HR & Kyriacos Kyriacou, Interim Deputy Director of HR & OD Presented by: Louise Ludgrove,
WAITING TIMES AND ACCESS TARGETS
 NHS Board Meeting Tuesday 21 April 2015 Chief Officer (Acute Services) Board Paper No.15/17 WAITING TIMES AND ACCESS TARGETS Recommendation: The NHS Board is asked to note progress against the national
TAMESIDE & GLOSSOP INTEGRATED CARE NHS FOUNDATION TRUST
 TAMESIDE & GLOSSOP INTEGRATED CARE NHS FOUNDATION TRUST Report to Public Trust Board meeting of the 29 th June 2017 Agenda Item 7b Title Sponsoring Executive Director Author (s) Purpose Previously considered
Performance and Quality Report Sean Morgan Director of Performance and Delivery Mary Hopper Director of Quality Dino Pardhanani, Clinical Director
 Sutton CCG Clinical Commissioning Group Governing Body Date Thursday, 06 September 2018 Document Title Lead Director (Name and Role) Clinical Sponsor (Name and Role) Performance and Quality Report Sean
Ayrshire and Arran NHS Board
 Paper 12 Ayrshire and Arran NHS Board Monday 9 October 2017 Planned Care Performance Report Author: Fraser Doris, Performance Information Analyst Sponsoring Director: Liz Moore, Director for Acute Services
STATEMENT OF PURPOSE August Provided to the Care Quality Commission to comply with The Health & Social Care Act (2008)
") 1. Trust Profile STATEMENT OF PURPOSE August 2015 Provided to the Care Quality Commission to comply with The Health & Social Care Act (2008) 1.1 Worcestershire Acute Hospitals NHS Trust was formed on 1
1. Trust Profile STATEMENT OF PURPOSE August 2015 Provided to the Care Quality Commission to comply with The Health & Social Care Act (2008) 1.1 Worcestershire Acute Hospitals NHS Trust was formed on 1
Integrated Performance Report
 Mid Essex, Southend and Basildon Hospitals Joint Working Board 05/04/2017, 2pm Integrated Performance Report February 2017 Mid Essex, Southend and Basildon Hospitals Introduction by CEO February 2017 The
HERTFORDSHIRE COMMUNITY HEALTH SERVICES
 HERTFORDSHIRE COMMUNITY HEALTH SERVICES Minutes of the Hertfordshire Community Health Services Board Meeting Held on Thursday 22 nd July 2010 in the Boardroom, Howard Court Welwyn Garden City. Key Points
NHS LANARKSHIRE QUALITY DASHBOARD Board Report October 2011 (Data available as at end August 2011)
") NHS LANARKSHIRE QUALITY DASHBOARD Board Report October 2011 (Data available as at end August 2011) INTRODUCTION This paper provides a monthly quality dashboard for NHS Lanarkshire. This is in line with
NHS LANARKSHIRE QUALITY DASHBOARD Board Report October 2011 (Data available as at end August 2011) INTRODUCTION This paper provides a monthly quality dashboard for NHS Lanarkshire. This is in line with
WAITING TIMES AND ACCESS TARGETS
 NHS Board Meeting Tuesday 17 December 2013 Lead Director (Acute Services Division) Board Paper No 13/60 Recommendation: WAITING TIMES AND ACCESS TARGETS The NHS Board is asked to note progress against
Quality & Performance Report Author: John Adler Sponsor: Chief Executive Date: PPPC + QOC 21 ST December 2017
 UNIVERSITY HOSPITALS OF LEICESTER NHS TRUST PAGE 1 OF 2 Quality & Performance Report Author: John Adler Sponsor: Chief Executive Date: PPPC + QOC 21 ST December 2017 Executive Summary from CEO Joint Paper
Quarter /13 Quality Account (Quality and Safety)
") Airedale NHS Foundation Trust Board of Directors:23 rd January 213 Title: Quarter 2 212/13 Quality Account (Quality and Safety) Author: Alison Fuller, Assistant Director Healthcare Quarter 2 212/13 Quality
Airedale NHS Foundation Trust Board of Directors:23 rd January 213 Title: Quarter 2 212/13 Quality Account (Quality and Safety) Author: Alison Fuller, Assistant Director Healthcare Quarter 2 212/13 Quality
Agenda item: 5 EAST AND NORTH HERTFORDSHIRE NHS TRUST
 Agenda item: 5 EAST AND NORTH HERTFORDSHIRE NHS TRUST Minutes of the Trust Board meeting held in public on Wednesday 25 th February 2009 at 2.00 pm in Rooms 2 and 3 at Hertford County Hospital DRAFT Present:
Quality Improvement Scorecard June 2017
 Mortality: HSMR Nat NB: Each month is a 12 month rolling value. I.e. Mar-16 reports the monthly average of Apr-15 to Mar-16. Performance remained below target in February. Mortality: HSMR (weekday) vs.
RTT Assurance Paper. 1. Introduction. 2. Background. 3. Waiting List Management for Elective Care. a. Planning
 RTT Assurance Paper 1. Introduction The purpose of this paper is to provide assurance to Trust Board in relation to the robust management of waiting lists and timely delivery of elective patient care within
EAST AND NORTH HERTFORDSHIRE NHS TRUST CHIEF EXECUTIVE S REPORT
 EAST AND NORTH HERTFORDSHIRE NHS TRUST CHIEF EXECUTIVE S REPORT Agenda Item No. 7 23 rd January 2008 1. Christmas Day Visit From Mayor of Stevenage and General Secretary, Royal College of Nursing Alison
Executive Workforce Report
 Executive Workforce Report (v2) Safe & Effective Kind & Caring Exceeding Expectation Agenda Item No: 9.3 The Royal Wolverhampton NHS Trust Trust Board Report Meeting Date: 27 th November 2017 Title: Executive
NHS Ashford Clinical Commissioning Group. Integrated Performance Report. November 2013
 NHS Ashford Clinical Commissioning Group Integrated Performance Report November 2013 Page 1 Contents Executive Summary... 6 Assurance Framework Overview... 10 Are local people getting good quality care?...
Learning from Patient Deaths: Update on Implementation and Reporting of Data: 5 th January 2018
 Learning from Patient Deaths: Update on Implementation and Reporting of Data: 5 th January 218 Purpose The purpose of this paper is to update the Trust Board on progress with implementing the mandatory
Redesign of Front Door
 Redesign of Front Door Transforming Acute and Urgent Care Strategic Background and Context Our Change and Improvement Programme What have we achieved and how? What did we learn? Ian Aitken, General Manager
NHS Electronic Referrals Service. Paper Switch Off an update Digital Health Webinar 4 May 2018
 NHS Electronic Referrals Service Paper Switch Off an update Digital Health Webinar 4 May 2018 Aims of Session Introductions and refresh of Paper Switch Off Sharon Wilson Implementation manager NHS Digital
CQC Quality Improvement Plan
 2018-19 CQC Quality Improvement Plan Date of Submission: 21/03/2018 Chief Executive: Lance McCarthy Chair Alan Burns Navigation Our Patients Our People Our Performance Our Places Key The table below identifies
Standardising Acute and Specialised Care Theme 3 Governance and Approach to Hospital Based Services Strategy Overview 28 th July 2017
 Standardising Acute and Specialised Care Theme 3 Governance and Approach to Hospital Based Services Strategy Overview 28 th July 2017 Background Theme 3 builds upon previous key strategic commissioning
Quality Improvement Scorecard February 2017
 Mortality: HSMR Nat Performance continued to improve into Q3 2016/17. NB: Each month is a 12 month rolling value. I.e. Mar-16 reports the monthly average of Apr-15 to Mar-16. Mortality: HSMR (weekday)
A&E Clinical Quality Indicators
 A&E Clinical Quality Indicators Overview This dashboard presents a comprehensive and balanced view of the care delivered by our A&E department, and reflects the experience and safety of our patients and
Integrated Quality Report
 Integrated Quality Report Data provided by Patient Services and the Clinical Governance and Risk Department June 2018 Included this month: Health-care Associated Infections Patient Falls Pressure Ulcers