The Final Report of the Evaluation of the Court Support Services Division s Probation Transition Program
|
|
|
- Patricia Chandler
- 6 years ago
- Views:
Transcription

1 The Final Report of the Evaluation of the Court Support Services Division s Probation Transition Program Stephen M. Cox, Ph.D. Professor, Department of Criminology and Criminal Justice Kathleen Bantley, J.D. Associate Professor, Department of Criminology and Criminal Justice Sarah Newton Graduate Assistant, Department of Criminology and Criminal Justice June 2010 This project was funded in part through a contract from the Connecticut Judicial Branch, Court Support Services Division. The Connecticut Judicial Branch nor any of its components are responsible for, or necessarily endorse, the views expressed in this report.
2 EXECUTIVE SUMMARY The Judicial Branch s Court Support Services Division (CSSD) began accepting probationers into the Probation Transition Program (PTP) on October 1, 2004 in five probation offices. The PTP targeted inmates who had probation sentences that followed their prison sentence and subsequent release from the Department of Correction (DOC). The overarching goal was to reduce the technical violation rate of split sentence probationers by helping them reenter their community following prison release. In theory, the lower caseloads would allow PTP officers to spend more time assessing probationers, helping them find appropriate services, and monitoring their behavior. Legislative funding to the Judicial Branch to hire more probation officers led to the statewide expansion of the PTP in February of Faculty from the Department of Criminology and Criminal Justice from were contracted to evaluate the PTP expansion. The following report summarizes the findings and conclusions of this evaluation. Areas of Research The evaluation focused on three primary areas. First, we met with and interviewed PTP officers regarding their attitudes about PTP, their perception of its success, and barriers that hindered its ability to be successful. Second, as part of assessing the implementation of the PTP, we examined the intake process in terms of looking at the number of probationers who entered the program and the general profile of PTP clients. Third, data were collected for every client in the PTP and a comparable group of probation officers on regular caseloads to assess program outcomes in terms of probation violation rates and reincarceration rates. We looked at the nature of the violations (new arrest vs. technical violation) and attempted to determine what client factors were associated with being violated (e.g., LSI-R risk level, criminal history, gender, age, marital status, education, and employment). Summary of Findings The process and outcome components of the PTP evaluation produced four distinct conclusions. First, PTP was widely implemented in a manner consistent with the program model. We found few differences in the demographics and risk scores of PTP clients across the three study groups in the pilot offices and across the statewide expansion offices. These findings suggest the selection criteria were being applied consistently across offices. There was also a high amount of consistency in the program completion rate (over 70% of clients were successfully transitioned into a regular caseload) across the expansion offices. The consistent program implementation resulted in similar outcomes across PTP offices. With the exception of a few of offices, the percentages of PTP clients technically violated were similar across the pilot and expansion offices. Second, the PTP appeared to be targeting the highest risk offenders. CSSD policy dictated that PTP officers give priority to split-sentenced probationers with (1) insufficient familial and/or peer support; (2) lack of housing; (3) extensive criminal history; (4) extensive drug abuse; (5) history of mental health problems; (6) lack of employment; and, (7) a high total risk score on the LSI-R. The majority of PTP participants were single/never married and 1
3 unemployed with high LSI-R total risk scores. In fact, PTP participants in the expansion groups had much higher LSI-R total risk and subscale scores than PTP participants in the pilot study. Third, split-sentenced probationers in the PTP had statistically lower technical violation rates and were statistically less likely to be sentenced to prison for technical violations than similar groups of probationers. Specifically, comparison group probations were much more likely to be technically violated than PTP clients in the pilot offices (more than twice as likely) and the statewide expansion offices (almost twice as likely). Our first evaluation of the pilot PTP program concluded that PTP reduced the technical violation rates of split-sentenced probationers and also reduced the number of split-sentenced probationers who were resentenced to prison for technical violations. The evaluation of the statewide expansion found that PTP still produced lower technical violation rates in the five pilot offices and also in the statewide expansion probation offices. The final conclusion of this evaluation concerns the exploration of factors associated with arrests and technical violations. There were differences in those PTP clients arrested versus those who were technically violated. PTP clients who were arrested resembled the demographic most likely to be arrested in general: young males with prior criminal records who were unemployed, used drugs and/or alcohol, and had a peer group who likely encouraged their criminal behavior. In contrast, PTP clients most likely to receive technical violations had several risk factors associated with instability. They were unemployed, had unstable housing, used alcohol or drugs, and had a negative peer group (they were also younger probationers with criminal histories). Overall Conclusion and Recommendations Our overall conclusion was the PTP was effective in reducing technical violations and new prison sentences from technical violations. The PTP was implemented consistently in the pilot offices and the statewide expansion offices while targeting high risk probationers. We do, however, offer the following recommendations to improve the delivery of the PTP: More PTP specific training for PTP officers that includes a detailed presentation of the PTP purpose and model. Develop better and more consistent communication methods with the Department of Correction. Identify and develop more skills-based and employment services for PTP clients. Unemployment was a major factor for PTP participants who were arrested and technically violated. While it was not part of our evaluation, it is important to acknowledge the progress CSSD has made in automating its case management system (CMIS) and also enhancing its internal ability to conduct research. One aspect of CSSD s 2004 report to the General Assembly included the creation of a component involving research and evaluation. CSSD did establish the Center for Research, Program Analysis and Quality Improvement. Since its inception, this unit has greatly furthered CSSD s ability to implement and sustain evidence-based practices by disseminating probationer information and assessments to probation supervisors and program staff, conducting internal research and evaluation of its programs, and supporting external research and evaluation initiatives. 2
4 TABLE OF CONTENTS EXECUTIVE SUMMARY... 1 INTRODUCTION AND BACKGROUND OF THE PROGRAM... 4 IMPLEMENTATION OF THE PROBATION TRANSITION PROGRAM... 6 Screening and Selection Process... 6 Program Operation... 7 PTP Officer Selection... 7 Training... 8 EVALUATION METHODOLOGY... 9 Areas of Research... 9 Research Design and Data... 9 Definition and Measurement of Recidivism Creation of the PTP Comparison Groups EVALUATION FINDINGS PTP Probation Officer Interviews Background and Training Caseload Management Technical Resources Client Referrals to the PTP Outcome Analysis PTP Completion Rates Program Outcomes: New Arrests and Technical Violations Factors Influencing One Year PTP Outcomes Table 24. Multinomial Regression For New Arrests and Technical Violations Comparison Group Analysis Summary of the Outcome Analysis EVALUATION CONCLUSIONS AND RECOMMENDATIONS Conclusions Overall Conclusion and Recommendations APPENDIX A CSSD S PTP POLICY APPENDIX B PROBATION OFFICER INTERVIEW INSTRUMENT APPENDIX C PTP AND COMPARISON GROUP DEMOGRAPHICS AND LSI-R SCORES
5 INTRODUCTION AND BACKGROUND OF THE PROGRAM Prison and jail overcrowding has been a concern in Connecticut since the early 1990s. The prison population increased 82% (10,573 to 19,216) between 1992 and 2003 with the largest increase taking place with accused offenders awaiting trial or sentencing (145% during this time period) (see the 2003 State of Connecticut Prison and Jail Overcrowding Commission s report). One commonly held belief was that probation violators comprised a high percentage of the prison population (some estimates reported that over 25% of Connecticut inmates were probation violators) with a significant number of probationers being sentenced to prison for technical violations. As a response to concerns over the prison population, the Connecticut General Assembly passed Public Act , An Act Concerning Prison Overcrowding, on May 19, Governor Rowland signed this act into law on June 8, 2004 and it went into effect on July 1, The Act introduced several ways to reduce the number of people being incarcerated. One aspect of this legislation specifically pertained to the Judicial Branch. Sec. 26 (a) required the Judicial Branch to submit a plan, no later than October 15, 2004, to the joint standing committees of the General Assembly, to reduce by at least twenty percent the number of incarcerations resulting from technical violations of conditions. In accordance with the time frames indicated above, the Judicial Branch s Court Support Services Division (CSSD) submitted A Report on Strategies to Reduce Technical Violations of Probation on October 15, This report outlined a four-point program to reduce violations of probation. The proposed program consisted of a case management plan, a response to noncompliance policy change, the introduction of two special probation projects, and lastly, a component involving research and evaluation. The two special probation projects were the Probation Transition Program (PTP) and the Technical Violations Units (TVU). These projects were aimed at reducing the number of technical violations for two different groups of probationers. The PTP targeted inmates who had terms of probation upon their discharge from the Department of Correction (i.e., split sentenced probationers). The targeted PTP pool included all inmates, excluding sex offenders, who served a sentence of 90 days or more, and who would be discharged from DOC custody with a period of probation to follow. The goal of this program was to reduce technical violations for split sentenced probationers by better helping them re-enter their communities following prison release. The TVU targeted probationers not complying with their court or probation officerordered terms of probation and were about to receive a technical violation (e.g., deliberate or repeated non-compliance with court ordered conditions, reporting requirements, and service treatment requirements). The Technical Violations Unit program was designed to reduce the number of probationers sentenced to incarceration as a result of technical violations of probation. TVU officers had lower caseloads so they could attempt to stabilize clients to avoid having to technically violate them. 4
6 The PTP was initially piloted in five probation offices across Connecticut. Two probation officers staffed the PTP at each of the five probation office locations: Bridgeport, Hartford, New Haven, New London, and Waterbury. While each probation officer ideally had a maximum caseload no higher than 25 probationers, the actual caseload size varied by location. PTP officers were given access to motor vehicles, cell phones, and laptop computers. Also, services were available to probationers 24 hours a day and seven days a week. Faculty from s Department of Criminology and Criminal Justice were contracted to evaluate the pilot PTP. A report was released in January of 2005 finding that the PTP met the legislative mandate by reducing the number of probation technical violators being resentenced to prison by 20%. A subsequent report released in August of 2006 had two major findings. First, PTP participants had significantly lower probation violation rates than the PTP comparison group (36% to 52%) one year after their release from prison. This difference was directly attributed to a lower technical violation rate (14% for the PTP and 26% for the PTP comparison group). Second, the Level of Service Inventory Revised (LSI-R) overall risk level was a significant predictor of PTP success, in that, the higher the risk level the more likely PTP clients would be violated (although the PTP violation rate was lower than the PTP comparison group at every risk level). This finding was supported by the comparison of violators to non-violators. PTP violators had significantly higher risk scores across most of the LSI-R subscales. Third, the reincarceration rate for PTP (17%) was significantly lower than the PTP comparison group (41%). While some of these differences were explained by the lower probation violation rates, judges were also less likely to sentence PTP technical violators to prison than technical violators in the PTP comparison group. As a result of the success of the pilot program, the General Assembly provided additional funding to the Judicial Branch for the expansion of the PTP. The goal was to have PTP officers in probation offices throughout Connecticut and incorporate those practices leading to the success of the pilots. These were lower specialized caseloads (which allowed probation officers to be more accessible to clients), availability of services, and initial and ongoing training from CSSD staff and outside experts. Another key component of the PTP pilot was the 24 hour a day/seven day a week availability of probation officers by providing them with laptop computers, cellular telephones, and automobiles. Expansion of PTP began on February 1, This document presents the overall process and outcome findings of the Probation Transition Program evaluation. It begins with a description of the Probation Transition Program and is followed by a summary of the evaluation methodology. The evaluation findings are presented in the next section that discusses the results of the probation officer interviews and is followed by the analysis of probation and court data. The final section of the report presents the overall conclusions and recommendations for future programming and practice. 5
7 IMPLEMENTATION OF THE PROBATION TRANSITION PROGRAM The Probation Transition Program (PTP) targeted inmates who had probation sentences following their prison sentence and subsequent release from the Department of Correction (DOC). This group included those discharging at the end of sentence from a correctional facility, halfway house, parole, transitional supervision or a re-entry furlough. The overarching goal was to reduce the technical violation rate of split sentence probationers by helping them reenter their community following prison release. In theory, the lower caseloads would allow PTP officers to spend more time assessing probationers, helping them find appropriate services, and monitoring their behavior. Screening and Selection Process PTP officers received periodic reports from the Department of Correction identifying inmates with split sentences who were serving 30 or more days of a prison sentence. PTP officers received these reports and conducted preliminary reviews of inmates court and probation records. PTP officers were required to meet with all split sentence probationers prior to their prison release (with the exception of sex offenders who were not eligible for the PTP). After this initial determination, PTP officers met with inmates in correctional institutions to review conditions of probation and probationers obligation to report to their probation offices on a specific dates. PTP officers also conducted in-depth assessments through an LSI-R (Level of Service Inventory-Revised) and ASUS-R (Adult Substance Use Survey-Revised). The LSI-R is a 54 item assessment instrument that identified risks and needs. It was composed of ten subscales that have been found to be predictive of recidivism (criminal history, education/employment, financial, family/marital, accommodation, leisure/recreation, companions, alcohol/drug problems, emotional/personal, and attitude/orientation). The ASUS-R is a 96 item survey that screens and assesses individuals alcohol and drug use involvement. PTP officers used this information to create case plans and begin arranging for appropriate services when inmates left prison and started their probation sentence. The more commonly identified areas of need were housing, employment, substance abuse, and mental health treatment. These services were provided in a variety of ways and varied by location since available resources varied by location throughout the state. If there were situations where PTP officers were at caseload capacity, priority was given to inmates with (1) insufficient familial and/or peer support; (2) lack of housing; (3) extensive criminal history; (4) extensive drug abuse; (5) history of mental health problems; (6) lack of employment; and, (7) a high total risk score on the LSI-R. Within the first 5 business days of release from a DOC facility, PTP officers met with probationers in the office or in the community. Given the extent of the pre-release planning, PTP officers attempted to secure needed services before probationers left prison. In general, four face-to-face and two collateral contacts per month were made during the first four months of supervision with additional contacts made as needs arose. The goal was to stabilize probationers during this time and transition them to regular probation caseloads (see Appendix A for CSSD s PTP policies). 6
8 Program Operation For the piloting of the PTP, each probation office had its own method of operating. For example, some locations used the same PTP officer to do both the intake in the correctional facility and the supervision of the inmate upon release. In those cases, officers had a maximum of 25 probationers. Other locations divided the workload by having only one of the PTP officers do the initial screening and assessment and the other do the supervision. These officers typically had a caseload that was larger than 25 probationers. Following the statewide expansion of PTP, CSSD made two specific changes to the daily operation of it. First, caseload sizes were increased to 35 probationers per officer. CSSD determined that this increase from 25 to 35 would not significantly decrease the effectiveness of the PTP. Second, CSSD adapted a regional PTP approach. That is, each region was allowed to develop its own PTP model as long as the PTP policies were followed. The reason for the regional approach was that it was more efficient to have PTP offices share resources than have each office operate on its own. For example, it was inefficient for two PTP officers from two different offices in the same region to go to the same prison each day to interview and assess PTP-eligible inmates. Under the regional model, one PTP officer would go to the prison to interview and assess all PTP-eligible inmates in that region and simply forward the assessments to other PTP officers. In the piloting of the PTP, all PTP officers were given access to automobiles, cell phones, and laptop computers. However, additional expansion funding was not provided for automobiles or laptop computers. PTP officers had to share motor vehicles with other probation officers in their offices or had to use their personal vehicles. Decreases in the overall operating budget caused CSSD to stop issuing laptop computers altogether for PTP officers. PTP supervision was designed to last 30 to 120 days from a clients release from prison but probationers could remain in PTP after this time period with approval from the PTP officers supervisors. PTP participants were transitioned from PTP to a regular probation caseload after the PTP officer believed that a probationer was successfully re-integrated back into the community. Clients had to remain in PTP for a minimum of 30 days and could be transitioned after they were responding well to being back in the community. PTP Officer Selection Probation officers were asked to volunteer to be PTP officers. In offices where multiple probation officers volunteered, probation supervisors decided who would participate. Selection of the officers varied based on location. The more common reasons for selection were the number of years he/she had been working in probation, attitude, communication skills, management skills, ability to work with a challenging population, ability to motivate a client towards positive change, and willingness to be available to clients 24 hours a day seven days a week. In some instances with the statewide expansion, new probation officers were assigned to the PTP. 7
9 Training During the pilot of PTP, all PTP officers, along with the treatment providers assigned to the PTP, were required to participate in intensive training centered on the importance of using the principles of cognitive behavioral change to their daily casework. Coursework consisted of Motivational Interviewing and Criminal Thinking. The initial training was completed from January through April of Some coursework and refresher programs were ongoing. Trained facilitators from the CSSD Center for Best Practices and experts in the field of cognitive-behavioral change delivered the training. However, probation officers participating in PTP during the second year of the pilot and the statewide expansion were not offered specialized training. New PTP officers received LSI-R and Motivational Interviewing training during their initial training academy but were not provided training specific to the PTP. If a probation supervisor thought a PTP officer was not effectively working with clients or unable to properly assess them, that PTP officer could be required to attend booster training sessions. 8
10 EVALUATION METHODOLOGY The evaluation employed both qualitative and quantitative research methods in assessing the overall effectiveness of the Probation Transition Program (PTP). These methods centered on two aspects of this program. First, we examined the implementation of the program within and across the individual probation offices in order to better understand the daily activities of probation officers assigned to these units. Without knowing how well the program was implemented, we would have been unable to draw firm conclusions regarding any results they produced (positive or negative). Second, we collected and analyzed data on a sample of program participants and a comparison group of probationers on regular caseloads to determine the effects of the PTP on recidivism both during and following their involvement in the program. This analysis included a detailed comparison of probationers violated during the program and probationers who successfully completed the PTP. Areas of Research The evaluation focused on three primary areas. First, we met with and interviewed PTP officers regarding their attitudes about PTP, their perception of its success, and barriers that hindered its ability to be successful. Second, as part of assessing the implementation of the PTP, we examined the intake process in terms of looking at the number of probationers who entered the program and the general profiles of PTP clients. This step was necessary to determine the levels of program utilization and to better understand what types of probationers were being selected to participate in the PTP. Third, data were collected for every client in the PTP and a comparable group of probation officers on regular caseloads to assess program outcomes in terms of probation violation rates and reincarceration rates. We looked at the nature of the violations (new arrest vs. technical violation) and attempted to determine what client factors were associated with being violated (e.g., LSI-R risk levels, criminal history, gender, age, marital status, education, and employment). Research Design and Data The evaluation incorporated both qualitative and quantitative methods within the research design. The qualitative methods consisted of face-to-face and telephone interviews with PTP officers conducted during the Fall of 2008 and the Winter of All PTP officers were contacted by evaluation staff and were invited to participate in the interviews. The interviews lasted approximately 45 minutes to one hour and consisted of a series of open and closed-ended questions pertaining to the various aspects of the PTP. The interview questions were based on observations and evaluation findings from our earlier evaluation of the PTP pilot. These questions focused on probation officer selection and training, case management, technical resources available to PTP officers, and client referrals to the PTP (see Appendix B for the interview instrument). The quantitative aspect of the evaluation utilized a secondary analysis of existing data. Specifically, data from the Court Support Services Division s case management information system (CMIS) were collected for all clients entering the PTP between October 1, 2004 and 9
11 August 31, We limited our sample to clients entering PTP prior to September 1, 2008 so that we would be able to have a follow-up period of one year for all PTP clients. The CMIS data contained the following information: PTP start and end dates Type of PTP discharge (successful vs. unsuccessful) Demographic information (age, gender, race/ethnicity, marital status, education level obtained, employment) Date of probation violation (if one occurred) Nature and disposition of probation violation Criminal history (bail charges, prior arrests and convictions, age at first arrest) Current offense (offense type, number and types of charges, number and types of convictions) Level of Service Inventory Revised scores (LSI-R) In the pilot evaluation and subsequent reports we also included the Adult Substance Abuse Survey (ASUS). However, ASUS scores were collected but were not used in this report because CSSD switched from the ASUS to the ASUS-R midway through the evaluation. We were concerned that the change in instruments midway through the evaluation could have decreased the validity of our results and conclusions. These data were collected for 2,286 PTP clients. Three study group cohorts were created for the PTP evaluation so that we could assess differences occurring at different stages of PTP implementation. The first cohort (Pilot Year One) consisted of clients who participated in the PTP from October 1, 2004 to October 1, The second cohort (Pilot Year Two) was comprised of clients who entered the PTP in the second year of the pilot program but before the expansion (October 2, 2005 to January 31, 2007). The third cohort (Expansion) consisted of clients entering the PTP after the expansion of these programs from the pilot offices to the entire state (February 1, 2007 to August 31, 2008). The pilot program of PTP consisted of five offices with a total of 519 PTP participants in the first year of the pilot and 465 in the second year (Table 1). The expansion included adding more PTP officers to the five pilot offices as well as putting PTP officers in probation offices across Connecticut. There were 1,298 PTP participants in the first year of the expansion. Some offices had low numbers of PTP participants (namely Norwalk, Stamford, and Bristol) during the first year of the pilot due to a delayed start up of the program. 10
12 Table 1. Total Number of PTP Participants by Office Probation Office Pilot Year One Pilot Year Two Expansion Total Bridgeport Waterbury New Haven Hartford New London Danbury Norwich New Britain Manchester Danielson Middletown Milford Bantam Willimantic Bristol Stamford Norwalk TOTAL PTP ,298 2,286 Definition and Measurement of Recidivism The primary outcome measure of program success was a lack of a technical violation of probation. This measure is different from other recidivism studies that simply use any new arrest or technical violation. We made this decision because the primary goal of the PTP was to reduce the number of technical violations that resulted in new prison sentences and new arrests do not always result in technical violations of probation. For example, a probationer is arrested for a minor larceny (Larceny 6). The probation officer has discretion whether to violate this probationer. Probation officers rarely violate probationers in these situations because the resulting sentence for the larceny arrest usually consists of an extension or minor modification of the original probation sentence. We did not believe, in these instances, the new arrest should count against the success rate of PTP because there were no technical violations and no new prison sentences. Creation of the PTP Comparison Groups Ideally, evaluation research should follow an experimental research design where individuals are randomly selected to participate in a treatment program or are placed in a control group. This research design is preferred because the only difference between the two groups is that one was selected to receive treatment and one was not. However, the legal and ethical nature of criminal justice programming rarely allows for randomly placing offenders into treatment or denying them treatment solely for research purposes. We could not create a randomly assigned control group because all high risk split sentenced inmates were likely to 11
13 participate in the PTP. Additionally, in cases where there were more inmates than PTP availability, PTP officers selected the most risky offenders. We used two methods for creating comparison groups that were as similar to PTP participants as possible. Both methods used what is known as a historical comparison group. The historical comparison groups were comprised of probationers who were on probation prior to the implementation of the PTP and would have been eligible to participate if it had existed. For the five PTP pilot sites in our initial evaluation of PTP, the historical comparison group was created by collecting data on closed split sentenced probation cases from the same five courts where the PTP was piloted. To minimize the historical affects of supervision trends and policy, we selected high risk cases that were closed in the three-month period prior to inception of the PTP. These cases were closed because the probationer either had completed his/her probation sentence or had his/her probation terminated or revoked due to a new arrest or technical violation. The cases were high risk based on their LSI-R total risk score and assigned supervision level. After collecting CMIS data on this group, we conducted a number of statistical tests on the two groups and found that the PTP pilot group was very similar to the pilot historical comparison group. For the twelve expansion sites, we collected CMIS data for all probationers in the expansion offices who started probation one year prior to the implementation of the PTP expansion. After these data were collected, we selected probationers having high LSI-R total risk scores or were assigned to a supervision level of high or surveillance. We then conducted several statistical tests on the two groups and found little significant differences between the PTP expansion group and the expansion historical comparison group. 12
14 EVALUATION FINDINGS The following section presents the results of the quantitative and qualitative aspects of the evaluation. We begin by summarizing the results of the PTP probation officer interviews. This presentation is followed by the outcome analysis of CMIS data. PTP Probation Officer Interviews All PTP officers were asked to participate in 45 minute telephone interviews. They were asked about their role and attitudes regarding the PTP. Specifically, questions fell into four general categories: Background and Training; Caseload Management; Technical Resources; and, Client Referrals to PTP. A total of 23 PTP officers participated in these interviews. Background and Training The questions asked in this category related to when the officer actually was hired, when he/she started the PTP, meeting and trainings officers attended or received, whether the officer had a mentor or person he or she could seek out for advice, and if there was any type of assistance or training that was needed for the program. PTP officers were first asked how long they had been probation officers prior to PTP and the answers ranged from 2 to 14 years (Table 2). Most of the PTP officers (61%) had been probation officers from 1 to 4 years. Two of the interviewed officers started their probation careers as PTP officers. Table 2. Probation Officer Experience Prior to the PTP Category Frequency Percentage New Probation Officer 2 9% Less than One Year 1 4% One to Four Years 14 61% More than Four Years 6 26% Table 3 presents how officers became involved in the PTP. The majority of the interviewed officers (74%) volunteered for the PTP (Table 3). Three (13%) PTP officers were assigned to the unit and three others were hired to be PTP officers. Table 3. How Did You Become Involved with this Program? Amount Category Frequency Percentage Volunteered 17 74% Assigned to Position 3 13% Hired for Position 3 13% Next, the officers were asked if they received any training or mentoring once they joined the PTP. In regards to their training and mentoring (Table 4), 65% of the interviewed officers reported attending inter-office/region meetings regarding PTP and 70% reported having mentors 13
15 from which they could solicit program-specific information. However, only 26% of the officers reported receiving any type of program training prior to beginning work with the PTP. Table 4. Questions Pertaining to Training and Mentoring Item Yes Responses Percentage Did you receive any PTP-specific training? 6 26% Have you gone to any PTP-specific meetings with other officers outside of your office/region? 15 65% Did you have a mentor within your office that you could go to in regards to being a PTP officer? 16 70% For those officers who indicated they received specific PTP training, the trainings included: ASUS training, LSI/risk assessment training, motivational interviewing, policies and contact standards training, mental health and substance abuse training, and social service training. One officer stated that he/she did not receive any specific training but did work closely with another PTP officer and was informally trained through this relationship. The majority of PTP officers participated in meetings with other PTP officers. The purpose of those meetings varied. Many meetings focused on discussions involving policy changes, program statistics, trouble shooting on how to improve the program, the intake process, aspects of supervision, best services available for clients, how to work collectively, job performance, and overall expectations of the program. It is important to point out that many officers suggested that all new PTP officers attend some type of basic PTP training in addition to their probation officer academy training. This training should cover both the intake process (specifically how to work with the Department of Correction) and the supervision process. Also, it was suggested that officers have some specific training in areas such as mental health, social services and motivational interviewing. One officer suggested that PTP training be informal and conducted by veteran PTP officers. Caseload Management The next series of questions dealt with caseload management. When the PTP was piloted, officers were to have a maximum caseload of 25 and their caseloads were to consist only of PTP clients. As the program expanded, PTP officers had their caseloads increased to 35 clients and some PTP officers were assigned clients who were not in the PTP. Table 5 presents officers current caseload and Table 6 presents whether those caseloads are mixed. In addition, Table 6 presents reporting days and days in the field. Table 5. What is Your Current Caseload? Amount Category Frequency Percentage 25 or fewer cases 9 39% 26 to 35 cases 9 39% 36 or more cases 5 22% 14
16 The majority of interviewed PTP officers had caseloads under 35 (78%). Nine of the officers reported having caseloads between 26 and 35 clients and nine had caseloads under 25 cases (Table 5). Five PTP officers (22%) had caseloads over 35 cases. Table 6. Questions Pertaining to PTP Supervision Item Yes Responses Percentage Is your caseload strictly PTP? 19 83% Do you have specific reporting days each week? 12 52% Do you have specific days you are in the field? 9 39% Also in regards to their caseloads, 19 of the 23 interviewed officers (83%) reported serving only PTP clients (Table 6). Of these interviewed individuals, 52% stated that they offered specific reporting days for those clients and 39% indicated that they set aside certain days for fieldwork. Of those officers reporting a mixed caseload, the mixture of clients was varied. Two officers had PTP clients along with high risk clients. One of these officers indicated that the addition of high risk clients was rare. Another officer indicated that his/her caseload was mixed with minimum clients. The remaining officer indicated that 70% of his/her caseload contained active PTP clients while the remaining 30% consisted of former PTP clients that had been retained by the officer instead of being sent to a regular caseload. Most of the officers did not think other clients could be assigned to them due to having full caseloads. One officer did indicate that he/she could be assigned more of the split sentence offenders. None of the officers reported having difficulty balancing the mixed caseload and most of them believed that they treated all of their clients the same. Those clients with immediate needs were given priority, regardless of their caseload type. Technical Resources The next series of questions centered on technical resources provided to PTP officers such as state-issued vehicles and cell phones. When the program was originally piloted, these resources were provided but were decreased due to budgetary issues. Table 7 presents the responses to the questions pertaining to these resources. Although 96% of the interviewed officers reported having state-issued cell phones and every officer had access to a state car, only five individuals (25%) reported that the vehicles they had access to were specifically designated for the PTP. Furthermore, 15 of the officers (65%) reported instances in which they required motor vehicle access, but no cars were available. Tables 8 and 9 present the responses regarding motor vehicles. Table 8 refers to the number of vehicles available to an officer and Table 9 refers to the number of officers actually vying for use of a vehicle. The lack of access mentioned in Table 7 may have been due to the fact that 14 of interviewed individuals (61%) reported sharing one car with multiple probation officers, while only two PTP officers (9%) reported having their own state vehicles (Table 8). 15
17 Table 7. Questions Pertaining to TVU Resources Item Yes Responses Percentage Do you have to sign up for its use ahead of time? 18 78% Was available car specifically designated for PTP? 5 25% Have there been times when the vehicle has not been available when you needed it? 15 65% If vehicle not available, did you use your own vehicle as an alternative? 9 53% If vehicle not available, did you reschedule your plans? 10 59% Do you have a state-issued cell phone? 22 96% Do you provide your cell phone number to your clients? 19 91% Table 8. How Many Officers Share a Vehicle? Amount Category Frequency Percentage This officer has own car 2 9% One car for multiple officers 14 61% Multiple cars for multiple officers 7 30% When having to share a vehicle, 8 of the interviewed PTP officers (35%) shared a car with five or fewer probation officers (Table 9). However, 11 (48%) had to share vehicles with over 10 other probation officers. Table 9. Number of Officers Vehicle(s) Shared With Amount Category Frequency Percentage 5 or fewer POs 8 35% 6 to 10 POs 4 17% 11 to 25 POs 6 26% 25 or more POs 5 22% *Table percentages do not sum to 100% due to rounding. Table 10 follows up with information provided in Table 7 regarding PTP cell phone usage. Almost all of the PTP officers gave out their cell phone numbers (96%) with the majority of officers (59%) saying they received phone calls from clients either frequently or on a daily basis. Only 5 PTP officers (23% of those interviewed) said that they never or rarely were called by clients. Table 10. If You do Provide Clients with the Cell Phone Number, How Often Do They Call? Amount Category Frequency Percentage Never 2 9% Rarely 3 14% Occasionally 4 18% Frequently 5 23% Daily or more often 8 36% 16
18 Another follow-up question asked PTP officers the reasons for clients calling them. The more common responses were to notify the officer of not being able to make appointments, to reschedule appointments, requests for a curfew extension, changing of residence, issues with treatment, expressing needs for services, contacts with the police, clients having difficult/stressful times, and clients having crisis situations. The last question asked of PTP officers in this series was if they had unlimited resources, what technical support did they believe would help with their jobs. The responses to this question varied and fell into three general categories: technical support, client specific support, and DOC/Parole communication. In terms of technical support, several officers suggested they be provided with a GPS (Global Positioning System). Along this same line, others suggested having wireless laptops to conduct video conferences. Several officers requested more ready access to vehicles. The request for client specific support revolved around residential beds, housing, tokens, bus passes, and essential programs for drug abuse. In regard to DOC/Parole communication, the specific resource that was mentioned was voic accessibility for DOC/parole staff. Some officers were concerned that they were to leave messages for DOC or parole staff. Client Referrals to the PTP The last series of questions dealt with client referrals to the PTP. Most officers stated that clients files were simply transferred to them from DOC. Once this happened, PTP officers reviewed casenotes to determine if clients were appropriate for the PTP. In addition, officers tended to note clients areas of concern, potential triggers, and specific issues that needed to be addressed upon release from DOC. Once clients were deemed appropriate for the PTP, meetings were scheduled to visit clients at correctional facilities. During these initial meetings, risk assessments were completed and PTP officers discussed clients immediate needs. Many officers also met with clients approximately three days prior to their prison release to review clients plans and activities upon their prison release. In some cases, clients were supervised by someone other than the intake PTP officer. The supervising officers contact information was provided to the client. Table 11 presents the responses to the questions regarding concerns about the process and potential stumbling blocks. In regards to the PTP referral process, 39% of the interviewed officers cited concerns about the current process and 57% reported that stumbling blocks existed within it. Table 11. Questions Pertaining to PTP Referrals Item Yes Responses Percentage Do you have concerns about the current process? 9 39% Are there any stumbling blocks/hurdles in the referral process? 13 57% PTP officers mentioned several concerns with the referral process. Some of these were time management issues, DOC communication, locating clients upon discharge, and the need for 17
19 better screening to assure clients were appropriate for the PTP. With time management, some officers indicated it was hard to balance the need to do intakes at the correctional facilities and be able to properly supervise existing PTP clients. One officer thought that splitting the intake and supervision of clients was a bad idea and a concern for the program. As has been discussed earlier, communication with the DOC was a concern. Several officers thought this needed to be improved. In doing so, it would be easier to work with the DOC and gain access to clients. Locating clients upon discharge was also a concern that was expressed because some clients gave false addresses. Once they were released and did not show up to meet their supervising officer, they were difficult to find. Lastly, there was a concern regarding about the appropriateness of some clients in the program. The DOC often recommended all split sentence offenders with no consideration of their needs. PTP officers believed that many inmates recommended to the PTP should actually be on regular probation caseloads. Many officers were concerned with the lack of communication with DOC. These officers believed that better lines of communication needed to be established with each of the correctional facilities. In addition, it was suggested that regular meetings should occur with DOC to keep these channels open. Some officers also expressed a desire to have a more professional location to meet with clients at the correctional facility. One further suggestion involved the possibility of having video conferences with clients at the correctional facilities when face-to-face meetings were not possible. Outcome Analysis The outcome analysis primarily used CMIS data collected for all PTP clients entering the program between October 1, 2004 and August 31, These data were used to describe the clients participating in the PTP, determine the outcomes of these clients, and explore those factors related to program success. PTP clients were organized into three study groups, depending on when they entered the program. The first study group was comprised of clients entering PTP between October 1, 2004 and October 1, 2005 (Pilot Year One). The second study group entered PTP between October 2, 2005 and January 31, 2007 (Pilot Year Two). Finally, the third study group began PTP between February 1, 2007 and August 31, 2008 (Expansion). The purpose of the three study groups was to assess the different phases of the implementation of the PTP. If CSSD was successful in expanding the PTP model statewide, there would be few differences in outcomes across the three study groups. Furthermore, two PTP comparison groups were created to determine the overall effects of the PTP compared to a similar group of probationers who were on probation prior to the implementation of the PTP. The first comparison group was comprised of high risk probationers from the five pilot PTP offices (Bridgeport, Hartford, New Haven, New London, and Waterbury) while the second comparison group was made up of probationers from the expansion probation offices. The final part of the outcome analysis provides an assessment of probation outcomes for the PTP participants and the historical comparison groups. 18
20 Study Group Description Table 12 presents a summary of the three study groups. The vast majority of PTP clients were males in each of the three study groups (over 90%). There were differences in the race/ethnicity of clients in the Expansion study group compared to the two pilot groups. For instance, there were fewer African-Americans, fewer Hispanics, and more Caucasian clients in the Expansion study group. These differences were expected given that the pilot sites were located in urban areas with a higher population of minorities than the expansion sites. There were few differences across the study groups for age, marital status, and education. The only other difference between the groups was for employment. The Pilot Year One group had a lower percentage of unemployed clients (63%) than the other two groups (77% for Pilot Year Two and the Expansion). Table 13 shows the LSI-R risk levels for the study groups. The LSI-R risk levels were relatively the same across the three groups. The average LSI-R overall risk score was for the first pilot group, for the second year pilot group, and for the Expansion group. The Pilot Year Two study group had the highest percentage of clients at high or surveillance (93%), followed by the Expansion group (90%) and the Pilot Year One group (87%). The average LSI-R total risk scores by PTP office are presented in Table 14. There were few differences across the three study groups for the initial pilot sites. That is, the risk levels of PTP clients did not appear to significantly change from the first year to the second year of the pilot, nor from the second year of the pilot to the expansion. For the expansion sites, Bantam had the highest average LSI-R risk score (33) and Norwalk and Danielson had the lowest average risk scores (28). 19
21 Table 12. Demographic Summary of the Three Study Groups Pilot Year One (n=519) Pilot Year Two (n=465) Expansion (n=1,298) Males 89% 93% 91% Race/Ethnicity African-American 44% 47% 37% Caucasian 29% 21% 36% Hispanic 27% 31% 26% Other.2% 1% 1% Age % 11% 13% % 40% 39% % 31% 24% Over 40 20% 18% 24% Average Age 32 yrs. old 31 yrs. old 32 yrs. old Marital Status Married 5% 6% 7% Single 81% 79% 77% Divorced/Sep/Widowed 14% 15% 16% Education No High School diploma 65% 71% 65% High School Graduate 24% 20% 24% More than High School 11% 9% 11% Employment Unemployed 63% 77% 77% Other Income 6% 5% 4% Employed 31% 18% 19% Table 13. LSI Risk Level by Study Group LSI Risk Level Pilot Year One (n=514) Pilot Year 2 (n=464) Expansion (n=1,297) Administrative 12 (3%) 11 (3%) 16 (1%) Medium 50 (10%) 20 (4%) 108 (8%) High 374 (72%) 373 (80%) 1,133 (87%) Surveillance 78 (15%) 60 (13%) 40 (3%) Average LSI Risk Score
22 Table 14. Average LSI Score by Study Group and Office Probation Office Pilot Year One Pilot Year Expansion Two Hartford Waterbury New Haven Bridgeport New London Bantam 33 Bristol 31 Manchester 31 Middletown 31 Milford 31 New Britain 30 Norwich 30 Stamford 30 Danbury 29 Willimantic 29 Danielson 28 Norwalk 28 TOTAL PTP PTP Completion Rates Clients were referred and accepted into the PTP prior to their release from prison. The purpose of the PTP was to provide a smooth transition from prison release to probation supervision with PTP clients spending up to 120 days on a PTP caseload before being transferred to a general probation caseload. Table 15 presents the percentage of clients successfully discharged from the PTP and transitioned to regular probation. There were different trends in the pilot sites across the three study groups. First, three offices (New London, Waterbury, and Bridgeport had higher completion rates during the first year of the program, followed by a decrease during the second year, and then an increase during the expansion. Second, one office (New Haven) had a higher completion rate from the first to the second year, followed by a decrease during the expansion. Third, the Hartford PTP had the same completion rate for the two pilot years and a decrease during the expansion. There was some variation in completion rates across the expansion offices. Most of the offices had a completion rate over 70% (13 of the 17 offices). The other four offices had completion rates over 50%. 21
23 Table 15. PTP Completion Rate by Study Group and Office Probation Office Pilot Year One Pilot Year Expansion Two New London 75% 72% 79% Waterbury 79% 57% 75% Bridgeport 82% 71% 72% New Haven 75% 77% 71% Hartford 75% 75% 59% Norwalk 88% Stamford 86% Milford 85% Danielson 84% Danbury 83% Norwich 77% Bantam 76% Middletown 75% Bristol 71% Manchester 63% Willimantic 63% New Britain 56% TOTAL PTP 78% 71% 72% Tables 16 and 17 show the average days clients were in the PTP and the average number of client contacts for PTP offices. Even though the prescribed time in the PTP was 120 days, only two offices averaged 120 days or less (Danbury and Manchester) while several offices had averages over 180 days (Hartford, New London, Bridgeport, Bantam, Danielson, Willimantic, and Norwich). The average number of days in the PTP was well over 120 days for all three study groups (156 days for Pilot Year One, 172 for Pilot Year Two, and 160 for the Expansion). There were some differences for the three study groups. The average days in the PTP was similar for Pilot Year One (156 days) and the Expansion (160 days) but was higher for Pilot Year Two (172 days). Table 17 presents the average number of client contacts. Client contacts consisted of face-to-face meetings between PTP officers and clients, telephone contacts, and contacts with peripherals (e.g., service providers, family members, employment supervisors, etc.). The findings of Table 17 were consistent with Table 16, in that, the longer clients were in the PTP the more contacts they had. Danbury had the lowest average days in the PTP (100 days) and also had the lowest average number of client contacts (11) while Bantam had the most days in PTP (269) and the most contacts (46). 22
24 Table 16. Average Days in Program by Study Group and Office Probation Office Pilot Year One Pilot Year Expansion Two Hartford New London Bridgeport New Haven Waterbury Bantam 269 Danielson 238 Willimantic 213 Norwich 180 New Britain 174 Bristol 158 Stamford 153 Milford 138 Norwalk 135 Middletown 128 Manchester 104 Danbury 100 TOTAL PTP Table 17. Average Number of Client Contacts by Study Group and Office Probation Office Pilot Year One Pilot Year Two Expansion New London Bridgeport New Haven Waterbury New Britain Hartford Bantam 46 Stamford 32 Norwich 26 Milford 25 Manchester 23 Danielson 20 Willimantic 19 Norwalk 18 Bristol 18 Middletown 17 Danbury 11 TOTAL PTP
25 Program Outcomes: New Arrests and Technical Violations The primary outcome of the study was violations of probation that resulted in technical violations up to one year following PTP clients prison release. Table 18 shows that the percentage of technical violations was almost the same for the Pilot Year One (13%) and the Expansion (12%) study groups but was higher for Pilot Year Two (19%). In contrast, the percentage of new arrests and percentage of new arrests and technical violations were relatively the same for all three study groups. Table 18. New Arrests and Probation Violations Across Study Groups Pilot Year One (n=519) Pilot Year Two (n=465) Expansion (n=1,298) VOPs and New Arrests within One Year New Arrests 76 (15%) 76 (16%) 207 (16%) Technical Violations 68 (13%) 86 (19%) 150 (12%) New Arrests and Tech. Violation 46 (9%) 40 (9%) 131 (10%) Totals 190 (37%) 202 (44%) 488 (38%) PTP clients were transitioned onto regular probation caseloads if PTP officers believed they had been successfully re-integrated into their communities. Table 19 presents the one year outcomes of PTP completers. A small percentage of PTP completers were arrested or technically violated after being successfully transitioned from PTP. For instance, only 8% of PTP completers in the Expansion study group were technically violated and 11% were arrested. These outcomes were similar across the three study groups. Table 19. New Arrests and Technical Violations for PTP Completers Pilot Year One Pilot Year Two Expansion (n=412) (n=329) (n=930) New Arrests 44 (11%) 39 (12%) 98 (11%) Technical Violations 18 (4%) 24 (7%) 33 (4%) New Arrests and Tech. Violation 21 (5%) 11 (3%) 40 (4%) Totals 83 (20%) 74 (22%) 171 (19%) Figure 1 shows the time frame for technical violations for each study group. The trends were similar for the Pilot Year One and the Expansion study groups. For instance, very few (less than 2%) of these two groups were technically violated in the first month following prison release and close to 8% were violated after six months. The Pilot Year Two study group had a much different pattern. A higher percentage of PTP clients were violated after six months (nearly 14%). After six months, the percentage of technical violations for the Pilot Year Two study group followed a similar pattern as the other two study groups (about a 5% increase). 24
26 Figure 1. Cumulative Monthly Percentage of Technical Violations by Study Group 20% 18% 16% 14% 12% 10% 8% 6% 4% 2% 0% Pilot Year One Pilot Year Two Expansion There was a wide variation in the percentage of the PTP clients who were technically violated across the Expansion group sites (Table 20). Overall, 12% of PTP clients received technical violations within one year of prison release. New Britain had the highest technical violation rate (20%) and three offices had zero technical violations (Bristol, Bantam, and Stamford). These differences can also be observed by looking at the total percentage of the PTP clients technically violated or arrested. Approximately 50% of New Britain (51%) and Hartford (50%) PTP clients were arrested or violated while Danielson (20%) and Milford (27%) had the lowest. 25
27 Table 20. One Year Probation Violation Types by Office (Expansion Study Group Only) Probation Office New Technical New Arrest and Total Arrest Violation Technical Violation New Britain 15% 20% 16% 51% Hartford 23% 19% 8% 50% Norwalk 4% 17% 26% 47% Manchester 13% 15% 15% 43% Bristol 24% 0% 19% 43% Norwich 16% 13% 13% 42% New Haven 21% 13% 6% 40% Waterbury 10% 11% 18% 39% Bridgeport 19% 11% 4% 34% Middletown 16% 11% 7% 34% Danbury 16% 9% 7% 32% New London 10% 9% 13% 32% Willimantic 17% 13% 0% 30% Bantam 8% 0% 21% 29% Stamford 10% 0% 19% 29% Milford 15% 5% 7% 27% Danielson 7% 4% 9% 20% TOTAL PTP 16% 12% 10% 38% Table 21 presents the number and percentage of the PTP clients receiving new prison sentences as a result of being arrested and/or technically violated. The overall percentages of new prison sentences were relatively the same for the Pilot Year One and the Expansion study groups (around 22%) while the Pilot Year Two study group was much higher (32%). The difference for the Pilot Year Two study group was attributed to a higher percentage of new arrests and technical violations that resulted in prison sentences. Table 21. New Prison Sentences of Study Groups by Type of Probation Violation* Pilot Year One Pilot Year Two Expansion New Arrest 47 (9%) 54 (12%) 103 (9%) Technical Violation 44 (9%) 58 (13%) 64 (6%) New Arrest and Tech. Viol. 33 (6%) 31 (7%) 73 (6%) Totals 124 (24% of 508) 156 (32% of 447) 240 (21% of 1,142) *Total does not include violations that are pending court action The percentages of PTP clients sentenced to prison as a result of new arrest or technical violation are presented in Table 22. For all five pilot offices, the percentages of clients receiving new prison sentences increased from Pilot Year One to Pilot Year Two and then decreased for the Expansion. Similar to technical violation rates, there were differences across the Expansion sites in percentages of PTP clients sentenced to prison. Manchester had the highest arrest and technical violation rate and the highest percentage of PTP clients sentenced to prison (33%) while Milford (6%) and Danielson (10%) had the lowest percentages. 26
28 Table 22. New Prison Sentences Due to One Year Probation Violations by Office Probation Office Pilot Year One Pilot Year Expansion Two Waterbury 21% 41% 29% Hartford 31% 35% 27% New Haven 26% 27% 21% Bridgeport 24% 27% 19% New London 25% 31% 19% Manchester 33% New Britain 29% Norwalk 24% Norwich 22% Middletown 21% Willimantic 18% Stamford 17% Danbury 16% Bristol 11% Bantam 11% Danielson 10% Milford 6% TOTAL PTP 25% 32% 22% Factors Influencing One Year PTP Outcomes The next part of the outcome analysis was comprised of identifying differences between PTP participants who were arrested or technically violated one year after starting the PTP. Table 23 shows these rates for gender, race/ethnicity, age, marital status, employment, and education. There were statistically significant differences in the arrest rates for all of the demographic factors. Males were much more likely to be arrested than females (26% to 15%) and African- Americans were the most likely racial/ethnic group to be arrested (33%). The younger the PTP client, the higher likelihood of an arrest (44% of probationers under 21 were arrested compared to 14% of those over 40 years old). Single probationers also had a higher arrest rate than those who were married or had been married. Also, PTP clients who were unemployed and did not have a high school diploma also had a higher likelihood of being arrested one year following their PTP entry. 27
29 Table 23. Demographic Factors with New Arrests and Technical Violations New Arrest Technical Violation Gender* Males (n=2,077) 26% 14% Females (n=205) 15% 12% Race/Ethnicity* Caucasian (n=714) 17% 12% African-American (n=928) 33% 13% Hispanic (n=619) 24% 16% Other (n=15) 20% 0% Age at PTP Start* Under 21 Years Old (n=277) 44% 11% 21 thru 30 Years Old (n=909) 29% 13% 31 thru 40 Years Old (n=599) 21% 16% Over 40 Years Old (n=497) 14% 12% Marital Status** Single, never married (n=1,778) 29% 14% Divorced/Widowed/Separated (n=350) 11% 9% Married (n=147) 18% 18% Employment** Full-Time (n=363) 13% 6% Part-Time (n=126) 23% 6% Other Income (n=106) 19% 10% Unemployed (n=1,680) 29% 16% Education** No H.S. Diploma (n=1,501) 28% 15% High School Diploma (n=533) 23% 11% More than H.S. Diploma (n=241) 16% 8% *Differences in arrest categories were statistically significant at p.<.05 **Differences in arrest and technical violation categories were statistically significant at p.<.05 Only marital status, employment, and education produced differences in technical violation rates (Table 23). Clients with the lowest likelihood of being violated were divorced/widowed/separated (9%) compared to single (14%) or married (18%) clients. Similar to arrests, unemployed clients and clients without high school diplomas were the most likely to be technically violated. While Table 23 points out individual differences in arrest and technical violation rates across for a variety of demographic factors, it is not possible to determine which factors had the most effect. To compare the effects across all of the variables, we used multinomial logistic regression analysis. This statistical technique looks at the relative contribution of many variables 28
30 in explaining arrests and technical violations. For this analysis, we used age, prior arrests, gender, marital status, employment, and the LSI-R subscales (criminal history, education/employment, financial, family, accommodations, leisure, companions, alcohol/drug, emotional, and attitude/orientation). The multinomial regression tells us which factors significantly affect whether PTP clients were arrested or technically violated and the importance of each (Table 24). PTP participants arrested one year after their PTP start were younger, unemployed had prior arrests, a high LSI-R companions score, males, and had high LSI-R risk scores for criminal history, orientation (attitude), leisure, and alcohol/drugs. Taken together, these results show that PTP clients more likely to be arrested were young males with a deviant peer group who had already been arrested multiple times. These clients also were unemployed, had poor attitudes along with alcohol and/or drug use, and had a significant amount of unoccupied leisure time. PTP clients most likely to be technically violated one year after entering the PTP were slightly different (Table 24). These clients were unemployed, had prior arrests, high LSI-R drug/alcohol risk scores, were younger, and had higher LSI-R accommodations and companions risk scores. While unemployment and prior arrests were the most influential factors for technical violations, these clients appeared different than those that were arrested because their drug/alcohol problems were more prevalent along with unstable housing and a deviant peer group. 29
31 Table 24. Multinomial Regression For New Arrests and Technical Violations Beta Stand. Error Wald Sign. Odds Ratio New Arrest Intercept Age Employment Prior Arrests LSI Companions Males LSI Criminal History LSI Orientation LSI Leisure LSI Alcohol/Drug Married LSI Accommodations Education LSI Emotional LSI Financial LSI Employment/Education LSI Family Technical Violation Intercept Employment Prior Arrests LSI Alcohol/Drug Age LSI Accommodations LSI Companions Education LSI Leisure LSI Employment/Education LSI Criminal History Males LSI Family LSI Emotional LSI Financial LSI Orientation Married Model Chi-Square = , p.<.05. Cox and Snell R 2 =.15, Nagelkerke R 2 =.18 Comparison Group Analysis The final set of analyses compared the one year probation outcomes of PTP clients to similar groups of probationers who did not participate in the PTP. This analysis used two separate comparison groups of probations; one for the pilot PTP offices (Bridgeport, Hartford, New Haven, New London, and Waterbury) and one for the statewide expansion offices. These groups were referred to as historical comparison groups because both groups consisted of individuals on probation prior to the implementation of the PTP. 30
32 Creation of historical comparison groups. The Pilot Comparison Group was created by taking all probation cases that were closed during the months of June, July, and August of 2004 for courts that had the PTP. These cases had been closed because clients successfully completed their probation sentence or had their probation terminated or revoked due to new arrests or technical violations. This type of group was utilized because it created a random selection of split sentenced offenders from the five PTP offices and provided complete outcome data for split sentenced probationers prior to the implementation of the PTP. To create this group, a list of probation cases that were closed during June, July, and August of 2004 was obtained from the CSSD s CMIS database. Next, client demographic data, risk scores (LSI-R and ASUS), charge data (charges and severity), and criminal history data were collected from CMIS. Rearrest data were also collected on this group from the Judicial Branches CRMVS database. Finally, we reviewed hard copy files for those probationers who were violated in order to obtain the specific reason for the probation violation. This group consisted of 134 high risk probationers across the five PTP pilot offices and closely resembled PTP clients from the Pilot Year One study group. The biggest difference between these two groups was unemployment, with the PTP Pilot Year One group having a higher percentage of probationers unemployed (see our August 2006 report titled Addendum to the Final Report of the Court Support Services Division s Probation Transition Program and Technical Violations Unit for a complete description of the Pilot Comparison Group). While the average total LSI risk scores indicated that both groups were high risk, the Pilot Year One study group had a higher risk score (29.25) than the Pilot Comparison Group (25.53). Although the Pilot Comparison Group closely resembled the Pilot Year One study group it was significantly different than the Pilot Year Two and pilot offices expansion study groups (See Appendix C summary tables). The Pilot Comparison Group had a higher percentage of married clients than the PTP Pilot Sample (11% to 6%) and a lower percentage of unemployed clients (67% to 77%). The primary differences between these groups were in LSI-R risk scores. The Pilot Comparison Group was had lower risk scores for all of the LSI-R risk scores except Alcohol/Drug Leisure. The average total LSI-R score was much higher for the PTP Pilot Sample (30.14) than the Pilot Comparison Group (25.54). While the Pilot Comparison Group provided a source to compare to the PTP pilot offices, we also needed a group to compare with the statewide expansion offices. Substantial developments in CMIS since 2004 allowed us to select a similar group of probationers who began their probation sentence prior to the statewide implementation of the PTP. In addition, CSSD s Center for Research, Program Analysis and Quality Improvement had been conducting an in-house recidivism study of all probationers and created a data file consisting of all offenders who began their probation sentences between 2004 and This dataset contained almost all of the information we had collected for the PTP pilot study groups and the Pilot Comparison Group. We were given data for all probationers starting probation in the 2005 calendar year. From this group, we selected split sentenced probationers from the expansion offices (probationers from the five pilot offices were not included). We intended to use propensity score matching to create a one-to-one comparison group match for each PTP participant, however, CSSD made a major change in how LSI-R total risk scores that defined probation officer supervision levels in the middle of the evaluation. This change did not allow us to use propensity score matching techniques. As an alternative, we had to select a sample of PTP 31
33 expansion clients and probationers in these offices prior to the PTP that had been supervised at the same risk level. The one similarity was that probationers with a LSI-R total risk score over 28 were classified as high risk and supervised with the same contact standards prior to and after the PTP expansion. Therefore, we selected only those PTP and nonptp probationers who scored over 28 and were supervised as high risk clients. We also stratified these groups by office, race/ethnicity, gender, and age to obtain the closest matched groups as possible. This process resulted in a PTP Expansion Sample with 305 PTP participants and an Expansion Comparison group with 377 nonptp probationers. These groups were then compared across demographic information (e.g., gender, race/ethnicity, age, marital status, education, and employment) and LSI-R risk scores (See Appendix C for the tables containing these comparisons). Across all of these data, there were three differences between the two groups. The Expansion Comparison Group had a higher percentage of married clients (13%) than the PTP Expansion Sample (8%) and also a lower percentage of clients without high school diplomas (51% to 62%). Additionally, the PTP Expansion Sample had a higher LSI-R criminal history risk score (6.82 to 6.41). We would have preferred the Pilot Comparison Group to have more closely resembled the Pilot Year Two and the Expansion Pilot office clients in order to make more direct comparisons of program effectiveness. However, the differences between the study groups in the pilot offices led us to believe that PTP officers in the second program year and the expansion were selecting more serious offenders than in the initial pilot. Also, because the Pilot Comparison was lower risk, we would expect the percentage of new arrests and technical violations to be lower for this group than the PTP program groups. One year probation outcomes. The primary purpose of creating comparison groups was to use them to determine the effects of the PTP on new arrests and technical violations. Since the PTP was implemented to decrease technical violations along with reducing the number of technical violators being sentenced to prison, we expected the biggest differences between the PTP and comparison groups to be for technical violations. For a period of one year after probationers start of the PTP or regular probation supervision (for the comparison groups), the percentage of PTP clients who received technical violations was statistically significantly lower than the comparison group for both the pilot and expansion offices (Table 25). That is, 26% of the Pilot Comparison Group compared to 14% of% the PTP Pilot Office Sample were technically violated one year after their start of probation. The difference was smaller between the PTP Expansion Sample (11%) and the Expansion Comparison Group (16%) but was still statistically significant. There were no differences for new arrests for the pilot offices or the statewide expansion offices. 32
34 Table 25. New Arrests and Technical Violations Across Study Groups Number New Technical Total Arrests Violations* PTP Pilot Office Sample 1, (25%) 258 (14%) 709 (39%) Pilot Comparison Group (26%) 35 (26%) 70 (52%) PTP Expansion Sample (28%) 33 (11%) 117 (39%) Expansion Comparison Group (30%) 62 (16%) 165 (46%) Note: Chi Square tests for the pilot and expansion were statistically significant at p. <.05 These differences were also present for new prison sentences (Table 26). A statistically higher percentage of probationers in the Pilot Comparison Group (23%) were sentenced to prison for technical violations than the PTP Pilot Office Sample (8%). Similarly, a higher percentage of the Expansion Comparison Group (11%) was sentenced to prison as a result of technical violations than the PTP Expansion Sample (5%). There were no differences in new prison sentences resulting from arrests for the PTP Pilot Office Sample and the Pilot Comparison Group. However, the Expansion Comparison Group also had a higher percentage of probationers sentenced to prison for new arrests (20%) than the PTP Expansion Sample (13%). Table 26. New Prison Sentences Across Study Groups Number New Technical Total Arrests Violations* PTP Pilot Office Sample 1, (16%) 147 (8%) 425 (24%) Pilot Comparison Group (14%) 30 (23%) 49 (37%) PTP Expansion Sample (13%) 16 (5%) 57 (19%) Expansion Comparison Group (20%) 43 (11%) 119 (32%) * Chi Square tests for the pilot and expansion were statistically significant at p. <.05 Effects of the PTP on new arrests and technical violations. Multinomial logistic regression was used to determine the actual effects of PTP participation (Tables 27 and 28). The overall results mirror Table 25, in that, PTP had no effects on new arrests but did have an effect on technical violations for the pilot offices and the statewide expansion offices. The odds ratio was used in this analysis for determining the actual effects of the PTP. For the pilot offices, the odds ratio of indicates that PTP clients were 2.29 times less likely to be technically violated than the comparison group. In the statewide expansion offices, the odds ratio of shows that PTP clients in these offices were 1.7 times less likely to be technically violated. Table 27. PTP Effects on New Arrests and Technical Violations for Pilot Offices B Std. Error Sig. Odds Ratio New Arrests Intercept PTP Clients Technical Violations Intercept PTP Clients Chi-Square=13.04, df=2, p.<.05 33
35 Table 28. PTP Effects on New Arrests and Technical Violations for Expansion Offices B Std. Error Sig. Odds Ratio New Arrests Intercept PTP Clients Technical Violations Intercept PTP Clients Chi-Square=6.17, df=2, p.<.05 Summary of the Outcome Analysis The collection of CMIS data allowed us to observe the demographics of PTP clients (e.g., age, gender, race/ethnicity, employment, and education), determine outcomes of PTP participants (e.g., successful discharges from the PTP, rates of new arrests and technical violations one year after beginning PTP supervision, and rates of new prison sentences from new arrests and technical violations), identify factors that may have effected new arrests and technical violations (e.g., demographics, criminal history, and LSI-R risk scores), and compare the outcomes of PTP clients to similar groups of probationers who did not participate in the PTP. Demographics. There were few differences in demographic information across the three study groups. The majority of PTP clients were males (nearly 80%), were single and never married (approximately 80%), were mostly under 30 years old (close to 52%), were largely unemployed (around 75%), and did not have a high school diploma (approximately 65%). The one demographic difference across the three study groups was for race/ethnicity. A higher percentage of the first and second pilot groups were either African-American (45%) or Hispanic (28%) than in the expansion study group (37% were African-American and 26% were Hispanic). These differences were expected since the five probation offices in the PTP pilot were located in urban areas with a higher percentage of African-American and Hispanic residents. We also looked at LSI-R risk scores for each study group and across all of the statewide expansion probation offices. There were very little differences across the three study groups in LSI-R total risk score. The average LSI-R total risk score was close to for all three groups, indicating that these groups were high risk. In addition, the LSI-R total risk scores were fairly similar across the statewide expansion offices (the range was 28 to 32). PTP completion. The outcome analysis looked at PTP completion rates, new arrests and technical violations one year after clients start of PTP, and compared these outcomes to two groups of similar probationers who did not participate in the PTP. We found that the PTP completion rates were very high and fairly consistent across the three study groups and across the expansion offices. For instance, the completion rates increased in the four of the five pilot offices from the first year to the expansion year (Hartford was the only office with a significant decrease). We also found that most PTP expansion offices had high completion rates (between 71% and 88%) with the exceptions being New Britain (56%), Willimantic (63%), and Manchester (63%). These results suggest that PTP implementation was mostly consistent across study groups and expansion offices. One concern was with the days in PTP. Three offices had 34
36 well over the prescribed 120 days (Bantam averaged 269 days, Danielson averaged 238 days, and Willimantic averaged 213 days). Technical violations and new arrests. Similar to program completion, we looked at the percentage of PTP cases ending in technical violations and new arrests across the three study groups for the five PTP pilot offices and also across all of the statewide expansion offices. For the pilot offices, the percentage of clients with new arrests was almost the same for the three study groups (24% for Pilot Year One, 25% for Pilot Year Two, and 26% for the Expansion pilot offices) while there were variations in the percentages of technical violations. The percentage of clients technically violated increased from the Pilot Year One group to the Pilot Year Two group (13% to 19%) but decreased from Pilot Year Two to the Expansion (19% to 12%). We were unable to determine exactly why Pilot Year Two was so different but we believe it had to do with staff turnover in the pilot offices between the first two years of the PTP. CSSD also placed a significant emphasis on PTP during the Expansion and we believe this resulted in better implementation of the program model. Overall, four of the five pilot offices had decreases in the percentage of PTP technical violations from the Year One Study group to the Expansion (with the exception of Waterbury). The statewide expansion offices had wide variations in technical violation rates (it ranged from 6% in Milford to 33% in Manchester)(The Manchester PTP office also had one of the lowest PTP completion rates). An analysis of those client factors related to new arrests and technical violations found the following factors related to new arrests (in order of importance): age (the younger the probationer the more likely of an arrest), unemployment, negative peer groups, males, criminal history, poor attitudes about the criminal justice system, poor leisure activities, and alcohol/drug use. In contrast, those PTP clients more likely to receive technical violations: were unemployed, had prior arrests, alcohol/drug use, were younger, had unstable housing, and a negative peer group. While unemployment and prior arrests were the most influential factors for technical violations, these clients appeared different than those that were arrested because their drug/alcohol problems were more prevalent along with unstable housing and a deviant peer group. Comparison group analysis. The final aspect of the outcome analysis compared the results of the PTP to two historical comparison groups made up of similar probationers to PTP clients. Probationers in the historical comparison groups were on probation prior to the implementation of the PTP and would likely have been selected to participate. One historical comparison group was created for the five pilot offices and the second was created with probationers from the statewide expansion offices. The statewide expansion comparison group was very similar to the expansion office PTP clients across demographic information and LSI-R risk scores. However, the pilot comparison group was created to match the Year One Study group and was a lower risk group than the Year Two and Pilot Expansion study groups. The analysis of new arrests and technical violations found that both historical comparison groups had statistically higher technical violation rates than PTP clients. This technical violation rate was much higher for the Pilot Comparison group (26%) than the pilot PTP offices (14%) even though this group had much lower risk scores. The differences between PTP clients in the statewide expansion offices and the Expansion Comparison group were smaller (11% to 16%) 35
37 but were still statistically significant. There were no differences in the percentage of clients who were arrested across the four study groups. We had similar findings when looking at new prison sentences. Both historical comparison groups had higher percentages of probationers sentenced to prison for technical violations than PTP participants. While the pilot comparison group had the highest percentage (23% to 8% for the PTP Pilot Sample), the Expansion Comparison group was also statistically higher than the Expansion Sample (11% to 5%). The Expansion Comparison group also had a higher percentage of probationers sentenced to prison for new arrests (20%) than the PTP Expansion Sample (13%). The use of odds ratios allowed us to calculate the likelihood of PTP and comparison clients to get arrested or technically violated. This analysis found no differences in the likelihood of being arrested between PTP and comparison group clients. However, for technical violations, comparison group clients in the PTP pilot offices were more than twice as likely to be technically violated than PTP clients. In the statewide expansion offices, comparison group clients were almost twice as likely to be violated as PTP clients. 36
38 EVALUATION CONCLUSIONS AND RECOMMENDATIONS CSSD began accepting probationers into the Probation Transition Program on October 1, 2004 in five probation offices (Bridgeport, Hartford, New Haven, New London, and Waterbury). PTP was meant to help split sentenced probationers as they were leaving prison and beginning their probation sentence. PTP officers met with probationers while they were still in prison and conducted assessments, developed case plans, and started setting up needs-based services. PTP officers were assigned lower caseloads (25 clients), technical resources (cell phones, laptop computers, and motor vehicles), and preference for client services (e.g., residential substance abuse, mental health treatment, etc.) to be able to spend more time working with troubled clients and better address their criminogenic needs than probation officers with regular caseloads. CCSU was contracted to evaluate the pilot PTP program. The overall conclusion of our one year effectiveness assessment of the pilot PTP program was that PTP was successful in contributing to the overall CSSD goal of the number of probationers who are resentenced to prison as a result of technical violations by 20% and we recommended statewide expansion of the PTP. Legislative funding to the Judicial Branch to hire more probation officers led to the statewide expansion of the PTP in February of However, funding shortages forced CSSD to increase caseload sizes to 35 PTP clients per officer, access to technical resources was limited (PTP officers no longer had laptop computers and did not have designated motor vehicles), and PTP clients did not have immediate access to treatment or other services. Conclusions The process and outcome components of the PTP evaluation produced four distinct conclusions. First, PTP was widely implemented in a manner consistent with the program model. We found few differences in the demographics and risk scores of PTP clients across the three study groups in the pilot offices and across the statewide expansion offices. These findings suggest the selection criteria were being applied consistently across offices. There was also a high amount of consistency in the program completion rate (over 70% of clients were successfully transitioned into a regular caseload) across the expansion offices. The consistent program implementation resulted in similar outcomes across PTP offices. With the exception of a few of offices, the percentages of PTP clients technically violated were similar across the pilot and expansion offices. We do note two areas of concern for PTP implementation. One, several PTP officers mentioned that they had difficulties trying to meet with PTP clients in Department of Correction facilities and attributed this to lack of communication with DOC staff. This lack of communication most often occurred between correctional counselors and PTP officers. It was suggested that correctional counselors always contact PTP officers both prior to release and upon release. Another concern expressed by PTP officers was that some DOC facilities were very accommodating while others were not. Unnecessary hurdles existed at some DOC facilities that made it extremely difficult for PTP officers to meet with the clients. Some PTP officers felt that 37
39 the process of going into the institutions was very unorganized and caused significant delays. Most of these comments were attributed to the lack of communication with DOC staff. Two, PTP officers mentioned a lack of PTP-specific training. Newer PTP officers felt they were somewhat unprepared when first starting the PTP due to a lack of formal training. We mentioned this concern in an earlier progress report and know that each region has been trying to address this need on an individual basis. However, it remained a problem that was mentioned repeatedly in our interviews of PTP officers. Our second overall conclusion was that the PTP appeared to be targeting the highest risk offenders. CSSD policy dictated that PTP officers give priority to split-sentenced probationers with (1) insufficient familial and/or peer support; (2) lack of housing; (3) extensive criminal history; (4) extensive drug abuse; (5) history of mental health problems; (6) lack of employment; and, (7) total risk score on the LSI-R. The majority of PTP participants were single/never married and unemployed with high LSI-R total risk scores. In fact, PTP participants in the expansion groups had much higher LSI-R total risk and subscale scores than PTP participants in the pilot study. Third, split-sentenced probationers in the PTP had statistically lower technical violation rates and were statistically less likely to be sentenced to prison for technical violations than similar groups of probationers. Specifically, comparison group probations were much more likely to be technically violated than PTP clients in the pilot offices (more than twice as likely) and the statewide expansion offices (almost twice as likely). Our first evaluation of the pilot PTP program concluded that PTP reduced the technical violation rates of split-sentenced probationers and also reduced the number of split-sentenced probationers who were resentenced to prison for technical violations. The evaluation of the statewide expansion found that PTP still produced lower technical violation rates in the five pilot offices and also in the statewide expansion probation offices. The lower technical violation rates explained why fewer PTP clients were sentenced to prison for technical violation rates. However, we also found that nonptp clients were more likely to be sentenced to prison for new arrests (although the new arrest rate was similar for PTP clients). We offer two possible explanations for these differences. One, several probation officers mentioned they had acted as advocates for their clients during their court appearances. That is, the probation officers believed their clients had been making significant progress before being arrested and asked the court to take this into consideration. If this did occur, it may explain why judges were more likely to sentence PTP clients to prison for new arrests at a lower rate as the comparison group. Second, it is important to point out that differences in court actions for new arrests may simply reflect changes in the sentencing philosophy of sentencing judges. The PTP comparison group reflected court decisions regarding probation violators prior to the implementation of the PTP. Since the implementation of the PTP, there were changes in judges in each of the PTP courts and there was more statewide attention to decreasing the prison population. It was highly likely these two issues had an effect on decreasing the number of probationers being sentenced to prison for new arrests. 38
40 The final conclusion of this evaluation concerns the exploration of factors associated with arrests and technical violations. There were differences in those PTP clients arrested versus those who were technically violated. PTP clients who were arrested resembled the demographic most likely to be arrested in general: young males with prior criminal records who were unemployed, used drugs and/or alcohol, and had a peer group who likely encouraged their criminal behavior. In contrast, PTP clients most likely to receive technical violations had several risk factors associated with instability. They were unemployed, had unstable housing, used alcohol or drugs, and had a negative peer group (they were also younger probationers with criminal histories). Overall Conclusion and Recommendations Our overall conclusion was the PTP was effective in reducing technical violations and new prison sentences from technical violations. The PTP was implemented consistently in the pilot offices and the statewide expansion offices while targeting high risk probationers. We do, however, offer the following recommendations to improve the delivery of the PTP: More PTP specific training for PTP officers that includes a detailed presentation of the PTP purpose and model. This training should occur prior to probation officers entry into the PTP and follow-up training should be conducted with all PTP officers. PTP training and discussions should include all line supervisors. Develop better and more consistent communication methods with the Department of Correction. Throughout the pilot and expansion evaluations we found that PTP officers were having problems meeting clients in the prisons. We know that CSSD has met with DOC to work through many of these issues but it appeared that not all of the problems had been resolved. We suggest CSSD administrative staff meet with PTP officers to discuss existing problems and concerns and then meet with DOC staff to better address them. Identify and develop more skills-based and employment services for PTP clients. Unemployment was a major factor for PTP participants who were arrested and technically violated. The first step in this process would be to identify nonprofit agencies that offer employment services and contract or partner with them to provide gainful employment opportunities. While it was not part of our evaluation, it is important to acknowledge the progress CSSD has made in automating its case management system (CMIS) and also enhancing its internal ability to conduct research. One aspect of CSSD s 2004 report to the General Assembly included the creation of a component involving research and evaluation. CSSD did establish the Center for Research, Program Analysis and Quality Improvement. Since its inception, this unit has greatly furthered CSSD s ability to conduct evidence-based practices by disseminating probationer information and assessments to probation supervisors and program staff, conducting internal research and evaluation of its programs, and supporting external research and evaluation initiatives. 39
41 APPENDIX A CSSD S PTP POLICY 40
42 41
43 42
44 43
45 44
46 45
47 46
48 47
49 48
50 49
51 50
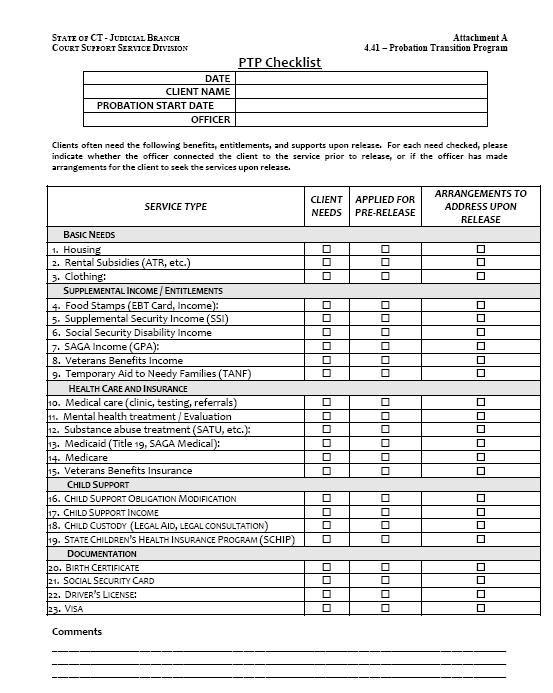
52 51
STATEWIDE CRIMINAL JUSTICE RECIDIVISM AND REVOCATION RATES
 STATEWIDE CRIMINAL JUSTICE RECIDIVISM AND REVOCATION RATES LEGISLATIVE BUDGET BOARD JANUARY 2009 COVER PHOTO COURTESY OF SENATE PHOTOGRAPHY Criminal Justice Data Analysis Team Michele Connolly, Manager
Statewide Criminal Justice Recidivism and Revocation Rates
 Statewide Criminal Justice Recidivism and Revocation Rates SUBMITTED TO THE 82ND TEXAS LEGISLATURE LEGISLATIVE BUDGET BOARD STAFF JANUARY 2011 STATEWIDE CRIMINAL JUSTICE RECIDIVISM AND REVOCATION RATES
DOC & PRISONER REENTRY
 DOC & PRISONER REENTRY Mission DOC provides secure confinement, reformative programs, and a process of supervised community reintegration to enhance the safety of our communities. 2 DOC At a Glance Alaska
PRE-RELEASE TERMINATION AND POST-RELEASE RECIDIVISM RATES OF COLORADO S PROBATIONERS: FY2014 RELEASES
 PRE-RELEASE TERMINATION AND POST-RELEASE RECIDIVISM RATES OF COLORADO S PROBATIONERS: FY2014 RELEASES 10/12/2015 FY2014 RELEASES PREPARED BY: KRIS NASH EVALUATION UNIT DIVISION OF PROBATION SERVICES STATE
The Final Report of the Evaluation of the Court Support Services Division s Mental Health Case Management Pilot Project
 The Final Report of the Evaluation of the Court Support Services Division s Mental Health Case Management Pilot Project Stephen M. Cox, Ph.D. Professor Damon Mitchell, Ph.D. Associate Professor Rachel
Pamela K. Lattimore, Debbie Dawes and Stephen Tueller RTI International
 Summary Findings from the National Evaluation of the Honest Opportunity Probation with Enforcement Demonstration Field Experiment: The HOPE DFE Evaluation Pamela K. Lattimore, Debbie Dawes and Stephen
Deputy Probation Officer I/II
 Santa Cruz County Probation September 2013 Duty Statement page 1 Deputy Probation Officer I/II 1. Conduct dispositional or pre-sentence investigations of adults and juveniles by interviewing offenders,
Follow-Up on VFM Section 3.01, 2014 Annual Report RECOMMENDATION STATUS OVERVIEW
 Chapter 1 Section 1.01 Ministry of Community Safety and Correctional Services and Ministry of the Attorney General Adult Community Corrections and Ontario Parole Board Follow-Up on VFM Section 3.01, 2014
Chapter 5 COMMUNITY SUPERVISION. Introduction to Corrections CJC 2000 Darren Mingear
 Chapter 5 COMMUNITY SUPERVISION Introduction to Corrections CJC 2000 Darren Mingear CHAPTER OBJECTIVES 5.1 Explain the key ways in which community supervision is beneficial to the offender, the community,
Sacramento County Community Corrections Partnership. Public Safety Realignment Plan. Assembly Bill 109 and 117. FY Realignment Implementation
 Sacramento County Community Corrections Partnership Public Safety Realignment Plan Assembly Bill 109 and 117 FY 2013 14 Realignment Implementation April 4, 2013 Prepared By: Sacramento County Local Community
OFFENDER REENTRY PROGRAM
 OFFENDER REENTRY PROGRAM PROCEDURE DOCUMENT The Offender Reentry Program policy was created in response to a mandate for the Alaska Department of Corrections to develop and implement risk reduction and
NORTH CAROLINA SENTENCING AND POLICY ADVISORY COMMISSION. CURRENT POPULATION PROJECTIONS FISCAL YEAR 2013 to FISCAL YEAR 2022
 NORTH CAROLINA SENTENCING AND POLICY ADVISORY COMMISSION CURRENT POPULATION PROJECTIONS FISCAL YEAR 2013 to FISCAL YEAR 2022 Prepared in Conjunction with the North Carolina Department of Public Safety
Washoe County Department of Alternative Sentencing
 Washoe County Department of Alternative Sentencing Misdemeanor Probation 2012 Joe Ingraham, Chief 1 Mission Statement The mission of the Department of Alternative Sentencing (DAS) is to increase safety
Marin County STAR Program: Keeping Severely Mentally Ill Adults Out of Jail and in Treatment
 Marin County STAR Program: Keeping Severely Mentally Ill Adults Out of Jail and in Treatment Ron Patton E X E C U T I V E S U M M A R Y The Marin County STAR (Support and Treatment After Release) Program
Testimony of Michael C. Potteiger, Chairman Pennsylvania Board of Probation and Parole House Appropriations Committee February 12, 2014
 Testimony of Michael C. Potteiger, Chairman Pennsylvania Board of Probation and Parole House Appropriations Committee February 12, 2014 Good morning Chairman Adolph, Chairman Markosek and members of the
Agenda: Community Supervision Subgroup
 Agenda: 9.15.15 Community Supervision Subgroup 1. Welcome 2. Member Introductions 3. Policy Discussion o Incentivizing Positive Behavior Earned Compliance Credits o Responding to Probation Violations:
Characteristics of Adults on Probation, 1995
 U.S. Department of Justice Office of Justice Programs Bureau of Justice Statistics Special Report December 1997, NCJ-164267 Characteristics of Adults on Probation, 1995 By Thomas P. Bonczar BJS Statistician
Sacramento County Community Corrections Partnership
 Sacramento County Community Corrections Partnership AB 109 Mental Health & Substance Abuse Work Group Proposal Mental Health & Alcohol / Drug Service Gaps: County Jail Prison ( N3 ), Parole, and Flash
NORTH CAROLINA SENTENCING AND POLICY ADVISORY COMMISSION. CURRENT POPULATION PROJECTIONS FISCAL YEAR 2012 to FISCAL YEAR 2021
 NORTH CAROLINA SENTENCING AND POLICY ADVISORY COMMISSION CURRENT POPULATION PROJECTIONS FISCAL YEAR 2012 to FISCAL YEAR 2021 Prepared in Conjunction with the North Carolina Department of Public Safety
Technical Report. An Analysis of Probation Violations and Revocations in Maine Probation Entrants in Maine Statistical Analysis Center
 Technical Report An Analysis of Probation Violations and Revocations in Maine Probation Entrants in 2005-2006 Submitted to the Justice Research and Statistics Association by Mark Rubin, Research Associate
RIVERSIDE COUNTY PROBATION DEP ARTME Serving Courts Protecting Our Community Changing Lives
 RIVERSIDE COUNTY PROBATION DEP ARTME Serving Courts Protecting Our Community Changing Lives MARKA.HAKE CHIEF PROBATION OFFICER August 6, 2014 Honorable Mark A. Cope, Presiding Judge Superior Court of California,
WINDSOR COUNTY, VERMONT DUI TREATMENT DOCKET (WCDTD) FOR REPEAT OFFENSE IMPAIRED DRIVING CASES
 FOR REPEAT OFFENSE IMPAIRED DRIVING CASES") WCDTD Policy Manual, Revised 5.4.15 WINDSOR COUNTY, VERMONT DUI TREATMENT DOCKET (WCDTD) FOR REPEAT OFFENSE IMPAIRED DRIVING CASES POLICY AND PROCEDURES MANUAL The Windsor County DUI Treatment Docket has
WCDTD Policy Manual, Revised 5.4.15 WINDSOR COUNTY, VERMONT DUI TREATMENT DOCKET (WCDTD) FOR REPEAT OFFENSE IMPAIRED DRIVING CASES POLICY AND PROCEDURES MANUAL The Windsor County DUI Treatment Docket has
Public Safety Realignment Act of 2011 (AB109)
") Community Corrections Partnership Executive Committee (CCPEC) Public Safety Realignment Act of 2011 (AB109) San Francisco Board of Supervisors Public Safety Committee Public Safety Realignment Hearing
Community Corrections Partnership Executive Committee (CCPEC) Public Safety Realignment Act of 2011 (AB109) San Francisco Board of Supervisors Public Safety Committee Public Safety Realignment Hearing
Closing the Revolving Door: Community. National Association of Sentencing Commissions August 2, 2011
 Closing the Revolving Door: Transition from Prison to Community National Association of Sentencing Commissions August 2, 2011 Oregon Department of Corrections Mission To promote public safety by holding
Circuit Court of Cook County Performance Metrics Department Adult Probation
 Fee collection N/A Adult Probation collects restitution on behalf of the courts that is distributed to victims. Adult Probation also collects probation fees that go to support subsidized treatment for
Assessment of Disciplinary and Administrative Segregation Proposal
 Assessment of Disciplinary and Administrative Segregation Proposal Submitted to: Pennsylvania Department of Corrections Central Office 1920 Technology Parkway Mechanicsburg PA 17050 US Submitted by Vera
Instructions for completion and submission
 OMB No. 1121-0094 Approval Expires 01/31/2019 Form CJ-5A 2018 ANNUAL SURVEY OF JAILS PRIVATE AND MULTIJURISDICTIONAL JAILS FORM COMPLETED BY U.S. DEPARTMENT OF JUSTICE BUREAU OF JUSTICE STATISTICS AND
JANUARY 2013 REPORT FINDINGS AND INTERIM RESEARCH HIGHLIGHTS. Legislative Budget Board Criminal Justice Forum October 4, 2013
 JANUARY 2013 REPORT FINDINGS AND 2013 14 INTERIM RESEARCH HIGHLIGHTS Criminal Justice Forum Outline of Today s Criminal Justice Forum 2 Criminal Justice Forum parameters Overview of January 2013 reports
5/25/2010 REENTRY COURT PROGRAM
 ALLEN COUNTY INDIANA REENTRY COURT PROGRAM Hon. John F. Surbeck, Jr. Judge, Allen Superior Court Presented in Boston, MA June 4, 2010 Allen County, Indiana Reentry Court Program 1. Background information
Factors Impacting Recidivism in Vermont. Report to House and Senate Committees April 21, 2011
 Factors Impacting Recidivism in Vermont Report to House and Senate Committees April 21, 2011 Michael Eisenberg, Research Manager Jessica Tyler, Senior Research Associate Council of State Governments, Justice
SUNSET ADVISORY COMMISSION. Texas Department of Criminal Justice Board of Pardons and Paroles Correctional Managed Health Care Committee
 SUNSET ADVISORY COMMISSION Texas Department of Criminal Justice Board of Pardons and Paroles Correctional Managed Health Care Committee Staff Report October 2006 Sunset Advisory Commission Senator Kim
Justice Reinvestment in Indiana Analyses & Policy Framework
 Justice Reinvestment in Indiana Analyses & Policy Framework December 16, 2010 Council of State Governments Justice Center Marshall Clement, Project Director Anne Bettesworth, Policy Analyst Robert Coombs,
North Carolina Sentencing and Policy Advisory Commission
 North Carolina Sentencing and Policy Advisory Commission Prison Population Projections: Fiscal Year 2016 to Fiscal Year 2025 February 2016 Introduction North Carolina General Statute 164 40 sets forth
Community Sentences and their Outcomes in Jersey: the third report
 Community Sentences and their Outcomes in Jersey: the third report Helen Miles Peter Raynor Brenda Coster September 2009 1 INTRODUCTION This report is the third in a continuing series which aims to provide
September 2011 Report No
 John Keel, CPA State Auditor An Audit Report on The Criminal Justice Information System at the Department of Public Safety and the Texas Department of Criminal Justice Report No. 12-002 An Audit Report
Program Guidelines and Procedures Supersedes: January 6, for Adult Transitional Case Management
 Texas Department of Number: PGP 01.07 Criminal Justice January 3, Date: 2011 TCOOMMI Page: I of 5 Program Guidelines and Procedures Supersedes: January 6, for Adult Transitional Case Management 2009 Subject:
Montgomery County s Continuity of Care (COC) Court for Mentally Ill Probationers: Process Evaluation
 Court for Mentally Ill Probationers: Process Evaluation") Montgomery County s Continuity of Care (COC) Court for Mentally Ill Probationers: Process Evaluation Prepared by: Jeff Bouffard, PhD Liz Berger, MA Nicole Niebuhr Correctional Management Institute of Texas
Montgomery County s Continuity of Care (COC) Court for Mentally Ill Probationers: Process Evaluation Prepared by: Jeff Bouffard, PhD Liz Berger, MA Nicole Niebuhr Correctional Management Institute of Texas
Instructions for completion and submission
 OMB No. 1121-0094 Approval Expires 01/31/2019 Form CJ-5 2017 ANNUAL SURVEY OF JAILS FORM COMPLETED BY U.S. DEPARTMENT OF JUSTICE BUREAU OF JUSTICE STATISTICS AND ACTING AS COLLECTION AGENT: RTI INTERNATIONAL
Responding to Racial Disparities in Multnomah County s Probation Revocation Outcomes
 Responding to Racial Disparities in Multnomah County s Probation Revocation Outcomes JUSTIN BREAUX, THE URBAN INSTITUTE KIMBERLY BERNARD, MULTNOMAH COUNTY DEPARTMENT OF COMMUNITY JUSTICE HELEN HO & JESSE
Nathaniel Assertive Community Treatment: New York County Alternative to Incarceration Program. May 13, 2011 ACT Roundtable Meeting
 Nathaniel Assertive Community Treatment: New York County Alternative to Incarceration Program May 13, 2011 ACT Roundtable Meeting Consumer Characteristics Average Age 43 Male 84% African American 60% Latino
County of Bucks DEPARTMENT OF CORRECTIONS 1730 South Easton Road, Doylestown, PA (215) Fax (215)
 Fax (215)") County Commissioners Robert G. Loughery, Chairman Charles H. Martin, Vice Chair Diane M. Ellis-Marseglia, LCSW County of Bucks DEPARTMENT OF CORRECTIONS 1730 South Easton Road, Doylestown, PA 18901 (215)
County Commissioners Robert G. Loughery, Chairman Charles H. Martin, Vice Chair Diane M. Ellis-Marseglia, LCSW County of Bucks DEPARTMENT OF CORRECTIONS 1730 South Easton Road, Doylestown, PA 18901 (215)
Adult DUI/Drug Court Certification Application
 The Council of Accountability Court Judges (Council) has created a certification process for the DUI/Drug courts. The certification process is part of an effort to ensure courts are adhering to standards
GENERAL ASSEMBLY OF NORTH CAROLINA Session Legislative Incarceration Fiscal Note
 GENERAL ASSEMBLY OF NORTH CAROLINA Session 2007 Legislative Incarceration Fiscal Note (G.S. 120-36.7) BILL NUMBER: SHORT TITLE: SPONSOR(S): House Bill 887 (Second Edition) Amend Criminal Offense of Stalking.
Outcomes Analyses: Prepared 2/04/04 by Lois A. Ventura, Ph.D. Department of Criminal Justice College of Health and Human Services University of Toledo
 Outcomes Analyses: Probationers Released from CTF and Admitted to the Lucas County TASC Offender Stabilization Project in Calendar Year 2001 Calendar Year 2002 Prepared 2/04/04 by Lois A. Ventura, Ph.D.
*Chapter 3 - Community Corrections
 *Chapter 3 - Community Corrections I. The Development of Community-Based Corrections p57 A. The agencies of community-based corrections consist of diversion programs, probation, intermediate sanctions,
Justice Reinvestment in West Virginia
 Justice Reinvestment in West Virginia Presentation to WV Behavioral Health Planning Council October 16, 2014 Joseph D. Garcia Deputy General Counsel Office of Governor Earl Ray Tomblin Outline of Presentation
ALTERNATIVES FOR MENTALLY ILL OFFENDERS
 ALTERNATIVES FOR MENTALLY ILL OFFENDERS Annual Report January December 007 Table of Contents I. Introduction II. III. IV. Outcomes reduce recidivism and incarceration stabilize housing reduce acute care
The Primacy of Drug Intervention in Public Safety Realignment Success. CSAC Healthcare Conference June 12, 2013
 The Primacy of Drug Intervention in Public Safety Realignment Success CSAC Healthcare Conference June 12, 2013 Review complete 2010 prison population (162 offenders to prison Conduct Risk Assessments for
Correctional Populations in the United States, 2009
 U.S. Department of Justice Office of Justice Programs Bureau of Justice Statistics Bureau of Justice Statistics Bulletin December 2010, NCJ 231681 Correctional Populations in the United States, 2009 Lauren
DATA SOURCES AND METHODS
 DATA SOURCES AND METHODS In August 2006, the Department of Juvenile Justice s (DJJ) Quality Assurance, Technical Assistance and Research and Planning units were assigned to the Office of Program Accountability.
DEPARTMENT OF CORRECTIONS
 DEPARTMENT OF CORRECTIONS Department Budget Overview House Finance Sub-Committee January 26, 2017 Mission 1 The enhances the safety of our communities. We provide secure confinement, reformative programs,
North Carolina Sentencing and Policy Advisory Commission
 North Carolina Sentencing and Policy Advisory Commission January 2015 Prison Population Projections: Fiscal Year 2015 to Fiscal Year 2024 Introduction North Carolina General Statute 164 40 sets forth the
Defining the Nathaniel ACT ATI Program
 Nathaniel ACT ATI Program: ACT or FACT? Over the past 10 years, the Center for Alternative Sentencing and Employment Services (CASES) has received national recognition for the Nathaniel Project 1. Initially
Closing the Gap. Using Criminal Justice and Public Health Data to Improve the Identification of Mental Illness JULY 2012
 Closing the Gap Using Criminal Justice and Public Health Data to Improve the Identification of Mental Illness JULY 2012 SUBSTANCE USE AND MENTAL HEALTH PROGRAM Executive Summary This report describes findings
Indiana Criminal Justice Association Presentation October 18 th, 2016
 Indiana Criminal Justice Association Presentation October 18 th, 2016 The Hoosier Initiative for Re-Entry (HIRE) program started in February 2012 and is a joint effort between WorkOne/Department of Workforce
Nevada Department of Public Safety Division of Parole and Probation PAROLE AND PROBATION RE-ENTRY PROGRAMS
 Nevada Department of Public Safety Division of Parole and Probation PAROLE AND PROBATION RE-ENTRY PROGRAMS Agency Collaboration Beginning in December 2012 and into 2013, Division of Parole and Probation,
GENERAL ASSEMBLY OF NORTH CAROLINA Session 2017 Legislative Incarceration Fiscal Note
 GENERAL ASSEMBLY OF NORTH CAROLINA Session 2017 Legislative Incarceration Fiscal Note BILL NUMBER: House Bill 65 (First Edition) SHORT TITLE: Req Active Time Felony Death MV/Boat. SPONSOR(S): Representatives
Overview of Recommendations to Champaign County Regarding the Criminal Justice System
 Overview of Recommendations to Champaign County Regarding the Criminal Justice System Recommendations related specifically to the facilities issues are not included in this table. The categories used in
Speaker: Ruby Qazilbash. Ruby Qazilbash Associate Deputy Director Bureau of Justice Assistance Office of Justice Programs U.S. Department of Justice
 1 2 Speaker: Ruby Qazilbash Ruby Qazilbash Associate Deputy Director Bureau of Justice Assistance Office of Justice Programs U.S. Department of Justice 3 Today s Webinar Council of State Governments Justice
Sacramento County Community Corrections Partnership. Public Safety Realignment Act
 Sacramento County Community Corrections Partnership Public Safety Realignment Act Assembly Bill 109 and 117 Long-Term Realignment Implementation Plan May 2014 Prepared by: Sacramento County Community Corrections
Ministry of Children and Youth Services. Follow-up to VFM Section 3.13, 2012 Annual Report RECOMMENDATION STATUS OVERVIEW
 Chapter 4 Section 4.12 Ministry of Children and Youth Services Youth Justice Services Program Follow-up to VFM Section 3.13, 2012 Annual Report RECOMMENDATION STATUS OVERVIEW # of Status of Actions Recommended
Office of Criminal Justice Services
 Office of Criminal Justice Services Annual Report FY 2012 Manassas Office 9540 Center Street, Suite 301 Manassas, VA 20110 703-792-6065 Woodbridge Office 15941 Donald Curtis Drive, Suite 110 Woodbridge,
State of North Carolina Department of Correction Division of Prisons
 State of North Carolina Department of Correction Division of Prisons POLICY & PROCEDURES Chapter: E Section:.1700 Title: Issue Date: 06/11/10 Supersedes: 11/13/07 Mutual Agreement Parole Program (MAPP).1701
UTILIZING SWIFT AND CERTAIN SANCTIONS IN PROBATION: FINAL RESULTS FROM DELAWARE S DECIDE YOUR TIME PROGRAM.
 UTILIZING SWIFT AND CERTAIN SANCTIONS IN PROBATION: FINAL RESULTS FROM DELAWARE S DECIDE YOUR TIME PROGRAM. Daniel O Connell Christy Visher John Brent Grant Bacon Karl Hines The American Society of Criminology.
STUCK BEHIND BARS: EXPLORING REASONS WHY PAROLE ELIGIBLE INMATES IN NEVADA REMAIN INCARCERATED. May 21, 2015
 STUCK BEHIND BARS: EXPLORING REASONS WHY PAROLE ELIGIBLE INMATES IN NEVADA REMAIN INCARCERATED T May 21, 2015 en years ago a report by the Nevada Department of Corrections (NDOC) found that the Nevada
Justice-Involved Veterans
 Justice-Involved Veterans Jessica Blue-Howells, LCSW National Coordinator, Health Care for Reentry Veterans National Program Manager, Project CHALENG May 2014 Agenda Who are justice involved Veterans Why
HOPE: Theoretical Underpinnings and Evaluation Findings
 HOPE: Theoretical Underpinnings and Evaluation Findings Angela Hawken, Ph.D. Professor of Economics and Policy Analysis School of Public Policy Pepperd ine University Malibu, CA Testimony prepared for
2007 Innovations Awards Program APPLICATION
 2007 Innovations Awards Program APPLICATION CSG reserves the right to use or publish in other CSG products and services the information provided in this Innovations Awards Program Application. If your
Reducing Recidivism for Ex-offenders Returning to Essex County
 Reducing Recidivism for Ex-offenders Returning to Essex County Background When The Nicholson Foundation began to focus its efforts in New Jersey in 2002, research into the most important problems confronting
TARRANT COUNTY DIVERSION INITIATIVES
 TARRANT COUNTY DIVERSION INITIATIVES Texas Council June 2015 Ramey C. Heddins, CCHP Director Mental Health Support Services Kathleen Carr Rae, Public Policy Specialist WHAT IS THE PROBLEM? Prison 3-year
WRITTEN TESTIMONY SUBMITTED BY DOUGLAS SMITH, MSSW TEXAS CRIMINAL JUSTICE COALITION
 WRITTEN TESTIMONY SUBMITTED BY DOUGLAS SMITH, MSSW TEXAS CRIMINAL JUSTICE COALITION ON THE TEXAS DEPARTMENT OF CRIMINAL JUSTICE & THE TEXAS BOARD OF PARDONS AND PAROLES TO HOUSE COMMITTEE ON APPROPRIATIONS
Racial Bias and Probation: Research Findings and Real World Strategies
 Racial Bias and Probation: Research Findings and Real World Strategies Managing Your Most Dangerous Offenders Conference June 18-19, 2019 Jesse Jannetta, Urban Institute Truls Neal, Multnomah County Department
SAN JOAQUIN COUNTY PUBLIC SAFETY REALIGNMENT. Data Collection Efforts
 SAN JOAQUIN COUNTY PUBLIC SAFETY REALIGNMENT Data Collection Efforts 2 Year 1 Planning Contracted with San Joaquin County Community Data Co-Op 10 year relationship with evaluation work Funds from one-time
DISABILITY-RELATED INQUIRIES CONCERNING INDIVIDUALS INCARCERATED IN PRISON. Prepared by the Disability Rights Network of Pennsylvania
 DISABILITY-RELATED INQUIRIES CONCERNING INDIVIDUALS INCARCERATED IN PRISON Prepared by the Disability Rights Network of Pennsylvania Jail and Prison: What Is the Difference? People often use the terms
1 P a g e E f f e c t i v e n e s s o f D V R e s p i t e P l a c e m e n t s
 1 P a g e E f f e c t i v e n e s s o f D V R e s p i t e P l a c e m e n t s Briefing Report Effectiveness of the Domestic Violence Alternative Placement Program: (October 2014) Contact: Mark A. Greenwald,
TEXAS DEPARTMENT OF CRIMINAL JUSTICE
 TEXAS DEPARTMENT OF CRIMINAL JUSTICE TEXAS CORRECTIONAL OFFICE ON OFFENDERS WITH MEDICAL OR MENTAL IMPAIRMENTS (TCOOMMI) NUMBER: DATE: September 1, 2017 (rev. 2) PROGRAM GUIDELINES PAGE: 1 of 6 AND PROCESSES
St. Louis County Public Safety Innovation Fund Report
 St. Louis County Public Safety Innovation Fund Report INTENSIVE PRE-TRIAL RELEASE PROGRAM Program Goal: Provide Intensive Community Supervision on Pre-Trial Defendants in lieu of incarceration at the St.
ASHTABULA COUNTY COMMON PLEAS MENTAL HEALTH COURT. JUDGE MARIANNE SEZON, 25 West Jefferson Street, Jefferson, Ohio PARTICIPANT HANDBOOK
 ASHTABULA COUNTY COMMON PLEAS MENTAL HEALTH COURT JUDGE MARIANNE SEZON, 25 West Jefferson Street, Jefferson, Ohio 44047 PARTICIPANT HANDBOOK TABLE OF CONTENTS CHAPTER 1: WELCOME AND PROGRAM INTRODUCTION.....
April 16, The Honorable Shirley Weber Chair Assembly Budget, Subcommittee No. 5 on Public Safety State Capitol, Room 3123 Sacramento CA 95814
 April 16, 2018 The Honorable Shirley Weber Chair Assembly Budget, Subcommittee No. 5 on Public Safety State Capitol, Room 3123 Sacramento CA 95814 Dear Assemblymember Weber, I and the undersigned legislators
Interagency Council on Intermediate Sanctions
 Interagency Council on Intermediate Sanctions October 2011 Timothy Wong, ICIS Research Analyst Maria Sadaya, Judiciary Research Aide Hawaii State Validation Report on the Domestic Violence Screening Instrument
Justice Reinvestment in Arkansas
 Justice Reinvestment in Arkansas Fifth Presentation to the Legislative Criminal Justice Oversight Task Force June 22, 2016 Andy Barbee, Research Manager Jessica Gonzales, Senior Research Associate Mack
Examining Racial Disparities in the Sixth Judicial District of Iowa s Probation Revocation Outcomes
 Examining Racial Disparities in the Sixth Judicial District of Iowa s Probation Revocation Outcomes HELEN HO, JUSTIN BREAUX, AND JESSE JANNETTA, THE URBAN INSTITUTE MALINDA LAMB, IOWA S SIXTH JUDICIAL
New Directions --- A blueprint for reforming California s prison system to protect the public, reduce costs and rehabilitate inmates
 - --- \. \ --- ----. --- --- --- ". New Directions A blueprint for reforming California s prison system to protect the public reduce costs and rehabilitate inmates California Correctional Peace Officers
A Preliminary Review of the Metropolitan Detention Center s Community Custody Program
 A Preliminary Review of the Metropolitan Detention Center s Community Custody Program Prepared by: Institute for Social Research, University of New Mexico Linda Freeman, M.A. June 2006 Introduction The
COUNTY OF SACRAMENTO Probation Department
 COUNTY OF SACRAMENTO Probation Department 9750 BUSINESS PARK DRIVE, SUITE 220, SACRAMENTO, CALIFORNIA 95827 TELEPHONE (916) 875-0273 FAX (916) 875-0347 LEE SEALE CHIEF PROBATION OFFICER COUNTY PAROLE OFFICER
Harris County Mental Health Jail Diversion Program Harris County Sequential Intercept Model
 Harris County Mental Health Jail Diversion Program Harris County Sequential Intercept Model 12/31/2015 1 Harris County Mental Health Jail Diversion Program Sequential Intercept Model The Sequential Intercept
The Criminal Justice Information System at the Department of Public Safety and the Texas Department of Criminal Justice. May 2016 Report No.
 An Audit Report on The Criminal Justice Information System at the Department of Public Safety and the Texas Department of Criminal Justice Report No. 16-025 State Auditor s Office reports are available
H.B Implementation Report
 H.B. 1711 Implementation Report September 1, 2010 Submitted to: Governor Lieutenant Governor Speaker of the House Senate Criminal Justice & House Corrections Committees H.B. 1711 Implementation Report
Virginia Community Corrections
 National Center for State Courts Project Co-Directors: Fred Cheesman, Ph.D. Tara L. Kunkel, MSW Project Staff: Scott E. Graves, Ph.D. Michelle T. White, MPA Shauna Strickland, MPA Virginia Community Corrections
GENESEE COUNTY PUBLIC DEFENDER S OFFICE 2017 PROGRAM BUDGET
 GENESEE COUNTY PUBLIC DEFENDER S OFFICE 2017 PROGRAM BUDGET ORGANIZATIONAL CHART Public Defender Senior Assistant Public Defender Criminal Trial Program Investigator Family Court Program Clerical Staff
PROJECTING THE IMPACTS OF A COERCED ABSTINENCE PROBATION MODIFICATION PROGRAM IN NORTH CAROLINA
 PROJECTING THE IMPACTS OF A COERCED ABSTINENCE PROBATION MODIFICATION PROGRAM IN NORTH CAROLINA Maureen Richey Master of Public Policy Candidate Sanford School of Public Policy Duke University Faculty
SHELBY COUNTY, ALABAMA VETERANS COURT PROGRAM MENTOR GUIDE INTRODUCTION
 SHELBY COUNTY, ALABAMA VETERANS COURT PROGRAM MENTOR GUIDE INTRODUCTION In 2011, Shelby County was selected by the Alabama Administrative Office of Courts to serve as a pilot county for implementation
MH Collaboration TA NIC/CSG
 MH Collaboration TA NIC/CSG Orange County Strategies to Examine MH PTR Program Planning and Delivery Dr. Tony Fabelo CSG/The JFA Institute 1 Overview Review of April 05 Miami Conference Issues Goals of
RE: Grand Jury Report: AB109/AB117 Realignment: Is Santa Clara County Ready for Prison Reform?
 County of Santa Clara Office of the Clerk of the Board of Supervisors County Government Center, East Wing 70 West Hedding Street San Jose, California 95110-1770 (408) 299-5001 FAX 298-8460 TDD 993-8272
During 2011, for the third
 U.S. Department of Justice Office of Justice Programs Bureau of Justice Statistics Probation and Parole in the United States, 2011 Laura M. Maruschak, BJS Statistician and Erika Parks, BJS Intern During
PROPOSAL FAMILY VIOLENCE COURT
 Mission Statement Through a collaborative process with the community and the Superior Court to increase awareness and understanding of the causes and consequences of family violence, the Marin County Family
Hamilton County Municipal and Common Pleas Court Guide
 Hamilton County Municipal and Common Pleas Court Guide Updated May 2017 PREVENTION ASSESSMENT TREATMENT REINTEGRATION MUNICIPAL & COMMON PLEAS COURT GUIDE Table of Contents Table of Contents... 2 Municipal
CSG JUSTICE CENTER MASSACHUSETTS CRIMINAL JUSTICE REVIEW
 CSG JUSTICE CENTER MASSACHUSETTS CRIMINAL JUSTICE REVIEW Working Group Meeting 4 Interim Report, October 20, 2016 The Council of State Governments Justice Center Interim report prepared by: Katie Mosehauer,
Fresno County, Department of Behavioral Health Full Service Partnership Program Outcomes Reporting Period Fiscal Year (FY)
") The Fresno County, Department of Behavioral Health strives to evaluate Contract Providers and In-House programs on an ongoing basis to measure cost effectiveness, need for service, program success, and
The Fresno County, Department of Behavioral Health strives to evaluate Contract Providers and In-House programs on an ongoing basis to measure cost effectiveness, need for service, program success, and
Forensic Assertive Community Treatment Team (FACT) A bridge back to the community for people with severe mental illness
 A bridge back to the community for people with severe mental illness") Forensic Assertive Community Treatment Team (FACT) A bridge back to the community for people with severe mental illness Gary Morse, Ph.D. Katie Thumann, L.C.S.W. Places for People: Community Alternatives
Forensic Assertive Community Treatment Team (FACT) A bridge back to the community for people with severe mental illness Gary Morse, Ph.D. Katie Thumann, L.C.S.W. Places for People: Community Alternatives