UTAH S ADVANCED PRACTICE REGISTERED NURSE WORKFORCE, 2017: A Study on the Supply and Distribution of APRNs in Utah. The Utah Medical Education Council
|
|
|
- Martin Greer
- 6 years ago
- Views:
Transcription

1 UTAH S ADVANCED PRACTICE REGISTERED NURSE WORKFORCE, 2017: A Study on the Supply and Distribution of APRNs in Utah The Utah Medical Education Council State of Utah Prepared by: Annette Harris & Clark Ruttinger
2 Utah s Advanced Practice Registered Nurse Workforce, 2017: A Study of the Supply and Distribution of APRNs in Utah Copyright 2017 by the Utah Medical Education Council All Rights Reserved Printed in the United States of America Internet Address: This publication cannot be reproduced or distributed without permission. Please contact the UMEC at juolson@utah.gov or call (801) for permission to do so. Suggested Citation: Utah Medical Education Council (2017). Utah s Advanced Practice Registered Nurse Workforce, 2017: A Study of the Supply and Distribution of APRNs in Utah. Salt Lake City, UT.
3 The Utah Medical Education Council The Utah Medical Education Council (UMEC) was created in 1997 by H.B.141 out of a need to secure and stabilize the state s supply of healthcare clinicians. This legislation authorized the UMEC to conduct ongoing healthcare workforce analyses and to assess Utah s training capacity and graduate medical education (GME) financing policies. The UMEC is presided over by an eight-member board appointed by the Governor to bridge the gap between public/private health care workforce and education interests. Members of the UMEC include: ACTING CHAIR Wayne M. Samuelson M.D. Associate Dean for Admissions, School of Medicine University of Utah VICE-CHAIR Douglas Smith, M.D. Institutional Sponsor Member Associate Chief Medical Officer Intermountain Healthcare John Berneike, M.D. Institutional Sponsor Member Director, Family Practice Residency Program Utah Health Care Institute Larry Reimer, M.D. Institutional Sponsor Member Associate Dean Professor of Pathology, School of Medicine University of Utah Mark Hiatt, M.D., MBA, MS Executive Medical Director Regence BlueCross BlueShield of Utah Gar Elison Public Member Mary Williams, Ph.D., RN Public Member Sue Wilkey, DNP Public Member
4 ACKNOWLEDGEMENTS This study of Utah s advanced practice registered nurse workforce is based on a survey completed in 2016 by the Utah Medical Education Council (UMEC) with assistance from the Utah Division of Occupational and Professional Licensing (DOPL). Additional support was provided by the University Of Utah College Of Nursing, Westminster College of Nursing, Brigham Young University College of Nursing and the Utah Organization of Nurse Leaders. The UMEC would like to thank its staff for their assistance and the following members of the advanced practice registered nurse workforce advisory committee, for their time and expertise in developing this report: Committee Members Deanne Williams, CNM, MS Advanced Practice Clinical Coordinator Intermountain Healthcare Donna Freeborn, PhD, FNP-BC Coordinator, FNP Program Brigham Young University College of Nursing Gwen Latendresse, PhD, CNM, FACNM Director, Nurse Midwifery DNP Specialty Track University of Utah College of Nursing Julie P. Balk, DNP, FNP-BC, CNE FNP Specialty Track Director University of Utah College of Nursing Ted Morris, CRNA President Utah Association of Nurse Anesthetists Kelleen Brown, MSN, ACNS-BC, OCN Adult Health Clinical Nurse Specialist Intermountain Healthcare Patricia G. Morton, PhD, RN, ACNP-BC, FAAN Dean University of Utah College of Nursing Sheryl Steadman, PhD, MSN, BSN Dean Westminster College, School of Nursing and Health Sciences
5 Additional Resources Healthcare Workforce Reports Since its establishment, the UMEC has completed multiple reports on healthcare workforce in Utah, including: Advanced Practice Nurses Dentists Medical Technologists Mental Health Professionals Pharmacists Podiatrists Physicians Physician Assistants Radiology Technologists Registered Nurses For access to any of these reports, please view on our website Physician Job Opportunities in Utah The UMEC conducts annual job fairs for Physicians and Advanced Practitioners (PAs, APRNs including CNSs, CNMs, CRNAs, and NPs) attending training programs and/or practicing in Utah. These job fairs are free of cost for attendees and are geared towards promoting retention of Utah trained workforce in Utah. Major health care employers in Utah are invited to recruit at the fairs. As a part of its rural workforce initiative, the UMEC encourages rural and frontier hospitals, clinics, and practices to take part in these job fairs by discounting their participation fees. In addition, the UMEC also hosts a job board on its website. For a listing of Utah physician jobs by specialty, please access our website at:
6 Table of Contents Table of Contents... 1 List of Tables... 3 List of Figures... 4 Executive Summary... 5 Methodology... 7 License Data... 7 Design of Survey Instrument... 7 Data Collection... 7 Response Rate... 8 Data Entry and Analysis... 8 Survey Limitations... 8 Introduction... 9 Licensing and Certification Licensed in Utah APRNs Practicing in State Certification Demographics Upbringing Age Gender Race Education and Experience Previous RN Experience APRN Graduation Education Background Nursing Faculty Time Allocation Work and Income Current Positions held Income Income by Geography
7 Retirement Practice Characteristics Geographic Distribution Specialties Settings Patient Visits Age Range of Patients Provider Accessibility Insurance Payer Types Precepting Consultation and Referral Plans Workforce Projections Supply Demand Certified Nurse Midwife Projection Clinical Nursing Specialists Projections Certified Registered Nurse Anesthetists Projection Nurse Practitioners Projection Conclusion Policy Recommendations Appendix A: Works Cited Appendix B: Survey Instruments
8 List of Tables Table 1: 2015 Survey Response Rates and Weighting Factors... 8 Table 2: Growth in Utah APRN Workforce Table 3: NP Certifications--Utah and National Table 4: CNS Certifications Utah Table 5: Age Cohort Breakdown Percentages--2003, 2010, Table 6: APRNs in Utah by Gender and License Category--2003, 2010, Table 7: Years since APRN Graduation Table 8: Age Cohort of APRNs at Graduation Table 9: Highest Degree Achieved by Utah APRNs Table 10: Faculty/Teaching Status of Utah APRNs Table 11: Hours Worked per Week by Category Table 12: Type of Position Held Table 13: Ranked Reasons for Unemployment Table 14: Average Median FTE Adjusted Income for APRNs in Utah Table 15: FTE Adjusted Income Distribution Summary by Category Table 16: APRNs with Intention to Retire within 10 Years Table 17: APRNs by Rural/Urban Primary Practice Setting Table 18: Primary Practice Location by County Table 19: Overall APRN Specialties Table 20: APRN Settings by Category Table 21: Mean Patient Visits per Week Table 22: Average Patient Visits per Week Table 23: Average Patient Visits per Week Table 24: % Change in Patient Visits per Week Since Table 25: Age Range of Patients by APRN Category Table 26: Average Patient Wait Times Table 27: Patient Insurance Use Breakdown by Category for Primary Practice Table 28: Physician, PA, and Population Ratios in All Utah Counties Table 29: CNM 10-year Workforce Projection Table 30: CNS 10-year Workforce Projection Table 31: CRNA 10-year Workforce Projection Table 32: NP 10-year Workforce Projection
9 List of Figures Figure 1: 2015 APRN Category Breakdown Figure 2: Number of Active APRN Licenses by Category Over Time Figure 3: All APRN License Trends--Issued and Currently Active Figure 4: NP/CNS License Trends--Issued and Currently Active Figure 5: CNM License Trends--Issued and Currently Active Figure 6: CRNA License Trends--Issued and Currently Active Figure 7: Percent of Workforce Practicing in Utah--2003, 2010, Figure 8: Upbringing Setting of APRNs Working in Rural Areas Figure 9: Practice Location and Upbringing Figure 10: Average Age of Utah APRNs by Category Figure 11: Age Cohort Breakdown by Category Figure 12: Gender Breakdown by Category Figure 13: Utah's APRN Workforce by Race Compared to Utah Population by Race Figure 14: Avg. Number of Years of RN Experience Before Becoming an APRN Figure 15: Percentage of APRN Workforce Trained in Utah by Category Figure 16: First Nursing Degree/Credential Figure 17: 2015 Median FTE Adjusted Income by Category Figure 18: CNM FTE Adjusted Income Distribution Figure 19: CNS FTE Adjusted Income Distribution Figure 20: CRNA FTE Adjusted Income Distribution Figure 21: NP FTE Adjusted Income Distribution Figure 22: Median Income by Rural vs Urban Practice Figure 23: Number of Years until Intended Retirement by License Category Figure 24: Number of Years to Intended Retirement by Age Figure 25: APRN Specialties by Median FTE Income Figure 26: CNM Specialties Breakdown Figure 27: CNS Specialties Breakdown Figure 28: NP Specialties Breakdown Figure 29: CNM Settings Breakdown Figure 30: CNS Settings Breakdown Figure 31: CRNA Settings Breakdown Figure 32: NP Settings Breakdown Figure 33: Insurance Use Breakdown by Category--Primary Practice Figure 34: Preceptor Supply for Utah APRNs Figure 35: Experience with Consultation and Referral Plans Figure 36: Counties with <1:3,000 Primary Care MDs to Population Ratio Figure 37: Counties with <1:3,000 Total Primary Care Providers to Population Ratio Figure 38: CNM 10 Year Projection Figure 39: CNS 10 Year Projection Figure 40: CRNA 10 Year Projection Figure 41: NP 10-year Workforce Projection
10 Executive Summary This report contains analysis of the fourth Utah Medical Education Council s Advanced Practice Registered Nurse workforce survey. Compared to the previous surveys conducted in 1998, 2003 and 2010, Utah s APRN workforce continues to grow. As of October 2015, there were a total of 2,169 APRNs licensed in the state. This total is made up of 1,670 (77%) Nurse Practitioners, 139 (6%) Certified Nurse Midwives, 110 (5%) Clinical Nurse Specialists, and 250 (12%) Certified Registered Nurse Anesthetists. Of those licensed in the state, survey data indicates that 1,852 (85%) provide health care services in state. The 2015 survey received 1,115 responses, which is a response rate of 51.4% 1. Such a high response rate allows for highly accurate analysis. The accuracy has a confidence interval of 95% +/- 2%. Survey responses were weighted with the following factors to account for nonrespondents: CNM, 1.38; CNS, 2.00; CRNA, 1.89; and NP, Overall, the APRN workforce continues to grow older on average. The average age overall is 50 (up from 47 in 2010) but when broken down by category of APRN for CNMs, CNSs, CRNAs, and NPs the average ages are 52, 59, 49, and 49 respectively. Average incomes for APRNs have grown in dollar amount, but when adjusted for inflation have fallen 12% since the last APRN survey in FTE adjusted median income for APRNs overall is $101,254 according to the 2015 survey data. Median income for APRNs practicing in rural settings is higher than for those in urban settings. Demographically, APRNs are 88% female, and 91% Caucasian. They have on average 8 years of RN experience before pursuing advanced practice education. Survey data indicated that male RNs move onto advanced practice much more quickly than women. Utah APRNs have 13.4 years of advanced practice experience on average, with 84% reporting that their highest level of education is a master s degree while 16.4% report holding a doctorate. One hundred and fourteen APRNs report currently working as a faculty member. The APRN workforce has seen a percentage decrease in rural practice dropping from 11% overall in 2003 to 6% in More than 20% of the CRNA workforce are working in rural counties. 1 Response rates within specific categories 5
11 Utah APRNs have a diverse range of specialties, the most common overall being Family Practice (18.3%), OB/GYN (10%), and Pediatrics (6%). APRNs report seeing an average of 14 inpatients and 42 outpatients per week. This represents an increase in number of patients seen since the survey conducted in 2003 there has been a 75% increase in inpatients seen per week. The largest category of insurance used by APRN patients is private insurance at 33% in primary settings, but Medicaid and Medicare make up the bulk of insurance use when considered together. Most CNMs, CNSs, and NPs report that they are currently accepting all types of insurance in their primary or secondary practice locations. The majority of each category is either currently precepting or has interest in precepting in the near future. Overall, 56% of APRNs report that they are currently precepting. The category with the fewest preceptor sites are CRNAs and with the most are CNMs. Those who indicated that they did not see precepting as a possibility in the foreseeable future cited busy schedules and workplace policy as major reasons for not participating as preceptors. Ten-year workforce and population-based demand projections indicate that for every category, there will be a supply shortage over the next 10 years compared to demand if there are no changes in trends. CNMs are projected to decline at a rate of 1.47 FTEs per year, but will need a growth rate of 1.4 FTEs per year over the next 10 years to meet population-based demand. CNSs are projected to decline at a rate of FTEs per year, but will need a growth rate of 1.7 FTEs per year over the next 10 years to meet population-based demand. CRNAs are projected to grow at a rate of FTEs per year, but will need a growth rate of 3.9 FTEs per year to meet population-based demand. NPs are projected to grow at a rate of FTEs per year, but will need a growth rate of 27.8 FTEs per year to meet population-based demand. 6
12 Methodology License Data The Utah Department of Commerce s Division of Occupational and Professional Licensing (DOPL) provided the Utah Medical Education Council with updated license information for every person licensed as Certified Registered Nurse Anesthetists (CRNA), Certified Nurse Midwife-Advanced Practice Registered Nurses (CNM-APRN), and Advanced Practice Registered Nurses (APRN). In Utah, Nurse Practitioners (NP) and Clinical Nurse Specialists (CNS) are classified by DOPL the same way. As of October 2015, there were 2,169 nurses holding one of these licenses according to DOPL data. No selection criteria or sampling calculations were necessary since UMEC has the capacity to survey the entire population of Utah APRNs. Design of Survey Instrument The design of the 2015 APRN survey was based on the precedent and methodology set by the previous two UMEC APRN reports from 2003 and 2011, as well as consideration of their strengths and weaknesses. Instead of one survey that included questions relevant to all categories of APRN, the 2015 survey was broken into 4 more specific surveys sent to APRNs based on their DOPL licensing. 2 The 4 versions of the survey were: 1. Certified Nurse Midwife Survey 2. Certified Registered Nurse Anesthetist Survey 3. Nurse Practitioner/Clinical Nurse Specialist Survey 4. Nurse Practitioner/Certified Nurse Midwife/Clinical Nurse Specialist Survey (to better capture dual licensed APRNs in 2 or more of the categories) Data Collection The survey was sent out initially in October Those who did not respond received a second mailing in February A third mailing was sent to those who had not responded to the first two mailings in April In addition to the mailed surveys, UMEC provided an online option to complete the survey through Qualtrics. Relatively few online responses (170) were received, and were included in all analysis unduplicated. Data collection was completed at the end of June The survey received 1,115 responses with an overall response rate of 51.4 % (95% confidence interval +/- 2%). With such a high response rate, UMEC was able to conduct highly accurate analysis. Survey responses were weighted by license category as follows CNM: 1.42, CRNA: 1.89, CNS: 2.01, NP: 2.01 to account for non-respondents. 2 These surveys largely asked the same questions with particular specific focus for each profession. Survey instruments are published in the appendix of this report. 7
13 Response Rate Response rates to the APRN survey were strong, particularly when compared to typical response rates expected for mail-in surveys. Overall, our 2015 mail-out surveys were completed with a 51.4% response rate. A small number of people completed the survey in an online version UMEC made available for the first time in our APRN reporting for this report. One hundred and seventy individuals completed the survey online and during the data cleaning process we removed any duplications from people who completed both the online survey and returned the paper survey. The table below details the total number of licensed individuals in each category, the number of survey responses (unduplicated) received, the percent of each APRN category that responded, and the weighting factors that were applied to each category for analysis counts. Table 1: 2015 Survey Response Rates and Weighting Factors APRN Category Total Number Responses Percentage Weighting Factors CNM % 1.38 CNS % 2.00 CRNA % 1.89 NP % 2.02 All subsequent numbers cited in this report are weighted numbers unless otherwise indicated. Data Entry and Analysis The 2015 Utah APRN Workforce Survey was processed using forms and databases created in Microsoft Access. Data entry and cleanup were done in house by UMEC staff. Once data entry and clean up were complete, the information was imported into IBM SPSS for all statistical analysis. Analysis began in September of Survey Limitations Because survey data relies on self-reported information, there is risk of inaccuracy even with a well-designed survey instrument. Additionally, while CNS is nationally recognized as one of the four types of APRNs, the state of Utah licenses both NPs and CNSs together with no distinction between the two in the DOPL data. While the exact numbers of CNMs and CRNAs could be determined by license data, the number of CNSs and NPs were determined by number of respondents who indicated that they are currently practicing as a CNS or Nurse Practitioner. 8
14 Introduction An advanced practice registered nurse (APRN) is a registered nurse (RN) prepared at the postgraduate level, holding a specialized certificate. The definition of APRN according to the American Nursing Association is a nurse who has 1) completed an accredited graduate-level education program preparing him/her for one of the four recognized APRN roles, 2) who has passed a national certification examination that measures APRN, role and population-focused competencies and who maintains continued competence as evidenced by recertification in the role and population through the national verification program; 3) who has acquired advanced clinical knowledge and skills preparing him/her to provide direct care to patients; 4) whose practice builds on the competencies of registered nurses by demonstrating a great depth and breadth of knowledge, a great synthesis of data, increased complexity of skills and interventions, and greater role autonomy; and 5) who is educationally prepared to assume responsibility and accountability for health promotion and/or maintenance as well as the assessment, diagnosis, and management of patient problems (Institutes of Medicine, 2011). There are four main categories of the APRN profession: Certified Nurse Midwives (CNM), Clinical Nurse Specialists (CNS), Certified Registered Nurse Anesthetists (CRNA) and Nurse Practitioners (NP). A CNM provides a full range of primary health care services to women throughout the lifespan, including gynecologic care, family planning services, preconception care, childbirth, and care of newborns. A CNS has a unique role of integrating care across patients, the nursing workforce, and health systems. The primary goal of the CNS is to create positive environments for patients and nurses through mentoring, evidence-based practices, high quality coordination, and prevention of illness and risk behaviors among individuals, families, and communities. A CRNA is trained to provide the full spectrum of patients anesthesia care for individuals of all ages and health statuses. An NP practices autonomously across the healthcare system and specializes in diverse aspects of healthcare delivery. They are educated to diagnose, treat, and manage patient conditions including prescribing medication (with some restrictions state-by-state) and making appropriate referrals for patients (American Nurses Association, 2010). Utilization of the APRN workforce is a renewed topic of national debate in the context of healthcare reform. With expanded access to insurance coverage after the 2010 roll-out of the Patient Protection and Affordable Care Act, healthcare systems have made efforts to better utilize the APRN workforce to address gaps in management of chronic conditions, increased access to primary care, prevention and wellness education, behavioral and mental health, school health, and palliative services. While healthcare reform is in a time of transition and change, utilization of the APRN workforce is a strategy for high-quality and efficient healthcare systems 9
15 advocated by numerous organizations. 3 The APRN workforce is uniquely qualified to address gaps in the healthcare system. This report focuses on APRN information relevant to the healthcare system and development of new policy such as: How many APRNs are there and what type of work are they doing? Where are they working? Is there an adequate supply of APRNs in the workforce pipeline? How do APRNs interface with other players in the healthcare system? 3 Some organizations advocating for utilization of APRNs as a cost-effective strategy for ensuring an efficient healthcare system are the Federal Trade Commission, the National Governor s Association, the National Association of Community Health Centers, the Baker Institute of Public Policy, the National Center for Policy Analysis, and the AARP. 10
, 107 CNMs, 250 CRNAs, and 42 dual-licensed APRN-CNMs.")
16 Licensing and Certification Licensed in Utah As of October 2015, there were a total of 2,169 APRNs licensed in the state of Utah. The breakdown of license type from DOPL is 1,770 APRNs (including NPs and CNSs), 107 CNMs, 250 CRNAs, and 42 dual-licensed APRN-CNMs. Of those licensed as APRNs, our survey data indicates that 1,670 are NPs and 110 are CNSs. Clinical Nurse Specialists are not licensed separately in Utah; therefore, self-reported data was relied on to separate these two categories. Eleven individuals indicated dual certification as NP/CNMs on the survey, and four indicated dual certifications as NP/CNSs. For all analysis in this report, the dual NP/CNMs are included in the CNM category and the dual NP/CNSs are included in the NP category based on indicated specialty and practice characteristics of the dual licensed individuals. Figure 1: 2015 APRN Category Breakdown CNM 139, 6% CNS 110, 5% CRNA 250, 12% NP 1,670, 77% Utah s APRN workforce has grown since the last UMEC APRN report published in 2013 as well as the first APRN report conducted in Raw numbers in each category for the 2003, 2010, and 2015 APRN survey data are illustrated in the figure below. Overall, the Utah APRN workforce has increased by 28% since 2010 and 95% since While the overall numbers are trending toward growth, there has been a decrease in certain license categories as a percentage of 11
17 the total APRN workforce. Notably, the CNS workforce has decreased by 34% since Detailed percentage breakdowns are in the table below. Figure 2: Number of Active APRN Licenses by Category compared between 2003, 2010, and 2015 Data 1,670 1, CNM CNS CRNA NP Table 2: Growth in Utah APRN workforce % Change All APRN CNM CNS CRNA NP 2003 to % 43% -51% 45% 81% 2010 to % -15% 36% 8% 37% 2003 to % 22% -34% 57% 147% The following graphs illustrate licensure trends over time for APRNs overall as well as each Utah license category specifically. The solid line indicates the number of licenses currently active using the scale in the left vertical axis. The dotted line indicates number of new licenses issued per year. 12
18 2,500 2,000 1,500 1,000 1,167 1, Figure 3: All APRN License Trends--Issued and Currently Active 235 2,211 1,885 1,914 1,682 1,730 2,090 1,487 1, , , Licenses Currently Active Licenses issued The general trend for both total currently active and licenses issued per year is positive, indicating a workforce with overall growth. There was a spike of licenses issued for 2013 and 2014 with licenses issued per year jumping from 176 in 2013 to 235 new licenses issued in Figure 4: NP/CNS License Trends--Issued and Currently Active 2, ,812 1,800 1,681 1,485 1,524 1, ,321 1,364 1,400 1,166 1, ,200 1, , Licenses Currently Active Licenses Issued NP/CNS licensing echoes the general trend of growth over time, with a particularly steep slope from 2012 to The number of new licenses issued for this category per year almost doubled in that time frame. 13
19 Figure 5: CNM License Trends--Issued and Currently Active Licenses Currently Active Licenses Issued While CNM license issuing trends per year have been varied, the overall number of currently active CNMs has been positive. This suggests that CNMs are staying in the workforce longer into their careers and not retiring. This observation is confirmed by survey results throughout this report. Figure 6: CRNA License Trends--Issued and Currently Active Licenses Currently Active Licenses Issued CRNA trends show positive growth for active licenses, with variation in new licenses issued per year, including a drop by almost half in 2013 compared to a 4-year spike of new licenses issued in 2009, 2010, 2011 and
20 APRNs Practicing in State Of APRNs with an active Utah license, small percentages do not actually work in Utah. Of the 2,169 total APRN licenses through DOPL, 1,852 indicate that they currently practice in Utah. This is composed of 1,458 NPs, 115 CNMs, 98 CNSs, and 181 CRNAs. These totals are used for analysis through the remainder of the report. The 317 APRNs that reported working no hours in Utah make up 14.6% of total Utah licensed APRNs. This represents a small decrease in Utah licensed APRNs who are not practicing in state compared to the 2010 survey which showed 15.3% working out of state. Reasons for APRNs not practicing in Utah are varied. In free responses on the survey question to elaborate on the decision not to practice in the state, nothing in particular stood out among the reasons reported. The most common reasons indicated were that they had recently moved or retired, are expecting to move back to Utah in the near future, or are active duty military members. The following graph shows the percentage of Utah licensed APRNs who are practicing in state in the last three UMEC APRN surveys and broken down by category. Figure 7: Percent of Workforce Practicing in Utah--2003, 2010, % 87% 82% 98% 100% 89% 65% 79% 73% 85% 79% 87% CNM CNS CRNA NP Certification Certification norms and policies vary among APRN categories. While CRNAs and CNMs are by nature of their profession certified in a specific area of advanced practice, NPs and CNSs can certify in a specific patient population or field. NPs can certify in the following areas: Acute Care (ACNP), Adult (ANP), Family Practice (FNP), Geriatric (GNP), Neonatal (NNP), Oncology (ONP), Pediatric (PNP), Psychiatric/Mental Health (PMHNP), and Women s Health (WHNP). CNSs certify in the same areas but with the CNS abbreviation. There are no CRNAs holding dual certifications in other categories. 15
21 The tables below detail the certifications held by NPs and CNSs. 4 The majority of Utah NPs report being certified as FNPs (809, 56%) which is a lot higher than the national percentages of that certification at 48.3%. Table 3: NP Certifications--Utah and National 5 Specialty Utah Count Utah % National % ACNP % 5.6% ANP 8 <1.0% 19.3% FNP % 48.3% GNP 10 <1.0% 3.2% NNP 89 6% 2.0% PNP 97 7% 8.5% PMHNP 93 6% 3.0% WHNP 54 4% 9.0% Missing % - Total 1, % 100% There is less variation in certification in Utah s CNS population, and reported certifications are summarized below. The majority of CNSs are certified as PMHCNSs (78, 71%). Table 4: CNS Certifications Utah Certifications Count % ACCNS 8 8% ACNS 8 8% PMHCNS 78 80% Pediatric CNS 10 10% Other CNS 14 14% Missing 0 0% Total In these and all following tables, any counts less than 5 are not listed. 5 National comparison numbers were retrieved from American Association of Nurse Practitioners NP Fact Sheet. 6 Many CNS respondents indicated more than one certification on the survey, resulting in the total count exceeding the total practicing in the state. Percentages refer to percentage of Utah practicing CNS workforce that indicated the listed certification. 16
22 Demographics Upbringing Overall, 474 or 25.6% of Utah APRNs reported growing up in a rural area with 840 or 45.4% from a suburban area, and 507 or 27.4% from an urban area. These percentages are almost exactly the same as they were in 2010 survey results, indicating a consistent pattern in upbringing to pursuing a career as an APRN. The breakdown by category was 23.8% of female APRNs compared to 34% of male APRNs reported a rural upbringing. Rural upbringing is the only category of upbringing with a higher percentage of male APRNs than female. Figure 8: Reported Upbringing Setting of Utah APRNs 34.2% 28.6% 24.2% 27.7% 40.5% 46.9% 43.2% 46.9% 25.3% 24.5% 32.6% 25.4% CNM CNS CRNA NP Rural Suburban Urban Upbringing patterns can have important implications on recruitment for areas of the state most at need. For example, the figure below illustrates that nearly half of those who practice in a rural setting grew up in a rural setting themselves. With major shortages in healthcare providers in rural areas, more targeted recruitment for those from rural areas could have a meaningful impact. 17
23 Figure 9: Practice Location and Upbringing 47.6% 47.2% 39.6% 23.5% 28.9% 13.2% Urban Practice Rural Practice Rural Suburban Urban Age Continuing a pattern seen in the last two APRN reports, the APRN workforce is growing slightly older. The overall average age for an APRN practicing in Utah is 50 years old, up three years from 2010 s average age of 47 year old. When broken down by category, average age is somewhat varied with CNMs at 52, CNSs at 59, CRNAs at 49, and NPs also at 49. Every category is showing an increase since the 2010 survey. The national average age for NPs is also 49 according to the 2016 AANP National Nurse Practitioner Sample Survey(AANP, 2016). CNMs have a national average age of 48 (Sipe et. al, 2012). No current national average could be found for comparison to the CNS population. CRNAs average age on a national scale is 48, according to an article on APRN demographics recently published in the Journal of Professional Nursing (Sipe et al., 2012). 18
24 Figure 10: Average Age of Utah APRNs by Category CNM CNS CRNA NP By breaking down the categories into age cohorts instead of only averages, one can see how each category s workforce is aging. CNMs and CNSs have the largest percentages in age cohorts 55+, as well as the smallest percentages under 44 when all categories are compared. Larger percentages in the older cohorts are bringing the averages up and younger licensed APRNs are entering the workforce. Figure 11: Age Cohort Breakdown by Category % 37.3% 34.0% 20.5% 19.3% 7.2% 15.7% 2.0% 2.0% 14.3% 22.4% 28.1% 27.1% 26.9% 19.8% 22.5% 14.6% 10.4% 8.9% 7.8% CNM CNS CRNA NP < >65 Percent change from 2003 for each category are detailed in the table below. The largest increases are found in the 65+ age cohort particularly in CNMs and CNSs when 2003 and 2015 survey 19
25 results are compared. This verifies the patterns seen in the license trends and indicates an aging workforce. When these patterns were found in the 2010 survey data, it was assumed that the CNM and CNS populations were moving closer to retirement, and while that is still true, the older workforce seems to be continuing their careers for longer than might have been anticipated. This is pulling up the average age and maintaining growth for most categories despite lower numbers of new licenses coming into the state. CNM CNS CRNA NP Table 5: Age Cohort Breakdown Percentages--2003, 2010, 2015 < Total % 30% 54% 4% 4% 100% % 24% 28% 31% 2% 100% % 19% 21% 37% 16% 100% % 17% 54% 22% 6% 100% % 13% 33% 42% 13% 100% % 2% 14% 59% 22% 100% % 32% 34% 22% 1% 100% % 40% 31% 17% 3% 100% % 28% 20% 27% 15% 100% % 30% 45% 9% 2% 100% % 25% 32% 24% 2% 100% % 27% 23% 34% 8% 100% The distribution of CNSs in the state shows the most distinct pattern of aging and decline in number of all of the APRN categories. This pattern has been consistent for the 2003, 2010, and now the 2015 survey results. Even nationally, CNSs are on average older than other categories of the APRN workforce. The CRNA workforce has maintained a fairly consistent breakdown among age-cohorts in all three surveys that UMEC has analyzed. They have a robust cohort of individuals under the age of 45 to replace those who retire, although just as in the other categories and echoing national trends the CRNA workforce is aging on average. Nationally, surveys have indicated that 14% of NPs are 35 years or younger, which is higher than Utah s 9% in that category. In 2010, the <35 cohort was 18%, well above the national average at the time. This indicates that NPs, while their workforce in Utah is growing the most quickly, are not necessarily attracting a high number of young adults to the career. (Budden et al, 2013). Gender Nursing is a profession that is traditionally female-dominated 88% of the national APRN workforce is made-up of women (US Census Bureau, 2013). In Utah, the APRN workforce is 20
26 78% female (1442), with 22% male (410), which is consistent with previous APRN reports. The gender breakdown in the 2003 survey was 81% female and 19% male there have been slight increases in male representation in the workforce. Considering the categorical breakdown, the main outlier in gender breakdown are the CRNAs were only 18% of CRNAs are women and the remaining 82% are men. According to the American Association of Nurse Anesthetists, the national gender breakdown of CRNAs is that approximately 42% of them are men (AANA, 2016). The graph below illustrates the gender breakdown for each APRN category for Utah s workforce. Figure 12: Gender Breakdown by Category 2.4% 8.2% Female Male 17.0% 97.6% 91.8% 82.3% 82.8% 17.7% CNM CNS CRNA NP One factor that has affected the increase in male representation in Utah s APRN workforce is the increase in number of CRNAs in the state, which is a field with a majority of men in the workforce, particularly in Utah as compared to other states. The following table shows a distribution of the number of APRNs working in the state based in the 2003 survey, the 2010 survey, and the new 2015 data. 21
27 Table 6: APRNs in Utah by Gender and License Category--2003, 2010, All APRNs Number Percent Number Percent Number Percent Male % % % Female % 1,110 77% 1,442 78% Total % 1, % 1, % CNM Number Percent Number Percent Number Percent Male 6 5% 3 2.6% Female 86 96% % % Total % % % CNS Number Percent Number Percent Number Percent Male 11 7% 7 9% 8 8% Female % 74 91% 90 92% Total % % % CRNA Number Percent Number Percent Number Percent Male 77 74% % % Female 27 26% 38 21% 32 18% Total % % % NP Number Percent Number Percent Number Percent Male 81 15% % % Female % % % Total % % % Race The Utah APRN workforce continues to be predominately White without sufficient numbers representing Utah s increasingly diverse population. A total of 1,680 (91%) Utah APRNs are White, 53 (3%) are Hispanic/Latino, 78 (4%) are Asian, 9 (0.5%) are American Indian and no other category had reportable numbers. In comparison, the overall population in Utah are 91% White, 14% Hispanic/Latino, 2% Asian, 1% American Indian/Alaska Native, 0.9% African American and Native Hawaiian/Pacific Islander. The Hispanic/Latino population continues to be underrepresented in the APRN workforce, although it has increased to 4% in the 2015 survey data from 1.3% in the 2010 survey data. 22
28 Figure 13: Utah's APRN Workforce by Race (Left) Compared to Utah Population 7 by Race (Right) 4.2% 0.5% 0.1% 0.2% 1.9% 2.9% 91% White/Caucasian Hispanic/Latino Asian American Indian Pacific Islander African American Unreported 2% 13% 1% 0.9% 0.9% 80% Education and Experience Previous RN Experience Utah s APRN workforce reported an average of 8 years (6 median) of experience as a registered nurse before pursuing an advanced practice training program. This is unchanged from the 2010 survey. Overall, male APRNs worked an average of 5 years (6 median) and female APRNs worked an average of 10 (median 7). Figure 14: Average Number of Years of RN Experience Before Becoming an APRN by Category and Gender CNM CNS CRNA NP Female Male Overall Female Male Overall Female Male Overall Female Male Overall Utah demographic data is from the Kem C. Gardner Policy Institute. 23
29 Breaking down the RN experience by gender as in the figure above illustrates clearly that men are moving from RN to APRN careers more quickly than women in every category. On average, regardless of gender, the APRN workforce in Utah graduated from their APRN programs 13.4 years ago (median of 11) with variation when broken down by category shown in table 6. Table 7: Years since APRN Graduation Mean Median All APRNs CNM CNS CRNA NP APRN Graduation The majority of APRNs (67%) working in Utah at the time of the survey were also trained in Utah. The graph below shows a breakdown in percentage of the workforce split by category that were trained in Utah vs. outside of Utah. The exception is the CRNA workforce; 89% of CRNAs reported being trained outside of Utah. A likely factor here is limited training opportunity for CRNAs in the state. There were a total of 1,216 APRNs that reported receiving their APRN training in the state of Utah (CNMs 73, CNS 78, CRNA 19, NPs 1,046). The next largest states where Utah s APRN workforce were educated are California (69, 4%), and Washington (25, 1.4%). Figure 15: Percentage of APRN Workforce Trained in Utah by Category 33% 17% 27% 33% 89% 67% 83% 74% 67% 11% CNM CNS CRNA NP Overall Utah Other State 24
30 The table below shows the distribution of graduation ages from advanced practice training for all license categories. The majority of APRNs fell between the ages of 30 and 44 when they graduated from their advanced training program. Table 8: Age Cohort of APRNs at Graduation Age Cohort Number Percent % % % % % % % No Response 75 4% Total % Education Background In order to better understand the educational background of Utah s APRN workforce, the survey asked what type of nursing degree/credential qualified them for their first nursing license. The results are broken up for all APRNs and include percentages and counts. Nearly half of APRNs began their careers as Baccalaureate trained RNs. Figure 16: First Nursing Degree/Credential 8 Doctorate Master's 2%, 43 12%, 215 Vocational 10%, 188 Diploma 2%, 45 Baccalaureate 44%, 798 Associate 30%, It is unlikely that someone could have a doctorate degree as their first nursing degree the fact that 2% of respondents indicated such a degree may be a self-reporting error. 25
31 With so much need for qualified and well-trained healthcare professionals, the educational standards of most nursing professions have been raised. The American Association of Colleges of Nursing set 2015 as the deadline to meet the goal of moving the educational level of preparation for advanced practice from a master s level to a doctorate level. As of the 2011 APRN report, the University of Utah had already transitioned their APRN programs to be Doctor of Nursing Practice (DNP) degrees, with BYU and Westminster in process. The survey asked respondents what their highest level of education is, and the responses are summarized in the following table. Currently in Utah, an APRN certification requires a graduate degree the 2015 survey did not include the option to answer less than a Master s degree as the highest degree achieved. Master s Degree Nursing Master s Degree Non- Nursing Doctor of Nursing Practice Doctoral Degree Nursing (PhD) Doctoral Degree Non- Nursing Table 9: Highest Degree Achieved by Utah APRNs All APRNs CNM CNS CRNA NP Count % Count % Count % Count % Count % % % % % % % 4 3.6% 2 2.1% % % % % 4 4.2% 4 2.5% % % 6 5.4% % % % 1.9% 2 2.1% 2 1.3% % Missing 75 4% 4 3% 2 2.1% 24 13% 45 3% Total % % % % % The 2010 APRN survey data showed that 9% of the workforce had a Doctorate level education and 84% had a Masters level. Combining the categories above, 2015 data shows 16.4% with a Doctorate and 83.4% with a Masters, indicating a workforce that is meeting the challenge set by the American Association of Colleges of Nursing (AACN) to increase the overall education of the APRN workforce. This recommendation is driven by the Institute of Medicine s goal of doubling the number of nurses with a doctorate by the year 2020 (The Future of Nursing, IOM). 26
32 Nursing Faculty According to the AACN, the ideal faculty to student ratio for an APRN training program is between 1:6 and 1:8 (AACN, 2017). The table below shows the number and percent of survey respondents indicating that they work as faculty and the mean number of hours survey respondents reported teaching per week. Overall, 114 APRNs or 6.3% of all APRNs indicated that they worked as faculty. When broken down, that is 23 CNMs, 14 CNSs, 4 CRNAs and 73 NPs. The highest percentage of the workforce that indicated having a faculty assignment were CNMs. Table 10: Faculty/Teaching Status of Utah APRNs CNM CNS CRNA NP Number of APRNs indicating faculty work setting % of workforce with work setting as faculty 20.4% 14.3% 3.0% 5.0% Mean number of hours/ week spent teaching Time Allocation The survey asked respondents to estimate their average hours worked per week total and separately asked how many hours were spent in distinct activities (patient care, and various nonpatient care activities such as teaching, research, administration/management, consulting, policy/procedure development, volunteer/charity work, and other). In each category, reported hours spent on patient care far exceed hours spent on non-patient care activities. For CNMs, percent of reported hours worked focused on patient care is 66%; for CNSs, 71%; for CRNAs, 88%; and for NPs, 99%. The table below details the average hours reported for each activity. Table 11: Hours Worked per Week by Category CNM CNS CRNA NP Reported Hours per Week Total Patient Care Teaching Research Administration/ Management Consulting Policy/Procedure Development Volunteer/Charity Work Other Because these were self-reported, answered separately, and averaged, the activities do not always add up to the reported total hours worked per week. 27
33 Work and Income Current Positions held The majority (70%) of APRNs report working full time, 20% of all APRNs report working only part-time, 10% report working on a contract basis and 1.5% of all APRNs report being unemployed. Of those that reported participating in contract work, survey responses indicate a median of 7 hours spent per week on contracted activities. The category with the highest incidence of contracted members of its workforce is the CRNAs. Table 12: Type of Position Held 10 Full Part Contract Unemployed Time Time All 70% 20% 10% 1.5% APRNs CNM 65% 14% 1% 3% CNS 51% 33% 14% 2% CRNA 67% 3% 49% 3% NP 72% 22% 7% 1% Those who indicated that they were currently unemployed had the option of explaining the circumstance. Qualitative analysis was conducted, categorized, and ranked from most commonly used to least commonly used. The following table details the top five most common responses, ranked in order. Table 13: Ranked Reasons for Unemployment Rank Response 1 Taking care of family/stay at home parent 2 Inadequate salary in the area 3 Caretaker for elderly family member 4 Difficulty finding an APRN position 5 Personal disability Income To account for part-time vs. full-time work, all income analysis is done using FTE adjusted income. This standardizes the income levels so they can be compared. Median FTE adjusted 10 These percentages do not add up 100 because respondents reported combined positions when appropriate. 28
34 income from the 2015 survey for APRNs overall is approximately $101,300, up from $88,000 from the 2010 survey. According the 2015 survey responses, the median CNM income is $106,128; the median CNS income is $99,580; the median CRNA income is $145,638; and the median NP income is $97,918. It is consistent with previous survey results to see larger median income reported for CRNAs than in the other categories. Figure 17: 2015 Median FTE Adjusted Income by Category $145,638 $106,128 $99,580 $97,918 Certified Nurse Midwives Clinical Nurse Specialist Certified Registered Nurse Anesthetist Nurse Practitioners The table below shows the FTE adjusted income from the 2003 and 2010 surveys, broken down by category. Using the inflation calculator provided by the Bureau of Labor Statistics, inflation adjusted dollar amounts from 2003 and 2010 to 2015 are included as well. Median income has risen steadily survey to survey in dollar amount but is not keeping up with inflation amounts. Since 2010, overall APRN incomes have declined by 12% when adjusted for inflation. From 2010 to 2015, CRNAs experienced the largest decline in inflation adjusted income. CNSs have actually experienced a slight increase in FTE adjusted income since the last survey in
35 Table 14: Average Median FTE Adjusted Income for APRNs in Utah with Inflation Adjustments 11 All APRNs 2003 FTE Adjusted 2003 FTE Adjusted in 2015 Dollars 2010 FTE Adjusted 2010 FTE Adjusted in 2015 Dollars 2015 FTE Adjusted 2015 National Comparison $73,000 $95,554 $88,000 $115,188 $101,000 $107,460 CNM $66,000 $86,391 $81,000 $106,025 $106,000 $99,770 CNS $74,000 $96,863 $72,000 $94,245 $100,000 $95,000 CRNA $124,000 $162,311 $161,000 $210,742 $146,000 $160,270 NP $70,000 $91,627 $84,000 $109,952 $98,000 $100,910 Considering the 2015 income breakdowns in more detail, the following figures illustrate the income broken down by segment for each workforce. Figure 18: CNM FTE Adjusted Income Distribution 12.8% 17.9% 19.2% 10.3% 9.0% 3.8% 3.8% 5.1% 5.1% 6.4% 6.4% A plurality of CNMs have an income between $80,000 and $109,000, with almost 13% reporting that they make less than $50, National median income comparisons were collected from the Bureau of Labor Statistics and are current for the year CNS national income came from a 2015 MedScape survey. 30
36 Figure 19: CNS FTE Adjusted Income Distribution 17.0% 19.1% 10.6% 10.6% 6.4% 6.4% 4.3% 6.4% 6.4% 2.1% 6.4% The income distribution for CNSs does not have a normal distribution and has a lot of variation. The largest percentage of the workforce reports an income between $100,000 and $109,000 at 19.1%. Similar to CNMs, there is a fairly large percentage reporting an income less than $50,000. Figure 20: CRNA FTE Adjusted Income Distribution 20.2% 6.7% 5.6% 4.5% 3.4% 1.1% 1.1% 2.2% 5.6% 6.7% 7.9% 5.6% 4.5% 1.1%1.1% 5.6% 4.5% 3.4% 2.2% 2.2% 1.1% 2.2% 1.1% The CRNA income is reported on a different scale than the others because the workforce reports a larger spread of income ranges. The largest percentage of the CRNA workforce by far reports an income between $140,000 and $150,000 at 20.2%. 31
37 16.8% 17.2% 14.1% Figure 21: NP FTE Adjusted Income Distribution 8.7% 4.3% 5.1% 7.1% 10.4% 6.6% 3.1% 6.6% The income distribution of NPs follows a fairly normal distribution with the largest percentages in the middle of the range between $80,000 and $109,000. Table 15: FTE Adjusted Income Distribution Summary by Category Income (in $1,000s) All APRNs CNM CNS NP CRNA < $49 8.6% 12.8% 17.8% 8.7% -- $ % 3.8% 6.7% 4.3% -- $ % 3.8% 6.7% 5.1% 3.4% $ % 5.1% 11.1% 7.1% 1.1% $ % 17.9% 4.4% 16.8% 4.5% $ % 19.2% 11.1% 17.2% 1.1% $ % 10.3% 20.0% 14.1% 2.2% $ % 9.0% 6.7% 10.4% 2.2% $ % 5.1% 6.7% 6.6% 6.7% $ % 6.4% 2.2% 3.1% 5.6% $ % 6.4% 6.7% 6.6% 76.1% Income by Geography When income is cross tabulated by practice setting, an interesting pattern is confirmed. In most APRN categories, those professionals who practice in rural settings have a slightly higher median income than those in urban settings. The exception to the pattern are CNSs, who the survey data shows have a slightly higher income in urban settings. Reasons for this difference could vary and may be affected by demand, billing rate differences from Medicaid/Medicare in rural areas, and different patterns of utilization of APRNs in rural areas compared to urban settings. 32
38 Figure 22: Median Income by Rural vs Urban Practice $178,724 $144,198 $120,000 $105,887 $94,221 $100,569 $106,941 $96,516 CNM CNS CRNA NP Rural Urban Retirement Analyzing the intended years to retirement reported by survey respondents provides valuable insight into the future APRN workforce. The 2015 survey data shows that large percentages of most APRN categories intend to retire in more than 20 years, which is promising considering retention and growth goals. However, one outlier illustrated plainly in the figure below is that more than 40% of the CNS workforce intends to retire in 6-10 years and more than 35% intend to retire in 1-5 years. While this is consistent with the average age of the CNS workforce, it does indicate that even more workforce decline for CNSs is to be expected in the future. 33
39 45% 40% 35% 30% 25% 20% 15% 10% 5% 0% Figure 23: Number of Years until Intended Retirement by License Category < >20 The following table lists the number and the percentage of each category workforce with reported intention to retire within 10 years. National and state trends indicate that age at retirement is increasing and that fewer than half of individuals retire at or before their intended retirement date when projected out 5-10 years (UMEC, 2011). Table 16: APRNs with Intention to Retire within 10 Years Count Retiring within 10 years % Retiring within 10 years CNM % CNS % CRNA % NP % CNM The following figure shows the relationship between current age of respondent and their years to intended retirement. Note how the younger age groups, <35 and 35-44, trend toward intended retirement in 20+ years while the older populations trend toward retirement in less than 10 years. Interestingly, the age cohort >65 has more than 60% with intention to retire in 1-5 years. Based on their age and retirement norms, it would be expected that higher percentages would have intention to retire in <1 year. This pattern lends more data to the idea that members of the APRN workforce today may be working longer than expected. CNS CRNA NP 34
40 100% 90% 80% 70% 60% 50% 40% 30% 20% 10% 0% Figure 24: Number of Years to Intended Retirement by Age < < >65 Practice Characteristics Geographic Distribution Overall, 6.2% (53) of APRNs have their primary practice in a rural setting, versus 93.8% in urban settings. This is down from the 2010 survey data which indicated that 11% of APRNs had a rural primary practice site. According the Kem C. Gardner Policy Institute, 13% of Utah s population lives in rural counties. The following table breaks down by category the count and percentage of APRNs in rural vs. urban settings. It is important to note the outlier in the CRNAs for percentage in rural settings. Twenty one percent of CRNAs work in rural areas of the state, which is more than 4 times the percentage of CNMs, CNSs, or NPs and their respective workforce representation in rural parts of Utah. CRNAs are being utilized differently in rural settings than the other APRN categories. Table 17: APRNs by Rural/Urban Primary Practice Setting All APRNs CNM CNS CRNA NP Count % Count % Count % Count % Count % Rural 103 6% 87 76% 72 73% 34 19% 63 4% Urban 1,577 85% 4 3% 2 2% % % Missing 172 9% 24 21% 24 25% 20 11% 104 7% Total 1, % % % % 1, % 35
41 The following table details the number and percent of APRNs with a primary practice in each of the listed counties. The counties highlighted in blue are designated urban counties. Blank cells indicate that there are no APRNs represented in those counties, and grayed out cells indicate that there are fewer than five APRNs in that county. There are 410 APRNs who indicated having a secondary practice (22% of all Utah APRNs). Of those secondary practices, only 17 or approximately 1% are in a rural area. Table 18: Primary Practice Location by County 2015 CNM CRNA CNS NP County Count % Count % Count % Count % Beaver Box Elder 8 4.9% % Cache % Carbon 6.4% Daggett Davis 6 6.2% 6 3.5% % Duchesne 6.4% Emery Garfield Grand Iron % Juab Kane Millard Morgan Piute Rich Salt Lake % % 50 61% % San Juan Sanpete Sevier Summit % Tooele 6 3.5% 8.6% Uintah 14 1% Utah % 32 20% 8 9.8% % Wasatch 8.6% Washington 8 4.9% % Wayne Weber 8 8.2% % % % Out of State 4 4.1% 6 7.3% % Missing 18 16% 17 9% 16 16% 75 5% Total % % % 1, % Legend: Urban County Fewer than five APRNs Zero 36
42 Compared to 2011, a number of counties saw changes. For CNMs, both Salt Lake and Utah Counties experienced a decrease from 78 and 15 to 57 and 10 respectively. CRNAs experienced a small decrease in most urban counties, but did make small gains in rural counties. For the CNSs, there was a small increase in Utah and Weber counties, and Salt Lake maintained 50 CNSs. NPs have experienced large gains in numbers and percentages in nearly every county, urban and rural. Specialties APRNs are a segment of the healthcare workforce with an extremely wide range of specialties. The table below lists the specialties indicated by respondents on the 2015 APRN survey. The figures that follow illustrate the specialties most common for each category. Table 19: Overall APRN Specialties Specialty % Specialty % Specialty % Specialty % Anesthesiology 0.3% Ambulatory Care 1.9% Allergy and Immunology Aesthestics/ Medical Spa 0.6% 1.1% Family Practice Endocrinolog y and Metabolism Emergency or Trauma Development al Disability 18.3% Hospitalist 1.6% 1.5% 1.4% Hospice/ Palliative Care Home Health 0.3% OBGYN 9.7% Acute care 4.0% Dermatology 0.9% Geriatrics 2.1% Hematology/ Oncology Behavioral/ Mental health 2.4% 2.5% Pediatrics 5.8% Pain Management 1.9% Ostomy/ Wound Care Other surgical Subspecialty Critical Care/ICU Community/ Public Health Rheumatolog y Renal/Dialysi s 2.0% Gastroenter ology 0.5% Genetics 0.3% 0.1% 0.1% 0.3% Rehab 0.4% 1.5% Urology 0.9% Family Planning Cardio- Thoracic Surgery Surgery/ General School Health Occupational Health 0.9% 1.5% Neonatal 4.4% 0.4% Nephrology 0.3% Internal Medicine Infectious Disease 2.3%.3% 0.6% Radiology 0.1% Pulmonary Disease 1.0%.6% Psychiatric 8.5%.3% 1.4%.1% Preventative/ Occupational Medicine Orthopedic Surgery Neurological Surgery 0.5% 0.8% 1.4% 37
43 There is variation in median FTE adjusted income by specialty. The following graph shows the median income for the 20 most common specialties of Utah s APRN workforce. Dermatology stands out as the highest paid specialty at around $135,000 a year. $140,000 Figure 25: APRN Specialties by Median FTE Income $120,000 $100,000 $80,000 $60,000 $40,000 $20,000 $- Next, the following graphs break down specialties among each category of APRN. CNMs are by nature of their profession fairly specialized automatically, so it is not surprising to see that 80.6% of CNM respondents indicated that they were specialized in OB/GYN. 38

44 Figure 26: CNM Specialties Breakdown 80.6% 9.7% 1.6% 1.6% 1.6% 1.6% 1.6% 1.6% The CNS workforce in Utah is not very diverse in their specializations, the majority of which go into psychiatric care or mental health care. 64.6% Figure 27: CNS Specialties Breakdown 18.8% 4.2% 2.1% 4.2% 4.2% Other Psychiatric Pediatrics Hospice Care Cardiac Care Mental Health CRNAs have no diversification of specialties because the nature of their field is already specialized on anesthetics. NPs on the other hand, are the most diverse of the categories, specializing in many different fields. 39
45 Figure 28: NP Specialties Breakdown % 1.5%1.6% 2.3% 3.9% 2.0% 1.6% 4.1% 1.3% 3.9% 2.5% 2.6% 1.5% 1.9% 5.1% 2.8% 2.2% 6.6% 5.4% 1.2% 1.6%1.6%1.7% 7.0% Settings The training and education APRNs receive prepare them to be effective members of the healthcare system in diverse settings in addition to their specific specialties. The following figures detail the most common settings by category. Table 20 gives a detailed overview of the counts and percentages within every category for reported settings. In the table, a hospital setting is split between inpatient, outpatient, emergency department, ambulatory care, or other unit. In the figures following the table, hospital settings are combined together and reported as a whole for each category. 12 Figure 28: 1% or less: Urology, Orthopedic Surgery, Cardiothoracic Surgery, School Health, Rheumatology, Renal Dialysis, Rehab, Radiology, Occupational Medicine, Ostomy, Ophthalmology, Radiation Oncology, Medical Oncology, Nephrology, Infectious Disease, Home Health, Family Planning, Disabilities, Dermatology, Public Health, Case Management, Anesthesiology, Allergy and Immunology, and No Patient Care specialties. 40
46 Table 20: APRN Settings by Category 13 CNM CRNA CNS NP N % N % N % N % Self employed 17 15% 42 23% 32 33% 75 5% Group APRN Practice 15 13% 15 8% 24 2% Hospital Inpatient 8 7% 34 19% 18 18% % Hospital Outpatient 7 6% 21 12% % Hospital - ED 16 1% Hospital Ambulatory Care Center 6 3% 16 1% Other Unit of Hospital Federal Hospital VA 8 8% 34 2% Physician Practice Solo 46 3% Physician Single Specialty Group 12 10% % Physician Multi Specialty Group 7 6% % NHB Outpatient Clinic 6 3% 12 12% 107 7% NHB Urgent Care Facility 18 1% FQCHC 36 2% Certified Rural Health Clinic 6 0% Free Standing Surgery Center 15 8% Spa/Aesthetic/Weight Loss Clinic 12 1% Gov't Planning Agency Birthing Center Hospice Care 8 1% Home Health Agency 4 0% Nursing Home/LTC Facility 10 1% Occupational Health 16 1% Student/School Health 32 2% Faculty (College or Univ) 8 7% 6 3% 22 2% Insurance Company 16 1% Corrections Facility 4 0% Non Profit 22 2% Other 61 4% Missing 23 20% 22 12% 6 6% 93 6% Total % % % 1, % 13 Blank cells indicate 0, greyed out cells indicate numbers less than 5. 41
47 CNMs report more than 20% in both physician practice groups and in hospital settings, with 17.6% reporting self-employment and 16.2% in a group APRN practice. Figure 29: CNM Settings Breakdown 17.6% 16.2% 22.1% 20.6% 4.4% 1.5% 1.5% 1.5% 8.8% 2.9% 2.9% CNSs report equal percentages (34.8%) in hospital settings and in a self-employed/contractor arrangement. 42
48 Figure 30: CNS Settings Breakdown 34.8% 34.8% 13.0% 4.3% 2.2% 2.2% 2.2% 2.2% 4.3% While CRNAs do not specialize outside of anesthetics, they do practice in a variety of settings. Almost 35% report practicing in a hospital setting, and similar to the CNS population a large percentage of CRNAs work in a self-employed/contractor arrangement. Other common settings for CRNAs are free-standing surgery centers and group APRN practices. Figure 31: CRNA Settings Breakdown 34.8% 26.5% 3.6% 9.6% 9.6% 3.6% 2.4% 43
49 NPs, as the largest group of APRNs in Utah, have a wide range of reported settings in addition to their diverse specialties. The most common response for setting from the NP population is a hospital setting with 36.7% of the NP workforce. Other common settings for NPs include nonhospital based outpatient clinics and physician practice groups. Figure 32: NP Settings Breakdown 36.7% 0.3% 1.6% 2.6% 0.1% 1.9% 11.8% 7.7% 8.8% 3.5% 5.7% 1.2% 1.3% 1.7% 0.7% 1.2% 0.9% 2.3% 4.5% Patient Visits Most APRNs see a mix of inpatient and outpatients, but it is generally more common for an APRN to interact with people on an outpatient basis. Overall, APRNs report seeing 14 inpatients and 42 outpatients a week, which is down from 20 inpatients and 54 outpatients a week reported in the 2010 survey data. This could be a factor of sampling or of the increasing number of APRNs in the state lightening the load on the workforce and their patients. NPs see the most patients per week on average at 65. Table 21 details the 2015 survey data results and Tables 22 and 23 present the data from 2010 and 2003 for comparison. Generally speaking, the data in 2015 show a decrease in number of patient visits from 2010, but an increase from 2003 indicating some variability over time. 44
50 Table 21: Mean Patient Visits per Week All APRNs CNM CRNA NP CNS In-Patients Out-Patients Total Table 22: Average Patient Visits per Week All APRNs CNM CRNA NP CNS Inpatients Outpatients Total Table 23: Average Patient Visits per Week All APRNS CNM CRNA NP CNS Inpatients Outpatients Total Table 24: % Change in Patient Visits per Week Since 2003 All APRNs CNM CRNA NP CNS In-Patients Change 75% 0% 60% 110% 86% Out-Patients Change 2% -59% 83% -2% 3% Age Range of Patients Another skill and competency in any APRN workforce is the aptitude to provide high quality health services to individuals of all ages, either as inpatients or as outpatients. Consistent with the 2010 survey results, 2015 results indicate that the largest majority of both in- and out-patients are between the ages of 20 and 64. Unsurprisingly, CNMs see the fewest patients over 65 years of age. CNSs see the largest number of people under the age of 19, particularly as inpatients. 45
51 Table 25: Age Range of Patients by APRN Category All APRNs Inpatient 28% 37% 23% 8% Outpatient 21% 47% 22% 9% CNM Inpatient 12% 81% 1% 1% Outpatient 13% 72% 9% 4% CRNA Inpatient 5% 45% 36% 7% Outpatient 13% 42% 31% 8% CNS Inpatient 43% 42% 19% 6% Outpatient 17% 66% 8% 9% NP Inpatient 34% 27% 25% 10% Outpatient 23% 43% 24% 10% Provider Accessibility Survey data for patient wait times only include CNMs, CNSs and NPs because the nature of a CRNA s scope of work does not include the typical aspect of office wait time for accessibility. Table 26: Average Patient Wait Times New Patient (Days) Established Patient (days) Office Wait (minutes) CNM Mean Median Mean Median Mean Median Primary Secondary CNS Mean Median Mean Median Mean Median Primary Secondary NP Mean Median Mean Median Mean Median Primary Secondary Insurance Payer Types Utah APRNs are able to accept most types of insurance in their primary and secondary practice locations. The type of insurance that covers the most APRN patients is private insurance with 33%. However, there is variation by category in most common insurance used. The following figure shows the general breakdown by category of insurance types respondents reported using 46
52 in primary practices. Medicare and Medicare combined are important sources of insurance for the APRN workforce, with private insurance covering the largest percentage of patients through all categories. CNMs utilize Medicare less than the other categories, which is consistent with the average age range of a typical CNM patient. Figure 33: Insurance Use Breakdown by Category--Primary Practice CNM CNS CRNA NP Medicaid Medicare Private Insurance Managed Care Self Pay/Uninsured Tri-Care Workman's Comp Charity Other The following table gives more detail about insurance use for APRN patients and breaks down average reported utilization by category and by primary practice. There were no significant differences between primary and secondary practice insurance use based on survey responses. 47
53 Table 27: Patient Insurance Use Breakdown by Category for Primary Practice CNM CNS CRNA NP ALL Medicaid 16% 18% 17% 19% 19% Medicare 4% 10% 24% 18% 22% Private Insurance 49% 38% 29% 22% 33% Managed Care 3% 10% 3% 5% 4% Self-Pay/Uninsured 14% 16% 16% 16% 13% Tri-Care 2% 0% 4% 1% 2% Workman's Comp 0% 0% 1% 2% 1% Charity 2% 1% 1% 4% 2% Other 0% 13% 4% 8% 4% Precepting Currently, 56% of all APRNs report that they precept APRN students. Of those who are not currently precepting students, 55% indicated that they were interested in participating in the future. Qualitative analysis of reasons provided for not precepting came down to 3 common responses: first, the respondent felt that they were too busy to be a good mentor to a student in the practice; second, that they didn t work enough hours to effectively precept; or third, that their employer does not allow precepting. The figure below shows the percentage of each APRN category s workforce that is currently precepting, that is interested in precepting in the future, or that is unavailable to precept in the foreseeable future. The majority of each workforce is either currently precepting or willing to precept in the future. 48
54 9.5% 24% Figure 34: Preceptor Supply for Utah APRNs 33.9% 34.4% 17.6% 22% 66.2% 27% 39.5% 37% 28.4% 59.9% CNM CNS CRNA NP Precepting Now Future Possible Precepters Unavailable to Precept Consultation and Referral Plans A consultation and referral plan is a DOPL required agreement from an APRN with a physician in order to prescribe schedule II-III controlled substances. There have been changes recently of regulations in Utah affecting APRNs in regard to practice and referral plans. Prior to Senate Bill 58, which passed in the 2016 general legislative session, some categories of APRNs were required to compete a consultation and referral plan before prescribing Schedule II or III controlled substances. CRNAs may order and administer the drugs in a hospital or ambulatory setting, but they may not provide prescriptions to be filled outside the hospital. The regulation affected NPs principally. Senate Bill 58, which was passed after many of the survey respondents had returned their surveys loosened restrictions and allowed NPs to prescribe the substances if they fulfilled one of the two following requirements: 1) have 2,000 hours experience as a certified Nurse Practitioner or 2) have two years of experience as a certified Nurse Practitioner. 49
55 Figure 35: Experience with Consultation and Referral Plans Difficult Finding a Collab. Physician 6.1%(6) 1.2% (1) 2.8% (40) Collab. Physician Works in Same Office 40.8% (40) 66.3% (65) 63.1% (917) Fee Paid to Collaborating Physician Patients Regularly Discussed w/ Collab. Physician 6.1% (6) 9.4% (8) 4.1% (59) 8.8% (8) 28.6% (28) 35.8% (521) Do not prescibe S II-III substances 22.4% (22) 9.4% (8) 8.5% (123) CNS CNM NP Small percentages of Utah APRNs find it difficult to find a collaborating physician or have the requirement of paying a fee to their collaborating physician. More than half of CNMs and NPs and 41% of CNSs report that they work in the same office as their collaborating physician. Twenty nine percent of CNSs and 36% of NPs report that they regularly discuss patients needing prescribed controlled substances with their collaborating physician, indicating a high level of coordination and team work in the process. Provider Mix with Physicians and Pas In order to provide consistency for comparison to previous UMEC reports, this report considers APRN primary designation using the same criteria used for physicians and PAs. All CNMs and NPs in certain specialties are considered to be primary care providers while CNSs and CRNAs are considered to be in specialty care regardless of their reported specialty because of the nature of their specific focus areas. To be eligible for federal designation as a primary care HPSA, an area must have a population to primary care physician ratio of 3,000 population to 1.0 physician FTE. The following figure indicates that there are currently eight counties in Utah that have less than one primary care physician for 3,000 people: Daggett, Duchesne, Emery, Kane, Piute, Sevier, Tooele, and Wayne. Numbers of physicians per county are from the most recent UMEC report 50

56 on Utah s physician workforce (UMEC, 2016) and population per county numbers come from the Kem C. Gardner Policy Institute s population breakdowns for the year Figure 36: Counties with <1:3,000 Primary Care MDs to Population Ratio If APRNs who are designated primary care providers were included in the provider to population ratio, the number of counties with fewer than one primary care provider per 3,000 people would drop from eight to three with only Daggett, Kane, and Piute counties still having less than 1 primary care physician per 3,000 people in the county. This is evidence that the APRN workforce can be an important factor in improving access to primary care in underserved areas and that reform that encourages APRN providers to practice in HPSA areas can help address those shortages. Figure 37: Counties with <1:3,000 Primary Care Provider to Population Ratio including Primary Care Physicians and Primary Care APRNs 51
, ratios between the three workforces were calculated and are summarized in the table below. There is an average of.29 APRNs per physician and 1.")
57 Comparing data on the distribution of APRNs between counties in the state to the most recent UMEC reports on physicians (UMEC Physicians Workforce Report, 2016) and PAs (UMEC PA Workforce Report, 2015), ratios between the three workforces were calculated and are summarized in the table below. There is an average of.29 APRNs per physician and 1.03 APRNs per PA overall in the state. 52
58 Table 28: Physician, PA, and Population Ratios in All Utah Counties County 14 APRN to APRN to Total Provider to APRN to PA Physician Population Population 15 Beaver :1661 1:515 Box Elder :2408 1:582 Cache :2833 1:485 Carbon :3532 1:548 Daggett Davis :4574 1:583 Duchesne :2319 1:401 Emery - - 1:5329 1:5329 Garfield :953 1:548 Grand :4830 1:375 Iron :3494 1:649 Juab :852 Kane :1818 Millard :1191 Morgan :5485 1:738 Piute Rich :588 1:181 Salt Lake :1056 1:225 San Juan :7872 1:418 Sanpete :4848 1:909 Sevier :3918 1:804 Summit :1511 1:317 Tooele :5272 1:959 Uintah :2645 1:717 Utah :1998 1:499 Wasatch :2861 1:923 Washington :1546 1:363 Wayne 0 0 1:1363 1:1363 Weber :1722 1: Urban Counties are highlighted. 15 This includes all APRNs, PAs, and Physicians in each county according to the most recent UMEC reports 53
59 Workforce Projections Because of the many points of variance between each APRN category, projection modeling is done for each separately. The workforce projection model used here relies on supply minus demand, as well as population projections and provider to 100,000 population ratios. These projections use survey responses to project out 10 years, from 2015 at the time of survey to the year Supply Supply is calculated as the FTE adjusted average number of licenses issued per year minus the FTE adjusted average number of licenses expired per year. Averages were calculated from the last 6 six years of DOPL data ( ). License averages are adjusted based on the FTE average of the workforce and so appropriate comparisons can be made to FTE projections. Additionally, supply totals are adjusted for average percentage of total licensed workforce that practice in the state, using data from the previous three UMEC studies. For NPs and CNSs, the average number of licenses issued was calculated based on the difference in their respective workforce sizes in 2003 and 2015, divided by the number of years between them (12). Licenses expired are left at zero due to lack of differentiated license data from DOPL for the two categories in Utah. Demand Demand is calculated as the sum of FTE loss to retirement, FTE loss to pre-retirement hour reduction, and FTE loss to post-hour-reduction retirement. The UMEC survey captures data on intended years to retirement, intended years to hour-reduction pre-retirement, intended hours to be reduced, and when that reduction will take place. Because the projections are sensitive to individual intended hour reductions and retirement plans based on survey data, each year 1-10 has a different projected FTE loss. Demand based solely on data from the survey, represented in the graphs below by the solid line, does not account for population growth, insurance changes, or other factors. Using population estimates and projections from the Kem C. Gardner Policy Institute for the years , each graph below also includes a dotted line showing the population-based need for each license category assuming a constant provider to 100,000 population ratio per category. Certified Nurse Midwife Projection According to our projection model, the CNM workforce in Utah will decline at a rate of 1.47 FTEs per year through 2025 assuming workforce growth continues as projected. As of 2015, 54
60 there were 115 CNMs practicing in the state, with a 98 FTE equivalence. This equates to 3.3 fulltime CNMs for every 100,000 people in Utah according to the Kem C. Gardner Institute s population estimate for the state. In order to maintain that ratio through 2025, the CNM workforce needs to grow by 1.4 FTEs per year on average through The table below details the projection for workforce as it is expected to grow, and is represented by the solid line in the graph. The dotted line represents the number of total CNM FTEs needed to accommodate Utah s growing population and maintain a ratio of 3.3 CNMs per 100,000 population. Supply (i-e+l) Demand 16 (p+h+r) Table 29: CNM 10-year Workforce Projection Factors CNM Average Licenses Issued (i) 8 Average Licenses Expired (e) 5 Total Licensed FTE Supply (l) 3*(.8521)= FTE Total In-State FTE Supply (s) *.83=2.12 FTEs FTE loss to pre-retirement hour reduction (p).907 FTE loss to post-hour-reduction retirement (h).676 FTE loss to retirement (r) 1.95 Total Demand (d) (s-d) Average Annual FTE Supply Over Demand Demand totals here are averaged over 10 years graphs and related table details exact FTE loss applied per year. 55
61 Figure 38: CNM 10 Year Projection Workforce Trends Populaiton-Based Growth Demand Based on our workforce projections and the assumed population growth over the next 10 years, the CNM workforce will need 118 FTEs to meet the demand of population growth, but is on track to have only 81 a deficit of 37 FTEs. Clinical Nursing Specialists Projections According to our projection model, the CNM workforce in Utah will decline at a rate of FTEs per year through This is consistent with the age profiles and demographic patterns of the workforce and the replacement rates seen in licensing and age cohorts based on past UMEC reports. As of 2015, there were 110 CNSs practicing in the state, with an FTE equivalent of 85. This equates to 2.8 FTEs per 100,000 population again using the Kem C. Gardner Policy Institute s population estimates for the state. In order to maintain that provider to population ratio, the CNS workforce should grow by 1.7 FTEs per year through The table below details the projection for workforce as it is expected to grow based on survey results, and is represented by the solid line in the graph. The dotted line represents the number of total CNS FTEs needed to accommodate Utah s growing population and maintain a ratio of 2.8 CNSs per 100,000 population. 56
62 Supply (i-e+i) Demand 17 (p+h+r) Table 30: CNS 10-year Workforce Projection Factors CNS Average Licenses Issued (i) -4.6 Average Licenses Expired (e) 0 Total Licensed FTE Supply (l) -4.6*(.8671)=-4.05 FTEs Total In-State FTE Supply (s) -4.05*.96=-3.88 FTEs FTE loss to pre-retirement hour reduction (p) FTE loss to post-hour-reduction retirement (h).965 FTE loss to retirement (r) Total Demand (d) (s-d) Average Annual FTE Supply Over Demand *CNS population in 2003=166; 2015=110. Difference=56/12=4.6. Figure 39: CNS 10 Year Projection Workforce Trends Population-Based Growth Considering expected rates of retirement and pre-retirement work reduction, as well as licensure trends in the state, this projection estimates that there will be no CNS workforce in Utah by In order to maintain the current ratio of 2.7 per 100,000 in the population as it grows, the CNS workforce will need 102 FTEs practicing in state. 17 Demand totals here are averaged over 10 years graphs and related table details exact FTE loss applied per year. 57
63 Certified Registered Nurse Anesthetists Projection According to our projection model, the CNM workforce in Utah will increase at a rate of FTEs per year through the year As of 2015, there were 181 CRNAs practicing in the state, with an FTE equivalence of 191 (because a portion report working 40 hours a week). This equates to 6.4 FTEs per 100,000 population based on population estimates provided by the Kem C. Gardner Policy Institute. In order to maintain that provider-to-population ratio, the CRNA workforce should grow by an average of 3.9 FTEs per year through The table below details the projection for workforce as it is expected to grow based on survey results, and is represented by the solid line in the graph. The dotted line represents the number of total CRNA FTEs needed to accommodate Utah s growing population and maintain a ratio of 6.4 FTEs per 100,000 population. Supply (i-e+l) Demand 18 (p+h+r) Table 31: CRNA 10-year Workforce Projection Factors CRNA Average Licenses Issued (i) 19 Average Licenses Expired (e) 12 Total Licensed FTE Supply (l) 7*(1.054)= 7.38 FTEs Total In-State FTE Supply (s) 7.38*.72=5.31 FTE loss to pre-retirement hour reduction (p) FTE loss to post-hour-reduction retirement (h).4725 FTE loss to retirement (r) Total Demand (d) (s-d) Average Annual FTE Supply Over Demand Demand totals here are averaged over 10 years graphs and related table details exact FTE loss applied per year. 58
64 Figure 40: CRNA 10 Year Projection Workforce Trends Population-Based Growth Considering expected workforce patterns based on survey responses, the CRNA workforce in the state is expected to remain fairly steady. Because of population growth in Utah, this projection identifies a deficit of 29 FTEs in the CRNA workforce by the year 2025 if trends don t change. Nurse Practitioners Projection According to our projection model, the NP workforce in Utah will increase at a rate of FTEs per year through the year As of 2015, there were 1,458 NPs practicing in the state of Utah with an FTE equivalence of 1,354. This equates to 4.5 FTEs per 100,000 population based on population approximations from the Kem C. Gardner Policy Institute. In order to maintain that provider to population ration, the NP workforce should grow by an average of 27.8 per year. The table below details this report s projection of workforce size based on survey data, and the graph shows those projections over time as well as population-based projections assuming that the provider to population ratio stays constant as the total population of the state expands. 59
65 Supply (i-e+l) Demand 19 (p+h+r) Table 32: NP 10-year Workforce Projection Factors NP Average Licenses Issued (i) 82.5* Average Licenses Expired (e) 0 Total Licensed FTE Supply (l) 82.5*(.9285)= 76.6 FTEs Total In-State FTE Supply (s) 76.6*(.84)=64.3 FTE loss to pre-retirement hour reduction (p) FTE loss to post-hour-reduction retirement (h) FTE loss to retirement (r) Total Demand (d) (s-d) Average Annual FTE Supply Over Demand *NP population in 2003=680; 2015=1,670. Difference=990/12=82.5. Figure 41: NP 10-year Workforce Projection 1, ,354 1,372 1,389 1,417 1,448 1,454 1,482 1,509 1,533 1,562 1, The NP workforce is projected to continue its growth, although this projection indicates that the rate of growth will be slightly behind population-based demand over the next 10 years. In the year 2025, the NP workforce could face a deficit of 62 FTEs in its workforce if trends for retirement, licensure, and practicing out of state continue. 19 Demand totals here are averaged over 10 years graphs and related table details exact FTE loss applied per year. 60
66 Conclusion The Advanced Practice Registered Nurse workforce in Utah is a robust population of highly trained healthcare professionals with varied backgrounds and working in diverse geographic areas, settings, and specialties. The population is dynamic, with changes and/or growth in all four license categories represented in the state. Since Utah s population is projected to grow, and considering expected changes in the federal and state level healthcare system, it is an important time to understand the dynamics of the APRN workforce. Projection analysis shows that for every category, current trends are not expected to supply a large enough workforce to meet the demand of Utah s growing population. Of particular concern is ensuring a sufficient APRN workforce in rural Utah and in HPSA designated shortage areas, where APRNs can have a major impact on healthcare accessibility. Attention should be paid to meeting the expected shortfall in years to come. Recruitment and retention, Utah s low unemployment rate and fairly competitive wages compared to national rates may attract providers from elsewhere and keep Utah licensed APRNs in practice in state in order to address the shortfall. 61
67 Policy Recommendations Recommendation I. Integrate supply, demand and education data to better understand workforce needs. The UMEC is now collecting not only APRN workforce supply information but also information on education and employer demand for APRNs in the state. These data sets can be combined and explored in order to provide a more accurate picture of the need for APRNs in the state. The UMEC should continue to build collaboration with state and national entities that collect and house data. Some of these data sources are: Utah Department of Health- Office of Health Care Statistics- All Payer Claims Database U.S. Department of Health and Human Services- Agency for Healthcare Research and Quality- Medical Expenditure Panel Survey National State Boards of Nursing Council/ National Forum of State Nursing Workforce Centers- Minimum, supply, demand and education datasets. Utah Department of Workforce Services- Employment and wage data. Recommendation II. Study the Involvement of APRNs in inter professional healthcare teams as the healthcare system continues to change. Nursing workforce dynamics can continue to be studied in the following ways: a) Tracking state and national supply/demand for APRNs. b) Focusing future surveys on how APRNs work in inter-professional teams. c) Assessing nursing roles and participation in Medicaid/Medicare as those programs change. d) Understanding how involvement of nurses in team care can keep costs down for patient centered care and accountable care organization service models. Recommendation III. Support efforts to make the APRN workforce more representative of the population. The Utah APRN workforce as a whole is made up of 16% minorities. The state population is 20% minority. In general, APRNs seem to have a better representation of minorities than other medical professions (physicians, PAs, dentists etc.) in the state. However, UMEC recommends continued support for efforts to preserve and perpetuate diversity in the APRN workforce. a) Make collaborative efforts with AHEC, local high schools, DOH, United Way (Cradle to Career Program etc.) etc. to encourage minority youth and college students to look at nursing as a profession. 62
68 Recommendation IV. Increase availability of training sites and preceptors in the state. Competition for clinical training sites has been on the rise and will continue to grow with new medical training programs opening in the state. Utah nursing schools and the UMEC as the state s nursing workforce information center should collaborate to: a) Develop information on potential untapped preceptors. b) Recognize and leverage training site capacity. c) Work with non-nursing medical training programs in the state to optimizing training sites for inter-professional team based training. Recommendation V. Continue to invest in rural workforce development. Reform that encourages APRN providers to practice in geographic, demographic and institutional Health Provider Shortage Areas (HPSAs) can be a means to improve access to medical services for people living in those HPSAs. While APRNs who practice in a rural area earn more that their urban counterparts in general, an APRN costs less to employ than a physician in a rural area. Rural practice can be encouraged in the following ways: a) Support insurance payment/reimbursement reform, both public and private insurance. b) Support loan reimbursement programs through private, non-profit, state and federal government programs. c) Support clinical rotations in rural areas through UMEC s continued partnership with the Area Health Education Center. 63
69 Appendix A: Works Cited AANP (2016). NP Fact Sheet. Web. April 24, < Budden et al. (2014). The National Council of State Boards of Nursing and The Forum of State Nursing Workforce Centers 2013 National Workforce Survey of Registered Nurses. Journal of Nursing Regulation. Vol 4. Web. May 2, < Bureau of Labor Statistics, U.S. Department of Labor. (2015). Nurse Anesthetists, Nurse Midwives, and Nurse Practitioners. Occupational Outlook Handbook, Web. April 27, 2017.< > California Board of Registered Nursing (2011). Survey of Clinical Nurse Specialists in California. Web. April 15, Institute of Medicine (2011). The Future of Nursing: Leading Change, Advancing Health. Web. April 21, < Kem C. Gardner Policy Institute (2017). Population Projections. Web. April 24, Peckman, Carol (2015). Medscape National Nurse Salary Report. Web. May 2, Sipe et al. (2012) Demographic Profiles of Certified Nurse Midwives, Certified Registered Nurse Anesthetists, and Nurse Practitioners: Reflections on Implications for Uniform Education and Regulation. Journal of Professional Nursing. Vol 25, No 3. Web. May 2, on_implications_for_uniform_education_and_ Utah Medical Education Council (2013). Utah s Advanced Practice Registered Nurse Workforce, 2013: A Study of the Supply and Distribution of APRNs in Utah. Salt Lake City, UT. Utah Medical Education Council (2016). Utah s Physician Workforce, 2016: A Study of the Supply and Distribution of Physicians in Utah. Salt Lake City, UT. Utah Medical Education Council (2015). Utah s Physician Assistant Workforce, 2015: A Study of the Supply and Distribution of PAs in Utah. Salt Lake City, UT. U.S. Census Bureau (2013). Men in Nursing Professions. Web. April 25, < 64

70 Appendix B: Survey Instruments NP/CNS Cover Letter and Survey 65
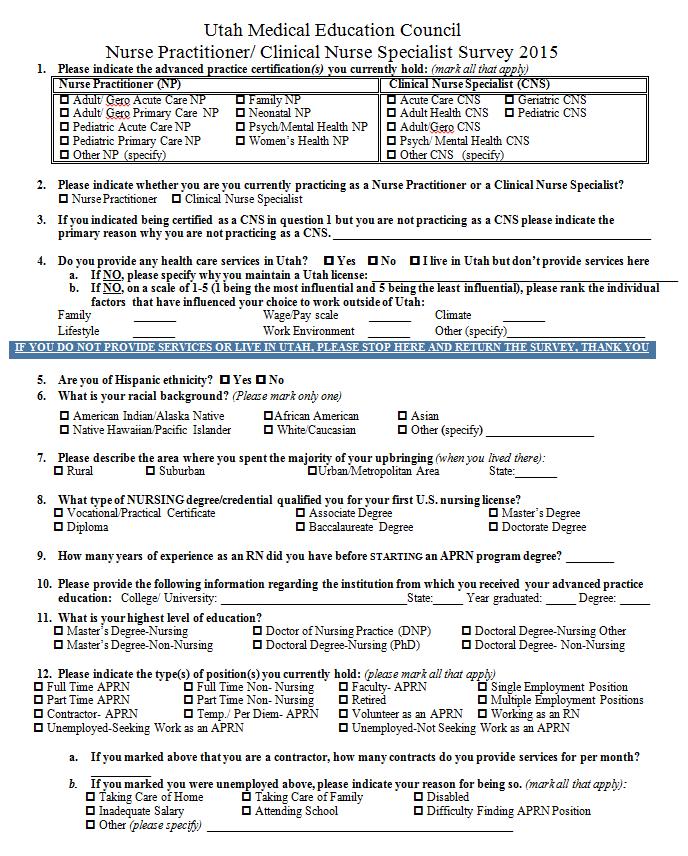
71 66
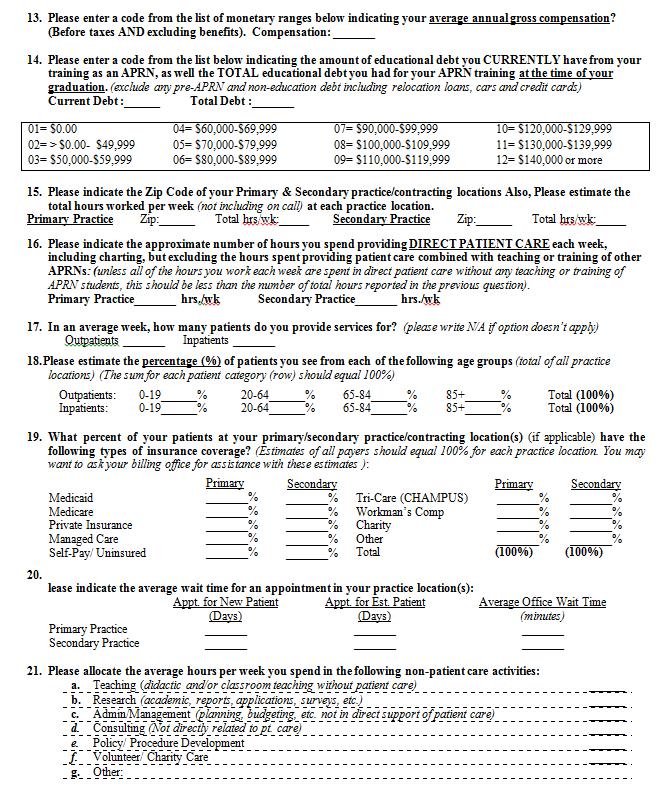
72 67
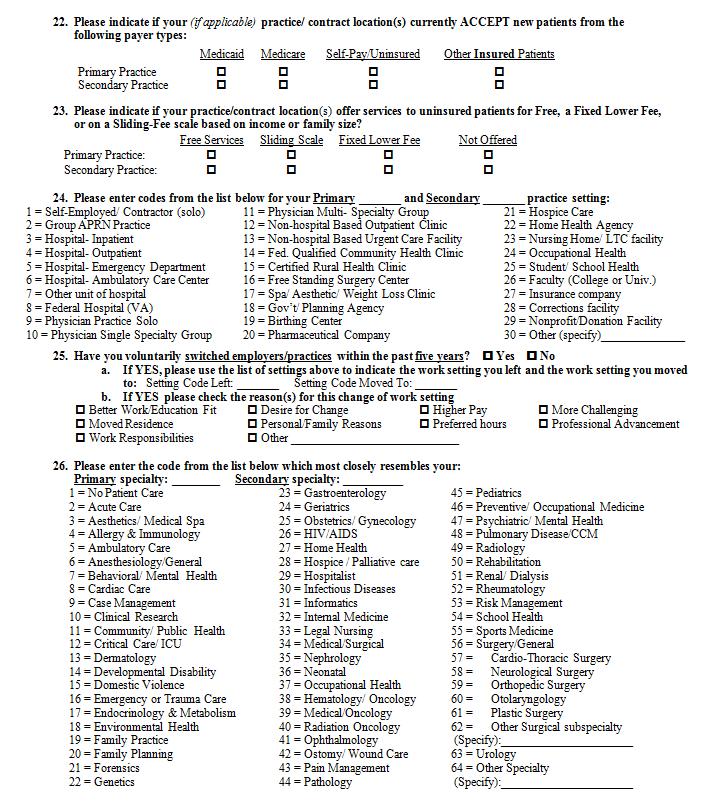
73 68
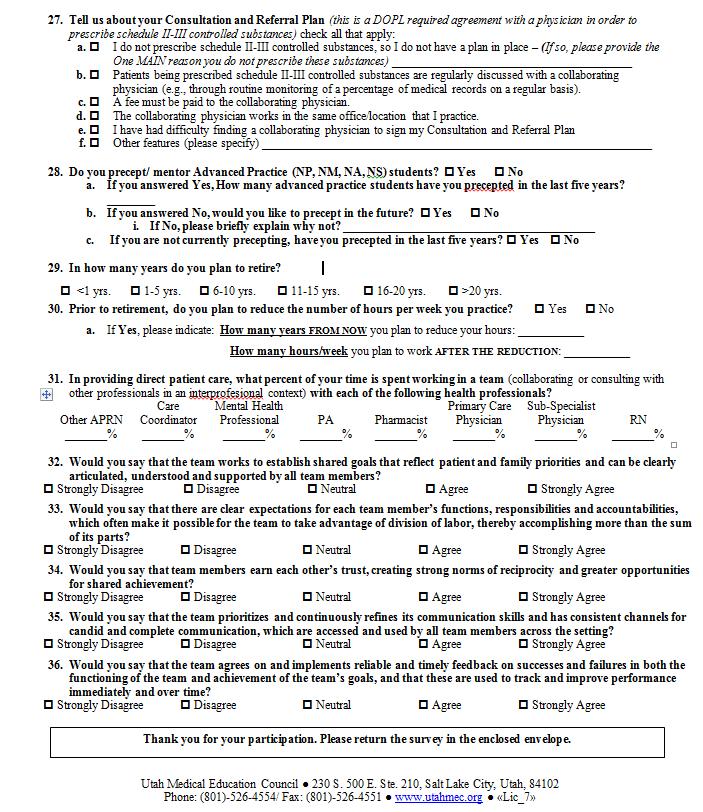
74 69
75 CNM Cover Letter and Survey 70
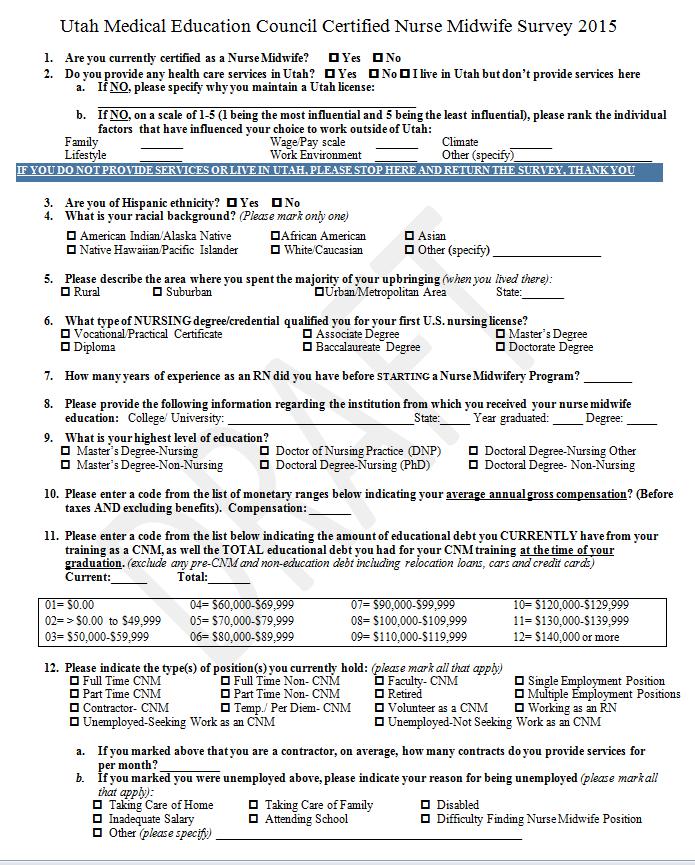
76 71
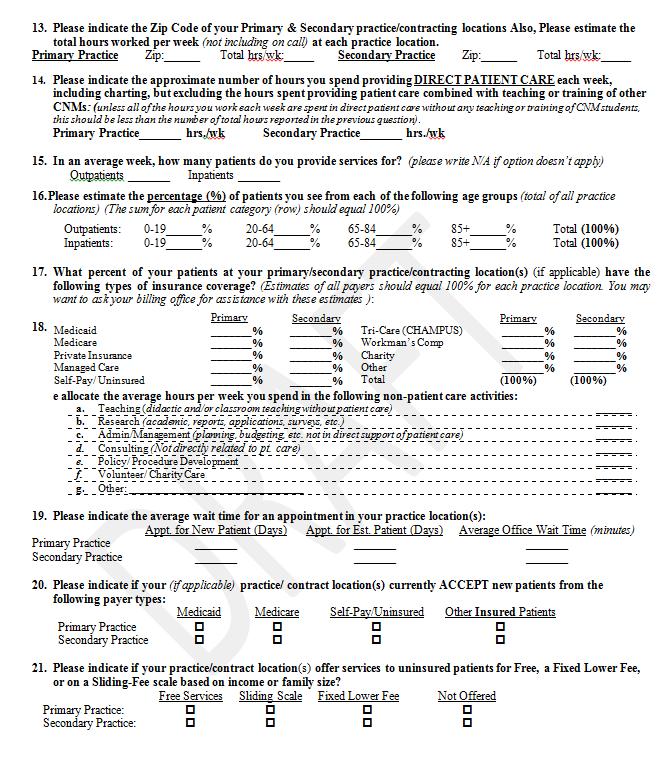
77 72
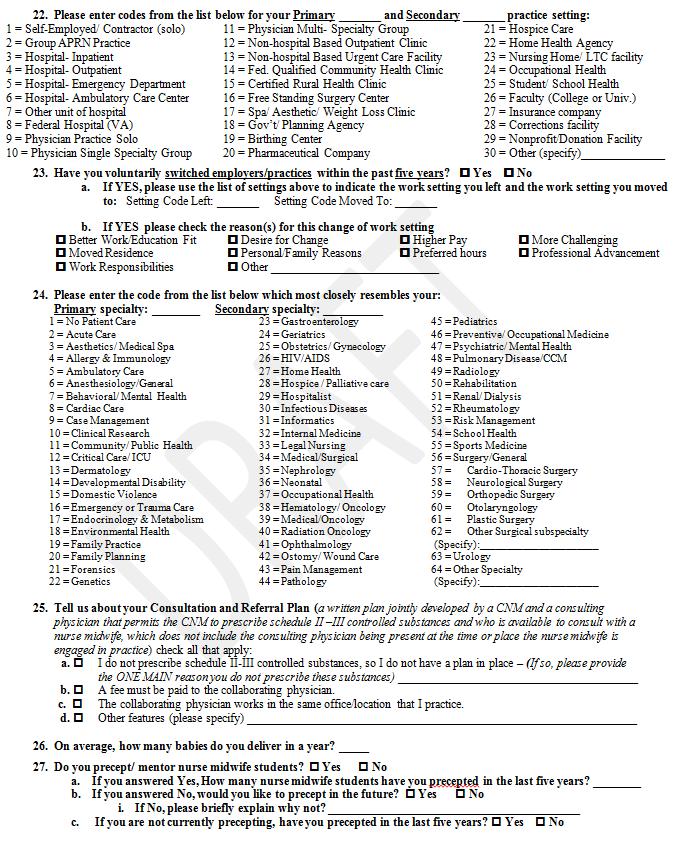
78 73
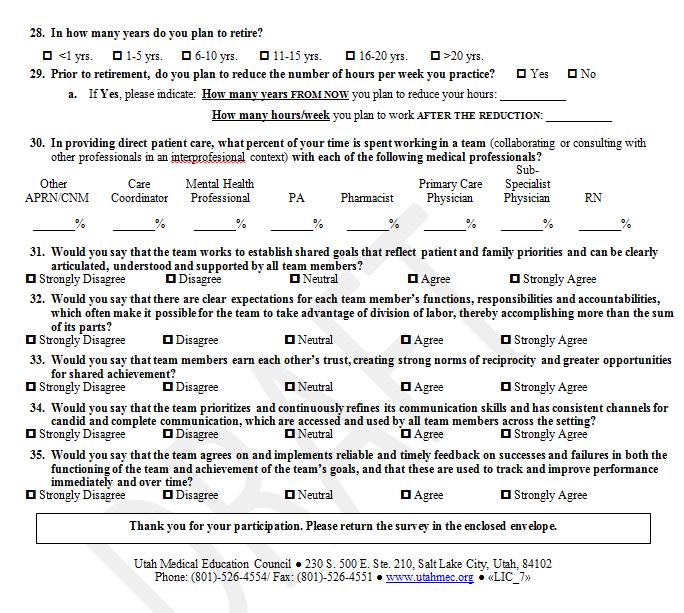
79 74
80 CRNA Cover Letter and Survey 75
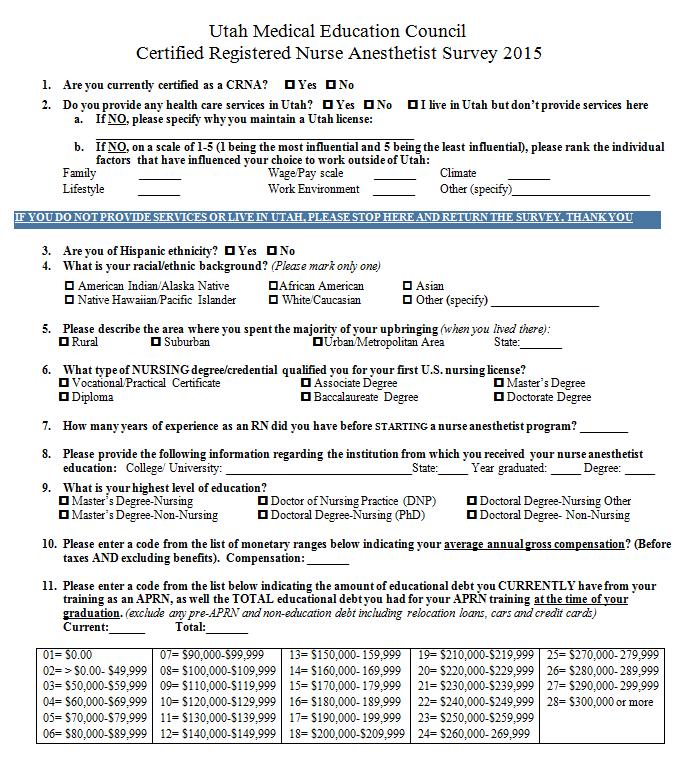
81 76
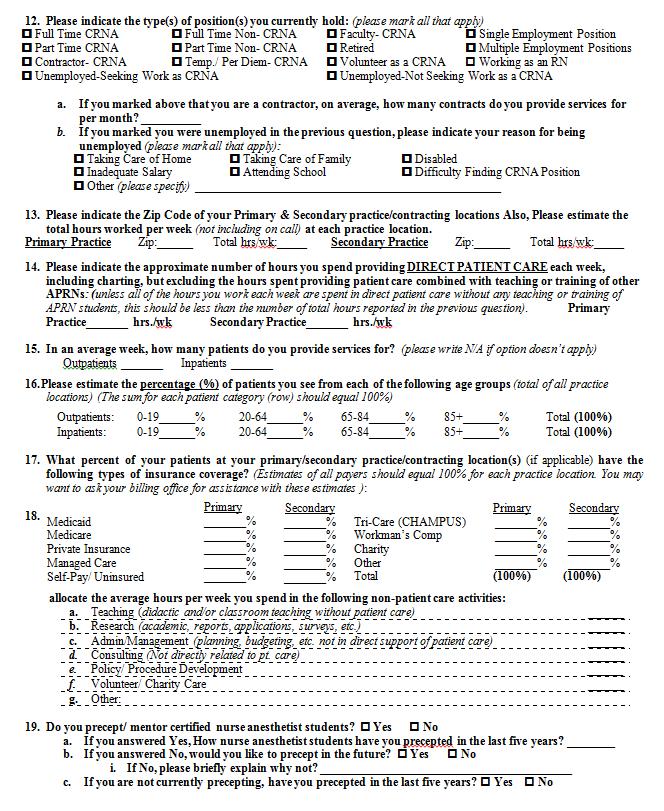
82 77
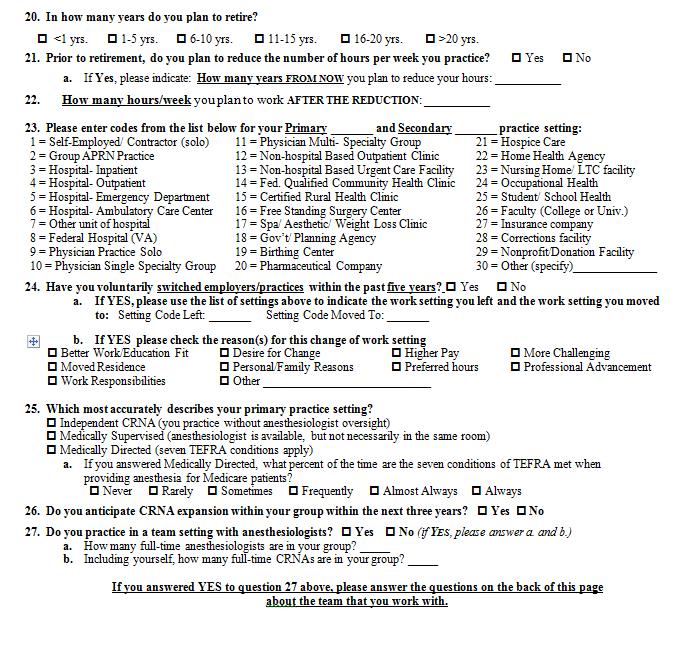
83 78
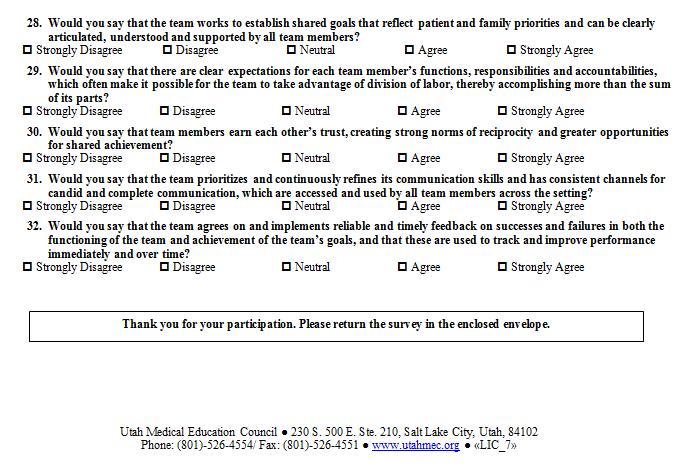
84 79

85 APRN/CNM Cover Letter and Survey 80
86 81
87 82
88 83
89 84
2016 Survey of Michigan Nurses
 2016 Survey of Michigan Nurses Survey Summary Report November 15, 2016 Office of Nursing Policy Michigan Department of Health and Human Services Prepared by the Michigan Public Health Institute Table of
Presented by: Jill Budden, PhD
 Findings from the 2015 National Nursing Workforce Study: A Collaboration between the National Council of State Boards of Nursing & The National Forum of State Nursing Workforce Centers Presented by: Jill
Florida Post-Licensure Registered Nurse Education: Academic Year
 Florida Post-Licensure Registered Nurse Education: Academic Year 2016-2017 The information below represents the key findings regarding the post-licensure (RN-BSN, Master s, Doctorate) nursing education
School of Public Health University at Albany, State University of New York
 2017 A Profile of New York State Nurse Practitioners, 2017 School of Public Health University at Albany, State University of New York A Profile of New York State Nurse Practitioners, 2017 October 2017
2017 Louisiana Nursing Education Capacity Report and 2016 Nurse Supply Addendum Report
 217 Louisiana Education Capacity Report and 216 Nurse Supply Addendum Report Louisiana State Board of Center for 217 Louisiana Education Capacity Report and 216 Nurse Supply Addendum Report Executive Summary
Foundations for the Future: The Leadership of the American Association of Nurse Practitioners Over the Decades
 Foundations for the Future: The Leadership of the American Association of Nurse Practitioners Over the Decades KATHY WHEELER, PHD, RN, APRN, NP-C, FNAP, FAANP ASSISTANT PROFESSOR, UNIVERSITY OF KENTUCKY
INCREASE ACCESS TO PRIMARY CARE SERVICES BY ALLOWING ADVANCED PRACTICE REGISTERED NURSES TO PRESCRIBE
 INCREASE ACCESS TO PRIMARY CARE SERVICES BY ALLOWING ADVANCED PRACTICE REGISTERED NURSES TO PRESCRIBE Both nationally and in Texas, advanced practice registered nurses have helped mitigate the effects
Survey of Nurses 2015
 Survey of Nurses 2015 Prepared by Public Sector Consultants Inc. Lansing, Michigan www.pscinc.com There are an estimated... 104,351 &17,559 LPNs RNs onehundredfourteenthousdfourhundredtwentyregisterednursesactiveinmichigan
Nursing Education Capacity and Nursing Supply in Louisiana 2015
 Nursing Education Capacity and Nursing Supply in Louisiana 215 Louisiana State Board of Nursing Center for Nursing Nursing Education Capacity and Supply in Louisiana 215 Executive Summary Findings from
YOUR FUTURE IN NURSING HEATHER CURTIS, RN, BSN
 YOUR FUTURE IN NURSING HEATHER CURTIS, RN, BSN OBJECTIVES Review BSN outcomes Review MSN outcomes Review Doctoral outcomes Why should I pursue higher education What jobs can I get with a MSN Which program
Florida s Workforce Supply Characteristics and Trends: Registered Nurses (RN)
") Florida s 2016-2017 Workforce Supply Characteristics and Trends: Registered Nurses (RN) Addressing Nurse Workforce Issues for the Health of Florida www.flcenterfornursing.org Visit our site at: www.flcenterfornursing.org
Florida s 2016-2017 Workforce Supply Characteristics and Trends: Registered Nurses (RN) Addressing Nurse Workforce Issues for the Health of Florida www.flcenterfornursing.org Visit our site at: www.flcenterfornursing.org
Nursing Education Capacity and Nursing Supply in Louisiana Louisiana State Board of Nursing Center for Nursing
 Nursing Education Capacity and Nursing Supply in Louisiana Louisiana State Board of Nursing Center for Nursing 2011 Executive Summary Nursing Education Capacity and Supply in Louisiana 2010-2011 This report
Report on the APNA National Psychiatric Mental Health Advanced Practice Registered Nurse Survey
 Report on the APNA National Psychiatric Mental Health Advanced Practice Registered Nurse Survey Kathleen R. Delaney, PhD, PMHNP BC Barbara L. Drew, PhD, PMHCNS BC Amy J. Rushton, MSN, PMHCNS BC Conflict
Who delivers health care? Non-physician Workforce Considerations : The Role of the Advanced Practice Nurse and the Physician Assistant.
 Who delivers health care? Non-physician Workforce Considerations : The Role of the Advanced Practice Nurse and the Physician Assistant Meredith Davison, PhD, MPH University of Oklahoma School of Community
Minnesota s Registered Nurse Workforce
 Minnesota s Registered Nurse Workforce 2015-2016 HIGHLIGHTS FROM THE 2015-2016 RN WORKFORCE SURVEYi Overall Registered nurses, the largest segment of the health care workforce, deliver primary and specialty
Cite as: LeVasseur, S.A. (2015) Nursing Education Programs Hawai i State Center for Nursing, University of Hawai i at Mānoa, Honolulu.
 Nursing Education Programs Hawai i State Center for Nursing, University of Hawai i at Mānoa, Honolulu.") Nursing Education Program Capacity 2012-2013 1 Written by: Dr. Sandra A. LeVasseur, PhD, RN Associate Director, Research Hawai i State Center for Nursing University of Hawai i at Mānoa, Honolulu, Hawai
Nursing Education Program Capacity 2012-2013 1 Written by: Dr. Sandra A. LeVasseur, PhD, RN Associate Director, Research Hawai i State Center for Nursing University of Hawai i at Mānoa, Honolulu, Hawai
Registered Nurses. Population
 The Registered Nurse Population Findings from the 2008 National Sample Survey of Registered Nurses September 2010 U.S. Department of Health and Human Services Health Resources and Services Administration
Conflict of Interest Statement
 Report on the APNA National Psychiatric Mental Health Advanced Practice Registered Nurse Survey Kathleen R. Delaney, PhD, PMHNP BC Barbara L. Drew, PhD, PMHCNS BC Amy J. Rushton, MSN, PMHCNS BC Conflict
Objectives. Getting and Staying Certified: Issues for the New and Practicing NP. Upon completion of the program, the participant will be able to:
 Objectives Getting and Staying Certified: Issues for the New and Practicing NP Margaret A. Fitzgerald, DNP, FNP-BC, NP-C, FAANP, CSP, FAAN, DCC President Fitzgerald Health Education Associates, Inc. Family
Please note that Academic Year (AY) is defined as Fall (August/September) Semester 2015 through Summer (July/August) Semester 2016.
 is defined as Fall (August/September) Semester 2015 through Summer (July/August) Semester 2016.") 2016 Florida Center for Nursing Survey of Nursing Programs Nursing Program: BROWARD COUNTY SHERIDAN TECHNICAL COLLEGE Program Dean or Director Contact Information Please provide contact information for
2016 Florida Center for Nursing Survey of Nursing Programs Nursing Program: BROWARD COUNTY SHERIDAN TECHNICAL COLLEGE Program Dean or Director Contact Information Please provide contact information for
2017 Florida Center for Nursing Survey of Nursing Programs
 2017 Florida Center for Nursing Survey of Nursing Programs This worksheet is intended to help you assemble information for your nursing program prior to online submission of your data. Please log on to
Predicting Transitions in the Nursing Workforce: Professional Transitions from LPN to RN
 Predicting Transitions in the Nursing Workforce: Professional Transitions from LPN to RN Cheryl B. Jones, PhD, RN, FAAN; Mark Toles, PhD, RN; George J. Knafl, PhD; Anna S. Beeber, PhD, RN Research Brief,
Minnesota s Registered Nurse Workforce
 Minnesota s Registered Nurse Workforce 2013-2014 HIGHLIGHTS FROM THE 2013-2014 RN WORKFORCE SURVEY i Overall Registered nurses are the largest segment of the health care workforce delivering primary and
Clinical Nurse Specialist (CNS)
") Clinical Nurse Specialist (CNS) Paula Halcomb, MSN, DNP, APRN, ACNS-BC paula.halcomb@uky.edu Jill Dobias, MSN, APRN, ACCNS-AG, OCN, AOCNS jill.dobias@uky.edu Dee Sawyer, MS, APRN, MLDE, AGCNS-BC, BC-ADM,
Clinical Nurse Specialist (CNS) Paula Halcomb, MSN, DNP, APRN, ACNS-BC paula.halcomb@uky.edu Jill Dobias, MSN, APRN, ACCNS-AG, OCN, AOCNS jill.dobias@uky.edu Dee Sawyer, MS, APRN, MLDE, AGCNS-BC, BC-ADM,
2005 Survey of Licensed Registered Nurses in Nevada
 2005 Survey of Licensed Registered Nurses in Nevada Prepared by: John Packham, PhD University of Nevada School of Medicine Tabor Griswold, MS University of Nevada School of Medicine Jake Burkey, MS Washington
2017 SPECIALTY REPORT ANNUAL REPORT
 2017 SPECIALTY REPORT ANNUAL REPORT National Commission on Certification of Physician Assistants Table of Contents Message from the President... 3 About the Data Collection and Methodology...4 All Specialties....
Report on the SREB Council on Collegiate Education for Nursing South Carolina School of Nursing Data
 Office of Health Care Workforce Research for Nursing Report on the SREB Council on Collegiate Education for Nursing South Carolina School of Nursing Data Report Prepared By: Dr. Peggy O. Hewlett, Director
The 2015 National Workforce Survey Maryland LPN Data June 17, 2016
 1. What is your gender? n=644.9 Male 10.1% Female 89.9% The 2015 National Workforce Survey Maryland LPN Data June 17, 2016 2. What is your race/ethnicity? (Mark all that apply) n=682.4 American Indian
South Carolina Nursing Education Programs August, 2015 July 2016
 South Carolina Nursing Education Programs August, 2015 July 2016 Acknowledgments This document was produced by the South Carolina Office for Healthcare Workforce in the South Carolina Area Health Education
2017 Survey of Nurse Practitioners and Certified Nurse Midwives
 2017 Survey of Nurse Practitioners and Certified Nurse Midwives by Joanne Spetz, Lisel Blash, Matthew Jura, and Lela Chu Philip R. Lee Institute for Health Policy Studies & Healthforce Center at UCSF April
APRNs - Who are they? KAREN FOREN LAKE, PHD, RNC, APRN (CNP) MICHIGAN NURSES ASSOCIATION
 MICHIGAN NURSES ASSOCIATION") NP CRNA CNS CNM APRNs - Who are they? KAREN FOREN LAKE, PHD, RNC, APRN (CNP) MICHIGAN NURSES ASSOCIATION Conflict of Interest and Accreditation Successful Completion of this Continuing Nursing Education
NP CRNA CNS CNM APRNs - Who are they? KAREN FOREN LAKE, PHD, RNC, APRN (CNP) MICHIGAN NURSES ASSOCIATION Conflict of Interest and Accreditation Successful Completion of this Continuing Nursing Education
PA Education Worldwide
 Physician Assistants: Past and Future Roderick S. Hooker, PhD, MBA, PA October 205 Oregon Society of Physician Assistants PA Education Worldwide Health Workforce North America 204 US Canada Population
The Registered Nurse Workforce in South Carolina
 The Registered Nurse Workforce in South Carolina - 2016 July, 2018 This document contains information about the Registered Nurses actively employed as nurses in South Carolina as reported by the nurses
Perspectives on Nurse Practitioner/Advanced Practice Nursing in the USA-2012 Update
 Perspectives on Nurse Practitioner/Advanced Practice Nursing in the USA-2012 Update In the United States (U.S.), advanced practice registered nurses (APRNs) represent a growing segment of health care professionals
North Dakota Nursing Education, Supply and Demand Chartbook
 North Dakota Nursing Education, Supply and Demand Chartbook January, 2016 Patricia Moulton, PhD and Kyle Martin, BS North Dakota Center for Nursing Research Publication #10 Questions regarding this report
NURSING. Executive Summary. Can It Remain a Source of Upward Mobility Amidst Healthcare Turmoil?
 NURSING Center on Education and the Workforce McCourt School of Public Policy Can It Remain a Source of Upward Mobility Amidst Healthcare Turmoil? A n thony P. Carne va l e Ni c ol e S m i th Ar t e m
Physician Workforce Fact Sheet 2016
 Introduction It is important to fully understand the characteristics of the physician workforce as they serve as the backbone of the system. Supply data on the physician workforce are routinely collected
THE ADVANCING ROLE OF ADVANCED PRACTICE CLINICIANS: COMPENSATION, DEVELOPMENT, & LEADERSHIP TRENDS
 THE ADVANCING ROLE OF ADVANCED PRACTICE CLINICIANS: COMPENSATION, DEVELOPMENT, & LEADERSHIP TRENDS INTRODUCTION The demand for Advanced Practice Clinicians (APCs) or Advanced Practice Providers (APPs)
Survey of Nurse Employers in California 2014
 Survey of Nurse Employers in California 2014 Conducted by UCSF Philip R. Lee Institute for Health Policy Studies, California Institute for Nursing & Health Care, and the Hospital Association of Southern
Identifying and Describing Nursing Faculty Workload Issues: A Looming Faculty Shortage
 Identifying and Describing Nursing Faculty Workload Issues: A Looming Faculty Shortage Nancy Phoenix Bittner, PhD, CNS, RN Cynthia F. Bechtel, Ph.D., RN, CNE, CEN, CHSE Conflicts of Interest and Disclosures:
The RN & APRN Workforce in Ohio
 March 2015 Ohio Action Coalition The RN & APRN Workforce in Ohio An Overview of 2013 Licensure Renewal Data This analysis of the 2013 licensure renewal data was supported by funds from the State Implementation
2012 NDNQI RN Survey
 2012 NDNQI RN Survey Practice Environment Scale For each item, please indicate the extent to which you agree that the item is PRESENT IN YOUR CURRENT JOB. Response options: strongly agree, agree, disagree,
Minnesota s Physician Assistant Workforce, 2016
 OFFICE OF RURAL HEALTH AND PRIMARY CARE Minnesota s Physician Assistant Workforce, 2016 HIGHLIGHTS FROM THE 2016 PHYSICIAN ASSISTANT SURVEY Table of Contents Minnesota s Physician Assistant Workforce,
Licensed Nurses in Florida: Trends and Longitudinal Analysis
 Licensed Nurses in Florida: 2007-2009 Trends and Longitudinal Analysis March 2009 Addressing Nurse Workforce Issues for the Health of Florida www.flcenterfornursing.org March 2009 2007-2009 Licensure Trends
Idaho s Nursing Workforce
 Idaho s Nursing Workforce June 3, 2015 Bob Uhlenkott - Chief Research Officer Idaho Department of Labor Workforce - #1 Challenge to Idaho s Economic Prosperity Page-2 Population Trends Page-3 Source: US
Determining the Role of the Nurse with a Doctor of Nursing Practice Degree
 Determining the Role of the Nurse with a Doctor of Nursing Practice Degree Anna Song Beeber, PhD, RN; Cheryl Jones, PhD, RN, FAAN; Carrie Palmer DNP, RN, ANP-BC; Julee Waldrop DNP, PNP-BC; Mary Lynn PhD,
DoDEA Seniors Postsecondary Plans and Scholarships SY
 DoDEA Seniors Postsecondary Plans and Scholarships SY 2011 12 Department of Defense Education Activity (DoDEA) Research and Evaluation Branch Ashley Griffin, PhD D e p a r t m e n t o f D e f e n s e E
Licensure, Accreditation, Certification, Education in Nursing: Aligning the Pieces to Improve Outcomes
 Licensure, Accreditation, Certification, Education in Nursing: Aligning the Pieces to Improve Outcomes June 12, 2013 Institute of Medicine Standing Committee on Credentialing Research in Nursing Washington,
Interprofessional Education Seminar Series: A Certificate Program for Health Care Providers. Basic Education of Selected Healthcare Professionals
 Interprofessional Education Seminar Series: A Certificate Program for Health Care Providers Basic Education of Selected Healthcare Professionals Audiology Dentist Dietician Evaluate and treat hearing and
REPORT TO THE 2018 LEGISLATURE. Annual Report on Findings from the Hawai i Physician Workforce Assessment Project
 REPORT TO THE 2018 LEGISLATURE Annual Report on Findings from the Hawai i Physician Workforce Assessment Project Act 18, SSLH 2009 (Section 5) Act 186, SLH 2012 Act 40, SLH 2017 October 2017 Hawai i Physician
The National Association of Clinical Nurse Specialists (NACNS)
") The National Association of Clinical Nurse Specialists (NACNS) Response to the Institute of Medicine s Future of Nursing Report This document was prepared by an NACNS appointed task force that was tasked
The National Association of Clinical Nurse Specialists (NACNS) Response to the Institute of Medicine s Future of Nursing Report This document was prepared by an NACNS appointed task force that was tasked
Minnesota s Physician Workforce, 2015
 Minnesota s Physician Workforce, 2015 HIGHLIGHTS FROM THE 2015 PHYSICIAN WORKFORCE SURVEY i Overall According to the Minnesota Board of Medical Practice, as of November 2015, there were 22,353 actively
Minnesota s Marriage & Family Therapist (MFT) Workforce, 2015
 Workforce, 2015") OFFICE OF RURAL HEALTH AND PRIMARY CARE Minnesota s Marriage & Family Therapist (MFT) Workforce, 2015 HIGHLIGHTS FROM THE 2015 MFT WORKFORCE SURVEY i Overall According to the Board of Marriage and Family
OFFICE OF RURAL HEALTH AND PRIMARY CARE Minnesota s Marriage & Family Therapist (MFT) Workforce, 2015 HIGHLIGHTS FROM THE 2015 MFT WORKFORCE SURVEY i Overall According to the Board of Marriage and Family
Minnesota s Physical Therapist Assistant Workforce, 2015
 Minnesota s Physical Therapist Assistant Workforce, 2015 HIGHLIGHTS FROM THE 2015 PHYSICAL THERAPIST ASSISTANT WORKFORCE SURVEY i Overall According to the Minnesota Board of Physical Therapy, as of April
2018 Technical Documentation for Licensure and Workforce Survey Data Analysis Addressing Nurse Workforce Issues for the Health of Florida
 2018 Technical Documentation for Licensure and Workforce Survey Data Analysis Addressing Nurse Workforce Issues for the Health of Florida www.flcenterfornursing.org 1 Contents Background... 3 Data Extract...
WHAT IS THE APRN CONSENSUS MODEL AND HOW DOES IT EFFECT ADVANCED PRACTICE NURSES?
 WHAT IS THE APRN CONSENSUS MODEL AND HOW DOES IT EFFECT ADVANCED PRACTICE NURSES? Sonoita, AZ June 26, 2015 Paula Christianson-Silva DNP, RN, FNP-BC, ANP-BC Objectives 1. Review the history and development
Wisconsin s Health Care Workforce Report 2008
 Wisconsin s Health Care Workforce Report 2008 A report by the Wisconsin Hospital Association Wisconsin s Health Care Workforce Report 2008 A report by the Wisconsin Hospital Association Table of Contents
Consensus Model for APRN Regulation: Licensure, Accreditation, Certification, Education
 Consensus Model for APRN Regulation: Licensure, Accreditation, Certification, Education Victoria A. Weill Future of Nursing Report (IOM, 2010) Recommendations 1) the health care system needs to tap the
Population Representation in the Military Services
 Population Representation in the Military Services Fiscal Year 2008 Report Summary Prepared by CNA for OUSD (Accession Policy) Population Representation in the Military Services Fiscal Year 2008 Report
Module 1 Program Description
 Module 1 Program Description Palliative Care Program Description 1. What type(s) of communities does your palliative care program serve? Check all that apply. Urban Suburban Rural 2. Which counties does
Guidelines for Graduate APRN Clinical Experiences
 Guidelines for Graduate APRN Clinical Experiences The following guidelines have been developed to clarify the faculty, preceptor, and student s role during their clinical experience. Definition of terms:
The Nursing Workforce: Challenges for Community Health Centers and the Nation s Well-being
 The Nursing Workforce: Challenges for Community Health Centers and the Nation s Well-being Jane K Kadohiro, DrPH, APRN, CDE University of Hawaii at Manoa Overview Today s nursing workforce Determinants
Appendix A Registered Nurse Nonresponse Analyses and Sample Weighting
 Appendix A Registered Nurse Nonresponse Analyses and Sample Weighting A formal nonresponse bias analysis was conducted following the close of the survey. Although response rates are a valuable indicator
Trends in the Supply and Distribution of the Health Workforce in North Carolina
 Trends in the Supply and Distribution of the Health Workforce in North Carolina Erin Fraher, PhD MPP Director Program on Health Workforce Research & Policy Cecil G. Sheps Center for Health Services Research,
2017 nursing trends and salary survey results: PART 1
 SPECIAL REPORT: 2017 TRENDS AND SALARY SURVEY 2017 nursing trends and salary survey results: PART 1 Almost 6,000 clinical nurses and nurse managers told us who they are, what they do, and what they think.
State of the State: Rules & Regulations for the APRN
 State of the State: Rules & Regulations for the APRN November 4 th, 2014 Meredith Lahl, MSN, PCNS-BC, PNP-BC, CPON Senior Director Advanced Practice Nursing Nursing Institute Topics Cleveland Clinic
ACADEMIC GROUP PRACTICE AND THE LEADERSHIP OF APRN S
 ACADEMIC GROUP PRACTICE AND THE LEADERSHIP OF APRN S Margaret Head, Chief Operating Officer/Chief Nursing Officer Susan Moseley Gent, Administrative Director Vanderbilt Medical Group March 10, 2012 With
FINAL NARRATIVE REPORT
 FINAL NARRATIVE REPORT UTAH NURSE RESIDENCY IMPLEMENTATION PROGRAM RWJF Grant ID# 70695 Period: February 1, 2013 January 31, 2015 $150,000 Goal: To Implement the Institute of Medicine Goal #3, Nurse Residency
Kechi Iheduru-Anderson DNP-c, MSN, RN, CWCN. December 2013
 Kechi Iheduru-Anderson DNP-c, MSN, RN, CWCN. December 2013 As a nurse in the united states you will encounter a variety of different types of caregivers. You may work with unlicensed assistive personnel
Analyst HEALTH AND HEALTH CARE IN SAN JOAQUIN COUNTY REGIONAL
 SPRING 2016 HEALTH AND HEALTH CARE IN SAN JOAQUIN COUNTY San Joaquin County Health Care s Rapid Growth Creates Critical Shortages in Key Occupations. Health care has been changing rapidly in the United
Hospital Discharge Data, 2005 From The University of Memphis Methodist Le Bonheur Center for Healthcare Economics
 Hospital Discharge Data, 2005 From The University of Memphis Methodist Le Bonheur Center for Healthcare Economics August 22, 2008 Potentially Avoidable Pediatric Hospitalizations in Tennessee, 2005 Cyril
East Central Florida Status Report on Nursing Supply and Demand July 2016
 East Central Florida Status Report on Nursing Supply and Demand July 2016 About the East Central Florida Region Regional Reports The Florida Center for Nursing was established in statute to address the
Economic Benefits of Less Restrictive Regulation of APRNs in North Carolina:
 Economic Benefits of Less Restrictive Regulation of APRNs in North Carolina: An Analysis of Local and Statewide Effects on Business Activity Christopher J. Conover, PhD Center for Health Policy and Inequalities
International Journal of Caring Sciences September-December 2017 Volume 10 Issue 3 Page 1705
 International Journal of Caring Sciences September-December 2017 Volume 10 Issue 3 Page 1705 Pilot Study Article A Strategy for Success on the National Council Licensure Examination for At-Risk Nursing
College of Nursing Assessment Plan Prepared for the University of Toledo Assessment Committee Data Collection and Review Process for
 College of Nursing Assessment Plan Prepared for the University of Toledo Assessment Committee Data Collection and Review Process for 2009-2010 1. COLLEGE/UNIT MISSION STATEMENT College of Nursing Mission
The Unmet Demand for Primary Care in Tennessee: The Benefits of Fully Utilizing Nurse Practitioners
 The Unmet Demand for Primary Care in Tennessee: The Benefits of Fully Utilizing Nurse Practitioners Major Points and Executive Summary by Cyril F. Chang, PhD, Lin Zhan, PhD, RN, FAAN, David M. Mirvis,
2012 SURVEY OF REGISTERED NURSES AMN HEALTHCARE, INC., 2012 JOB SATISFACTION, CAREER PATTERNS AND TRAJECTORIES
 We ve earned The Joint Commission s Gold Seal of Approval 2012 SURVEY OF REGISTERED NURSES AMN HEALTHCARE, INC., 2012 12400 High Bluff Drive, San Diego, CA 92130 JOB SATISFACTION, CAREER PATTERNS AND TRAJECTORIES
APPLICATION FOR TESTING AND SUBSEQUENT CERTIFICATION AS A CERTIFIED NURSE-MIDWIFE (CNM)
") APPLICATION FOR TESTING AND SUBSEQUENT CERTIFICATION AS A CERTIFIED NURSE-MIDWIFE (CNM) American Midwifery Certification Board 849 International Drive, Suite 120 Linthicum, MD 21090 410-694-9424 Phone
APPLICATION FOR TESTING AND SUBSEQUENT CERTIFICATION AS A CERTIFIED NURSE-MIDWIFE (CNM) American Midwifery Certification Board 849 International Drive, Suite 120 Linthicum, MD 21090 410-694-9424 Phone
9/26/2014. Preceptors and Students: A Discussion Larlene Dunsmuir James Sims. Problem. Foundation
 Preceptors and Students: A Discussion Larlene Dunsmuir James Sims Problem Perception: Insufficient number of practicing NPs willing to serve as clinical preceptors for NP students Reported: Finding adequate
Demographic Profile of the Active-Duty Warrant Officer Corps September 2008 Snapshot
 Issue Paper #44 Implementation & Accountability MLDC Research Areas Definition of Diversity Legal Implications Outreach & Recruiting Leadership & Training Branching & Assignments Promotion Retention Implementation
Experiences Using the National Provider Identifier (NPI) for Health Workforce Research
 for Health Workforce Research") Experiences Using the National Provider Identifier (NPI) for Health Workforce Research Susan Skillman, MS Davis Patterson, PhD Holly Andrilla, MS Bert Stover, PhD Center for Health Workforce Studies, and
Experiences Using the National Provider Identifier (NPI) for Health Workforce Research Susan Skillman, MS Davis Patterson, PhD Holly Andrilla, MS Bert Stover, PhD Center for Health Workforce Studies, and
Module 1 Program Description and Metrics
 Module 1 Program Description and Metrics Outpatient Clinic / Office-based Program Description 1. Is this program serving an urban, suburban or rural community? Urban Suburban Rural 2. Who administers your
Advanced Practice Registered Nurses (APRNs)
") - 4 - Advanced Practice Registered Nurses (APRNs) - 5 - Advanced Practice Registered Nurses (APRNs) APRNs are registered nurses who have at a minimum completed graduate coursework (masters degree), passed
- 4 - Advanced Practice Registered Nurses (APRNs) - 5 - Advanced Practice Registered Nurses (APRNs) APRNs are registered nurses who have at a minimum completed graduate coursework (masters degree), passed
The Roles of the APRN An Education for Credentialing Staff
 The Roles of the APRN An Education for Credentialing Staff Jennifer L. Burns, MJ, MSN, RN BC, NE BC, PHNA BC Practice & Education Consultant of the Wyoming State Board of Nursing Objectives Powers of WSBN
Future of Nursing: Campaign for Education Action
 Future of Nursing: Campaign for Education Action Montana Nurse Educators October 12, 2011 Mary Sue Gorski, RN, PhD, Assistant Professor, Gonzaga University Consultant, Center to Champion Nursing in America
Primary Care Workforce Survey Scotland 2017
 Primary Care Workforce Survey Scotland 2017 A Survey of Scottish General Practices and General Practice Out of Hours Services Publication date 06 March 2018 An Official Statistics publication for Scotland
New Jersey Nurse Workforce Supply and Demand
 New Jersey Nurse Workforce Supply and Demand A Report to Governor Chris Christie and the New Jersey State Legislature December 2015 R Governor s Bi-annual Report December 2015 New Jersey Nurse Workforce
CHALLENGES IN EXPERIENTIAL LEARNING ROLE OF CLINICAL PRECEPTORS IN COMMUNITY SETTINGS JILL S. BUTERBAUGH MSN, CRNP, FNP-BC
 CHALLENGES IN EXPERIENTIAL LEARNING ROLE OF CLINICAL PRECEPTORS IN COMMUNITY SETTINGS JILL S. BUTERBAUGH MSN, CRNP, FNP-BC EXPERIENTIAL LEARNING STUDENTS ARE ENCOURAGED TO APPLY AND AUGMENT CLASSROOM LEARNING
Massachusetts Healthcare Workforce Summit Devens Commons September 25, 2015
 Massachusetts Healthcare Workforce Summit Devens Commons September 25, 2015 Diversity in the Nursing Workforce Deborah Washington, PhD, RN INSTITUTE OF MEDICINE REPORT: FUTURE OF NURSING Leading Change,
Florida Licensed Practical Nurse Education: Academic Year
 # of LPN Programs Florida Licensed Practical Nurse Education: Academic Year 2016-2017 This report presents key findings regarding the Licensed Practical Nursing education system in Florida for Academic
West Central Florida Status Report on Nursing Supply and Demand July 2016
 West Central Florida Status Report on Nursing Supply and Demand July 2016 About the West Central Florida Region Regional Reports The Florida Center for Nursing was established in statute to address the
American Academy of Emergency Nurse Practitioners 2015 Membership Survey
 American Academy of Emergency Nurse Practitioners 15 Membership Survey American Academy of Emergency Nurse Practitioners website: http://aaenp-natl.org/index.php Highlights from the 15 Academy of Emergency
Standards for Accreditation of. Baccalaureate and. Nursing Programs
 Standards for Accreditation of Baccalaureate and Graduate Degree Nursing Programs Amended April 2009 Standards for Accreditation of Baccalaureate and Graduate Degree Nursing Programs Amended April 2009
Survey of Health Care Employers in Arizona: Long-Term Care Facilities, 2015
 Survey of Health Care Employers in Arizona: Long-Term Care Facilities, 2015 June 22, 2016 Prepared by: Lela Chu Joanne Spetz, PhD University of California, San Francisco 3333 California Street, Suite 265
Wisconsin Hospital Association 2014 Workforce Report. Wisconsin Health Care Workforce 2014 Report
 Wisconsin Hospital Association 2014 Workforce Report Wisconsin Health Care Workforce 2014 Report Front cover photo courtesy of Stoughton Hospital Stoughton Hospital rehab staff Robert Komes and April Swenson
Christopher W. Blackwell, Ph.D., ARNP, ANP-BC, AGACNP-BC, CNE, FAANP Associate Professor & Coordinator
 Certification and Education as Determinants of Nurse Practitioner Scope of Practice: An Investigation of the Rules and Regulations Defining NP Scope of Practice in the United States Christopher W. Blackwell,
AJL Reporting User Guide
 AJL Reporting User Guide V O L U M E 1 WIOA, TAA, Case Manager, EEO, Provider, Self-Service, Miscellaneous, & Exit Reports America s JobLink Version 13.2 America s Job Link Alliance-Technical Support 1430
Minnesota s Licensed Marriage & Family Therapist (LMFT) Workforce, 2017 HIGHLIGHTS FROM THE 2016 LMFT SURVEY
 Workforce, 2017 HIGHLIGHTS FROM THE 2016 LMFT SURVEY") Minnesota s Licensed Marriage & Family Therapist (LMFT) Workforce, 2017 HIGHLIGHTS FROM THE 2016 LMFT SURVEY Minnesota s Licensed Marriage & Family Therapist (LMFT) Workforce, 2017 Highlights from the
Minnesota s Licensed Marriage & Family Therapist (LMFT) Workforce, 2017 HIGHLIGHTS FROM THE 2016 LMFT SURVEY Minnesota s Licensed Marriage & Family Therapist (LMFT) Workforce, 2017 Highlights from the
Master of Nursing (MN) Graduate Degree. Clinical Nurse Leader
 Graduate Degree. Clinical Nurse Leader") Master of Nursing (MN) Graduate Degree Clinical Nurse Leader Clinical Manual for Students 2016-2017 Reviewed and Approved August, 2016 Associate Dean for Research and Graduate Education Table of Contents
Master of Nursing (MN) Graduate Degree Clinical Nurse Leader Clinical Manual for Students 2016-2017 Reviewed and Approved August, 2016 Associate Dean for Research and Graduate Education Table of Contents
Health Professions Workforce
 Health Professions Workforce For the Health of Texas February 28, 2011 Ben G. Raimer, MD, MA, FAAP Past Chairman (1997-2010), Statewide Health Coordinating Council Senior Vice President, Health Policy