Table of Contents. Acknowledgments... Executive Summary... v. 1.0 Introduction Background Structure of this Report...
|
|
|
- Frederica Susan Kennedy
- 6 years ago
- Views:
Transcription
1
2 Table of Contents Acknowledgments... iv Executive Summary... v 1.0 Introduction Background Structure of this Report Data Project Implementation The Analytic File Methods Analytic Approach Derivation of the Current Model Approaches to Assessing Performance of the Model Findings Resource Use for the Clinical Model Performance of the Clinical Model Future Activities Refining the Case-mix Model Further Issues for Payment Policy Development References Appendices Appendix A: Appendix B: Appendix C: Appendix D: Appendix E: Appendix F: Appendix G: Appendix H: Data Collection Instruments The Diagnostic Model Clinical Model Terminal Node Statistics, Learning and Holdback Samples ICD9-CM Codes Used to Define the Diagnostic Groups (DGs) Valuing Home Health Resource Input: Opportunity Cost by Visit Type Weighting to National Estimates OASIS+ Inter-rater Reliability Study Regression Statistics for the Clinical Model Abt Associates Inc. Home Health Case-Mix Project: Second Interim Report, 9/24/1999 II
3 List of Tables and Exhibits Table 2.1: Agency Enrollment in the Home Health Case-mix Project, by Sampling Cell... 8 Table 2.2: Agencies Providing Data for the Analysis: Agency Characteristics... 9 Table 2.3: Distribution of Qualifying Start-of-Care Dates for Project Cohort...13 Table 2.4: Characteristics of Beneficiaries in the Analysis File at Earliest Assessment...19 Table 2.5: Distribution of Episodes, Payment Segments with > 4 Visits, Imputation, and Trimming in the Analysis File...20 Exhibit 2.1: Standardized Dollar Resource Costs, Segments 1 and 2, > 4 Visits...21 Table 3.1: Composition of Learning and Holdback Samples, by Episode Payment Segment Table 3.2: Disposition of OASIS+ Variables Considered for Measuring Clinical Severity...31 Table 3.3: Cognition and Resource Use...37 Table 3.4: Statistical Performance of Variables in the Clinical Severity Domain (Regression Analysis)...38 Table 3.5: Statistical Performance of Variables in the Functional Status Domain (Regression Analysis)...40 Table 3.6: Mean Cost Associated with Service Utilization Domain Variables...41 Table 3.7: Mean Costs and Scores Derived from Univariate Analysis...43 Table 3.8: Coefficients and Weighted Scores Derived from Regression Analysis...46 Table 3.9: Functional Status Domain Scores and Severity Categories...48 Table 3.10: Clinical Severity Domain Scores and Severity Categories...49 Table 3.11: Service Utilization Domain Scores and Severity Categories...52 Exhibit 3.1: Medicare Home Health Case-Mix Project Clinical Model Exhibit 3.2: Summary of the Clinical Model...55 Table 4.1 Mean and standard deviation of resource use for the entire model and for the Clinical Severity domain...60 Table 4.2 Mean resource use by segment >4 visits in learning sample: terminal nodes with 50 or more observations in segment 1 and in segment Table 4.3 Summary Measures of Fit for Initial and Second 60-day Episode Segments > 4 Visits...64 Table 4.4 Summary Measures of Fit for Initial 60-day Episode Segments > 4 Visits, by Agency Census Region...65 Table 4.5 Summary Measures of Fit for Second 60-day Episode Segments > 4 Visits, by Agency Census Region...66 Table 4.6 Summary Measures of Fit for Initial 60-day Episode Segments > 4 Visits, by Agency Type...67 Table 4.7 Summary Measures of Fit for Second 60-day Episode Segments > 4 Visits, by Agency Type...68 Table 4.8 Summary Measures of Fit for Initial 60-day Episode Segments > 4 Visits, by Urban/Rural Location...69 Table 4.9 Summary Measures of Fit for Second 60-day Episode Segments > 4 Visits, by Urban/Rural Location...70 Abt Associates Inc. Home Health Case-Mix Project: Second Interim Report, 9/24/1999 III
4 ACKNOWLEDGMENTS The authors acknowledge with gratitude the hard work and commitment of the many people who made this project and this report possible. First mention must go to the clinical and administrative staff of the participating home health agencies. They voluntarily invested vast amounts of time and effort to collect and submit data on thousands of patients and hundreds of thousands of visits that they received. They made this generous gesture on behalf of all Medicare-certified home health agencies to support the development of a case-mix adjuster for a home health prospective payment system (PPS). Our Project Officer at the Health Care Financing Administration, Ann Meadow, has worked tirelessly to help the agency implement its Congressional mandate to implement the PPS by FFY She has been an active partner and has given generously of her time to provide thoughtful review and helpful suggestions at critical moments along the way. The project staff at Abt, including site support staff Sarai Kopecek, Carolyn Robinson, and April Silva; data processing staff Gary Magil, Kathy Hill; and the Abt Associates Survey group (especially Louis Kiefor) have devoted many hours to supporting the sites in their data collection efforts and to seeing the data from raw forms or files to a clean and integrated analytic database. Staff at our subcontractors (Christine Bishop, Ph.D., at Brandeis University; Vince Mor, Ph.D., and Katherine Berg, Ph.D., at Brown University; and Mitzi Dean and Joe Hafkenschiel at the California Association for Health Services at Home ) have all made valuable contributions in their specific areas of expertise. Our work on home health prospective payment, and the development of the case-mix model, has spanned many years. It is gratifying to reach milestones on the way to full implementation, and even more so with the collaboration of such talented and dedicated colleagues. Abt Associates Inc. Home Health Case-Mix Project: Second Interim Report, 9/24/1999 IV
5 Executive Summary The Health Care Financing Administration (HCFA) has had a long-term commitment to work towards implementation of a per-episode prospective payment approach for Medicare home health services, and Section 5101(f) of Public Law , Omnibus Consolidated and Emergency Supplemental Appropriations Act for Fiscal Year 1999, mandates the implementation of such a system by FY2001. HCFA must develop a payment system which promotes provider efficiency while preserving access to services for patients with high care needs. The latter goal is attained by modifying payment amounts based on prospectively-set rates using adjustment factors which reflect the differences in the amount of resources required by patients of different types. This is typically termed case-mix adjustment. The formulation of accurate case-mix adjustment factors requires the ability to estimate the future resource use by each patient or by categories of patients. This document presents findings from a research project intended to develop such a case-mix adjustment model. This Project Previous efforts to develop a model that predicts home health resource use have had less than satisfactory results. This project was designed to improve upon past efforts by: Recruiting a large sample of agencies that could in turn provide a large representative sample of patients for the analysis; Collecting extensive and consistent data on patient, agency, and area characteristics; Collecting more detailed and consistent data on the services provided and resources used. The Agencies and the Patient Cohort. The study design called for recruitment of 90 home health agencies from 8 states, selected for diversity of location, home health practice pattern, distribution of agency type, and fiscal intermediary. A total of 290 agencies volunteered to take part, and a sample of 90 were selected to participate, stratified so as to optimize our ability to generate national estimates of patient distributions from the study. Two providers dropped out of the (voluntary) study before collecting data, so the findings are based on data from 88 participating home health agencies. The patient cohort includes all Medicare fee-for-service patients admitted to participating agencies during the first six months of its participation in the project. This translates roughly to October 1997 through mid-april Data on Patient Characteristics. The original procurement required the contractor to collect patientlevel data using the OASIS and any other data items deemed necessary for case-mix adjustment. The Outcomes and Assessment Information Set (OASIS) therefore provided the core of the primary data collection protocol used for patient assessment. However, since the OASIS was not intended to provide all of the data elements necessary to adjust prospective payment rates for case-mix differences, supplemental data elements were added. The task of supplementing the OASIS-B dataset was approached with Abt Associates Inc. Home Health Case-Mix Project: Second Interim Report, 9/24/1999 V
6 much concern over burdening home health agencies with too much data collection. Many of the items selected to augment the OASIS-B were based on the Minimum Data Set for Home Care (MDS-HC) (Morris et al., 1996a; Morris et al., 1996b). Using tested items from a validated instrument was a necessity on the project s expedited time frame, since no time was available for extensive item development, testing and revision. The final supplemented dataset includes 129 items and was named OASIS+. Resource Data. Additional data collection protocols were developed to capture information on the length of time spent by clinicians in the home, on selected services performed, and on events likely to affect the length of the visit. The visit logs were not intended to collect data on ALL activities performed in the home, only those that were likely to affect the length of the visits significantly. Project agencies were directed to collect data on every visit provided to a study cohort patient by each of the six Medicare-covered disciplines (skilled nursing; home health aide; physical, occupational and speech therapy; and medical social work). Estimated resource use for each Medicare-covered visit was calculated by multiplying total minutes by a national average wage for the appropriate discipline. Resource use was then summed over all visits in the relevant segment. This measure of resource use does not represent Medicare payment amounts; rather it is an estimate of the resource cost of time spent in the home. Other Data. In addition to assessments and visit logs, secondary data on cohort patients and agencies have been assembled from secondary sources, including Medicare enrollment files as well as claims for home health and inpatient services. Agencies have also provided information on the staff who serve cohort patients. Finally, data on agencies and the areas in which they operate have been obtained from the Medicare Provider of Service files, as well as the Area Resource File. Descriptive analysis of the agencies and the patient cohort were presented in the First Interim Report (Goldberg, Burstein, Moore et al., 1998). This Report This report summarizes our efforts to create a clinically useful and statistically predictive case-mix model, building on the exploratory analyses presented in the First Interim Report (Goldberg, Burstein, Moore et al, 1998). Chapter 1 reviews the background of the project, the need for a prospective payment system, and the implications of previous research related to patient classification systems and case-mix adjustment for home health. A brief summary of the implementation of the project and the development of the data which supports the analysis used to create the case-mix adjustor are described in Chapter 2. The process of developing the model and a methodological discussion of the measures used to assess its performance is detailed in Chapter 3. Chapter 4 presents the data on the performance of the model overall, and for subgroups of agencies of different types. Finally, Chapter 5 describes future activities under the project. Results of Case-mix Modeling Efforts The case-mix adjustor model which resulted from the project is a straightforward system combining 21 data elements to create easily understandable patient case-mix groupings. These elements are drawn from OASIS assessment items and additional variables that enhance the case-mix adjuster s predictive Abt Associates Inc. Home Health Case-Mix Project: Second Interim Report, 9/24/1999 VI
7 accuracy. The selection of these items was guided by statistical analysis, review of the literature, and consultation with home health clinicians, government policy experts, and researchers. The data elements measure three basic dimensions: clinical severity factors, functional status factors, and service utilization factors. Each possible value for each data element used in a dimension is given a score based on its observed relationship to home health resource use. Scores were developed through statistical analysis of the participating agencies data. Within each dimension, scores on assessment items are summed, and the resulting total is used to assign a patient to a severity category for that dimension. The case-mix model defines a set of 80 mutually-inclusive groups from all possible combinations of severity categories across the three dimensions (Exhibit A). The process of defining a structure for the case-mix model, and of selecting items for the dimensions, is described in detail in Chapter 3. The process of selecting items for the three case mix dimensions was not limited to statistical criteria for predictive accuracy, but also included qualitative criteria relating to policy objectives, incentives to provide good care, robustness against gaming, apparent item subjectivity, and administrative feasibility. The first case-mix model dimension is the Clinical Severity domain. It includes OASIS items pertaining to the following clinical conditions and risk factors: diagnoses involving orthopedic, neurological, or diabetic conditions; therapies used at home (i.e., intravenous therapy or infusion therapy, parenteral and enteral nutrition); vision status; pain frequency; status of pressure ulcers, stasis ulcers, and surgical wounds; dyspnea; urinary and bowel incontinence; bowel ostomy; and cognitive/behavioral problems, such as impaired decision making and hallucinations. This dimension captures significant indicators of clinical need from several OASIS subdomains, including patient history, sensory status, integumentary status, respiratory status, elimination status, and neuro/emotional/behavioral status. The second case-mix dimension is the Functional Status domain, comprised of six Activities of Daily Living (ADLs): upper and lower body dressing, bathing, toileting, transferring, and locomotion. These items are drawn from the ADL/IADL subdomain of the OASIS assessment instrument. The third case mix dimension is the Service Utilization domain. This dimension includes two kinds of data elements. The first is the patient s pre-admission location in the 14 days preceding admission to home care, taken from the patient history subdomain of OASIS. The second is receipt of home health rehabilitation therapies totaling at least 8 hours during the period of the home health episode itself. The data for this variable will come from the home health agency s service records. Ideally, the case mix system would rely on data elements that do not depend on treatments planned or received; however, we found this measure to be extremely powerful in explaining resource use, even after all other predictive patient characteristics had been included in the model. Defining the variable with a minimum of 8 hours of service was intended to exclude evaluation-only patients and to discourage provider manipulation of the system. In the sample analyzed, only 12% of all cases met this criterion. Including the therapy receipt variable in the case-mix system will also help to preserve access to therapy for patients with significant therapy needs. A summary of the classification algorithm is presented as Exhibit B. The current case-mix model performs well in terms of overall predictive accuracy. It explains 32% of the variation in resource use over a sixty-day episode. The episodes used for development of the model pertained to the first sixty days following admission; however, the model was subsequently tested on a sizable number of observations for subsequent sixty-day periods assembled from the study Abt Associates Inc. Home Health Case-Mix Project: Second Interim Report, 9/24/1999 VII
8
9 Exhibit B Summary of the Model Clinical Severity Domain - Clinical Model, >4 visits OASIS Description Value Scoring Item M0230 Primary home care If Orthopedic DG, add 10 to score min = 0-7 diagnosis If Neurological DG, add 19 to score low = 8-16 If Diabetes DG, add 16 to score mod = M0250 IV/Infusion/ If box 1, add 15 to score high = 27+ Parenteral/Enteral If box 2, add 20 to score Therapies If box 3, add 24 to score M0390 Vision If box 1 or 2, add 7 to score M0420 Pain If box 2 or 3, add 6 to score M0460 Current pressure ulcer If box 1 or 2, add 15 to score stage If box 3 or 4, add 43 to score M0476 Stasis ulcer If box 3, add 24 to score M0488 Surgical wound If box 2 or 3, add 10 to score M0490 Dyspnea If box 2, 3 or 4, add 5 to score M0530 Urinary incontinence If box 1 or 2, add 8 to score M0540 Bowel incontinence If box 2-5, add 11 to score M0550 Bowel ostomy If box 1 or 2, add 10 to score M0610 Behavioral Problems If box 1-6, add 3 to score Functional Status Domain - Clinical Model, >4 visits OASIS Item Description Value Scoring M0650 (current) Dressing If M0650 = box 1, 2 or 3 Min = 0-4 M0660 (current) or Low = 5-15 M0660 = box 1, 2 or 3 Mod = add 4 to score High = M0670 (current) Bathing If box 2-5 add 8 to score Max =36+ M0680 (current) Toileting If box 2-4, add 3 to score M0690 (current) Transferring If box 1, add 3 to score If box 2-5, add to 8 score M0700 (current) Locomotion If box 1 or 2, add 6 to score If box 3-5, add 13 to score Service Utilization Domain - Clinical Model, >4 visits Variable Description Value Scoring M0170 line 1 NO Hospital discharge past If box 1 IS BLANK, add 1 Min = days to score Low = 3 M0170 line 2 or 3 Inpatient rehab or SNF If box 2 or 3, add 2 to discharge past 14 days score Receipt of Therapy 8 or more therapy hours If yes, add 4 to score Mod = 4-6 High= 7 Abt Associates Inc. Home Health Case-Mix Project: Second Interim Report, 9/24/1999 IX
10 sample. The case-mix model explained approximately 30% of the variance for second sixty day episodes of patients in the cohort. Thus, we found that the explanatory power of the groups is quite similar regardless of whether the episode is the patient s first sixty days following admission or the subsequent sixty days (though most patients were assigned to a different case-mix group in the later period based on their clinical, functional, and service utilization characteristics at the start of that period). This statistical finding suggests that the case-mix model is inherently self-adjusting to changes in patient characteristics that predict resource use over a sequence of sixty-day episodes. As the accumulating data permit, we will test the model s explanatory power on later sixty-day periods. Future Work Future efforts will focus on additional analyses to support HCFA's development of the forthcoming PPS system based on an expanded data set after all projected data are received and the maximum matched sample can be used. In addition, we intend to pursue further refinements to the model, including the creation of customized clinical (and possibly functional) domains for various diagnostic categories in an effort to maximize explanatory power while minimizing the number of end points. Abt Associates Inc. Home Health Case-Mix Project: Second Interim Report, 9/24/1999 X
11 Case-Mix Adjustment for a National Home Health Prospective Payment System SECOND INTERIM REPORT September 24, 1999
12 1.0 Introduction The Health Care Financing Administration (HCFA) has had a long-term commitment to work towards implementation of a per-episode prospective payment approach for Medicare home health services, and Section 5101(f) of Public Law , Omnibus Consolidated and Emergency Supplemental Appropriations Act for Fiscal Year 1999, mandates the implementation of such a system by FY2001. HCFA must develop a payment system which promotes provider efficiency while preserving access to services for patients with high care needs. The latter goal is attained by modifying payment amounts based on prospectively-set rates using adjustment factors which reflect the differences in the amount of resources required by patients of different types. This is typically termed case-mix adjustment. The formulation of accurate case-mix adjustment factors requires the ability to estimate the future resource use by each patient or by categories of patients. This document presents findings from a research project intended to develop such a case-mix adjustment model. The patient classification algorithms presented here represent our efforts to date to provide models that are both clinically meaningful and capable of being translated into case-mix adjustors that are operationally and administratively feasible. Meanwhile, we are pursuing further refinements to enhance both statistical performance and clinical coherence of these models. 1.1 Background The move toward prospective payment for home health services emanates from several sources: the federal government's desire to contain rising health care costs, an Omnibus Budget Reconciliation Act of 1987 mandate to explore prospective payment as an alternative to cost-reimbursement, ongoing home health industry efforts for passage of legislation mandating episodic prospective payment, and the need to assure that Medicare beneficiaries receive the appropriate services to address their care needs. Concern for rising program costs was expressed in the HCFA Administrator's formation of the Home Health Initiative work group, a group tasked with assessing the home health benefit and its administration. Home care has become the fastest growing component of Medicare expenditures (Levitt 1994). Medicare spending on the home health benefit has grown from $2.12 billion in 1988 to $10.5 billion in 1993, and is projected to exceed $22 billion by the end of this century (Clauser 1994). The Medicare home health benefit covers part-time or intermittent skilled services such as skilled nursing and rehabilitative therapy to Medicare beneficiaries confined to their homes. Medicare currently reimburses participating HHAs for the reasonable costs incurred to provide covered visits to eligible beneficiaries up to cost caps established for each area of the country. Costs are reported on the Home Health Agency Cost Report form (HCFA-1728), which the provider submits to one of HCFA's eight contracted Regional Home Health Intermediaries for eventual settlement. The current system of reimbursing providers for incurred costs does not create incentives for agencies to provide care in a cost-effective manner. Current proposals for a prospective payment system for home health vary, but are all based upon the concept of a set rate for a pre-defined episode of care delivered. The lump-sum episode payment approach, designed to reward agencies who achieve efficiencies in care delivery, is currently being implemented in HCFA's National Home Health Agency Prospective Payment Demonstration (PPS demonstration). Abt Associates Inc. Home Health Case-Mix Project: Second Interim Report, 9/24/1999 1
13 There have been various studies exploring the rising costs of the Medicare home health care program, and discussions continue about how to balance the need for appropriate service delivery with the desire to prevent ongoing, inappropriate payment for care provided to beneficiaries who may not require home health services. HCFA is attempting to achieve such a balance in one way by moving toward mandatory use of a data-driven, outcome-based quality improvement strategy by all Medicare-certified HHAs, using data provided by the Outcomes and Assessment Information Set (OASIS) instrument. Variation in utilization patterns of home care is well-documented, but not well understood. Variability in home health use has typically been regarded as arising from patient-level, agency-level, and market-level factors. Patient characteristics associated with the number of visits, service intensity, or expenditures include age, gender, race, health/functional status, marital status, diagnosis, and service type needs (Benjamin, 1986; Williams et al., 1990; Kenney and Dubay, 1992; Branch et al., 1993). With regard to agency characteristics, patients in public agencies have been found to have lower numbers of visits per week, fewer weeks of care, and lower total charges for services. Patients of proprietary agencies had the highest numbers of visits and the longest episodes (Goldberg and Schmitz, 1994; Williams, 1994). Proprietary agencies appear to accrue higher levels of reimbursement by providing more visits at roughly similar charges per visit as other agencies (Goldberg and Schmitz, 1994). Several market-related and regional factors appear to influence the variability of home health service use and expenditures, such as the number of home health agencies per 1000 Medicare beneficiaries, the number of physicians per 1000 beneficiaries, number of nursing home beds, and higher Medicare reimbursement ceilings (Benjamin, 1986; Kenney and Dubay, 1992). Home health visit rates tend to be lower in areas where Medicaid nursing home use is case-mix adjusted, where Medicaid payment rates for nursing home stays are higher, or where there are relatively more comprehensive outpatient rehabilitation facilities (Benjamin, 1986; Mauser and Miller, 1994). Patients living in rural areas tend to have longer home health care episodes (Goldberg and Schmitz, 1994). Although much is known about the determinants of home health care service use and the variability of service delivery, there is little information regarding patient-level predictors of resource use by type of service utilized. A clear understanding of variations in the procedures and general content of home health care as episodes of care progress has not been reached. Inadequate exploration of the differences between home health patients and the content and duration of visits they receive inhibits further progress toward accurate prediction of Medicare beneficiaries' resource needs. Such a classification is necessary for movement toward a national prospective payment system for home care where payment is no longer linked directly to the volume or type of services provided. Case-mix adjustors are necessary in such situations to assure that providers will receive adequate reimbursement when serving patients requiring higher-than-average levels of service. Systems that classify patients into categories of resource need have been developed for use in a variety of care settings and are used primarily to refine payments. Home health case-mix measures developed to date (Foley et al., 1986; Manton and Hausner, 1987; Saba, 1991; Phillips et al., 1992; Branch and Goldberg, 1993; and Mauser, 1994) have not been very accurate. These disappointing results are the product of several factors, which continue to bedevil efforts to develop well-performing case-mix systems for home care: There is a high degree of intrinsic variability in the condition of patients, who may suffer in divergent ways from illness, frailty, or injury, either singly or in combination. The Abt Associates Inc. Home Health Case-Mix Project: Second Interim Report, 9/24/1999 2
14 ability of any objective measures to reflect this variation is probably inherently limited. Furthermore, the ability of patients at home to call on supports from family, community or other sources is similarly diverse and certainly varies with family composition, ethnicity, income, and location. Accurate measures of resource use in home care have not been collected. Most studies have used either a count of total visits or have used Medicare interim payments for visits as a proxy for resource use. Both methods have clear and widely recognized shortcomings since several brief visits may incorrectly appear to constitute more resource use than one extended visit. This project is among the first to address this longstanding weakness of earlier studies. An unknown, but perhaps substantial source of observed variation in resource use may have little to do with characteristics of patients or their environments, but instead may reflect differences in patterns of practice across provider types and geographic areas. Goldberg and Schmitz (1994) for example, found sharp differences between for-profit and not-for-profit agencies in the mean number of visits per home health episode. They also found pronounced effects associated with an agency's fiscal intermediary, even after controlling for census region and urban/rural location. Because they had only crude measures of patient status, they could not rule out the possibility that the differences were due at least in part to case-mix variations. Under cost reimbursement, providers have had no marginal incentive to be efficient. This may have led to variations in resource use that are unrelated to patient or agency characteristics. These considerations suggest that we must be reasonable in our expectations for any home health case-mix system and also provide a focus for efforts to improve on the current state of these systems. We know that if extant variation in resource use is subject to systematic organizational and regional 1 factors, then the portion explained by patient-centered case-mix will be lower as a result. It must be recognized, of course, that the data forming the basis for our analyses reflect home health agency practice patterns under Medicare's current cost reimbursement system. We expect that home health agencies will be attempting to maximize reimbursement for the services they provide, proprietary agencies seeking to generate profits for their owners, nonprofit agencies seeking to recover all of their costs and fulfill their charitable missions. This behavior will certainly shape service patterns (e.g., agencies may continue to provide and bill for skilled nursing services longer than strictly needed by the patient solely to allow home health aide services to be continued to be reimbursable by Medicare). 1 The findings presented in our First Interim Report (Goldberg, Burstein, Moore, et al. 1998) suggest that there is some portion of variation in resource use that is attributable to organizational and area factors which would depress the proportion of variation that can be explained by a patient-based model. The results also suggested that the power of a model would also depend on the inclusiveness of the concept of case-mix. If demographic and safety factors, for example, are considered case-mix variables, they could potentially enhance the explanatory power of a case-mix model. However, policy makers must decide whether these and certain other types of variables available on the OASIS assessment are appropriate for use in determining payment. Abt Associates Inc. Home Health Case-Mix Project: Second Interim Report, 9/24/1999 3
15 However, we are largely unable to isolate these effects, as our scope calls for analysis of service patterns for standard Medicare home health services under the current system rather than services provided under managed care or in other risk-based settings. It should be noted, however, that our patient intake cohort spans the implementation of the Interim Payment System (IPS), and may therefore reflect recent apparent changes in agency practice patterns. To control for this trend as much as possible, we have assured that all analysis samples include patients who were admitted both before and after this change. 1.2 Structure of this Report This report summarizes our development and refinement of the patient classification model, and our initial assessment of its performance. Chapter 2 documents the development of the data which supports the analysis, including a brief summary of the implementation of the project. Chapter 3 describes the process of developing the model itself, and also includes methodological discussion of the measures used to assess its performance. Chapter 4 presents the data on the performance of the model overall, as well as performance for subgroups of agencies of different types. Finally, Chapter 5 describes future activities under the project. Abt Associates Inc. Home Health Case-Mix Project: Second Interim Report, 9/24/1999 4
16 2.0 Data This chapter describes the development of the data base used to estimate the model predicting home health resource use. To provide an understanding of the derivation of the data, we briefly review the implementation of the overall project, including design of the data collection instruments, recruitment and training of participating home health agencies, data collection and data processing, and site support. (This information was presented in greater detail in the project s First Interim Report [Goldberg, Burstein, Moore, et al. 1998].) We then describe the process of merging all of this information into a file to support the analysis, including the procedures for dealing with missing data, and the definition of the home health episode and payment segment, which serves as the unit of analysis. Finally, to provide context for the reader, we present some summary statistics on the final analytic data base. 2.1 Project Implementation Project Implementation - Development of Data Collection Instruments Patient Characteristics. The original procurement required the contractor to collect patient-level data using the OASIS and any other data items deemed necessary for case-mix adjustment. The Outcomes and Assessment Information Set (OASIS) therefore provided the core of the primary data collection protocol used for patient assessment. However, since the OASIS was not intended to provide all of the data elements necessary to adjust prospective payment rates for case-mix differences, supplemental data elements were added. The task of supplementing the OASIS-B dataset was approached with much concern over burdening home health agencies with too much data collection. In order for assessment items to be included in the final dataset, they needed to be supported in the literature or elsewhere as being predictive of resource use and they had to be clinically meaningful items which were not duplicated elsewhere in the dataset. Based on a review of the relevant literature, as well as the assistance of clinical experts, items were added to the following OASIS-B domains: demographics and patient history; living arrangements; supportive assistance; integumentary status; elimination status; neuro/emotional/behavioral status; activities of daily living (ADL) and instrumental activities of daily living (IADL); and medications. No supplemental items were added to the domains of sensory status, respiratory status, equipment management, emergent care, and disposition. A twelfth domain was added to the dataset, entitled nutrition/hydration status, as nutritional status and the potential for dehydration are important predictors of poorer outcomes in the rehabilitation and nursing home literature. Many of the items selected to augment the OASIS-B were based on the Minimum Data Set for Home Care (MDS- HC) (Morris et al., 1996a; Morris et al., 1996b) Using tested items from a validated instrument was a necessity on the project s expedited time frame, since no time was available for extensive item development, testing and revision. The final supplemented dataset includes 129 items and was named OASIS+ (see Appendix A.) The OASIS+ was made available to participating agencies as OASIS+ forms, including the full OASIS+; OASIS plus-only forms, for use by those agencies which would collect OASIS-B items via an existing automated system (i.e., laptop or handheld clinical point-of-service data entry system) and conduct separate data collection of the supplemental items; and OASIS plus plus (OASIS++) forms, a more comprehensive patient assessment tool than the OASIS+. The OASIS++ was developed in order to facilitate the process of integrating the OASIS+ items into agencies existing assessment processes. The Abt Associates Inc. Home Health Case-Mix Project: Second Interim Report, 9/24/1999 5
17 OASIS++ began as an adaptation of the format which the Center for Health Policy Research (CHPR) supplied to agencies participating in HCFA s quality improvement demonstration. The instrument was refined based on review of agencies existing assessment forms and review and discussion of data requirements of entities such as the Joint Commission on Accreditation of Healthcare Organizations (JCAHO). To facilitate agencies efforts to integrate the OASIS+ items into their own assessment protocols, Abt provided electronic word processing files of all forms to agencies on request. Resource Data. Additional data collection protocols were developed to capture information on the length of time spent by clinicians in the home and on selected services performed and events likely to affect the length of the visit. Since existing typologies, such as Common Procedural Terminology (CPT) or HCPCS codes used for billing purposes, do not adequately identify the most common home health services that are likely to affect visit time, we needed project-focused instruments. The visit logs that were developed (see Appendix A) were not intended to collect data on ALL activities performed in the home, only those that were likely to affect the length of the visits significantly. Project agencies were directed to collect data on every visit provided to a study cohort patient by each of the six Medicarecovered disciplines (skilled nursing, home health aide, physical, occupational and speech therapy, and medical social work). Project Implementation - Agency Recruitment and Training In this section, we describe the process by which home health agencies were selected for recruitment, contacted and enrolled, and trained in project data collection procedures. This information is intended to enhance the reader s understanding of the sources of the data which were analyzed, and the procedures by which we sought to attain consistency and validity in the data supporting the analyses. Sample. The study design called for recruitment of 90 home health agencies from 8 states, selected for diversity of location, home health practice pattern, distribution of agency type, and fiscal intermediary. Because participation in the study was voluntary, it was not possible to assure a fully representative sample of agencies; instead, participants were recruited as a stratified sample to ensure that broad categories of agencies appear in the project sample. The sampling categories were : Agency auspice (4) freestanding for-profit; freestanding voluntary/private nonprofit; hospital-based; and government Geographic (census) region (4) northeast, north central, south, west Urban/rural location (2) MSA/non-MSA location Historical practice pattern (3) number of visits per episode in 1995 in the highest quartile for the region, in the lowest quartile, or remainder This yielded 96 potential sampling cells, though not all were actually populated by existing agencies. Since not all of these categories could be represented within a 90-agency cohort, the 90 slots were allocated across the cells in proportion to the underlying universe so as to require relatively similar weights for the eventual generation of national estimates. Abt Associates Inc. Home Health Case-Mix Project: Second Interim Report, 9/24/1999 6
18 A number of further eligibility criteria were applied to the universe of potential participants for substantive and administrative reasons. These included: location in one of the eight project states; unambiguous membership in one of the auspice categories specified above (based on data in the December 1996 POS file); active Medicare certification before July 1, 1993; must have provided home care to at least 50 Medicare beneficiaries during calendar year 1995; must not be participating in other HCFA demonstrations involving collection of OASIS data; must not have participated as a treatment (PPS) group agency in Phase I of the National Home Health PPS Demonstration. All Medicare-certified home health agencies were screened, and 1,797 eligible providers were identified. Recruitment. Agencies were recruited via a stepped process intended to provide agencies with gradually increasing levels of information, leading them towards an informed choice to participate in the project. This process included the following general steps (which took place on the schedule indicated): Initial informational mailing to all eligible agencies (April 2-3, 1997) Telephone follow up (April 11 - June 30, 1997) Group informational sessions in each project state (May 2 - June 12, 1997) Telephone follow up with interested agencies (May 3 - July 18, 1997) Signing of the Provider Participation Agreement (July 7 - July 18, 1997) Selection of participants from among all volunteers (July 18, 1997) Approximately 290 volunteers returned the participation agreement by July 18, We selected participants by a random selection process within each sampling cell, and we met the original sampling quota in 86 out of 90 instances; in four (of 77 populated cells), substitutions had to be made. The enrolled agencies were distributed across the sampling cells as shown in Table 2.1. Training. The initial training sessions were designed as train-the-trainer sessions, for a number of reasons. The primary intent of this educational approach was to create an internal resource within each agency and we requested that each agency designate a staff member to serve as the trainer and project liaison to Abt Associates over the course of the study. In addition agencies were encouraged to bring as many clinical staff as they could to the sessions to be trained firsthand--at minimum, the clinician trainer and one data processing/mis staff member. On average, each participating agency sent three individuals to training. A comprehensive Procedures Manual was developed to provide guidance on all project activities and on the interpretation of each assessment and visit log item. The manual included an overview of the project; copies of the assessment and visit log forms; item-by-item specifications; a chapter on reporting requirements and data submission requirements; a description of reports agencies would receive; and a section containing training techniques along with practice exercises and case study scenarios for staff to use. The manual was developed by Abt staff, with significant contributions from Brown University and the California Association for Health Services at Home (CAHSAH) on the item-by-item guidelines and case studies. Any clarifications or changes in procedures that arose after the initial training sessions were communicated to participating agencies as updates to the Procedures Manual. Abt Associates Inc. Home Health Case-Mix Project: Second Interim Report, 9/24/1999 7
19 Table 2.1 Agency Enrollment in the Home Health Case-mix Project, By Sampling Cell AGENCY LOCATION CENSUS REGION: NORTHEAST N. CENTRAL SOUTH WEST TOTAL Urban/Rural: Urban Rural Urban Rural Urban Rural Urban Rural Urban Rural Total AGENCY TYPE Freestanding forprofit H M L SUBTOTAL Freestanding nonprofit H M L SUBTOTAL Hospital-based H M L SUBTOTAL Government H M L SUBTOTAL TOTAL H M L TOTAL * H=top quartile visits/pt. 1995, M=medium visits/pt. 1995, L=bottom quartile visits/pt Almost 300 staff members from the 90 participating agencies participated in two-day training sessions in July and August of The agenda included an introduction covering the background of the project; development of the instruments; an item-by-item review of the instruments; the data management processes of the project; small group case study exercises; and the assignment of homework a clinical case study. Since training back at the agency was key to the success of the agency in the project, substantial time was spent discussing trainer techniques and learning activities. On the session evaluation forms, the participants rated the sessions an average of 4.7 (on a scale of 1 to 5) for accomplishing the goal of increasing the knowledge of meeting attendees, and 4.1 overall. Ongoing Participation. Over the course of enrollment and operations, there was some turnover in the cohort. Two agencies of those initially enrolled dropped out before active operations were begun; these were replaced in time for the replacement agencies to be trained. However, one of these, as well as one other participating agency, experienced overwhelming data collection difficulties and never submitted any data for the project. Therefore, the cohort of agencies with data included in the analysis is 88. A summary of the characteristics of these agencies is shown in Table 2.2. Abt Associates Inc. Home Health Case-Mix Project: Second Interim Report, 9/24/1999 8
20 Table 2.2 Agencies Providing Data for the Analysis: Agency Characteristics All AR CA FL IL MA PA TX WI #PROVIDERS % Rural 28.4% 69.2% 7.7% 0.0% 30.0% 16.7% 20.0% 28.6% 42.9% %Chain 22.7% 76.9% 15.4% 12.5% 20.0% 0.0% 20.0% 14.3% 0.0% % Provider Control a V/NP- Relig 11.4% 7.7% 15.4% 12.5% 20.0% 0.0% 0.0% 4.8% 42.9% V/NP- Private 23.9% 38.5% 7.7% 25.0% 20.0% 66.7% 30.0% 14.3% 14.3% V/NP - Other 8.0% 7.7% 7.7% 0.0% 0.0% 0.0% 40.0% 0.0% 14.3% PROP 38.6% 15.4% 38.5% 50.0% 50.0% 33.3% 30.0% 61.9% 0.0% GOV - St/Cnty 9.1% 30.8% 0.0% 12.5% 0.0% 0.0% 0.0% 4.8% 28.6% GOV - Local 9.1% 0.0% 30.8% 0.0% 10.0% 0.0% 0.0% 14.3% 0.0% % Provider Facility Type b VNA - Free 5.7% 0.0% 0.0% 0.0% 0.0% 16.7% 40.0% 0.0% 0.0% Official (Gov) - Free 8.0% 23.1% 7.7% 0.0% 10.0% 0.0% 0.0% 0.0% 28.6% Hospital-based 37.5% 38.5% 38.5% 50.0% 40.0% 33.3% 30.0% 38.1% 28.6% Other - Free 48.9% 38.5% 53.8% 50.0% 50.0% 50.0% 30.0% 61.9% 42.9% % Sampling Auspice b PROP - Free 38.6% 15.4% 38.5% 50.0% 50.0% 33.3% 30.0% 61.9% 0.0% V/NP - Free 15.9% 23.1% 15.4% 0.0% 0.0% 33.3% 40.0% 0.0% 42.9% Hospital-based 37.5% 38.5% 38.5% 50.0% 40.0% 33.3% 30.0% 38.1% 28.6% Government - Free 8.0% 23.1% 7.7% 0.0% 10.0% 0.0% 0.0% 0.0% 28.6% c Mean Number of Episodes Minimum Maximum Std Deviation CV A B C V/NP Relig = Voluntary/non-profit religious, V/NP Private = Voluntary/ non-profit private, V/NP other = Voluntary/ nonprofit other, PROP = proprietary, GOV St/Cnty = Government state or county, GOV Local = Government local. Free - Free standing (not facility-based) Episode = Admission through 120 days or until a 45-day gap after the 120th day. Sources: Health Care Financing Administration Provider of Services File, Standard Analytic Files (via DSAF). It should also be noted that, with the advent of the Interim Payment System and attendant pressures on home health agencies, a number of agencies have gone out of business or have withdrawn from the project prior to the end of data collection due to a lack of resources for ongoing data collection. As of December 1998, 7 agencies fell in this category. The data they submitted before leaving the project is included in the analysis. Abt Associates Inc. Home Health Case-Mix Project: Second Interim Report, 9/24/1999 9
21 Project Implementation Ongoing Operations There is an ongoing need for contact with participating home health agencies. This reminds agency staff that they are participating and that they need to follow project procedures, which in turn leads to more consistent data. It also allows project staff to learn of any developing problems at an early stage, so that they can be avoided or resolved before any serious damage is done. Contact with participating agencies is maintained through a range of activities. Abt site support staff review data submission reports for trends, following up with agencies on areas of concern, making telephone contact at least once a month if the agency has not been heard from, and helping agency staff understand the project data reports. Sites also receive a quarterly project newsletter and periodic Update Memos. In addition to the proactive site monitoring activities, Abt site support staff respond to a continuous flow of implementation questions from agencies by telephone and fax (via toll-free lines provided) and . Abt strongly encourages communication among agencies participating in the study. All agencies were provided with a list of contact information for the other participating providers, which is updated periodically. Abt also arranged two rounds of conference calls among the providers to serve as a forum for discussion of specific issues raised by participants, as well as sessions at the Annual Meetings of the National Association for Home Care (NAHC) where staff from participating providers who were already attending the meeting could assemble to meet each other and share experiences. Abt also supports an E- mail discussion group for participants. As a reward for participation, agencies receive quarterly outcome reports based on their OASIS-Plus data. These reports are modeled after those produced by the Center for Health Policy Research (CHPR), and were first disseminated to case-mix project agencies in May Agencies patients outcomes are calculated based upon the interval between the start of care assessment and the OASIS-Plus follow-up or discharge assessment date (whichever occurs first), and an individual agency s outcomes are compared to project agencies in their state, and to all agencies in the project. Project Implementation Data Management During project design and implementation, much emphasis was placed on data management procedures, in an effort to support agencies in the collection and submission of consistent and reliable data on patient characteristics and service use. This section summarizes these procedures in order to provide the reader with a better understanding of the data that went into the modeling analyses. Data Collection and Entry Assessment Data. Agency staff use the OASIS+ instrument to conduct assessments of all patients in the project cohort (i.e., fee-for-service Medicare patients with start-of-care date during the agency s 6-month intake period.) Participating agencies are also responsible for entering the data into an electronic data file using either the OASIS-Plus software or their own data systems. Data entry on site is required because it allows a computer program to edit the data and to report any errors so that they can be addressed before the data are submitted to Abt. Abt Associates Inc. Home Health Case-Mix Project: Second Interim Report, 9/24/
22 The project data management protocol calls for sites to submit a complete copy of their OASIS+ database to Abt at least once a month. This procedure assures that the project central database is synchronized with each site s database on a regular basis. Data Collection and Entry Visit Data. The visit logs were printed up in different colors to minimize the chances for confusion. The forms are designed for optical scanning of the activity boxes, and the agencies batch up the forms and send the originals directly to an optical scanning vendor. The scanning vendor verifies the shipment contents and contacts Abt if there are any discrepancies. The acceptable data are double entered and scanned, and the hard copy forms are sent to Abt, along with the electronic data files, for cleaning. Abt processes all visit log forms received from project agencies, and generates reports indicating the outcomes of this editing process. Agencies receive up to eight types of visit log processing reports, depending on the types of errors identified. When agencies receive the error reports and the associated hard copy logs, their responsibility is to review the problems, make any changes, and resubmit. Data Collection and Entry Staff Data. Participating providers submit data on every clinician who provides visits to a cohort patient. The information will be included in the final analysis in order to control for any impacts of staff characteristics on patterns of service and resource use. A module was added to the OASIS-Plus software to allow agency staff to enter this information. Data Collection Secondary Data. Since home health resource use is felt likely to be a function of patient characteristics, provider characteristics, and market characteristics, we have sought to include measures at all these levels in the preliminary analyses. To complement the data on patient characteristics, visit characteristics, and resource use that were assembled via primary data collection as described above, a variety of types of secondary data have been assembled for use. Data on patients collected by participating home health agencies was supplemented with data on Medicare home health and inpatient service utilization collected from HCFA s claims files. We also collected data on inpatient stays (hospital, SNF, rehab) during the 60 days before enrollment in the cohort and after enrollment. From HCFA s Enrollment Data Base (EDB), we collected data on cohort patients' vital status, enrollment in risk HMOs, and eligibility for Part A or Part B Medicare during the period following enrollment. Data on the characteristics of each participating provider were assembled in the course of developing the sampling frame for recruitment. These included data from HCFA s Provider of Service file (agency location, auspice (facility type and control), certification date, fiscal intermediary, etc.) as well as agency level summary measures developed from Medicare claims in the home health Standard Analytic File (SAF) for calendar 1995, such as total Medicare visits and visits by discipline, unduplicated beneficiaries and visits per unduplicated beneficiary. Contact with each agency during recruitment enabled us to add some additional measures, such as chain membership and proportion of total visits provided under managed care. 2.2 The Analytic File In this section, we describe the process that was used to convert the raw data collected by agencies and assembled from secondary sources into a unified database capable of supporting the project s analytic needs. While almost all of these data were describing characteristics or services related to specific patients, the information was assembled from a variety of sources and arrived bearing a variety of Abt Associates Inc. Home Health Case-Mix Project: Second Interim Report, 9/24/
23 identifiers, making the matching of data on each patient across sources a major challenge. Then, it was necessary for the raw resource data to be aggregated into an appropriate unit of analysis. To maximize the applicability of the model to the prospective payment system, it was necessary for the unit of observation in the analytic file to mimic as far as possible the unit of payment to be used in that system. However, since development of payment policy was in a dynamic developmental stage, collaboration with policy makers at HCFA was required to reach agreement on a file structure that would resemble the most likely system design. This structure of home health episodes and payment segments was then imposed on claims data collected under the current payment system, which sometimes required aggregating visits and costs within the new chronological framework. A series of algorithms was developed to accomplish this task. Also, comparison of data across sources within episodes sometimes revealed gaps in resource data, which had to be filled by retrieval or by imputation, for which more algorithms were developed. All of these processes are described in this section. Patient Samples for Two Successive Analytic Files. In using the information presented here to understand the analyses described in Chapters 3 and 4, it should be remembered that the project has gone through two waves of analytic file construction the first to support the analyses included in the First Interim Report (Goldberg, Burstein, Moore, et al., December 1998) and the more recent to support the analyses for this report. However, much of the model development described in Chapter 3 began soon after the submission of the First Interim Report and used the file which had been developed for it. This included 4,303 cohort patients who were enrolled in October through December The patients' resource use in the file was measured for the first 60 days from admission. This sample excluded patients who had home health care within the 30 days prior to admission, in order to reduce heterogeneity in resource use in the sample. The sample used to complete model development, as described in Chapter 3, was developed more recently and includes patients admitted throughout the project intake window (October April 1998). Therefore, some of the development analyses will have a sample size of 4,303 (the First Interim Report file), and others will reflect the more recent Expanded Learning Sample (n=10,570 initial payment segments) that was developed for this report. Final refinement of the model (as well as the validation described in Chapter 4) used a subset of the larger file that was limited to 60- day payment segments that included more than 4 visits. This subset consisted of 9,373 initial payment segments. All development analyses were conducted on initial payment segments (i.e., data from the first 60 days of care following admission). We subsequently tested our results on later 60-day periods, as reported in Chapter 4. Identifying the Project Cohort for this Report. The first step in file construction for this report was identifying the beneficiaries potentially in the project patient cohort. These were those beneficiaries with a Medicare home health start-of-care at a project provider during the intake window, i.e., the first six months of the provider s enrollment. These beneficiaries were identified via analysis of the Medicare claims for project providers processed through August 26, 1998, and home health admission data from Medicare's Enrollment Data Base (EDB) file. A total of 21,969 qualifying unique equated Health Insurance Claim (HIC) number-agency provider number pairs were identified. Of these, 502 were in providers that dropped out and/or provided no data; 30 were beneficiaries who had qualifying claims at two different project providers we kept the earlier admission and dropped the other; and 11 were cases that were dropped because the beneficiary had multiple HIC number anomalies. This left 21,426 unique provider-beneficiary pairs in the cohort. The distribution of the start-of-care dates for the potential cohort is shown in Table 2.3. Abt Associates Inc. Home Health Case-Mix Project: Second Interim Report, 9/24/
24 Table 2.3 Distribution of Qualifying Start-of-Care Dates for Project Cohort Month Cohort Beneficiaries October , % November , % December , % January , % February , % March , % April , % Total 21, % Linking the OASIS+ Assessment Data. The OASIS+ assessment information that had been submitted by agencies had to be merged with the records for cohort patients as defined using the claims data, which were considered to be our gold standard. While agencies were required to submit OASIS+ data on cohort patients, they submitted data on other patients as well. The OASIS+ data set included many potential matching keys (name, HIC number, gender, date of birth, start-of-care date, assessment date). However, given that the forms are completed by clinicians in the field and not necessarily reconciled with billing information, matching assessments to identifiers from claims was not always straightforward. This process was both aided and complicated by the fact that the OASIS+ data base record created by each agency for its patients consists of a person-level module including patient information that is not expected to change over time (last name, birth date, gender, agency patient ID) plus individual assessment records that include the assessment data plus some additional identifiers (such as Medicare HIC number, Medicare start-of-care date, state of residence). Therefore, a patient s record in the database can (and frequently does) include multiple versions of the HIC number. This is helpful, in that the agency has multiple opportunities to provide the correct HIC number which will match to the claims data, but it means that multiple identifiers must be checked for each patient, making the process more complicated. There were other complications as well. The lack of first name on the OASIS record (now remedied in OASIS-B1) had the result that sometimes the assessments for one beneficiary would end up attached to the patient record for another frequently a spouse or another person with the same last name. Iterative matching algorithms, and intensive manual review of potential matches, were used to untangle such situations and match OASIS+ assessment records to the claims/edb patient records. Of the 21,426 2 patients, 17,351 had one or more OASIS+ assessments that could be matched. Linking the Visit Log Data. Data on 768,391 visits that had been submitted by project agencies and processed by the August data cut-off also were available for matching to claims records. Eleven logs had an 2 Agencies are requested to submit the missing assessments. Abt Associates Inc. Home Health Case-Mix Project: Second Interim Report, 9/24/
25 unusable provider number and 2,146 had missing visit dates; these were excluded from further analysis, leaving 766,234 to be linked to the HHA claims data for the project providers. As a result of efforts to minimize the repetitive data collection burden on field staff, the visit logs included fewer matching keys. All attempted matches used agency provider number, discipline (skilled nursing, home health aide, etc.) and visit date (i.e., the log date falling during the period covered by the claim.) In addition, successive attempts to match were made using: exact HIC number as entered on the visit log against HIC number on the claim; exact patient number (medical record number) as entered on the log against patient number on the claim (and a few where patient number on the log exactly matched the HIC number on the claim); and where last name and initial on the log (as well as provider, discipline, and date) exactly matched the data for the patient in the Medicare Enrollment Data Base (EDB). Because of the presence of inaccurate data in the identifying fields on the visit logs, it was necessary to protect against false matching based on incorrect visit log data. Even with an exact match on one key field (besides provider, discipline and date), it was required that the rest of the key fields be compatible. To accomplish this, a spelling distance algorithm was applied to comparisons of all possible match fields. An exact match yields a spelling distance of 0; penalty points accrue according to the number, type, and position of errors, adjusted for the length of the fields being compared. Based on a manual review of spelling distances for non-matching fields, a scoring algorithm was developed to assign a match score to each of the potential matches: HIC, SSN, BIC, patient number (original or recoded), last name, and first initial. An exact match on HIC, patient number, or last name and first initial was assigned 30 match points. Close matches on these fields (determined by acceptable spelling distances) were given 5 to 20 points. Cases were run through the algorithm and grouped by score for manual review to set a cutoff match score (i.e., the point below which the reviewers felt a significant proportion of the matches were incorrect). A cutoff point of 50 match points was established, and a considerable number of visits were matched based on one exact match and one or more fuzzy matches. An additional 1,221 visits were matched to claims based solely on fuzzy criteria (that is, even though they had no exact matches on any key field). Ultimately, 588,846 logged visits were matched to claims for cohort patients. An additional 66,543 visits were matched to claims for non-cohort Medicare patients at participating providers, while 110,815 visits were not matched to any Medicare patient. Some in this latter category are likely Medicare (and even cohort) patients for 3 whom identifying information was not sufficient to make a match; the rest reflect agencies having their staff complete logs for all patients rather than having them worry about which patients visits get logged and which do not. Construction of home health episodes. The original plan for the project called for an evaluation of alternative definitions of the home health payment episode. Subsequently, the rapid pace of policy development required by legislative mandates for the implementation of PPS required that the basic outlines of the system be developed before these evaluations could be conducted. In order to provide timely support to HCFA policy makers, it became more efficient to conform our analytic activity to the emerging parameters of the PPS being developed at HCFA, using that single episode definition. 3 It should be noted that logs with any missing identifiers are returned to agencies for correction. Since we wanted to maximize the information available for this analysis, we attempted to match all logs that had been received, including those not yet corrected by the agency, using whatever data were available on them. Abt Associates Inc. Home Health Case-Mix Project: Second Interim Report, 9/24/
26 HCFA adopted a 60-day period as the episode definition. A 60-day period conforms to the regulatory time period under which HHAs have historically managed and projected home health care needs of beneficiaries. Specifically, current certification requirements for Medicare home health plans of care are based on 60-day horizons. The 60-day episode period also matches the reassessment schedule for OASIS, promoting parallel time frames for case-mix adjustment and quality reporting. Also, the 60-day episode captures the majority of stays experienced in HCFA's demonstration of episode-based prospective payment for home health care. For this report, therefore, the home health episode begins with an admission to home health, and is comprised of a series of 60-day payment segments, corresponding to the anticipated units of payment under the PPS. The episode concludes at the end of a payment segment preceding a 60-day period in which no home health services were received. Payment segments can be contiguous (day 1-60 following admission, day , etc.) or disjoint. The latter situation arises when the patient is discharged at some point during one payment segment (e.g., day 40 following admission) and is readmitted at a point time during the next payment segment (e.g., day 100 following the original admission). While these two payment segments are not contiguous, they are considered part of the same episode; however, the 60-day clock for the definition of payment segments is reset to the start of the disjoint payment segment. The episode ends when there is a full 60-day payment segment during which no home health services were provided by the home health agency i.e., the patient may be discharged during the current 60-day payment segment, but it cannot be determined that the episode ended until another full 60 days has passed (after the end of the current payment segment) without the receipt of further services. When the episode/payment segment logic was overlaid on the existing claims data for each beneficiary, payment segment boundaries (e.g., the 60th day following admission) could fall in the middle of the period covered by a claim. Since many of these claims were generated during the period before providers began submitting line-item home health bills showing the dates of each visit, an algorithm was needed to allocate visits to the two payment segments. The visit logs were the preferred basis for this allocation, since they described the same visits and provided individual dates. When the number of logs available for the period covered by the claim was equal to the number of visits on the claim, the number of logged visits (by discipline) falling in each payment segment were simply aggregated. When logs were not available for all visits on a claim, the proportion of logged visits (by discipline) that fell in each payment segment was used to allocate claimed visits to each payment segment. If no logs of the discipline were available to match the claim, the claimed visits were allocated in proportion to the total logged visits that fell into each segment. If no logs were matched to the claim, the claimed visits were allocated to segments in proportion to the number of the days covered by the claim that fell in each payment segment. Applying this logic to the home health claims available for the 21,426 cohort patients, a total of 22,103 episodes and 32,378 payment segments were created. There were some (452) payment segments that had zero visits. This was generally a result of applying the episode payment segment logic to existing data retrospectively. For instance, a home health patient could be admitted to the hospital on the 15th of a month. The home health agency may be expecting to resume services upon discharge, so they bill (on their normal schedule) to the end of the month (the 31st). Meanwhile, the 60th day of the payment segment could fall on the 20th of the month. Since the patient is still formally on service on the 21st, a Abt Associates Inc. Home Health Case-Mix Project: Second Interim Report, 9/24/
27 new payment segment is begun, even though no services are being provided. If the patient does not return to the agency after hospital discharge, the agency will discharge him/her, and that second payment segment will be left with no home health visits. The phenomenon of payment segments with zero visits could also be due to our use of visit logs to allocate visits when the claim is split across payment segments. If all of the visit logs that are available happen to be from the earlier part of the claim (that happens to fall into the first payment segment), all of the visits on the claim would be allocated to the earlier payment segment, leaving no visits assigned to the later payment segment, even though the period covered by the claim extends into that new payment segment. Dropping these vestigial payment segments left a total of 31,926 payment segments with claimed visits, an average of 1.4 payment segments per episode and an average of 1.8 payment segments per cohort member. Only 8,563 (26.8%) segments had services continuing into the following payment segment; in most, (23,363, 73.2%), services ended before the 60th day after admission. Of 9,823 payment segments that did not begin an episode, 8,110 (82.6%) began immediately after the end of the previous payment. The rest, (1,713, 17.4%) were separated from the previous segment by a gap of up to 58 days and were linked to the same episode only by the logic of disjoint payment segments. Medicare inpatient days (hospital, SNF, rehab) which had been obtained from Medicare claims were also allocated to payment segments. The availability of admission and discharge dates made this a more straightforward process. Imputation. The key outcome variable for the analysis is the measure of resource use during the episode of home health care. This measure is derived from minutes of care provided (from the visit logs) which are weighted with standardized hourly wage data (developed as shown in Appendix E.) If logs with usable time data were not available to match all visits on the claims, minutes were imputed using the log data available. Since previous analysis of visit log data had shown significant differences between the length of initial visits in each discipline (except home health aide) and subsequent visits, imputation values were developed on a patient/episode basis by calculating the length of a first visit and the length of a routine visit from visit logs available for each patient/episode for each discipline. Since logs could not be matched directly to individual visits on claims, a logged visit was deemed to be a first visit if it was the first logged visit by that type of staff member within the episode of care and if the log indicated that the visit included an initial assessment or a comprehensive reassessment. (Skilled nursing visits were required to occur on the start-of-care date.) All other logged visits within the episode were deemed to be routine. Some episodes had many routine visit logs but no first visit log, or a first visit log but no routine visit logs. In order to use the data on these patients, we first looked to see if that patient had another episode for which a first visit premium, by discipline, could be calculated. For each patient/episode with both types of visit logs, we estimated the average length of a routine visit, and then subtracted this value from the length of the first visit. This was our estimate of the incremental time required to Abt Associates Inc. Home Health Case-Mix Project: Second Interim Report, 9/24/
28 4 provide the initial visit of that discipline (within an episode) to that patient by that agency. To accommodate patients who had no other episodes, provider-level first visit premia were also calculated for each discipline by averaging all episode-level values within the provider. This result was our estimate of the incremental time required to provide an initial visit of that discipline (within an episode) to a typical patient by the agency. This information was then used to impute minutes for missing logs when the patient had no other episodes that could supply a value. Total minutes for each discipline within each payment segment was computed by summing the minutes from the visit logs that had visit dates during the payment segment. If there were as many logs as claimed visits in the payment segment but no initial visit logged during the episode, an initial visit premium was added to the minutes for the first payment segment with a claimed visit for the discipline. If there were fewer logged visits than claimed visits, the imputation values were used to estimate minutes for the missing logs. If there was an initial visit but no routine visits logged, the agency mean initial visit premium was subtracted from the actual initial visit time to impute a value for the routine visit(s). If there were more logs than claimed visits (which can occur when agencies document visits to cohort patients that are not billable to Medicare), the minutes for all logs were included. If a patient had claimed visits in a discipline but NO logs for visits in that discipline, data were imputed using provider-level mean visit lengths (for initial and routine visits). Only in the rare cases where there were no logs for a discipline for any patients at a provider was the variable set to missing. Ultimately, total resources were calculated for 31,725 (99.4%) of the 31,926 non-zero payment segments that had been created using the claims files. This is a significant improvement over the rate achieved when constructing the data base for the First Interim Report (59%), due to the submission of additional data by the sites, refinements in our matching algorithms, and more aggressive imputation. Trimming Outliers. After resources were calculated or imputed for all payment segments, analysis of the data revealed the presence of outliers in mean minutes per visit by discipline within payment segment. In cases with few visit logs available, values as low as two minutes or as high as 395 minutes were observed for mean visit lengths within disciplines. To avoid potential distortion of the analytic results, visit lengths in payment segments with outlier values (defined as the highest and lowest 0.25% of cases within each discipline) were replaced with agency-level mean visit lengths for the outlier discipline(s) (including an allowance for the initial visit premium as appropriate). A total of 335 segments (1%) were trimmed; mean total resources (standardized dollar resource cost) for 31,725 payment segments with valid resource data decreased insignificantly ($ to $445.98). Merging the OASIS+ Data. To develop the file to be used for analysis, the patient assessment data (OASIS+) had to be merged onto the segment-level file of data on visits and resources. In theory, every patient would have an OASIS+ assessment at admission, and a follow-up assessment every 57 to 62 days, which could be matched with each succeeding 60-day payment segment. In reality, because the 60-day follow-up assessment clock for each patient could be reset by intervening factors such as hospitalizations or home health discharges and readmissions, and because a few clinicians would conduct their follow-up assessments early in order to coordinate better with the process of recertification for billing, reassessments were not always conducted between 57 and 62 days after the original admission. 4 In a few cases where the patient s routine visits were actually longer, on average, than the initial visit, the premium was set to zero. Abt Associates Inc. Home Health Case-Mix Project: Second Interim Report, 9/24/
29 For the First Interim Report analysis, we used an OASIS+ assessment as the admission assessment if it was conducted within 31 days of the admission (plus or minus). For this report, the clinical staff wanted to use a tighter window, to reduce the likelihood of significant changes in patient condition (and service need) between assessment and start of care. Therefore, we accepted an OASIS+ assessment as linked to the start of the payment segment if it was conducted within 14 days of the start of the payment segment. Using this rule, 23,266 of 32,378 payment segments were linked with an OASIS+ assessment. (Of the remainder, 5,224 patients in the claims-based cohort had no OASIS+ assessments, while 3,888 had assessments but none falling within 14 days of the start of the payment segment. This latter figure s contrast with the First Interim Report file, where 97.7% of matched assessments fell within 14 days of the start-of-care date, is likely a result of creating second and subsequent payment segments retrospectively by imposing the 60-day payment segment structure on the data.) It should be noted that the OASIS+ assessments linked to non-initial payment segments were usually recertification assessments. Conforming to the OASIS-B protocol, these included only a subset of the OASIS assessment items. In order to be able to use these segments (approximately 14% of the total) in the modeling analysis, these gaps were filled with the patient's values for those items on the most recent previous start- (or resumption-) of-care assessment. Three OASIS variables were populated in this way when necessary: M Vision, M Principal Diagnosis, and M Utilization in the previous 14 days. Where possible, values for M0230 and M0170 were assigned based on Medicare claims. Defining the Final Analysis File. After all available data from all sources were merged, there were 17,272 beneficiaries (80.6% of the original 21,426) who had non-missing resource data as well as matched OASIS+ assessments for at least segment 1 of episode 1. In some cases, the OASIS assessment was missing one of the key variables needed for modeling, in which case it was excluded from the analysis, leaving 22,120 usable segments for 17,064 beneficiaries. At this point, an additional development in planned payment policy was integrated into the analysis. Specifically, HCFA determined that it would be undesirable from a policy perspective to issue a full episode payment for episodes with extremely low numbers of visits. This could create perverse incentives for agencies to extend patients stays just over the threshold into a new 60-day payment period, or to go to great lengths to admit evaluation only physical therapy patients. To neutralize these incentives, it was decided that perepisode payments will be limited to payment segments that include more than 4 visits; inlier segments, including less than 5 visits, will be paid on a per-visit basis. To calibrate the case-mix model to this subset of episodes (which corresponds to the subset of episodes to which the adjustor will actually be applied under the PPS), the final specification of the model and all final analyses were performed on a file that was limited to segments with more than 4 visits. The final statistics on the model that are presented in Chapter 3, and all of the tables in Chapter 4 that present alternative measures of model performance, are based on this subset of the analysis file, which includes 19,449 segments for 15,446 beneficiaries. Characteristics of the Analysis File. A summary of selected characteristics of the beneficiaries included in the analysis file of segments with > 4 visits is shown in Table 2.4, as well comparison data on all beneficiaries with matched data. As can be seen, the differences are small. Abt Associates Inc. Home Health Case-Mix Project: Second Interim Report, 9/24/
30 Table 2.4 Characteristics of Beneficiaries in the Analysis File at Earliest Assessment Unduplicated Unduplicated Beneficiaries - Segments Beneficiaries - With All Segments >4 Visits (N = 15,446) (N = 17,064) Mean age at assessment 77.7 yrs yrs. Pct. Female 64.6% 64.1% Pct. white 83.3% 83.1% Mean number of medications Pct. used services in past 14 days hospital 58.8% 58.9% rehab 11.4% 10.7% nursing home 6.2% 6.0% Pct. reported Medicaid as source of payment 7.1% 7.1% The total number of payment segments with complete data (>4 visits) for these beneficiaries and the prevalence of imputation, is shown in Table 2.5. Percentile values for estimated (standardized) home health resources consumed in payment segments 1 and 2 (>4 visits) is shown in Exhibit 2.1. (Episode is not shown since they were not distinguished in the subsequent analysis i.e., all payment segment 1's were pooled, regardless of episode.) Abt Associates Inc. Home Health Case-Mix Project: Second Interim Report, 9/24/
31 Table 2.5 Distribution of Episodes, Payment Segments with > 4 Visits, Imputation, and Trimming in the Analysis File Payment Episode segment Mean total Percent of Percent of sequence sequence Number of minutes segments using segments within within payment per provider-level affected by beneficiary episode 1 segments segment 2 imputation 3 trimming ,364 1, % 0.9% 2 2,722 1, % 1.2% , % 0.4% , % 1.0% , % 0.0% , % 0.4% % 0.0% Total 19,449 1, % 0.9% Number of 60-day payment segments with non-missing, non-zero resources, and matched OASIS assessment with complete data. Segments for which agency-level means were used to impute minutes. Does not identify cases where the provider-average initial visit premium was used to impute a value for cases with missing visit length data. See text for details on imputation. Segments with highest and lowest 0.25% values for mean visit length by discipline were reassigned agencylevel mean visit lengths for those disciplines. Abt Associates Inc. Home Health Case-Mix Project: Second Interim Report, 9/24/
32 Abt Associates Inc. Home Health Case-Mix Project: Second Interim Report, 9/24/
33 3.0 Methods This chapter describes the analytic process that was undertaken to develop a clinically meaningful case mix model. Initially, models were developed using an analytic file that included data on resource use during the first 60 days of episodes of care. (These were data on a convenience sample of 4,303 patients that was available to the project in mid-1998 and was used in the production of the First Interim Report.) Models and their components are evaluated during development based on their power to explain variation 2 in resource use (R ). The true ability of a model to explain resource use is measured using a separate holdback sample of episodes not employed in the model's construction. In Chapter 4 of this report, the final model is validated on a larger file of segments of care with more than 4 visits provided. To construct alternative case mix groupings, first, preliminary regression analyses were used to investigate the relative importance of various factors explaining resource use. Then, clinical judgment was used to identify and define clinically meaningful dimensions of case mix, factoring in findings from the literature and the results from the regressions. Alternative ways of measuring and constructing the dimensions and of relating them to one another in a decision tree were explored in consultation with both government and Abt clinical experts. Along with clinical considerations, policy implications of alternative variables or structures were also considered particularly the implications of alternatives for promoting improvement in health and Functional Status and the potential to make the adjuster vulnerable to manipulation for paymentmaximization. Another consideration was ease of implementing the system. If all of the case mix elements could come from the OASIS data set, then the data collection necessary for PPS would already be accomplished when agencies met the OASIS data collection requirements included in the revised Conditions of Participation. The resulting case-mix groupings, and their component dimensions, were evaluated and refined interactively with clinical, policy, and administrative input. Modeling efforts resulted in two different case-mix models, dubbed the Clinical Model and the Diagnostic Model, based on the dimension, or domain, at the top of the decision tree in each. There has been controversy regarding the relative advantages and disadvantages of a diagnostically-driven model. Proponents of this type of model believe that it more accurately reflects the way clinicians think about patients. It also has the potential to create more homogeneous patient groupings, thereby providing an opportunity to develop criteria customized for different diagnoses. There are several disadvantages of the diagnostically-driven model, however. One is that only a relative few diagnostic categories (notably orthopedic, neurological, diabetes, and skin wounds/lesions) result in a significant variance reduction, leaving many patients in an amorphous all others category. Another negative is that the use of diagnostic categories is problematic when dealing with a home care population which frequently has multiple diagnoses. It also inevitably leads to a model with a higher number of end-points that may make it more complex and difficult to use. In addition to being unwieldy for clinicians to use, it becomes more difficult to translate research results into relative weights when sample sizes for terminal nodes become increasingly small due to the proliferation of nodes. Ultimately, HCFA determined that the Clinical Model was the model of choice to enable implementation of the national prospective payment system by the legislation's effective date (October 2000). When that decision was made, further development efforts on the Diagnostic Model were suspended. At the point that we suspended development efforts on Abt Associates Inc. Home Health Case-Mix Project: Second Interim Report, 9/24/
34 the Diagnostic Model, it had 280 terminal nodes, or case-mix groups. The development and structure of the Clinical Model is described in detail below; the Diagnostic Model is described in Appendix B. 3.1 Analytic Approach Construction of Learning and Holdback Samples In order to produce the largest possible sample for the First Interim Report of July 1998, all data from the initial file construction effort were assigned to the learning sample. Under this strategy, a holdback sample was to be constructed later in the year, as new data became available. The First Interim Report therefore used all 4,303 episode payment segments initially available in the exploration of a case-mix model. This same sample of 4,303 payment segments was subsequently used for most of the development of the clinically-based case-mix model presented in this chapter. As this model was under development, the available sample of episode payment segments was augmented substantially. This expansion of the sample resulted not only from delivery of new visit logs and OASIS assessments from project agencies but also from continued efforts to improve the matching of logs, assessments, and Medicare home health claims. Comparisons of the initial sample of 4,303 segments with those payment segments constructed later revealed strong differences between the two and cast doubt on the validity of drawing a holdback sample solely from this later sample of payment segments. The mean number of Medicare home health visits per payment segment was found to be markedly lower in the newly created payment segments than in the initial 4,303 segments. This difference may very well reflect implementation of the Interim Payment System (IPS) for Medicare home health visits. Most of the initial 4,303 payment segments represent visits that occurred prior to the January 1, 1998, when IPS became effective for most of the project agencies, while many of the later segments capture visits and resource use under the IPS. Drawing the holdback sample entirely from this later collection of payment segments would create the potential for bias in evaluation of alternative case-mix systems because of systematic differences between the learning sample used to construct the systems and the holdback sample used to validate them. To protect against this possibility, the learning and holdback samples were redrawn after adding the newly available cases. After limiting the sample to segments with more than 4 visits (to conform with HCFA s intended payment policy, as described in Chapter 2), this new pooled sample consists of 19, day payment segments of care received by 15,446 distinct beneficiaries. These beneficiaries were randomly assigned to the learning or holdback samples in a 60/40 ratio. The number of 60-day payment segments in each sample is given in Table 3.1 below. After redefining the sample, remaining model development activities and model refinement were conducted on the initial 60-day segments of this learning sample (N=9,373). Refer to Chapter 4 for case-mix performance measures for both the learning and hold-back samples. Abt Associates Inc. Home Health Case-Mix Project: Second Interim Report, 9/24/
35 Table 3.1 Composition of Learning and Holdback Samples, Segments with Greater than 4 Visits, by Episode Payment Segment Learning sample Segment 1 9,373 6,263 Segment 2 1,664 1,072 Segment Segment Segment Total 11,674 7,775 Holdback sample Explanatory Variables Patient-level independent variables were derived from the OASIS+ assessments, visit logs and prior Medicare claims records. In selecting the variables that were considered as potential candidates for inclusion in a case-mix model, it was necessary to assess the appropriateness of each variable, its statistical performance, its clinical utility or meaningfulness, and the potential incentive effects or administrative burden particular variables may impose (Schneider et al., 1991). This was an iterative process, involving Abt Associates, HCFA staff, and home health clinicians who were consulted in October Further discussion of variables with accompanying rationale for their exclusion may be found in Section 3.2. Several examples of OASIS+ items which were excluded and the accompanying rationale are listed below. Appropriateness: Some patient characteristics would never be considered as a basis for payment because they are unacceptable from a policy perspective. For example, the OASIS+ variables of patient race and years of education were excluded, as were variables which reflected the social or physical environment in which a patient lives (e.g., unsanitary or unsafe conditions). Making payment differentials contingent on such characteristics may conflict with cultural values, such as equity, and would raise questions about incentives created by the payment system. Similarly, no classification system should discourage family members of home care patients from assisting them with their care. So although the presence or absence of a caregiver has been identified by some home-care clinicians as a significant influence on the need for home care services, the project team and HCFA agree that this characteristic should not be used to adjust payment for care. Caregiver variables may not only influence caregiver availability they also reflect social characteristics as opposed to the objective medical conditions upon which payment differentials ought to be based. We nevertheless investigated the explanatory power of caregiver variables when added to our model. They were only marginally helpful in predicting resource use. For discussion of these results, see Section 3.2. Incentive effects: Unintended incentive effects which could be attributable to a case-mix payment system would result from the inclusion of variables which reward providers for negative practice patterns, such as the use of a urinary catheter absent clinical need for such a device. These items are considered too easily manipulated, or gameable, by providers, and were excluded. Also, OASIS+ variables which were considered to be partially or fully controllable by Abt Associates Inc. Home Health Case-Mix Project: Second Interim Report, 9/24/
36 a home health agency were initially eliminated from the acceptable list of variables, despite the fact that some of them have considerable predictive power. Examples of these include the receipt of specific types of services such as physical therapy. The final case-mix model does include a variable which considers receipt of eight or more hours of therapy during the 60-day segment, since it was found to greatly improve the power to explain total resource use. Establishing an eight-hour threshold was felt to exclude assessment-only cases and assure that only patients requiring a substantial course of treatment would be included. Administrative criteria: After having done some initial modeling with the supplemental OASIS items ( plus items), HCFA instructed us to test the case-mix model(s) using only the OASIS-B items. Incorporation of the plus items in the case-mix model at this time would introduce the potential for increased home health agency data collection burden, while providing little increase in explanatory power. We reviewed the OASIS items to find substitutes for the plus items, and were able to replace most of them with little impact on the model. Similarly, the use of intervening hospital stay or other Service Utilization variables not collected via the OASIS-B assessment form were initially excluded whereas receipt of therapy was ultimately included. This decision reflected HCFA's judgment that the marginal predictive power to be gained from utilization variables other than therapy use was outweighed by the potential burden on agencies from such data collection. Not only would intervening hospital utilization variables not be known until the end of the payment period, in many instances the agency would not collect the information in the normal course of operations. The therapy receipt variable was the only Service Utilization variable whose contribution was strong enough to counterbalance the burden concern, and the variable would be known to the agency and always reported to HCFA under current plans for bill processing. Other criteria: In determining appropriateness for inclusion in the model, reliability, subjectivity, and transience criteria were also applied to OASIS variables. "Transience" refers to health status measures which may be brief in their occurrence or recurrence, such as "signs or symptoms present for at least 2 of the last 7 days" (C0160). This item, as well as food and fluid intake in the past three days (C0280/C0290) were considered to be transient and were excluded from analysis. Concerns about subjectivity arise when the lack of clear definitions of terms or guidelines for choosing among the response categories allows varying interpretations by clinicians. If case-mix variables address characteristics that appear subject to varying interpretation by assessing clinicians, the system could be vulnerable to manipulation by providers or patients. It was the belief of the project team that when payment increments are at stake, great care must be taken before accepting items even if they have been proved sufficiently reliable for other purposes such as quality assurance research. Examples of OASIS items assessed to be subjective include "severity of diagnosis" (M0230/ M0240). This item was met with varying interpretations by home health clinicians during and after our home health agency training sessions. Other items eliminated from consideration due to concerns about subjectivity include prognosis and life expectancy (M0260/M0270/ M0280), high risk factors (M0290) and psychosocial status indicators (C0190). One way to assess subjectivity is through reliability testing. Reliability refers to the consistency of scores when assessed by more than one rater. The reliability of a given item may be poor if that item introduces Abt Associates Inc. Home Health Case-Mix Project: Second Interim Report, 9/24/
37 the potential for subjective ratings by clinicians. An inter-rater reliability study, involving two clinicians completing an OASIS+ assessment on the same cohort patient within 72 hours of each other, was performed as part of the this project. The full text of the Interim Reliability Report can be found in Appendix G. Preliminary results from the first phase of the study indicate that all but two of the items included in the Clinical Model meet the Landis and Koch criteria for excellent (kappa greater than 0.75) or adequate (kappa values greater than 0.40) reliability (Landis and Koch, 1977). The report also indicates that several of the items eliminated due to concern about subjectivity had acceptable reliability scores. For example, severity of diagnosis had an overall kappa of 0.63 for all cases in which the clinicians agreed on diagnosis and the diagnosis was cardiac or respiratory. However, the kappa was only 0.29 when the diagnosis was listed as orthopedic, musculo-skeletal or neurological. It should also be noted that the inter-rater reliability findings are preliminary and based on a small sample size. The final results of the study will be available in the summer of In addition to reliability, manipulability is another problematic aspect of subjective items. When items are open to interpretation, it becomes easier to manipulate responses to maximize revenues. For example, when no specific guidelines such as body mass index are given to determine obesity and the response given affects reimbursement, there is a greater incentive to classify a patient as obese. This may be especially true for items which will not reflect negatively on an agency's outcome statistics, i.e., items such as prognosis or high risk factors for which no improvement is expected as a result of appropriate care. Exploration of Alternative Case-mix Grouping Systems Two general approaches were used in our exploration of case-mix groupings. In initial attempts to explore factors predictive of home health resource use, we adopted a data-driven strategy. Later, after input from HCFA, we embarked upon a more clinically-oriented approach to patient classification. This approach, combined with detailed review of the statistical performance of each candidate case-mix variable and some study of how variables performed in conjunction with each other, yielded a case-mix model that performs well statistically (see Section 3.2 and Chapter 4) and retains clinical coherence. In addition to using the project staff s clinical expertise in derivation of case-mix models, we have consulted with several other sources to determine how best to structure the model. We have reviewed the health services research literature on previously-developed case-mix classification systems and examined related clinical literature to better understand the interaction between various health status domains. Additionally, we received extensive input from HCFA clinical, research and payment policy staff, as well as some formal and informal feedback on our modeling efforts from practicing home health clinicians. All of these activities are described in detail below. Related Case-mix and Clinical Classification Literature. A host of payment-related research and demonstrations in the area of long term care have been devoted in the last decade to the appropriate classification of elderly who require institutional care, and by extension, to the appropriate case-mixadjusted payment for providers of institutional care (for Medicare beneficiaries and Medicaid enrollees). These efforts originated from several sources, including critics of fee-for-service payment systems, which they argued created incentives for over-provision of care and services as a means of maximizing revenues, rather than patient care (Weissert and Musliner, 1992). Models developed to date include the Diagnosis-Related Group (DRG) system, which, by design,...intended to represent groups of hospital Abt Associates Inc. Home Health Case-Mix Project: Second Interim Report, 9/24/
38 inpatients that are clinically similar to one another and relatively homogenous with respect to resource use (KPMG, 1995); and the Resource Utilization Group, Version III (RUG-III) system. This 44-group case-mix classification system was designed to capture the resource use (staff time) of nursing home residents (Fries et al., 1994), and has recently been mandated for Medicare skilled nursing facility (SNF) prospective payment nationwide. The classification system groups SNF residents according to a hierarchy of service need (e.g., rehabilitation services, clinically complex services), and has been noted to account for a high of 56 percent of the variance in staff time costs (Fries et al., 1994) to a low of 21 percent (White et al., 1998). The lower range of predictive power is attributable the reduction in the amount of across-category variance in costs when the resident sample is restricted to Medicare patients, which tend to have Medicare-covered stays which classify only into one of the top 26 RUG-III categories. Additional characteristics used to group patients under RUG-III include dependencies in activities of daily living (ADL), receipt of services such as IV medications, IV feeding and suctioning, and depression. Other models for describing and grouping institutionalized patients for either research purposes, casemix classification, risk adjustment or care and treatment have been developed. These include the nursing severity index (NSI), the Functional Independence Measure (FIM), the Acute Physiology and Chronic Health Evaluation (APACHE), and the International Classification of Disease Illness Severity Score (ICISS), among others. The NSI was developed as an instrument for predicting the in-hospital mortality rate and length of stay of hospitalized patients, and is based on a conceptual model that describes severity of illness in terms of physiologic alterations, physical and social functioning, cognition, nutrition, mood and social support. The nomenclature used for describing severity of illness in the NSI model is nursing diagnosis. The FIM classifies treatment and outcomes for rehabilitation patients, using a 7-level scale of independent performance in self-care, sphincter control, mobility, locomotion, communication and social cognition (Granger and Hamilton, 1992). The APACHE was developed for predicting survival and measuring acuity in medical intensive care units (ICU), the ICISS for use in classifying surgical ICU patients. These systems were reviewed as we considered how to categorize functional impairment, Clinical Severity, and other patient characteristics in our sample. Examination of such systems helped inform decisions regarding how to structure our model, whether to group patient characteristics via distinct domains of health status (e.g., functional v. clinical); whether to consider end-splits in groups for which such splits would produce clinical and statistical meaning (i.e., ADL end-splits, as the RUG-III system utilizes); the desirability of symmetrical v. asymmetrical models; and whether to create an indexing system or a categorical system. When referring to end-splits, we are referring to a mechanism in which branches are created from a terminal node with some clinical variable or set of variables in order to further define the patient group. For example, when considering issues such as cognition, we considered whether such variables would be more appropriately captured within a Clinical Severity or Functional Status domain, or whether they would provide more clinical meaning (or statistical power) if used as a binary split (i.e., yes/no cognitive impairment) after clinical and functional groups were established. Similarly, in our consideration of existing classification systems, we examined the clinical value of different structural and operational features of systems. The Nursing Severity Index, for example, adds points per each qualifying nursing diagnosis and sums to a total score. The total score, or index, reflects the patient s severity, with a total index of 34 reflecting the highest severity of illness. Unlike the NSI, the RUG-III classification system is a hierarchical system, with seven general categories (or domains) which are placed in general order of costs associated with caring for residents. The first category, or top split, is rehabilitation; the last is reduced physical function. As we reviewed these systems, we gave Abt Associates Inc. Home Health Case-Mix Project: Second Interim Report, 9/24/
39 consideration to which type of system seemed least complex for use by home health clinicians, most clinically-intuitive, and most feasible to operationalize, given the nature of the OASIS+ dataset. Exploratory Analyses Abt Associates' initial approach to the development of a patient classification system for home health care involved exploration of the statistical impact of OASIS+ data elements on resource use. For instance all allowable variables (i.e., those not considered likely to be unacceptable from a policy perspective) were evaluated using stepwise regression, which resulted in a benchmark regression equation with standardized resource use as the dependent variable. The benchmark equation (estimated on the 2 sample of 4,303 segments) achieved an R of Among the covariates identified as having the greatest predictive power for home health resource use were: preadmission location; certain acute conditions (orthopedic, neurologic, open wounds or lesions, diabetes); an ostomy; and dependence with respect to locomotion. Further regression equations were developed on the 4,303 segment sample, as described fully in the First Interim Report (Goldberg, Burstein, Moore et al., 1998). These included: Variation 2: Disaggregate Analysis: To incorporate information on whether agencies provided any services to patients for a given discipline, the linear regression approach was used to estimate separate equations of number of staff hours by discipline (skilled nurse, therapist, home health aide) for only those patients who received services of each type, using the same procedure as for the benchmark equation of total resource use. For those who received MSW services, we estimated provider-level mean amounts. Then, for the sample of individuals that had complete information (n=4303), we computed predicted total resource use as the sum across the four service types of predicted hours of care, weighted by relative wages for the types of care. The R-squared was computed from the sum of squared deviations from this predicted value and the actual value of standardized cost. This approach corresponds to our construction of the dependent variable in our aggregate approach. That is, total resources are derived from the sum of nurse time, therapist time, home health aide time, and speech pathologist time, each weighted by the appropriate hourly wage. This approach was expected to achieve a better fit to the data than the benchmark equation for two reasons. First, it uses information on whether any services of each type were received. Second, using a separate regression equation for each discipline better exploits the predictive potential of the available independent variables. Results: Using the disaggregate approach generated a marked increase in explanatory power relative to the benchmark equation, from 0.19 to Variation 2 incorporates actual information on whether patients received any services from nurses, therapists, home health aides, and medical social 2 workers. The R for the component equations of hours of care, restricted to patients who received each service, were not impressive (0.11 to 0.18). Substantial leverage was obtained, however, by assigning zeros to patients for individual components that they did not receive. This is the method used to incorporate information on use of individual types of service. The additional explanatory power achieved here foreshadowed the important role played by the Abt Associates Inc. Home Health Case-Mix Project: Second Interim Report, 9/24/
40 therapy receipt variable in the final Clinical Model. It should be noted that the equation for therapist staff hours performed best when using measures of ADLs based on patients performance in the past 7 days (i.e., the + items.) This made a difference of just over one percentage point in the explanatory power for that component. Variation 3: Expanded List of Patient Characteristics: We re-estimated the benchmark equation including the excluded patient-level variables, such as living conditions and characteristics of visits. Results: Variation 3 returned to the aggregate approach, but incorporated the expanded list of patient characteristics and visit descriptors. By so doing, it increased the percent of variance explained relative to the benchmark model from 0.19 to Among the added variables that had the greatest explanatory power were: patient lives alone; caregiver needed assistance with equipment; excessive non-task time spent during visits (especially staff members waiting); and events occurring during visits (especially staff members supervising aides or assistants). Variation 4: Area Characteristics: We broke out the variation in total resource use (or staff hours) that was associated with providers after patient-level characteristics were taken into account, and analyzed this variation independently. Results: When the benchmark equation 2 was run including provider indicators, an R of 0.27 was achieved, an improvement of 0.08 over the benchmark equation. Only 27 percent of the variation in these fixed effects coefficients 2 could be explained by area factors, however. Hence the appropriate R for this variation is ( ), or 0.21, and the net contribution of the area characteristics was.02. Variation 5: Expanded List of Patient Characteristics, Area Characteristics, and Agency Characteristics: Similarly, we re-estimated Variation 3 including provider indicators, and regressed the fixed effects on area and agency characteristics. Results: If agency indicators are 2 included in Variation 3, the R increases from 0.35 to It is notable that agency indicators add only 6 percentage points to explained variance in this expanded equation. The reason is undoubtedly that the visit descriptors that were already included (such as time spent waiting, occurrence of medical emergencies, etc.) captured much of the variation across agencies in total resource use, conditional on allowable patient characteristics. Area and agency characteristics 2 explained 26 percent of these fixed effects. Hence the R for this approach is ( ), or Looking at the second-stage (agency level) analysis, we again find that area utilization rates strongly affect total resource use: a one-visit increase in the state visits per Medicare home health user in a past year was associated with about $1.50 greater value for total resources supplied in the first sixty days of home health care. This responsiveness to state practice patterns was even greater for for-profit agencies, as shown by the large positive coefficient for the corresponding interaction term. This coefficient indicates that for-profit agencies supplied another 85 cents of resources for every additional visit per beneficiary in their states, even after all case-mix variables were accounted for. Abt Associates Inc. Home Health Case-Mix Project: Second Interim Report, 9/24/
41 Variation 6: Disaggregate Analysis Including Expanded List of Patient Characteristics, Area Characteristics, and Agency Characteristics: Finally, we predicted total resource use based on all available information considered to this point: receipt of any services from each discipline, allowable and excluded patient characteristics, and area and agency characteristics. The explanatory power of this approach represents the maximum attainable using a linear regression approach and the data elements available. Results: For our final variation, we used all possible explanatory variables to estimate total resources via the individual components. When only patient-level characteristics are used, the individual component equations had an 2 2 average R of 0.33, and on combining them an R of 0.45 is attained for total resources. This is 6 percentage points higher than the value for Variation 2, which used only allowable patient characteristics. Inclusion of provider indicators raises the percentage of variation explained to The discipline-specific analyses of the provider fixed effects, using agency as well as area 2 characteristics, explained 29 percent of the variance on average. So our estimated overall R for this approach is 0.47 (= ( )). Casemix Groups: A regression-based case-mix model may offer substantial predictive power, but fails to group patients according to recognized clinical categories and meshes poorly with the clinical diagnostic process. An alternative approach is to use a decision tree to classify homehealth patients into homogeneous groups requiring more or less home health care, based on clinically significant indicators. An initial exploratory decision-tree analysis was performed using CART (Classification and Regression Trees), a software package designed to build classification systems for medical, marketing and other purposes (see Breiman et al., 1984). Results: The data-driven CART analysis which used the same dependent variable (total resources used) and the same set of explanatory variables (allowable patient characteristics) as 2 the basic benchmark regression equation achieved an R of 0.23, with 20 groups. Its superiority to the benchmark linear equation is a reflection of its more flexible functional form. However, since this classification algorithm does not incorporate clinical logic, it is not discussed in detail. Clinically-driven Approaches to Case-mix Modeling In principle, regression equations could be developed into case-mix adjustment systems, but they have distinct drawbacks: they fail to group patients according to recognized clinical categories and may mesh poorly with clinical practice and logic. In order to develop a useful and acceptable system for home health clinicians, we embarked upon a more clinically oriented approach. This approach required that we identify the factors which home health and other practitioners recognize as significant when considering patient care needs, review the relevant literature on patient classification and health status measurement, and combine this information into a framework for classifying patients into homogeneous groups which require more or less home health care. We started by developing a list of questions which the project team s clinical staff might seek answers to when assessing a patient s need for services. What level of complexity, severity and instability characterizes the patient s clinical condition? How much and what type of assistance does the patient need with activities of daily living? Does the patient require special therapies or high-tech services? What cognitive impairments, behavioral characteristics, risk factors, and environmental conditions affect the amount and type of care this patient will require? In our efforts to identify these clinically significant Abt Associates Inc. Home Health Case-Mix Project: Second Interim Report, 9/24/
42 indicators, we were guided by the experience of our clinicians and by previous work in this field, including clinical comments reported in the NAHC (National Association for Home Care) 1997 Clinical Panel Case-mix Report, comments obtained by Mathematica Policy Research during that organization s case-mix modeling work, review of the literature and of the previously-cited case-mix classification systems (e.g., RUG-III, HHUGs). We then selected specific patient-level independent variables, derived from the OASIS+ assessments and prior Medicare claims records, that would provide us with the data for the selected clinically significant indicators. This list of variables was then subjected to the process of eliminating items which could become problematic for inclusion in a case-mix adjustor as mentioned previously (e.g., appropriateness/acceptability from a policy perspective, incentive transcience or subjectivity factors). See Table 3.2 for a list of the clinical variables initially considered for inclusion in the model and reasons for elimination. Table 3.2 Disposition of OASIS+ Variables Considered for Measuring Clinical Severity M age 85+ OASIS Item M recent treatment change M home care diagnosis M0230/240 - severity of diagnosis Eliminated - subjective C signs and symptoms* M IV /enteral/parenteral therapies M overall prognosis M rehabilitation prognosis M life expectancy M obesity M other high risk factors C psychosocial status indicators* C falls (frequency) M vision M hearing M speech M pain frequency M intractable pain C history of pressure ulcers* M pressure ulcer stage M pressure ulcer status M stasis ulcer status M surgical wound status M dyspnea M respiratory treatments at home M presence of urinary catheter M urinary incontinence Outcome of Analysis Eliminated - statistically insignificant and inversely related to cost. Eliminated - inversely related to cost. Related items (recent inpatient stay) integrated into the Service Utilization domain. Diagnoses in the Neurological, Orthopedic and Diabetes Diagnostic Groups were retained others were statistically insignificant and/or inversely related to cost. Eliminated - transient Retained in final model Eliminated - subjective Eliminated - subjective Eliminated - subjective Eliminated - subjective Eliminated - subjective and poor predictors of resource utilization Eliminated - subjective and poor predictors of resource utilization Eliminated - C0 item Retained in final model Eliminated - poor predictor of resource utilization Eliminated - poor predictor of resource utilization Retained in final model Eliminated - does not improve on variance reduction achieved by M0420 Eliminated (C0 item) - M0460 substituted Retained in final model Eliminated - did not increase predictive power over M0460 Retained in final model Retained in final model Retained in final model Eliminated - statistically insignificant and inversely related to cost Eliminated - potential for encouragement of negative practice patterns Retained in final model Abt Associates Inc. Home Health Case-Mix Project: Second Interim Report, 9/24/
43 Table 3.2 Disposition of OASIS+ Variables Considered for Measuring Clinical Severity OASIS Item M bowel incontinence M bowel ostomy M cognition M confusion M behaviors C decreased food intake* C insufficient fluids* Retained in final model Retained in final model Outcome of Analysis Eliminated - statistically insignificant in regression analysis Eliminated - statistically insignificant in regression analysis Retained in final model Eliminated - transient Eliminated - transient C number of medications* Eliminated (C0 item) - substituted M0780 and M0800 which were subsequently eliminated in final Clinical Model due to statistical insignificance in regression analysis and concern about provider manipulation *Note: Some of the supplemental C0 items were eliminated early in the development process due to concerns about their appropriateness for inclusion due to transience, or subjectiveness. Others were eliminated when it became apparent that too few C0 items remained in the variable list to justify the additional administrative burden of adding C0 items to the OASIS. Of these, all but C0200 (falls) either were replaced by OASIS ( M0 ) item substitutes or were found to be statistically insignificant. We used PC-Group, another decision tree program, to assist us in creating a model using the selected variables. Like CART, PC-Group is used to create decision trees whose terminal nodes may be regarded as case-mix groups. It does not, however, use a computer algorithm for construction of a grouping system. Instead, the analyst grows the tree interactively. It is this ability for the clinician to intervene in the selection and division of nodes that makes PC-Group particularly attractive for construction of casemix groups. PC-Group was used extensively in the construction of the RUG-III classification system for nursing homes. 3.2 Derivation of the Current Model Grouping Variables into Domains In our exploratory attempts at using PC-Group, it became apparent that using each of the potential OASIS variables independently would result in a decision tree with hundreds of end points, making it unmanageable and ultimately impractical. With this in mind, we decided to arrange the variables into the following domains: Clinical Severity; Functional Status; and Service Utilization. Our hypothesis was that patients who had the greatest degree of Clinical Severity, the most severe functional impairment, and the greatest need for rehabilitation and other services would utilize the most home health care resources. In response to comments from clinical experts at HCFA, we also created a diagnostic domain consisting of the home care diagnoses which our data showed were most predictive of resource use. In our attempts to improve the clinical utility and explanatory power of the patient Abt Associates Inc. Home Health Case-Mix Project: Second Interim Report, 9/24/
44 classification models, we experimented with many variations of each domain, adding and removing items and examining their effect on the way the models functioned. The Clinical Severity Domain Table 3.2 shows OASIS+ variables which were considered to be indicators of clinical status and potential predictors of increased resource use. As described earlier, candidate variables were assessed against criteria such as statistical performance, administrative or operational concerns, clinical meaning, appropriateness for use in a payment system, or other criteria such as reliability or transience. Several items were eliminated because, either in discussions with HCFA or in feedback from clinical experts who reviewed the models, it became apparent that the items were considered too unreliable due to subjectivity. An example of this is obesity. Although clinical opinion indicated that obesity impacts need for home care services and univariate analysis of the data showed that this item was a good predictor of resource use, feedback from expert reviewers confirmed our concerns about the subjectivity of the item as worded in the OASIS. Further, due to the difficulty encountered in obtaining weights on many home care patients, it was decided that simply improving the wording in the OASIS tool and providing guidelines for obesity would not be sufficient. The elimination of this variable resulted in an insignificant drop (less 2 than.01) in the R achieved by the domain. Other items eliminated due to transience or subjectivity include symptoms such as dizziness and edema (which are included in item C0160; see Appendix A.) Presence of a urinary catheter was the only item in the Clinical Severity domain eliminated specifically due to concern about the potential negative incentive effect (e.g., by offering an incentive to leave a catheter in place when it was no longer clinically necessary). An administrative decision was made to eliminate the plus (C0) items which the project team had added to the OASIS-B. It was decided that the insubstantial advantage in explanatory power provided by the C0 items did not justify the operational burden that adding these items to the OASIS-B1 would impose. Several clinical variables which had initially been assessed by examining C0 items (history of pressure ulcer and urinary incontinence) were replaced by similar M0 items with no loss of predictive power for the domain. There was one C0 item, however, that was statistically significant for which no M0 proxy could be identified: the number of falls in the last 180 days. The removal of this item from the model resulted in a loss of approximately one point of variance reduction. Finally, variables which were not eliminated by concerns about their transience, subjectivity, potential for negative incentive effects or for administrative reasons, were assessed for statistical significance. Initially, univariate analysis was used to test the predictive value of each variable. Subsequently, 2 candidate variables were tested to assess their impact on the R of the domain to which they were assigned (e.g., variables describing ADL impairments were tested for their impact on the Functional Status domain). We used PC Group for these analyses, which involved assessing the contribution of a variable to the explanatory power of the domain, given that the other variables already included in the domain were also helping to predict resource use. This was done for the sake of efficiency, since it would have been too time-consuming to retest the entire model each time a variable was added or eliminated. It is improbable that a variable that had little impact on the variance reduction of the domain would have increased power when tested on the entire model. The inverse was sometimes found to be true, however, Abt Associates Inc. Home Health Case-Mix Project: Second Interim Report, 9/24/
45 with variables which appeared to be significant becoming weaker when their impact was measured on the entire model. This is most likely due to collinearity among the dimensions of the model. During the model refinement stage we turned to least-squares regression analysis to obtain improved measures of predictive value. We used the regressions to measure the relationship between resource use and the clinical variables which had been identified up to that point in the analysis as predictive of resource utilization. The technique of multivariate regression enabled us to control for all the clinical variables simultaneously and to quantify the independent contribution of each item to resources used and thus to establish more accurate scoring. In particular, multivariate regression determined whether certain items were redundant (once other items were taken into account) or whether there were synergies among items - for example, whether urinary incontinence (though generally requiring additional resources) had no marginal effect among those who also suffered from bowel incontinence. To be usable for the analysis, the clinical items had to be translated into indicator variables. Clinical judgment was used to combine categories for example, a clinician suggested that the Stage of Most Problematic Pressure Ulcer item could be captured in three indicator variables: no observable pressure ulcer; stage 1 or stage 2 ulcer; and stage 3 or stage 4 ulcer. During the refinement process using regression, statistically insignificant variables were removed, and initial variable translations were revised so that the regression coefficients and hence the regression-based scoring would make sense clinically. Based on the regression results, we made final decisions about variable inclusion based on statistical significance tests (i.e., t-values). Variables not significant at the 5% level (i.e., t-value of at least 1.96) 5 were eliminated from the Clinical Severity domain. (Another use of the regression was to refine the system of scores for variables in each domain; this scoring system is explained below.) Diagnosis as a Predictor of Resource Use. In response to feedback from clinicians at HCFA, we investigated using diagnostic categories in our framework for model construction. Much has been written on the relationship between the effect of multiple illnesses or comorbidities and outcomes such as functional impairment and mortality. As mentioned earlier, the hospital PPS system is based upon a case-mix classification system driven by patient diagnosis.... Common age-related conditions such as cerebrovascular disease, heart disease, and hip fracture have been found to be associated with functional dependence (Giuccioni et al., 1994). A recent study of an elderly population attributed percent of the difficulty in climbing stairs, walking, and carrying bundles to osteoarthritis of the knee, stroke, and depressive symptomatology (Freedman and Martin, 1998). We have also noted that home health nurses frequently refer to patient diagnosis as a predictor of service delivery, and began to examine certain diagnostic groupings as a way to classify patients. One concern arising when considering diagnosis is the reliability of the primary diagnosis recorded by home health nurses on the OASIS+ (M0230). This item was met with much confusion by participating home health nurses, both during and after formal training. There are several possible explanations for the varying interpretations regarding appropriate diagnostic coding among home health nurses; however, most center on the competing forces of administrative v. clinical care needs. Specifically, agencies 5 See Table 3.4 for the definitions and t statistics of each variable in the final clinical regression. The final regression model is presented in Appendix H. Abt Associates Inc. Home Health Case-Mix Project: Second Interim Report, 9/24/
46 struggled to provide a primary diagnosis which was both acceptable to the fiscal intermediary, in order to justify Medicare coverage, and to the case-mix project s OASIS item which requests an underlying medical diagnosis for which the patient is receiving services. Many stated that the primary diagnosis they would ordinarily record under M0230 would be the same as that recorded for Medicare insurance purposes, which was a diagnosis that they had either been instructed by the intermediary to record, such as a procedure code to justify visits for rendering treatment or a 5-digit code to specify the diagnosis and its severity (e.g., uncontrolled insulin dependent diabetic - ICD-9-CM code ), and/or that their supervisors believed would be Medicare-covered. Such a diagnosis would not only be unacceptable for this data collection effort (since the tool does not accept 5-digit or V-codes), but may not reflect the underlying condition for which the patient required home health treatment. For example, agency nurses described great familiarity with documenting procedure codes for treatment of wounds; however, the identification of the clinical or medical process which led to the development of that wound or the need to care for that wound (e.g., osteoporosis as the underlying condition which led to the surgical procedure and resultant surgical wound) did not appear to be part of the customary home health patient assessment. In the first phase of preliminary inter-rater reliability testing performed by clinicians in the case-mix project, there was agreement in 76.6% of cases on the primary diagnosis, but given the large number of diagnoses, no attempt was made to compute a kappa statistic on this variable. Since the decision was eventually made to include primary diagnosis in our case-mix models due to its predictive value, we will continue to examine the reliability of this item in particular and consider potential training strategies to improve its reliability. The full text of the Interim Reliability Report can be found in Appendix G. In developing a model which incorporates a diagnostic domain (the Diagnostic Model), we initially used CHPR s Quality Indicator Groupings (QUIGs) as the basis for our diagnostic groups. For QUIG definitions, see Exhibit C in our First Interim Report ( Goldberg, et al., 1998). After initial investigation of this approach, we decided to create groups that contained the diagnostic parameters of the QUIGs but produced diagnostic groupings more appropriate for home health use, which we labeled Diagnostic Groups (DGs). In order to create the DGs, the following steps were taken: removing the requirement for inpatient treatment in the past 14 days (a variable which is already accounted for in the Service Utilization domain) obtaining the primary diagnosis from M0230 (primary home care diagnosis) rather than M0190 (inpatient diagnosis) or M0210 (diagnosis after medical or treatment regimen change) eliminating diagnoses which are likely to be unreliable correlates of home health use. For example, osteoarthritis when coded in the community often encompasses an extremely broad range of clinical symptomatology and impact on Functional Status and need for care. We decided to drop this diagnosis to protect the integrity of the orthopedic diagnosis category as a marker for cases with a need for significant clinical resources (see Appendix D for a list of the diagnoses in each DG). eliminating the requirement for receipt of psychiatric nursing for the Psychiatric DG and substituting the major psychiatric diagnoses. In all, six different Diagnostic Groups (Neurologic, Orthopedic, Diabetes, Open Wounds/Lesions, Psychiatric, and Cardiac/Vascular/Pulmonary) were initially found to be predictive of resource use. Only Abt Associates Inc. Home Health Case-Mix Project: Second Interim Report, 9/24/
47 the Neurologic, Orthopedic and Diabetes DGs were found to have sufficient predictive value to be included in the Clinical Severity domain used in the Clinical Model. Environmental, Cognitive, Sensory and Behavioral Variables. When clinically intuitive modeling was first initiated, a domain containing environmental factors such as the safety and sanitation of the patients' physical surroundings was considered. The domain was eventually dropped, however, because they were considered to be highly subjective and potentially prone to manipulation by providers. For example, M0320 (Safety Hazards) has response categories for inadequate lighting, heating, and cooling which could be defined differently by different clinicians. The lack of clear guidelines for these items results in a high potential for manipulation by providers. In addition, statistical testing of the explanatory power of the domain demonstrated that these variables were of no significant value in the prediction of resource use. In response to feedback from clinicians who reviewed earlier iterations of the case-mix model, an attempt was made to integrate measures of cognitive, sensory and behavioral impairment which affect resource use. Neurological, cognitive, sensory and behavioral (NCSB) variables in the OASIS tool which were identified in univariate analysis as indicators of resource use are: M0390 (vision), M0400 (hearing), M0410 (speech), M0560 (cognition), M0570 (confusion) and M0610 (behaviors). Early attempts to integrate these variables into the model, either as part of the Clinical Severity domain or in a separate domain, were problematic. A domain consisting solely of the NCSB variables was created; 2 it explained 1.5% of the variance in the overall sample (i.e., R =.015). However, the highest degree of cognitive impairment was not consistently related to the highest mean costs. In addition, the interplay between the NCSB measures and the other domains of the model is complex. Analysis of the data showed that patients who had a moderate to high clinical severity actually had a somewhat lower mean cost when they had high NCSB impairments than when they did not. Consideration of functional status also caused the resulting terminal nodes of the decision tree in the full model to become counterintuitive (that is, higher impairment was linked to lower costs). We theorized that this is due to several factors. First is that there is a high collinearity between the NCSB variables and both the Clinical Severity and Functional Status domains, so that the majority of the effect on home health resource use due to NCSB impairment is already captured by the clinical and functional variables. We also postulated that patients with high NCSB deficits are so impaired they may not receive high cost therapies, or they may spend more time in an inpatient setting, resulting in a shorter home care stay, and/or that they may remain in their homes only with extensive support aside from home care. Table 3.3, below, documents this relationship between Cognitive Functioning (M0560), supportive assistance, days in inpatient settings and therapies received. Since increasing levels of severity of the NCSB variables as a group are not consistently associated with increased resource use, we did not attempt to utilize them as an independent domain. Using data from regression analysis, however, we were able to integrate M0390 (vision) and M0610 (behaviors) into the Clinical Severity domain in a way that did not produce counter-intuitive cost groupings. The remainder of the NCSB variables were determined to either be of questionable reliability, poor predictors of resource use, or to be inversely related to cost, and were eliminated from the model. Abt Associates Inc. Home Health Case-Mix Project: Second Interim Report, 9/24/
48 Table 3.3 Cognition and Resource Use M0560 N Standardized Mean Mean Mean Receive non- Mean Inpt (Cognition) Mean Cost number number number HHA help LOS (univariate) therapy skilled aide several times (hospital, hours nurse hours per day or rehab+snf) hours more (M or 2) in 60-day segment Alert 7081 $ % 11.4 Occasional 1847 $ % 12.0 Prompting needed Some 902 $ % 13.3 assistance needed Considerable 413 $ % 14.0 Assistance needed Total 170 $ % 18.9 Dependence Note: analysis performed on expanded learning sample, constructed from 10,570 initial 60-day payment segments, including both segments with more than 4 visits and those with 4 or fewer visits. Caregiver Variables. From the early exploratory phases of case-mix modeling, variables examining whether the patient had supportive assistance from non-home health agency sources (family, friends or the community) were considered non-allowed. This was due to concern that having home health payment based in part on the willingness of these supports to assist in the patient s care might actually serve to discourage these supports from participating in the patient s care. However, initial feedback from home health clinicians on the case-mix model included concern that we would not be capturing the variation in resource use due to patients' lack of non-agency supportive assistance. In order to determine whether the predictive power of variables related to caregiver presence was sufficient to counter concerns regarding inclusion of these variables, we examined the effect of these variables on the model. A simple comparison of segments in which the patient did have supportive assistance from a non-agency caregiver with those that did not, found no difference in mean standardized costs between the two groups. Our hypothesis regarding this is that patients who are able to remain in the home without a caregiver are inherently less impaired and more able to provide self care than other home care patients. In examining the issue further, however, we were able to define three variables from M0350, M0370 and C0230 that had sufficiently significant coefficients and t-values in regression analysis to warrant further investigation. The first is patients who receive assistance from a caregiver on less than a daily basis (M0370, response categories 4-6). These patients had a mean cost $27 greater than patients who received at least daily assistance (t = 2.32). Patients who had a caregiver who was distressed or not satisfied with support received (C response category 2 or 3) had a mean cost $23 greater than those whose caregivers were not distressed (t = 1.31). Analysis also showed that patients who were described as having a caregiver who was unable to continue in caregiving activities (C response category 1) have a mean cost $79 greater than those that did not (t = 4.82). However, when we tested these variables in the Abt Associates Inc. Home Health Case-Mix Project: Second Interim Report, 9/24/
49 model to see how they would interact with those in the Clinical Severity, Functional Status and Service 2 Utilization domains, the R for the model increased by less than.01. It was the determination of both the project team and HCFA that this small improvement in variance explanation is not sufficient to warrant including these variables, due to their potential for discouraging family members and friends from assisting homebound patients. Summary of Statistical Significance As described previously, clinical items initially identified as significant via univariate analyses were translated into indicator variables and then tested (usually with PC Group in the context of the domain in which they were included) and then refined in regression analyses. Table 3.4 below shows the definitions and t-statistics of each variable in the final clinical regression. Table 3.4 Statistical Performance of Variables in the Clinical Severity Domain (Regression Analysis) Response t-value OASIS Item Category All segments Segments > 4 visits M Primary home care diagnosis Orthopedic DG Neurological DG Diabetes DG M IV / Infusion Parenteral/ Enteral IV/Infusion therapies at home Parenteral Enteral M Vision 1 or M Pain 2 or M Current pressure ulcer stage 1 or or M Stasis ulcer M Surgical wound 2 or M Dyspnea 2,3, M Urinary incontinence 1 or M Bowel incontinence M Bowel ostomy 1 or M Behavioral Problems Note: Based on expanded learning sample of initial 60-day payment segments both for all payment segments (N = 10,413) and for payment segments with greater than 4 visits (N = 9,373). The Functional Status Domain As in the development of the Clinical Severity domain, we began by selecting OASIS+ items considered to be potential predictors of increased resource use, focusing on the extent of assistance the patient required with activities of daily living. We initially chose to work primarily with OASIS-B (M0) items, rather than the plus (C0) items, since regression tree analysis using CART (see p. 30 ) indicated that they were generally equivalent in predictive power. Only plus item C0480, use of an assistive device for ambulation, was selected by CART as being a superior predictor of resource use. Further analysis showed Abt Associates Inc. Home Health Case-Mix Project: Second Interim Report, 9/24/
50 that appropriate grouping of response categories to OASIS-B item M0700, ambulation/ locomotion, 2 actually yielded a higher variance reduction in univariate analysis than plus item C0480 (R =.06 versus.03). C0430, mobility in bed (another plus item), was also included in the domain initially, but was 2 eliminated when analysis revealed that the loss of C0430 did not affect the R of the domain. We experimented with several versions of the Functional Status domain beginning with an iteration patterned after the CART regression tree analysis, using ambulation as a top split. This version divided cases into those requiring an assistive device to ambulate and those that did not, further subdividing each 2 of the two groups into low, medium and high ADL impairments. This yielded a high R (.10 for the Functional Status domain in isolation) but was not clinically appealing. Though the use of an assistive device may increase the independence of an otherwise functionally impaired patient, this would not intuitively be an area where one would begin the evaluation of functional and health status. We also created a Functional Status index using only late-loss ADLs (i.e., those ADLs likely to be lost late in life: 2 eating, transferring, toileting and bed mobility), which produced an R of.07. We did this in order to determine if late-loss ADLs were better predictors of resource use in the home-bound elderly, as they appear to be in the elderly residing in nursing homes (Williams et al, 1994). In reviewing additional methods of classifying patients by Functional Status, we tested other predictors of functional dependency to determine if variables other than ADLs should be included in the Functional Status domain. In a study of a community-based elderly cohort in Stockholm, investigators concluded that...dementia is the strongest determinant for developing functional disability and functional decline (Torres, et al., 1998). In the versions of the domain ultimately used in the Clinical Model (see Table 3.5 below), ambulation was integrated and both early-loss and late-loss ADLs were included (while cognitive factors were examined for incorporation into the Clinical Severity domain). None of the variables in the Functional Status domain were eliminated due to transience, subjectivity or potential negative incentive effects. There was concern expressed by clinicians who reviewed the model that there is a potential for manipulability, with providers having an incentive to make patients seem as functionally impaired as possible on admission to home care. This is an interesting issue for providers and policy-makers, and one which may necessitate data quality monitoring as case-mix classification systems which rely upon functional status indicators become more prominent in the Medicare program. The notion of nurses coding patients as more dependent than they are also runs counter to our experience in this project. We noted during project training sessions that home health nurses completing the OASIS+ appeared to be hesitant to assign high levels of dependency to their patients. A multivariate model was used to quantify the independent contribution of each functional item to total resources used. Each functional item was translated into indicator variables and the set of variables refined in a fashion similar to that described for the clinical items. Based on the regression results, several of the variables initially incorporated in the Functional Status domain were altered or eliminated from the version ultimately used in the Clinical Model. M0650 (Dressing Upper Body) and M0660 (Dressing Lower Body) were found to be closely related and were therefore combined. M0640 (Grooming) and M0710 (Eating) were eliminated after regression analysis showed them to be less than robust predictors of resource use. M0780 (Management of Oral Medications) and M0800 (Management of Injectable Medications) were also eliminated. There had been concern that these items were subjective and could be better measured by examining other patient characteristics, such as manual dexterity required for grooming and visual acuity. M0780 (Management of Oral Medications) was eliminated due to the low t- Abt Associates Inc. Home Health Case-Mix Project: Second Interim Report, 9/24/
51 value in regression analysis. When tested in the functional domain after including the Clinical Severity domain in the model, the contribution of M0800 (Management of Injectable Medications) was insignificant, so it was eliminated. The insignificant result may be due to the fact that the Clinical Severity domain itself contains variables associated with injectable medications (pain and diabetes). Table 3.5 Statistical Performance of Variables in the Functional Status Domain (Regression Analysis) OASIS Item Response t-value Category All Segments segments > 4 visits M0650 and M0660 (current) Dressing M0670 (current) Bathing M0680 (current) Toileting M0690 (current) Transferring M0700 (current) Locomotion 1 or Note: Based on expanded learning sample of initial 60-day payment segments both for all payment segments (N = 10,413) and for payment segments with greater than 4 visits (N = 9,373). The Service Utilization Domain The Service Utilization domain contains variables related to the type and amount of services the patient received both before and during the episode of home care. In developing the patient classification models, we sought to focus on variables that predicted care needed by the patient, as opposed to care rendered by providers. This is due to the desire to produce a case-mix adjustor which creates as little incentive as possible for providers to enhance revenues by providing unnecessary services. However, power to explain total resource use is greatly improved by augmenting OASIS patient variables with information regarding receipt of therapies (Physical, Occupational, or Speech/Language). We note that the RUG-III system for nursing home case-mix measurement does include an indicator for receipt of therapy. In our modeling, 2 inclusion of a Receipt of Therapy variable improved the R of our models by approximately 20 points. Given this significant improvement in explanatory power, the decision was made by HCFA to incorporate it into the case-mix model. In order to reduce potential gameability and eliminate cases in which the patient received assessment-only services, we defined the criterion for Receipt of Therapy as the receipt 6 of eight hours or more of therapy services during the 60-day payment segment. Only 12 percent of the cases in the sample were classified into the Receipt of Therapy group using this criterion. 6 Note that in a near term implementation of a PPS system, this parameter may need to be translated into visits, since time data are not currently available from claims. Though the Balanced Budget Act of 1997 (BBA97) mandated that agencies begin to submit data on the duration of home health visits, HCFA has postponed implementation of this requirement. Abt Associates Inc. Home Health Case-Mix Project: Second Interim Report, 9/24/
52 In our analysis of costs associated with pre-admission location, we examined how responses to M0170 and M0180 (health service utilization preceding home care admission) were related to mean cost. Contrary to what the project s clinicians might have predicted, initial analysis showed that an inpatient stay (discharge) within 14 days of home health admission was associated with lower resource use during the home care episode. In contrast, SNF or inpatient rehabilitation stay within 14 days of home health admission were associated with increased home care costs (see Table 3.6 below). Analysis of these variables showed that for patients who did not receive 8 hours or more of therapy, the lowest three groups had mean standardized costs in the range of $ The highest cost non-therapy patients (those who had a recent SNF or rehab discharge and no hospital discharge in the past 14 days) had a mean cost of $525, approximately 25% higher. With therapy, the lowest three groups had mean costs in the range of $900 to $970, and the highest group had a mean cost of more than $1,100, 16-25% higher. Our sense about the clinical reasoning behind these groupings is that we are at least partially looking at proxies for chronicity versus acuity (the hospital discharge in the past 14 days variable), and/or a need for more intensive services (SNF or inpatient rehabilitation discharge in the past 14 days). With or without therapy, patients in the highest group seem to have needed a longer rehabilitation/snf stay of at least 14 days (since they did not go from hospital to rehabilitation to home in 14 days or less). Table 3.6 Mean Cost Associated with Service Utilization Domain Variables 8 or more Nursing home/ inpatient Hospital discharge Standardized Mean hours therapy rehab discharge past 14 days Cost (PT, OT, SLP) past 14 days NO NO YES $404 NO NO NO 455 NO YES YES 430 NO YES NO 525 YES NO YES 970 YES NO NO 926 YES YES YES 902 YES YES NO 1,122 Note: Based on expanded learning sample of 9,373 initial 60-day payment segments with more than 4 visits. See text on pp for further details on the sample. Examining Days At Risk and Previous Home Health Use. Inpatient stays during a payment segment reduce the ability of patients to receive services at home. They may also reflect exacerbations in patients' clinical condition. We attempted to exploit this potential relationship between inpatient utilization and home health resource use by integrating an Intervening Inpatient Stay (IIS) variable into the Service Utilization domain. Analysis of the original sample showed that 983 (or 22%) of 60-day episodes included an inpatient admission. The mean standardized cost for episodes which included an inpatient admission was $446; the mean cost for episodes which did not include an inpatient admission differed by only $5 ($451). However, the mean cost for the 419 episodes in which the patient did not return to home care (with the same agency) was $303, while the mean cost for the 564 episodes in which the patient did Abt Associates Inc. Home Health Case-Mix Project: Second Interim Report, 9/24/
53 return to home care was $552. Differences based on the type of inpatient setting to which the patient was admitted were not found to be significant. However, the total length of stay in an inpatient setting during the 60-day episode was significant. Episodes in which the patient spent only one day in an inpatient setting had a mean cost of ($413). Episodes in which the patient spent 2 or more days in an inpatient setting and returned to home care had a mean cost of $559. Using this information, a variable indicating whether the episode included more than one day in an inpatient setting with a return to the same home care agency was incorporated into the Service Utilization 2 domain, with a resulting increase in R of.02 for the domain. However, when the domain was 2 incorporated into the Diagnostic Model, use of the IIS variable improved R by less than.01. (This variable was not tested on the Clinical Model.) The low level of improvement, combined with operational concerns regarding collecting the IIS data (which would not be available until after the 60-day segment was completed and were not predictable by agencies) led to a decision by HCFA to eliminate the variable from the model this time, and it is not included in the Service Utilization domain of the Clinical Model. Future refinements may include further examination of the issue of at risk days, combining the IIS variable with information about how many days the patient was not available for Medicare home health for other reasons (SNF stay, death, HMO enrollment, or Medicare ineligibility). The Home health in the past 90 days variable was also found to help predict resource use. However, due to concerns about the potential incentive effect that using this variable might introduce to patterns of care under PPS (e.g., encouraging the readmission of patients within the 90-day window), the variable was deleted from the model. This resulted in a loss of less than.01 in the explanatory power of the Service Utilization domain. Scoring Patient Variables and Developing Severity Categories The development of a scoring system for the Clinical Severity and Functional Status domains in the casemix models involved two different processes: determining a score for each of the variables, and then summing the scores on assessment items and classifying the summed scores into overall severity categories within each domain, such as minimal, low, moderate and high. In our first attempt to develop scores for each variable that reflected meaningful differences in resource utilization, we performed a univariate analysis on each of the variables. Mean standardized resource costs (that is the wage-weighted hours of care delivered) were obtained for each response category. The response category which represented the least severe impairment was assigned a score of zero. The mean cost of each response category was then compared to the mean cost of the least impaired category and given one point for each incremental cost increase of approximately $30. Table 3.7 shows the scores which resulted from this process. Abt Associates Inc. Home Health Case-Mix Project: Second Interim Report, 9/24/
54 Table 3.7 Mean Costs and Scores Derived from Univariate Analysis Mean Response Stand. OASIS Item Category Frequency Cost Differential Score Clinical Severity Domain M IV therapies at No home Yes M No Enteral/parenteral therapies at home Yes M pain 0 or or M pressure ulcer N/A stage 1 or or M stasis ulcer N/A M surgical wound N/A M dyspnea 0 or ,3, M urinary M0520 = incontinence and M timing of urinary incontinence M0520 = AND M0530 = 1 M0520= AND M0530=2 M bowel incontinence 1-5, N/A, UK M ostomy or Abt Associates Inc. Home Health Case-Mix Project: Second Interim Report, 9/24/
55 Table 3.7 Mean Costs and Scores Derived from Univariate Analysis Mean Response Stand. OASIS Item Category Frequency Cost Differential Score Functional Status Domain M0640 (current) Grooming M0650 (current) Dressing upper body M0660 (current) Dressing lower body M0670 (current) Bathing M0680 (current) Toileting M0690 (current) Transferring M0700 (current) Locomotion Abt Associates Inc. Home Health Case-Mix Project: Second Interim Report, 9/24/
56 Table 3.7 Mean Costs and Scores Derived from Univariate Analysis Mean Response Stand. OASIS Item Category Frequency Cost Differential Score M0710 (current)eating M (current)management of Oral Medications M (current)management of injectable meds Note: Based on original learning sample of 60-day payment segments as described fully in the First Interim Report (N = 4,303). Examining the univariate-based scores, it appears that successively higher levels of severity or impairment are not consistently associated with increasingly higher resource use in several instances (M0680, M0690, M0710, M0780, and M0800). For two of these items, M0780 and M0800 (management of oral and injectable medications), the last response category is used for patients who are not on any of the respective medications. Therefore, for these items, the highest response category being associated with lower cost is actually an artifact of the OASIS response category ordering rather than a case of higher dependence being associated with lower cost. For the other items, the reasons for the counter-intuitive cost progression are somewhat more complex. For M0680, response category 3 indicates a patient who cannot use either a toilet or bedside commode. For M0690 (Transferring), response category 5 indicates a patient who is bedbound and cannot turn or position himself. For M0710 (Eating), response category 5 indicates a situation in which the patient is unable to take any nutrients either by mouth or by tube feeding. The project team has theorized that lower costs associated with these conditions may be related to either abbreviated home care stays or greater than average amounts of family support for these highly impaired patients. Once HCFA determined that the Clinical Model was the preferred model, we refined the scoring of the Clinical Severity and Functional Status domains used in that model via regression analysis. The primary goals of the regression analysis were to generate scores for each variable that simultaneously controlled for all the other variables in the domain and to examine whether there were significant interrelationships among variables that should be accounted for in the final scoring. The regression analysis was performed in two steps. First, total resources were regressed on the clinical variables and the clinical scores computed. Then, residuals from that regression, i.e., the part of total resources not explained by the clinical variables, were regressed on the functional variables and the functional scores computed. The results of regression analysis did change scoring and led to the merging of some items and response Abt Associates Inc. Home Health Case-Mix Project: Second Interim Report, 9/24/
57 categories, and to the elimination of others due to statistical insignificance. M0640 (Grooming), M0710 (Eating), and M0780 and M0800 (management of oral and injectable medications) were all eliminated from the Functional Status domain, due to lack of statistical significance. The scoring of M0690 (Transferring) was altered, so that all degrees of impairment greater than one were grouped together. 2 However, these changes resulted in an improvement in the R of less than.01. Table 3.8, below, presents the results of the regression-based scoring. Note that the regression-based scores were calculated based on one point for every $10 in the regression coefficient, while the univariate scores shown in Table 3.7 were based on one point for every $30 increment over baseline. Table 3.8 Coefficients and Weighted Scores Derived from Regression Analysis OASIS Item Response Category Coefficient from Regression- based Regression Score Analysis Clinical Severity Domain M Primary home Orthopedic DG care diagnosis Neurological DG Diabetes DG M IV/Infusion IV / Infusion Parenteral/ Parenteral Enteral therapies at home Enteral M Vision 1 or M Pain 2 or M Current pressure 1 or ulcer stage 3 or M Stasis ulcer M Surgical wound 2 or M Dyspnea 2,3, M Urinary 1 or incontinence M Bowel incontinence M Bowel ostomy 1 or M Behaviors Functional Status Domain M0650 (current) Dress upper body or M0660 (current) Dress lower body M0670 (current) Bathing M0680 (current) Toileting Abt Associates Inc. Home Health Case-Mix Project: Second Interim Report, 9/24/
58 Table 3.8 Coefficients and Weighted Scores Derived from Regression Analysis OASIS Item Response Category Coefficient from Regression- based Regression Score Analysis M0690 (current) Transferring M0700 (current) 1 or Locomotion Note: Based on expanded learning sample of initial 60-day payment segments with greater than 4 visits (N = 9,373). For the Clinical Severity domain, total resources were regressed on the clinical variables described by the two left columns. For the Functional Status domain, the residuals from the clinical regression were regressed on the functional variables described by the two left columns. Grouping Scores into Severity Categories. After summing scores in each domain, we examined the mean standardized costs in the 60-day period according to total score within the domain. For example, in the Functional Status domain, we examined the mean cost associated with cases which scored from a low of zero to a high of 36. Referring to Table 3.9, it can be observed that certain scores cluster together within a range of mean costs. For example, the mean cost for the majority of payment segments with scores of four or less clustered around $350 and patients in this group were classified as having a minimal functional impairment. Mean cost for patients with scores in the range of 5-15 generally clustered between $400 and $500 and were termed low functional impairment. Mean costs for patients with scores between 16 and 22 were generally in the range of $500 to $600 and were classified as moderate functional impairment. Patients with scores of between 23 and 33 had mean costs between $600 and $800, and were termed high functional impairment. Patients with the highest score possible, 36, had a mean cost of $838 and were classified as having maximum functional impairment. Within each of these severity groupings, there are a number of scores with mean costs which do not fall within the specified ranges. These cases often involve very small sample sizes, which may make the means unstable. The development process for the severity groupings followed an iterative trial-and-error process of dividing the scores into two, three or more groups based on several factors including the points 2 at which natural breaks and clusters appeared, which divisions achieved the greatest R, and a consideration of the clinical characteristics of patients within each severity grouping. For example, patients who score at the minimal functional impairment level either have impaired ability to dress, toilet or transfer, but do not have impairments in locomotion. Patients in the maximum functional impairment severity group are either chair-fast or bed-fast and have significant impairments in all areas of functioning measured by the model. Another consideration in the development of severity categories was the number of patients within each group and the number of terminal nodes each division would create in the resulting model. Creating a 2 high number of severity categories can potentially produce higher R values, but leads to an unwieldy model in which some of the terminal nodes are empty, making obtaining an estimate of mean costs for that node difficult. The process of developing severity categories for the Clinical Severity domain (Table 3.10) was similar to that described above for the Functional Status domain. Abt Associates Inc. Home Health Case-Mix Project: Second Interim Report, 9/24/
59 Table 3.9 Functional Status Domain Scores and Severity Categories Domain Count Percent Cum Count Cum Percent Mean Severity Score Stand. Category Cost 0 1, , Minimum , , , Low , , , , , , , , , , Moderate , , , , , , , High , , , , , , , , , Maximum Note: Based on expanded learning sample of 9,373 initial 60-day payment segments with more than 4 visits. See text on pp for further details on the sample. Abt Associates Inc. Home Health Case-Mix Project: Second Interim Report, 9/24/
60 Table 3.10 Clinical Severity Domain Scores and Severity Categories Domain Count Percent Cum Cum Mean Severity Score Count Percent Stand. Category Cost , Minimal , , , , , Low , , , , , , , , , Moderate , , , , , , , , , , High , , , Abt Associates Inc. Home Health Case-Mix Project: Second Interim Report, 9/24/
61 Table 3.10 Clinical Severity Domain Scores and Severity Categories Domain Count Percent Cum Cum Mean Severity Score Count Percent Stand. Category Cost , High (cont'd.) , , , , , , , , , , , , , , , , , , , , , , , , , , , Abt Associates Inc. Home Health Case-Mix Project: Second Interim Report, 9/24/
62 Table 3.10 Clinical Severity Domain Scores and Severity Categories Domain Count Percent Cum Cum Mean Severity Score Count Percent Stand. Category Cost , High (cont'd.) , , , , , , , , , , , , , , , , , , , , , , , , , , , Abt Associates Inc. Home Health Case-Mix Project: Second Interim Report, 9/24/
63 Table 3.10 Clinical Severity Domain Scores and Severity Categories Domain Count Percent Cum Cum Mean Severity Score Count Percent Stand. Category Cost , High (cont'd.) , , , Note: Based on expanded learning sample of 9,373 initial 60-day payment segments with more than 4 visits. See text on pp for further details on the sample. The severity categories for the Services Utilization domain resulted from collapsing groups with similar mean cost, separately for patients with and without at least 8 hours of therapy services. Patients with a SNF or rehab stay but no hospital stay used significantly more resources on average than patients from other pre-admission locations. Therefore, the severity categories differentiate these patients from others, and then differentiate patients with and without at least 8 hours of therapy. We devised a scoring system to reflect these differences (Table 3.11). Table 3.11 Service Utilization Domain Scores and Severity Categories 8 or more Nursing Hospital Domain Count Mean Severity hours home/ discharge Score Standardtherapy Category inpatient past 14 days ized Cost (PT,OT,SLP) rehab discharge past 14 days NO=0 NO=0 YES=0 0 4,227 $404 Minimal NO=0 NO=0 NO=1 1 2, NO=0 YES=2 YES= NO=0 YES=2 NO= Low YES=4 NO=0 YES= Moderate YES=4 NO=0 NO=1 YES=4 YES=2 YES= YES=4 YES=2 NO= ,122 High Note: Based on expanded learning sample of 9,373 initial 60-day payment segments with more than 4 visits. See text on pp for further details on the sample. Abt Associates Inc. Home Health Case-Mix Project: Second Interim Report, 9/24/
64 Determining Overall Structure of the Models While working with the content of the domains, we were also experimenting with placement of each domain within the structure of the model. Operational considerations dictated placing the Service domain at the bottom of the tree, because this domain contains variables which are unobtainable until after the 60- day episode has ended. Our initial models followed a structure of first placing the patient in a Functional Status category, then assessing Clinical Severity and finally assigning an end-point determined by the Service Utilization domain, since the Functional Status domain consistently produced a higher variance reduction (increase in R-squared) over the Clinical Severity domain in univariate analysis. However, it was ultimately believed that placing the Clinical Severity domain at the top of the decision tree more accurately reflected the thought process of clinicians when assessing a patient s home care needs. The order of the domains in the decision tree does not affect the explanatory power of the model. The Clinical Model. The Clinical Model, shown in Exhibit 3.1, achieves an R of.32 on payment 2 segment 1, and.30 on payment segment 2, of the expanded learning sample (segments > 4 visits). It consists of three domains (Clinical Severity, Functional Status and Service Utilization), with 80 terminal nodes. The Clinical Severity and Service Utilization domains are each divided into four severity categories (minimal, low, moderate and high). The Functional Status domain is divided into five severity categories (minimal, low, moderate, high and maximum). Perceived advantages of this model are its relatively simple and clinically logical design which groups cases by patient problems rather than by medical diagnosis. Several clinical reviewers said this approach more accurately reflected their thought processes about patient care needs and HCFA has designated this model as the basis for case-mix adjustment of payment under the forthcoming prospective payment system (PPS). Exhibit 3.2 is a convenient summary of the classification algorithm for the Clinical Model. Abt Associates Inc. Home Health Case-Mix Project: Second Interim Report, 9/24/
65
66 Exhibit 3.2 Summary of the Clinical Model Clinical Severity Domain - Clinical Model, >4 visits OASIS Description Value Scoring Item M0230 Primary home care If Orthopedic DG, add 10 to score min = 0-7 diagnosis If Neurological DG, add 19 to score low = 8-16 If Diabetes DG, add 16 to score mod = M0250 IV/Infusion/ If box 1, add 15 to score high = 27+ Parenteral/Enteral If box 2, add 20 to score Therapies If box 3, add 24 to score M0390 Vision If box 1 or 2, add 7 to score M0420 Pain If box 2 or 3, add 6 to score M0460 Current pressure ulcer If box 1 or 2, add 15 to score stage If box 3 or 4, add 43 to score M0476 Stasis ulcer If box 3, add 24 to score M0488 Surgical wound If box 2 or 3, add 10 to score M0490 Dyspnea If box 2, 3 or 4, add 5 to score M0530 Urinary incontinence If box 1 or 2, add 8 to score M0540 Bowel incontinence If box 2-5, add 11 to score M0550 Bowel ostomy If box 1 or 2, add 10 to score M0610 Behavioral Problems If box 1-6, add 3 to score Functional Status Domain - Clinical Model, >4 visits OASIS Item Description Value Scoring M0650 (current) Dressing Upper, If M0650 = box 1, 2 or 3 Min = 0-4 M0660 (current) Dressing Lower or Low = 5-15 M0660 = box 1, 2 or 3 Mod = add 4 to score High = M0670 (current) Bathing If box 2-5 add 8 to score Max =36+ M0680 (current) Toileting If box 2-4, add 3 to score M0690 (current) Transferring If box 1, add 3 to score If box 2-5, add to 8 score M0700 (current) Locomotion If box 1 or 2, add 6 to score If box 3-5, add 13 to score Service Utilization Domain - Clinical Model, >4 visits Variable Description Value Scoring M0170 line 1 NO Hospital discharge past If box 1 IS BLANK, add 1 Min = days to score Low = 3 M0170 line 2 or 3 Inpatient rehab or SNF If box 2 or 3, add 2 to discharge past 14 days score Receipt of Therapy 8 or more therapy hours If yes, add 4 to score Mod = 4-6 High= 7 Abt Associates Inc. Home Health Case-Mix Project: Second Interim Report, 9/24/
67 3.3 Approaches to Assessing the Performance of the Model Statistical accuracy refers to the precision with which a case-mix model approximates the resource use required for a randomly selected sample of home health patients. Increases in the statistical accuracy of a case-mix model tend to lower the financial risk faced by home health providers and also reduce the likelihood that certain categories of beneficiaries will become unattractive to all providers. In this report, as in nearly all other treatments of case-mix measurement, statistical accuracy will be gauged by comparing the model s prediction of resource use with that actually provided to a sample of home health recipients. We must also reiterate here that resource use is not to be understood as payments actually made by Medicare to home health agencies in the sample, but rather as the minutes of care provided by each home health discipline, each valued at a nationally representative payment rate for the discipline. The model was constructed using a combination of clinical judgment, and successive revision on a socalled learning sample of 60-day payment segments of home health care. As candidate groupings and models were defined, measures of fit were computed for the model and the model was further refined and altered. This creates a potential for capitalizing on chance, that is, for developing a model that is tailored too closely to the particular traits and characteristics of the learning sample. Such a process is often referred to as over-fitting the model. In order to prevent over-fitting, a portion of the sample is typically not used in model development. This holdback sample is used at the completion of model building to assess model fit. Because the holdback sample was not used or consulted in construction of the model, measures of fit estimated on it can be expected to furnish an unbiased estimate of model accuracy. Details on the selection of the learning and holdback samples are presented in Section 3.1 above. In Chapter 4, we report seven measures of fit for the case-mix systems under consideration. They have previously been used by Phillips et al. (1992) in their evaluation of alternative approaches to home health case-mix measurement R. Often termed the proportion of variance explained by the model. R 2 ' 1& j (C i &Ĉ) 2 / j (C i & C) 2, where Ĉ represents mean resource use in the casemix group to which patient i is assigned and C 2 is overall mean resource us. The value of R is defined as one minus the ratio of the sum of squared deviations of observed resource use from the group mean to the sum of squared deviations of observed resource use from the overall mean. Values nearer to one indicate better fit. This is the most commonly used summary measure of fit because it is scaled from 0 to 1, so it can be used to compare models with different dependent variables; for example, the clinical and diagnostic models fit to initial payment segments and to second payment segments. Note that the scaling factor is the variation in observed resource use. By this measure, errors of a given size will be considered relatively more significant if there is less variation in actual resource use. Abt Associates Inc. Home Health Case-Mix Project: Second Interim Report, 9/24/
68 R 2 The measure is well defined only when computed for the same sample used to compute the casemix group means, Ĉ. If there are G casemix groups, indexed by j, and if the mean resource use in group j, estimated from the entire sample, is, then it must be true that Ĉ j [3.1] j i j j C ij & C 2 ' ji j j C ij &Ĉ j 2 % jj n j Ĉ j & C 2 when the summation is carried out over the entire sample of individuals i. The two terms on the right-hand side of the equation are usually called the unexplained and the explained sums of 2 squares. The equality implies that implies that R must lie between 0 and 1. When the summation is carried out for a portion of the sample, say only for patients in a specific geographic region, 2 2 then [3.1] need not hold and R is not well defined. Consequently, R is included among the measures of model fit reported in Chapter 4 only when describing the entire sample and not for subgroups defined by region, type of control, or urban-rural location. 2. The Predictive Ratio (PR): the ratio of the sum of proposed case-mix payments to the sum of resource costs. PR ' j Ĉ i / j C i This ratio indicates whether the proposed payments are high, low, or correct on average. It is particularly useful for determining whether the proposed payments are systematically high or low relative to current resource use for particular subpopulations; i.e., patients in different regions of the country or patients served by different types of agencies. The predictive ratio must equal one when computed for the same sample on which a model is estimated. For other samples, values greater than one indicate that the proposed payments will exceed the cost of the resources currently used (based on national prices) and values less than one indicate that the payments will be less than this standardized cost. Evaluating a value of PR that is greater than one requires deciding whether the generous payment is an appropriate reward for conserving resources or whether it is simply excessive. Similarly, evaluating a value of PR less than one requires deciding whether tight payments provide an appropriate incentive to operate more efficiently or whether they might provoke denial of needed care or unnecessary financial hardship for agencies. These types of judgments are outside the scope of the current work. 3. The square root of the mean squared deviation (RMSE) of cost from group mean resource use. RMSE ' j (C i &Ĉ i ) 2 /N 1/2 This measure of fit is the dispersion of group mean resource use relative to observed resource use. It is closely related to R squared, but is a dollar value rather than a score. Thus, it gives a sense of the magnitudes of the errors involved. However, it is not the mean absolute deviation. Because deviations are squared, large deviations are weighted more heavily than small ones. For example, given four deviations (-$20, -$10, $10, $20) the RMSE would be approximately $16. For this measure, Lower values indicate better fit. Abt Associates Inc. Home Health Case-Mix Project: Second Interim Report, 9/24/
69 4. The mean absolute deviation (MAD) of cost from proposed payment MAD ' j *C i &Ĉ i */N In this measure of dispersion, deviations are entered as absolute values so that, given the four deviations above, the RMSE would be $15. This has the simple interpretation - how big is the error on average? Again, lower values indicate better fit. 5. The mean relative absolute deviation (MRAD) of cost from proposed payment MRAD ' j *C i &Ĉ i */C i /N This is a third measure of dispersion. Here deviations appear as proportions of resource use so that a $10 deviation in a use with resource cost $100 becomes ten times as significant as a $10 deviation in a case with resource use of $1,000. Lower values indicate better fit. 6, 7. The 20th and 80th percentiles of the distribution of the deviations of resource use from group means th 20E=20 percentile of C i &Ĉ th 80E=80 percentile of C i &Ĉ These two measures offer a sense of the range of deviations of proposed payment from cost. Values nearer zero indicate better fit. The difference between the two indicates the range into which 60 percent of errors fall. Summary This chapter has described the process by which the data collected as described in Chapter 2 were used to develop a model that predicts Medicare home care resource use. The data available for analysis were randomly assigned to a learning sample and a holdback sample, and only the former was used in the analyses described in this chapter. We have described how the OASIS+ assessment items and other variables were evaluated for their ability to predict home health resource use and their value in a case-mix adjuster. We have also described the attributes that would argue against including an item in the adjustor - such as undesirability from a policy perspective (e.g., social characteristics, or variables which would create perverse incentives for family caregivers); vulnerability to gaming or other provider manipulation; questionable reliability, subjectivity, or transience; and administrative burden (such as the use of non-oasis items, which would impose additional data collection burden on agencies and would require modification of all OASIS data systems.) We reviewed the findings of our initial data-driven exploratory analyses, which identified variables that showed promise as predictors of resource use, and described how HCFA chose to establish meaningfulness to clinicians as a central principle guiding the process of model development. We summarized the development of the three model domains (Clinical Severity; Functional Status; and Service Utilization) and the process by which assessment variables were tested and retained or rejected. Specific discussion of our evaluation of selected groups of items is presented to anticipate the reader s questions about why certain variables were or were not included in the final model. These include home Abt Associates Inc. Home Health Case-Mix Project: Second Interim Report, 9/24/
70 care diagnosis; environmental factors; cognitive, sensory, and behavioral variables; and the availability of an informal caregiver. Finally, we documented the structuring of the model by the grouping of individual variables into the three domains, and the assignment of scores to each response on each item (for the purpose of categorizing patients into a severity category within each domain). We also presented the statistical measures of fit that will be used to evaluate the performance of the model and to predict any systematic failures to make accurate predication of resources used by the patients of agencies of particular types or in certain locations. An initial evaluation of this type is presented in the following chapter. Abt Associates Inc. Home Health Case-Mix Project: Second Interim Report, 9/24/
71 4.0 Findings 4.1 Resource Use for the Clinical Model Mean resource use for segments classified by the full casemix hierarchy and for segments classified according to their measured Clinical Severity category based on the summed-score intervals described in Chapter 3 is shown in Table 4.1 below. As a group, initial segments were only slightly more costly than second segments $531 for initial versus $509 for second segments in the learning sample. Mean resource use in the holdback sample was $523 for initial segments and $490 for second segments. Both the absolute and relative variability of resource use is higher for second segments. Every one of the 20 possible comparisons between Segment 1 and Segment 2 in the table produces a higher coefficient of variation (standard deviation divided by the mean) of resource use for Segment 2. Nineteen of the comparisons produce a higher standard deviation for Segment 2. Moving across levels of clinical severity within segment numbers, the situation is somewhat different. Going from the lowest level of clinical severity to the highest, the coefficient of variation is nearly constant; variability in resource use relative to the mean is about the same at all clinical levels. Variability in resource use thus appears to grow in proportion to clinical severity. This suggests that while the relative percentage difference between resource use and payment under a casemix-adjusted prospective payment system would be about the same at high and low levels of clinical severity, the dollar difference would tend to be greater at higher severity levels. Table 4.1 Mean and standard deviation of resource use for the entire model and for the Clinical Severity domain: segments with more than 4 visits Learning Sample Holdback Sample Segment 1 Segment 2 Segment 1 Segment 2 Mean Std dev Mean Std dev Mean Std dev Mean Std dev Entire model Clinical Severity level Minimum Low Moderate High Mean resource use by case-mix group for the Clinical Model is displayed in Appendix C. Mean standardized resource costs for the initial payment segment of the model ranged from $279 to $1,498 for the learning sample and $233 to $1640 for the holdback sample. Amounts for second segments were similar, ranging from $258 to $1634 for the learning sample and $258 to $1783 for the holdback sample. Abt Associates Inc. Home Health Case-Mix Project: Second Interim Report, 9/24/
72 The tendency for mean resource cost to be similar for initial and second segments was evident among individual case-mix groups as well. Table 4.2 shows mean resource use for the 11 terminal nodes having 50 or more observations for both initial and second segments. In only three of these did the discrepancy in mean resource use between initial and second segments exceed four percent. The near equality of resource use between first and second segments when segments with few visits are removed is consistent with a higher proportion of low-visit segments among second segments compared to first segments. Table 4.2 Mean resource use by segment in learning sample for terminal nodes with 50 or more observations in segment 1 and in segment 2: segments with more than 4 visits Node identifier Mean resource use ($) Clinical Functional IOS Segment 1 Segment 2 Percent difference Min Min Min % Min Low Min % Min Mod Min % Low Low Min % Low Min Min % Low Mod Min % Mod Low Min % Mod Mod Min % High Mod Min % High High Min % High Max Min % 4.2 Performance of the Clinical Model Surprisingly, many measures of goodness of fit were slightly better for the Holdback Sample than for the Learning Sample. This was unexpected because the Learning Sample was used during a period of experimentation to construct the casemix model. This typically leads to some overfitting as models with better fit are accepted and modified and those with poorer fit are abandoned. That model fit was at least as good for the Holdback Sample as for the Learning Sample suggests that the final Clinical Model did not capitalize on random elements in the data. Abt Associates Inc. Home Health Case-Mix Project: Second Interim Report, 9/24/
73 2 Goodness-of-fit, captured by the measures introduced in Chapter 3, is shown in Table 4.3. R values varied from 0.30 to 0.34, and were thus nearly identical for initial and second segments and for the Learning and Holdback samples. Each one of the measures of fit were slightly worse for second segments than for first segments. Measures of the absolute variability of cost around the casemix group means (RMSE and MAD) were about ten percent higher for segment 2 than for Segment 1; relative variability (MRAD) was about 30 percent higher. This reduction in goodness-of-fit is probably the result of greater variability in the number of visits in second segments compared to initial segments. Casemix-adjusted payments based on this model are thus likely to be somewhat less accurate for second segments (and presumably for subsequent segments as well) than for initial segments. Model fit by agency characteristics Tables display measures of fit for agencies classified by region, type of control, and urban-rural location. 7 Region. Tables 4.4 and 4.5 display the same measures of fit for agencies classified by U.S. Census Region. For both initial and second payment segments, the model fit, as captured by the absolute measures RMSE and MAD, tends to be somewhat better in the Northeast and North Central U.S. than in the South and West. Because the mean value of resource use in the South is relatively high, the measure of proportional variability (MRAD) is lower there than might be expected. As indicated by the predictive ratios, the model predicts higher resource use in the North Central and much higher in the West than was provided by agencies from those regions in the sample. The model underpredicted resource use in the South by about 9 percent on average. These predictive ratios suggest that, controlling for case mix, care patterns in the North Central and West are less resource-intensive than average, while care patterns in the South are more resource-intensive than average. Agency type. Measures of model fit by agency type are shown in Table 4.6 and 4.7. A striking feature of the tables is the ordering of the dollar value measures of variability RMSE and MAD in both the Learning and Holdback samples. The value of both measures increases consistently as one moves from 8 Government to Hospital-based to Nonprofit to Proprietary agencies. That is, in dollar terms, the variability of resource use is highest for proprietary agencies and lowest for government agencies. In relative terms, however, variability is rather low for proprietary agencies, a consequence of their relatively high mean resource use. Another notable feature of these tables is that the 80th percentile of actual minus predicted resource use is much greater for proprietary agencies than for other types. For 20 percent of these agencies patients, the cost of actual resources exceeds the proposed payment by $330 or more, consistent with the relatively high RMSE and MAD measures. 2 7 The R measure is not appropriate for subsamples such as these and so is not reported in the tables See Section 3.3 for further discussion. 8 The only exception to this rule occurs in Government agencies for second segments. This is almost surely a consequence of the very small number of second segments observed for this agency type. Abt Associates Inc. Home Health Case-Mix Project: Second Interim Report, 9/24/
74 As might be expected, the predictive ratio for proprietary agencies is low - i.e. on average the cost of actual resources expended exceeds the modeled amount. This result is consistent with the results of Tables 4.4 and 4.5 showing low predictive ratios in the South since proprietary agencies tend to predominate there. These results for proprietary agencies suggest care patterns of relatively high resource intensity after holding casemix constant. Urban/Rural location. Finally, Tables 4.8 and 4.9 show measures of model fit by urban/rural location. As indicated by the predictive ratios, the model tends to overstate resource use in rural areas, particularly for second segments. It is important to bear in mind that this overstatement is not caused by higher average wages in cities, because all visits in any given discipline are valued at the same national average wage. The result must rather be caused by a tendency for rural agencies to provide fewer visits to home health patients, given their membership in a given case-mix group. Abt Associates Inc. Home Health Case-Mix Project: Second Interim Report, 9/24/
75 R 2 Learning Table 4.3 Summary Measures of Fit for Initial and Second 60-day Episode Segments > 4 Visits Initial Second Holdback RMSE Learning Holdback Predictive ratio Learning Holdback MAD Learning Holdback MRAD Learning Holdback th percentile of C)Ĉ Learning (234.48) (256.59) Holdback (236.22) (243.65) 80th percentile of C)Ĉ Learning Holdback n Learning 9,373 1,664 Holdback 6,263 1,072 Abt Associates Inc. Home Health Case-Mix Project: Second Interim Report, 9/24/
76 Table 4.4 Summary Measures of Fit for Initial 60-day Episode Segments > 4 Visits, by Census Region Northeast North Central South West RMSE Learning Holdback Predictive Ratio Learning Holdback MAD Learning Holdback MRAD Learning Holdback th percentile of C)Ĉ Learning (206.02) (250.72) (208.00) (297.66) Holdback (210.92) (257.12) (210.59) (286.14) 80th percentile of C)Ĉ Learning Holdback n Learning 2,266 1,195 3,851 2,061 Holdback 1, ,572 1,363 Abt Associates Inc. Home Health Case-Mix Project: Second Interim Report, 9/24/
77 Table 4.5 Summary Measures of Fit for Second 60-day Episode Segments > 4 Visits, by Census Region Northeast North Central South West RMSE Learning Holdback Predictive ratio Learning Holdback MAD Learning Holdback MRAD Learning Holdback th percentile of C)Ĉ Learning (226.99) (269.01) (255.01) (311.99) Holdback (219.80) (254.11) (236.42) (284.23) 80th percentile of C)Ĉ Learning Holdback n Learning Holdback Abt Associates Inc. Home Health Case-Mix Project: Second Interim Report, 9/24/
78 Table 4.6 Summary Measures of Fit for Initial 60-day Episode Segments > 4 Visits, by Agency Type RMSE Predictive ratio MAD MRAD 20th percentile of C)Ĉ Hospital- Proprietary Nonprofit based Government Learning Holdback Learning Holdback Learning Holdback Learning Holdback Learning (202.42) (250.75) (243.38) (225.10) Holdback (214.42) (260.33) (241.05) (187.72) 80th percentile of C)Ĉ Learning Holdback n Learning 2,813 1,889 4, Holdback 1,893 1,275 2, Abt Associates Inc. Home Health Case-Mix Project: Second Interim Report, 9/24/
79 Table 4.7 Summary Measures of Fit for Second 60-day Episode Segments > 4 Visits, by Agency Type RMSE Predictive ratio MAD MRAD 20th percentile of C)Ĉ Hospital- Proprietary Nonprofit based Government Learning Holdback Learning Holdback Learning Holdback Learning Holdback Learning (239.15) (260.80) (263.10) (273.37) Holdback (234.68) (244.11) (247.87) (215.56) 80th percentile of C)Ĉ Learning Holdback n Learning Holdback Abt Associates Inc. Home Health Case-Mix Project: Second Interim Report, 9/24/
80 Table 4.8 Summary Measures of Fit for Initial 60-day Episode Segments > 4 Visits, by Urban/Rural Location Urban Rural RMSE Learning Holdback Predictive ratio Learning Holdback MAD Learning Holdback MRAD Learning Holdback th percentile of C)Ĉ Learning (229.83) (252.36) Holdback (230.94) (267.34) 80th percentile of C)Ĉ Learning Holdback n Learning 8,123 1,250 Holdback 5, Abt Associates Inc. Home Health Case-Mix Project: Second Interim Report, 9/24/
81 Table 4.9 Summary Measures of Fit for Second 60-day Episode Segments > 4 Visits, by Urban/Rural Location Urban Rural RMSE Learning Holdback Predictive ratio Learning Holdback MAD Learning Holdback MRAD Learning Holdback th percentile of C)Ĉ Learning (251.59) (283.34) Holdback (234.98) (257.64) 80th percentile of C)Ĉ Learning Holdback n Learning 1, Holdback Abt Associates Inc. Home Health Case-Mix Project: Second Interim Report, 9/24/
82 5.0 Future Activities In this chapter, we describe additional tasks that we will be performing under this project. These include activities and analyses related directly to further refinement of the case-mix model as well as tasks that will support HCFA s activities related to design and implementation of a national prospective payment system (PPS) for Medicare home health services. 5.1 Refining the Case-mix Model While the Clinical Model presented in this report has undergone extensive refinement and performs well, there are a number of activities we hope to be able to pursue in hope of improving its performance even further. These include the following: Considering Medicare days at risk. In the analyses carried out to this point, home health resource use has been calculated for each 60-day segment of care that is initiated by sample members. For some individuals in the sample, this 60-day period is too long, not because they did not receive services for the entire period, but rather because they could not. If a beneficiary dies, loses eligibility for Medicare, enters a hospital or nursing home, and/or joins a Medicare HMO during a 60-day segment, then he or she is not available to receive Medicare home health services during some portion of the segment. If the proportion of total days in any given segment during which beneficiaries are not available to receive services is non-negligible, the accuracy of the payment system can be improved by adjusting payment for an individual to account for the proportion of the segment for which he or she is available to receive services. The simplest way of doing this would be by computing resource use in a segment per day at risk and then computing the payment rate for each individual by multiplying this rate by the number of days the individual is at risk during the segment. Goodness of fit measures could then calculated by using deviations of actual resource use for each individual from this adjusted payment rate. Validating the model on a larger sample of payment segments. The analyses in this report are based on data that were available less than two-thirds of the way through our data collection period. Due to processing lags, these data probably reflect services provided only through the first nine months of data collection. By the time we conduct the final analyses, more data will have become available to us by way of new submissions of data from the sites and by their submission of corrections to data submitted previously. That the current file is based on data from the halfway point in data collection does not mean that the volume of data will eventually double. We are tracking the service utilization of a fixed cohort of patients, and most home health episodes are of relatively short duration. Aside from late submissions and corrections to earlier data, we will mainly be adding data on the minority of patient cohort members who have very long episodes and those who were readmitted to the agency after having been discharged from their qualifying episode that took place in late 1997 or early Testing the model on subsequent payment segments. The analyses presented in this report show the performance of the model predicting resource use during the first and second 60-day periods following admission to home care. By the end of the project, data on service use during subsequent periods should be available for all members of the patient cohort who had such use. If sample sizes are adequate, we may be able to evaluate the performance of the model during later periods following admission, and determine Abt Associates Inc. Home Health Case-Mix Project: Second Interim Report, 9/24/
83 if a separate set of patient groupings would be desirable to produce accurate payment adjustments during the latter portions of home health episodes. Refining the Diagnostic Model. We may return to the Diagnostic Model and pursue further refinements to it, including the creation of customized clinical (and possibly functional) domains for each of the diagnostic groups. Analysis of data from the original learning sample indicated that some variables are more predictive of resource use in one diagnostic group than in another. For example, the symptom of dyspnea is not correlated with higher resource use in the Orthopedic and Neurological DGs, but is associated with higher mean costs in the Cardiac/Vascular/ Pulmonary, Diabetes and All Others DGs. We could investigate creating Clinical Severity, and possibly Functional Status, domains which have been customized for each diagnostic group. This has the potential to enhance the explanatory power of the Diagnostic Model while reducing the number of end points to a more manageable number. 5.2 Further Issues for Payment Policy Development A workable, accurate system of case-mix groups is a necessary first step in developing a case-mix adjusted prospective payment system for home health care. Additional work is necessary to translate information from the case-mix groups into payment system components in particular, the case-mix relative weights that will be needed to adjust payments. This translation involves two activities. First, case-mix information must be projected from the sample to the nation. Second, methods for estimating average resource costs for case-mix groups are needed. Another issue for payment system development is how to deal with outlier cases those with resource costs falling at the extremes of the cost distribution and for whom the case-mix-adjusted payment is considered inadequate or overly generous. A final issue concerns payment policies as they affect the minority of patients experiencing multiple continuous episodes. Such long-term users are important in terms of cost to the Medicare program, and further policy development activities may be appropriate to ensure appropriate and efficient payment for such cases. National projections. Chapter 2 provided detailed information about the agency sample selection procedures. The sample design was intended to capture a very broad range of environments and practice patterns. Four census regions, four agency categories, urban/rural location, and three levels of visit volume were used to define sampling cells. It was intended that the final agency sample would provide data that could be used to generate estimates of the distribution of Medicare home health patients by casemix group. The population weighting method, described in Appendix F, permits HCFA to project 60-day segment counts to the national level by case-mix group, region, agency category, and urban/rural location. The projections are based on a file which aggregates all home health in the 1997 National Claims History into 60-day segments. The projections yield a national estimate of the relative frequency of each case-mix group in the Medicare population over the course of a year. These national estimates can be used for further rate-setting activities such as determining relative case-mix weights and standardizing the 60-day payment rate. Finding relative case-mix weights. Information from the case-mix groups is required in determining the case-mix relative weights. A straightforward method of calculating the relative weights is to divide each group s mean per-episode resource cost by the overall mean per-episode cost. This set of ratios comprises a set of case-mix relative weights whose average value is 1.0 as long as the means are volume-weighted. Abt Associates Inc. Home Health Case-Mix Project: Second Interim Report, 9/24/
84 However, the very small sample sizes in some groups (Appendix C) suggest that the raw group mean may not be a reliable measure of the population mean. Regression analysis can be used to estimate group and overall means using data from observations in the broader sample. The population weights discussed above would be used in estimating the group mean and overall mean resource cost before forming the ratios. Outliers. The law mandating national prospective payment allows for payments due to unusual variations in the type or amount of medically necessary home health care. The total payments for outlier cases during a fiscal year may not exceed 5 percent of total payments projected or estimated to be made based on the home health prospective payment system in that year. The case-mix system for 60-day payment segments developed under this project is consistent with a planned policy of paying for successive 60-day units for a beneficiary as long as the beneficiary continues to be recertified for additional home care. Consequently, any unusual variation would be defined within the 60-day unit of payment when external factors cause the home health agency to incur extraordinarily low or high costs. For example, a death early in the 60-day period might result in only a very few visits being provided to the patient, whereas severe exacerbation of a condition not resulting in death could incur extraordinary costs that exceed the regular unit payment. Some payment adjustment in the former case, and outlier payments in the latter, would make the payments more accurate relative to the actual cost incurred. (The law envisions financing outlier payments for high-cost cases from the 5 percent set-aside.) Downward payment adjustments for extraordinarily low-cost cases could also free up funds for distribution to the remaining 60-day payment segments through a reallocation to the standardized payment amount. Payment supplements for extraordinary costs would provide some protection for beneficiaries whose care needs cost significantly more than the amount of the unit payment. The further development of outlier policy is beyond the scope of this project. However, the project s sample data provide HCFA with a resource for simulating outlier payment policy, because they are the only source containing information on both the resource cost of the payment segments and the case-mix assignment. National data may be available in the future after HCFA s plans for implementing OASIS and PPS billing requirements take effect. Technical Assistance. There are specific technical tasks related to PPS implementation where project staff will play a defined role. As national OASIS data become available, project staff will provide technical support to HCFA in the use of these data to refine national estimates of case-mix group distribution in the Medicare population. Abt staff will develop the grouper software that will be incorporated into the HAVEN software and other HCFA (and presumably private vendor) systems. The software module will read the HAVEN OASIS record and generate a case-mix group code that agencies will use for billing purposes. A built-in edit will identify situations where any of the required information is missing or invalid. Abt staff will help provide training to HCFA and RHHI staff on the case-mix model and the grouper to acquaint them with the classification logic and how it may affect them and their work. Abt staff will also be available to review implementation documents and to assist in anticipating and identifying implementation issues based on our experience on this and related projects. Abt Associates Inc. Home Health Case-Mix Project: Second Interim Report, 9/24/
85 References Branch LG, Goldberg HB. A Preliminary Case-Mix Classification system for Medicare Home Health Clients. Medical Care 31(4): , Breiman L, Friedman JH, Olshen R and Stone CJ. Classification and Regression Trees. Wadsworth: Belmont, CA Foley WJ et al. Development of a Survey, Case-mix Measurement System, and Assessment Instrument to Rationalize the Long Term Care Home Care System. Troy, NY: Rensselaer Polytechnic Institute, Freedman, V., and Martin, L. Understanding Trends in Functional Limitations Among Older Americans, American Journal of Public Health (1998) 88: Fries, B.E., Schneider, D.P., Foley, W.J. et al. Refining a Case-Mix Measure for Nursing Homes: Resource Utilization Groups (RUG-III). Medical Care 32: , Goldberg, HB, Burstein, NR, Moore, T, et al. Case-mix Adjustment for a National Home Health Prospective Payment System: First Interim Report. Prepared for the US Health Care Financing Administration (HCFA) under contract # , TO#2. Cambridge, MA: Abt Associates Inc., December Granger, C., Hamilton, B. The Uniform Data System for Medical Rehabilitation Report of First Admissions for 1990", American Journal of Physical and Medical Rehabilitation. 1992; 71: Guccione, AA, Felson, DT, Anderson, JJ et al. The effects of specific medical conditions on the functional limitations of elders in the Framingham Study. American Journal of Public Health. 1994; 84: Helmstadter, G.C. (1964). Principles of Psychological Measurement. New York: Appleton-Century- Crofts. Landis, J.R. and Koch, G.G. (1977a). The measurement of observer agreement for categorical data. Biometrics, 33: Manton K, Hausner T. A Multidimensional Approach to Case-mix for Home Health Services. Health Care Financing Review 8(4): 37-54, Mauser E. The Home Health Utilization Groups Case-mix Adjustor, developed for use in the National Home Health Prospective Payment Demonstration, Health Care Financing Administration, Morris JN, Fries BE, Mehr D et al. A Comprehensive Clinical Assessment in Community Settings. November 1996a (submitted for publication). Abt Associates Inc. Home Health Case-Mix Project: Second Interim Report, 9/24/
86 Morris JN. The Minimum Data Set for home care. Presentation for The Key to Elderly Care in an Aging World in Reykjavik, Iceland 1996b. Nunnally, J.C. (1978). Psychometric Theory, second edition. New York: McGraw-Hill. Phillips BR, Brown RS, Schore JL et al. Case-Mix Analysis Using Demonstration Data: Home Health Prospective Payment Demonstration. Submitted to HCFA. Princeton, NJ: Mathematica Policy Research, Inc., December Saba V. Develop and Demonstrate a Method for Classifying Home Health Patients to Predict Resource Requirements and to Measure Outcomes. Washington, DC: Georgetown University School of Nursing, February Torres, HA, Fratiglioni, L., Guo, Z, Viitanen, M., von Strauss, E. and Winblad, B. Dementia is the Major Cause of Functional Dependence in the Elderly: 3-Year Follow-up Data from a Population-based Study. American Journal of Public Health. 1998; 88: White, A., Pizer, S. and White, C. Refining Resource Utilization Groups (RUG-III) for a National Skilled Nursing Facility System: Technical Expert Panel Briefing. October Abt Associates Inc. Home Health Case-Mix Project: Second Interim Report, 9/24/
87 Appendix A Data Collection Instruments
88 Exhibit A.1 OASIS+ Data Set
89
90
91
92
93
94
95
96
97
98
99
100
101
102
103
104
105
106 Exhibit A.2 Visit Logs
107
108
109
110
111
112
113 Appendix B The Diagnostic Model
114 Appendix B The Diagnostic Model As noted in Chapter 3, initial modeling efforts resulted in two distinct case-mix models, dubbed the Clinical and the Diagnostic Models, based on the domain at the top of the model. Because the Diagnostic Model first classifies cases based on primary diagnosis, proponents of this type of model believe that it may more accurately reflect the way clinicians think about patients. It also offers the potential to develop subclassifications that are customized to each diagnostic category, thereby creating more clinically homogeneous patient groupings. There are, however, several disadvantages to a diagnosis-driven model. One is that relatively few of our diagnostic categories (notably orthopedic, neurological, diabetes, and skin wounds/lesions) were found to explain a significant amount of the variance in home health resource use and were found worthy of incorporation in a model. This left many patients in an amorphous all others category. Another is the challenge of using diagnostic categories to classify home care patients, whose multiple diagnoses can cause confusion and create a high potential for gaming the system. Finally, the potentially large number of diagnostic categories is likely to lead to a model with a large number of case-mix groups, which would make the resulting payment system complex and difficult to administer. The Clinical and Diagnostic Models were developed and refined concurrently through the end of Early in 1999, HCFA determined that the Clinical Model was the model that would be developed for incorporation into the prospective payment system to be proposed later in the year, and refinement of the Diagnostic Model was suspended so that all efforts could be devoted to the Clinical Model. HCFA has indicated that further work on the Diagnostic Model may be undertaken at some point in the future; this Appendix documents the state of this model at the current time. The development of the Clinical Model is detailed in Chapter 3. Significant differences in the development and current form of the Diagnostic Model are described here. It should be remembered that certain refinements to structuring of model domains, scoring of variables, and defining severity categories were developed after work on the Diagnostic Model had been suspended. Therefore, the current definitions of these parameters as presented here are not quite state of the art. When work on this model is resumed, these refinements will be implemented before we proceed with further development of the model itself. Structure of the Diagnostic Model The Diagnostic Model follows the same general structure as the Clinical Model, with the addition of the assignment of each payment segment to a diagnostic category based on primary home health diagnosis prior to classification based on clinical, functional and Service Utilization factors. Diagnostic domain. Each segment is classified into one of seven primary home care Diagnostic Groups (DGs). As described in Section 3.2, the DGs are defined using the diagnostic parameters of the Quality Abt Associates Inc. Home Health Case-Mix Project: Second Interim Report, 9/24/1999 B-1
115 Indicator Groups (QUIGs) that were developed by the Center for Health Policy Research (Denver, CO) for use in measuring patient health outcomes. For the purposes of using these groupings in the modeling of home health resource use, we made a number of modifications (as described in Section 3.2) to the parameters of the QUIGs. In all, six different DGs (Neurologic, Orthopedic, Diabetes, Skin Wounds/Lesions, Psychiatric, and Cardiac/Vascular/Pulmonary) were found to be predictive of resource use and were retained in the model. These groups, arranged in descending order of mean resource use, form the Diagnostic Domain. Cases which do not fall into any of the DGs are placed into a seventh All Others group. Classification within the Diagnostic Domain is hierarchical, i.e., if a segment qualifies for more than one DG, it is assigned to the first one for which it qualifies. Appendix D presents a list of the 3-digit ICD9-CM codes included in each DG. Clinical Severity Domain. There are several differences in the current definitions of the Clinical Severity domain used for the Clinical and Diagnostic Models. Some differences are due to modifications that were made to the Clinical Domain for the Clinical Model after work on the Diagnostic Model had been suspended. Behavioral and sensory variables were added to the Clinical Model, and several variables were removed because they were not found to be statistically significant when domain-level regression analyses were performed to refine scoring. In addition, the Diagnostic Model actually uses two different versions of the Clinical Severity domain. In both of these versions, the diagnostic group variables have been eliminated since they have been moved to the Diagnostic Domain. The Clinical Domain used in the first four diagnostic groups in the Diagnostic Model (Neurological, Orthopedic, Diabetes and Skin Wounds/Lesions) contains variables related to skin wounds and lesions. The last three diagnostic groups use a version of the Clinical Severity domain which does not contain those variables, since under the hierarchical structure of the Diagnostic Model, all cases with a skin wound or lesion will have been caught by the Skin Wounds/Lesions DG (if not already assigned to one of the previous DGs.) Functional Status Domain. The current definition of the Functional Domain for the Diagnostic Model is the earlier version used for the Clinical Model and includes the variables listed in Table 3.7. It retains the variables that were later dropped due to lack of statistical significance in the regression analysis (M0640, Grooming; M0710, Eating; M0780 and M0800, Management of Oral and Injectable Meds). Service Utilization Domain. The current Service Domain for the Diagnostic Model is the earlier version that retains the Intervening Inpatient Stay (IIS) variable. Scoring Patient Variables. Scoring of variables in the Diagnostic Model is based on univariate analysis of each of the component variables. This process is described in Chapter 3; Table 3.7 shows the derivation of the scores. Developing Severity Categories. Since the Diagnostic domain has seven categories, it was necessary to minimize the number of severity categories for the other domains to avoid creating a model with many hundreds of end-points. For this reason, the Functional Status domain is reduced to a two-way high/low split (versus five in the Clinical Model). The Service Utilization Domain, however, has five severity categories, one more than the domain in the Clinical Model, because it retains the Intervening Inpatient Stay variable. With this variable included, a five-way split is supported by a clinical rationale, a clustering of mean costs, and an increase in the proportion of variance explained. For a full discussion of the scoring Abt Associates Inc. Home Health Case-Mix Project: Second Interim Report, 9/24/1999 B-2
116 of the domains in general, as well as the Service Utilization Domain and the Intervening Inpatient Stay variable, see Chapter 3. The Current Model. Based on classification into a Diagnostic Group (Neurologic, Orthopedic, Diabetes, Skin Wounds/Lesions, Psychiatric, Cardiac/Vascular/Pulmonary, All other ); a Clinical Severity category (minimal, low, moderate or high); a Functional Status category (low or high); and a Service Utilization category (minimal, low, moderate, high or maximum), a payment segment falls into one of 280 terminal nodes (e.g. Diabetes DG, moderate Clinical Severity, low functional impairment, and maximum Service Utilization). A diagram of the Diagnostic Model is shown in Exhibit B.1. (When viewing the diagram, please note that in order to make efficient use of space, the high/low functional groups were stacked vertically, rather placed side-by-side on a single vertical level.) Exhibits B.2 and B.3 present statistics on the cases included in the expanded learning sample as classified using the current version of the Diagnostic Model (no visit restrictions, n=10,570.) The exhibit shows the number of cases assigned to each node, and the mean and standard deviation of the standardized resource cost for visits provided during the segment. Exhibit B.2 presents information on initial payment segments within an episode of care. The mean standardized cost across all segments was $486; the mean standardized cost at the populated terminal nodes ranged from $125 to $2,934. Exhibit B.3 presents comparable information on second segments (n=2,151). Variance Reduction. The current version of the Diagnostic Model explains about 38 percent of the variance in resource use (mean standardized cost) during payment segments 1 and 2 for the expanded learning sample without visit constraints. This is slightly higher than the variance explained by the Clinical Model at the time, (33% of the variance for both segments) and better than the performance of the current Clinical Model on segments with >4 visits (32% of the variance for segment 1 of the expanded learning sample, and 34% of the variance for segment 1 in the holdback sample.) Since the Diagnostic Model is hierarchical in nature, cases proceed from left to right, rather than top to bottom, as in the Clinical Model. The explanatory power attributable to each domain can be found by 2 2 recomputing R after adding each additional domain and using the increment to R as the measure of explanatory power contributed by the newly added domain. When the Diagnostic domain is the only one 2 in the model, the R is.03. The explanatory power added by including each additional domain in order is 2 as follows: the Clinical Severity domain explains about 5% (i.e., R =.05); the Functional Status domain about 4%; and the Services Utilization domain about 26%. Future Work. As described above, when work continues on the Diagnostic Model, we plan to bring the definition and scoring of the domains up to date by implementing the procedures that were used to refine the Clinical Model. Further, we plan to investigate the benefits of customizing the Clinical Severity and Functional Status domains within each diagnostic category by determining if any of the different clinical or functional variables or severity categories are predictive for some types of patients but not for others. If this is the case, the classification of patients within the Functional Status and/or Clinical Severity domains might be allowed to differ for patients across diagnostic categories, increasing the explanatory power of the model while potentially reducing the number of end points. Abt Associates Inc. Home Health Case-Mix Project: Second Interim Report, 9/24/1999 B-3
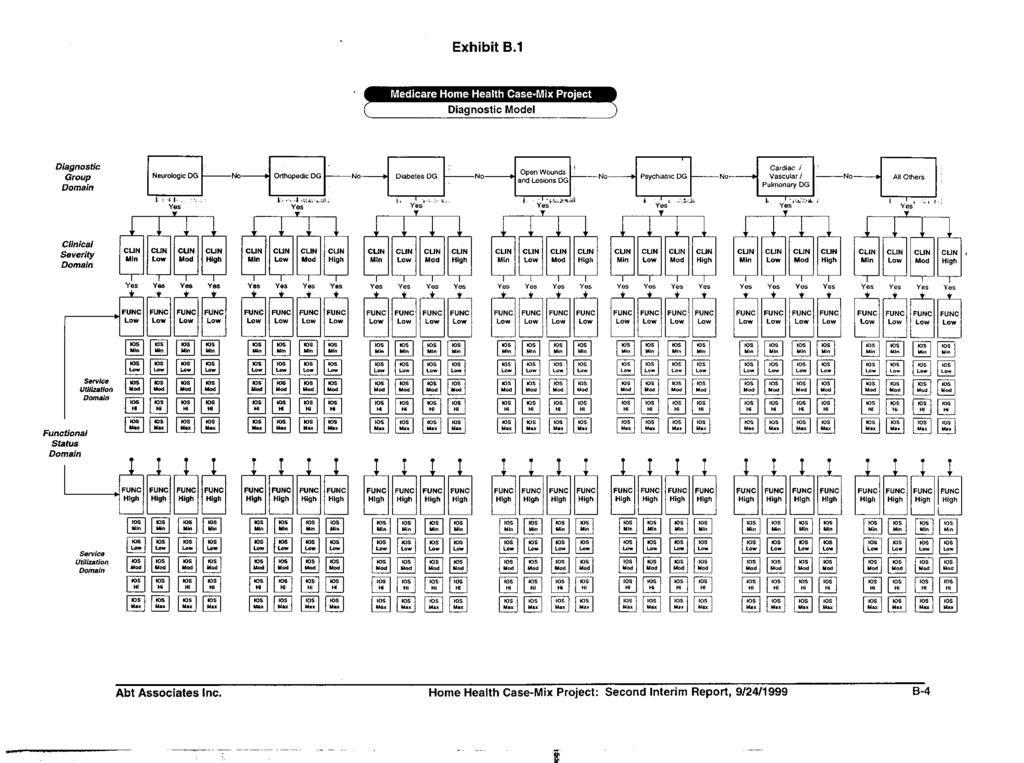
117
118
119
120
121
122
123
124
125
126
127
128
129
130
131
132 Appendix C Clinical Model - Terminal Node Statistics Learning and Holdback Samples
133
134
135
136
137 Appendix D ICD9-CM Codes Used to Define Diagnostic Groups
138 Appendix D ICD-9 Codes Used to Define Diagnostic Groups DG ICD9 Code Description ORTHO 170 MAL NEO BONE/ARTIC CART ORTHO 171 MAL NEO SOFT TISSUE ORTHO 213 BEN NEO BONE/ARTIC CART ORTHO 274 GOUT ORTHO 710 DIFF CONNECTIVE TISS DIS ORTHO 711 ARTHROPATHY W INFECTION ORTHO 712 CRYSTAL ARTHROPATHIES ORTHO 713 ARTHROPATH IN OTHER DIS ORTHO 714 OTH INFLAMM POLYARTHROP ORTHO 716 ARTHROPATHIES NEC/NOS ORTHO 717 INTERNAL DERANGEMNT KNEE ORTHO 718 OTHER JOINT DERANGEMENT ORTHO 720 INFLAM SPONDYLOPATHIES ORTHO 721 SPONDYLOSIS ET AL ORTHO 722 INTERVERTEBRAL DISC DIS ORTHO 723 OTHER CERVICAL SPINE DIS ORTHO 724 BACK DISORDER NEC & NOS ORTHO 725 POLYMYALGIA RHEUMATICA ORTHO 728 DIS OF MUSCLE/LIG/FASCIA ORTHO 730 OSTEOMYELITIS ORTHO 731 OSTEITIS DEFORMANS ORTHO 732 OSTEOCHONDROPATHIES ORTHO 781 NERV/MUSCULSKEL SYS SYMP ORTHO 800 SKULL VAULT FRACTURE ORTHO 801 SKULL BASE FRACTURE ORTHO 802 FRACTURE OF FACE BONES ORTHO 803 OTHER SKULL FRACTURE ORTHO 804 MULT FX SKULL W OTH BONE ORTHO 805 VERTEBRL FX W/O CORD INJ ORTHO 806 VERTEBRAL FX W CORD INJ ORTHO 807 FX RIB/STERN/LARYN/TRACH ORTHO 808 PELVIC FRACTURE ORTHO 809 FRACTURE OF TRUNK BONES ORTHO 810 CLAVICLE FRACTURE ORTHO 811 SCAPULA FRACTURE Abt Associates Inc. Home Health Case-Mix Project: Second Interim Report, 9/24/1999 D-1
139 ICD-9 Codes Used to Define Diagnostic Groups DG ICD9 Code Description ORTHO 812 HUMERUS FRACTURE ORTHO 813 RADIUS & ULNA FRACTURE ORTHO 814 CARPAL FRACTURE ORTHO 815 METACARPAL FRACTURE ORTHO 816 FRACTURE PHALANGES, HAND ORTHO 817 MULTIPLE HAND FRACTURES ORTHO 818 FRACTURE ARM MULT/NOS ORTHO 819 FX ARMS W RIB/STERNUM ORTHO 820 FRACTURE NECK OF FEMUR ORTHO 821 OTHER FEMORAL FRACTURE ORTHO 822 PATELLA FRACTURE ORTHO 823 TIBIA & FIBULA FRACTURE ORTHO 824 ANKLE FRACTURE ORTHO 825 FX OF TARSAL/METATARSAL ORTHO 827 LOWER LIMB FRACTURE NEC ORTHO 828 FX LEGS W ARM/RIB ORTHO 831 SHOULDER DISLOCATION ORTHO 832 ELBOW DISLOCATION ORTHO 833 WRIST DISLOCATION ORTHO 835 DISLOCATION OF HIP ORTHO 836 DISLOCATION OF KNEE ORTHO 837 DISLOCATION OF ANKLE ORTHO 838 DISLOCATION OF FOOT ORTHO 846 SPRAIN SACROILIAC REGION ORTHO 847 SPRAIN OF BACK NEC/NOS ORTHO 887 TRAUMATIC AMPUT ARM/HAND ORTHO 896 TRAUMATIC AMPUTAT FOOT ORTHO 897 TRAUMATIC AMPUTATION LEG ORTHO 927 CRUSHING INJ UPPER LIMB ORTHO 928 CRUSHING INJURY OF LEG NEURO 13 CNS TUBERCULOSIS NEURO 45 ACUTE POLIOMYELITIS NEURO 46 CNS SLOW VIRUS INFECTION NEURO 47 ENTEROVIRAL MENINGITIS NEURO 48 OTH ENTEROVIRAL CNS DIS NEURO 49 OTH NONARTHROPOD CNS VIR Abt Associates Inc. Home Health Case-Mix Project: Second Interim Report, 9/24/1999 D-2
140 ICD-9 Codes Used to Define Diagnostic Groups DG ICD9 Code Description NEURO 191 MALIGNANT NEOPLASM BRAIN NEURO 192 MAL NEO NERVE NEC/NOS NEURO 225 BENIGN NEO NERVOUS SYST NEURO 320 BACTERIAL MENINGITIS NEURO 321 OTH ORGANISM MENINGITIS NEURO 322 MENINGITIS, UNSPECIFIED NEURO 323 ENCEPHALOMYELITIS NEURO 324 CNS ABSCESS NEURO 325 PHLEBITIS INTRCRAN SINU NEURO 326 LATE EFF CNS ABSCESS NEURO 330 CEREBRAL DEGEN IN CHILD NEURO 331 CEREBRAL DEGENERATION NEURO 332 PARKINSON'S DISEASE NEURO 333 EXTRAPYRAMIDAL DIS NEC NEURO 334 SPINOCEREBELLAR DISEASE NEURO 335 ANT HORN CELL DISEASE NEURO 336 SPINAL CORD DISEASE NEC NEURO 337 AUTONOMIC NERVE DISORDER NEURO 340 MULTIPLE SCLEROSIS NEURO 341 OTHER CNS DEMYELINATION NEURO 342 HEMIPLEGIA NEURO 343 INFANTILE CEREBRAL PALSY NEURO 344 OTH PARALYTIC SYNDROMES NEURO 347 CATAPLEXY AND NARCOLEPS NEURO 348 OTHER BRAIN CONDITIONS NEURO 349 CNS DISORDER NEC/NOS NEURO 352 DISORDER CRAN NERVE NEC NEURO 356 HERED PERIPH NEUROPATHY NEURO 357 INFLAM/TOXIC NEUROPATHY NEURO 358 MYONEURAL DISORDERS NEURO 392 RHEUMATIC CHOREA NEURO 430 SUBARACHNOID HEMORRHAGE NEURO 431 INTRACEREBRAL HEMORRHAG NEURO 432 INTRACRANIAL HEM NEC/NOS NEURO 433 PRECEREBRAL OCCLUSION NEURO 434 CEREBRAL ARTERY OCCLUS Abt Associates Inc. Home Health Case-Mix Project: Second Interim Report, 9/24/1999 D-3
141 ICD-9 Codes Used to Define Diagnostic Groups DG ICD9 Code Description NEURO 435 TRANSIENT CEREB ISCHEMIA NEURO 436 CVA NEURO 437 OTH CEREBROVASC DISEASE NEURO 741 SPINA BIFIDA NEURO 742 OTH NERVOUS SYSTEM ANOM NEURO 851 CEREBRAL LACER/CONTUSION NEURO 852 MENINGEAL HEM FOLLOW INJ NEURO 853 OTH TRAUMATIC BRAIN HEM NEURO 854 OTHER BRAIN INJURY NEURO 907 LATE EFF NERV SYSTEM INJ NEURO 950 INJ OPTIC NERV/PATHWAYS NEURO 951 CRANIAL NERVE INJURY NEC NEURO 952 SPINAL CORD INJ W/O FX NEURO 953 INJ NERVE ROOT/SPIN PLEX NEURO 954 INJURY OTH TRUNK NERVE NEURO 955 INJ PERIPH NERV SHLD/ARM NEURO 956 INJ PERIPH NERV PELV/LEG SKIN 707 CHRONIC ULCER OF SKIN SKIN 870 OCULAR ADNEXA OPEN WOUND SKIN 871 EYEBALL OPEN WOUND SKIN 872 OPEN WOUND OF EAR SKIN 873 OTHER OPEN WOUND OF HEAD SKIN 874 OPEN WOUND OF NECK SKIN 875 OPEN WOUND OF CHEST SKIN 876 OPEN WOUND OF BACK SKIN 877 OPEN WOUND OF BUTTOCK SKIN 878 OPEN WOUND GENITAL ORGAN SKIN 879 OPEN WOUND SITE NEC SKIN 880 OPN WND SHOULDR/UPPR ARM SKIN 881 OPEN WOUND OF LOWER ARM SKIN 882 OPEN WOUND OF HAND SKIN 883 OPEN WOUND OF FINGER SKIN 884 OPEN WOUND ARM MULT/NOS SKIN 890 OPEN WOUND OF HIP/THIGH SKIN 891 OPEN WND KNEE/LEG/ANKLE SKIN 892 OPEN WOUND OF FOOT Abt Associates Inc. Home Health Case-Mix Project: Second Interim Report, 9/24/1999 D-4
142 ICD-9 Codes Used to Define Diagnostic Groups DG ICD9 Code Description SKIN 893 OPEN WOUND OF TOE SKIN 894 OPEN WOUND OF LEG NEC SKIN 940 BURN OF EYE & ADNEXA SKIN 941 BURN OF HEAD/FACE/NECK SKIN 942 BURN OF TRUNK SKIN 943 BURN OF ARM SKIN 944 BURN OF HAND & WRIST SKIN 945 BURN OF LEG SKIN 946 BURN OF MULTIPLE SITE SKIN 947 BURN OF INTERNAL ORGANS SKIN 948 BURN BY % BODY SURFACE SKIN 949 BURN UNSPECIFIED CVP 391 RHEUM FEV W HEART INVOLV CVP 393 CHR RHEUMATIC PERICARD CVP 394 DISEASES OF MITRAL VALVE CVP 395 DISEASES OF AORTIC VALVE CVP 396 MITRAL/AORTIC VALVE DIS CVP 397 ENDOCARDIAL DISEASE NEC CVP 398 OTH RHEUMATIC HEART DIS CVP 402 HYPERTENSIVE HEART DIS CVP 403 HYPERTENSIVE RENAL DIS CVP 404 HYPERTEN HEART/RENAL DIS CVP 405 SECONDARY HYPERTENSION CVP 410 ACUTE MYOCARDIAL INFARCT CVP 411 OTH AC ISCHEMIC HRT DIS CVP 413 ANGINA PECTORIS CVP 414 OTH CHR ISCHEMIC HRT DIS CVP 415 ACUTE PULMONARY HRT DIS CVP 416 CHR PULMONARY HEART DIS CVP 417 OTH PULMON CIRCULAT DIS CVP 420 ACUTE PERICARDITIS CVP 421 AC/SUBAC ENDOCARDITIS CVP 422 ACUTE MYOCARDITIS CVP 423 OTH PERICARDIAL DISEASE CVP 424 OTH ENDOCARDIAL DISEASE CVP 425 CARDIOMYOPATHY Abt Associates Inc. Home Health Case-Mix Project: Second Interim Report, 9/24/1999 D-5
143 ICD-9 Codes Used to Define Diagnostic Groups DG ICD9 Code Description CVP 426 CONDUCTION DISORDERS CVP 427 CARDIAC DYSRHYTHMIAS CVP 428 HEART FAILURE CVP 429 ILL-DEFINED HEART DIS CVP 440 ATHEROSCLEROSIS CVP 441 AORTIC ANEURYSM CVP 442 OTHER ANEURYSM CVP 444 ARTERIAL EMBOLISM CVP 446 POLYARTERIT NODOSA ET AL CVP 447 OTHER ARTERIAL DISEASE CVP 451 THROMBOPHLEBITIS CVP 452 PORTAL VEIN THROMBOSIS CVP 453 OTH VENOUS THROMBOSIS CVP 456 VARICOSE VEINS NEC CVP 457 NONINFECT LYMPHATIC DIS CVP 459 OTH CIRCULATORY DISEASE CVP 11 PULMONARY TUBERCULOSIS CVP 12 OTHER RESPIRATORY TB CVP 160 MAL NEO NASAL CAV/SINUS CVP 161 MALIGNANT NEO LARYNX CVP 162 MAL NEO TRACHEA/LUNG CVP 163 MALIGNANT NEOPL PLEURA CVP 164 MAL NEO THYMUS/MEDIASTIN CVP 165 OTH/ILL-DEF MAL NEO RESP CVP 197 SECONDRY MAL NEO GI/RESP CVP 475 PERITONSILLAR ABSCESS CVP 480 VIRAL PNEUMONIA CVP 481 PNEUMOCOCCAL PNEUMONIA CVP 482 OTH BACTERIAL PNEUMONIA CVP 483 PNEUMONIA: ORGANISM NEC CVP 484 PNEUM IN OTH INFEC DIS CVP 485 BRONCHOPNEUMONIA ORG NO CVP 486 PNEUMONIA, ORGANISM NOS CVP 491 CHRONIC BRONCHITIS CVP 492 EMPHYSEMA CVP 493 ASTHMA Abt Associates Inc. Home Health Case-Mix Project: Second Interim Report, 9/24/1999 D-6
144 ICD-9 Codes Used to Define Diagnostic Groups DG ICD9 Code Description CVP 494 BRONCHIECTASIS CVP 495 EXT ALLERGIC ALVEOLITIS CVP 496 CHR AIRWAY OBSTRUCT NEC CVP 500 COAL WORKERS' PNEUMOCON CVP 501 ASBESTOSIS CVP 502 SILICA PNEUMOCON NEC CVP 503 INORG DUST PNEUMOCON NE CVP 504 DUST PNEUMONOPATHY NEC CVP 505 PNEUMOCONIOSIS NOS CVP 506 FUM/VAPOR RESP DISEASES CVP 507 SOLID/LIQ PNEUMONITIS CVP 508 RESP COND D/T EXT AGENT CVP 510 EMPYEMA CVP 511 PLEURISY CVP 512 PNEUMOTHORAX CVP 513 LUNG/MEDIASTINUM ABSCESS CVP 514 PULM CONGEST/HYPOSTASIS CVP 515 POSTINFLAM PULM FIBROSI CVP 516 OTH ALVEOL PNEUMONOPATHY CVP 517 LUNG INVOLV W OTH COND CVP 518 OTHER LUNG DISEASES CVP 519 OTH RESP SYSTEM DISEASES CVP 860 TRAUM PNEUMOHEMOTHORAX CVP 861 HEART & LUNG INJURY CVP 862 INTRATHORACIC INJURY NEC DM 250 DIABETES MELLITUS PSYCH 292 DRUG PSYCHOSES PSYCH 295 SCHIZOPHRENIC DISORDERS PSYCH 296 AFFECTIVE PSYCHOSES PSYCH 297 PARANOID STATES PSYCH 298 OTH NONORGANIC PSYCHOSES PSYCH 300 NEUROTIC DISORDERS Abt Associates Inc. Home Health Case-Mix Project: Second Interim Report, 9/24/1999 D-7
145 Appendix E Valuing Home Health Resource Input: Opportunity Cost by Visit Type Christine E. Bishop, Ph.D. Institute for Health Policy Heller Graduate School Brandeis University
146 1 INTRODUCTION Appendix E Table of Contents 2 DEFINING STANDARDIZED WEIGHTS 2.1 Types of personnel 2.2 Labor mix 2.3 Industry 2.4 Opportunity Cost: Wages plus Fringe Benefits 3 SOURCES OF COMPENSATION DATA 3.1 Wages and Labor Mix: Occupational Employment Survey, Bureau of Labor Statistics 3.2 Occupation and Industry-specific Fringe Benefits Bureau of Labor Statistics/ Employer Cost for Employee Compensation National Association for Home Care/ HHCS Cost reports as a source of benefit costs Best Estimate of Benefits by Occupation 4 BEST ESTIMATE OF OPPORTUNITY COST OF LABOR HOURS BY VISIT TYPE 5 APPENDIX A: OCCUPATIONAL DEFINITIONS, EMPLOYMENT, AND RELATIVE WAGES 6 APPENDIX B: SOURCES OF COMPENSATION DATA 6.1 Occupational Employment Survey, Bureau of Labor Statistics 6.2 National Association for Home Care/ HHCS 6.3 Alternative Bureau of Labor Statistics Sources 6.4 Occupational Organizations American Nurses Association American Physical Therapy Association American Occupational Therapy Association American Speech-Language-Hearing Association National Academy of Social Work 7 APPENDIX C: HCFA COST WEIGHT METHODS 7.1 Salary Equivalency Method 7.2 HCFA HHA Indices 8 REFERENCES Abt Associates Inc. Home Health Case-Mix Project: Second Interim Report, 9/24/1999
147 Valuing Home Health Resource Input: Opportunity Cost by Visit Type 1.0 Introduction A proper calculation of the opportunity cost of home health visits or episodes requires a relative valuation of the time spent by nurses, medical social workers, therapists, and home health aides. This valuation is typically performed by weighting each hour worked by the mean labor cost for its occupational category. In order for a case-mix system to capture the intensity of resource use between groups of patients, it is 1 necessary to weight each labor hour by a national mean labor cost. For this project, labor hours for each home health discipline were captured using visit logs for each patient. This report presents the methods and data used to develop these standardized weights. The first steps are to assure that data for opportunity cost by personnel type can be matched to the personnel types reported in the visit logs, and that the compensation data used to represent opportunity cost represents the full opportunity cost for these home health workers. The first section below discusses definitions for personnel by type, presents estimates of personnel mix that must be used when labor hours are available by visit type but not by occupation, assesses the appropriateness of using data from other sectors of the health industry to represent opportunity cost for home health, and discusses the necessity of including fringe benefit information in the full employment cost. The second section below discusses sources of compensation data, including a separate discussion of fringe benefits (Section 3.2.4). The concluding section presents the results, our best estimates of opportunity cost of labor hours by visit type. The reader with less interest in these methodological and data issues can move directly to the results, presented in a summary table as Exhibit 5. 1 Regional and local variation in labor cost can be accounted for through indexation of rates by the payment system as is done by Medicare s hospital prospective payment system. Abt Associates Inc. Home Health Case-Mix Project: Second Interim Report, 9/24/1999 E-1
148 2.0 Defining Standardized Weights 2.1 Types of Personnel Precise definitions of home health occupations are needed if we are to develop labor cost weights. Home health agencies must use specific types of personnel to produce visits by discipline. The six types of Medicare home health visits, as designated in the Medicare statute and in the Schedule of Limits, are identified by the type of personnel that can provide them. They are: Skilled nursing care Physical therapy Speech Pathology Occupational therapy Medical social services Home health aide Medicare Conditions of Participation (COP) detail tasks that can be provided within these visits by these personnel. Training requirements for these personnel types are detailed in the Federal Code of Regulation. The development of correct weights for these personnel requires data on compensation that are collected according to these personnel definitions, or a close approximation. Definitions used by each wage and benefits survey source must be compared to these personnel definitions, to assess the value of compensation data in reflecting the opportunity cost of Medicare home health input labor. The COP definitions, presented as Appendix Exhibit 1, show that the Bureau of Labor Statistics occupational classifications are a good approximation of these personnel categories. 2.2 Labor Mix Within the rules governing visits by discipline, agencies may use different mixes of personnel to produce specific visit types. For example, either registered nurses or licensed practical nurses may provide skilled nursing visits. The mix of the labor hours used to serve a particular patient is presumably affected by patient need, agency cost considerations, agency philosophy or practice patterns, and local market conditions, including relative wages and availability for different types of personnel. The study visit logs indirectly captures the type of personnel providing each patient visit: the staff ID is queried on the survey form, and this can be matched to a staff list that indicates the discipline of each staff member. This match will be carried out for the final study analysis, but data on staff type will not be available for preliminary analysis. Therefore we must develop estimates of staff mix by discipline for each type of visit. 2.3 Industry We might measure opportunity cost of home health resources using compensation by occupation for all industries, recognizing that home health agencies purchase labor in broader occupational labor markets. By this logic, national average compensation for each type of worker employed throughout the economy should be used, providing a more general measure of the opportunity cost of these workers. Abt Associates Inc. Home Health Case-Mix Project: Second Interim Report, 9/24/1999 E-2
149 Instead, we recommend measuring resource cost in home health using compensation currently paid to workers by home health agencies i.e. wages paid by this industry. The home health industry may systematically choose workers within an occupation with different amounts of experience, education, and the like, and thus the opportunity cost of home health workers could have a systematic relationship to the average for all workers in the occupation: pay could be higher for home health workers in some occupations and lower for others when they are compared to their counterparts in other industries. This variation may also occur because the home health industry plays a different role in each occupational market it is slightly more important in the market for physical therapists, for example, than it is as an employer of registered nurses (see Appendix Exhibit 2). This suggests that compensation in home health should be used to develop weights whenever possible. 2.4 Opportunity Cost: Wages plus Fringe Benefits The ideal weights for resource inputs are average or median hourly compensation, wages plus benefits, for 2 personnel in these categories. Wages are often surveyed, but accurate data on benefits is more difficult to acquire. Fringe benefits include legally required benefits, paid leave /paid time off, insurance benefits, retirement and savings benefits, and supplemental pay. National estimates of these portions of compensation support the importance of including them as part of home health labor costs. Legally-required benefits include payments for Federal Old Age, Survivors, and Disability Insurance (Social Security), Medicare, Federal and state unemployment insurance, and workers compensation insurance. The cost of these benefits is proportional to salary for workers with annual pay below ceilings. Rates and ceilings vary by state for the state-required benefits. For all civilian workers, legally required benefits were 8.4% of employer cost per hour worked in March 1997 (U. S. Bureau of Labor Statistics 1997). Paid leave or paid time off includes vacation pay, holiday pay, sick leave, and other leave pay. Nationally, this represented 6.6% of total employer cost per hour worked for civilian workers (ibid.). Insurance benefits, including paid life, health, sickness and accident insurance, long-term disability insurance, were 6.4% of employer cost per hour worked. Retirement and savings plans, both defined benefit and defined contribution plans, were 3.9% of employer cost per hour worked. Nationally, supplemental pay, including premium pay, shift pay, and nonproduction bonuses, averaged 2.4% of employer cost per hour worked in March (U. S. Bureau of Labor Statistics 1997). HCFA s salary equivalent estimates for therapists (Health Care Financing Administration 1998) explicitly excluded supplemental pay from estimates of standard compensation. It could be argued that supplemental pay is a cost of attracting workers in tight labor markets, and is certainly necessary for the shift work sometimes required for patient care at home. However, this analysis will follow the HCFA method and exclude supplemental pay. 2 Some home health workers are paid as independent contractors. Through regulations requiring salary equalization in Medicare cost finding, HCFA has asserted that employment cost should not exceed the equivalent for salaried workers (Health Care Financing Administration 1998). This implies that national mean compensation rates should be used to estimate the opportunity cost of these resources, regardless of whether visits are provided by salaried staff or outside contractors. Methods and data for determining salary equivalents are discussed in the appendix. Abt Associates Inc. Home Health Case-Mix Project: Second Interim Report, 9/24/1999 E-3
150 3.0 Sources of Compensation Data 3.1 Wages and Labor Mix: Occupational Employment Survey, Bureau of Labor Statistics The Bureau of Labor Statistics Occupational Employment Survey (OES) began to collect wages by occupation and industry in The stratified sample represents all private employers and is selected primarily from establishments reporting to state unemployment insurance programs. Details of the sample and survey are presented at the BLS website (U.S. Bureau of Labor Statistics 1997). The OES establishment sample differs from the agencies serving Medicare patients in several ways. First, the OES sample is not limited to Medicare-certified agencies. This may not be a drawback, insofar as uncertified agencies are competing for workers in the same labor markets as certified agencies. In addition, a high proportion of all home health and hospice agencies are Medicare certified: the National Center for Health Statistics, drawing a sample of agencies from an updated National Health Provider Inventory, found 88.2% of these agencies had Medicare certification in 1996 (Haupt 1998). Further, the BLS establishment sample of establishments classified in Standard Industrial Classification (SIC) 808 does not include agencies under government auspices nor hospital-based agencies where workers are employed by the hospital. The NCHS found in 1996 that 11.4% of agencies, serving 9.2% of patients, were under government auspices, and 27.4% of the agencies, serving 34% of the patients, were 3 hospital-affiliated. However, it can be argued that compensation by occupation for free-standing private agencies represents a better estimate of opportunity cost in the market, because of the possibility that government civil service grades or hospital pay for specialized occupations may systematically over- or under-shoot market rates. The occupational definitions in the OES relevant to direct home health care workers are listed in Appendix Exhibit 3. Exhibit 1 presents total employment and average hourly compensation for the nine direct patient care occupations for non-government home health agencies as surveyed in the last quarter of (Social work assistants were not counted by the survey.) Appendix Exhibit 4 shows home health average hourly earnings as a proportion of hospital wages by occupation. 3.2 Occupation and Industry-Specific Fringe Benefits As discussed above, fringe benefits are an important part of compensation, and thus must be included in the opportunity cost of labor for home health services. Information to estimate fringe benefits paid to home health workers can be drawn from surveys and can be estimated from agency cost reports. No source reports both the occupational and industry detail for the required home health occupations. Surveys do report dollar costs of benefits for the health industry, for broad occupational classifications, 3 HCFA statistics indicate that government agencies provided 9% and hospital-based agencies provided 28% of Medicare visits in Abt Associates Inc. Home Health Case-Mix Project: Second Interim Report, 9/24/1999 E-4
151 and for nurses; and one source reports non-statutory benefits as a percentage of wages. Because many benefits are proportional to wages, we have chosen to apply an estimated percentage calculated from these surveys to base wages. The discussion below supports the slightly different estimates of benefits (statutory, i.e. legally required) plus other, not including premium pay) as a percentage of average wages for three types of personnel: nurses, therapists and social workers, and home health aides. The estimated percentages are very close. If fringe benefits are a more or less constant proportion of wages for these occupations, our estimate of this percentage will not change the relative valuation of labor hours. This means that estimated wages and salaries per hour could be used as relative weights for labor input costs by visit type and eventually by occupation Bureau of Labor Statistics/Employer Cost for Employee Compensation The Bureau of Labor Statistics conducts a survey of Employer Cost for Employee Compensation to produce the Employment Cost Index (ECI). The establishments surveyed include state and local governments as well as private employers. Employer cost per hour worked includes benefits listed above. Data are available for broad occupational and industry categories. The cross-walk between the labor types used to provide the six Medicare visit types and the ECI classifications is presented as Appendix Table 5. Exhibit 2 shows available benefit information for these occupational and industry breakdowns for the health sector. (All reported health sector information is included in Appendix Exhibit 5.) National Association for Home Care/HHCS Hospital and Healthcare Compensation Service (1997) (p. XIII-2) provides an average nation-wide percentage for cost of non-statutory fringe benefits. Only 814 (32.6%) of the 2035 participants answered this question. Many more agencies answered detailed questions about specific benefits. Exhibit 3 shows the percentages reported for three types of home health employees. Medicare home health occupations which are not professional Nurses and Therapists are in the Nonmanagement category. Abt Associates Inc. Home Health Case-Mix Project: Second Interim Report, 9/24/1999 E-5
152
153
154 Exhibit 3 Cost of Nonstatutory Fringe Benefits, Home Health Employees National Average Percent of Base Pay Management 20.97% Nonmanagement 21.87% Nurses and Therapists 20.90% Response to question "What is the actual cost of all Nonstatutory Fringe Benefits provided your employees (as a percentage of base pay)? Source: Hospital and Healthcare Compensation Service, 1997, p. XIII-3. oeswgs HHCS Cost Reports as a Source of Benefit Costs The HCFA salary equivalency method (see Appendix B) used a fringe benefits percentage computed from Medicare cost reports for PPS hospitals. Fringe benefits as a percent of total salary costs was computed. To this was added an estimate of the cost of paid leave (vacation, sick leave). This resulted in a fringe benefit amount that was about 28 percent of total compensation, (Health Care Financing Administration 1998), ( p. 5114). This means that benefits as reported in the final rule were 39.3% of wages Best Estimate of Benefits by Occupation We would prefer a reliable source of benefits paid to home health workers. The response rate of the HHCS survey was low, and response to overall benefit questions even lower. However, when estimates from different sources are arrayed (Exhibit 4), it appears that estimates of overall benefits as a percentage of wages are quite close. Neither survey reports striking differences in total benefits between professional and service workers. In part, this is because statutory benefits are a higher proportion of wages for lowwage workers, while other benefits make up a smaller share of compensation. Benefits for service workers across the health sector were lower than benefits reported to the home health wage and salary survey (Hospital and Healthcare Compensation Service 1997). To avoid over-weighting either a survey with poor response rate or a survey that reports mostly health jobs outside of home health, we propose to use the average of these two estimates of non-statutory benefits, plus the statutory benefit rates reported in the BLS ECI survey. These percentages are listed in the far right column of Exhibit 4. The surveys refer to time periods that differ by five months (March 1997 and August 1997). Because benefits are paid, and these data are reported and used here, in percentage terms, inflation in wages over this period will not affect the estimates. Abt Associates Inc. Home Health Case-Mix Project: Second Interim Report, 9/24/1999 E-8
155
156 4.0 Best Estimate of Opportunity Cost of Labor Hours by Visit Type Exhibit 5 presents our current best estimate of the opportunity cost of home health labor hours by visit type. Mean hourly wage is from the Bureau of Labor Statistics Occupational Employment Survey. Estimates of benefits exclusive of supplemental pay are estimated as described in Section above. As described in Section 2.2, four types of Medicare visits may be provided by multiple types of personnel. In the final analysis for this project, we will be able to weight visit time by observed occupational mix. For this interim analysis, we rely on employment weights from the Occupational Employment Survey. Abt Associates Inc. Home Health Case-Mix Project: Second Interim Report, 9/24/1999 E-10
157
158 5.0 Appendix: Occupational Definitions, Employment, and Relative Wages Abt Associates Inc. Home Health Case-Mix Project: Second Interim Report, 9/24/1999 E-12
159 Exhibit 1 Services and Occupational Requirements, Medicare Home Health Conditions of Participation Section Skilled Nursing Definition of Services (Condition of Participation) Skilled Nursing Occupational Qualifications (Code of Federal Regulations) The HHA furnishes skilled nursing services by or under the supervision of a registered nurse and in accordance with the plan of care. Standard: Duties of the registered nurse. The registered nurse makes the initial evaluation visit, regularly reevaluates the patient's nursing needs, initiates the plan of care and necessary revisions, furnishes those services requiring substantial and specialized nursing skill, initiates appropriate preventive and rehabilitative nursing procedures, prepares clinical and progress notes, coordinates services, informs the physician and other personnel of changes in the patient's condition and needs, counsels the patient and family in meeting nursing and related needs, participates in in-service programs, and supervises and teaches other nursing personnel. Duties of the licensed practical nurse. The licensed practical nurse furnishes services in accordance with agency policies, prepares clinical and progress notes, assists the physician and registered nurse in performing specialized procedures, prepares equipment and materials for treatments observing aseptic technique as required, and assists the patient in learning appropriate self-care techniques. Registered nurse (RN). A graduate of an approved school of professional nursing, who is licensed as a registered nurse by the State in which practicing. Practical (vocational) nurse. A person who is licensed as a practical (vocational) nurse by the State in which practicing. Abt Associates Inc. Home Health Case-Mix Project: Second Interim Report, 9/24/1999 E-13
160 Therapy Services Sec Therapy Services. Physical therapist. Any therapy services offered by the HHA directly or under A person who is licensed as a physical therapist by the State in which practicing, and arrangement are given by a qualified therapist or by a qualified therapy (a) Has graduated from a physical therapy curriculum approved by: assistant under the supervision of a qualified therapist and in (1) The American Physical Therapy Association, or accordance with the plan of care. The qualified therapist assists the (2) The Committee on Allied Health Education and Accreditation of physician in evaluating level of function, helps develop the plan of the American Medical Association, or care (revising it as necessary), prepares clinical and progress notes, (3) The Council on Medical Education of the American Medical advises and consults with the family and other agency personnel, and Association and the American Physical Therapy Association; or participates in in-service programs. (b) Prior to January 1, 1966, (1) Was admitted to membership by the American Physical Therapy (a) Standard: Supervision of physical therapy assistant and Association, or occupational therapy assistant. Services furnished by a qualified (2) Was admitted to registration by the American Registry of physical therapy assistant or qualified occupational therapy assistant Physical Therapist, or may be furnished under the supervision of a qualified physical or (3) Has graduated from a physical therapy curriculum in a 4-year occupational therapist. A physical therapy assistant or occupational college or university approved by a State department of education; or therapy assistant performs services planned, delegated, and supervised (c) Has 2 years of appropriate experience as a physical therapist, by the therapist, assists in preparing clinical notes and progress and has achieved a satifactory grade on a proficiency examination reports, and participates in educating the patient and family, and in conducted, approved, or sponsored by the U.S. Public Health Service in-service programs. except that such determinations of proficiency do not apply with respect to persons initially licensed by a State or seeking qualification as a (b) Standard: Supervision of speech therapy services. Speech therapy physical therapist after December 31, 1977; or services are furnished only by or under supervision of a qualified (d) Was licensed or registered prior to January 1, 1966, and prior speech pathologist or audiologist. to January 1, 1970, had 15 years of full-time experience in the treatment of illness or injury through the practice of physical therapy in which services were rendered under the order and direction of attending and referring doctors of medicine or osteopathy; or (e) If trained outside the United States, (1) Was graduated since 1928 from a physical therapy curriculum approved in the country in which the curriculum was located and in which there is a member organization of the World Confederation for Physical Therapy. Physical therapy assistant. A person who is licensed as a physical therapy assistant, if applicable, by the State in which practicing, and (1) Has graduated from a 2-year college-level program approved by the American Physical Therapy Association; or (2) Has 2 years of appropriate experience as a physical therapy assistant, and has achieved a satisfactory grade on a proficiency examination conducted, approved, or sponsored by the U.S. Public Health Service, except that these determinations of proficiency do not apply with respect to persons initially licensed by a State or seeking initial qualification as a physical therapy assistant after December 31, Abt Associates Inc. Home Health Case-Mix Project: Second Interim Report, 9/24/1999 E-14
161 Sec Medical Social Services. Occupational therapist. A person who: (a) Is a graduate of an occupational therapy curriculum accredited jointly by the Committee on Allied Health Education and Accreditation of the American Medical Association and the American Occupational Therapy Association; or (b) Is eligible for the National Registration Examination of the American Occupational Therapy Association; or (c) Has 2 years of appropriate experience as an occupational therapist, and has achieved a satisfactory grade on a proficiency examination conducted, approved, or sponsored by the U.S. Public Health Service except that such determinations of proficiency do not apply with respect to persons intially licensed by a State or seeking initial qualifications as a physical therapy assistant after December 31, Medical Social Services Social worker. If the agency furnishes medical social services, those services are A person who has a master's degree from a school of social work accredited given by a qualified social worker or by a qualified social work by the Council on Social Work Education, and has 1 year of social work assistant under the supervision of a qualified social worker, and in experience in a health care setting. accordance with the plan of care. The social worker assists the physician and other team members in understanding the significant social Social work assistant. A person who: and emotional factors related to the health problems, participates in the development of the plan of care, prepares clinical and progress (1) Has a baccalaureate degree in social work, psychology, notes, works with the family, uses appropriate community resources, sociology, or other field related to social work, and has had at least 1 participates in discharge planning and in-service programs, and acts as year of social work experience in a health care setting; or a consultant to other agency personnel. (2) Has 2 years of appropriate experience as a social work assistant, and has achieved a satisfactory grade on a proficiency examination conducted, approved, or sponsored by the U.S. Public Health Service, except that these determinations of proficiency do not apply with respect to persons initially licensed by a State or seeking initial qualification as a social work assistant after December 31, Abt Associates Inc. Home Health Case-Mix Project: Second Interim Report, 9/24/1999 E-15
162 Sec Home Health Aide Services. Home Health Aide Services Home Health Aide. Home health aides are selected on the basis of such factors as a Effective for services furnished after August 14, sympathetic attitude toward the care of the sick, ability to read, 1990, a person who has successfully completed a State-established or write, and carry out directions, and maturity and ability to deal other training program that meets the requirements of Sec (a) and effectively with the demands of the job. They are closely supervised to a competency evaluation program or State licensure program that meets ensure their competence in providing care. For home health services the requirements of Sec (b) or (e), or a competency evaluation furnished (either directly or through arrangements with other program or State licensure program that meets the requirements of organizations) after August 14, 1990, the HHA must use individuals who Sec (b) or (e). An individual is not considered to have meet the personnel qualifications specified in Sec for ``home completed a training and competency evaluation program, or a competency health aide''. evaluation program if, since the individual's most recent completion of this program(s), there has been a continuous period of 24 consecutive months during none of which the individual furnished services described in Sec of this chapter for compensation. Abt Associates Inc. Home Health Case-Mix Project: Second Interim Report, 9/24/1999 E-16
163
164 Exhibit 3 Occupational Definitions: BLS Occupational Employment Survey REGISTERED NURSES Administer nursing care to ill or injured persons. Licensing or registration required. Include administrative, public health, industrial, private duty, and surgical nurses LICENSED PRACTICAL NURSES Care for ill, injured, convalescent, and handicapped persons in hospitals, clinics, private homes, sanitariums, and similar institutions PHYSICAL THERAPISTS Assess, plan, organize, and participate in rehabilitative programs that improve mobility, relieve pain, increase strength, and decrease or prevent deformity of patients suffering from disease or injury PHYSICAL AND CORRECTIVE THERAPY ASSISTANTS AND AIDES Prepare patient and/or administer physical therapy treatment, such as massages, traction, and heat, light and sound treatment. Instruct, motivate, and assist patients with learning and improving functional activities. Normally work under the direction of a Physical or Corrective Therapist OCCUPATIONAL THERAPISTS Plan, organize, and participate in medically-oriented occupational programs in hospital or similar institution to rehabilitate patients who are physically or mentally ill OCCUPATIONAL THERAPY ASSISTANTS AND AIDES Assist Occupational Therapists in administering medically-oriented occupational programs to assist in rehabilitating patients in hospitals and similar institutions SPEECH-LANGUAGE PATHOLOGISTS AND AUDIOLOGISTS Examine and provide remedial services for persons with speech and hearing disorders. Perform research related to speech and language problems SOCIAL WORKERS, MEDICAL AND PSYCHIATRIC Counsel and aid individuals and families with problems that may arise during or following the recovery from physical or mental illness by providing supportive services designed to help the persons understand, accept, and follow medical recommendations. Include Chemical Dependency Counselors HOME HEALTH AIDES 4 Care for elderly, convalescent, or handicapped person in home of patient. Perform duties for patient such as changing bed linen; preparing meals; assisting in and out of bed; bathing, dressing, and grooming; and administering oral medications under doctors' orders or direction of nurse. Exclude Nursing Aides and Homemakers. 4 As shown in Exhibit, home health agencies also report substantial numbers of other nursing aides which seem by definition to be distinct from home health aides NURSING AIDES, ORDERLIES, AND ATTENDANTS Work under the direction of nursing or medical staff to provide auxiliary services in the care of patients. Perform duties such as answering patient's call bell, serving and collecting food trays, and feeding patients. Orderlies are primarily concerned with setting up equipment and relieving nurses of heavier work. Exclude Psychiatric Aides and Home Health Aides. Abt Associates Inc. Home Health Case-Mix Project: Second Interim Report, 9/24/1999 E-18
165
166 Exhibit 5 Medicare Personnel Types and Classifications in Employment Cost Index Survey Medicare Visit Type Occupation ECI Classification Skilled Nursing Registered Nurse Nurses Practical (Vocational) Nurses Nurse Physical Therapy Physical Therapist Professional Occupations 5 PT Assistant Service Occupations Occupational Therapy Occupational Therapist Professional Occupations OT Assistant Service Occupations Speech Pathology Speech therapist, Professional Audiologist Occupations Medical Social Service Medical Social Worker Professional Occupations Social work assistant Professional Occupations Home Health Aide Home Health Aide Service Occupations 5 Includes nurses Abt Associates Inc. Home Health Case-Mix Project: Second Interim Report, 9/24/1999 E-20
167 6.0 Appendix: Sources of Compensation Data 6.1 Occupational Employment Survey, Bureau of Labor Statistics The Occupational Employment Statistics (OES) program conducts a yearly mail survey designed to produce estimates of occupational employment and wage rates. The OES program collects data on wage and salary workers in nonfarm establishments in order to produce estimates for over 750 occupations, in over 400 industry classifications. The industry classifications correspond to the 2- and 3-digit Standard Industrial Classification (SIC) industrial groups. The 1996 survey round was the first year that the Occupational Employment Statistics (OES) program began collecting wage rate data along with occupational employment data in every State. In addition, the program's three-year survey cycle was modified to collect data from all covered industries each year. Prior to 1996, the OES program collected occupational employment data for selected industries in each year of the three-year survey cycle. For the 1996 survey round, one-third of the total cross-industry sample was surveyed. The OES program surveys approximately 400,000 establishments per year, taking 3 years to fully collect the sample of 1.2 million establishments. To reduce respondent burden, the collection is on a three-year survey cycle that ensures an establishment is surveyed at most once every three years. The 1996 estimates for occupations in nonfarm establishments are based on OES data collected for the reference months of October, November, or December The OES survey is a Federal-State cooperative program between the Bureau of Labor Statistics (BLS) and State Employment Security Agencies (SESAs). BLS provides the procedures and technical support, draws the sample, and produces the survey materials, while the SESAs collect the data. SESAs from all fifty States, plus the District of Columbia, Puerto Rico, Guam, and the Virgin Islands participate in the survey. Occupational employment and wage rate estimates at the national level are produced by BLS-Washington using data from the fifty States and the District of Columbia. Source: (U.S. Bureau of Labor Statistics 1998) 6.2 National Association for Home Care/HHCS In collaboration with National Association for Home Care (NAHC), Hospital and Healthcare Compensation Service has carried out a wage survey of home health agencies for seven years. Survey questionnaires were sent to approximately 15,000 home care agencies on the NAHC mailing list. The 2035 responses represent a response rate of 13.56%; 98.3% of the responding agencies were Medicare-certified. The agencies responding were more likely to be under proprietary auspices than are home health agencies in the nation (Exhibit 2). Abt Associates Inc. Home Health Case-Mix Project: Second Interim Report, 9/24/1999 E-21
168 Exhibit 2 Respondents to NAHC/HHCS and NCHS Surveys by Agency Type HHCS Survey: Percent Agencies Responding NCHS Survey Not-For-Profit (Voluntary) Government and Other 11.4 Government 1.5 Not-for-Profit (Private) 12.5 Hospital-Based (For Profit, 12.2 Nonprofit, and Government) For Profit Hospital-based agencies were listed as a separate category whatever their auspices, making this classification difficult to compare with NCHS classifications. For comparison, 27.3% of the home health agencies surveyed by NCHS were hospital-based. The survey was sent out in May of 1997 and requested that responding agencies report wage data for personnel employed August 1, 1997; (see Hospital and Healthcare Compensation Service 1997, Appendix Section XIV for occupational descriptions.) Because of the relatively low response to this survey, the Bureau of Labor Statistics Occupational Employment Survey was selected as the source for wage data. 6.3 Alternative Bureau of Labor Statistics Sources BLS reports average hourly earnings by selected industry, including home health, on a quarterly basis. This is computed by dividing total payroll from reporting establishments by total hours, and so cannot be used for occupation-specific wage weights. This series might be used to assess trends. Average cost per weighted minute might be compared with this figure to assess reliability. 6.4 Occupational Organizations Membership organizations for occupations employed by home health agencies may be a source of data on wages paid to workers by type American Nurses Association. The American Nurses Association was unable to provide data on salaries and benefits for registered and licensed practical nurses employed in home health. Abt Associates Inc. Home Health Case-Mix Project: Second Interim Report, 9/24/1999 E-22
169 6.4.2 American Physical Therapy Association The American Physical Therapy Association conducts and annual salary survey of members median income for physical therapists and physical therapist assistants employed in home health were $54,500 and $32,500 respectively (American Physical Therapy Association 1997; American Physical Therapy Association 1997). Assuming a working year of approximately 2000 hours, this results in hourly earnings of $27.25 and $16.25 respectively, somewhat lower than the hourly wages reported to the BLS OES, but in the same general range American Occupational Therapy Association The American Occupational Therapy Association surveyed its membership in Assuming approximately 2000 hours per year, mean hourly earnings for occupational therapists working in home health were $26.54, and for certified occupational assistants $ These estimates are lower than those found by the Bureau of Labor Statistics OES American Speech-Language-Hearing Association We were unable to obtain wage and salary information from the American Speech-Language-Hearing Association concerning employment and earnings in home health National Academy of Social Work A 1997 survey by the National Academy of Social Work (NASW) found a median salary for social workers employed in outpatient health settings of $32,499. For a 2000-hour year, this translates to $16.25 per hour, somewhat below the BLS reported average hourly earnings of $20.20 per hour. Abt Associates Inc. Home Health Case-Mix Project: Second Interim Report, 9/24/1999 E-23
170 7.0 Appendix: HCFA Cost Weight Methods 7.1 Salary Equivalency Method Guidance for valuing compensation of home health labor hours is provided by the salary equivalency determinations carried out by HCFA for therapists serving Medicare patients under contract to providers (see (Health Care Financing Administration 1998). These were carried out to address a different issue, the need for a prudent buyer standard for assessing reasonable costs of care. In developing salary equivalents, HCFA analysts had to set methods for computing mean national wage rates and fringe benefit costs from imperfect data sources, collected at different times from varying respondents. Even though the salary equivalents apply to Medicare home health, no home health wages were included in the analysis. Nursing home and hospital compensation data were used. Because no one source of data was ideal for the purpose, the method blended data from several surveys. The analysts state (p. 5110) Given that the mean hourly wages of therapists generally cluster in rather small ranges, we believe that an average of the various sources, including any inherent biases, fairly represents the national wage rate for each of the four therapist types. Before blending, wage data were all trended forward to the same point in time. Non-wage compensation was measured and included as a percentage of wages and was adjusted for inflation by adjusting the wage base. 7.2 HCFA HHA Indices The methods used to construct an input price index for home health can also inform our effort to develop national weights for hourly compensation. The purpose of the HHA Market Basket Index (Health Care Financing Administration 1996) was to update home health agency reasonable cost limits for inflation in input prices. To develop a home health care market basket, HCFA had to select base cost or expenditure weights, indicating the value of resources used in home health production in the base year. These weights were then to be updated using an appropriate price/wage variable, called a price proxy (p.34348). The cost weights were developed from 1993 home health Medicare cost reports. They are thus based on total spending by home health agencies on categories of labor. Weights for the labor types relevant to this project, direct patient care workers, were not developed from occupation-specific wages and salaries, but on spending for workers in two classes: Skilled Nursing & Therapists and Other Professional/Technical, including an allocation for Contract Services Labor; and Service, including an allocation for Contract Services Labor (home health aides) (Health Care Financing Administration 1996) p and Appendix Table 4. Expenditures for these wages and salaries were found in the 1993 Medicare cost reports. This uses amount and mix of labor of 1993 without requiring separate estimates of wages and number employed for any specific type of personnel, or even for the four occupational classes. The weights to be used for benefits were also estimated from cost reports of benefits paid. They were then to be updated by an index incorporating benefits cost increases for the four classes of personnel. Thus these weights are for all home health employment, not direct patient care workers only. They also do not include paid leave as a benefit, since it is included in the wages and salaries base. It is informative that the benefits weight was 20.9% of the wage and salary weight; this means that paid benefits were about one-fifth of wages and salaries for all employees of Medicare home health agencies filing cost reports in Abt Associates Inc. Home Health Case-Mix Project: Second Interim Report, 9/24/1999 E-24
171 Home Health Wage Index. The current index used in Medicare home health payment is the hospital wage index. There is no detail on input costs for the six home health disciplines. This index is not a wonderful choice for indexing costs over time nor for reflating costs back to the local level. However, it could be used for either purpose because it is computed annually and has broad geographical coverage. This index is computed not on average wages multiplied by standard market basket employment weights (which would in any case be for hospitals not home health agencies), but by finding the average of average hospital hourly earnings, computed by dividing each hospital s total wage bill by total hours (Prospective Payment Assessment Commission 1993). Thus it is not even weighted by standard employment weights but by specific hospital employment mix, and is lower than a consistently-weighted price index would be in areas using lower-skilled input mixes, and higher in areas using high skill mixes. Abt Associates Inc. Home Health Case-Mix Project: Second Interim Report, 9/24/1999 E-25
172 8.0 References American Physical Therapy Association (1997). Physical Therapist Assistant Median Income. APTA Research Briefing 4(3): 1-4. American Physical Therapy Association (1997). Physical Therapist Median Income. APTA Research Briefing 4(1): 1-4. Haupt, B. J. (1998). An overview of home health and hospice care patients: 1996 National Home and Hospice Care Survey. Washington D.C., National Center for Health Statistics. Health Care Financing Administration (1996). Federal Register 61(127 (Monday July 1, 1996)): Health Care Financing Administration (1998). Salary equivalency guidelines for physical therapy, respiratory therapy, speech language pathology, and occupational therapy services; final rule. Federal Register 63(20): Hospital and Healthcare Compensation Service (1997). Homecare Salary & Benefits Report Oakland, New Jersey, in Cooperation with the National Association for Home Care. Prospective Payment Assessment Commission (1993). Report and recommendations to the Congress. Washington, D.C. U. S. Bureau of Labor Statistics (1997). Employer Costs for Employee Compensation - March Washington D. C., U.S. Department of Labor. U.S. Bureau of Labor Statistics (1997). Occupational Employment Statistics. BLS Handbook of Methods, U.S. Bureau of Labor Statistics (1998). Occupational Employment Statistics Overview, Williams, B.C., Fries, B.E., Foley, W.J. et al. Activities of Daily Living and Costs in Nursing Homes. Health Care Financing Review 1994; (15)4: Abt Associates Inc. Home Health Case-Mix Project: Second Interim Report, 9/24/1999 E-26
173 Appendix F Weighting to National Estimates
174 Appendix F Weighting to National Estimates The observed distribution of segments of home health care by sampling cell and case-mix group among agencies in the study sample may be combined with data on the population distribution of segments by cell to generate estimates of the number of segments by case-mix group for the entire U.S. The weighting scheme developed here uses total Medicare segment counts compiled by Deborah Chaney and Randy Throndset of the Health Care Financing Administration to produce population estimates for At this point, we shall assume that new home health segments are spread out evenly over time, so that, for example we can expect to capture about one quarter of the year s initial segments if we sample for three months and about one-half if we sample for six months. There probably is some seasonality, which can be addressed at a later time. In order to increase accuracy and to allow estimates to be updated easily as new data arrive, separate national estimates are developed for initial segments (termed S1 segments) and subsequent segments (termed S+ segments). An initial or S1 segment is defined as a 60-day span of home health care that is not preceded by any Medicare-covered home health care within the previous 30 days. The S1 segment defines the beginning of an episode of home health care. An S+ segment is any 60-day period of care that is not an S1 segment. That is, S+ segments are 60-day periods of home health care that are preceded by home health care in the 30 days prior to the segment. The weighting methodology uses variables defined in the table below (Table F.1). For clarity of exposition, all summations over agencies in the sample and in the population are suppressed. In all cases, segment counts shown below should be understood to represent those segments that satisfy particular criteria. One set of weights has been calculated for all segments. A separate set was calculated for those segments containing more than 4 Medicare-covered home health visits. Table F.1 Variable definitions for sample and population totals. Variable Definition Source S 1 i S % i g 1 jk number of initial segments (S1) of care in cell i in the Medicare population in number of non-initial (S+) segments of care in cell i in the Medicare population in number of S1 segments from cell i in case-mix group j among agencies in the study sample. HCFA 1997 home health episode file. HCFA 1997 home health episode file. Abt Associates project datafile. Abt Associates Inc. Home Health Case-Mix Project: Second Interim Report, 9/24/1999 F-1
175 Table F.1 Variable definitions for sample and population totals. Variable Definition Source g % jk number of S+ segments from cell i in case-mix group j among agencies in the study sample. total number of S1 segments in cell i among agencies in the study sample. s 1 i s 1 i total number of S+ segments in cell i among agencies in the study sample. s % i s % i Abt Associates project datafile. ' j G j ' j G j g 1 ij g % ij Because the population number of segments in each cell is known, the weight necessary to compute the estimated total number of home health segments is equal to the ratio of total to sample segments in each cell, i. [1] [2] w 1 i 'S 1 i /s 1 i w % i 'S % i /s % i The estimated total number of initial segments in case-mix group j in cell i,, is given by the product of the cell weight and the number of study sample segments from cell i in case-mix group j. The same calculation is used for non-initial segments: G 1 ij [3] [4] G 1 ij ' w 1 i g 1 ij G % ij ' w % i g % ij The number of segments in group j for any subpopulation of beneficiaries by cell can be computed by summing over those segments in say, the northeast, or in hospital-based agencies, rural agencies and the like. The total number of segments is simply the sum over all cells, i: [5] G 1 j ' ji w 1 i g 1 ; ij G % j ' ji w % i g % ij The quantities S1 and S+ were drawn from a file of all Medicare-covered home health claims constructed by the Health Care Financing Administration. The file contains all home health visits provided to Medicare beneficiaries during CY Visits were aggregated to episodes of care, defined to begin on the first date of service not preceded by any other service in the previous 60 days. Episodes continued until a date of service was identified that was not followed by any other service in the subsequent 60 days. These episodes were in turn divided into 60-day segments of care. Visits were apportioned to segments based on the from and through dates of Medicare home health claims. Additional considerations Abt Associates Inc. Home Health Case-Mix Project: Second Interim Report, 9/24/1999 F-2
176 1. Collapsing cells. Because individuals are not evenly distributed across case-mix groups in the study sample, it will sometimes occur that no individuals (or very few individuals) in a sample cell are assigned to a given case-mix group. When this occurs, the cells must be collapsed into larger aggregates to secure reasonably stable estimates of population totals. For any case-mix group containing fewer than 50 segments in the study sample, all cells are collapsed and only one national estimate is calculated. For case-mix groups containing at least 20 segments in each Census region, separate regional weights and totals are calculated. For those case-mix groups for which totals by Census region are computed, separate weights and totals by agency type are computed for each group and region in which at least 20 segments are observed in each of the four agency type strata (government, forprofit, nonprofit, facility-based). Finally, within cells defined by region and agency type, separate urban and rural weights are calculated for those groups having at least 20 urban and 20 rural segments. This process resulted in 32 cells for which population weights were computed. Table F.2 displays both the total number of segments in each cell and the number of segments containing more than four home health visits. This restriction reduced the population number of initial segments by about 14 percent and the number of subsequent segments by about 21 percent. Though not shown explicitly in the table, calculations performed on the table entries indicate a tendency for these reductions to occur disproportionately among hospital-based agencies. 2. Inability to assign case-mix groups. The scheme for weighting as presented above assumes that a case-mix group can be assigned to every segment observed in the study sample. In some instances, however, usable OASIS data were not available or could not reliably be associated with a particular segment of home health care. If these segments are ignored, then following the procedure outlined above requires the implicit assumption that the distribution of segments by case-mix group is the same for those segments whose casemix group cannot be ascertained as it is for those segments whose case-mix group is known. Abt Associates Inc. Home Health Case-Mix Project: Second Interim Report, 9/24/1999 F-3

177
Executive Summary. This Project
 Executive Summary The Health Care Financing Administration (HCFA) has had a long-term commitment to work towards implementation of a per-episode prospective payment approach for Medicare home health services,
Key points. Home Care agency structures. Introduction to Physical Therapy in the Home Care Setting. Home care industry
 Introduction to Physical Therapy in the Home Care Setting Home Health Section of APTA Key points Home care industry Client populations Prospective Payment System (PPS) Physical therapy services Assessment
August 25, Dear Ms. Verma:
 Seema Verma Administrator Centers for Medicare & Medicaid Services Hubert H. Humphrey Building 200 Independence Avenue, S.W. Room 445-G Washington, DC 20201 CMS 1686 ANPRM, Medicare Program; Prospective
2014 MASTER PROJECT LIST
 Promoting Integrated Care for Dual Eligibles (PRIDE) This project addressed a set of organizational challenges that high performing plans must resolve in order to scale up to serve larger numbers of dual
Prepared for North Gunther Hospital Medicare ID August 06, 2012
 Prepared for North Gunther Hospital Medicare ID 000001 August 06, 2012 TABLE OF CONTENTS Introduction: Benchmarking Your Hospital 3 Section 1: Hospital Operating Costs 5 Section 2: Margins 10 Section 3:
All Medicare Advantage Organizations (MAOs), PACE Organizations, Cost Plans, and certain Demonstrations
, PACE Organizations, Cost Plans, and certain Demonstrations") DEPARTMENT OF HEALTH & HUMAN SERVICES Centers for Medicare & Medicaid Services 7500 Security Boulevard Baltimore, Maryland 21244-1850 CENTER FOR MEDICARE MEDICARE PLAN PAYMENT GROUP TO: FROM: SUBJECT:
DEPARTMENT OF HEALTH & HUMAN SERVICES Centers for Medicare & Medicaid Services 7500 Security Boulevard Baltimore, Maryland 21244-1850 CENTER FOR MEDICARE MEDICARE PLAN PAYMENT GROUP TO: FROM: SUBJECT:
OASIS-B1 and OASIS-C Items Unchanged, Items Modified, Items Dropped, and New Items Added.
 Items Added. OASIS-B1 Items UNCHANGED on OASIS-C OASIS-C Item # M0014 M0016 M0020 M0030 M0032 M0040 M0050 M0060 M0063 M0064 M0065 M0066 M0069 M0080 M0090 M0100 M0110 M0220 M1005 M1030 M1200 M1230 M1324
Objectives 2/23/2011. Crossing Paths Intersection of Risk Adjustment and Coding
 Crossing Paths Intersection of Risk Adjustment and Coding 1 Objectives Define an outcome Define risk adjustment Describe risk adjustment measurement Discuss interactive scenarios 2 What is an Outcome?
September 25, Via Regulations.gov
 September 25, 2017 Via Regulations.gov The Honorable Seema Verma Administrator Centers for Medicare & Medicaid Services 7500 Security Boulevard Baltimore, MD 21244-1850 RE: Medicare and Medicaid Programs;
06-01 FORM HCFA WORKSHEET S - HOME HEALTH AGENCY COST REPORT The intermediary indicates in the appropriate box whether this is the
 06-01 FORM HCFA-1728-94 3204 3203. WORKSHEET S - HOME HEALTH AGENCY COST REPORT The intermediary indicates in the appropriate box whether this is the initial cost report (first cost report filed for the
REPORT OF THE BOARD OF TRUSTEES
 REPORT OF THE BOARD OF TRUSTEES B of T Report 21-A-17 Subject: Presented by: Risk Adjustment Refinement in Accountable Care Organization (ACO) Settings and Medicare Shared Savings Programs (MSSP) Patrice
You re In or You re Out: Determining Winners and Losers Under a Global Payment System
 You re In or You re Out: Determining Winners and Losers Under a Global Payment System PRESENTED TO: Northeast Home Health Leadership Summit PRESENTED BY: Allen Dobson, Ph.D. PREPARED BY: Allen Dobson,
Medicare Skilled Nursing Facility Prospective Payment System
 Final Rule Summary Medicare Skilled Nursing Facility Prospective Payment System Program Year: FY2019 August 2018 1 TABLE OF CONTENTS Overview and Resources... 2 SNF Payment Rates... 2 Wage Index and Labor-Related
OASIS QUALITY IMPROVEMENT REPORTS
 6 OASIS QUALITY REPORTS GENERAL INFORMATION... 2 AGENCY PATIENT-RELATED CHARACTERISTICS (CASE MIX) REPORT... 4 AGENCY PATIENT-RELATED CHARACTERISTICS (CASE MIX) TALLY REPORT 9 HHA REVIEW AND CORRECT REPORT...13
Working Paper Series
 The Financial Benefits of Critical Access Hospital Conversion for FY 1999 and FY 2000 Converters Working Paper Series Jeffrey Stensland, Ph.D. Project HOPE (and currently MedPAC) Gestur Davidson, Ph.D.
Outcomes Measurement in Long-Term Care (LTC)
") ASHA Short Course Outcomes Measurement in Long-Term Care (LTC) Bill Goulding, MS/CCC-SLP November 19, 2012 How Do We Show Value? Easy to measure! Not so easy! V $$$ A L Impact? Cost U Benefit E What do
ASHA Short Course Outcomes Measurement in Long-Term Care (LTC) Bill Goulding, MS/CCC-SLP November 19, 2012 How Do We Show Value? Easy to measure! Not so easy! V $$$ A L Impact? Cost U Benefit E What do
Scottish Hospital Standardised Mortality Ratio (HSMR)
") ` 2016 Scottish Hospital Standardised Mortality Ratio (HSMR) Methodology & Specification Document Page 1 of 14 Document Control Version 0.1 Date Issued July 2016 Author(s) Quality Indicators Team Comments
` 2016 Scottish Hospital Standardised Mortality Ratio (HSMR) Methodology & Specification Document Page 1 of 14 Document Control Version 0.1 Date Issued July 2016 Author(s) Quality Indicators Team Comments
Analysis of 340B Disproportionate Share Hospital Services to Low- Income Patients
 Analysis of 340B Disproportionate Share Hospital Services to Low- Income Patients March 12, 2018 Prepared for: 340B Health Prepared by: L&M Policy Research, LLC 1743 Connecticut Ave NW, Suite 200 Washington,
MDS 3.0: What Leadership Needs to Know
 MDS 3.0: What Leadership Needs to Know especially prepared for CANPFA Ann Spenard RN, MSN History of the MDS and RAI Process The Resident Assessment Instrument (RAI) was part of a set of reforms enacted
time to replace adjusted discharges
 REPRINT May 2014 William O. Cleverley healthcare financial management association hfma.org time to replace adjusted discharges A new metric for measuring total hospital volume correlates significantly
Final Report No. 101 April Trends in Skilled Nursing Facility and Swing Bed Use in Rural Areas Following the Medicare Modernization Act of 2003
 Final Report No. 101 April 2011 Trends in Skilled Nursing Facility and Swing Bed Use in Rural Areas Following the Medicare Modernization Act of 2003 The North Carolina Rural Health Research & Policy Analysis
Case-mix Analysis Across Patient Populations and Boundaries: A Refined Classification System
 Case-mix Analysis Across Patient Populations and Boundaries: A Refined Classification System Designed Specifically for International Quality and Performance Use A white paper by: Marc Berlinguet, MD, MPH
Development of Updated Models of Non-Therapy Ancillary Costs
 Development of Updated Models of Non-Therapy Ancillary Costs Doug Wissoker A. Bowen Garrett A memo by staff from the Urban Institute for the Medicare Payment Advisory Commission Urban Institute MedPAC
CMS Proposed SNF Payment System -- Resident Classification System: Version I (RCS-1)
") CMS Proposed SNF Payment System -- Resident Classification System: Version I (RCS-1) Ohio Health Care Association Mike Cheek, Senior Vice President, Reimbursement Policy October 3, 2017 Background 1 FY18
CMS Proposed SNF Payment System -- Resident Classification System: Version I (RCS-1) Ohio Health Care Association Mike Cheek, Senior Vice President, Reimbursement Policy October 3, 2017 Background 1 FY18
A REVIEW OF NURSING HOME RESIDENT CHARACTERISTICS IN OHIO: TRACKING CHANGES FROM
 A REVIEW OF NURSING HOME RESIDENT CHARACTERISTICS IN OHIO: TRACKING CHANGES FROM 1994-2004 Shahla Mehdizadeh Robert Applebaum Scripps Gerontology Center Miami University March 2005 This report was funded
CRS Report for Congress Received through the CRS Web
 CRS Report for Congress Received through the CRS Web Order Code RS20386 Updated April 16, 2001 Medicare's Skilled Nursing Facility Benefit Summary Heidi G. Yacker Information Research Specialist Information
CMS-0044-P; Proposed Rule: Medicare and Medicaid Programs; Electronic Health Record Incentive Program Stage 2
 May 7, 2012 Submitted Electronically Ms. Marilyn Tavenner Acting Administrator Centers for Medicare and Medicaid Services Department of Health and Human Services Room 445-G, Hubert H. Humphrey Building
CY2019 Proposed Medicare Home Health Rate Rule and Much More
 Medicare Home Health Proposed Rule July 13, 2018 William A. Dombi President wad@nahc.org Mary K. Carr Vice President mkc@nahc.org CY2019 Proposed Medicare Home Health Rate Rule and Much More Published
Chapter 6 Section 3. Hospital Reimbursement - TRICARE DRG-Based Payment System (Basis Of Payment)
") Diagnostic Related Groups (DRGs) Chapter 6 Section 3 Hospital Reimbursement - TRICARE DRG-Based Payment System (Basis Of Payment) Issue Date: October 8, 1987 Authority: 32 CFR 199.14(a)(1) 1.0 APPLICABIITY
Diagnostic Related Groups (DRGs) Chapter 6 Section 3 Hospital Reimbursement - TRICARE DRG-Based Payment System (Basis Of Payment) Issue Date: October 8, 1987 Authority: 32 CFR 199.14(a)(1) 1.0 APPLICABIITY
Trends in Skilled Nursing and Swing-bed Use in Rural Areas,
 Trends in Skilled Nursing and Swing-bed Use in Rural Areas, 1996- Working Paper No. 83 WORKING PAPER SERIES North Carolina Rural Health Research and Policy Analysis Center Cecil G. Sheps Center for Health
GUIDELINES FOR CRITERIA AND CERTIFICATION RULES ANNEX - JAWDA Data Certification for Healthcare Providers - Methodology 2017.
 GUIDELINES FOR CRITERIA AND CERTIFICATION RULES ANNEX - JAWDA Data Certification for Healthcare Providers - Methodology 2017 December 2016 Page 1 of 14 1. Contents 1. Contents 2 2. General 3 3. Certification
The Pain or the Gain?
 The Pain or the Gain? Comprehensive Care Joint Replacement (CJR) Model DRG 469 (Major joint replacement with major complications) DRG 470 (Major joint without major complications or comorbidities) Actual
(M1025) Case-Mix Diagnosis (Optional) OPTIONAL Complete only if a Z-code in Column 2 is reported in place of a resolved condition
 Case-Mix Diagnosis (Optional) OPTIONAL Complete only if a Z-code in Column 2 is reported in place of a resolved condition") HOME HEALTH 2017 PPS CALCULATION WORKSHEET PATIENT NAME: ID NUMBER: DATE: TYPE OF ASSESSMENT: Start of care Follow-up M0110 - EPISODE TIMING: Is the Medicare home health payment episode f which this assessment
HOME HEALTH 2017 PPS CALCULATION WORKSHEET PATIENT NAME: ID NUMBER: DATE: TYPE OF ASSESSMENT: Start of care Follow-up M0110 - EPISODE TIMING: Is the Medicare home health payment episode f which this assessment
Medicare Home Health Prospective Payment System (HHPPS) Calendar Year (CY) 2013 Final Rule
 Calendar Year (CY) 2013 Final Rule") Last updated 11/13/12 Contact: Advocacy@apta.org Medicare Home Health Prospective Payment System (HHPPS) Calendar Year (CY) 2013 Final Rule Introduction COMPREHENSIVE SUMMARY On November 2, 2012, the Centers
Last updated 11/13/12 Contact: Advocacy@apta.org Medicare Home Health Prospective Payment System (HHPPS) Calendar Year (CY) 2013 Final Rule Introduction COMPREHENSIVE SUMMARY On November 2, 2012, the Centers
Medicare Home Health Prospective Payment System
 Medicare Home Health Prospective Payment System Payment Rule Brief Final Rule Program Year: CY 2013 Overview On November 8, 2012, the Centers for Medicare and Medicaid Services (CMS) officially released
Distribution of Post-Acute Care under CJR Model of Lower Extremity Joint Replacements for MS-DRG 470
 Distribution of Post-Acute Care under CJR Model of Lower Extremity Joint Replacements for MS-DRG 470 Introduction The goal of the Medicare Comprehensive Care for Joint Replacement (CJR) payment model is
ALTERNATIVES TO THE OUTPATIENT PROSPECTIVE PAYMENT SYSTEM: ASSESSING
 ALTERNATIVES TO THE OUTPATIENT PROSPECTIVE PAYMENT SYSTEM: ASSESSING THE IMPACT ON RURAL HOSPITALS Final Report April 2010 Janet Pagan-Sutton, Ph.D. Claudia Schur, Ph.D. Katie Merrell 4350 East West Highway,
Re: Rewarding Provider Performance: Aligning Incentives in Medicare
 September 25, 2006 Institute of Medicine 500 Fifth Street NW Washington DC 20001 Re: Rewarding Provider Performance: Aligning Incentives in Medicare The American College of Physicians (ACP), representing
Exhibit A. Part 1 Statement of Work
 Exhibit A Part 1 Statement of Work Contractor shall provide Basic Neurological services as described herein to Medicaid eligible Clients who are authorized to receive services at the Contractor s owned
Introduction and Executive Summary
 Introduction and Executive Summary 1. Introduction and Executive Summary. Hospital length of stay (LOS) varies markedly and persistently across geographic areas in the United States. This phenomenon is
MEDICARE PROGRAM; FY 2014 HOSPICE WAGE INDEX AND PAYMENT RATE UPDATE; HOSPICE QUALITY REPORTING REQUIREMENTS; AND UPDATES ON PAYMENT REFORM SUMMARY
 MEDICARE PROGRAM; FY 2014 HOSPICE WAGE INDEX AND PAYMENT RATE UPDATE; HOSPICE QUALITY REPORTING REQUIREMENTS; AND UPDATES ON PAYMENT REFORM SUMMARY On April 29, 2013, the Centers for Medicare & Medicaid
3M Health Information Systems. 3M Clinical Risk Groups: Measuring risk, managing care
 3M Health Information Systems 3M Clinical Risk Groups: Measuring risk, managing care 3M Clinical Risk Groups: Measuring risk, managing care Overview The 3M Clinical Risk Groups (CRGs) are a population
Introduction Patient-Centered Outcomes Research Institute (PCORI)
") 2 Introduction The Patient-Centered Outcomes Research Institute (PCORI) is an independent, nonprofit health research organization authorized by the Patient Protection and Affordable Care Act of 2010. Its
2 Introduction The Patient-Centered Outcomes Research Institute (PCORI) is an independent, nonprofit health research organization authorized by the Patient Protection and Affordable Care Act of 2010. Its
Seema Verma Centers for Medicare & Medicaid Services Department of Health and Human Services Attn: CMS-1696-P P.O. Box 8016 Baltimore, MD
 June 26, 2018 Seema Verma Centers for Medicare & Medicaid Services Department of Health and Human Services Attn: CMS-1696-P P.O. Box 8016 Baltimore, MD 21244-1850 Re: CMS-1696-P Medicare Program; Prospective
National Hospice and Palliative Care OrganizatioN. Facts AND Figures. Hospice Care in America. NHPCO Facts & Figures edition
 National Hospice and Palliative Care OrganizatioN Facts AND Figures Hospice Care in America 2017 Edition NHPCO Facts & Figures - 2017 edition Table of Contents 2 Introduction 2 About this report 2 What
Medicare Spending and Rehospitalization for Chronically Ill Medicare Beneficiaries: Home Health Use Compared to Other Post-Acute Care Settings
 Medicare Spending and Rehospitalization for Chronically Ill Medicare Beneficiaries: Home Health Use Compared to Other Post-Acute Care Settings May 11, 2009 Avalere Health LLC Avalere Health LLC The intersection
Attachment A - Comparison of OASIS-C (Current Version) to OASIS-C1 (Proposed Data Collection)
 to OASIS-C1 (Proposed Data Collection)") Attachment A - Comparison of OASIS-C (Current Version) to (Proposed Data Collection) OASIS-C M0010 CMS Certification Number S M0010 CMS Certification Number M0014 Branch State S M0014 Branch State S M0016
Attachment A - Comparison of OASIS-C (Current Version) to (Proposed Data Collection) OASIS-C M0010 CMS Certification Number S M0010 CMS Certification Number M0014 Branch State S M0014 Branch State S M0016
The influx of newly insured Californians through
 January 2016 Managing Cost of Care: Lessons from Successful Organizations Issue Brief The influx of newly insured Californians through the public exchange and Medicaid expansion has renewed efforts by
Final Rule Summary. Medicare Skilled Nursing Facility Prospective Payment System Fiscal Year 2017
 Final Rule Summary Medicare Skilled Nursing Facility Prospective Payment System Fiscal Year 2017 August 2016 Table of Contents Overview and Resources... 2 Skilled Nursing Facility (SNF) Payment Rates...
Determining Like Hospitals for Benchmarking Paper #2778
 Determining Like Hospitals for Benchmarking Paper #2778 Diane Storer Brown, RN, PhD, FNAHQ, FAAN Kaiser Permanente Northern California, Oakland, CA, Nancy E. Donaldson, RN, DNSc, FAAN Department of Physiological
Medicare: This subset aligns with the requirements defined by CMS and is for the review of Medicare and Medicare Advantage beneficiaries
 InterQual Level of Care Criteria Subacute & SNF Criteria Review Process Introduction InterQual Level of Care Criteria support determining the appropriateness of admission, continued stay, and discharge
SNF proposed rule revisions to case-mix methodology
 SNF proposed rule revisions to case-mix methodology Comments due: August 25, 2017 CMS intent to propose case-mix refinements in the FY 2019 SNF PPS proposed rule Summary of changes Goals of the change:
Overview of the Hospice Proposed Rule
 HOSPICE Overview of Hospice Payment Reform Robert J. Simione Managing Principal Simione Healthcare Consultants On April 29, 2013 CMS issued the proposed rule that would update FY 2014 Medicare payment
Medicare Advantage PPO participation Termination - Practice Name (Tax ID #: <TaxID>)
") July xx, 2013 INDIVDUAL PRACTICE VERSION RE: Medicare Advantage PPO participation Termination - Practice Name (Tax ID #: ) Dear :
July xx, 2013 INDIVDUAL PRACTICE VERSION RE: Medicare Advantage PPO participation Termination - Practice Name (Tax ID #: ) Dear :
Dual Eligibles: Medicaid s Role in Filling Medicare s Gaps
 I S S U E P A P E R kaiser commission on medicaid and the uninsured March 2004 Dual Eligibles: Medicaid s Role in Filling Medicare s Gaps In 2000, over 7 million people were dual eligibles, low-income
An Analysis of Medicaid Costs for Persons with Traumatic Brain Injury While Residing in Maryland Nursing Facilities
 An Analysis of Medicaid for Persons with Traumatic Brain Injury While Residing in Maryland Nursing Facilities December 19, 2008 Table of Contents An Analysis of Medicaid for Persons with Traumatic Brain
Leveraging Your Facility s 5 Star Analysis to Improve Quality
 Leveraging Your Facility s 5 Star Analysis to Improve Quality DNS/DSW Conference November, 2016 Presented by: Kathy Pellatt, Senior Quality Improvement Analyst, LeadingAge NY Susan Chenail, Senior Quality
Cancer Hospital Workgroup
 Cancer Hospital Workgroup William G. Lehrman, PhD Centers for Medicare & Medicaid Services (CMS) August 28, 2014 2:00 3:00 PM ET Agenda Roll Call PCHQR Program Updates HCAHPS Updates 2 PPS-Exempt Cancer
Cancer Hospital Workgroup. Agenda. PPS-Exempt Cancer Hospital Quality Reporting Program. Roll Call PCHQR Program Updates HCAHPS Updates
 Cancer Hospital Workgroup William G. Lehrman, PhD Centers for Medicare & Medicaid Services (CMS) August 28, 2014 2:00 3:00 PM ET Agenda Roll Call PCHQR Program Updates HCAHPS Updates 2 PPS-Exempt Cancer
Scoring Methodology FALL 2016
 Scoring Methodology FALL 2016 CONTENTS What is the Hospital Safety Grade?... 4 Eligible Hospitals... 4 Measures... 5 Measure Descriptions... 7 Process/Structural Measures... 7 Computerized Physician Order
Frequently Asked Questions (FAQ) Updated September 2007
 Updated September 2007") Frequently Asked Questions (FAQ) Updated September 2007 This document answers the most frequently asked questions posed by participating organizations since the first HSMR reports were sent. The questions
Frequently Asked Questions (FAQ) Updated September 2007 This document answers the most frequently asked questions posed by participating organizations since the first HSMR reports were sent. The questions
BACKGROUND PAPER: RURAL AND URBAN DIFFERENCES IN NURSING HOME AND SKILLED NURSING SUPPLY
 BACKGROUND PAPER: RURAL AND URBAN DIFFERENCES IN NURSING HOME AND SKILLED NURSING SUPPLY Working Paper No. 74 WORKING PAPER SERIES North Carolina Rural Health Research and Policy Analysis Center Cecil
Medicare Spending and Rehospitalization for Chronically Ill Medicare Beneficiaries: Home Health Use Compared to Other Post-Acute Care Settings
 Medicare Spending and Rehospitalization for Chronically Ill Medicare Beneficiaries: Home Health Use Compared to Other Post-Acute Care Settings Executive Summary The Alliance for Home Health Quality and
Impact of Financial and Operational Interventions Funded by the Flex Program
 Impact of Financial and Operational Interventions Funded by the Flex Program KEY FINDINGS Flex Monitoring Team Policy Brief #41 Rebecca Garr Whitaker, MSPH; George H. Pink, PhD; G. Mark Holmes, PhD University
Medi-Pak Advantage: Reimbursement Methodology
 Medi-Pak Advantage: Reimbursement Methodology The information located on the following pages is intended to summarize the reimbursement methodologies for Medi-Pak Advantage: Medi-Pak Advantage reimburses
2017 Quality Reporting: Claims and Administrative Data-Based Quality Measures For Medicare Shared Savings Program and Next Generation ACO Model ACOs
 2017 Quality Reporting: Claims and Administrative Data-Based Quality Measures For Medicare Shared Savings Program and Next Generation ACO Model ACOs June 15, 2017 Rabia Khan, MPH, CMS Chris Beadles, MD,
The Home Health Groupings Model (HHGM)
") The Home Health Groupings Model (HHGM) September 5, 017 PRESENTED BY: Al Dobson, Ph.D. PREPARED BY: Al Dobson, Ph.D., Alex Hartzman, M.P.A, M.P.H., Kimberly Rhodes, M.A., Sarmistha Pal, Ph.D., Sung Kim,
The Home Health Groupings Model (HHGM) September 5, 017 PRESENTED BY: Al Dobson, Ph.D. PREPARED BY: Al Dobson, Ph.D., Alex Hartzman, M.P.A, M.P.H., Kimberly Rhodes, M.A., Sarmistha Pal, Ph.D., Sung Kim,
Changes to the RAI manual effective October 1, 2013
 Changes to the RAI manual effective October 1, 2013 CMS released on Friday, September 27 an updated version of the RAI manual that became effective October 1, 2013. The manual is found here> http://www.cms.gov/medicare/quality-initiatives-patient-assessment-
Equalizing Medicare Payments for Select Patients in IRFs and SNFs
 Equalizing Medicare Payments for Select Patients in IRFs and SNFs Doug Wissoker Bowen Garrett A report by staff from the Urban Institute for the Medicare Payment Advisory Commission The Urban Institute
HOMECARE AND HOSPICE REIMBURSEMENT
 Hospice Modeling Hospice Changes to Prepare for Medicare Reimbursement and Care Delivery Reform Robert J. Simione Managing Principal Simione Healthcare Consultants, LLC HOMECARE AND HOSPICE REIMBURSEMENT
Medicare P4P -- Medicare Quality Reporting, Incentive and Penalty Programs
 Medicare P4P -- Medicare Quality Reporting, Incentive and Penalty Programs Presenter: Daniel J. Hettich King & Spalding; Washington, DC dhettich@kslaw.com 1 I. Introduction Evolution of Medicare as a Purchaser
Gantt Chart. Critical Path Method 9/23/2013. Some of the common tools that managers use to create operational plan
 Some of the common tools that managers use to create operational plan Gantt Chart The Gantt chart is useful for planning and scheduling projects. It allows the manager to assess how long a project should
HCCA South Central Regional Annual Conference November 21, 2014 Nashville, TN. Post Acute Provider Specific Sections from OIG Work Plans
 HCCA South Central Regional Annual Conference November 21, 2014 Nashville, TN Kelly Priegnitz # Chris Puri # Kim Looney Post Acute Provider Specific Sections from 2012-2015 OIG Work Plans I. NURSING HOMES
An Initial Review of the CY Medicare Home Health Rule. CY2018 Proposed Medicare Home Health Rate Rule and Much More
 An Initial Review of the CY 2018 2019 Medicare Home Health Rule Mary K. Carr William A. Dombi NAHC CY2018 Proposed Medicare Home Health Rate Rule and Much More Published July 25, 2017 https://www.cms.gov/medicare/medicare
Patient Driven Payment Model (PDPM) and the MDS: A Total Evolution of the SNF Payment Model
 and the MDS: A Total Evolution of the SNF Payment Model") Patient Driven Payment Model (PDPM) and the MDS: A Total Evolution of the SNF Payment Model By Devin Kassi, PT, DPT, and Melissa Keiter, RN, RAC-CT, DNS-CT, DON Centers for Medicare & Medicaid Services
Patient Driven Payment Model (PDPM) and the MDS: A Total Evolution of the SNF Payment Model By Devin Kassi, PT, DPT, and Melissa Keiter, RN, RAC-CT, DNS-CT, DON Centers for Medicare & Medicaid Services
Attachment C: Itemized List of OASIS Data Elements
 Attachment C: Itemized List of OASIS Data Item Description Number of Data SOC ROC FU TOC DTH DIS M0010 CMS Certification Number 1 1 M0014 Branch State 1 1 M0016 Branch ID Number 1 1 M0018 National Provider
MLN Matters Number: MM6699 Related Change Request (CR) #: 6699
 #: 6699") News Flash Medicare will cover immunizations for H1N1 influenza also called the "swine flu." There will be no coinsurance or copayment applied to this benefit, and beneficiaries will not have to meet their
News Flash Medicare will cover immunizations for H1N1 influenza also called the "swine flu." There will be no coinsurance or copayment applied to this benefit, and beneficiaries will not have to meet their
Population and Sampling Specifications
 Mat erial inside brac ket s ( [ and ] ) is new to t his Specific ati ons Manual versi on. Introduction Population Population and Sampling Specifications Defining the population is the first step to estimate
HOT ISSUES FACING HOME HEALTH & HOSPICE AGENCIES. Luke James Chief Strategy Officer Encompass Home Health & Hospice
 HOT ISSUES FACING HOME HEALTH & HOSPICE AGENCIES Luke James Chief Strategy Officer Encompass Home Health & Hospice Hospice Challenges Past & Present Face-to-Face (F2F) Implementation Sequestration Cuts
CMS Proposed Home Health Claims-Based Rehospitalization and Emergency Department Use Quality Measures
 July 15, 2013 Acumen, LLC 500 Airport Blvd., Suite 365 Burlingame, CA 94010 RE: CMS Proposed Home Health Claims-Based Rehospitalization and Emergency Department Use Quality Measures To Whom It May Concern:
Aging in Place: Do Older Americans Act Title III Services Reach Those Most Likely to Enter Nursing Homes? Nursing Home Predictors
 T I M E L Y I N F O R M A T I O N F R O M M A T H E M A T I C A Improving public well-being by conducting high quality, objective research and surveys JULY 2010 Number 1 Helping Vulnerable Seniors Thrive
MDS FOR THE ADMINISTRATOR: WHAT YOU NEED TO KNOW
 MDS FOR THE ADMINISTRATOR: WHAT YOU NEED TO KNOW LIBBY YOUSE, LNHA Long Term Care Leadership Coach OBJECTIVES Understanding factors why MDS s are so important in your home Identify the effects it places
DA: November 29, Centers for Medicare and Medicaid Services National PACE Association
 DA: November 29, 2017 TO: FR: RE: Centers for Medicare and Medicaid Services National PACE Association NPA Comments to CMS on Development, Implementation, and Maintenance of Quality Measures for the Programs
Outpatient Hospital Facilities
 Outpatient Hospital Facilities Chapter 6 Chapter Outline Introduce students to 1. Different outpatient facilities 2. Different departments involved in the reimbursement process 3. The Chargemaster 4. Terminology
III. HOW NURSING FACILITIES ARE FUNDED
 III. HOW NURSING FACILITIES KEY POINTS Today, nursing and rehabilitation facilities are funded through four sources: Medicare, Medicaid, Quality Assurance Assessment Program and patient pay. Medicare Part
Regulatory Compliance Risks. September 2009
 Rehabilitation Regulatory Compliance Risks September 2009 1 Agenda - Rehabilitation Compliance Risks Understand the basic requirements for Inpatient Rehabilitation Facilities (IRFs) and Outpatient Rehabilitation
Review Process. Introduction. InterQual Level of Care Criteria Long-Term Acute Care Criteria
 InterQual Level of Care Criteria Long-Term Acute Care Criteria Review Process Introduction InterQual Level of Care Criteria support determining the appropriateness of Long-Term Acute Care (LTAC) admission,
Objectives 9/18/2018. Patient Driven Payment Model(PDPM) Janine Finck Boyle, MBA/HCA, LNHA Vice President of Regulatory Affairs Fall 2018
 Janine Finck Boyle, MBA/HCA, LNHA Vice President of Regulatory Affairs Fall 2018") Patient Driven Payment Model(PDPM) Janine Finck Boyle, MBA/HCA, LNHA Vice President of Regulatory Affairs Fall 2018 Mission: The trusted voice for aging. Objectives List the five(5) case mix components
Patient Driven Payment Model(PDPM) Janine Finck Boyle, MBA/HCA, LNHA Vice President of Regulatory Affairs Fall 2018 Mission: The trusted voice for aging. Objectives List the five(5) case mix components
Minnesota Statewide Quality Reporting and Measurement System: Quality Incentive Payment System
 Minnesota Statewide Quality Reporting and Measurement System: Quality Incentive Payment System JUNE 2015 DIVISION OF HEALTH POLICY/HEALTH ECONOMICS PROGRAM Minnesota Statewide Quality Reporting and Measurement
CHAPTER 1. Documentation is a vital part of nursing practice.
 CHAPTER 1 PURPOSE OF DOCUMENTATION CHAPTER OBJECTIVE After completing this chapter, the reader will be able to identify the importance and purpose of complete documentation in the medical record. LEARNING
The PCT Guide to Applying the 10 High Impact Changes
 The PCT Guide to Applying the 10 High Impact Changes This Guide has been produced by the NHS Modernisation Agency. For further information on the Agency or the 10 High Impact Changes please visit www.modern.nhs.uk
Reference materials are provided with the criteria and should be used to assist in the correct interpretation of the criteria.
 InterQual Level of Care Criteria Rehabilitation Criteria Review Process Introduction InterQual Level of Care Criteria support determining the appropriateness of admission, continued stay, and discharge
The Shift is ON! Goodbye PPS, Hello RCS
 The Shift is ON! Goodbye PPS, Hello RCS Presented By Maureen McCarthy, RN, BS, RAC-MT, QCP-MT President/CEO Maureen McCarthy, RN, BS, RAC-MT, QCP-MT Maureen is the President of Celtic Consulting, LLC and
Contracts and Grants between Nonprofits and Government
 br I e f # 03 DeC. 2013 Government-Nonprofit Contracting Relationships www.urban.org INsIDe this IssUe In 2012, local, state, and federal governments worked with nearly 56,000 nonprofit organizations.
QUALITY MEASURES WHAT S ON THE HORIZON
 QUALITY MEASURES WHAT S ON THE HORIZON The Hospice Quality Reporting Program (HQRP) November 2013 Plan for the Day Discuss the implementation of the Hospice Item Set (HIS) Discuss the implementation of
OASIS-C2 FIELD GUIDE TO DATA COLLECTION
 OASIS-C2 FIELD GUIDE TO DATA COLLECTION Outcome and Assessment Information Set OASIS-C2 Guidance Manual Effective January 1, 2018 Manual: Effective January 1, 2018 Q&A from November 2016 Categories 1 through
ALABAMA MEDICAID AGENCY ADMINISTRATIVE CODE CHAPTER 560-X-45 MATERNITY CARE PROGRAM TABLE OF CONTENTS
 ALABAMA MEDICAID AGENCY ADMINISTRATIVE CODE CHAPTER 560-X-45 MATERNITY CARE PROGRAM TABLE OF CONTENTS 560-X-45-.01 560-X-45-.02 560-X-45-.03 560-X-45-.04 560-X-45-.05 560-X-45-.06 560-X-45-.07 560-X-45-.08
The TeleHealth Model THE TELEHEALTH SOLUTION
 The Model 1 CareCycle Solutions The Solution Calendar Year 2011 Data Company Overview CareCycle Solutions (CCS) specializes in managing the needs of chronically ill patients through the use of Interventional
Rapid Recovery Therapy Program. GTA Rehab Network Best Practices Day 2017 Joan DeBruyn & Helen Janzen
 Rapid Recovery Therapy Program GTA Rehab Network Best Practices Day 2017 Joan DeBruyn & Helen Janzen $1 Million Photo credit: Physi-med.org Agenda About the Program Description of the Rapid Recovery Therapy