Dec-06 May-06 Jun-07. KEY PERFORMANCE INDICATORS Month Year to date Month Year to date
|
|
|
- Kristina Carson
- 5 years ago
- Views:
Transcription
1 60.00 Dec-06 May-06 Jun-07 KEY PERFORMANCE INDICATORS Month Year to date Month Year to date CLINICAL QUALITY Jun-06 Jun-07 Target Var Actual Target Var DELIVERY QUALITY Jun-06 Jun-07 Target Var Actual Target Var Readmission Rate 4.2% 2.9% 4.5% 36.2% 4.5% 4.5% (0.6%) Overall Inpatient Satisfaction - Quarterly (Good & Very Good) (Q) - March % 91.7% 90% 1.9% 92.1% 90% 2.3% Unplanned Readmission to ICU (Surgery) (7) (1) 16 0 (16) Staff Turnover % (FTE Basis) (1)(8) 0.97% 1.16% 1.2% 3.2% 12.72% 14.4% 11.7% Caesarean Section Rate (5) 34.2% 28.8% 28.0% (2.7%) 32.9% 28.0% (17.6%) Sick Leave % (1) 3.04% 3.39% 3% (13.0%) 3.15% 3% (5.1%) BSI - Hospital Acquired Blood Stream Infection Rate (1) 0.51% 0.4% 0.15% (192.8%) 0.36% 0.15% (138.6%) ED Triage - Priority 1 (1) 100.0% 100% 100% 0% 100% 100% 0% Hospital-Acquired S. Aureus Bloodstream Infections * 0.20% 0.00% (0.20%) 0.072% 0.0% (0.072%) ED Triage - Priority 2 (1) 84.0% 86.1% 80% 7.6% 87.8% 80% 9.7% Medical Outlier Days (3) (78) (1,154) ED Triage - Priority 3 (1) 55.8% 65.7% 75% (12%) 65.3% 75% (13%) Surgical Outlier Days (3) Average number of working days to resolve complaints (1) (9%) (11%) Paediatric Admits to Adult Wards (4) (13) (156) Outpatients Number Waiting > six months on the waiting list (1 Inpatients Number Waiting > six months (76) 76 0 (76) (155) (155) PRODUCTIVITY Jun-06 Jun-07 Target Var Actual Target Var FINANCIAL PERFORMANCE Jun-06 Jun-07 Target Var Actual Target Var ALOS Med_Surg Only(1) (7.9%) (2.9%) WIES11A Caseweight Volumes (Based on month end coding) 2,213 2,121 2,371 (10.5%) 28,172 28, % Resourced Occupancy (1) 84% 88% 85% 3.6% 87% 85% 2.2% Outpatient FSA Volumes (1) 1,775 1,747 2,195 (20.4%) 22,397 24,622 (9.0%) Elective Theatre Utilisation (MOT) 76% 85% 85% 0.0% 83% 85% (2.1%) Outpatient FU Volumes (1) 4,456 4,444 4,967 (10.5%) 54,424 56,139 (3.1%) Day Surgery Utilisation (DSU) 81% 91% 85% 7.1% 73% 85% (14.2%) Emergency Dept attendances 2,713 2,757 2, % 36,079 30, % Elective Daycase Rate (1) (2) 64% 78% 77% 0.7% 73% 77% (5.6%) FTEs 2,368 2,309 2,284 (1.1%) 2,292 2, % Outpatient DNA Rate (1) FSAs 5.0% 5.8% 5% (16.4%) 5.9% 5% (18.6%) Number of staff with Annual Leave (excludes RMOs SMOs) > 240 hours * (107) (107) Outpatient DNA Rate (1) Follow Ups 7.2% 7.1% 5% (42.1%) 6.9% 5% (37.7%) Number of staff with Annual Leave > 300 hours (RMO'S& SMO'S) * 10 0 (10) 10 0 (10) Overall Average Case Weight (WIES11A) (1) % (6.3%) Operating Result ($000, +ve is surplus) (1,511) ,055 (48) 7,103 Personnel Costs($000) 14,807 14,731 12,869 (1,862) 162, ,121 (4,323) ACC Revenue ($000) (14) 6,401 6, DSS Revenue ($000) 1,702 1, ,740 6,468 1,272 KEY (Q) Quarterly Measure based on the previous fiscal quarter & YTD fiscal year. (1) Source -Reporting Team (M-1) Indicator reported in Qtrly MOH Balanced (2) The data definition is now in line with MOH definition. (National average for this KPI 71% for March 05 quarter) Target adjusted to equal that of the best DHB. * Historical Data is not available in relation to the new Scorecard categories (3)The number of bed nights (according to the midnight census) spent by patients from Medical group in Surgical beds or the number from Surgical group in Medical beds. All Variances (Except where a zero target is in place) have been re-calculated so that they now represent the relative degree to which actual performance varies from targeted performance (4) The number of admissions by patients under 14 years of age to an adult ward (not including ICU) (5)Caesarean Section rate is for Queen Mary specialists only and excludes the interventions made by private obstetricians (6) FTEs does not include DHB Governance&Admin (7) Unplanned readmission to ICU - changed from readmissions within 5 days to 72 hours (now consistent with ACHS clinical care indicators)
2 KPI s June 2007 Megan Boivin Operations Manager 17 July 2007 KPI s HAC report 20/07/2007 Operations Manager : Megan Boivin
3 KPI's % of Resourced Beds Occupied for Dunedin and Wakari Hospitals (KPI #1) 100.0% 95.0% 90.0% 85.0% 80.0% 75.0% 70.0% Target = 85% June = 88.1% 65.0% 60.0% Jun-06 Jul-06 Aug-06 Sep-06 Oct-06 Nov-06 Dec-06 Jan-07 Feb-07 Mar-07 Apr-07 May-07 Jun-07 Definition: Total number of beds occupied at the midnight census divided by the number of resourced bed Actual Lower Upper Target Linear (Actual) % of Emergency Department Patients Seen Within Specified Times as defined by the Australasian College for Emergency Medicine (KPI # 2) Month : T1=100% T2=86% T3=66% T4=63% T5=87% Australia 1997 : T1=92% T2=69% T3=66% T4=67% T5=80% Targets : T1=100% T2=80% T3=75% T4=70% T5=70% 0 Jun-06 Jul-06 Aug-06 Sep-06 Oct-06 Nov-06 Dec-06 Jan-07 Feb-07 Mar-07 Apr-07 May-07 Jun-07 Specified times - Triage 1-1 min; Triage 2-10 mins; Triage 3-30 mins; Triage 4-1 hours; Triage 5-2 hrs. Triage 1 Triage 2 Triage 3 Triage 4 Triage 5 Page A
4 KPI's Readmit Rate (KPI # 3) Target = 4.5% June = 2.83% 7.0% 6.5% 6.0% 5.5% 5.0% 4.5% 4.0% 3.5% 3.0% 2.5% 2.0% 1.5% 1.0% 0.5% 0.0% Jun-06 Jul-06 Aug-06 Sep-06 Oct-06 Nov-06 Dec-06 Jan-07 Feb-07 Mar-07 Apr-07 May-07 Jun-07 Rate Target Lower Upper Linear (Rate) Average Length of Stay Med/Surg Only (KPI # 4) Target = 4.5 days June = 4.86 days Jun-06 Jul-06 Aug-06 Sep-06 Oct-06 Nov-06 Dec-06 Jan-07 Feb-07 Mar-07 Apr-07 May-07 Jun-07 Definition: Total days in hospital divided by the number of discharges (excludes ICU and CCU and all day cases) occurred in the month. Comment: Actual Target Lower Upper Linear (Actual) Page B
5 KPI's 5.0% Percent Sick Leave Hours (KPI # 5) Target = 3% June =3.4% 4.0% 3.0% 2.0% Total sick hours = Total hours = 364, % Percent lost time Target Lower Upper Linear (Percent lost time) 0.0% Jun-06 Jul-06 Aug-06 Sep-06 Oct-06 Nov-06 Dec-06 Jan-07 Feb-07 Mar-07 Apr-07 May-07 Jun-07 Definition: Total sick hours paid during the month (excl ACC) over total hours paid during the month. Comment: 5.0% Sick Leave % with long term sick identified KPI # 6 June long term sick leave 1,749 hours 16 staff members 4.0% 3.0% 2.0% 1.0% 0.0% Jun-06 Jul-06 Aug-06 Sep-06 Oct-06 Nov-06 Dec-06 Jan-07 Feb-07 Mar-07 Apr-07 May-07 Jun-07 % Total Sick % Excluding Long Term Sick Page C
6 KPI's Percent Sick Leave Hours by Group (KPI # 7) 6.0% 5.5% 5.0% 4.5% 4.0% 3.5% 3.0% 2.5% 2.0% 1.5% 1.0% 0.5% 0.0% Jun-06 Jul-06 Aug-06 Sep-06 Oct-06 Nov-06 Dec-06 Jan-07 Feb-07 Mar-07 Apr-07 May-07 Jun-07 Medical Personnel Nursing Personnel Allied Health Support Personnel Management/Administration This represents individual occupation groups which allow us to review trends within these groups 4000 Overtime and Callback Hours (Electronic Timesheet Report KPI # 8) hours Jun Jul Aug Sep Oct Nov Dec Jan Feb Mar Apr May Jun Overtime Hours Callback Hours 2 per. Mov. Avg. (Overtime Hours) Page D
7 Number of patients Waiting for treatment > than 6 months KPI # 9 For 3 months to June Cardiac Surgery Cardiology ENT Gynaecolo gy Neurosurg ery Ophthalmol ogy Orthopaedi c Paediatric General Surgery Apr May Jun Urology 100% Waiting Times of Elective Patients Admitted during the month of June 2007 KPI # 10 75% 50% 25% 0% Cardiac Surgery Cardiology ENT Gynaecolo Neurosurg gy ery Ophthalm ology Orthopaed ic Paediatric General Surgery Admit <=6 Mths 83% 97% 91% 92% 100% 97% 86% 85% 91% 80% Admit >6 Mths 17% 3% 9% 8% 0% 3% 14% 15% 9% 20% Total Admits Urology Total Admissions during the month vs Total added to the Booking Lists during the month of June 2007 KPI # Cardiac Surgery Cardiology ENT Gynaecolo gy Neurosurg ery Ophthalmo logy Orthopaedi c Paediatric General Surgery Total Admits Total Added Added >AT Page E Urology
8 Inpatient KPI's Waiting > 6 Months (KPI # 12) Trend Line represents the Total of All Services Stack represents only those Services with Volumes greater than Jun-06 Jul-06 Aug-06 Sep0-6 Oct-06 Nov-06 Dec-06 Jan-07 Feb-07 Mar-07 Apr-07 May-07 Jun-07 ENT General Surgery Urology Orthopaedic Total Page F
9 KPI's 25 Waiting for FSA > 6 Months by Speciality (KPI # 13) (Excludes Rural Clinics Waiting) Cardiol ogy Derma tology Diabet es ENT Gastro Gen Med Gen Surg Gynae cology Haema tology Neurol ogy Apr May Jun Neuros urg Oncolo gy Ophth almolo Ortho Paeds Pain Renal Respir atory Rheum atology Urolog y 300 Waiting for FSA > 6 Months Totals (KPI # 14) (Excludes Rural Clinics Waiting) 10% 8% 200 6% 100 4% 2% 0 Jun-06 Jul-06 Aug-06 Sep0-6 Oct-06 Nov-06 Dec-06 Jan-07 Feb-07 Mar-07 Apr-07 May-07 Jun-07 No Waiting >6 Mths Total Waiting % Waiting >6 Mths 6% 6% 4% 3% 2% 1% 3% 5% 4% 2% 3% 2% 2% 0% Page G
10 KPI's 600 Number of Patients on Active Review (KPI # 15) (Patients with a Staged/Planned Flag are excluded) Stack represents only those services with volumes greater than 20 Included in these numbers are 10 children, 9 within ENT and 1 in Orthopaedics Jun-06 Jul-06 Aug-06 Sep-06 Oct-06 Nov-06 Dec-06 Jan-07 Feb-07 Mar-07 Apr-07 May-07 Jun General Surgery Cardiac Surgery ENT Orthopaedic Gynaecology Ophthalmology Total Page H
11 KPI's 500 Total patients in Active Review and Given Certainty (KPI # 16) June Cardiac Surgery Cardiolog y ENT Gynaecol ogy Neurosurg ery Ophthalm ology Orthopae dic Paediatric General Surgery Total Waiting > 6 Months Total Waiting < 6 Months Active Review Urology This graph represents patients on the booking system by specialty, it shows the total number patients on Active review and also those that have been told that they will receive treatment within 6 months and actually shows if they have been waiting longer than the 6 months This graph also includes those patients that have received a date for treatment 7.5% 7.0% DNA Rate of Total FSA Appointments (KPI # 17) (Excludes Rural Clinics) June % DNA Percentage 6.5% 6.0% 5.5% 5.0% 4.5% No of DNAs 4.0% 3.5% DNA Rate No of DNA's Linear (DNA Rate) % Jun-06 Jul-06 Aug-06 Sep0-6 Oct-06 Nov-06 Dec-06 This graph represents the percentage of patients that did not attend their First Specialist Attendance within the Med/Surg groups Jan-07 Feb-07 Mar-07 Apr-07 May-07 Jun-07 0 Page I
12 Inpatient KPI's Acute Admissions - Average CW/Discharge KPI # Caseweights Jul Aug Sep Oct Nov Dec Jan Feb Mar Apr May Jun 05_ _ Elective Admissions - Average CW/Discharge KPI # Caseweights Jul Aug Sep Oct Nov Dec Jan Feb Mar Apr May Jun 05_ _ Total Admissions - Average CW/Discharge KPI # Caseweights Jul Aug Sep Oct Nov Dec Jan Feb Mar Apr May Jun 05_ _ Page J
13 Number of patients Given Certainty and their Wait time for treatment (Includes Booked patients) at June 2007 KPI#21 (Excludes patients with a staged or planned status) The numbers in Red indicate the number of booked patients No of patients >=6 Cardiothoracic Cardiology ENT Gynaecology Neurosurgery Paediatric General Surgery Ophthalmology Total Months Waiting Comments: This graph shows the number of patients who have received certainty, including those that have been booked for treatment (383) The numbers in this graph includes 626 patients with certainty status but are under the Access Threshold and 41 of these have been waiting greater than 6 months No of patients Number of patients Given Certainty and their Wait time for treatment (Includes Booked patients) at May 2007 KPI#21 (Excludes patients with a staged or planned status) The numbers in Red indicate the number of booked patients >= Cardiothoracic Cardiology ENT Gynaecology Neurosurgery Paediatric General Surgery Ophthalmology Total Months Waiting Comments: This graph shows the number of patients who have received certainty, including those that have been booked for treatment (377) The numbers in this graph includes 626 patients with certainty status but are under the Access Threshold and 46 of these have been waiting greater than 6 months Number of patients Given Certainty and their Wait time for treatment (Includes Booked patients) at April 2007 KPI#21 (Excludes patients with a staged or planned status) The numbers in Red indicate the number of booked patients No of patients >=6 Cardiothoracic Cardiology ENT Gynaecology Neurosurgery Orthopaedics Months Waiting Paediatric General Surgery Urology Ophthalmology Total C t Thi h h th b f ti t h h i d t i t i l di th th t h b b k d f t t t (470) Number of patients Given Certainty and their Wait time for treatment (Includes Booked patients) at March 2007 KPI#21 (Excludes patients with a staged or planned status) The numbers in Red indicate the number of booked patients No of patients >=6 Cardiothoracic Cardiology ENT Gynaecology Neurosurgery Orthopaedics Months WaitingPaediatric General Surgery Urology Ophthalmology Total C t Thi h h th b f ti t h h i d t i t i l di th th t h b b k d f t t t (404) Page K
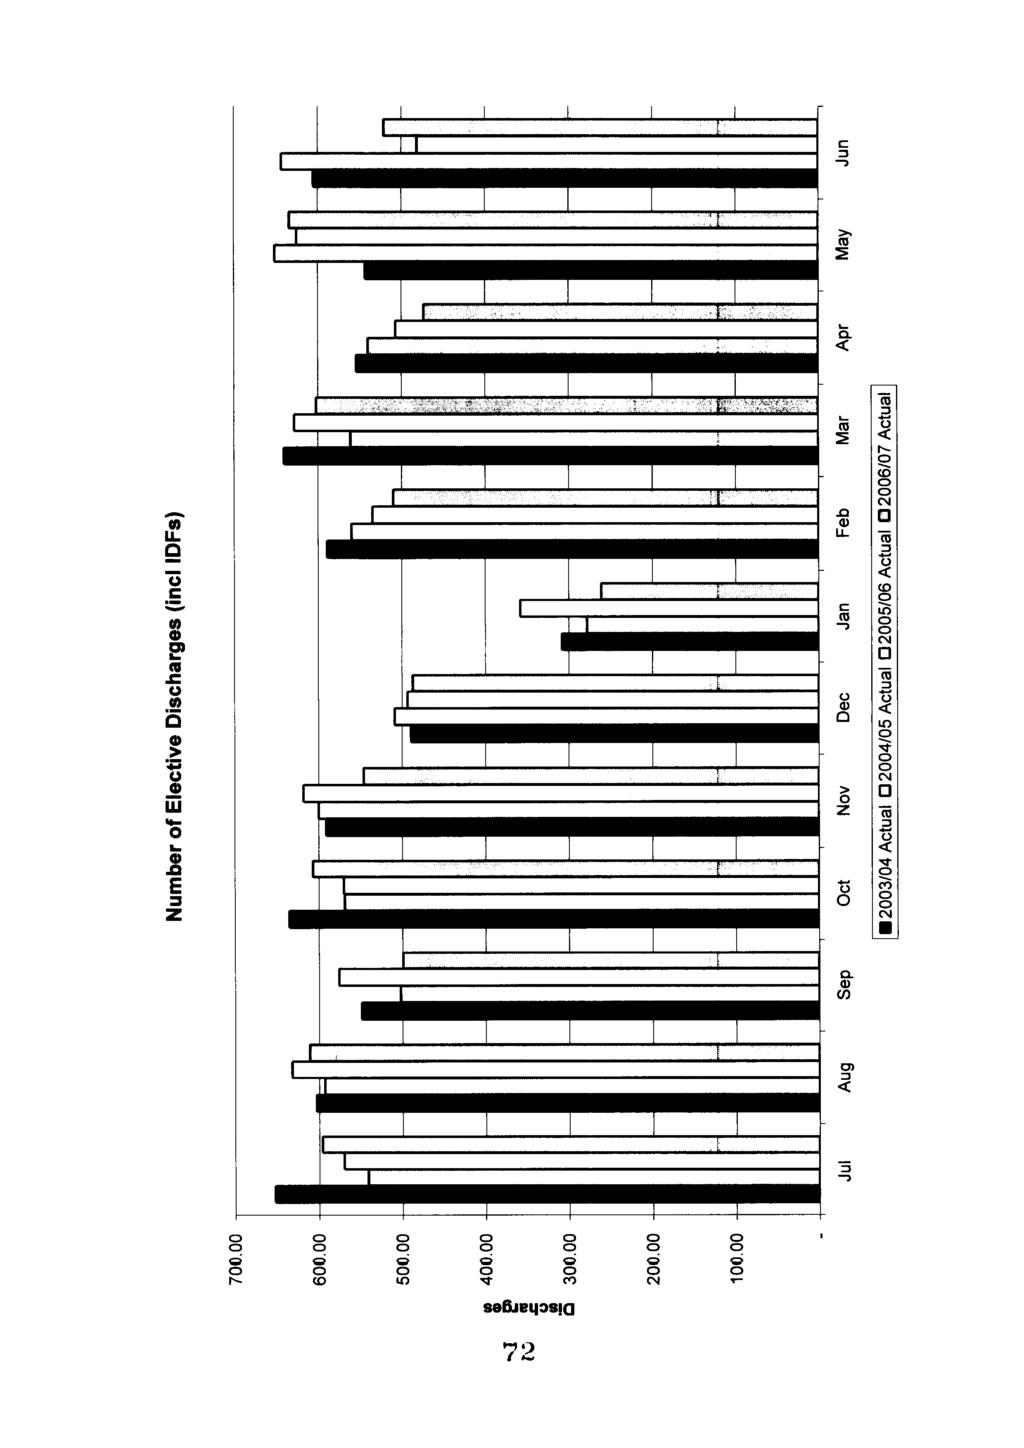
14 Activity June 2007 Recommendation That the Hospital Advisory Committee note the report. Caseweight activity is 8% below plan for the month. This includes an assumption that the 56 uncoded cases will produce 67 caseweights. Patients admitted from the Emergency Department to inpatient areas were 854 compared to 822 in May. Inpatients : There are 66 Medical / Surgical cases that remain uncoded year to date. Caseweight activity is 8% below plan for June (including an adjustment for the uncoded cases). Acute activity is 13% below plan for June compared to 2% above plan for May; Otago acute volumes are 13% below plan for June compared to 3% below plan for May. Year end, Otago Acute volumes are 1% below plan. Elective activity is 4% below plan for June compared to 6% above plan for May. Year end, elective activity is 1% above plan (121 caseweights). There are still 19 elective cases to be coded at the time of the report. There were 18 patients still in Hospital as at 1 July 2007, all with lengths of stay greater than 30 days, attached is a table that shows which services these patients are in. Last month there were 18 patients. Service ACC Funded Bed Days MoH Funded Bed Days Geriatrics 109 Physical Rehab NICU 256 Orthopaedics 39 Psychogeriatrics 211 Cardiothoracic 113 Urology 31 Total 107 days 790 days Activity June /07/ Megan Boivin
15 Inter District Flow (IDF) volumes are 25% below plan for June, however they are 8% above plan for the year. Attached is a table that shows the IDF inflows by DHB, this information is different to that reflected in the appendices, due to phasing. In the appendices the services have phased the total IDF s per service by admit type, but it is not split by DHB. The information in the attached table has not been phased, and looks at total volumes by DHB rather than being split by service. The Ministry of Health assigned the planned volumes. This information also excludes any cases that were admitted and discharged from the Emergency Department, due to DHB s capturing data differently in this area. DHB June Year to date Actual Plan Variance Actual Plan Variance Auckland % % Bay of Plenty % % Canterbury % % Capital and Coast % % Counties Manukau % % Hawkes Bay % % Hutt % % Lakes % % MidCentral % % Nelson Marlborough % % Northland % % South Canterbury % % Southland % % Tairawhiti % % Taranaki % % Waikato % % Waitemata % % Wairarapa % % West Coast % % Whanganui % % TOTAL % 3, , % Below is a table which shows the July to June actual inflows from Southland for both Elective and Acute admissions, compared to the budgeted volumes for the same period. The figures below exclude uncoded cases. This represents an 8.6% performance above planned volumes. Admission Type Actual ytd Budget ytd Elective Acute/Arranged 2, ,821 TOTAL 2, ,755 Activity June /07/ Megan Boivin
16 Outpatients: Total outpatient activity is 12% below plan for June, compared to 2% above plan for May. Year end we are 5% below plan. Within the outpatient activity there are services that are under delivering and those that are over delivering. The Industrial action and has impacted on some of the outpatient activity, in particular within the Orthopaedic service. (See appendix 9) Megan Boivin Operations Manager 9 th July 2007 Attachments 1. Contract Performance Total coded caseweights summary June Contract Performance Acute & Elective includes IDF s June Contract Performance Coded Acute caseweights includes IDF June Contract Performance Coded Acute caseweights IDF s only June Contract Performance Coded Acute caseweights Otago patients only June Contract Performance Coded Elective caseweights includes IDF s June Contract Performance Coded Elective caseweights Otago patients only June Contract Performance Coded Elective caseweights IDF s only June Contract Performance Outpatients June Total Cumulative Caseweight Delivery Cumulative Elective Caseweight Delivery Cumulative Acute Caseweight Delivery Monthly Phasing of Caseweight Activity Number of Patients admitted from ED to inpatient areas 15. Admissions from ED to inpatient wards Number of ED presentations by triage category 17. ED volumes comparison between years 18. ED versus Non-ED Discharges 19. ED versus Non-ED Bed Days Activity June /07/ Megan Boivin
17
18
19
20
21
22
23
24
25
26
27
28
29
30
31
32
33
34
35
36


37


38


39


40
SOUTHAMPTON UNIVERSITY HOSPITALS NHS TRUST Trust Key Performance Indicators May Regular report to Trust Board
 SOUTHAMPTON UNIVERSITY HOSPITALS NHS TRUST Trust Key Performance Indicators May 20 Report to: Trust Board July 20 Report from: Sponsoring Executive: Aim of Report/Principle Topic: Review History to date:
Performance audit report. District health boards: Availability and accessibility of after-hours services
 Performance audit report District health boards: Availability and accessibility of after-hours services Office of of the the Auditor-General PO PO Box Box 3928, Wellington 6140 Telephone: (04) (04) 917
RTT Recovery Planning and Trajectory Development: A Cambridge Tale
 RTT Recovery Planning and Trajectory Development: A Cambridge Tale Linda Clarke Head of Operational Performance Addenbrooke s Hospital I Rosie Hospital Apr 2014 May 2014 Jun 2014 Jul 2014 Aug 2014 Sep
Quality Management Report 2017 Q2
 Quality Management Report 2017 Q2 Quality Management Program CMS STAR Ratings Member Satisfaction (CAHPS & HOS) HEDIS Risk Adjustment DHS Member Incident Reporting Member Satisfaction Surveys Pay for Performance
2016/17 Activity Report April August/September 2016
 Due to a change in national hospital data flows (SUS) and also a delay in processing September 2016 Practice-level finance data, the latest information on hospital activity and spend is still up to August
Hospital Events 2007/08
 Hospital Events 2007/08 Citation: Ministry of Health. 2011. Hospital Events 2007/08. Wellington: Ministry of Health. Published in December 2011 by the Ministry of Health PO Box 5013, Wellington 6145, New
Ayrshire and Arran NHS Board
 Paper 12 Ayrshire and Arran NHS Board Monday 26 March 2018 Financial Management Report for the 11 months to 28 February 2018 Author: Bob Brown, Assistant Director of Finance Governance and Shared Services
Governing Body. TITLE OF REPORT: Performance Report for period ending 31st December 2012
 - Governing Body DATE OF MEETING: TITLE OF REPORT: Performance Report for period ending 31st December 2012 KEY MESSAGES: We are responsible for securing improvements in the quality of care and health outcomes.
CHC-A Continuity Dashboard. All Sites Continuity - Asthma. 2nd Qtr-03. 2nd Qtr-04. 2nd Qtr-06. 4th Qtr-03. 4th Qtr-06. 3rd Qtr-04.
 PPC1: ACCESS AND COMMUNICATION Element B: Access and Communication Results Item 1: Visits with assigned PCP Continuity data is reviewed each month at our Office Redesign Committee (ORDC). The data is collected
Rebalancing the Cost Structure: Progressive Health Systems, Inc. Bob Haley, CEO Steve Hall, CFO
 Rebalancing the Cost Structure: Progressive Health Systems, Inc. Bob Haley, CEO Steve Hall, CFO THE MARKET & PHS S POSITION 2 Progressive Health Systems, Inc. (dba Pekin Hospital) Pekin, IL 3 4 5 Nearby
The Royal Wolverhampton NHS Trust
 Title: Safe Staffing; Planned Versus Actual Staffing by Ward September 2016 data The Royal Wolverhampton NHS Trust Trust Board Report Meeting Date: 31 st October 2016 Title: Nursing Workforce Report Executive
New Zealand. Dialysis Standards and Audit
 New Zealand Dialysis Standards and Audit 2008 Report for New Zealand Nephrology Services on behalf of the National Renal Advisory Board Grant Pidgeon Audit and Standards Subcommittee February 2010 Establishment
Collaborative overview
 Safe use of opioids national collaborative Learning session one Collaborative overview Carmela Petagna Senior Portfolio Manager Health Quality & Safety Commission The Commission The Health Quality & Safety
Board of Director s Meeting
 Board of Director s Meeting Meeting Date: 15 November 212 Agenda item: 6.1 Title: Purpose: Summary: Recommendation: Author: Presented by: QUALITY AND PATIENT SAFETY ASSURANCE COMMITTEE To provide an exception
Section 1 - Key Performance Indicators
 Clinical Quality Report Month 6 2016/17 period ending 30th September 2016 Section 1 - Key Performance Indicators 1.1 NHS Improvement; Risk Assessment Framework Clostridium difficile Indicator M6 2 YTD
Table One: Employed FTE counts. 30 hours per week 0.75 FTE. 40 hours per week 1.0 FTE. 60 hours per week 1.0 FTE
 Health report Hon Tony Ryall DHB clinical staffing numbers update Executive summary 1. This report provides background on how medical and nursing staff numbers are reported to the Ministry of Health (the
Baptist Health System Jacksonville, FL
 Baptist Health System Jacksonville, FL Baptist Health System Community Leader in Healthcare Five (5) Hospital System Serving greater Jacksonville area and SE Georgia Children s Hospital Primary Care Facilities
Leveraging the Accountable Care Unit Model to create a culture of Shared Accountability
 Leveraging the Accountable Care Unit Model to create a culture of Shared Accountability How we improved Patient Safety and Quality Outcomes at Northwest Hospital Our Journey to Shared Accountability Implementation
UNIVERSITY OF ILLINOIS HOSPITAL & HEALTH SCIENCES SYSTEM HOSPITAL DASHBOARD
 UNIVERSITY OF ILLINOIS HOSPITAL & HEALTH SCIENCES SYSTEM HOSPITAL DASHBOARD January 19, 2017 UI Health Metrics FY17 Q1 Actual FY17 Q1 Target FY Q1 Actual Ist Quarter % change FY17 vs FY Discharges 4,836
SUPPORTING TREATMENT SAFETY TREATMENT INJURY INFORMATION APRIL
 SUPPORTING TREATMENT SAFETY TREATMENT INJURY INFORMATION APRIL 2018 www.acc.co.nz/treatmentsafety 978-0-478-36290-9 Supporting Patient Safety (printed version) 978-0-478-36291-6 Supporting Patient Safety
Reducing Elective Waits: Delivering 18 week pathways for patients. Programme Director NHS Elect Caroline Dove.
 Reducing Elective Waits: Delivering 18 week pathways for patients Programme Director NHS Elect Caroline Dove What I will cover 1. Why 18 Weeks is different 2. Where are we now 3. New models of delivery
Safe Nurse Staffing Levels. June 2017
 Safe Nurse Staffing Levels Executive Summary June 2017 The purpose of this report is: 1. To provide an assurance with regard to the management of safe nursing and midwifery staffing for the month of June
Page 347. Avg. Case. Change Length
 Page 345 EP 8 How nurses use trended data to formulate the staffing plan and acquire necessary resources to assure consistent application of the Care Delivery Model(s). The development of operational budgets
Nottingham University Hospitals Emergency Department Quality Issues Related to Performance
 RCCG/GB/14/123 Nottingham University Hospitals Emergency Department Quality Issues Related to Performance Introduction NUH have failed to meet the 95% 4 hour wait standard for a number of consecutive months.
UI Health Hospital Dashboard September 7, 2017
 UI Health Hospital Dashboard September 20 September 7, 20 UI Health Metrics FY Q4 Actual FY Q4 Target FY Q4 Actual 4th Quarter % change FY vs FY Discharges 4,558 4,680 4,720 Combined Observation Cases
Building a Healthy New Zealand
 Building a Healthy New Zealand Becoming a DHB board member Released August 2013 www.health.govt.nz Citation: Ministry of Health. 2013. Building a Healthy New Zealand: Becoming a DHB board member. Wellington:
Hutt PUBLIC Hospital Advisory Committee 21 October Agenda. 1.3 Minutes of previous meeting To Consider Virginia Hope 4
 Hutt Hospital Advisory Committee 21 October 2016 - Agenda AGENDA Held on Friday 21 October 2016 Board Room, Pilmuir House, Hutt Hospital Commencing at 9am HOSPITAL ADVISORY COMMITTEE SECTION Item Action
NHS Electronic Referrals Service. Paper Switch Off an update Digital Health Webinar 4 May 2018
 NHS Electronic Referrals Service Paper Switch Off an update Digital Health Webinar 4 May 2018 Aims of Session Introductions and refresh of Paper Switch Off Sharon Wilson Implementation manager NHS Digital
Standardising Acute and Specialised Care Theme 3 Governance and Approach to Hospital Based Services Strategy Overview 28 th July 2017
 Standardising Acute and Specialised Care Theme 3 Governance and Approach to Hospital Based Services Strategy Overview 28 th July 2017 Background Theme 3 builds upon previous key strategic commissioning
1 P a g e. Newsletter 4 April 2017
 Newsletter 4 April 2017 We are delighted to welcome Hawkes Bay DHB to Lippincott New Zealand Instance. This brings the number of DHBs using Lippincott in New Zealand to 13. There are also a large number
Ayrshire and Arran NHS Board
 Paper 12 Ayrshire and Arran NHS Board Monday 9 October 2017 Planned Care Performance Report Author: Fraser Doris, Performance Information Analyst Sponsoring Director: Liz Moore, Director for Acute Services
Mandatory Surveillance of Healthcare Associated Infections Report 2006
 Mandatory Surveillance of Healthcare Associated Infections Report 2006 Contents 1. Introduction...2 2. Key Points...3 3. Results of the fifth year of mandatory surveillance of MRSA bacteraemia, including
MINISTRY/LHIN ACCOUNTABILITY AGREEMENT (MLAA) MLAA Performance Assessment Dashboard /10 Q3
 MLAA Performance Assessment Dashboard /10 Q3") MINISTRY/LHIN ACCOUNTABILITY AGREEMENT (MLAA) MLAA Performance Assessment Dashboard - 29/1 Q3 README The 29/1 MLAA Dashboard has been designed to reflect various reporting fiscal periods as well as the
MINISTRY/LHIN ACCOUNTABILITY AGREEMENT (MLAA) MLAA Performance Assessment Dashboard - 29/1 Q3 README The 29/1 MLAA Dashboard has been designed to reflect various reporting fiscal periods as well as the
BOARD OF DIRECTORS PAPER COVER SHEET. Meeting Date: 1 st December 2010
 BOARD OF DIRECTORS PAPER COVER SHEET Meeting Date: 1 st December 2010 Agenda Item: 9 Paper No: E Title: Management of Pressure Ulcers Purpose: For Information Summary: This paper provides a report on the
Workshop: Nursing Sensitive Indicators. Annelie Meiring and Suseth Goosen
 Workshop: Nursing Sensitive Indicators Annelie Meiring and Suseth Goosen The level of patient care your facility provides is imperative it dictates your facility's financial success, as well as its reputation
Urgent Care Short Term Actions to Improve Performance
 To: Trust Board From: Chief Operating Officer Date: March 2017 Healthcare standard Title: Urgent Care Short Term Actions to Improve Performance Author/Responsible Director: Michael Woods / Andrew Prydderch
Sheffield Teaching Hospitals NHS Foundation Trust
 Sheffield Teaching Hospitals NHS Foundation Trust @seamlesssurgery Seamless Surgery Team Sheffield Teaching Hospitals NHS Foundation Trust July 2017 PROUD TO MAKE A DIFFERENCE PROUD TO MAKE A DIFFERENCE
University of Illinois Hospital and Clinics Dashboard May 2018
 May 17, 2018 University of Illinois Hospital and Clinics Dashboard May 2018 Combined Discharges and Observation Cases for the nine months ending March 2018 are 1.6% below budget and 4.9% lower than last
Quality Improvement Scorecard February 2017
 Mortality: HSMR Nat Performance continued to improve into Q3 2016/17. NB: Each month is a 12 month rolling value. I.e. Mar-16 reports the monthly average of Apr-15 to Mar-16. Mortality: HSMR (weekday)
UNIVERSITY OF ILLINOIS HOSPITAL & HEALTH SCIENCES SYSTEM HOSPITAL DASHBOARD
 September 8, 20 UNIVERSITY OF ILLINOIS HOSPITAL & HEALTH SCIENCES SYSTEM HOSPITAL DASHBOARD UI Health Metrics FY Q4 Actual FY Q4 Target FY Q4 Actual 4th Quarter % change FY vs FY Average Daily Census (ADC)
1. November RN VACANCY RATE: Overall 2320 RN vacancy rate for areas reported is 12.5%
 PATIENT CARE SERVICES REPORT Submitted to the Joint Conference Committee, December 2013 Terry Dentoni, RN, MSN, CNL, Interim Chief Nursing Officer 1. November 2013-2320 RN VACANCY RATE: Overall 2320 RN
Key Performance Indicators
 Regional Nephrology System (RNS) Chronic Disease Prevention and Management Key Performance Indicators 8/9 Fiscal Year End Report Version: 1. Date published: April 7th, 9 Created by: Ethel Doyle: RNS Interim
PATIENT EXPERIENCE REPORT
 Improving Patient Experience PATIENT EXPERIENCE REPORT 1st July 2012 30th September 2012 Patient Experience Report - Page 2 Introduction The Patient Experience Report aims to present a rounded picture
Ambulatory Care Model
 Ambulatory Care Model Hong Kong May 2013 Andrew Stripp Deputy Chief Executive & Chief Operating Officer Outline What is the Alfred Centre? How does it fit into Alfred Health service model Key aspects of
Tina Nelson, MBA, BSN Lisa Stepp, BSN, RN Rebecca Fyffe, BSN, RN Jessica Coughenour, LPN
 Establishing a Conservative Approach to the Prevention of Pressure Ulcers with the Utilization of Data Analytics to Monitor Effectiveness of Quality Efforts and Best Practice Models Tina Nelson, MBA, BSN
Recommendations to Improve Quality and the Measurement of Quality in New Zealand Emergency Departments
 Recommendations to Improve Quality and the Measurement of Quality in New Zealand Emergency Departments A Report from the Working Group for Achieving Quality in Emergency Departments to the Minister of
Northern Health - Acute Services. Evidence Based Practice Venous Thromboembolism Prevention
 Northern Health - Acute Services Evidence Based Practice Venous Thromboembolism Prevention (VTE) Jeannette Kamar Christine Lamotte, Liam Carter Improving Patient Safety Preventing and Managing Venous Thromboembolism
Safer Nursing and Midwifery Staffing Recommendation The Board is asked to: NOTE the report
 To: Board of Directors Date of Meeting: 26 th July 20 Title Safer Nursing and Midwifery Staffing Responsible Executive Director Nicola Ranger, Chief Nurse Prepared by Helen O Dell, Deputy Chief Nurse Workforce
PSI-15 Lafayette General Health 2017 Nicholas E. Davies Enterprise Award of Excellence
 PSI-15 Lafayette General Health 2017 Nicholas E. Davies Enterprise Award of Excellence Rachel Brunt, RN, BSN, MBA-HCA, CIC, CPHQ, Director Quality Jessie Hanks, BS, RHIA, Director HIM Lafayette General
Patients with Rib Fractures How We Decreased Unplanned Transfers to the ICU. Lillian Aguirre, DNP, CNS, CCRN, CCNS Orlando Regional Medical Center
 Patients with Rib Fractures How We Decreased Unplanned Transfers to the ICU Lillian Aguirre, DNP, CNS, CCRN, CCNS Orlando Regional Medical Center Disclosures I do not have any disclosures Background Struggling
Balanced Scorecard Highlights
 Balanced Scorecard Highlights Highlights from 2011-12 fourth quarter (January to March) Sick Time The average sick hours per employee remains above target this quarter at 58. Human Resources has formed
Complaints, Litigation, Incident & PALS (CLIP) Summary Report Q2 July September 2009
 Summary Report Q2 July September 2009") Agenda 24/1 Public Board Meeting, 28 JAN 21 Complaints, Litigation, Incident & PALS (CLIP) Summary Report Q2 July September Presented by: Colin Johnston, Medical Director 1. Purpose The following CLIP
Agenda 24/1 Public Board Meeting, 28 JAN 21 Complaints, Litigation, Incident & PALS (CLIP) Summary Report Q2 July September Presented by: Colin Johnston, Medical Director 1. Purpose The following CLIP
Wairarapa DHB Clinical Services Action Plan Current Service Status Appendix to the main report
 Wairarapa DHB Clinical Services Action Plan Current Service Status Appendix to the main report Table of Contents Introduction...1 Consultation Participants...2 Abbreviations and Definitions...4 Acute Services...6
Open and Honest Care in your Local Hospital
 Open and Honest Care in your Local Hospital Report for: Royal Wolverhampton NHS Trust January 2016 The Open and Honest Care: Driving Improvement Programme aims to support organisations to become more transparent
MET CALLS IN A METROPOLITAN PRIVATE HOSPITAL: A CROSS SECTIONAL STUDY
 MET CALLS IN A METROPOLITAN PRIVATE HOSPITAL: A CROSS SECTIONAL STUDY Joyce Kant, A/Prof Peter Morley, S. Murphy, R. English, L. Umstad Melbourne Private Hospital, University of Melbourne Background /
Driving High-Value Care via Clinical Pathways. Andrew Buchert, MD Gabriella Butler, MSN, RN
 Driving High-Value Care via Clinical Pathways Andrew Buchert, MD Gabriella Butler, MSN, RN 1 Andrew Buchert, MD Medical Director, Clinical Resource Management Children s Hospital of Pittsburgh of UPMC
Quality Improvement Scorecard June 2017
 Mortality: HSMR Nat NB: Each month is a 12 month rolling value. I.e. Mar-16 reports the monthly average of Apr-15 to Mar-16. Performance remained below target in February. Mortality: HSMR (weekday) vs.
Quality Improvement Scorecard December 2017
 Mortality: HSMR Performance improved in August Nat NB: Each month is a 12 month rolling value. I.e. Mar-16 reports the monthly average of Apr-15 to Mar-16. Mortality: HSMR (weekday) vs. HSMR (weekend)
Integrating Quality Into Your CDI Program: The Case for All-Payer Review
 7th Annual Association for Clinical Documentation Improvement Specialists Conference Integrating Quality Into Your CDI Program: The Case for All-Payer Review Katy Good, RN, BSN, CCDS, CCS CDI Program Coordinator
April Clinical Governance Corporate Report Narrative
 April 14 - Clinical Governance Corporate Report Narrative ITEM 7B Narrative has been provided where there is something of note in relation to a specific metric; this could be positive improvement, decline
Integrated Performance Report
 Integrated Performance Report M04 July 2016 Presented by: Angela Stevenson (Chief Operating Officer) Des Holden (Medical Director) Fiona Allsop (Chief Nurse) Paul Simpson (Chief Financial Officer) An Associated
NHS BOLTON CLINICAL COMMISSIONING GROUP Public Board Meeting AGENDA ITEM NO: 10. Date of Meeting:.24 th March 2017.
 NHS BOLTON CLINICAL COMMISSIONING GROUP Public Board Meeting AGENDA ITEM NO: 10 Date of Meeting:.24 th March 2017. TITLE OF REPORT: CCG Corporate Performance Report AUTHOR: Melissa Laskey Director of Service
WEST HAMPSHIRE PERFORMANCE REPORT. Based on performance data available as at 11 th January 2018
 WEST HAMPSHIRE PERFORMANCE REPORT Based on performance data available as at 11 th January 2018 1 CCG Quality and Performance Executive Summary Introduction: The purpose of this report is to provide an
Workflow. Optimisation. hereweare.org.uk. hereweare.org.uk
 Workflow Optimisation Dr. Paul Deffley & Jaivir Pall Clinical Lead & Commercial Lead About Here Not-for-profit social enterprise Membership organisation (our members are local GPs, Practice Managers, Practice
9/15/2017 THROUGHPUT. IT S NOT JUST AN EMERGENCY DEPARTMENT ISSUE LEARNING OBJECTIVES
 THROUGHPUT. IT S NOT JUST AN EMERGENCY DEPARTMENT ISSUE D O N N A C R I M M I N S - B O N N E L L, B S N, M H S M, C P H Q, L S S G B LEARNING OBJECTIVES 1) Define who is affected by inefficiency in throughput
What s Right in Healthcare. Covenant Health Knoxville, Tennessee
 What s Right in Healthcare Covenant Health Knoxville, Tennessee Getting the Framework Right How Evidence-Based Leadership Empowers 11,000 Professionals to Improve in Unison Journey to Excellence A Journey,
Brent Treichler, M.D., FACEP Assistant Professor, UT Southwestern Department of Surgery, Division of Emergency Medicine Chief of Emergency Services,
 Brent Treichler, M.D., FACEP Assistant Professor, UT Southwestern Department of Surgery, Division of Emergency Medicine Chief of Emergency Services, Parkland Health and Hospital System September 13, 2010
Quality Improvement Scorecard November 2017
 Mortality: HSMR Performance remained below target in July Nat NB: Each month is a 12 month rolling value. I.e. Mar-16 reports the monthly average of Apr-15 to Mar-16. Mortality: HSMR (weekday) vs. HSMR
Influence of Patient Flow on Quality Care
 Influence of Patient Flow on Quality Care Patients Waiting on Trolleys for an Inpatient Bed Patients who are Medically Fit to be discharged and cared for at Home with Support or in a Nursing Home or District
Strategic KPI Report Performance to December 2017
 Strategic KPI Report Performance to December 2017 Trust Board 25 th January 2018 Strategic KPI summary SROs: All Directors Objective KPI SRO Target Apr May Jun Jul Aug Sep Oct Nov Success Is Deliver A
Improving HCAHPS with a Culture of Quiet St. Francis Hospital (Puget Sound)
") Improving HCAHPS with a Culture of Quiet St. Francis Hospital (Puget Sound) Problem: Surveys showed that the noise level made it difficult for patients to rest. Innovation: Implemented a culture of quiet.
Improving HCAHPS with a Culture of Quiet St. Francis Hospital (Puget Sound) Problem: Surveys showed that the noise level made it difficult for patients to rest. Innovation: Implemented a culture of quiet.
Percent Unadjusted Inpatient Mortality (NHSL Acute Hospitals) Numerator: Total number of in-hospital deaths
 Numerator: Total number of in-hospital deaths") Page 1 of 23 Quality Ambition: Safe NHS Lanarkshire aims to be the safest health and care system in Scotland with no avoidable deaths, reduction in avoidable harm, a sustainable infrastructure for patient
Page 1 of 23 Quality Ambition: Safe NHS Lanarkshire aims to be the safest health and care system in Scotland with no avoidable deaths, reduction in avoidable harm, a sustainable infrastructure for patient
SUMMARY OF INDICATOR CHANGES FOR VERSION 3 INTELLIGENT MONITORING REPORTS Acute and Specialist NHS Trusts 23 June Final Draft, Subject to Change
 Never Event incidence Yes: 01 May 2013-30 Apr 2014 Incidence of Clostridium difficile (C.difficile) Incidence of Meticillin-resistant Staphylococcus aureus (MRSA) Dr Foster Intelligence: Mortality rates
Quality Improvement Plan (QIP) Narrative for Health Care Organizations in Ontario
 Narrative for Health Care Organizations in Ontario") Quality Improvement Plan (QIP) Narrative for Health Care Organizations in Ontario 4/1/2014 This document is intended to provide health care organizations in Ontario with guidance as to how they can develop
Quality Improvement Plan (QIP) Narrative for Health Care Organizations in Ontario 4/1/2014 This document is intended to provide health care organizations in Ontario with guidance as to how they can develop
PATIENT CARE SERVICES REPORT Submitted to the Joint Conference Committee, February 2013 Terry Dentoni, RN, MSN, CNL, Interim Chief Nursing Officer
 PATIENT CARE SERVICES REPORT Submitted to the Joint Conference Committee, February 2013 Terry Dentoni, RN, MSN, CNL, Interim Chief Nursing Officer 1. 2320 RN Vacancy Rates for the Month of January 2013
PATIENT CARE SERVICES REPORT Submitted to the Joint Conference Committee, November 2017
 Report Contents: PATIENT CARE SERVICES REPORT Submitted to the Joint Conference Committee, November By: Terry Dentoni, MSN, RN, CNL - ZSFG Chief Nursing Officer 1. Professional Nursing.....1 2. Emergency
Integrated Performance Report
 Integrated Performance Report M12 March 2015 Presented by: Paul Bostock (Chief Operating Officer) Des Holden (Medical Director) Fiona Alsop (Chief Nurse) Paul Simpson (Chief Financial Officer) An Associated
Question 1 a) What is the Annual net expenditure on the NHS from 1997/98 to 2007/08 in Scotland? b) Per head of population
 What is the Annual net expenditure on the NHS from 1997/98 to 2007/08 in Scotland? b) Per head of population") NHS SPENDING - SCOTLAND Question 1 a) What is the Annual net expenditure on the NHS from 1997/98 to 2007/08 in Scotland? b) Per head of population Question 2 a) Annual real (GDP deflated) increase in net
NHS SPENDING - SCOTLAND Question 1 a) What is the Annual net expenditure on the NHS from 1997/98 to 2007/08 in Scotland? b) Per head of population Question 2 a) Annual real (GDP deflated) increase in net
Change in the Acute Setting. Dr Veronica Devlin Lean Leader NHS Lanarkshire
 Change in the Acute Setting Dr Veronica Devlin Lean Leader NHS Lanarkshire 4 th International Conference, Society for Acute Medicine, Edinburgh 7-8 October 2010 World class facilities World class staff
NHS Performance Statistics
 NHS Performance Statistics Published: 8 th March 218 Geography: England Official Statistics This monthly release aims to provide users with an overview of NHS performance statistics in key areas. Official
Hard Truths Public Board 29th September, 2016
 Hard Truths Public Board 29th September, 2016 Presented for: Presented by: Author Previous Committees Governance Professor Suzanne Hinchliffe CBE, Chief Nurse/Deputy Chief Executive Heather McClelland
Board Briefing. Board Briefing of Nursing and Midwifery Staffing Levels. Date of Briefing January 2018 (December 2017 data)
") Board Briefing Board Briefing of Nursing and Midwifery Staffing Levels Date of Briefing January 2018 (December 2017 data) This paper is for: Sponsor: Chief Nurse- Dame Eileen Sills (DBE) Decision Author:
Board Briefing Board Briefing of Nursing and Midwifery Staffing Levels Date of Briefing January 2018 (December 2017 data) This paper is for: Sponsor: Chief Nurse- Dame Eileen Sills (DBE) Decision Author:
Improve the Efficiency and Service of the Emergency Room at North Side Hospital
 Improve the Efficiency and Service of the Emergency Room at North Side Hospital John Melton, VP and CEO Washington County Operations meltonjw@msha.com Kerry Vermillion, CFO Washington County Operations
Presentation Objectives
 Driving Accountability through Leader Evaluations and the Monthly Meeting Model Bo Boulenger, MHA CEO, Baptist Hospital of Miami (Miami, FL) Mitch Hagins Coach, Studer Group (Gulf Breeze, FL) Presentation
1. March RN VACANCY RATE: Overall 2320 RN vacancy rate for areas reported is 13.8%
 PATIENT CARE SERVICES REPORT Submitted to the Joint Conference Committee, April 2014 Terry Dentoni, RN, MSN, CNL, Interim Chief Nursing Officer 1. March 2014-2320 RN VACANCY RATE: Overall 2320 RN vacancy
LSU Health Public-Private Partnership Report Card FY th Quarter
 Statistics Percent Patient Mix by Service Offender Care *CEA Core Clinical Services Our Lady of the Angels Hospital - Bogalusa, Louisiana Measure BMC Monthly Avg FY 12 OLOAH Monthly Avg FY 14 Jul 2014
Agenda Item The report triangulates staffing levels against appropriate quality measures. The Report is provided to the Board for:
 To: Trust Board From: Michelle Rhodes, Director of Nursing Date: 2 nd May 2017 Essential Standards: Health and Social Care Act 2008 (Regulated Activities) Regulation 18: Staffing Title: Monthly Nursing/Midwifery
BOARD OFFICIAL NHS GREATER GLASGOW AND CLYDE S INTEGRATED PERFORMANCE REPORT
 NHS Greater Glasgow & Clyde BOARD OFFICIAL NHS Board Meeting Head of Performance 19 December 2017 Paper No: 17/64 NHS GREATER GLASGOW AND CLYDE S INTEGRATED PERFORMANCE REPORT Recommendation Board members
Activity Based Cost Accounting and Payment Bundling
 Activity Based Cost Accounting and Payment Bundling 1 Agenda Introduction of Speakers Fast Facts about Jewish Senior Life/Jewish Home of Rochester Determining the need and uses for an Activity Based Cost
The Royal Wolverhampton NHS Trust
 The Royal Wolverhampton NHS Trust Meeting Date: 3 th June 214 Trust Board Report Title: Executive Summary: Action Requested: Report of: Author: Contact Details: Resource Implications: Public or Private:
Integrated Performance Report August 2017
 Integrated Performance Report Contents Section Page High Level Dashboard Balanced scorecard 3 Domain Scorecards and Director Commentaries Operational Performance 4 Quality and Patient Safety 9 Workforce
Executive Summary MEDICARE FEE-FOR-SERVICE (FFS) HOSPITAL READMISSIONS: QUARTER 4 (Q4) 2012 Q STATE OF CALIFORNIA
 HOSPITAL READMISSIONS: QUARTER 4 (Q4) 2012 Q STATE OF CALIFORNIA") MEDICARE FEE-FOR-SERVICE (FFS) HOSPITAL READMISSIONS: QUARTER 4 (Q4) 2012 Q3 2013 Executive Summary STATE OF CALIFORNIA The Centers for Medicare & Medicaid Services (CMS) has tasked Health Services Advisory
MEDICARE FEE-FOR-SERVICE (FFS) HOSPITAL READMISSIONS: QUARTER 4 (Q4) 2012 Q3 2013 Executive Summary STATE OF CALIFORNIA The Centers for Medicare & Medicaid Services (CMS) has tasked Health Services Advisory
Hospital-Acquired Infections Prevention is in Your Hands. Rachel L. Stricof
 Hospital-Acquired Infections Prevention is in Your Hands Rachel L. Stricof rstricof@gmail.com Morbidity 1.7 Million infections per year (estimate 2002) Mortality 99,000 deaths per year (estimate 2002)
BSUH INTEGRATED PERFORMANCE REPORT. 1) Responsive Domain 2) Safe Domain 3) Effective Domain 4) Caring Domain 5) Well Led Domain
 Responsive Domain 2) Safe Domain 3) Effective Domain 4) Caring Domain 5) Well Led Domain") BSUH INTEGRATED PERFORMANCE REPORT 1) Responsive Domain 2) Safe Domain 3) Effective Domain 4) Caring Domain 5) Well ed Domain RESPONSIVE DOMAIN RESPONSIVE DOMAIN Metric Defined by Standard Apr-16 May-16
BSUH INTEGRATED PERFORMANCE REPORT 1) Responsive Domain 2) Safe Domain 3) Effective Domain 4) Caring Domain 5) Well ed Domain RESPONSIVE DOMAIN RESPONSIVE DOMAIN Metric Defined by Standard Apr-16 May-16
NHS performance statistics
 NHS performance statistics Published: 8 th February 218 Geography: England Official Statistics This monthly release aims to provide users with an overview of NHS performance statistics in key areas. Official
STRATIFICATION GUIDE 2018
 STRATIFICATION GUIDE 2018 The ACHS, in collaboration with relevant medical colleges, associations and specialty societies have developed the following stratification variables to enable like organisations
Prime Contractor Model King s Fund Nick Boyle Consultant Surgeon 27 March 2014
 Prime Contractor Model King s Fund Nick Boyle Consultant Surgeon 27 March 2014 Current Referral Route options - Information 1. Horizon Health Choices Horizon Musculoskeletal Triage & Treatment Chronic
REASSESSING THE BED COORDINATOR S ROLE SHADY GROVE ADVENTIST HOSPITAL
 Publication Year: 2008 REASSESSING THE BED COORDINATOR S ROLE SHADY GROVE ADVENTIST HOSPITAL Summary: Creation of Bed Coordinator position to improve patient flow throughout the entire hospital Hospital:
WAITING TIMES AND ACCESS TARGETS
 NHS Board Meeting Tuesday 17 December 2013 Lead Director (Acute Services Division) Board Paper No 13/60 Recommendation: WAITING TIMES AND ACCESS TARGETS The NHS Board is asked to note progress against
PATIENT CARE SERVICES REPORT Submitted to the Joint Conference Committee, March 2018
 Report Contents: PATIENT CARE SERVICES REPORT Submitted to the Joint Conference Committee, March By: Terry Dentoni, MSN, RN, CNL - ZSFG Chief Nursing Officer 1. Professional Nursing......1-2 2. Emergency