6FCEDS. Sponsored by:
|
|
|
- Elfrieda Booker
- 5 years ago
- Views:
Transcription


1 6FCEDS Sponsored by: EDA Award #
2 ACKNOWLEDGEMENTS AND NOTES SEDA-COG would like to gratefully acknowledge the participation of the following project participants from Centre, Clinton, and Mifflin Counties: Centre County: Mr. Steven Dershem, Mr. Michael Pipe, Mr. Mark Higgins, and Mr. Chris Exarchos, current and former Commissioners Mr. Robert Jacobs, Ms. Sue Hannegan, and Ms. Elizabeth Lose, Centre County Office of Planning and Community Development Mr. Nicholas Barger, Office of GIS Clinton County: Mr. Robert Pete Smeltz, Mr. Jeffrey Snyder, Mr. Paul Conklin, and Mr. Joel Long, current and former Commissioners Mr. Tim Holladay, Clinton County Planning Department Mr. Jim Watson and Mr. Dan Ake, Clinton County GIS Department Mr. Michael Flanagan, Clinton County Economic Partnership Mifflin County: Mr. Kevin Kodish, Ms. Lisa Nancollas, Mr. Stephen Dunkle, Mr. Mark Sunderland, and Mr. Otis Riden, current and former Commissioners Mr. William Gomes, Mifflin County Planning and Development Department Ms. Laura Simonetti, Mifflin County GIS Department Mr. Michael Petroski, Standard Steel Mr. Robert Postal, Mifflin County Industrial Development Corporation We also wish to acknowledge the many valuable contributions of our utility law consultant, Mr. Anthony Adonizio, Esq., and the SEDA-COG Board for their support Additional digital copies of this report (in PDF format) may be downloaded from SEDA-COG s Regional Gas Utilization Initiative Study Web page at ii
3 TABLE OF CONTENTS Executive Summary... ES-1 Project Overview Economic Need for Project Project Goals Key Task Areas Measurement of Successful Outcomes General Description of Project Area Centre County Clinton County Mifflin County Targeted Investment Areas Methodology, Analysis, and Results Methodology Summary of Targeted Investment Area Assessment and Evaluation Results Legal Advice Utility Law Investigation Governance Project Results Summary of Results Future Needed Actions Appendix A Targeted Investment Areas: Data Inconsistencies, Recommendations for Improvements, and Prospects for a Replicable Process Model... A-1 A.1 Data Inconsistencies... A-1 A.2 Recommendations for Improvements... A-2 A.3 Prospects for a Replicable Modeling Process... A-2 Appendix B Draft Nonprofit Cooperative Articles of Incorporation... B-1 Appendix C Draft Nonprofit Cooperative Membership Application and Agreement... C-1 iii
4 LIST OF FIGURES AND TABLES Figure ES-1: Percentage of Homes Heated with Natural Gas, Pennsylvania Counties... ES-1 Figure ES-2: Centre, Clinton, and Mifflin Counties Location Map... ES-3 Figure ES-3: Beech Creek-Blanchard-Valley Enterprise Container Targeted Investment Area: Assessment Ratings... ES-4 Figure ES-4: Beech Creek-Blanchard Targeted Investment Area: Proposed Project Phases and Projected Costs... ES-6 Figure 1-1: Percentage of Homes Heated with Natural Gas, Pennsylvania Counties Figure 1-2: Natural Gas Distribution Company Tariffed Areas in Project Counties Figure 2-1: Centre, Clinton, and Mifflin Counties Location Map Table 2-1: Characteristics of Study Counties Figure 3-1: SEDA-COG RGUI Targeted Investment Areas Model Approach Figure 3-2: Major Natural Gas Transmission Lines - Centre, Clinton, and Mifflin Counties Table 3-1: RGUI Assessment Index Rating Factors Figure 3-3: Mifflin County Hotspot Cluster Analysis Map Table 3-2: RGUI Evaluation Rating Factors and Weights Figure 3-4: Virtual Pipelines Evaluation Factors Figure 3-5: Decision Lens Level 1 and Level 2 Comparisons Hardline Extensions Figure 3-6: Example Decision Lens Factor Comparison Screen Table 3-3: Decision Lens Rankings for Centre County Targeted Investment Areas Hardline Extension Table 3-4: Decision Lens Rankings for Centre County Targeted Investment Areas Virtual Pipelines Table 3-5: Decision Lens Rankings for Clinton County Targeted Investment Areas Hardline Extensions Table 3-6: Decision Lens Rankings for Clinton County Targeted Investment Areas Virtual Pipelines Table 3-7: Decision Lens Rankings for Mifflin County Targeted Investment Areas Hardline Extensions Table 3-8: Decision Lens Rankings for Mifflin County Targeted Investment Areas Virtual Pipelines Figure 3-7: Decision Lens Grouped Evaluation Criteria Weights for Targeted Investment Areas, by County - Hardline Extensions Figure 3-8: Decision Lens Grouped Evaluation Criteria Weights for Targeted Investment Areas, by County Virtual Pipelines Figure 3-9: Decision Lens Individual Evaluation Criteria Weights for Targeted Investment Areas, by County - Hardline Extensions Figure 3-10: Decision Lens Individual Evaluation Criteria Weights for Targeted Investment Areas, by County Virtual Pipelines Table 3-9: Residential Fuel Consumption Table 3-10: Commercial Fuel Consumption Table 3-11: Centre County Matrix of Assessment Rating Scores iv
5 Table 3-12: Centre County Targeted Investment Area Evaluation/Prioritization Ratings Table 3-13: Centre County Targeted Investment Area Evaluation/Prioritization Ratings Virtual Pipelines Figure 3-11: Carolean Industrial Park Targeted Investment Area: Assessment Ratings Figure 3-12: Centre Hall-Old Fort-Grange Fair-Hanover Foods Targeted Investment Area: Assessment Ratings Figure 3-13: Milesburg-I-80/Alt. US 220 Interchange Targeted Investment Area: Assessment Ratings Figure 3-14: Moshannon Valley Business Park Targeted Investment Area: Assessment Ratings Figure 3-15: Snow Shoe Targeted Investment Area: Assessment Ratings Figure 3-16: Centre Hall-Old-Fort-Grange Fair-Hanover Foods Targeted Investment Area: Proposed Project Phases and Projected Costs Columbia Gas Solution Table 3-14: Centre Hall-Old-Fort-Grange Fair-Hanover Foods Targeted Investment Area: Proposed Project Phases and Projected Costs Columbia Gas Solution Figure 3-17: Centre Hall-Old-Fort-Grange Fair-Hanover Foods Targeted Investment Area: Proposed Project Phases and Projected Costs Virtual Pipeline Solution Table 3-15: Centre Hall-Old-Fort-Grange Fair-Hanover Foods Targeted Investment Area: Proposed Project Phases and Projected Costs Virtual Pipeline Solution Figure 3-18: Milesburg-I-80 Targeted Investment Area: Proposed Project Phases and Projected Costs Table 3-16: Milesburg-I-80 Targeted Investment Area: Proposed Project Phases and Projected Costs Figure 3-19: Snow Shoe Targeted Investment Area: Proposed Project Phases and Projected Costs Table 3-17: Snow Shoe Targeted Investment Area: Proposed Project Phases and Projected Costs Table 3-18: Clinton County Matrix of Assessment Rating Scores Table 3-19: Clinton County Targeted Investment Area Evaluation/Prioritization Ratings Table 3-20: Clinton County Targeted Investment Area Evaluation/Prioritization Ratings Virtual Pipelines Figure 3-20: Beech Creek-Blanchard-Valley Enterprise Container Targeted Investment Area: Assessment Ratings Figure 3-21: Mill Hall-Hogan Blvd. Targeted Investment Area: Assessment Ratings Figure 3-22: Beech Creek-Blanchard Targeted Investment Area: Proposed Project Phases and Projected Costs Table 3-21: Beech Creek-Blanchard Targeted Investment Area: Proposed Project Phases and Projected Costs Figure 3-23: Mill Hall-Hogan Blvd. Targeted Investment Area: Proposed Project Phases and Projected Costs Table 3-22: Mill Hall-Hogan Blvd. Targeted Investment Area: Proposed Project Phases and Projected Costs Table 3-23: Mifflin County Matrix of Assessment Rating Scores v
6 Table 3-24: Mifflin County Targeted Investment Area Evaluation/Prioritization Ratings Table 3-25: Mifflin County Targeted Investment Area Evaluation/Prioritization Ratings Virtual Pipelines Figure 3-24: Mifflin County Industrial Park and Surrounding Areas Targeted Investment Area: Assessment Ratings Figure 3-25: Standard Steel and Area to North Targeted Investment Area: Assessment Ratings Figure 3-26: US 322-Burnham Interchange Targeted Investment Area: Assessment Ratings Figure 3-27: Area East of US 322-Milroy Interchange Targeted Investment Area: Proposed Project Phases and Projected Costs Table 3-26: Area East of US 322-Milroy Interchange Targeted Investment Area: Proposed Project Phases and Projected Costs Figure 3-28: Pleasant Acres East Targeted Investment Area: Proposed Project Phases and Projected Costs Table 3-27: Pleasant Acres East Targeted Investment Area: Proposed Project Phases and Projected Costs Figure 3-29: Freedom Avenue Targeted Investment Area: Proposed Project Phases and Projected Costs Table 3-28: Freedom Avenue Targeted Investment Area: Proposed Project Phases and Projected Costs Table 4-1: Identified Options for Establishing an Enabling Entity for New Natural Gas Service Figure 4-1: Potential New Natural Gas Service Relationships, Without Support Figure 4-2: Potential New Natural Gas Service Relationships, With Support Table 4-2: SEDA-COG Regional Gas Utilization Initiative Potential Project Funding Sources Table 4-3: Geographic Options for Establishing a Nonprofit Cooperative Corporation(s) Figure 4-3: SEDA-COG RGUI Nonprofit Cooperative Development Process Figure 5-1: Proposed Schedule for Startup and Maintenance of Natural Gas Nonprofit Cooperative Corporation vi

7 EXECUTIVE SUMMARY Overview of Project Pennsylvania is rich in natural gas resources, and since the Marcellus Shale formation has recently become accessible the volume of gas extracted in the state has dramatically increased. However, access to this new source of natural gas in the 11-county region served by SEDA-Council of Governments (SEDA-COG) has been greatly constrained because of the lack of delivery infrastructure (see Figure ES-1). Provision of natural gas service has also often been restricted in the past to many potential business, institutional, commercial and residential customers by traditional natural gas distribution companies (NGDCs). This barrier has existed because of substantial distances involved in extending pipelines, problematic cost economics, and regulatory restrictions. SEDA-COG recognizes that it is vital to our region s economic viability to promote and enable better access to natural gas to attract new jobs and retain existing ones, as well as to provide energy cost savings to consumers. Figure ES-1: Percentage of Homes Heated with Natural Gas, Pennsylvania Counties Source: Analysis of Potential Demand for the Extension and Expansion of Natural Gas Distribution Infrastructure in Pennsylvania: A Report in Response to Senate Resolution 29, The Centre for Rural Pennsylvania, November ES-1
8 In this EDA-funded Regional Gas Utilization Initiative (RGUI), SEDA-COG proposed new natural gas services through identification and prioritization of targeted investment areas ( TIAs ) suitable for new or expanded natural gas service. We also organized stakeholders and built consensus for provision of these services, identified potential grant and loan funding programs for developing those services, and investigated potential supporting regulatory actions that have led to establishment of a new regional SEDA-COG natural gas Nonprofit Cooperative Corporation (NPC). The impetus for this initiative was provided largely by SEDA-COG s experience in establishing a Joint Rail Authority (JRA), which was formed in the 1980s to retain short line rail service to large industrial customers in the wake of Conrail s plans to abandon many lines. The JRA has proven to be a success in its mission, and SEDA-COG viewed the organization as a potential model in forming a similar regulatory body (or bodies) for providing natural gas services. The following were the proposed goals of the project: Identify the legal, operational and funding requirements to create a municipal authority, cooperative, corporation or other body charged with facilitating and expanding natural gas utility service and usage throughout the project area. Identify early opportunities for providing gas utility service to existing industrial parks and residential areas. Identify potential new industrial sites and parks in close proximity to other supporting infrastructure for development by county industrial development corporation groups in both the short and long term that will serve as attractive locations for manufacturers utilizing gas as both an energy source and feedstock for their operations. Identify priority locations that would also provide gas service to residential areas at the same time so as to significantly reduce energy costs to residential users and increase disposable income which is a key to stimulating local consumption and demand so critical to sustaining a vibrant regional economy. Identify at least one potential demonstration project in each of the counties that could be undertaken in the near term in order to test the commercial viability of this approach to regional economic development. In addition, to address the economic development needs of the SEDA-COG region as set forth in the Comprehensive Economic Development Strategy: Five Year Update report 1, the RGUI project was intended to support strategic goals 1, 2, 3, and 4 of the Action Plan on the CEDS: 1. Encourage the protection, modernization, and expansion of existing businesses and job opportunities, and where appropriate, encourage entrepreneurship and the recruitment of new business and industry consistent with the character of the Region. 2. Encourage the prudent utilization of the area's natural resources in an environmentally sustainable manner (including land, water, natural gas, and lumber). 1 Comprehensive Economic Development Strategy: Five Year Update, SEDA-Council of Governments, June ES-2
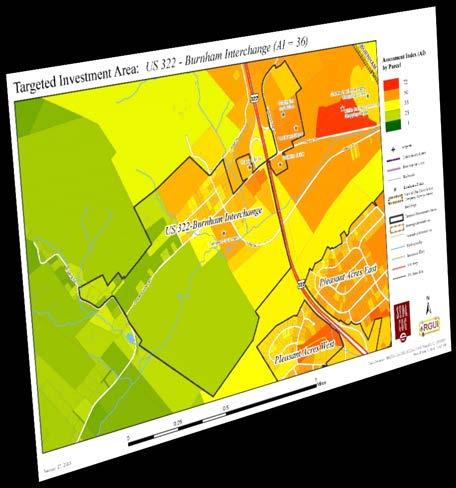
9 3. Improve and expand infrastructure, flood resiliency, and conservation/greening efforts to enhance the older and rural centers throughout the area for business and economic development. 4. Actively encourage energy conservation and foster the deployment of locally-owned, locally-used energy projects. Project Area A project area included Centre, Clinton and Mifflin Counties, which are located in rural Central Pennsylvania. The map below in Figure ES-2 shows the location of the three-county area. Figure ES-2: Centre, Clinton, and Mifflin Counties Location Map Targeted Investment Areas Methodology, Analysis, and Results The first major goal of the RGUI project was to identify key targeted investment areas that could benefit from new or increased access to natural gas utility service. Initial results were achieved through development and institution of a systematic process for identifying concentrations of potential utility gas users, using a set of economic, social, environmental, and accessibility assessment factors applied through automated geographic information systems (GIS) analysis procedures. Assessment index values were generated for each property parcel in all counties, with higher values indicating properties most attractive or suitable for new natural gas service. Figure ES-3 provides an example of the resulting assessment map for one of the TIAs. ES-3
10 Figure ES-3: Beech Creek-Blanchard-Valley Enterprise Container Targeted Investment Area: Assessment Ratings ES-4
11 Second, the TIAs were prioritized using a group collaborative process that provided a structured yet flexible suite of tools for ranking candidate TIAs according to non-quantifiable factors. The prioritization process yielded five priority TIAs for Centre County, three for Mifflin County, and two for Clinton County. These TIAs were then evaluated for potential natural gas consumption usage, and high-level cost estimates were developed for phased implementation. Recommended infrastructure types considered for these TIAs included hardline expansions of distribution system pipelines as well as deployment of virtual pipelines, infrastructure based upon delivery of compressed natural gas by truck. The example shown in Figure ES-4 displays the resulting project phases and projected costs map for one TIA. ES-5
12 Figure ES-4: Beech Creek-Blanchard Targeted Investment Area: Proposed Project Phases and Projected Costs ES-6
13 Legal Advice To complement the targeted investment area process, a utility law consultant conducted research to determine the feasibility of establishing an organizational entity to carry out administrative, funding, and oversight responsibilities involved in the provision of natural gas distribution service in the threecounty project region. The consultant completed a utility law investigation report that included a written opinion identifying and ranking the feasibility of such entities, with analysis of the various limitations, barriers, and issues associated with each option. The most attractive and achievable organizational option was determined to be a Nonprofit Cooperative Corporation (NPC) structure. The report also evaluated the feasibility of establishing natural gas infrastructure that could be held in public ownership, and whether funds could be leveraged to sustain an income-based funding stream for infrastructure maintenance and expansion. SEDA-COG then worked with the consultant to prepare a list and evaluation of the best potential funding programs. At the conclusion of the targeted investment areas portion of the project, the consultant prepared materials related to establishing the Nonprofit Cooperative Corporation entity, including its recommended structure, steps needed to establish the entity, articles of incorporation, bylaws, a board structure, and defined policies and powers. SEDA-COG also prepared supporting materials for project stakeholders to explain the steps needed to establish the NPC. These supporting documents (see Appendices for examples) formed the blueprint to establish the entity for the three project counties, and county stakeholders began that process immediately following the completion of the project. Project Results In almost all respects, SEDA-COG supported and met the main RGUI project goals. Through applying a systematic process model approach, the Regional Gas Utilization Initiative study was successful in identifying prioritized targeted investment areas, along with determining costs for potential implementation projects for new/expanded natural gas service. The process model proved to be adaptable and flexible in its application, which was necessary because of differences in data availability and quality among the three project counties, and their unique physical and cultural characteristics. The process model is replicable and can be applied in other geographic areas and situations. SEDA-COG identified several priority projects for each county, which include: Centre County: o Centre Hall - Old Fort - Grange Fair - Hanover Foods o Milesburg - I-80/ALT 220 Interchange o Snow Shoe Clinton County: o Beech Creek Blanchard Valley Enterprise Container o Mill Hall Hogan Blvd. Mifflin County: o Mifflin County Industrial Park and Surrounding Areas o Pleasant Acres East o Freedom Avenue Area ES-7
14 SEDA-COG and our utility law consultant also successfully identified actions to establish a Nonprofit Cooperative Corporation administrative body designed to facilitate procurement of grant funding and other potential equity/loan sources for infrastructure development and deployment, ensure sustainability, quicker buildout of natural gas infrastructure, and a faster return on investment. With respect to the CEDA goals mentioned earlier, the project well supports the improvement and expansion of community infrastructure related to economic development. The deployment of locallyowned, distributed energy projects is also being facilitated through establishment of the Nonprofit Cooperative Corporation. There is much yet to be done to move completely away from the use of fossil fuels in the SEDA-COG region in the long-term, but increased utilization of natural gas resources can provide a cleaner immediate benefit than other fossil fuels currently in widespread use. Perhaps equally important to our analysis are the results from promoting the need for increased access to natural gas access throughout the SEDA-COG region and beyond. SEDA-COG staff have spoken to many groups about the project and the region s natural gas needs, and our participation in the Governor s Pipeline Infrastructure Task Force has raised SEDA-COG s profile and participation in promoting better access to natural gas statewide. SEDA-COG looks to continue this meaningful role in the future. Finally, it is important to emphasize that SEDA-COG considers this report to essentially be the feasibility and planning study that will lead to development and implementation of actual new natural gas services. ES-8
15 1. PROJECT OVERVIEW AND APPROACH 1.1. Economic Need for Project Pennsylvania is rich in natural gas resources, and since the Marcellus Shale formation has recently become accessible the volume of gas extracted in the state has dramatically increased. However, access to this new source of natural gas in the 11-county region served by SEDA-Council of Governments (SEDA-COG) has been greatly constrained because of the lack of delivery infrastructure (see Figure 1-1). Figure 1-1: Percentage of Homes Heated with Natural Gas, Pennsylvania Counties Source: Analysis of Potential Demand for the Extension and Expansion of Natural Gas Distribution Infrastructure in Pennsylvania: A Report in Response to Senate Resolution 29, The Centre for Rural Pennsylvania, November Provision of natural gas service has also often been restricted in the past to potential business, institutional, commercial and residential customers by traditional natural gas distribution companies (NGDCs). This barrier has existed because of substantial distances involved in extending pipelines, problematic cost economics, and regulatory restrictions. In addition, individual NGDCs are only authorized to provide service in tariffed areas (by municipality) where they have received approval from the Pennsylvania Public Commission (PUC). These areas covered are often a patchwork of locations, do 1-1

16 not always cover complete counties, and may overlap. This is the case in the three project counties (Figure 1-2). Figure 1-2: Natural Gas Distribution Company Tariffed Areas in Project Counties Source: Centre County Office of Planning and Community Development SEDA-COG recognizes that it is vital to our region s economic viability to promote and enable better access to natural gas to attract new jobs and retain existing ones, as well as to provide energy cost savings to consumers. This need is reflected in several of the Strategic Goals defined in SEDA-COG s 2015 CEDS (Comprehensive Economic Development Strategy) plan update. In this EDA-funded Regional Gas Utilization Initiative (RGUI), SEDA-COG proposed new natural gas services through identification and prioritization of targeted investment areas ( TIAs ) suitable for new or expanded natural gas service. We also organized stakeholders and built consensus for provision of these services, identified potential grant and loan funding programs for developing those services, and investigated potential supporting regulatory actions that have led to establishment of a new SEDA-COG regional natural gas Nonprofit Cooperative Corporation (NPC). The impetus for this initiative was provided largely by SEDA-COG s experience in establishing a Joint Rail Authority (JRA), which was formed in the 1980s to retain short line rail service to large industrial customers in the wake of Conrail s plans to abandon many lines. The JRA has proven to be a success in its mission, and SEDA-COG viewed the 1-2
17 organization as a potential model in forming a similar regulatory body (or bodies) for providing natural gas services Project Goals As submitted in the project proposal to EDA, the following were the identified goals: Identify the legal, operational and funding requirements to create a municipal authority, cooperative, corporation or other body charged with facilitating and expanding natural gas utility service and usage throughout the project area. The project results determined that such a body is needed to facilitate provision of new natural gas service, and SEDA-COG will be involved in establishing and operating that body. Identify early opportunities for providing gas utility service to existing industrial parks and residential areas. These existing areas were typically identified as priorities for new service in the project. While providing natural gas to industrial parks and similar private business clusters and locations would result in significant economic benefits to the SEDA-COG region, existing, older residential areas also deserve consideration in sharing potential benefits, and were included in the project analyses. Identify potential new industrial sites and parks in close proximity to other supporting infrastructure for development by county industrial development corporation (IDC) groups in both the short and long term that will serve as attractive locations for manufacturers utilizing gas as both an energy source and feedstock for their operations. Proximity to supporting infrastructure, such as highways, rail, water, and sewer service is important to potential industrial users. Identify priority locations that would also provide gas service to residential areas at the same time so as to significantly reduce energy costs to residential users and increase disposable income which is a key to stimulating local consumption and demand so critical to sustaining a vibrant regional economy. This goal was included to ensure that a combination of potential users would benefit from new natural gas projects. For example, extension of a line to an industrial plant would provide a higher level of benefits if residential areas along the route could also be added to the line. Identify at least one potential demonstration project in each of the counties that could be undertaken in the near term in order to test the commercial viability of this approach to regional economic development. With three counties participating in this project, each was to have at least one potential, viable project identified for new or expanded natural gas service. In actuality, SEDA- COG identified several priority projects for each county, which include: Centre County: o Centre Hall - Old Fort - Grange Fair - Hanover Foods o Milesburg - I-80/ALT 220 Interchange o Snow Shoe Clinton County: 1-3
18 o o Beech Creek Blanchard Valley Enterprise Container Mill Hall Hogan Blvd. Mifflin County: o Mifflin County Industrial Park and Surrounding Areas o Pleasant Acres East o Freedom Avenue Area Identify the infrastructure needed to make natural gas fueling a viable alternative for locally operated vehicle fleets in the private and public sector, and facilitate projects for construction of said infrastructure. For various reasons, SEDA-COG chose not to focus directly on fueling of fleets and associated infrastructure in this project. This topic was indirectly considered with regard to potential establishment of virtual pipeline natural gas delivery systems, but a follow-up phase of the project would be more appropriate to consider these opportunities because of the breadth and complexity of the topic. In addition, to address the economic development needs of the SEDA-COG region as set forth in the Comprehensive Economic Development Strategy: Five Year Update report 2, the RGUI project was intended to support strategic goals 1, 2, 3, and 4 of the Action Plan on the CEDS: 1. Encourage the protection, modernization, and expansion of existing businesses and job opportunities, and where appropriate, encourage entrepreneurship and the recruitment of new business and industry consistent with the character of the Region. 2. Encourage the prudent utilization of the area's natural resources in an environmentally sustainable manner (including land, water, natural gas, and lumber). 3. Improve and expand infrastructure, flood resiliency, and conservation/greening efforts to enhance the older and rural centers throughout the area for business and economic development. 4. Actively encourage energy conservation and foster the deployment of locally-owned, locally-used energy projects. The RGUI project well supports the improvement and expansion of community infrastructure related to economic development. The deployment of locally-owned, distributed energy projects is also being facilitated through establishment of a natural gas Nonprofit Cooperative Corporation Key Task Areas Targeted Investment Area (TIA) Identification The first main key task area in the project was to identify concentrations of likely natural gas users, and evaluate and prioritize these areas for provision of new or upgraded service. These areas, defined as Targeted Investment Areas, or TIAs, were assessed, evaluated, and prioritized through the processes described in detail in Section 3 of this report. 2 Comprehensive Economic Development Strategy: Five Year Update, SEDA-Council of Governments, June
19 Legal Advice The second main key task area was to obtain legal advice, recommendations, and required input from the Pennsylvania Public Utility Commission and other entities for funding the formation and operation of a multi county entity (or entities) to administer and/or operate natural gas line extensions or expansions. This work was completed with the assistance of a utility law consultant who performed research related to determining feasibility of these entities and formulated recommendations on implementing follow-on actions. The results are described in Section 4 of this report Measurement of Successful Outcomes Success of this project is demonstrated by two main results. First, identification of suitable, viable potential natural gas extension or expansion projects for each county (through analysis of the targeted investment areas) was achieved, with potential costs and benefits detailed. Secondly, the project has set the stage for actual development and implementation of those projects. Development and deployment of new natural gas infrastructure will be facilitated through establishment of the new SEDA- COG natural gas Nonprofit Cooperative Corporation (discussed in detail in Section 4). Development of actual infrastructure will not be achieved for some time after the end of the project, but the study results and plans for follow-up work should help to ensure that this outcome is realized within a reasonable time frame. 1-5

20 2. GENERAL DESCRIPTION OF PROJECT AREA The pilot project area includes Centre, Clinton and Mifflin Counties. These counties are located in rural Central Pennsylvania. The map below in Figure 2-1 shows the location of the three-county area. Figure 2-1: Centre, Clinton, and Mifflin Counties Location Map Table 2-1 below provides a summary of various characteristics of each county. 2-1
21 Table 2-1: Characteristics of Study Counties Area (Square Miles) Population (2010) Persons per Square Mile Major Highways Major Railroads Incorporated Municipalities Natural Gas Distribution Companies Long-Distance Transmission Lines Top 5 Major Employers Centre Clinton Mifflin 1, , , , Interstates 80 and 99 U.S. Routes 220 and 322 Norfolk Southern SEDA-COG (Joint Rail Authority) State College Bellefonte Milesburg Ferguson Township Centre Hall Howard Millheim Snow Shoe Philipsburg Port Matilda Unionville Columbia Gas UGI Dominion Transmission, Inc. Texas Eastern Transmission Columbia Gas Transmission Corp Pennsylvania State University State Government State College Area School District Mount Nittany Medical Center Wal-Mart/Sam s Club Interstate 80 U.S. Route 220 PA Route 120 Norfolk Southern SEDA-COG (Joint Rail Authority) Lock Haven Renovo Mill Hall Avis Beech Creek Flemington Loganton South Renovo UGI Williams Gas Pipeline- Transco Dominion Transmission, Inc. Enterprise Products Operating LLC Columbia Gas Transmission Corp First Quality Products Inc. Keystone Central Schools State System of Higher Education First Quality Tissue, LLC Truck-Lite Co Inc. U.S. Routes 22, 322, and 522 Norfolk Southern Amtrak SEDA-COG (Joint Rail Authority) Lewistown Burnham Belleville Juniata Terrace Kistler McVeytown Newton Hamilton UGI Columbia Gas of Pennsylvania Dominion Transmission, Inc. Texas Eastern Transmission Williams Gas Pipeline- Transco Philips Ultrasound Inc. Geisinger-Lewistown Hospital Standard Steel Trinity Plastics Inc. First Quality Baby Products LLC 3 Source: U.S. Census Bureau: American Community Survey ( ) 5-Year Estimate. 2-2
22 Other economic data Over 2,000 businesses Unemployment rate of 3.2% (November 2015) 4 Unemployment rate of 5.5% Unemployment rate of 4.6% (November 2015) 4 (November 2015) Centre County Centre County was named due to its geographic location in the center of Pennsylvania. It neighbors Clinton and Mifflin counties, and is the largest in size and population of the three counties included in the project area. The largest communities in Centre County are State College (population 42,066 3 ), home to Penn State University, and Bellefonte (population 6,250 3 ), the county seat. Philipsburg, Boalsburg, Zion, Centre Hall, Pleasant Gap, Lemont, Pine Grove Mills, Milesburg, and Stormstown are other noteworthy communities. Penn State University is the largest employer in Centre County. Centre County is a transportation hub for central Pennsylvania, with two main Interstate highways (Interstate 99, a north-south corridor, and Interstate 80, a major east-west facility), along with U.S. Route 322. The University Park Airport also provides significant commercial air service for the State College region. Centre County government hosts a Natural Gas Task Force, which meets regularly to consider how to promote and manage natural gas services Clinton County Clinton County is located directly north of Centre County. Its population is the smallest of the three project counties. The main community in Clinton County is the county seat of Lock Haven (population 9,860 3 ), home to Lock Haven University. Other communities of note include Renovo, Mill Hall, Flemington, Avis, and Lamar. North of Lock Haven much of the landscape is preserved as state forest land, and has significant Marcellus Shale natural gas deposits and extraction activity. Clinton County is served by Interstate 80 and U.S. Route 220. For most of its length through the county, U.S. 220 is a limited access freeway, and is proposed to become part of an extended I-99 corridor. Of the three counties, Clinton currently has the most natural gas activity. Clinton County government also coordinates a Natural Gas Task Force, which is a community initiative established by the County Commissioners that aims to identify what has to be done to develop local gas deposits in order to most significantly benefit the community Mifflin County Mifflin County is the southernmost of the three project counties and is also the most rural. U.S. Routes 22, 322, and 522 are the main highways that connect the county to the rest of the state. U.S. 322 is a four-lane highway through most of the county with limited access freeway sections. The Juniata River also flows through the county. Lewistown (population 8,341 3 ) is the major city and county seat. Other significant communities include Belleville, Burnham, Yeagertown, and Milroy. 4 Source: U.S. Department of Labor, Bureau of Labor Statistics Web site. 2-3
23 3. TARGETED INVESTMENT AREAS METHODOLOGY, ANALYSIS, AND RESULTS 3.1. Methodology Introduction and Overview The first main goal of the Regional Gas Utilization Initiative project was to identify key investments to help sustain existing industrial activity and facilitate the expansion of new activity by providing increased access to natural gas utility service. This goal was approached through development of a systematic process model for identifying concentrations of potential utility gas users. The process model expanded upon the approach and study completed by the Centre County Planning and Community Development Office in 2012, which included 10 assessment factors to identify potential natural gas line extension sites. 5 A total of 13 assessment factors were included in our study. As with the Centre County study, the SEDA-COG process model was supported by the use of geospatial analysis tools, mainly geographic information systems (GIS), as an identification and initial screening mechanism. Potential candidate areas were initially identified based upon a set of assessment criteria including economic, social, environmental, and accessibility factors. Areas where the benefits of providing utility line natural gas service were sufficient to warrant further consideration were defined to be Targeted Investment Areas (TIAs). TIAs were generally areas of large-scale industrial or commercial usage or smaller scale self sustaining extensions of existing natural gas line networks, where residential service could be extended on a block-by-block basis through projects with sufficient density and participation to offset costs on an incremental basis. In some cases, these types of areas occurred in the same TIA. The TIAs were then prioritized using a computerized group decision-making tool called Decision Lens 6, which provided a structured yet flexible suite of tools that generated automated weighting of factors and ranking of candidate TIAs. From the prioritized list of TIAs, stakeholders selected a subset of the top areas for final consideration Approach SEDA-COG accomplished identification and prioritization of the TIAs through completion of the following modeling steps, as shown in Figure 3-1. Each step is described in the following sections. 5 Rural Gasification in Centre County, Centre County Planning and Community Development Office, 11/29/ Decision Lens was made available for use by SEDA-COG through the Pennsylvania Department of Transportation s transportation planning program. 3-1

24 Figure 3-1: SEDA-COG RGUI Targeted Investment Areas Model Approach Each of these steps is further discussed in the following sections Assessment Factors and Process To facilitate the process for identifying TIAs, SEDA-COG first utilized or obtained current GIS layers and associated attribute data (mainly computer-assisted mass appraisal, or CAMA, data) for each of the three counties. We had already procured or created many regional geospatial map data layers as part of developing SEDA-COG s Long-Range Transportation Plan, and the data obtained for the RGUI project added substantially to our library of regional information. We then defined and employed a single process method as a template and ran it for each county using ArcGIS software. It is important to acknowledge that each county stores data and information differently, with varying levels of completeness and coverage. Therefore, the processing and analysis approach had to be adapted to available data and their specific characteristics for each county. (Some issues and representative examples are described in Appendix A.) These data were used to produce thematic TIA maps displaying attribute data classes for each of the assessment factors. SEDA-COG staff conducted a series of TIA meetings with staff, elected leaders, and economic development officials from each of the three 3-2
25 counties, where GIS mapping and attribute data were interactively reviewed to promote identification of potential TIAs for each county. Thirteen factors (described below) were employed by SEDA-COG to compile suitability assessment total scores for each candidate TIA. We scored each factor on a 1 to 10 scale of possible points. Results are discussed in Section These descriptions are followed by a table with the assessment rating scale used for each factor and which factors were available and calculated for each of the three counties (Table 3-1). Property types. Codes for property type/use are extracted from CAMA databases maintained by County tax assessment offices. Classes of property types varied in each county depending on how the data provided was collected and represented. As reflected in possible points to be assigned for each parcel, the main property type to be targeted for natural gas expansion was industrial. Individual standalone commercial properties were of second priority. Mixed property types containing commercial uses could be attractive for extension of natural gas lines, but may lead to that type of landowner bearing the bulk of the investment cost that includes service for the other types present. Natural gas line extension to commercial users may also require costly excavation and surface restoration activities. For various reasons, expansion of natural gas service to residential areas may be one of the least cost-effective options. Providing service to already built-out neighborhoods requires working on or around existing infrastructure (roads, sidewalks, waterlines, sewer lines, etc.). In addition, not all homeowners in a development may want gas service if an expansion project disrupts other utilities, causes perceived damage to properties, or if initial service fees or payback schedules are viewed as too expensive. However, established residential areas could still be attractive to add on to an extension that also serves additional property types/clusters. Note that vacant properties, seasonal properties, and non-permanent structures were not ranked for this analysis. Heating fuel types. In the three county study area, most industries, businesses, and homes are heated with either fuel oil or electricity. Propane gas users were rated the highest for conversion suitability in this analysis; although propane gas is only used in a small percentage of all properties, converting a propane gas fueled heating system to one using natural gas should be a simpler, less costly process. Parcels that had no fuel type identified or where the fuel type was unknown received a value of 0. Including fuel source as a factor in the analysis should also reveal customers who are in close proximity to a natural gas distribution line but are using another home heating source. (Note: This data was available only for Centre County.) Heating systems. The heating system determines the method by which heat energy is delivered throughout the structure, although this data does not indicate the actual energy source. From this factor, the system could be evaluated as being conventional or unconventional, with consideration of its components. Forced air furnace systems are the most common heating system type for all counties, followed by baseboard heat and boilers and heat pumps. The majority of these heat pumps are air source heat pumps which are fueled by electricity. Forced air systems (furnace, ducts, and vents) and hot water boiler systems (pipes and radiators) constitute the components that deliver heat. Baseboard heat systems utilize individual heaters in every room. Heat pumps are more energy efficient versus conventional heating systems, and have both heating and cooling capabilities. (Note: Some counties had much more information for this field than others.) 3-3
26 Building square footages. The building square footage for each parcel was generated by calculating the square footage of buildings found in each parcel. The values for this data were obtained either from the county CAMA database or were calculated from the square footage of the building footprints in the GIS map layer, depending upon the county. Parcels that had a greater amount of square footage were given a higher assessment value, while parcels with a lower amount of square footage were given a lower assessment value. This ranking helped to identify the larger facilities first, with most residential uses scoring much lower. Industries with growth potential through natural gas service utilization. Industrial growth potential for each parcel was determined by using the federally-defined NAICS (North American Industry Classification System) codes as applied to data obtained from the Central Pennsylvania Workforce Development Corporation. Using the latest available Census employment data (2008), industries were identified whose primary product and/or service show potential for using natural gas. The values given to each parcel were determined by the first four digits in this code. has an extensive list of current and expanding industries that utilize natural gas, and provides details for industrial applications. Industry consumes a significant amount of natural gas in the United States, and this consumption is concentrated in a relatively small number of sectors, including pulp and paper manufacturing, metals, chemicals, petroleum refining, stone/clay/glass/cement/ceramics/plastics manufacturing, and food processing industries. Use of natural gas in these industries includes heating and cooling, water treatment and incineration, metals preheating, drying and dehumidification, glass melting, food processing, and fueling industrial boilers. Some additional innovative and specific uses of natural gas in industry occur in the plastics, pharmaceutical, candy manufacturing, and recycling industries, mostly for product drying and moisture absorption. Sales volumes of industry/ business. Sales volumes of the businesses and industries can be rated by using economic data. Targeted businesses and industries that employ a significant number of people and generate a high volume of sales are important to the areas being evaluated and tie directly into job retention and business retention. Such entities may be appropriate candidates for natural gas service in part because of this factor. (Note: The calculation process required additional processing of locations that needed to be adjusted geographically.) Employment numbers. Using 2008 Census employment data and other private sources, industries were rated based on the number of employees. For this factor, industries having more employees were rated higher. Natural gas service distribution areas. This value was determined by addressing whether each parcel was in a tariff (service) area defined by the Pennsylvania Public Utility Commission (PUC) for natural gas distribution companies (in this study, UGI or Columbia Gas), outside of a tariff area, or adjacent to a tariff area (see Figure 1-3). Inside a tariff area received the highest value, while outside a tariff area received the lowest value. (Note: The Pennsylvania Public Utility Commission (PUC) Web site ( has links to further details regarding natural gas company tariffs.) Growth boundaries/future development. A map layer of growth boundaries are often a result of a county s comprehensive planning process. The boundaries generally follow that of public sewerage coverage. Growth boundaries primarily help guide where future development should occur. The 3-4
27 extent of public sewerage and public water typically dictates where new structures can be built. Natural gas service expansion makes sense only if it is being directed towards those areas that contain other infrastructure and services to support development. Data used for this factor was taken from the 2012 SEDA-COG Long Range Transportation Plan, which referenced data provided by each of the counties. For Centre County, data are maintained as a management tool; for Clinton and Mifflin Counties, growth areas are designated in their comprehensive plans primarily as indicated by existing water and sewer service. Transportation corridors. Access to transportation networks and facilities is a key potential factor influencing natural gas expansion. For this factor, a one-half mile buffer was applied using GIS to the major transportation corridors (both road and railway) to identify property parcels defined to be in reasonable proximity to transportation facilities. Major transportation corridors were defined to include railroads, Interstate highways, U.S. Highways and Pennsylvania 2- or 3-digit state highways. Proximity to existing distribution/service lines. The proximity of property parcels to existing natural gas distribution/service lines can serve as a general indicator of the cost and level of effort that may be required to extend or tap into those lines. For this study, SEDA-COG staff worked with the counties and utility companies to determine approximate locations of areas that currently receive natural gas service. Proximity to these areas was judged to be an advantage for extending existing distribution lines. Buffer zones of different distances (within one-half, one, and two miles from natural gas distribution/service lines) were used to assign rating scores. (Note: This factor did not take into account line pressures/capacities of individual lines, for which data were not readily available.) Proximity to existing transmission lines. The proximity of property parcels to existing long-distance natural gas transmission lines (see Figure 3-2) also was determined to provide a possibility for local service connections. Buffer zones of different distances (within one-half, one, and two miles from natural gas transmission lines) were used to assign rating scores. 3-5
 provides a general measure of the attractiveness of a property parcel(s) for development and/or")
28 Figure 2-2: Major Natural Gas Transmission Lines - Centre, Clinton, and Mifflin Counties Proximity to interchanges/strategic access areas. Location near highway interchanges and other strategic access areas (examples rail sidings and yards) provides a general measure of the attractiveness of a property parcel(s) for development and/or provision of natural gas services. Buffer zones of different distances (within one-half, one, and two miles from strategic access features) were used to assign rating scores. 3-6
29 Table 3-1: RGUI Assessment Index Rating Factors Factor Rating Scale Description Counties Used Centre Clinton Mifflin Property types Heating fuel types Heating systems Building square footages Industries with growth potential through natural gas service utilization Sales volumes of industry/ business 10 = Industrial 7 = Commercial, single-use 4 = Commercial, mixed-use 1 = Residential 0 = All others 10 = Propane gas 7 = Electricity and fuel oil 4 = Coal and wood 1 = Kerosene and solar 10 = Forced air and boilers 7 = Baseboard 4 = Solar, space and stove 1 = Heat pump and geothermal 0 = No heating system 10 = 750,000 sq. ft. and larger 9 = 500,000 to 749,999 8 = 250,000 to 499,999 7 = 125,000 to 249,999 6 = 75,000 to 124,999 5 = 50,000 to 74,999 4 = 25,000 to 49,999 3 = 10,000 to 24,999 2 = 5,000 to 9,999 1 = Less than 5,000 sq. ft. 10 = Tax parcels that contain industries that could directly use natural gas 0 = All other tax parcels 10 = Over $1 billion 9 = $100 million to $500 million 8 = $50 million to $100 million 7 = $20 million to $50 million 6 = $10 million to $20 million 5 = $5 million to $10 million 4 = $2.5 million to $5 million 3 = $1 million to $2.5 million 2 = $500,000 to $1 million 1 = Less than $500,000 The target properties are industrial. Propane gas users are targeted in this analysis. Industries whose primary product and/or service is viable or shows potential for using natural gas are identified. X X X X X X X X X X X X X X 3-7
30 Employment numbers Natural gas service distribution areas Growth boundaries Transportation corridors Proximity to existing distribution/ service areas 10 = Industries having more than 10,000 employees 9 = 1,000 to 10,000 employees 8 = 750 to 999 employees 7 = 500 to 749 employees 6 = 250 to 499 employees 5 = 125 to 249 employees 4 = 75 to 124 employees 3 = 50 to 74 employees 2 = 25 to 49 employees 1 = Less than 25 employees 10 = Tax parcels located within a municipality served by a natural gas distribution provider 5 = Tax parcels adjacent to municipalities served by a natural gas distribution provider 0 = Tax parcels located within a municipality not served by a natural gas distribution provider 10 = Tax parcels located within the growth boundary 0 = Tax parcels located outside the growth boundary 10 = Tax parcels located within ½- mile major transportation corridor buffer (Interstates, U.S., and State highways) 0 = Tax parcels not located within the ½ mile buffer 10 = Tax parcels located within ½ mile of an existing distribution/ service area 5 = Tax parcels located within 1 mile of an existing distribution/ service area 2 = Tax parcels located within 2 mile of an existing distribution/ service area 0 = Tax parcels located farther than 2 miles from an existing distribution/ service area Growth boundaries primarily help guide where future development should occur. The proximity to major transportation corridors is a key component of the potential for natural gas expansion. A one-half mile buffer was applied to the major transportation corridors (both road and railway). Service areas were determined using various maps and datasets including locations of actual service lines and heating fuel types. Capacities of lines also must be considered in the evaluation stage. X X X X X X X X X X X X X X X 3-8
31 Proximity to existing transmission lines Proximity to interchanges/ strategic access areas 10 = Tax parcels located within ½ mile of an existing transmission line 5 = Tax parcels located within 1 mile of an existing transmission line 2 = Tax parcels located within 2 mile of an existing transmission line 0 = Tax parcels located farther than 2 miles from an existing transmission line 10 = Tax parcels located within ½ mile of an interchange or strategic access area 5 = Tax parcels located within 1 mile of an interchange or strategic access area 2 = Tax parcels located within 2 miles of an interchange or strategic access area 0 = Tax parcels located more than 2 miles from an interchange or strategic access area Capacities of lines also must be considered in the priority analysis stage. Correlates with development potential. X X X X X X Data Limitations Affecting the Assessment Process At the beginning of the project, SEDA-COG staff contacted County assessors and GIS staff to request the data used in the TIA assessment phase. We specified what data and formats were needed, and followed up with questions about metadata and interpretation and use of the data. Among the three counties, there were differences and inconsistencies that had to be addressed to provide the best results possible for the assessment analyses. In Mifflin County, further processing of map parcels needed to be performed to make them usable. For Clinton and Mifflin Counties, data did not exist or were incomplete for fuel type and/or heating system. In those cases, the factors were eliminated from the analysis. Building square footage data were also inconsistent across the counties, and had to be addressed on a case-by-case basis as to how the data would be used. Finally, locations of employers and/or the number of employees had to be reviewed and edited in many cases, including performing geocoding edits in GIS. We also had to consider how to utilize incomplete data for locations of natural gas distribution lines. SEDA-COG met with UGI and Columbia Gas to review locational data both before and after priority TIAs had been selected, but lack of such data hindered the early phase of the TIA identification process. It is understandable why natural gas distribution companies are reluctant to share map locations and attributes of their distribution systems (i.e., security, liability, and competition concerns). Non- 3-9
32 disclosure agreements could perhaps have potentially been pursued to share such information at least on a limited basis. These data limitations are typical of what can be expected in working in virtually any geographic area, but were addressed in this project so that the targeted investment area process model could be successfully applied in each county. One reason for this is that there are a robust number of assessment factors that were utilized; it is likely that missing data for one or two factors in any county did not affect the results substantially. It should be noted that additional, county-specific factors could have been added to the process model if requested, which could also be accommodated in other geographic areas if the process model is further utilized. Further discussion on these and other data limitations, along with suggestions for improving the process model, is provided in Appendix A Cluster Identification In the next step of the assessment process, the total values produced for each property parcel were used to create GIS-based countywide thematic maps that displayed graphical representations of those values. SEDA-COG staff then conducted a series of TIA meetings with staff and elected leaders from each of the three counties, where GIS mapping and attribute data were interactively reviewed to identify clusters of potential natural gas users for each county. SEDA-COG personnel continued the process by reviewing GIS mapping to finalize the group of potential clusters. In this process, several rules were followed to include or exclude individual parcels from potential TIA areas: Areas to be included: Look for clusters with high Assessment Index values Look at individual assessment factor values for individual parcels Include residential with other uses when logical Look for unserved neighborhoods/clustered residential Consider older neighborhoods and fill-in areas Include likely planned development areas Look for connection paths Areas to be excluded: Landlocked parcels/ those not likely to be developed (farms) Steep or inaccessible parcels Vacant or publicly owned parcels (parks, state forest, utilities, etc.) Parcels In floodplains (not developable) Residential outliers (too far from existing lines) 3-10
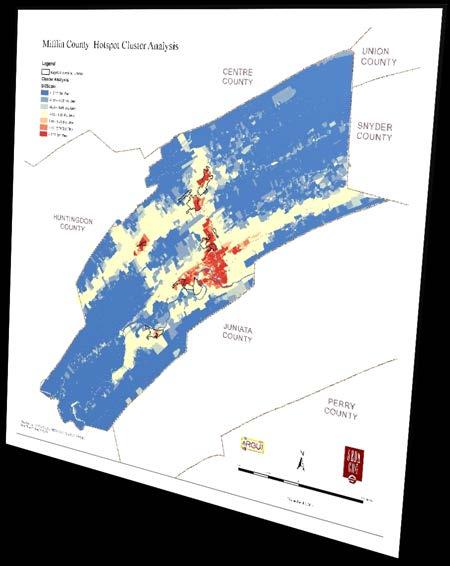
33 In addition to visually identifying potential TIA clusters, GIS staff employed the use of ArcGIS automated cluster analysis algorithms to provide further objective, non-visual guidance checks on potential areas. Cluster analysis is a method of analyzing spatial and data attributes through an algorithm that identifies statistically significant cold spots, hot spots, and spatial outliers. Spatial clustering of features having high and low values (or lack thereof) is determined and typically symbolized with hot and cold color shades. For this project, the assessment scores were used as the cluster data inputs. As an example of one result, the cluster analysis map for Mifflin County is displayed in Figure 3-3 below. Clustered areas with high assessment index values are shown in red shades, while those having low values are indicated by blue colors. The black lines denote the identified TIAs. In some cases, the cluster analysis proved to be valuable in detecting potential TIAs that were not otherwise identified through visual inspection of the assessment results. 3-11

34 Figure 3-3: Mifflin County Hotspot Cluster Analysis Map Evaluation Factors and Process The resulting TIAs were then further evaluated through a group ranking and prioritization process conducted by SEDA-COG staff for each county. The 19 chosen valuation factors were not as objectively quantifiable as the assessment factors; although we gave each factor a rating scale similar to that used with the assessment factors, these numbers were subjectively determined by stakeholders and were largely based upon individual interpretation. In addition, we gave each evaluation factor a weight for relative importance by stakeholders. We facilitated this weighting and compilation of final evaluation ratings and rankings using the Decision Lens stakeholder collaboration software tool, which provided 3-12
35 automated totals resulting in final rankings. Each of the evaluation factors is described below, followed by a table with the assessment rating scale used for each factor and which factors were used for each of the three counties. Extensions that would serve multiple clusters and/or property types. Natural gas distribution companies have traditionally extended new service to anchor customers such as large manufacturing plants or commercial sites, or to new, large residential subdivisions. Serving existing residential areas or mixed-use land uses has traditionally not been a priority. Cost efficiencies, however, may be realized through combining multiple cluster areas or types of users and/or areas to be served. The TIAs were accordingly evaluated using this factor. Likelihood of customer conversions number of potential customers. Conversion of residential customers (especially) to natural gas from other forms of energy may involve more costs than fees assessed by the gas service provider. Conversion of existing appliances (furnaces, water heaters, stoves, etc.) may be required as well. There are government-supported funding and grant programs designed to assist in these conversions, and rules of thumb to estimate levels of customer conversions based upon various economic factors. These factors were considered in evaluating potential TIAs. Planned/potential development in area. The potential for providing new natural gas access to an area may depend upon the level of existing development as well as planned or proposed development. This may be quite relevant, for example, in the case of proposed residential subdivisions and filling in of industrial parks. Decisions as to the suitability of providing new service should account for these factors. Extension cost per mile. NGDCs often initially approach significant potential gas line extensions by estimating ballpark costs on a per mile basis. However, many factors can influence costs for performing this work, including the amount of properties that may need to be crossed, existing rights-of-way that can be utilized (i.e., roads, railroads), sensitive environmental areas, sizes of pipe required, and additional peripheral infrastructure needed (compressor stations, etc.). Costs per mile may vary significantly as a result. These conditions were taken into account during the evaluation process. Funding options/potential commitments stakeholders, grants, etc. Costs of providing new gas service to an area or customer may be able to be shared through a combination of fees, contributions, loans, and /or grant funding. Each TIA has different characteristics for potential funding options. While not all potential commitments or avenues could be known at the time of analysis, some possibilities were considered and included as input to this factor. Possibilities for phasing proposed extensions. Phasing or sequencing segments of a proposed extension is another strategy for implementation, particularly if costs are expected to be significant. It may be possible to build an extension in sections to correspond to available funding or to phase with grant availability and schedules. The phasing also may correspond to variations in the types of users to be connected (for example, residential vs. commercial). We considered this possibility in individual TIA evaluations. 3-13
36 Capacities and condition of existing pipelines/estimates of needed capacities/reserve capacity of the existing gas distribution network. Any extension of an existing natural gas distribution or transmission line will be dependent upon the capacity and size of that line. It is possible that connecting a large commercial industrial user may not be possible without significant expansion of an existing pipeline. In that event, limitations of capacities/sizes of lines could prove to be a significant, cost-prohibitive issue to providing that new service, and we included this factor in the evaluation of all TIAs. Location of/potential for using other types of utility lines/row/corridors. The feasibility and cost of locating new underground natural gas distribution lines can be influenced significantly by the number and types of properties to be crossed or traversed. If existing public rights-of-way (highways, rail, water/sewer, communications, etc.) can be utilized for some portion of a proposed gas line extension, costs may be reduced. Individual TIAs were examined in this manner to evaluate relative levels of cost based upon the corridor to be traversed. Risk of ground/row-related disturbances. Similar to the above evaluation factor, we included the relative level of disturbance as an evaluation factor for TIAs. Structures such as bridges located in the proposed extension path can present significant cost barriers, and crossing private property can also result in significant limitations. Feasibility/ desirability of establishing new CNG/LNG fueling stations. Extensions of natural gas lines to unserved or underserved areas may also be desirable if there is a possibility of establishing a compressed natural gas (CNG) or liquefied natural gas (LNG) fueling facility as part of the infrastructure. The presence of vehicle fleets that could utilize CNG or LNG fuels could significantly increase the attractiveness of providing an extension. Such fleets could include those from publicly-owned entities (school buses, transit, refuse haulers, municipal vehicles) as well as private companies (delivery and service vehicles). The TIAs identified were evaluated for this possibility. Potential gas consumption demand. The number of potential customers of a natural gas line extension only partly addresses its attractiveness; one large commercial or industrial user may use the same amount of natural gas as many residential users. Therefore, the types of potential users in a TIA were also evaluated for potential gas consumption. Level of existing natural gas service. In some cases, some properties in identified TIAs (mostly commercial/industrial users) already had gas service, but were limited by pipeline capacities or had interruptible service. For those users, expanded, higher capacity gas service may be desirable, and where relevant we addressed this in the evaluation analysis. Positive economic impacts job creation/retention. One of the major reasons for pursuing extension of natural gas lines via this project is to create and/or retain new jobs in the three candidate counties. Estimating how many jobs might be created or retained through such an extension is a complicated question; for TIA evaluations, we assumed a qualitative approach rather than attempting to specifically quantify the benefits. Some additional factors that were considered include tax benefits, accelerating new development, possibilities of creating public-private partnerships (PPPs), and possible development of new infrastructure (roads, other utilities). Level of community support. TIAs were examined for the possible level of support by the communities to be served by new gas service. Typically, a natural gas distribution company may conduct 3-14
37 community surveys to gauge the level of support for new gas service. While this was not formally done as part of this project, and not all potential support is known at this time in each TIA, decisionmakers and elected officials do possess some knowledge of this factor. We included this information in the evaluation as appropriate. Availability of water/sewer service. Existing or planned water/sewer service in the candidate TIAs was included as an evaluation factor, since those complementary services may support new development and increase the desirability of providing new gas service. Cost recoverability potential. This evaluation factor was included as an indicator for determining how much of the initial installation costs could potentially be recovered from TIA customers through fees and other mechanisms. It is desirable that at least a portion of those costs be recouped and used for providing new gas service to additional areas. It should be noted that the applicability of this approach is dependent upon what type of administrative entity and structure is established for providing and managing new infrastructure. Project diversity. This factor is different from the first evaluation factor ( Extensions that would serve multiple clusters and/or property types ) through consideration of the overall types of TIAs for each county. To explain further, it was not the intention of SEDA-COG to identify similar TIA types within each county, i.e., all residential or all commercial customers. SEDA-COG wished to present a final list of candidate TIAs for each county that provide a mix of types of users and customers. We addressed and considered this factor where appropriate for each county in the evaluations. Potential for virtual pipeline operations. The relatively new concept of virtual pipelines may offer a solution for establishing natural gas availability where traditional hardline extensions are not feasible, or for upgrading capacities if limited service exists. A few companies are establishing this type of service, whereby compressed natural gas is delivered to a user via truck, the gas is decompressed, and fed to a power system via a short pipeline. These systems are primarily designed for single, large industrial or commercial users, although linking a small network of users and even residential customers is possible. Environmental flag factors/ ecologically sensitive areas. Any extension of existing natural gas distribution/service lines should be located to minimize negative impacts to the environmental and cultural landscape, both during the construction phase and afterward. The process should be modeled in a similar manner to that of federally-mandated corridor evaluations typically performed for large-scale pipeline projects. In these assessments, a set of environmental and cultural factors are examined and evaluated with respect to potential effects of siting such a feature. These processes typically include rating and/or weighting criteria that help to quantitatively assess and rank the suitability or level of impacts of a proposed project, and of potential alternatives. There are a number of good examples and automated tools in use for these types of evaluations. As an example, although we did not formally utilize the PennDOT Linking Planning and NEPA (LPN) process for this project, LPN criteria were provided to stakeholders as background. Often, these tools will include the flexibility to select appropriate factors and assign rating weights according to specific situations. 3-15
38 Table 3-2: RGUI Evaluation Rating Factors and Weights Evaluation Factor Rating Scale Description Extensions that would serve multiple clusters and/or property types Likelihood of customer conversions number of potential customers Planned/potential development in area Extension cost per mile Funding options/potential commitments stakeholders, grants, etc. 10 = Many different property types, multiple clusters can be served 7 = A few different property types, multiple clusters can be served 5 = A few different property types, a few clusters can be served 3 = A few different property types, single cluster can be served 2 = A few different property types, or a few clusters can be served (but not both) 1 = Single property type, single cluster can be served 10 = High number of likely customers 5 = Medium number of likely customers 1 = Low number of likely customers 10 = High potential for further development 5 = Medium potential for further development 1 = Low potential for further development 10 = Low cost per mile 5 = Medium cost per mile 1 = High cost per mile 10 = High potential for stakeholder funding commitments/ amounts 5 = Medium potential for stakeholder funding commitments/ amounts 1 = Low potential for stakeholder funding commitments/amounts Cost efficiencies may be realized through combining multiple types of users and/or areas to be served. Could be based upon new or existing surveys/ percentages. Potential to promote and stimulate future development of available land and/or guide or support existing planned development. Was coordinated with natural gas distribution companies to get ballpark cost estimates for each candidate site. Various mechanisms for funding extensions were identified and evaluated, depending upon individual TIA situations. 3-16
39 Possibilities for phasing proposed extensions Capacities and condition of existing pipelines/estimates of needed capacities/reserve capacity of the existing gas distribution network Location of/potential for using other types of utility lines/row/corridors Risk of ground/row-related disturbances Feasibility/ desirability of establishing new CNG/LNG fueling stations Potential gas consumption demand Level of existing natural gas service 10 = High potential for phasing proposed extensions 5 = Medium potential for phasing proposed extensions 1 = Low potential for phasing proposed extensions 10 = Likely to have sufficient existing capacities available from existing network 5 = May possibly have existing capacities available from existing network 1 = Unlikely to have existing capacities available from existing network 10 = Good potential for utilizing other ROW 5 = Medium potential for utilizing other ROW 1 = Low potential for utilizing other ROW 10 = Low potential for disturbance 5 = Medium potential for disturbance 1 = High potential for disturbance 10 = High potential for CNG stations 5 = Medium potential for CNG stations 1 = Low potential for CNG stations 10 = High potential demand 5 = Medium potential demand 1 = Low potential demand 10 = No existing service 5 = Existing interruptable/ supplemental service or capacity upgrades needed 1 = Full existing service/ no concerns Phasing may help to justify and enable project implementation. Will determine whether an existing pipeline could be extended or a new, highercapacity one would be required. Based in part upon analysis provided by natural gas distribution companies. Examples: highways, rail, water/sewer, fiber. Potential cost savings may result if existing ROW can be utilized, but may also introduce an additional level of complexity. Example: number and types of properties, ROW that must be crossed, existing structures, bridges, level of private property disturbance/risk of need for exercising eminent domain. Based in part upon location/presence/size of fleet vehicle clusters. Dependent upon number of potential customers and potential volume of use. Will help to recognize existing customers in need of upgraded service in the analysis. 3-17
40 Positive economic impacts job creation/retention Level of community support Availability of water/sewer service Cost recoverability potential Project diversity 10 = High potential positive economic/job creation/ retention impacts 5 = Medium potential positive economic/job creation/retention impacts 1 = Low potential positive economic/job creation/ retention impacts 10 = Strongly supported by surrounding community 5 = Somewhat supported by surrounding community 1 = Not strongly supported by surrounding community 10 = Available 5 = Expected to become available in near term 1 = Not expected to be available in near term 10 = High potential cost recoverability 5 = Medium potential cost recoverability 1 = Low potential cost recoverability 10 = Represents high project diversity 5 = Represents medium project diversity 1 = Represents low project diversity Could use analytical tools to summarize direct effects and secondary impacts. Potentially wide-ranging aspects to this: New job creation/attraction Tax benefits Retention of existing jobs/companies New/accelerated development Public-private partnerships (PPP) Development of new infrastructure (roads, other utilities) May need to conduct surveys. Natural gas distribution companies often perform this task in conjunction with service requests. May have chicken and the egg implications. Cost recoverability potential for investments made in individual line extensions by the SEDA- COG administrative entity, should there be one. Project diversity indicates the level of attractiveness of a project/type to be included as a viable option because it serves a specific user type not otherwise represented adequately in the list of candidate sites. 3-18
41 Potential for virtual pipeline operations Environmental flag factors/ ecologically sensitive areas 10 = High potential for virtual pipeline operations 5 = Medium potential for virtual pipeline operations 1 = Low potential for virtual pipeline operations 10 = No significant environmental effects expected 8 = A few minor environmental effects expected 5 = A few significant environmental effects expected 3 = Several significant environmental effects expected 0 = Major environmental effects expected Virtual pipeline operations could potentially be implemented for a single user or for an interconnected network of multiple users. Analysis using Linking Planning and NEPA (LPN) layers, Pennsylvania Natural Diversity Inventory (PNDI), wetlands, floodplains, steep slopes, geology/soils, endangered species, streams, groundwater aquifers, cultural/historic, hazmat, etc. SEDA-COG utilized Decision Lens software for the evaluation/prioritization process to determine first-cut rankings. Decision Lens is an online prioritization and optimization tool that was employed by each of the three counties to apply a group decision-making consensus process to prioritize and rank the TIAs. In this step, the virtual pipelines evaluation factor was also split out from the 19 evaluation factors and treated as a separate high-level subgroup. In this Virtual Pipelines group, 11 sub-factors were defined, eight of which were retained from the original list of 19 evaluation factors (see Figure 3-4). Three additional sub-factors considered to be specific to potential virtual pipeline operations were defined and added. 3-19

42 Figure 3-4: Virtual Pipelines Evaluation Factors In both analyses, the Decision Lens protocol asked respondents to choose which of the paired factors was most important, and rate the level of importance on a scale of 1 to 9. A rating of 1 indicated equal importance, while 9 denoted extreme importance. The Decision Lens scale is geometric; a rating of 3, for example, indicates that the factor receiving that rating is 3 times more important as compared to the other factor. Counties were given the choice of performing the Decision Lens comparisons individually or in a group collaborative setting. Each of the three counties chose to approach the process differently. Centre County completed the survey as individuals, where each participant made their comparisons separately; Clinton County met as a group and developed a single consensus rating for each comparison; Mifflin County also met as a group but first performed comparisons as individuals, then after discussion negotiated a group rating for each comparison. In each case, the ratings reflected the wishes of each group as to how they wanted the Decision Lens results to be compiled. First, the Decision Lens process allowed SEDA-COG to assign the 19 evaluation factors to a broader, higher-level group of four areas for easier comparisons Support, Context, Constructability, and Usage. 3-20
.")
43 Through this approach, two levels of comparisons were made. Each of the four broad groups was compared as a Level 1 comparison, and then comparisons of the factors assigned to each of those groups were performed as a Level 2 comparison (see Figure 3-5 below). A total of 45 comparisons were made by each respondent in this analysis. This was performed separately for each county for the remaining 18 hardline natural gas extension criteria and for the 11 virtual pipeline criteria shown in Figure 3-4. Figure 3-5: Decision Lens Level 1 and Level 2 Comparisons Hardline Extensions The survey structure was underlain with a set of defined logic relationships for each of the 18 evaluation factors, as in the Level 1 example shown in Figure 3-6 below. 3-21

44 Figure 3-6: Example Decision Lens Factor Comparison Screen The relative weighting of factors differed in the results for each county. Tables 3-3 through 3-8 show the highest-ranked TIAs for each county for hardline extensions and virtual pipelines. 3-22
45 Table 3-3: Decision Lens Rankings for Centre County Targeted Investment Areas - Hardline Extensions Rank Targeted Investment Areas - Centre County - Hardline Extensions Total Evaluation Score 1 Milesburg - I-80/ALT 220 Interchange Carolean Industrial Park Centre Hall - Old Fort - Grange Fair - Hanover Foods Snow Shoe Moshannon Valley Regional Business Park Roanoke-Hastings Roads University Park Airport - Big Hollow Road North side of Philipsburg Toftrees Boalsburg Panorama Village area Pleasant Hills Subdivision Fairfield Subdivision Lower-Upper Coleville Roads Area east of Boalsburg South Philipsburg - Curtis Park Airport Road - Centre Street Willowbrook Subdivision Kaywood I and II Subdivisions - Aspen Heights Subdivision OpeQuon Hill Subd. - Millgate Road Breezewood Drive Sandy Ridge Road - Crandall Drive - Carogin Drive Greenbrier Subdivision Philipsburg - S 9th St Area Brockerhoff Heights
46 Table 3-4: Decision Lens Rankings for Centre County Targeted Investment Areas - Virtual Pipelines Rank Targeted Investment Areas - Centre County - Virtual Pipelines Total Evaluation Score 1 Milesburg - I-80/ALT 220 Interchange Moshannon Valley Regional Business Park Snow Shoe Centre Hall - Old Fort - Grange Fair - Hanover Foods Roanoke-Hastings Roads Carolean Industrial Park Toftrees Lower-Upper Coleville Roads University Park Airport - Big Hollow Road North side of Philipsburg Boalsburg South Philipsburg - Curtis Park Willowbrook Subdivision Kaywood I and II Subdivisions - Aspen Heights Subdivision Fairfield Subdivision Panorama Village area Area east of Boalsburg Airport Road - Centre Street Sandy Ridge Road - Crandall Drive - Carogin Drive Pleasant Hills Subdivision OpeQuon Hill Subd. - Millgate Road Philipsburg - S 9th St Area Greenbrier Subdivision Breezewood Drive Brockerhoff Heights
47 Table 3-5: Decision Lens Rankings for Clinton County Targeted Investment Areas - Hardline Extensions Rank Targeted Investment Areas - Clinton County - Hardline Extensions Total Evaluation Score 1 First Quality Mill Hall Beech Creek - Blanchard - Valley Enterprise Container Nittany Valley - Lamar Township Business Park East Dunnstown-Woodhaven Development-Guardlock Drive Avis Area Nittany Valley - I-80/Exit Area south of Avis I-80/PA 477 Interchange - Area north of Loganton I-80/PA 880 Interchange - Area around Carroll Solvay USA/WSP Chemicals - Castanea Table 3-6: Decision Lens Rankings for Clinton County Targeted Investment Areas Virtual Pipelines Rank Targeted Investment Areas - Clinton County - Virtual Pipelines Total Evaluation Score 1 First Quality Beech Creek - Blanchard - Valley Enterprise Container Nittany Valley - Lamar Township Business Park Mill Hall Nittany Valley - I-80/Exit Area south of Avis East Dunnstown-Woodhaven Development-Guardlock Drive Avis Area T I-80/PA 477 Interchange - Area north of Loganton T I-80/PA 880 Interchange - Area around Carroll Solvay USA/WSP Chemicals - Castanea
48 Table 3-7: Decision Lens Rankings for Mifflin County Targeted Investment Areas - Hardline Extensions Rank Targeted Investment Areas - Mifflin County - Hardline Extensions Total Evaluation Score 1T First Quality T Mifflin County Industrial Park and Surrounding Areas Standard Steel and Area to North US 322/Burnham Interchange Area East of Belleville Pleasant Acres East - Senior and Junior High Schools Area East of US 322/Milroy Interchange Green Ave. Extended - Back Maitland Road Area West of Reedsville - US 322/PA 655 Interchange Pleasant Acres West 0.28 Table 3-8: Decision Lens Rankings for Mifflin County Targeted Investment Areas Virtual Pipelines Rank Targeted Investment Areas - Mifflin County - Virtual Pipelines Total Evaluation Score 1 Mifflin County Industrial Park and Surrounding Areas First Quality Area East of US 322/Milroy Interchange US 322/Burnham Interchange Standard Steel and Area to North Area West of Reedsville - US 322/PA 655 Interchange Area East of Belleville Pleasant Acres East - Senior and Junior High Schools Green Ave. Extended - Back Maitland Road Pleasant Acres West 0.17 These rankings based upon total evaluation scores were derived from the weighted criteria listed in Figures 3-4 and 3-5. Weights were automatically determined separately for each county for hardline extensions and virtual pipeline solutions via the factor-to-factor comparison process shown by the example in Figure 3-6. Following are graphical representations of the results for each county for the Level 1 four factor groups (Constructability, Usage, Context, and Support) (Figures 3-7 and 3-8) and for the relative level of importance of each Level 2 factor (Figures 3-9 and 3-10). (Note: In each of the charts, the relative weighting percentages for each county add up to 100%; these percentages represent the product of how important each criterion is and how important each group is, times the actual score, and the evaluation of how well the area meets the criteria, performed by the stakeholders in each county.) 3-26


49 Figure 3-7: Decision Lens Grouped Evaluation Criteria Weights for Targeted Investment Areas, by County - Hardline Extensions Figure 3-8: Decision Lens Grouped Evaluation Criteria Weights for Targeted Investment Areas, by County Virtual Pipelines 3-27
50 Support Context Usage Constructability Extension Costs Risk of Disturbances Potential for Existing ROW Reserve Capacity Virtual Pipeline Operations Phasing of Extensions Potential Consumption Demand Customer Conversions Serve Multiple Clusters Cost Recovery Sewer/Water Service Potential Development in Area Environmental Flags Project Diversity Existing Gas Service CNG/LNG Fueling stations Community Support Job Creation/Retention Funding Options Figure 3-9: Decision Lens Individual Evaluation Criteria Weights for Targeted Investment Areas, by County - Hardline Extensions 3-28
51 Constructability Support Context Usage Storage and Access Easily converted fuel source Potential Consumption Demand Customer Conversions Multiple clusters/ property types Highway Access Appropriate Zoning Planned/Potential Development Suitability - hardline extension Environmental Flags Suitability for CNG/LNG fueling Positive Economic Impacts - Jobs Level of Community Support Funding Options Figure 3-10: Decision Lens Individual Evaluation Criteria Weights for Targeted Investment Areas, by County Virtual Pipelines Results of the evaluation factors ranking process show noteworthy patterns. First, there are differences between the hardline extension rankings as compared to the virtual pipeline rankings, which would be expected since some TIAs are not as suitable for a virtual pipeline solution. However, the differences in rankings are not substantial. Second, each county showed marked differences in the weights (importance) assigned to each of the four Level 1 criteria groups. Mifflin County s weighting, for example, was much higher on the Constructability group, while Clinton County placed the most emphasis on Usage. Centre County weights were closer overall, with Constructability and Context determined to be most important. The five highest Level 2 rankings overall for hardline extensions were: 1. Serve Multiple Clusters (Clinton County) 2. Funding Options (Clinton County) 3. Potential for Existing ROW (Mifflin County) 4. Extension Costs (Mifflin County) 5. Phasing of Extensions (Mifflin County) The five highest Level 2 rankings overall for virtual pipelines were: 1. Potential Consumption Demand (Clinton County) 3-29
52 2. Storage and Acesss (Mifflin County) 3. Funding Options (Clinton County) 4. Potential Consumption Demand (Centre County) 5. Easily Converted Fuel Source (Mifflin County) Upon completion survey analysis, SEDA-COG met with each county for a final TIA review process. The purpose of these meetings was to select the final, prioritized list of TIAs, with adjustments from the Decision Lens rankings made at the group s discretion. These TIAs, discussed in Section 3.1.3, were further considered for project development, beginning with more detailed estimations of projected usage and infrastructure costs. Results of this ranking process clearly demonstrate that preferences (and differences among those preferences) are likely to exist in local priorities and reasons for extending or expanding natural gas service, and are affected by the type of solution that may be appropriate for any TIA. The Decision Lens portion of the TIA process model was able to recognize and include those preferences and differences through application of a meaningful, automated analysis tool that produced relatively straightforward results. SEDA-COG therefore concludes that the tool could be utilized in the future as part of the targeted investment areas process model with other groups having different preferences Quantification of Potential Consumption Demand The next step was to work with county staff, potential customers in the chosen prioritized TIAs, and gas distribution network operators (UGI and Columbia Gas) to quantify current and potential natural gas consumption demand in those TIAs, including conversion of existing businesses and operations to natural gas, installation of new lines or processes, potential development of vacant parcels, increased residential natural gas service, and potential vehicle fueling use. SEDA-COG determined this information to be important and useful in developing cost estimates for potential projects in the prioritized TIAs. The approach for estimating potential consumption consisted of a multi-stage process. First, TIAs were analyzed with respect to the land use of each specific property parcel. Using CAMA data from each county, properties were classified as residential, business/commercial, industrial, or vacant. Secondly, building square footages for each property were retrieved from CAMA data for non-vacant properties. For residential properties, the CAMA data represent the main residential building only. For other types of properties with buildings, square footages were used, and combined for multiple structures where applicable. Building square footages were then used in conjunction with data from the U.S. Energy Information Administration s 2009 Residential Energy Consumption Survey (RECS) and 2012 Commercial Buildings Energy Consumption Survey (CBECS). (Note: Although the EIA also publishes a Manufacturing Energy Consumption Survey (MECS), this was not used in the evaluation process; larger manufacturers were contacted directly to provide data on energy use.) Data averages from these surveys were used to 3-30
53 estimate potential natural gas use for all energy needs by square footage for each type of use. Tables 3-9 and 3-10 below show these averages for residential and commercial buildings. Table 3-9: Residential Fuel Consumption Residential fuel consumption Million Btu per household Natural Gas Square Footage Consumption Fewer than to ,000 to 1, ,500 to 1, ,000 to 2, ,500 to 2, ,000 to 3, ,500 to 3, ,000 or More Source: Adapted from 2009 U.S. Energy Information Administration's Residential Energy Consumption Survey, Table CE2.2, see Table 3-10: Commercial Fuel Consumption Commercial fuel consumption (non-mall buildings) - Million Btu per square foot (cubic feet) Square Footage Natural Gas Consumption 0 to 5, ,001 to 10, ,001 to 25, ,001 to 50, ,001 to 100, ,001 to 200, ,001 to 500, Over 500, Source: Adapted from 2003 U.S. Energy Information Administration's Commercial Buildings Energy Consumption Survey, Table C24, see Finally, it was important in the usage estimation process to recognize that not all potential residential customers can be expected to convert to natural gas if offered the opportunity, usually because of perceived limitations related to return on investment. Conversions to natural gas often require investment in new appliances, such as water heaters, gas stoves, and washers and dryers, to take full 3-31
54 advantage of long-term savings. We therefore applied a ballpark percentage conversion rate to residential properties within each TIA. No standard conversion rate applies in all geographic areas or types of residential areas, and participation rates can also vary based on up-front payback periods for conversion. Several surveys and studies have examined expected residential conversion rates. 7 For this study, SEDA-COG elected to base our estimates on the 2013 report, Analysis of Potential Demand for the Extension and Expansion of Natural Gas Distribution Infrastructure in Pennsylvania: A Report in Response to Senate Resolution 29, prepared by the Center for Rural Pennsylvania (a legislative agency of the Pennsylvania General Assembly). In this report, for a typical household facing up-front costs of $6,000 and annual savings of $1,000, a model developed by the authors predicts that percent of households in the North Central part of Pennsylvania would connect and convert to natural gas. SEDA- COG therefore used an estimated residential conversion rate of 30% for the three study counties. For larger business/commercial and industrial entities located in each TIA, SEDA-COG conducted a brief telephone survey to collect data on annual amounts and type of energy use, building square footage, and other factors. These numbers were used to generate estimated natural gas use for those properties instead of using the U.S. EIA data. For each Targeted Investment Area, SEDA-COG then compiled and submitted to the local NGDCs an estimate of projected natural gas use to be considered in service feasibility meetings, as discussed in the section below Service Feasibility Upon completion of the demand quantification process, SEDA-COG coordinated with the two natural gas distribution companies (UGI and Columbia) in the three-county study area, virtual pipeline providers, and county governments to identify for each priority Targeted Investment Area the distance to the nearest portion of the existing distribution network along with reserve line capacity, preliminary routing and right of way requirements, and cost estimates for required equipment and construction. UGI and Columbia both have cost economics/feasibility models they use to determine feasibility and expected usage (and therefore potential returns on investment) that were utilized to analyze each chosen TIA. The results of each model run provided solid economic data upon which Columbia Gas and UGI could base decisions on whether it was effective to provide new or expanded service. 7 Some of the most noteworthy studies reviewed include Northern Economics, Natural Gas in the Fairbanks North Star Borough: Results from a Residential Household Survey (2013); Joshua Ray Sherry, Natural Gas Expansion Model (2013); J. Mark Rodger, Expansion of Natural Gas Distribution in Southern Bruce County: The Business Case (2014); and Stanley McMillen and Nandika Prakash, The Economic Impact of Expanding Natural Gas Use in Connecticut (2011). 8 In the original proposal to EDA, SEDA-COG proposed to apply an analytical software tool to summarize direct effects and secondary impacts such as new jobs attracted and tax benefits of service extensions. We determined that no function available in such software can adequately address how to model these types of impacts especially the magnitude of how reduced cost of production increases potential employment and that the project did not develop data to support this analysis. In addition, SEDA-COG had originally proposed to conduct fleet surveys to gauge potential CNG vehicle use; this aspect of the potential project was not pursued as being central to the actual study scope, although it could be pursued in future phases. 3-32
55 UGI and Columbia Gas personnel provided rules of thumb cost estimates for connecting residential users, including customer contributions-in-aid-of-construction (CIAC), and for constructing delivery hardline infrastructure. SEDA-COG utilized these guidelines to produce cost estimates for the priority TIAs Results and General Comments The following sections briefly present an overview of the identified and priority targeted investment areas, with assessment (rating) score matrices and maps, evaluation/prioritization (ranking) scores, and proposed project phases/projected costs maps for selected priority TIAs. Assessment scores for Centre County were higher than those of Clinton and Mifflin Counties largely because the latter two counties did not have data for one or more assessment factors. It should be pointed out that one of the priority TIAs chosen for Clinton County, Beech Creek-Blanchard, extends partially into Centre County. It should be noted that the final selection of priority TIAs was performed by the county stakeholders, not SEDA-COG. The TIA assessment and evaluation processes were designed to introduce a measure of objectivity and accommodate personal preferences in a controlled, collaborative environment. The priority TIAs were chosen with guidance from these results, but there were some additional and subtractions made because of other factors. Some examples/reasons of these changes include: Existing natural gas service availability to some areas Previous discussions with natural gas distribution companies that resulted in unsatisfactory cost considerations Current ongoing discussions with natural gas distribution companies for establishment or expansion of distribution capabilities. Pending plans to expand industrial/commercial facilities, maintain the status quo, or reduce capabilities Suitability of specific grant/loan programs and/or possibilities for local matching funds for a particular TIA Lack of cost-effective prospects for expanding hardline natural gas capacities Proposal of a new TIA because of factors that were not reflected in assessment/evaluation scores. To summarize some of these factors, SEDA-COG prepared an internal suitability analysis matrix chart of the priority TIAs and used it to guide discussions that led to selection of the final, prioritized candidate areas. 3-33
56 Centre County For Centre County, 25 TIAs were identified and ranked using assessment factors. Total assessment scores ranged from 41 (lowest) to 75 (highest). (Note: For all county assessment score tables, roundedoff whole numbers are shown for each factor and the total scores, but the analysis included more detailed precision.) 3-34
57 Table 3-11: Centre County Matrix of Assessment Rating Scores Rank TIA Index Average A1 Prop_Type Average A2 Fuel_Type Average A3 Heat_Sys Average A4 BldSqFt Average A5 IndGrPo Average A6 Sales Average A7 EmplNum Average 1 Carolean Industrial Park Airport Road - Centre Street Pleasant Hills Subdivision University Park Airport - Big Hollow Road Lower-Upper Coleville Roads North side of Philipsburg Boalsburg South Philipsburg - Curtis Park Philipsburg - S 9th St Area Panorama Village area Area east of Boalsburg Fairfield Subdivision Roanoke-Hastings Roads Moshannon Valley Regional Business Park Breezewood Drive Brockerhoff Heights OpeQuon Hill Subd. - Millgate Road Willowbrook Subdivision Kaywood I and II Subdivisions - Aspen Heights Subdivision Milesburg - I-80/ALT 220 Interchange Sandy Ridge Road - Crandall Drive - Carogin Drive Toftrees Snow Shoe Greenbrier Subdivision Centre Hall - Old Fort - Grange Fair - Hanover Foods A8 Ngtarif Average A9 Growth Average A10 TranCo Average A11 Ngarea Average A12 NGline Average A13 Exits Average 3-35
58 Centre County Evaluation/Prioritization Rankings Hardline Extensions Results of the Decision Lens rankings of TIAs for the evaluation factors were split into two parts, as earlier described in Section hardline extensions and virtual pipelines. The following charts in this and the following section show the assessment ratings for each area, followed by the evaluation rankings, and a set of values that averages the two. Results are grouped into Top 3, Top 5, and Top 10 lists. For Centre and Mifflin Counties, the yellow and green highlighting identifies TIAs that show up multiple times on the lists. 3-36
59 Table 3-12: Centre County Targeted Investment Area Evaluation/Prioritization Ratings Comparison of Top 10 TIAs Assessment Rank (GIS) TIA Evaluation Rank (Decision Lens) TIA Combined Rank TIA Milesburg - I-80/ALT 220 Interchange 1 Carolean Industrial Park 1 Carolean Industrial Park 1 Airport Road - Centre 2 Street 2 Carolean Industrial Park 2 Milesburg - I-80/ALT 220 Interchange Pleasant Hills Centre Hall - Old Fort - Moshannon Valley Regional Business 2 Subdivision 3 Grange Fair - Hanover Foods 3 Park University Park Airport - 4 Big Hollow Road 4 Snow Shoe 4 Pleasant Hills Subdivision Lower-Upper Coleville Moshannon Valley Regional University Park Airport - Big Hollow 5 Roads 5 Business Park 5 Road 6 North side of 6 Roanoke-Hastings Roads 6 Roanoke-Hastings Roads University Park Airport - Big 6 Boalsburg 7 Hollow Road 7 Snow Shoe 8 Philipsburg - S 9th St 8 North side of Philipsburg 8 North side of Philipsburg 8 Panorama Village area 9 Toftreees 9 Centre Hall - Old Fort - Grange Fair 8 Area east of Boalsburg 10 Boalsburg 10 Boalsburg 8 Roanoke-Hastings Assessment Rank (GIS) TIA TIAs shown in green are in all three top 10 lists TIAs shown in yellow are on two of the three top 10 lists Evaluation Rank (Decision Lens) TIA Combined Rank TIA Milesburg - I-80/ALT 220 Interchange 1 Carolean Industrial Park 1 Carolean Industrial Park 1 Airport Road - Centre 2 Street 2 Carolean Industrial Park 2 Milesburg - I-80/ALT 220 Interchange Pleasant Hills Centre Hall - Old Fort - Moshannon Valley Regional Business 2 Subdivision 3 Grange Fair - Hanover Foods 3 Park University Park Airport - 4 Big Hollow Road 4 Snow Shoe 4 Pleasant Hills Subdivision Lower-Upper Coleville Moshannon Valley Regional University Park Airport - Big Hollow 5 Roads 5 Business Park 5 Road Assessment Rank (GIS) TIA TIAs shown in green are in all three top 5 lists TIAs shown in yellow are on two of the three top 5 lists d Evaluation Rank (Decision Lens) TIA Combined Rank TIA Milesburg - I-80/ALT 220 Interchange 1 Carolean Industrial Park 1 Carolean Industrial Park 1 Airport Road - Centre 2 Street 2 Carolean Industrial Park 2 Milesburg - I-80/ALT 220 Interchange Pleasant Hills Centre Hall - Old Fort - Moshannon Valley Regional Business 2 Subdivision 3 Grange Fair - Hanover Foods 3 Park TIAs shown in green are in all three top 3 lists TIAs shown in yellow are on two of the three top 3 lists Comparison of Top 5 TIAs Comparison of Top 3 TIAs 3-37
60 Assessment Rank (GIS) Centre County Evaluation/Prioritization Rankings Virtual Pipelines Table 3-13: Centre County Targeted Investment Area Evaluation/Prioritization Ratings Virtual Pipelines Evaluation Rank (Decision Lens) Combined TIA TIA Rank TIA Milesburg - I-80/ALT Carolean Industrial Park 1 Interchange 1 Milesburg - I-80/ALT 220 Interchange Moshannon Valley Regional Moshannon Valley Regional Business 2 Airport Road - Centre Street 2 Business Park 2 Park 2 Pleasant Hills Subdivision 3 Snow Shoe 3 Carolean Industrial Park University Park Airport - Big Centre Hall - Old Fort - 4 Hollow Road 4 Grange Fair - Hanover Foods 4 Snow Shoe 5 Lower-Upper Coleville 5 Roanoke-Hastings Roads 5 Roanoke-Hastings Roads 6 North side of Philipsburg 6 Carolean Industrial Park 6 University Park Airport - Big Hollow Centre Hall - Old Fort - Grange Fair - 6 Boalsburg 7 Toftrees 7 Hanover Foods 8 Philipsburg - S 9th St Area 8 University Park Airport - Big Hollow Road 8 Toftrees 8 Panorama Village area 9 North side of Philipsburg 9 North side of Philipsburg 8 Area east of Boalsburg 10 Lower-Upper Coleville Roads 10 Lower-Upper Coleville Roads 8 Roanoke-Hastings Roads Assessment Rank (GIS) TIA TIAs shown in green are in all three top 10 lists TIAs shown in yellow are on two of the three top 10 lists Evaluation Rank (Decision Lens) TIA Combined Rank TIA 1 Carolean Industrial Park 1 Milesburg - I-80/ALT 220 Interchange 1 Milesburg - I-80/ALT 220 Interchange 2 Airport Road - Centre Street 2 Moshannon Valley Regional Business Park 2 Moshannon Valley Regional Business Park 2 Pleasant Hills Subdivision 3 Snow Shoe 3 Carolean Industrial Park 4 University Park Airport - Big Hollow Road 4 Centre Hall - Old Fort - Grange Fair - Hanover Foods 4 Roanoke-Hastings Roads 5 Lower-Upper Coleville 5 Roanoke-Hastings Roads 5 Snow Shoe Assessment Rank (GIS) TIA TIAs shown in green are in all three top 5 lists TIAs shown in yellow are on two of the three top 5 lists Evaluation Rank (Decision Lens) TIA Combined Rank TIA 1 Carolean Industrial Park 1 Milesburg - I-80/ALT 220 Interchange 1 Milesburg - I-80/ALT 220 Interchange 2 Airport Road - Centre Street 2 Moshannon Valley Regional Business Park 2 Moshannon Valley Regional Business Park 2 Pleasant Hills Subdivision 3 Snow Shoe 3 Carolean Industrial Park TIAs shown in green are in all three top 3 lists TIAs shown in yellow are on two of the three top 3 lists Comparison of Top 10 Virtual Pipeline TIAs Comparison of Top 5 Virtual Pipeline TIAs Comparison of Top 3 Virtual Pipeline TIAs 3-38
61 Centre County Priority TIA Analysis Five priority TIAs were initially chosen by Centre County for further consideration for potential project development. They included: Carolean Industrial Park Centre Hall - Old Fort - Grange Fair - Hanover Foods Milesburg - I-80/ALT 220 Interchange Moshannon Valley Regional Business Park Snow Shoe Detailed TIA maps with classified and color-coded assessment index values for each property parcel are shown in the figures below. 3-39

62 Figure 3-11: Carolean Industrial Park Targeted Investment Area: Assessment Ratings 3-40

63 Figure 3-12: Centre Hall-Old Fort-Grange Fair-Hanover Foods Targeted Investment Area: Assessment Ratings 3-41

64 Figure 3-13: Milesburg-I-80/Alt. US 220 Interchange Targeted Investment Area: Assessment Ratings 3-42

65 Figure 3-14: Moshannon Valley Business Park Targeted Investment Area: Assessment Ratings 3-43

66 Figure 3-15: Snow Shoe Targeted Investment Area: Assessment Ratings 3-44
67 After further consideration of implementation feasibility and other factors as discussed with Centre County stakeholders, we reduced the Centre County priority TIA list to three: Centre Hall - Old Fort - Grange Fair - Hanover Foods Milesburg - I-80/ALT 220 Interchange Snow Shoe For these three TIAs, we performed detailed cost and phasing analysis, based in part on the demand analysis step as well as cost guidelines provided by UGI and Columbia Gas. For each TIA, we determined that a phased development approach may make economic sense based upon cost and available funding sources. The following maps and tables show proposed project development phases and projected costs for natural gas extensions (hardline and/or virtual pipeline) for these three Centre County priority TIAs. 3-45

68 Figure 3-16: Centre Hall-Old-Fort-Grange Fair-Hanover Foods Targeted Investment Area: Proposed Project Phases and Projected Costs Columbia Gas Solution 3-46
69 Table 3-14: Centre Hall-Old-Fort-Grange Fair-Hanover Foods Targeted Investment Area: Proposed Project Phases and Projected Costs Columbia Gas Solution Centre Hall-Grange Fair-Hanover Foods TIA Projected Costs for Natural Gas - Columbia Gas Solution NUMBER OF NON-VACANT PARCELS USER COST (50% OF PROPERTIES)** PHASE TOTALS PHASE DELIVERY LINE COST* 1 30 $2,800,000 $37,500 $2,837, $906,750 $146,250 $1,053, $4,046,125 $505,000 $4,551, $2,112,625 $243,750 $2,356,375 TOTALS 746 $9,865,500 $932,500 $10,798,

70 Figure 3-17: Centre Hall-Old-Fort-Grange Fair-Hanover Foods Targeted Investment Area: Proposed Project Phases and Projected Costs Virtual Pipeline Solution 3-48
71 Table 3-15: Centre Hall-Old-Fort-Grange Fair-Hanover Foods Targeted Investment Area: Proposed Project Phases and Projected Costs Virtual Pipeline Solution Centre Hall-Grange Fair-Hanover Foods TIA Projected Costs for Natural Gas - Virtual Pipeline Solution NUMBER OF NON-VACANT PARCELS VIRTUAL PIPELINE PAD COST USER COST (50% OF PROPERTIES)** PHASE TOTALS PHASE DELIVERY LINE COST* $400,000 $1,635,125 $245,000 $2,280, $0 $2,833,375 $368,750 $3,202, $0 $1,239,125 $82,500 $1,321, $0 $2,081,375 $232,500 $2,313,875 TOTALS 743 $400,000 $7,789,000 $928,750 $9,117,

72 Figure 3-18: Milesburg-I-80 Targeted Investment Area: Proposed Project Phases and Projected Costs 3-50
73 Table 3-16: Milesburg-I-80 Targeted Investment Area: Proposed Project Phases and Projected Costs Milesburg-I-80 Interchange TIA Projected Costs for Natural Gas NUMBER OF NON-VACANT PARCELS USER COST (50% OF PROPERTIES)** PHASE TOTALS PHASE DELIVERY LINE COST* 1 11 $2,500,000 $13,750 $2,513, $1,665,125 $196,250 $1,861, $2,245,875 $147,500 $2,393, $2,647,625 $383,750 $3,031, $1,299,000 $26,250 $1,325,250 TOTALS 614 $10,357,625 $767,500 $11,125,

74 Figure 3-19: Snow Shoe Targeted Investment Area: Proposed Project Phases and Projected Costs 3-52
75 Table 3-17: Snow Shoe Targeted Investment Area: Proposed Project Phases and Projected Costs Snow Shoe TIA Projected Costs for Natural Gas NUMBER OF NON-VACANT PARCELS USER COST (50% OF PROPERTIES)** PHASE TOTALS PHASE DELIVERY LINE COST* 1 35 $1,000,000 $43,750 $1,043, $3,420,000 $345,000 $3,765, $897,125 $72,500 $969,625 TOTALS 369 $5,317,125 $461,250 $5,778,
76 Clinton County For Clinton County, 11 TIAs were identified and ranked using assessment factors. Total assessment scores ranged from 34 (lowest) to 65 (highest). 3-54
77 Table 3-18: Clinton County Matrix of Assessment Rating Scores Rank TIA Index Average A1 Prop_Type Average A2 Fuel_Type Average A3 Heat_Sys Average A4 BldSqFt Average A5 IndGrPo Average A6 Sales Average A7 EmplNum Average 1 First Quality - Castanea East Dunnstown-Woodhaven Development-Guardlock Dr Hogan Blvd. - Mill Hall Avis Area Solvay USA/WSP Chemicals Beech Creek - Blanchard - Valley Enterprise Container Area south of Avis Nittany Valley - I-80/Exit I-80/PA 477 Interchange - Area north of Loganton Nittany Valley - Lamar Township Business Park I-80/PA 880 Interchange - Area around Carroll A8 Ngtarif Average A9 Growth Average A10 TranCo Average A11 Ngarea Average A12 NGline Average A13 Exits Average 3-55
78 Clinton County Evaluation/Prioritization Rankings Hardline Extensions Table 3-19: Clinton County Targeted Investment Area Evaluation/Prioritization Ratings Comparison of Top TIAs Assessment Rank (GIS) TIA Evaluation Rank (Decision Lens) TIA Combined Rank 1 First Quality 1 First Quality 1 First Quality 2 East Dunnstown- Woodhaven Development- Guardlock Drive 2 Mill Hall 2 Mill Hall 3 Mill Hall 3 Beech Creek - Blanchard - Valley Enterprise Container 3 Beech Creek - Blanchard - Valley Enterprise Container 4 Avis Area 4 Nittany Valley - Lamar Township Business Park 4 East Dunnstown-Woodhaven Development-Guardlock Drive 5 Beech Creek - Blanchard - Valley Enterprise Container 5 East Dunnstown-Woodhaven Development-Guardlock Drive 5 Avis Area 5 Solvay USA/WSP Chemicals - Castanea 6 Avis Area 6 Nittany Valley - Lamar Township Business Park Clinton County Evaluation/Prioritization Rankings Virtual Pipelines Table 3-20: Clinton County Targeted Investment Area Evaluation/Prioritization Ratings Virtual Pipelines Comparison of Top TIAs for Virtual Pipeline Extensions Assessment Rank (GIS) TIA Evaluation Rank (Decision Lens) TIA Combined Rank 1 First Quality 1 First Quality 1 First Quality 2 East Dunnstown- Woodhaven Development- Guardlock Drive 2 Beech Creek - Blanchard - Valley Enterprise Container 2 Beech Creek - Blanchard - Valley Enterprise Container 3 Mill Hall 3 Nittany Valley - Lamar Township Business Park 3 Mill Hall 4 Avis Area 4 Mill Hall 4 Nittany Valley - Lamar Township Business Park 5 Beech Creek - Blanchard - Valley Enterprise Container 5 Nittany Valley - I-80/Exit East Dunnstown-Woodhaven Development-Guardlock Drive 5 Solvay USA/WSP Chemicals - Castanea 6 Area south of Avis 6 Avis Area 3-56
79 Clinton County Priority TIA Analysis Two priority TIAs were chosen by Clinton County for further consideration for potential project development. They included: Beech Creek Blanchard Valley Enterprise Container Mill Hall Hogan Blvd. Detailed TIA maps with classified and color-coded assessment index values for each property parcel are shown in the figures below. 3-57

80 Figure 3-20: Beech Creek-Blanchard-Valley Enterprise Container Targeted Investment Area: Assessment Ratings 3-58

81 Figure 3-21: Mill Hall-Hogan Blvd. Targeted Investment Area: Assessment Ratings 3-59
82 For these two TIAs, we performed detailed cost and phasing analysis, based in part on the demand analysis step as well as cost guidelines provided by UGI and Columbia Gas. For both TIAs, we determined that a phased development approach may make economic sense based upon cost and available funding sources. The following maps and tables show proposed project development phases and projected costs for hardline natural gas extensions for these two Clinton County priority TIAs. 3-60

83 Figure 3-22: Beech Creek-Blanchard Targeted Investment Area: Proposed Project Phases and Projected Costs 3-61
84 Table 3-21: Beech Creek-Blanchard Targeted Investment Area: Proposed Project Phases and Projected Costs Blanchard-Beech Creek TIA Projected Costs for Natural Gas PHASE NUMBER OF NON-VACANT PARCELS USER COST (50% OF PROPERTIES) PHASE TOTALS DELIVERY LINE COST 1 74 $1,659,625 $111,000 $1,770, $1,160,000 $198,000 $1,358, $1,272,125 $174,000 $1,446, $3,313,750 $384,000 $3,697,750 GRAND TOTALS 578 $7,405,500 $867,000 $8,272,500 Note: Phases 1, 2, and 3 are Beech Creek; Phase 4 is Blanchard 3-62

85 Figure 3-23: Mill Hall-Hogan Blvd. Targeted Investment Area: Proposed Project Phases and Projected Costs 3-63
86 Table 3-22: Mill Hall-Hogan Blvd. Targeted Investment Area: Proposed Project Phases and Projected Costs Mill Hall - Hogan Blvd. TIA Projected Costs for Natural Gas PHASE NUMBER OF NON-VACANT PARCELS USER COST (50% OF PROPERTIES) PHASE TOTALS DELIVERY LINE COST 1 62 $876,000 $93,000 $969, $575,250 $258,000 $833, $371,125 $147,000 $518, $2,073,500 $366,000 $2,439, $1,219,000 $208,500 $1,427,500 GRAND TOTALS 715 $5,114,875 $1,072,500 $6,187,
87 Mifflin County For Mifflin County, 10 TIAs were identified and ranked using assessment factors. Total assessment scores ranged from 29 (lowest) to 54 (highest). 3-65
88 Mifflin County Matrix of Assessment Rating Scores Table 3-23: Mifflin County Matrix of Assessment Rating Scores Rank TIA Index Average A1 Prop_Typ e Average A2 Fuel_Type Average A3 Heat_Sys Average A4 BldSqFt Average A5 IndGrPo Average A6 Sales Average A7 EmplNum Average 1 First Quality Area East of Belleville Pleasant Acres East - Senior and Junior High Schools Pleasant Acres West Standard Steel and Area to North Mifflin County Industrial Park and Surrounding Areas Area West of Reedsville-US 322/PA 655 Interchange US 322-Burnham Interchange Area East of US 322-Milroy Interchange Green Ave. Extended - Back Maitland Road A8 Ngtarif Average A9 Growth Average A10 TranCo Average A11 Ngarea Average A12 NGline Average A13 Exits Average 3-66
89 Mifflin County Evaluation/Prioritization Rankings Hardline Extensions Table 3-24: Mifflin County Targeted Investment Area Evaluation/Prioritization Ratings Comparison of Top 10 TIAs Assessment Rank (GIS) Area_name Evaluation Rank (Decision Lens) Area_name Combined Rank Area_name 1 First Quality 1 First Quality 1 First Quality 2 Area East of Belleville 2 Mifflin County Industrial Park and Surrounding Areas 2 Mifflin County Industrial Park and Surrounding Areas 3 Pleasant Acres East - Senior and Junior High Schools 3 Standard Steel and Area to North 3 Standard Steel and Area to North 4 Pleasant Acres West 4 US 322/Burnham Interchange 4 Area East of Belleville 5 Standard Steel and Area to North 5 Area East of Belleville 5 Pleasant Acres East - Senior and Junior High Schools 6 Mifflin County Industrial Park and Surrounding Areas 6 Pleasant Acres East - Senior and Junior High Schools 6 US 322/Burnham Interchange 7 Area West of Reedsville - US 322/PA 655 Interchange 7 Area East of US 322/Milroy Interchange 7 Area East of US 322/Milroy Interchange 8 US 322/Burnham Interchange 8 Green Ave. Extended - Back Maitland Road 8 Area West of Reedsville - US 322/PA 655 Interchange 9 Area East of US 322/Milroy Interchange 9 Area West of Reedsville - US 322/PA 655 Interchange 9 Green Ave. Extended - Back Maitland Road 10 Green Ave. Extended - Back Maitland Road 10 Pleasant Acres West 10 Pleasant Acres West All TIAs included in all three lists Comparison of Top 5 TIAs Assessment Rank (GIS) Area_name Evaluation Rank (Decision Lens) Area_name Combined Rank Area_name 1 First Quality 1 First Quality 1 First Quality 2 Area East of Belleville 2 Mifflin County Industrial Park and Surrounding Areas 2 Mifflin County Industrial Park and Surrounding Areas 3 Pleasant Acres East - Senior and Junior High Schools 3 Standard Steel and Area to North 3 Standard Steel and Area to North 4 Pleasant Acres West 4 US 322/Burnham Interchange 4 Area East of Belleville 5 Standard Steel and Area to North 5 Area East of Belleville 5 Pleasant Acres East - Senior and Junior High Schools TIAs shown in green are in all three top 5 lists TIAs shown in yellow are on two of the three top 5 lists Assessment Rank (GIS) Area_name Evaluation Rank (Decision Lens) Area_name Combined Rank Area_name 1 First Quality 1 First Quality 1 First Quality 2 Area East of Belleville 2 Mifflin County Industrial Park and Surrounding Areas 2 Mifflin County Industrial Park and Surrounding Areas 3 Pleasant Acres East - Senior and Junior High Schools 3 Standard Steel and Area to North 3 Standard Steel and Area to North TIAs shown in green are in all three top 3 lists TIAs shown in yellow are on two of the three top 3 lists Comparison of Top 3 TIAs 3-67
90 Mifflin County Evaluation/Prioritization Rankings Virtual Pipelines Table 3-25: Mifflin County Targeted Investment Area Evaluation/Prioritization Ratings Virtual Pipelines Assessment Rank (GIS) Evaluation Rank (Decision Lens) Combined Area_name Area_name Rank Area_name Mifflin County Industrial Park 1 First Quality 1 and Surrounding Areas 1 First Quality Mifflin County Industrial Park 2 Area East of Belleville 2 First Quality 2 and Surrounding Areas Pleasant Acres East - Senior Area East of US 322/Milroy Area East of US 322/Milroy 3 and Junior High Schools 3 Interchange 3 Interchange Standard Steel and Area to 4 Pleasant Acres West 4 US 322/Burnham Interchange 4 North Standard Steel and Area to Standard Steel and Area to 5 North 5 North 5 US 322/Burnham Interchange Mifflin County Industrial Park Area West of Reedsville - US 6 and Surrounding Areas 6 322/PA 655 Interchange 6 Area East of Belleville Area West of Reedsville - US Area West of Reedsville - US 7 322/PA 655 Interchange 7 Area East of Belleville 7 322/PA 655 Interchange Pleasant Acres East - Senior Pleasant Acres East - Senior 8 US 322/Burnham Interchange 8 and Junior High Schools 8 and Junior High Schools Area East of US 322/Milroy Green Ave. Extended - Back Green Ave. Extended - Back 9 Interchange 9 Maitland Road 9 Maitland Road 10 Comparison of Top 10 TIA for Virtual Pipelines Green Ave. Extended - Back Maitland Road 10 Pleasant Acres West 10 Pleasant Acres West All TIAs included in all three lists Comparison of Top 5 TIAs Assessment Rank (GIS) Evaluation Rank (Decision Lens) Combined Area_name Area_name Rank Area_name Mifflin County Industrial Park 1 First Quality 1 and Surrounding Areas 1 First Quality Mifflin County Industrial Park 2 Area East of Belleville 2 First Quality 2 and Surrounding Areas Pleasant Acres East - Senior Area East of US 322/Milroy Area East of US 322/Milroy 3 and Junior High Schools 3 Interchange 3 Interchange Standard Steel and Area to 4 Pleasant Acres West 4 US 322/Burnham Interchange 4 North 5 Assessment Rank (GIS) Standard Steel and Area to North 5 TIAs shown in green are in all three top 5 lists TIAs shown in yellow are on two of the three top 5 lists Evaluation Rank (Decision Lens) Standard Steel and Area to North 5 US 322/Burnham Interchange Combined Area_name Area_name Rank Area_name Mifflin County Industrial Park 1 First Quality 1 and Surrounding Areas 1 First Quality Mifflin County Industrial Park 2 Area East of Belleville 2 First Quality 2 and Surrounding Areas Pleasant Acres East - Senior Area East of US 322/Milroy Area East of US 322/Milroy 3 and Junior High Schools 3 Interchange 3 Interchange TIAs shown in green are in all three top 3 lists TIAs shown in yellow are on two of the three top 3 lists Comparison of Top 3 TIAs 3-68
91 Mifflin County Priority TIA Analysis Three priority TIAs were originally chosen by Mifflin County for further consideration for potential project development. They included: Mifflin County Industrial Park and Surrounding Areas Standard Steel and Area to North US 322/Burnham Interchange Detailed TIA maps with classified and color-coded assessment index values for each property parcel are shown in the figures below. 3-69

92 Figure 3-24: Mifflin County Industrial Park and Surrounding Areas Targeted Investment Area: Assessment Ratings 3-70

93 Figure 3-25: Standard Steel and Area to North Targeted Investment Area: Assessment Ratings 3-71

94 Figure 3-26: US 322-Burnham Interchange Targeted Investment Area: Assessment Ratings 3-72
95 After further discussions with Mifflin County stakeholders, we updated and revised the final list of priority TIAs because of changes in current conditions and perceived feasibility for projects. These priority TIAs included: Area East of US 322 Milroy Interchange Pleasant Acres East Freedom Avenue Area For these final priority TIAs, we performed detailed cost and phasing analysis, based in part on the demand analysis step as well as cost guidelines provided by UGI and Columbia Gas. For one of the TIAs, we determined that a phased development approach may make economic sense based upon cost and available funding sources. The following maps and tables show proposed project development phases and projected costs for natural gas extensions (hardline and/or virtual pipeline) for these three Mifflin County priority TIAs. 3-73

96 Figure 3-27: Area East of US 322-Milroy Interchange Targeted Investment Area: Proposed Project Phases and Projected Costs 3-74
97 Table 3-26: Area East of US 322-Milroy Interchange Targeted Investment Area: Proposed Project Phases and Projected Costs US 322-Milroy Interchange TIA Projected Costs for Natural Gas PHASE NUMBER OF NON-VACANT PARCELS VIRTUAL PIPELINE PAD COST USER COST (50% OF PROPERTIES) PHASE TOTALS DELIVERY LINE COST 1 63 $400,000 $2,075,383 $94,500 $2,569, $0 $1,789,055 $330,000 $2,119, $0 $2,167,913 $328,500 $2,496, $0 $1,115,891 $198,000 $1,313, $0 $838,100 $145,500 $983,600 GRAND TOTALS 731 $400,000 $7,986,342 $1,096,500 $9,482,

98 Figure 3-28: Pleasant Acres East Targeted Investment Area: Proposed Project Phases and Projected Costs 3-76
99 Table 3-27: Pleasant Acres East Targeted Investment Area: Proposed Project Phases and Projected Costs Pleasant Acres East TIA Projected Costs for Natural Gas NUMBER OF NON-VACANT PARCELS DELIVERY LINE COST USER COST (50% OF PROPERTIES) PHASE TOTALS 232 $2,007,084 $348,000 $2,355,

100 Figure 3-29: Freedom Avenue Targeted Investment Area: Proposed Project Phases and Projected Costs 3-78
101 Table 3-28: Freedom Avenue Targeted Investment Area: Proposed Project Phases and Projected Costs Freedom Avenue Area Projected Costs for Natural Gas NUMBER OF NON-VACANT PARCELS DELIVERY LINE COST USER COST (50% OF PROPERTIES) PHASE TOTALS 257 $1,869,889 $385,500 $2,255,
102 3.2. Summary of Targeted Investment Area Assessment and Evaluation Results In summary, the final prioritized set of TIAs and potential natural gas implementation projects reflected some common themes in meeting the goals of the RGUI study. The priority TIAs generally included a mix of one or more small-to-medium-sized industrial, commercial, or institutional entities (or anchors ) along with significant residential areas. This type of area represents typical gap customers that have not been successful in attracting new service from the natural gas distribution companies because their economic cost models do not justify and support such service. Most priority TIAs and projects also would support phasing of new service (as shown in the cost/phasing maps and tables), perhaps even on a block-by-block basis in residential areas. If these types of projects can be facilitated and built through funding support procured by the proposed Nonprofit Cooperative Corporation, the RGUI process model will have assumed a significant role in establishing natural gas service. 3-80
103 4. LEGAL ADVICE Concurrent with the targeted investment area analysis portion of the RGUI project, SEDA-COG sought the expertise of a utility law consultant to conduct research to support establishment of an entity (e.g., authority, cooperative, or other body), to carry out administrative, funding, and oversight responsibilities involved in the extension of natural gas distribution lines in the three-county project region. The selected consultant, Mr. Anthony Adonizio, first completed a utility law investigation report that included a written opinion identifying potential enabling mechanisms for infrastructure development, with analysis of the various limitations, barriers, issues, and potential funding opportunities associated with each option. Mr. Adonizio then ranked these options in terms of desirability, with pros and cons for each listed and discussed. Finally, Mr. Adonizio evaluated the feasibility of establishing natural gas lines or extensions that could be held in public ownership, with consideration of whether the proposed entity could leverage the dollars needed to sustain an incomebased funding stream for gas line maintenance, as well as new expansions. Later in the project, Mr. Adonizio prepared materials related to governance aspects for the chosen type of entity, including its recommended structure, steps needed to establish the entity, articles of incorporation, bylaws, a board structure, and defined policies and powers of the entity. These supporting documents enabled SEDA-COG to begin the establishment process for a natural gas Nonprofit Cooperative Corporation, as described later in this chapter Utility Law Investigation Goals As defined in the original SEDA-COG proposal to EDA, there were two main goals in the utility law investigation step of the project: Determine mechanism(s) that can legally be applied to fully or partially underwrite construction costs on natural gas utility line extensions. Evaluate feasibility of public ownership of the capacity of the lines. As the project progressed, the focus of this step expanded somewhat, but the two main goals were addressed in detail. Specific recommendations that relate to the goals are discussed in the following sections Deliverables The main deliverables of the utility law investigation report were an opinion letter, which was the main document; a gap analysis, which took the form of responses to questions that were listed in the SEDA- COG request for proposal; and several miscellaneous appendices that provided additional details on background topics and supporting materials such as interviews notes, court docket summaries, 4-1
104 Pennsylvania state statutes and regulations, natural gas entity example articles of incorporation, and descriptions of potential state and federal financing programs Establishment of an Administrative Entity Summary of Pros and Cons of Approaches The main conclusion reached through the consultant s utility law investigation is that it is feasible and achievable for SEDA-COG and its project stakeholders to establish a legal entity to promote and administratively support extended/expanded natural gas services. There are several identified options that were considered to achieve this goal; two were noted as the most desirable a municipal gas authority and a Nonprofit Cooperative Corporation. These options are discussed in the section following Table 4-1, which provides a summary of the various options considered. Table 4-1: Identified Options for Establishing an Enabling Entity for New Natural Gas Service Entity Type Nonprofit Cooperative Corporation Nonprofit Corporation Local Development District Third Class City Municipal Authority Does enabling statute allow gas distribution purpose? yes yes Exempt from PUC regulation? yes, if operated on a bona fide cooperative basis only if operated on a bona fide cooperative basis Federally tax exempt? yes, if approved by IRS under 501(c)(2) only if operated on a cooperative basis Eminent domain power? no no Power to issue stock? yes no Recognized model for gas distribution in PA? yes, Keystone Cooperative Association, Inc. yes, Knox Energy Cooperative Association, Inc. possibly yes yes no no no yes no unless 53 Pa.C.S is amended yes, but not for service outside the city yes yes no no yes yes yes no no 4-2
105 Borough County First & Second Class Townships no, but Chambersburg is grandfathered no removed from further consideration no removed from further consideration yes, only Chambersburg Discussion of Recommended Options for Administrative Entity As the table above indicates, the utility law consultant evaluated important options for establishing an administrative entity based upon the following factors: Does an enabling statute in Pennsylvania law allow gas distribution purpose? Would the entity be exempt from Public Utility Commission regulation? Would the entity be federally tax exempt? Would the entity have eminent domain power? Would the entity have the power to issue stock? Is this option a recognized model for gas distribution in Pennsylvania? The first factor is perhaps the most important to establishment of an administrative entity. To be legally viable, enabling statutes under Pennsylvania law must support the chosen option. The first, most preferred option, as identified by the utility law consultant, is a Municipal Authority. This option would have the most positive aspects for its operations, including the right to exercise eminent domain if required. However, the current version of the Pennsylvania Municipality Act (53 Pa.C.S. 5607) specifically prohibits the formation of a Municipal Authority to provide natural gas services. Should this restriction be changed through amending the Pennsylvania Municipality Act (which would have to be approved by the Pennsylvania Legislature), this option would become the top choice. The second preferred option for an administrative entity is the Nonprofit Cooperative (NPC) Cooperation. Because of the current prohibition for establishing a Municipal Authority for natural gas service, the NPC option is currently considered to be the best available structure. This approach has been implemented already in Pennsylvania, as at least two such entities are currently operating in the state. While an NPC would not retain the right of eminent domain, it would have the power to issue stock and likely the same characteristics as a Municipal Authority. The other identified options either are not relevant or have significant limitations as compared to either a Municipal Authority or Nonprofit Cooperative Corporation. 4-3
106 Analysis of Whether an Administrative Entity Should be Established After we completed the bulk of the project work, SEDA-COG and the three counties stakeholders held meetings to decide whether a Nonprofit Cooperative Corporation should be established. We considered the two following possibilities for an organizational approach to establishing/expanding natural gas services: Potential projects could be pursued by the natural gas distribution companies and/or virtual pipeline companies. Should cost/economic analysis be performed in the project areas by the NGDCs, they may decide that development of infrastructure as part of their system would be a good fit for their economic justification and business model, and actually develop that infrastructure. It should be noted that both NGDCs providing service in the three counties (UGI and Columbia) have new tariff programs that are designed to expand the availability of natural gas to residential areas; these programs may come into play in reassessing potential project areas as more economically feasible. Other future NGDC programs could also prove to be relevant as regulatory environments and government initiatives may continue to change. One question would be the time frame proposed by an NGDC in providing service in any area; an interim step of SEDA-COG establishing an administrative entity to facilitate the process could still be a useful action in those instances. Establishing virtual pipeline solutions may also prove to be relevant in certain instances, either as standalone projects or in conjunction with extension of existing distribution lines. Figure 4-1 below shows how these relationships might be structured and overlaps that may result, without direct involvement of SEDA-COG or establishment of a Nonprofit Cooperative Corporation to coordinate operations. 4-4


107 Figure 4-1: Potential New Natural Gas Service Relationships, Without Support SEDA-COG could establish an administrative entity to provide natural gas services. Should an NGDC decide that providing new or expanded natural gas service for a potential project area is not justifiable, SEDA-COG may be able to facilitate provision of service through establishment of a Nonprofit Cooperative Corporation, as previously described. This model may offer significant advantages to finding and procuring grant or loan/equity funding of operations, in addition to its ability to issue stock. There are several considerations for organizing this type of body that may need to be more carefully considered. First, assuming that an NPC is established, its articles of incorporation and bylaws may be written with certain goals and conditions in mind. For example, the NPC model would require a one member, one vote structure, which could have significant implications for its operations. Also, articles of incorporation and bylaws can have some flexibility for enabling future actions related to financial considerations, including possibilities such as selling/transferring assets to an NGDC at a later date, and converting the cooperative over to a Municipal Authority at a later date if that becomes a viable option. Another variation on this approach may involve a project that is served partially or entirely by 4-5


108 virtual pipeline capabilities. In that case, additional types of funding opportunities may be available, and different arrangements with NGDCs may be considered (such as an NGDC connecting to virtual pipeline network at a later date, and taking ownership of all services and infrastructure). Figure 4-2 below shows the potential relationships similar to the preceding diagram, but coordinated through a local stakeholder body - the NPC. Figure 4-2: Potential New Natural Gas Service Relationships, With Support Potential Sources of Financing Grant Funding Grant funding that can potentially be used for natural gas line extensions or expansions may be provided with or without matching requirements. SEDA-COG initiated meetings with local, state, and federal agencies to discuss potential applicability of grant funding and debt financing/loan programs. Potential grant sources identified by SEDA-COG include the following, which are also summarized following Section in Table 4-2: 4-6
109 Appalachian Regional Commission (ARC). It appears that grant funding from ARC may be used for equipment related to establishment of virtual pipeline installations, such as decompression stations and pads. Actual construction of pipeline infrastructure may not be eligible. ARC regulations require that 100% matching funds be provided by the recipient, either in cash or inkind. Public or semi-public entities are best qualified to apply for this program, so an organization such as an economic development entity or a non-profit cooperative would seem to be eligible. Pennsylvania Natural Gas Infrastructure Development Fund. Pennsylvania Governor Wolf originally proposed a $25 million program in his 2015 legislative budget that would provide matching grants to business parks and manufacturers to support extending existing natural gas distribution lines for the last few missing miles to connect with these types of users. This program was cut from earlier budgets, but has been resurrected in House Bill 1327 as a $12 million program called the Natural Gas Infrastructure Development Fund, to be administered by the Pennsylvania Commonwealth Financing Authority. The bill is currently being considered by the Pennsylvania House of Representatives. Pennsylvania Office of Budget Redevelopment Assistance Capital Program (RACP). Centre County has three $5 million natural gas placeholder projects on state s budget list. These reserved funds were sponsored by local legislators, and formal applications and actual approval and release of funds would need to be pursued. Funds could be used for natural gas infrastructure construction activities but not planning, design, or legal work. USDA Rural Cooperative Development Grant Program. This program is specifically for rural cooperatives and nonprofits, but may not be a good it. It has a 25% match for a one-year, $200,000 maximum amount. US EDA POWER Program. This program is for negatively affected coal areas, and eligible Pennsylvania counties include Clinton. The funds could be used for planning and implementation projects. There is a 1:1 match required, and the award ceiling is $1,000,000. US EDA Economic Adjustment Assistance (EAA) Program. This flexible grant program is directed toward distressed communities for market and environmental studies, planning, or construction grants as applied to Comprehensive Economic Development Strategy/public works projects. There are two types of available grants: strategy grants and implementation grants. In general, the funding amount may not exceed 50% of the total cost of the project, although projects may receive an additional 30% of the total based on the relative economic needs of the region. The average award amount of these projects is around $820,000. The program could possibly be used for development of a business plan. US EDA Public Works and Economic Adjustment Assistance (EDAP) Program. This grant program is directed toward distressed communities to improve their key physical infrastructure. Similar to the EDA EAA program, the funding amount may not exceed 50% of the total cost of the project, although projects may receive an additional 30% of the total based on the relative economic needs of the region. The average award amount of these projects is around $1.4 million. 4-7
110 US EDA Public Works Investment Program. These grants are competitively based upon job creation and retention, and whether private sector investment is included. Projects must be publicly owned. The average grant amount is about $1 2.5 million. The program requires 1:1 matching funds. Ben Franklin Technology Partners/ Ben Franklin Shale Gas Innovation and Commercialization Center. This is a 2-year grant program from the Pennsylvania Discovered and Developed in PA (D2PA) Program. It is a competition with awards made to best shale energy oriented innovations, new product ideas, or service concepts that are either in the development stage or recently launched. There is a 1:1 match requirement. It could be suitable for virtual pipeline infrastructure Debt Financing As identified by SEDA-COG and our utility law consultant, there are several options for debt financing, loans, or borrowing, to fund natural gas line extensions or expansions. These are also summarized in Table 4-2, and include: Pennsylvania Economic Development Financing Authority Financing (PEDFA). The Pennsylvania Department of Community and Economic Development (DCED) sponsors this tax-exempt bond financing program, and natural gas projects appear to be eligible for funding. Thresholds must be met in three years for creating and/or retaining jobs, based upon the loan amount. Other specific requirements and conditions include: o o o o o o Types of facilities Tax-exempt or taxable project classifications Minimum ($400,000) and maximum (potential caps) loan sizes Loan term (based upon depreciable life of assets) Loan amortization period Loan and other fees and closing costs Despite documented program guidelines, it should be noted that it remains unclear to SEDA- COG at this time whether this program could be used to fund natural gas line extensions or expansions; we have received differing opinions from DCED staff as to its applicability. USDA Rural Development Business and Industry Guaranteed Loan Program. This federallysponsored program provides Business & Industry (B&I) guaranteed loans at very favorable rates. The program appears to be applicable for a Nonprofit Cooperative Corporation. Purchase of land easements or rights-of-way are allowable uses of funds. There is a limit of $10 million per loan per borrower, with some exceptions. Documented collateral value is required. Should an NPC procure such a loan guarantee, that guarantee could be taken to any Federal or statechartered bank, including virtually any local bank, to secure a construction loan. 4-8
111 USDA Rural Infrastructure Opportunity Fund. This program, new in 2014, can be used for rural energy projects and is a public-private partnership program for debt funding. CoBank is the anchor investor. USDA may or may not contribute funds to individual project loans. USDA Community Facility Program. This program is for nonprofit 501(c)(3) agencies and is intended for facilities that are essential for community operations (such as fire stations). USDA Strategic Economic and Community Development Farm Bill Title: VI - Section: This program provides the ability for USDA to prioritize projects (through set-asides) that are part of multi-jurisdictional strategic economic development or community development plans. Private pipeline construction/maintenance companies. Several companies offer services including financing, designing, building, and maintaining pipelines. Such companies could potentially be retained as the operational arm of an NPC. While their services may be useful, costs of using them to finance new infrastructure may be prohibitive compared to other options. 4-9
112 USDA Rural Development Business & Industry Loan Program Table 4-2: SEDA-COG Regional Gas Utilization Initiative Potential Project Funding Sources Program Comments Match Requirements Minimum/Maximum Amount Cooperative could apply. N/A Allowed uses: right-of-way, facilities, buildings, equipment Guarantees loans for rural businesses. Requires collateral. Not applicable for residential programs. Guarantee fees initial 3%, annual 0.5% of outstanding principal. USDA Rural Cooperative Development Grant Program ( ms-services/rural-cooperativedevelopment-grant-program) For rural cooperatives; nonprofits. Public bodies are not eligible to apply. Doesn t seem to be a good fit for directly establishing a nonprofit cooperative. Purpose is to help individuals and businesses start, expand or improve the operations of rural cooperatives and other mutuallyowned businesses through cooperative development centers. Other eligible grant activities may include conducting feasibility studies and creating business plans. 25% local match required. Program cannot be used for projects involving more than $10M. One-year grants of up to $200,000 were available in FY
113 Program Comments Match Requirements Minimum/Maximum Amount USDA Rural Infrastructure Opportunity Fund Established in Coordinated by USDA. Public-private partnership for debt funding. CoBank is the anchor investor (committed $10 billion). Funding could be provided by USDA and a private investor or just by a private investor. Rural energy projects on targeted list. In some cases, projects may be funded entirely through private sector dollars. In others, private dollars may be leveraged with and extend critical government loan and grant programs. USDA Community Facility Program USDA Strategic Economic and Community Development Farm Bill Title: VI - Section: 6025 For nonprofits. 501(c)(3) programs are eligible. Intended for facilities that are essential to the community (like fire stations). New recent section - Section 379H, Strategic Economic and Community Development. Provides USDA Rural Development the ability to prioritize projects (through setasides) that are part of multijurisdictional strategic economic development or community development plans. Authorizes USDA to reserve up to 10 percent of the funds made available for a fiscal year in the specific areas, including Rural Utilities Service Programs. Multi-jurisdictional strategy is encouraged. 4-11
114 Program Comments Match Requirements Minimum/Maximum Amount To be used for engineering/ 1:1 Target amount for #3 is around $100,000 feasibility study and/or 150,000 infrastructure funding. Appalachian Regional Commission SEDA-COG application #3 U.S. Economic Development Administration Grants Ben Franklin Technology Partners Several types of grants and programs may be relevant POWER, Public Works and Economic Adjustment Assistance (EDAP), Public Works Investment Program, Economic Adjustment Assistance (EAA) Program. POWER designed for areas negatively impacted by changes in the coal industry and power sector (includes some SEDA-COG counties, including Clinton). First track (April, 2015) provides $3M in planning grants to coal areas for CEDS. Second track for implementation projects, with funds provided by EDA, ETA, SBA, and ARC. EAA is for market and environmental studies, planning or construction grants as applied to CEDS/public works projects. EDAP is directed toward distressed communities to improve their key physical infrastructure. Justification needed as to job creation; residential emphasis not appropriate. POWER and Public Works and EDAP programs require match. Match required is 1:1 (in some cases, less match is required depending upon county economic status classifications). POWER award ceiling is $1,000,000. EAA project awards average around $820,000. EDAP project awards average around $1.4 million. 2-year grant from D2PA program. 1:1 $80,000 available to be divided among 4 winners. 4-12
115 Program Comments Match Requirements Minimum/Maximum Amount PennDOT Multimodal Eligibility is questionable. Federal/ state grants can t be used as match. Other state funds may be used as match. PA DCED Pennsylvania Economic Development Financing Authority Bond Program (PEDFA) PA Office of Budget Redevelopment Assistance Capital Program (RACP) PA DCED/ Commonwealth Financing Authority - Alternative and Clean Energy Program (ACE) NGDC Extension Programs Low-interest bonds financing. May or may not be tax-exempt. Requirements for risk to loan underwriters has lessened. Criteria must be met and documented for jobs creation/ retention. Monroe County used this program. Centre County has submitted three $5 million placeholder reserved applications. Grant/ loan funds part of Act 13. Criteria must be met and documented for jobs creation/ retention. May not be applicable for pipelines. In place for UGI (Get Gas Program) and Columbia Gas (New Service Area Rider). Mostly designed for existing residential areas. Financing for gas distribution projects is authorized. 1:1 1:1 No formal requirements. Minimum loan is $400,000. $1,000,000 minimum. Ceiling is $2 to 5 million, or 30-50% of cost. UGI s program is for $1,000,000 annually (may change). 4-13
116 Equity Financing Equity financing (issuance of stock/preferred stock/equity securities) to finance natural gas line extensions or expansions may be suitable for the Nonprofit Cooperative Corporation. Depending upon the overall initial capitalization plan for the NPC, this capability to issue equity securities could provide a significant benefit for the organization. It would ensure the means to raise capital, which may be required to qualify the NPC for some types of grant opportunities, as well as certain debt financing sources. These actions may require that the NPC have a certain equity level in order to qualify for their respective grant, loan, or loan guaranty programs. To issue stock, the Articles of Incorporation of a new Nonprofit Cooperative Corporation must provide that it is formed on a stock share basis, and the Bylaws of that NPC (to be initially adopted and approved by its Board of Directors) must also contain appropriate provisions as to the rights of the Board to issue the securities. When an NPC is formed on a non-stock share basis, its memberconsumers are ordinarily given a Membership Certificate to obtain service when they join the organization. However, when an NPC is formed on a stock share basis, instead of a Membership Certificate, each member is given a stock certificate for one share of the NPC s common stock, representing the member s ownership interest in the organization Governance Recommended Structure for Organizational Entity As indicated, SEDA-COG and our utility law consultant determined that establishing a Nonprofit Cooperative Corporation was the best available option to support development of new natural gas service to targeted investment areas, especially with regard to providing the best opportunities for applying for grant funding. After consideration of the options, the three project counties approved resolutions to establish and participate in a SEDA-COG sponsored Nonprofit Cooperative Cooperation. As of this writing, the NPC is in the process of being organized, which is expected to be completed in early One central question addressed was how many nonprofit cooperatives should be established, and at what geographic scale. The choices were as follows: A SEDA-COG-wide, 11-county Nonprofit Cooperative Corporation that would serve a large region including the three project counties (Centre, Clinton, and Mifflin). Individual NPCs for each county, to be implemented initially for one or more of the counties. Individual NPCs that would serve county subareas, mostly equivalent to TIAs. In consultation with our utility law consultant, SEDA-COG prepared a list of advantages and disadvantages of pursuing each option (Table 4-3). 4-14
117 Table 4-3: Geographic Options for Establishing a Nonprofit Cooperative Corporation(s) Advantages Disadvantages SEDA-COG-wide NPC Single County NPCs Site-Specific NPCs Lowest cost to Relatively low cost to Smaller Boards establish and establish and focused on specific maintain maintain areas Can have election Can have election Potentially lesser districts districts scrutiny from PUC Stronger prospects Could be spun off Single layer of Board for grant funds, later from a single members loans, local matching SEDA-COG-wide NPC Could be spun off funds, etc. later from a single economy of scale county-wide NPC Potentially greater Less economy of support and notice scale from statewide agencies such as DCED Potentially conflicting priorities, rivalries of Board members because of multiple counties, jurisdictions involved Potentially greater scrutiny from PUC Potentially conflicting priorities, rivalries of Board members because of multiple jurisdictions involved in each county Eventually higher cost to establish and maintain because of potentially large number of NPCs Lesser prospects for grant funds, loans, local matching funds, etc. Potentially lesser support and notice from statewide agencies such as DCED After much consideration, SEDA-COG and stakeholders from each county chose to develop a single natural gas Nonprofit Cooperative Corporation to support planning, development, and implementation of new and expanded natural gas services in the three-county region. Because the remaining eight SEDA-COG counties are involved in a similar project at this time, it is possible that one or more of the counties may also join the Nonprofit Cooperative Corporation at a later date Steps Needed for Establishment To establish a business entity like a Nonprofit Cooperative Corporation, any organizing group should follow a structured set of steps. These may be variable based upon individual situations, and SEDA- 4-15

118 COG s efforts to this point to establish the NPC have followed a specific approach, the main steps of which are outlined in Figure 4-3 below. Figure 4-3: SEDA-COG RGUI Nonprofit Cooperative Development Process Having determined that it is feasible to establish an NPC, articles of incorporation and bylaws are being prepared and development of a business plan will follow soon thereafter. SEDA-COG and our utility law consultant have completed analysis for a recommended structure for a Board of Directors, and the NPC s proposed defined policies and powers are being developed Articles of Incorporation (AOI) A necessary part of establishing a Nonprofit Cooperative Corporation is to file articles of incorporation in the state of Pennsylvania. The steps being performed for this task include: 4-16
6FCEDS. Sponsored by:
 6FCEDS Sponsored by: EDA Award # 01-06-14379 ACKNOWLEDGEMENTS AND NOTES SEDA-COG would like to gratefully acknowledge the participation of the following project participants from Centre, Clinton, and Mifflin
Centre County Metropolitan Planning Organization (CCMPO) Coordinating Committee Meeting Tuesday, March 22, :00 p.m.
 Coordinating Committee Meeting Tuesday, March 22, :00 p.m.") Centre County Metropolitan Planning Organization (CCMPO) Coordinating Committee Meeting Tuesday, March 22, 2011 6:00 p.m. Please Note the Location: Ferguson Township Municipal Building 1. Call to Order
Centre County Metropolitan Planning Organization (CCMPO) Coordinating Committee Meeting Tuesday, March 22, 2011 6:00 p.m. Please Note the Location: Ferguson Township Municipal Building 1. Call to Order
North Shore Railroad Newsletter First Quarter
 North Shore Railroad Newsletter 2016 First Quarter 2016 First Quarter TABLE OF CONTENTS Feature from the President page 2 Marketing Award page 3 Notes From Marketing page 4 A New Business Opportunity page
Comprehensive Planning Grant. Comprehensive Plan Checklist
 Comprehensive Planning Grant Comprehensive Plan Checklist This form was updated April 2010 Comprehensive Planning Grant Program Department of Administration Division of Intergovernmental Relations 101
Planning Developments
 Mifflin County Planning and Development Department Planning Developments Planning Developments is published quarterly by the Mifflin County Planning and Development Department 20 North Wayne Street, Lewistown,
Economic Development Strategic Plan Executive Summary Delta County, CO. Prepared By:
 Economic Development Strategic Plan Executive Summary Delta County, CO Prepared By: 1 Introduction In 2015, Region 10, a 501(c)(3) Economic Development District that services six counties in western Colorado,
Chapter 9: Economic Development
 Chapter 9: Economic Development 9.0 Accomplishments Since 2007 As the economic driver for the State, New Castle County continues to review development regulations and offer additional incentives and enhancements
1. INTRODUCTION TO CEDS
 1. INTRODUCTION TO CEDS TABLE OF CONTENTS INTRODUCTION... 1 CEDS STRATEGY COMMITTEE... 2 CEDS COMPONENTS... 2 Community Profiles... 2 Strategic Planning... 2 Bottom up Economic Development Strategies...
SEDA-COG AT A GLANCE. A History of Public and Private Collaboration in 11 Central Pennsylvania Counties
 SEDA-COG AT A GLANCE A History of Public and Private Collaboration in 11 Central Pennsylvania Counties M i s s i o n SEDA-Council of Governments SEDA-COG is a regional multi-county developent agency, which
Toledo Port Authority s Advanced Energy Utility
 Toledo Port Authority s Advanced Energy Utility August 14, 2012 3pm Eastern Moderators: Joel Rogers, Center on Wisconsin Strategy (COWS) James Irwin, Center on Wisconsin Strategy (COWS) Agenda Welcome
The ENDOW Regional Assessment. For Business Development and Innovation Zones
 The ENDOW Regional Assessment For Business Development and Innovation Zones 1 Agenda About ENDOW Business development and innovation zones What is the Regional Assessment? How to use the Regional Assessment
Coolidge - Florence Regional Transportation Plan
 Coolidge - Florence Regional Transportation Plan A Partnership Among the City of Coolidge, Town of Florence, and ADOT FINAL REPORT Kimley-Horn Kimley Kimley-Horn and and Associates, Associates, Inc. Inc.
Summary of Focus Groups Lycoming County 2016 Comprehensive Plan Update April May 2016
 Summary of Focus Groups Lycoming County 2016 Comprehensive Plan Update April May 2016 Focus Group Overview As part of the 2016 Comprehensive Plan community outreach strategy, Lycoming County conducted
5.7 Low-Income Initiatives
 5.7 Low-Income Initiatives 5.7.1 Overview Efficiency Maine Trust delivers energy-saving opportunities to low-income customers through a portfolio of initiatives. Customer Segment The target market for
Update on HB2 Preparation. Presentation to FAMPO May, 2016
 Update on HB2 Preparation Presentation to FAMPO May, 2016 Preparing for Next Round of HB2 and Next CLRP Positioning GWRC/FAMPO HB2 Projects to maximize project scores Candidate projects need to be in:
Russell County Commission. Russell County, Alabama. Request for Proposal Comprehensive Plan Pages Notice of Intent to Respond
 Russell County Commission Russell County, Alabama Request for Proposal Comprehensive Plan Pages 1-15 Notice of Intent to Respond Request for Proposal Due: February 8, 2010 Table of Contents I. Project
FOR OFFICIAL USE ONLY U.S. Department of Homeland Security Washington, DC 20528
 U.S. Department of Homeland Security Washington, DC 20528 FY 2006 Urban Areas Security Initiative (UASI) Award for the Las Vegas Area Las Vegas Area FY 2006 UASI Award $ 7,750,000 Risk: The Las Vegas Area
SEDA-Council of Governments
 SEDA-Council of Governments Economic Development District Comprehensive Economic Development Strategy Five Year Update June 2015 Prepared by: SEDA-Council of Governments 201 Furnace Road Lewisburg, PA
LETTERS TO THE EDITOR
 ATLANTIC SUNRISE EXPANSION A QUICK GUIDE TO WRITING GUIDE CONTENTS 1HOW TO WRITE A LETTER Quick Tips on keeping on message and how to be clear in your position. 2SAMPLE LETTER An example of a letter to
Low Income Energy Efficiency Program
 Exhibit No.: SoCalGas 2B Low Income Energy Efficiency Program Annual Report Program Year 2001 May 2002 Low Income Energy Efficiency Program Program Year 2001 Annual Report May 2002 Table of Contents 1.
Synopsis of Revised Changes to DCA s Rules for Developments of Regional Impact
 The Georgia Planning Act, passed by the General Assembly in 1989, charged the Georgia Department of Community Affairs with administering the State s comprehensive planning program. 1 That legislation assigned
Request for Proposals. Haywood County Broadband Assessment and Feasibility Study
 Request for Proposals Haywood County Broadband Assessment and Feasibility Study Purpose of RFP: The Haywood Advancement Foundation, Inc. (HAF), a 501(c)(3) non-profit organization, is requesting proposals
2014 UPDATE. Comprehensive Economic Development Strategy EAST TEXAS ECONOMIC DEVELOPMENT DISTRICT
 EAST TEXAS ECONOMIC DEVELOPMENT DISTRICT 2014 UPDATE Comprehensive Economic Development Strategy ETCOG 3800 Stone Road Kilgore, TX 75662 (903)218-6436 www.etcog.org 0 Executive Summary This document presents
Page. II. TECHNICAL ASSISTANCE PROJECT DESCRIPTIONS.. 3 A. Introduction... B. Technical Assistance Areas.. 1. Rate Design Consumer Programs...
 TABLE OF CONTENTS I. INTRODUCTION............... Page 1 II. TECHNICAL ASSISTANCE PROJECT DESCRIPTIONS.. 3 A. Introduction.... 4 B. Technical Assistance Areas.. 5 1. Rate Design.... 5 2. Consumer Programs...
2018 Regional Project Evaluation Criteria For PSRC s FHWA Funds
 2018 Regional Project Evaluation Criteria For PSRC s FHWA Funds INTRODUCTION As described in the adopted 2018 Policy Framework for PSRC s Federal Funds, the policy focus for the 2018 project selection
REQUEST FOR PROPOSALS
 REQUEST FOR PROPOSALS Downtown Triangle Redevelopment 1 st Street North, East Jackson Street, and Market Street City of Wisconsin Rapids 444 West Grand Avenue, Wisconsin Rapids, WI 54495 February 2017
NORTH CENTRAL TEXAS COUNCIL OF GOVERNMENTS METROPOLITAN PLANNING ORGANIZATION REQUEST FOR PROPOSALS
 NORTH CENTRAL TEXAS COUNCIL OF GOVERNMENTS METROPOLITAN PLANNING ORGANIZATION REQUEST FOR PROPOSALS CITY OF CEDAR HILL CITY CENTER TRANSIT-ORIENTED DEVELOPMENT PLAN August 19, 2011 REQUEST FOR PROPOSALS
5.6 Home Energy Savings Program
 5.6 Home Energy Savings Program 5.6.1 Overview The Home Energy Savings Program (HESP) is the program through which the Trust pursues savings from upgrades to a home's building envelope or certain heating
ECONOMIC DEVELOPMENT STRATEGIC PLAN. Adopted by the Riverbank City Council March 2011
 ECONOMIC DEVELOPMENT STRATEGIC PLAN Adopted by the Riverbank City Council March 2011 INTRODUCTION Economic development is a priority for Riverbank citizens and decision makers alike. The City wishes to
REQUEST FOR PROPOSAL (RFP) BIO-MATERIALS TECHNOLOGY DEPLOYMENT SAPPI NORTH AMERICA WESTBROOK MAINE SITE COLLABORATION
 BIO-MATERIALS TECHNOLOGY DEPLOYMENT SAPPI NORTH AMERICA WESTBROOK MAINE SITE COLLABORATION") REQUEST FOR PROPOSAL (RFP) BIO-MATERIALS TECHNOLOGY DEPLOYMENT SAPPI NORTH AMERICA WESTBROOK MAINE SITE COLLABORATION SAPPI NORTH AMERICA Administered by: Bio-Based Maine Executive Director Charlotte Mace
REQUEST FOR PROPOSAL (RFP) BIO-MATERIALS TECHNOLOGY DEPLOYMENT SAPPI NORTH AMERICA WESTBROOK MAINE SITE COLLABORATION SAPPI NORTH AMERICA Administered by: Bio-Based Maine Executive Director Charlotte Mace
Funding Principles. Years Passed New Revenue Credit Score Multiplier >3 years 0% % % % After Jan %
 Funding Principles I. Infrastructure Incentives Initiative: encourages state, local and private investment in core infrastructure by providing incentives in the form of grants. Federal incentive funds
ECONOMIC DEVELOPMENT PURPOSE RELATIONSHIP WITH OTHER ELEMENTS OF THE PLAN ECONOMIC CONDITIONS
 ECONOMIC DEVELOPMENT PURPOSE A strong and diversified economy provides a high quality of life for the citizens of Jefferson County and the region. This in turn generates the resources through which local
Section 5. Economic Development
 Section 5. Economic Development Economic Development Funding Funding for economic development projects, unlike that for transportation infrastructure, comes from somewhat less predictable sources. Traditionally,
Economic Development Element
 CHAPTER 6 66.1001(2)(f) Wis. Stat.: Economic Development Element Economic development element: A compilation of objectives, policies, goals, maps and programs to promote the stabilization, retention or
Act 13 Impact Fee Revenues Frequently Asked Questions
 Act 13 Impact Fee Revenues Frequently Asked Questions Revised March 2015 Act 13 Impact Fee Revenues Frequently Asked Questions Table of Contents Overview of Act 13... 3 Local Government Distributions...
FALSE CREEK FLATS GREEN ENTERPRISE ZONE. F C F Green Enterprise Zone
 FALSE CREEK GREEN ENTERPRISE ZONE FLATS F C F Green Enterprise Zone INTRODUCTION For decades, Vancouver has been a leader in smart and sustainable city building. We ve pioneered new built forms, such as
Local Area Key Issues Paper No.12: Cane lands
 Draft Sunshine Coast Planning Scheme Review of Submissions Local Area Key Issues Paper No.12: Cane lands Key Issue: Future use of Maroochy River Plain Cane lands No. of submissions: 217 Major issues raised:
ADMINISTRATIVE CODE BOARD OF COUNTY COMMISSIONERS
 ADMINISTRATIVE CODE BOARD OF COUNTY COMMISSIONERS CATEGORY: DEVELOPMENT/PLANNING/ZONING TITLE: TRANSPORTATION PROPORTIONATE SHARE CALCULATIONS FOR NEW DEVELOPMENT PROJECTS CODE NUMBER: AC-13-16 ADOPTED:
BUSINESS AND ECONOMICS
 This preliminary draft element was prepared by City staff on the basis of input from the CAC and members of the public received from January 2017 through February 2017. The Element will be reviewed by
TABLE OF CONTENTS. SUBCHAPTER 1 GENERAL PROVISIONS 3 5: Statement of purpose 3 5: Definitions 3
 NEW JERSEY DEPARTMENT OF COMMUNITY AFFAIRS DIVISION OF HOUSING AND COMMUNITY RESOURCES Rules of the Neighborhood Revitalization Tax Credit Program (N.J.A.C. 5:47) - as of August 18, 2014 TABLE OF CONTENTS
01/01/14-12/31/14 EDA Grant Number:
 Annual Performance Report 01/01/14-12/31/14 EDA Grant Number: 06-83-05814 Prepared by West Central Indiana Economic Development District, Inc. 1718 Wabash Ave, Terre Haute, IN 47807 (812) 238-1561 The
METHODOLOGY - Scope of Work
 The scope of work for the Truckee West River Site Redevelopment Feasibility Study will be undertaken through a series of sequential steps or tasks and will comprise four major tasks as follows. TASK 1:
The CEDS Action Plan Update for Creek County, Osage County and Tulsa County was adopted by the INCOG EDD Board on February 14, 2008.
 SUMMARY OF UPDATED INCOG EDD ACTION PLAN The CEDS Action Plan Update for Creek County, Osage County and Tulsa County was adopted by the INCOG EDD Board on February 14, 2008. SECTION I - REGIONAL VITALITY
Recommendations and Best Practices for Revising Incentive Structure May 2014
 Recommendations and Best Practices for Revising Incentive Structure May 2014 Opportunities and Challenges for Multifamily Incentive Restructuring In the fall of 2013, ACEEE completed a report identifying
CHAPTER 3: ECONOMIC DEVELOPMENT
 CHAPTER 3: ECONOMIC DEVELOPMENT GOAL 9: ECONOMY ECONOMIC DEVELOPMENT BACKGROUND SUMMARY INTRODUCTION This chapter addresses Statewide Planning Goal 9: "To provide adequate opportunities throughout the
CITY OF TYLER PLANNING AND ZONING COMMISSION STAFF COMMENTS
 CITY OF TYLER PLANNING AND ZONING COMMISSION STAFF COMMENTS Date: May 1, 2018 Subject: Z18-009 BELLWOOD LAKE & LOOP 323 LLLP (178.05 ACRE TRACT) Request that the Planning and Zoning Commission consider
Dane County Comprehensive Plan Economic Development Goals & Objectives HED Work Group July 7, 2006
 Dane County Comprehensive Plan Economic Development Goals & Objectives HED Work Group July 7, 2006 Section I. Goal 1: Dane County will help to build and promote a robust, sustainable economy that enhances
NORTHWEST SECTOR STUDY PHASE I REPORT. Approved 17 February 2015 (Resolution )
") EMBRACE ENHANCE EXPAND NORTHWEST SECTOR STUDY PHASE I REPORT Approved 17 February 2015 (Resolution 2015-02-022) This plan has been prepared by Parsons Brinckerhoff and their subconsultants for the City
EMBRACE ENHANCE EXPAND NORTHWEST SECTOR STUDY PHASE I REPORT Approved 17 February 2015 (Resolution 2015-02-022) This plan has been prepared by Parsons Brinckerhoff and their subconsultants for the City
Michigan State University School of Planning, Design, & Construction
 A Self-Assessment of Sustainability in Your Community: Williamstown Township Follow-Up Report December, 203 Acknowledgements Local Partners The Michigan State University (MSU) Project Team would like to
energy industry chain) CE3 is housed at the
 CE3 is housed at the") ESTABLISHING AN APPALACHIAN REGIONAL ENERGY CLUSTER Dr. Benjamin J. Cross, P.E., Executive in Residence, Ohio University Voinovich School of Leadership and Public Affairs, February 2016 Value Proposition
ESTABLISHING AN APPALACHIAN REGIONAL ENERGY CLUSTER Dr. Benjamin J. Cross, P.E., Executive in Residence, Ohio University Voinovich School of Leadership and Public Affairs, February 2016 Value Proposition
Revisit & Update Mobility Hubs Program
 Revisit & Update Mobility Hubs Program Task 1 Market Assessment Prepared for: Broward Metropolitan Planning Organization JULY 2017 Table of Contents Introduction 1 Overview of Key Tasks 2 Summary of Findings
Technical Report 2: Synthesis of Existing Plans
 Technical Report 2: Synthesis of Existing Plans Compiled by the Piedmont Triad Regional Council January, 2013 Triad Tomorrow Figure 1. Piedmont Triad Region CONTEXT The Piedmont Triad region consists of
Planning Process. & Community Involvement Plan
 Unified Government of Wyandotte County/Kansas City, KS Brownfields Project: Community Wide Hazardous Substance & Community Wide Petroleum Grants Planning Process & Community Involvement Plan Draft 10/30/2010
A THRIVING MIDDLE GEORGIA
 Plan for A THRIVING MIDDLE GEORGIA Presentation of Regional Assessment & Stakeholder Involvement Program September 3, 2015 Why Regional Planning? Challenges cross traditional city and county boundaries
SUPPORTING LOCAL BUSINESSES A GUIDE FOR MUNICIPALITIES
 SUPPORTING LOCAL BUSINESSES A GUIDE FOR MUNICIPALITIES Working to Keep the North Country Economy Strong NORTH COUNTRY COUNCIL S RESILIENT ECONOMY PROGRAM Supporting Local Businesses: A Guide for Municipalities
07/01/2010 ACTUAL START
 PAGE, 1/27/21 6:18:42PM Grant Number: SC2224 Activity: Municipal Facility Energy Conservation Program Quarter: 1/1/29-12/31/29 Metric Activity: Building Retrofits Status: Active % of Work Complete: Activity
 COLUMBIA COUNTY FLORIDA JOB GROWTH GRANT FUND 2018-2019 Wastewater Treatment Facilities 1. Program Requirements A. Detailed Description of the Public Infrastructure Improvements Columbia County requests
REQUEST FOR PROPOSALS
 REQUEST FOR PROPOSALS Town of Hope Mills Multi-Modal Congestion Management Plan September 19, 2016 Fayetteville Area Metropolitan Planning Organization Proposal Due Date: 3:00 PM Eastern Time, 28 th October,
Gunnison County Energy Action Plan
 Gunnison County Energy Action Plan Adopted by the Gunnison County Board of County Commissioners on August 4, 2009 Table of Contents Table of Contents... 2 Introduction... 3 ACTIONS FOR CURRENT CONSIDERATION...
Township of Scugog Action Plan
 Township of Scugog Action Plan 2013-2018 Township of Scugog Action Plan 2013-2018 Explanation: The Action Plan implements the four strategies of the Vibrant North Durham Economic Development Plan. The
VILLAGE OF FOX CROSSING REQUEST FOR PROPOSAL FOR COMPREHENSIVE PLAN
 VILLAGE OF FOX CROSSING REQUEST FOR PROPOSAL FOR COMPREHENSIVE PLAN Issuing Department: Community Development Department Village of Fox Crossing 2000 Municipal Dr. Project Officer: George L. Dearborn Jr.,
What is the Community Development Block Grant Program (CDBG)?
?") What is the Community Development Block Grant Program (CDBG)? The Community Development Block Grant (CDBG) is a federal grant program administered by the U.S. Department of Housing and Urban Development
What is the Community Development Block Grant Program (CDBG)? The Community Development Block Grant (CDBG) is a federal grant program administered by the U.S. Department of Housing and Urban Development
First & Main A Blueprint for Prosperity in America s Local Communities
 First & Main A Blueprint for Prosperity in America s Local Communities The corner of First & Main is where everything happens. Whether in a rural area, a tribal community, or a smaller city, First & Main
OSI NJ Grant Programs and Initiatives. Presentation To: DVRPC: New Jersey Open Space and Farmland Preservation Coordinators Roundtable Session
 OSI NJ Grant Programs and Initiatives Presentation To: DVRPC: New Jersey Open Space and Farmland Preservation Coordinators Roundtable Session April 19, 2013 Bayshore Highlands Fund $5 million OSI re grant
Powering Our Communities. Grant Guidelines
 Powering Our Communities Grant Guidelines Powering Our Communities Grant Guidelines The Northeast Ohio Public Energy Council, Inc. ( NOPEC ) is pleased to invite its electric member communities of The
TAX PHASE-IN GUIDELINES FOR BEXAR COUNTY AND CITY OF SAN ANTONIO
 TAX PHASE-IN GUIDELINES FOR BEXAR COUNTY AND CITY OF SAN ANTONIO Effective June 15, 2006 through June 14, 2008 BEXAR COUNTY CITY OF SAN ANTONIO Economic Development Department Economic Development Department
Request for Proposals. Housing Study Consulting Services. Proposals DUE: January 6, City of Grandview. Economic Development Department
 Request for Proposals Housing Study Consulting Services Proposals DUE: January 6, 2017 City of Grandview Economic Development Department Leonard Jones, Mayor Cory Smith, City Administrator REQUEST FOR
F. Provide a detailed description of, and quantitative evidence demonstrating, how the proposed public infrastructure project will promote:
 F. Provide a detailed description of, and quantitative evidence demonstrating, how the proposed public infrastructure project will promote: Economic recovery in specific regions of the state; Economic
N E W Y O R K S T A T E H O U S I N G F I N A N C E A G E N C Y
 N E W Y O R K S T A T E H O U S I N G F I N A N C E A G E N C Y APPLICATION REQUIREMENTS FOR ENERGY EFFICIENCY OF NEW CONSTRUCTION AND PRESERVATION/REHABILITATION FINANCING Please review the updated HFA
CONNECTED CITY FREQUENTLY ASKED QUESTIONS
 1) What is the Connected City project? CONNECTED CITY FREQUENTLY ASKED QUESTIONS The Connected City Corridor is a State-initiated pilot program that is unique to Pasco County, and will be the first planned
Association of Metropolitan Planning Organizations Fixing America s Surface Transportation (FAST) Act
 Act") Association of Metropolitan Planning Organizations Fixing America s Surface Transportation (FAST) Act General Overview Total authorizations (Highway Trust Fund, HTF, Contract Authority plus General Funds
Association of Metropolitan Planning Organizations Fixing America s Surface Transportation (FAST) Act General Overview Total authorizations (Highway Trust Fund, HTF, Contract Authority plus General Funds
SILVERTHORNE COMPREHENSIVE PLAN APPENDIX A - ECONOMIC DEVELOPMENT ELEMENT
 SILVERTHORNE COMPREHENSIVE PLAN APPENDIX A - ECONOMIC DEVELOPMENT ELEMENT INTRODUCTION The ability to provide quality municipal services and infrastructure to the Silverthorne community is directly related
INDUSTRY - SUSTAINABILITY - INNOVATION ECONOMIC DEVELOPMENT STRATEGY
 INDUSTRY - SUSTAINABILITY - INNOVATION ECONOMIC DEVELOPMENT STRATEGY VANCOUVER From past to present RESOURCES FINANCE & BANKING GREEN ECONOMY TECHNOLOGY DIGITAL ENTERTAINMENT & INTERACTIVE 1886 (Population:
Enterprise Zone Application. Cecil County Executive Tari Moore
 Enterprise Zone Application 2013 Cecil County Executive Tari Moore 1 2 Table of Contents II. III. IV. Expression of Consent Written Confirmation of State Priority Funding Area Eligibility Requirement for
Drive America s Economy Forward by Reinvesting in Municipal Infrastructure
 Drive America s Economy Forward by Reinvesting in Municipal Infrastructure WWW.NLC.ORG/INFRASTRUCTURE Drive America s Economy Forward Drive America s Economy Forward by Reinvesting in Municipal Infrastructure
Comprehensive Plan 2009
 Comprehensive Plan 2009 2.14 PUBLIC SCHOOLS FACILITIES Goal: Coordinate and maintain a high quality education system. Collaborate and coordinate with the Okaloosa County School Board (School Board) to
Community Revitalization Fund Tax Credit Program (CRFP) Overview and Request for Proposals (RFP)
 Overview and Request for Proposals (RFP)") Community Revitalization Fund Tax Credit Program (CRFP) Overview and Request for Proposals (RFP) The Pennsylvania Housing Finance Agency (PHFA or Agency) announces a Request for Proposals (RFP) to participate
Community Revitalization Fund Tax Credit Program (CRFP) Overview and Request for Proposals (RFP) The Pennsylvania Housing Finance Agency (PHFA or Agency) announces a Request for Proposals (RFP) to participate
Table 1. Summary of Recommended Implementation Strategies
 DATE: October 20, 2014 TO: Salem HNA and EOA Advisory Committee CC: Lisa Anderson-Ogilvie and Eunice Kim FROM: Bob Parker and Beth Goodman SUBJECT: DRAFT EMPLOYMENT LAND IMPLEMENTATION PLAN Summary The
SAN JOSE CAPITAL OF SILICON VALLEY
 CITY OF C7 S2 SAN JOSE CAPITAL OF SILICON VALLEY TO: HONORABLE MAYOR AND CITY COUNCIL COUNCIL AGENDA: 05/09/17 ITEM: 4.1 Memorandum FROM: Kim Walesh Jim Ortbal SUBJECT: SEE BELOW DATE: COUNCIL DISTRICT:
4.b. 6/22/2017. Local Agency Formation Commission. George J. Spiliotis, Executive Officer
 4.b. 6/22/2017 TO: FROM: SUBJECT: Local Agency Formation Commission George J. Spiliotis, Executive Officer LAFCO 2014-09-5 SPHERE OF INFLUENCE AMENDMENT TO THE CITY OF BEAUMONT (ADDITION) AND AMENDMENT
Multifamily Affordable Solar Housing. Semi Annual Progress Report. July 30, 2012
 Multifamily Affordable Solar Housing Semi Annual Progress Report July 30, 2012 Table of Contents 1. Executive Summary... 2 2. Background... 3 2.1. Incentive Types: Track 1 (A and B) and Track 2... 4 Table
Multifamily Affordable Solar Housing. Semi Annual Progress Report. July 31, 2013
 Multifamily Affordable Solar Housing Semi Annual Progress Report July 31, 2013 Table of Contents 1. Executive Summary... 2 2. Background... 3 2.1. Incentive Types: Track 1 (A and B) and Track 2... 4 Table
APPENDIX METROFUTURE OVERVIEW OVERVIEW
 APPENDIX B METROFUTURE OVERVIEW OVERVIEW Land use decisions and many economic development decisions in Massachusetts are controlled directly by local municipalities through zoning. This planning is guided
HRG Engineering Completes
 A publication of the Moshannon Valley Economic Development Partnership, Inc. M O S H A N N O N V A L L E Y P R O G R E S S Summer 2015 Volume 14 Issue 2 Special points of interest: MVEDP S 27th Annual
The Loop Media Hub. Gigabit Economic Development Impact Statement. Prepared for: The Loop Media Hub Feasability Study. June 27, 2012.
 Sandel & Associates The Loop Media Hub Gigabit Economic Development Impact Statement Prepared for: The Loop Media Hub Feasability Study June 27, 2012 Prepared by: Special Advisor Pat McKeehan 6900 Delmar
FREQUENTLY ASKED QUESTIONS
 LOW INCOME WEATHERIZATION PROGRAM FREQUENTLY ASKED QUESTIONS Contents GENERAL QUESTIONS... 1 PROGRAM ELIGIBILITY... 2 PROGRAM PROCESS... 3 PROJECT MEASURES, TIMELINE, AND CONSTRUCTION... 4 ENERGY EFFICENCY
Economic Development Plan For Kent County, Maryland
 Economic Development Plan For Kent County, Maryland October 2013 FINAL Submitted by: Kent County Economic Development Advisory Board File: Economic Development Office: EDAB_Plan_final_2013_10_02.doc Economic
WRP Natural Resources Committee s Southeastern Arizona/New Mexico (SoAZ/NM Project)
") 2015 WRP Natural Resources Committee s Southeastern Arizona/New Mexico (SoAZ/NM Project) SoAZ/NM Project: A formula for success. As a direct result of this project s efforts, the area: Won the 2014 REPI
2015 WRP Natural Resources Committee s Southeastern Arizona/New Mexico (SoAZ/NM Project) SoAZ/NM Project: A formula for success. As a direct result of this project s efforts, the area: Won the 2014 REPI
Results of the Clatsop County Economic Development Survey
 Results of the Clatsop County Economic Development Survey Final Report for: Prepared for: Clatsop County Prepared by: Community Planning Workshop Community Service Center 1209 University of Oregon Eugene,
Enterprise Zone Application. The Town of Chestertown. and The County of Kent
 Enterprise Zone Application The Town of Chestertown and The County of Kent 2016 Enterprise Zone Application_Chestertown_Kent County Page 2 Page 2 04/14/2016 Enterprise Zone Application_Chestertown_Kent
Finding Funding for Energy Efficiency
 54M102007D Finding Funding for Energy Efficiency Retail Industry Leaders Association Presented by Shaw Environmental & Infrastructure, Inc. 02M062007D July 9, 2009 2 Agenda Introduction to Shaw Overview
Georgia Water Supply Competitive Grant Program Program Guidelines
 Georgia Water Supply Competitive Grant Program Program Guidelines In March 008, the Georgia General Assembly approved and the Governor signed the amended state budget for Fiscal Year 008 (HB 989). The
2017 Application Instructions - Fuels & Forest Health Projects
 Application Instructions - Forest Restoration and Wildfire Risk Mitigation Grant Program Established by SB 17-050 Application Instructions: All blocks are fill-in enabled and character locked. Applicants
Idaho Statewide Implementation Strategy for the National Fire Plan
 Idaho Statewide Implementation Strategy for the National Fire Plan December 2006 Purpose Provide a collaborative framework for an organized and coordinated approach to the implementation of the National
NC General Statutes - Chapter 136 Article 19 1
 Article 19. Congestion Relief and Intermodal 21 st Century Transportation Fund. 136-250. Congestion Relief and Intermodal Transportation 21 st Century Fund. There is established in the State treasury the
APPENDIX A PROGRAMMATIC AGREEMENT FOR MINOR TRANSPORTATION PROJECTS
 APPENDIX A PROGRAMMATIC AGREEMENT FOR MINOR TRANSPORTATION PROJECTS PROGRAMMATIC AGREEMENT AMONG THE FEDERAL HIGHWAY ADMINISTRATION THE PENNSYLVANIA DEPARTMENT OF TRANSPORTATION, THE PENNSYLVANIA STATE
BEFORE THE PUBLIC UTILITIES COMMISSION OF THE STATE OF CALIFORNIA
 BEFORE THE PUBLIC UTILITIES COMMISSION OF THE STATE OF CALIFORNIA Funding Approval from the California Advanced Services Fund (CASF) for the California Broadband Cooperative s Digital 395 Middle Mile Project
FEDERAL ECONOMIC DEVELOPMENT FUNDING IN OHIO: SURVEY FINDINGS
 Prepared by: Afia Yamoah, Ph.D. In partnership with: The Office of U.S. Senator Sherrod Brown Ohio Economic Development Association (OEDA) FEDERAL ECONOMIC DEVELOPMENT FUNDING IN OHIO: SURVEY FINDINGS
INTERGOVERNMENTAL COORDINATION ELEMENT:
 INTERGOVERNMENTAL COORDINATION ELEMENT: Goals, Objectives and Policies Goal 1: To give the Town the maximum amount of input, control, and advisory power with other public agencies for the protection of
PUBLIC FACILITIES FINANCING
 9. Public Facilities Financing Brisbane Baylands Specific Plan 257 9 PUBLIC FACILITIES FINANCING 9.1 PURPOSE The Baylands is planned to accommodate a variety of uses including retail at a range of types