Croydon CCG. A consolidated view of provider performance across. A consolidated view of CCG contracting performance. Month 11.
|
|
|
- Gillian Robbins
- 5 years ago
- Views:
Transcription
1 Croydon CCG A consolidated view of provider performance across South London Epsom Croydon & CCG St. Helier Integrated University Report A consolidated view of CCG contracting performance Month 11 Month 11 1
2 Modules Context South East CSU provides Contract Management services on behalf of South London CCGs. This involves a range of activities including supporting the annual negotiation process, monthly and financial, performance and activity monitoring, and the query and claims management process. The purpose of this report is to provide a comprehensive understanding of the CCG s contracting performance position. The report is modular and is constructed from a number of components. Modules Contents Finance & Activity 4. CCG Overview 1. Croydon Health Services 13. St. George s Healthcare (SGH) 15. King s College Hospital 18. Epsom & St. Helier 2. Moorfields Eye Hospital 27. Summary of key finance & activity drivers, commissioning / contractual actions Community 37. Overview 4. TACS Finance & Activity Performance Quality Community Intermediate LES Intermediate 42. Planned Care 58. Unscheduled Care Glossary LIS 62. Overview Full glossary is available on the SLCSU Portal: Finance data primary source is finance adjusted SLAM data. Activity data primary source is SUS. Performance data primary source is relevant national websites (e.g. Unify2, Open Exeter, HPA HCAI database) Quality data primary source is Trust Scorecards Contents Introduction Glossary 2
3 Finance & Activity Croydon CCG Integrated Report 3
4 CCG overview Finance Full year plan YTD Plan YTD Actual Adjusted YTD (Over) / Underspend YTD (Over) / underspend M11 Finance Board Report (Over) / Underspend Forecast Outturn (over) / Underspend ' ' ' ' % ' ' Croydon Health Services NHS Trust 161, , ,253-3 % King's College Foundation Trust 19,722 18,79 18,41 38 % St George's Healthcare NHS Trust 22,638 2,752 21, % Epsom & St Helier (Acute & Renal) NHS Trust 8,278 7,588 8, % Moorfields Foundation Trust 9,47 8,293 9,848-1,555-19% - 1,697-1,697 Other acute contracts 51,617 47,315 48,813-1,497-3% - 1,999-1,999 LOCAL ACUTE CONTRACTS 272,999 25, ,543-4,294-2% - 5,63-5,63 Cost per case and exclusions to contracts % Other earmarked acute budgets % 216/17 commissioning reserves % Income % NHSE Transfers % TOTAL ACUTE BUDGET 216/17 % NHS England & 111 % REVISED ACUTE BUDGET 216/17 272,999 25, ,543-4,294-2% - 5,63-5,63 The month 11 year to date (YTD) position for Croydon CCG is reporting a 4.3m over spend across all Acute Trusts with a Month 12 extrapolated position of 5.6m. The main contributor to this position continues to be Moorfields with an over spend of 1.5m followed by St. Georges at 67k. Croydon Health Services (CHS) is over performing in month 12 by 3k (mitigated). The forecast outturn is 488k over performance which is due to Critical Care Work in Progress Patients and seasonality adjustments. CHS continues to underperform in elective and non-elective activity as well as Emergency activity. The main areas of over performance against plan are in A&E, outpatient (Firsts, Procedures, and Follow-ups) and direct access. A&E has continued to over perform and there is an in month increase in both activity and costs by 3,787 attendances. Increases are seen in category 2 investigations with category 4 treatment with a decrease in category 3 investigations with category 1-3 treatment. St. George s activity is 67k over plan mainly in all outpatient activity and the Maternity Pathway. Outpatients are 588k above year to date plan predominately in ENT relating to cochlear rehabilitation and assessment procedures followed by Neurology, Respiratory Physiology and Respiratory Medicine. The maternity pathway is 22k over plan. Deliveries and antenatal/postnatal activity are over plan from the previous month with 164 patients over the year to date plan. The Moorfields activity and finance impact continues to increase and month 11 has seen the greatest financial increases with an over performance of 1.5m mainly relating to drugs and devices. Croydon CCG is experiencing a 722k over performance in HCD Injections (Eylea). Elective activity is over-performing by 232k. An analysis of SLAM shows that this is being driven by over-performance of cataract procedures. The M11 position for all Providers shows that 2,112 cataract procedures have been undertaken (BZ2Z). The M11 position for 215/16 was 1,971 procedures and the M11 position 214/15 was 2,216 procedures. Whilst Moorfields appear to be over-performing, the overall level of activity across all Providers remains broadly consistent over that three year period. Other Acute Contracts are over performing at 612k and independent sector contracts by 66k. Further detailed positions for CHS, St. Georges, Kings, Epsom St. Helier and Moorfields are provided on pages, 11,14,16,18 and 2 of this report. Module Finance & Activity 4
5 CCG overview Finance All Providers Year to Date - Finance Year to Date - Activity CCG Adjusted Plan Actual Variance to CCG Plan Variance movement CCG Adjusted Plan Actual Variance ' ' ' % ' % Elective 42,12 42,26 77 % 34,318 34, % Emergency 64,842 63,733 1,11 2% 33,499 31,911 1,588 5% Non-Elective 3,537 3, % 4,85 3,515 1,29 27% A&E 15,91 16, % 147, ,769 5,895 4% Out Patient 1st 14,211 15,428-1,217-9% 84,47 91,93-7,433-9% Out Patient Follow Up 2,447 2, % 22, ,783-3,48-1% Out Patient Procedure 9,34 1,665-1,325-14% 47,51 55,511-8,1-17% Critical Care 9,158 8, % 7,365 7, % Direct Access 8,714 8, % 1,967,181 2,131, ,998-8% Drugs % % Drugs & Devices 8,457 9,579-1,122-13% 38,573 4,114-1,541-4% Maternity Pathway 23,776 24, % 15,652 16,741-1,89-7% Unbundled Diagnostics 4,822 4, % 44,122 49,132-5,1-11% PTS 1,964 1, % 11,424 13,973-2,55-22% Other 17,492 18,853-1,361-8% 12, ,79-13,456-11% CQUIN 5,485 5, % 1 1 1% Total 25, ,543-4,294-2% 2,777,563 2,974, ,297-7% % Croydon CCG is over plan across all providers by 4.3m year to date (YTD) with a forecast outturn of 5.6m, which is an improved position of 1.5m on the previous month. The areas of over performance continue in outpatient attendances, drugs and devices as well as the maternity pathway. Elective activity is under plan by 77k across all providers with CHS, St. Georges and Kings contributing to this position and offset by over performance at Moorfield s ( 232k) and Epsom St. Helier ( 63k). Emergency activity continues to underperform at Croydon Health Services ( 679k); Kings ( 241k) and St. Georges ( 79k) with the majority of over performance occurring at Epson St. Helier ( 94k). A&E over performance has an improved position of 73k in month 11. The main contributor is CHS at 1.2m due to Edgecombe unit activity. Kings and Moorfields continue the trend of underperformance as seen in previous months. Outpatient firsts is the highest over performing POD at 1.2m with corresponding in month increases in the number of follow-ups. The majority of over performance is at CHS and is due to the transfer of non-elective activity to the outpatient POD. The Trust have also applied quarter 1 reconciliation adjustments which are reflected in the data. Procedures are over plan by 1.3m mainly at CHS in cardiac procedures ( 351k), Female Reproductive system procedures including diagnostic hysteroscopy s ( 254k). The POD Drugs and Devices continues to significantly over perform by 1.1k in Month 11, with Moorfields being the main contributor at 722k; this is mainly related to Eylea injection costs. The maternity pathway also continues to over perform at all providers with the exception of Moorfields. St. Georges continues to report an over performance in the antenatal and postnatal pathways with a corresponding decrease in antenatal activity seen at Croydon Health Services. Module Finance & Activity 5
6 CCG overview Finance Other contracts Previous Month YTD Variance % YTD (Over) / Under Performance YTD (Over) / Under Performance Contract Annual Value Improvement (Deterioration) The narrative below refers to contracts which are over or under-performing by 2k or more or showing a 3% variance/ showing extreme variances from last month or any significant deterioration. Royal Brompton and Harefield NHS Foundation Trust Trust ' ' % ' ' Chelsea and Westminster Hospital NHS Foundation Trust 743 (126) (19%) (16) (21) Great Ormond Street Hospital For Children NHS Trust 19 (68) (39%) (65) (3) Guy's & St. Thomas' NHS Foundation Trust 7, % Kingston NHS Trust 273 (54) (22%) (43) (11) Queen Victoria Hospital NHS Foundation Trust 223 (7) (3%) 8 (15) Royal Brompton and Harefield NHS Foundation Trust 552 (125) (25%) (14) 15 Royal Free Hampstead NHS Trust % 14 (9) The Royal Marsden NHS Foundation Trust 3,636 (189) (6%) (12) (69) Royal Surrey County NHS Trust 134 (72) (58%) (74) 2 University College London Hospitals NHSFT 1,521 (95) (7%) (75) (2) Barts and The London NHS Trust % Epsom and St Helier University Hospitals (SWLEOC) NHS Trust 4,991 (318) (7%) (252) (66) Imperial College Healthcare NHS Trust 778 (87) (12%) (12) 14 The M11 SLAM reports an over-performance of 125k year to date (YTD). The unmitigated in month position shows favourable movement of 18k. The overperformance is driven by an over spend of 75k YTD in Electives; this is mainly due to thoracic procedures and disorders. Critical Care is over-performing by 23k (favourable in month movement by 1k due to 1 organ supported. Lewisham & Greenwich Hospital NHS Trust This contract is over-performing by 227k at M11 YTD, a favourable movement from M1. Critical Care continues to be the main driver for the overperformance and is 174k above plan due to 112 days of activity for 3 organ supported (mainly attributed to the discharge of one patient in August). There has been no reported discharge from ICU in M11. Great Ormond Street Hospital The contract is over-performing by 68k YTD; this equates to 39% against plan. The main drivers for the over-performance is in Emergency (53k) and Maternity (37K) Lewisham & Greenwich Hospital NHS Trust 883 (227) (28%) (237) 1 North West London Hospitals NHS Trust % 41 5 Queen Mary's Roehampton (SGH) % The Royal National Orthopaedic NHSFT % 21 (17) Surrey & Sussex NHS Trust 4,825 (13) (3%) (237) 17 London Ambulance NHS Trust 13,974 % (36) 36 Western Sussex Hospitals NHS Foundation Trust % Total Contract Value 43,642 (612) -2% (987) 375 Module Finance & Activity 6
7 CCG overview Finance Independents Bridging Analysis Trust SLAM YTD Month 11 Contract Monitoring Month 11 YTD Plan YTD Actual YTD (Over) / Plan Adj Uncoded KPIs Technical Adj Claims YTD Plan YTD Actual Under spend YTD (Over) / under spend ' ' ' ' ' ' ' ' ' ' ' INDEPENDENT CONTRACTS 6,671 6, ,595 7,31 7,917 (66) Ramsey Healthcare (8) (38) Virgin Assura 3,519 2, ,54 4,182 4,182 BMI Healthcare 2,672 3,216 (544) ,728 3,296 (568) CCG overview Finance Independents Overview Trust Contract Annual Value Previous Month YTD Variance % YTD (Over) / Under Performance YTD (Over) / Under Performance Improvement (Deterioration) ' ' % ' ' Dorking Healthcare % () Virgin Assura 4,562 % Nuffield % The total cost associated with the Virgin Assura contract is 4,562k, which includes the core activity of the contract ( 3.8m) and funding for the following items: -UCC and OOH activity ( 3.8m) - UCC Out of area - Out of Hours, Out of area, - Health care assistant for ViEWS reporting - Premises - Storage of old OOH records Please see pg for further analysis. Spire Gatwick % BMI 2,976 (568) (21%) (517) (51) Ramsay 437 (38) (9%) (35) (3) Epsomedical % () Horder % Total Contract Value 7,975 (66) -8% (552) (54) Module Finance & Activity 7
8 CCG overview Activity All Providers Outpatients (OP Attendances - Outpatient 1st & Follow Up (inc Procedures) by source) All Types GP C2C Other Apr May Jun Jul Aug Sep Oct Nov Dec Jan Feb Mar OP 1st OP 1st OP 1st OP 1st OP 1st OP 1st OP 1st OP 1st OP FU OP FU OP FU OP FU OP FU OP FU OP FU OP FU Activity (Total activity by POD) A&E (all types) Emergency Non-Elective Non-Emergency Elective Apr May Jun Jul Aug Sep Oct Nov Dec Jan Feb Mar Module Finance & Activity Interactive Activity Dashboard Available at: 8
9 CCG overview Finance Bridging analysis SLAM YTD Month 11 Contract Monitoring Month 11 Trust YTD (Over) / YTD Plan YTD Actual Plan Adj Uncoded KPIs Technical Adj Claims YTD Plan YTD Actual Under spend YTD (Over) / under spend ' ' ' ' ' ' ' ' ' ' ' LOCAL ACUTE CONTRACTS 21,849 28,327 (6,479) 1,85 (12) (2,511) (75) 22,934 25,73 (2,797) Croydon Health Services NHS Trust 147, ,33 (3,726) 646 (3,5) 148, ,253 (3) St. George's healthcare NHS Trust (SGH) 2,627 21,472 (845) 125 (51) 2,752 21,421 (67) King's College Hospital (Denmark Hill) 17,668 17,682 (14) (72) 18,79 18,41 38 Epsom and St Helier University Hospitals NHS Trust 7,52 8,9 (588) 87 (12) 92 (2) 7,588 8,167 (579) Moorfields Eye Hospital NHS Foundation Trust 8,476 9,781 (1,35) (183) 67 8,293 9,848 (1,555) OTHER ACUTE CONTRACTS 39,466 4,631 (1,165) 539 (1) (34) 334 (25) 4,5 4,895 (89) Chelsea and Westminster Hospital NHS Foundation Trust (144) 2 (2) (14) (126) Great Ormond Street Hospital For Children NHS Trust (68) (68) Guy's & St. Thomas' NHS Foundation Trust 6,96 6, (23) 7,69 6, Kingston NHS Trust (56) () (1) (54) Queen Victoria Hospital NHS Foundation Trust (7) (7) Royal Brompton and Harefield NHS Foundation Trust (125) () (125) Royal Free Hampstead NHS Trust The Royal Marsden NHS Foundation Trust 3,15 3,522 (372) 183 3,333 3,522 (189) Royal Surrey County NHS Trust (281) 1 (28) (72) University College London Hospitals NHSFT 1,415 1,489 (74) (21) 1,394 1,489 (95) Barts and The London NHS Trust Epsom and St Helier University Hospitals (SWLEOC) NHS Trust 4,519 4,829 (31) ,575 4,892 (318) Imperial College Healthcare NHS Trust (96) 3 (6) (87) Lewisham & Greenwich Hospital NHS Trust 85 1,41 (237) 4 (3) (3) 89 1,36 (227) North West London Hospitals NHS Trust St. George's healthcare NHS Trust (QMR) The Royal National Orthopaedic NHSFT (3) Surrey & Sussex NHS Trust 4,299 4,562 (264) 124 (1) (32) 33 4,423 4,553 (13) London Ambulance NHS Trust 12,81 12,81 (1) ,89 13,87 (278) Western Sussex Hospitals NHS Foundation Trust TOTAL ACUTE CONTRACTS 241, ,959 (7,644) 1,624 (1) (46) (2,177) (1) 242, ,626 (3,687) Module Finance & Activity 9
10 Croydon Health Services Finance Year to Date - Finance (over) / under Year to Date - Activity (over) / under CCG Adjusted Plan YTD Actual YTD Variance to CCG Plan Variance movement CCG Adjusted Plan Actual Variance ' ' ' % ' % Elective 18,646 17, % 18,134 17, % Emergency 48,496 47, % 25,793 24,282 1,511 6% Non-Elective 2,523 2, % 3,854 2,359 1,495 39% A&E 8,487 9,76-1,22-14% 51,87 55,594-3,787-7% Out Patient 1st 9,144 1,173-1,29-11% 51,318 57,462-6,144-12% Out Patient Follow Up 12,186 12, % 135, ,86 2,385 2% Out Patient Procedure 5,317 5, % 25,156 29,468-4,312-17% Critical Care 5,43 4, % 4,69 4, % Direct Access 7,951 8, % 1,879,117 2,61, ,29-1% Drugs & Devices 3,68 3, % 4-4 % Maternity Pathway 17,3 16, % 11,167 11, % Unbundled Diagnostics 3,148 3,158-1 % 31,38 33,642-2,64-8% Other 1,739 1, % % PTS 1,43 1,43 % % CQUIN 3,531 3,531 % % Total 148, ,253-3 % 2,236,645 2,43, ,787-9% % Forecast Outturn - Finance 161, , % The year to date mitigated financial position for Croydon CCG is 3k over plan with a forecast outturn of 488k; this is an improved position on previous months and has partly been impacted by the short month of February and also the general decrease in activity particularly in electives, emergency and non- elective activity. There are also a number of technical adjustments in month 11 as per the quarter 1 reconciliation agreement. The forecast outturn has a number of technical adjustments relating to critical care where the number of excess bed days has increased and therefore reporting a mitigated position. A year-end financial agreement has now been finalised with the Trust in which a number of financial challenges were agreed in favour of Croydon CCG. Please note that these adjustments have not been applied and will be reported in the frozen SLAM. The A&E price differential relating to the Edgecombe Unit activity was 2k in favour of Croydon CCG and it was agreed that an audit was no longer required as coding had been consistent for over a year and therefore did not constitute a coding and counting challenge. A Community funding claw back was also agreed for the COPD and Cardiology services where evidence had not been provided by the Trust as to where the additional funding had been spent. It was agreed that both CCG and CHS teams would work together in year to review the services. The excess bed day challenge was also upheld where there were a number of data quality issues and the Trust had altered the discharge date which was affecting the length of stay. A&E- SLAM is reporting a mitigated over performance of 1.2m. The highest spend continues in Emergency Medicine; Category 2 Investigation with Category 4 treatment. Electives (including day cases)-there is continued under performance in electives ( 774k) mainly relating to day case activity. A number of procedures remain under plan including Female Reproductive System ( 239k), Orthopaedic Non-Trauma ( 293k) and Mouth, Head, Neck and Ear procedures ( 14k). Module Finance & Activity 1
11 Croydon Health Services Finance Drugs and Devices- Drugs and devices are over performing by 127k; this is an improved position from last month as the Trust have corrected the NHSE drugs challenge for month 9 and 1 as they should not have been charged to the CCG. Outpatients- Outpatient first attendances ( 1m) procedures ( 648k) and follow ups ( 291k) are approximately 1.9m over plan. The Trust have transferred activity and finance from the non- elective non-emergency (NELNE) POD into the outpatient POD under EDGE and therefore causing the increase. This relates to Edgecombe Unit activity. Critical Care -Critical Care is under performing by 775k as the long stay critical care patient costs at 5 organs supported have been removed. The arbitration ruling in quarter 1 confirmed that the maximum number of organs to be applied was 3 and as such the CCG have adjusted in the costs. The year-end financial agreement also confirmed that the critical care audit would go ahead however the results would not impact the 16/17 position and would only be used to inform actions in 17/18. Direct Access-The SLAM position states an over performance of 181k mainly in direct access pathology tests as there was a problem with the data feed last month which has now been corrected; the Trust have matched actual with plan to compensate for the under reporting. Maternity Pathway- The maternity pathway is under performing by 522k. Antenatal is under plan however postnatal activity at CHS has increased. The Trust have also put in a one line adjustment for the maternity pathways which were not previously billed in months 1-3 however this is being challenged as the data has been frozen and the year-end agreement reached. Module Finance & Activity 11
12 Croydon Health Services Activity Outpatients (OP Attendances - Outpatient 1st & Follow Up (inc Procedures) by source) All Types GP C2C Other OP 1st OP 1st OP 1st OP 1st OP 1st OP 1st OP 1st OP 1st OP FU OP FU OP FU OP FU OP FU OP FU OP FU OP FU Activity (Total activity by POD) A&E (all types) Emergency Non-Elective Non-Emergency Elective
13 St. George s Healthcare Finance % Year to Date - Finance (over) / under Year to Date - Activity (over) / under CCG Adjusted Plan YTD Actual YTD Variance to CCG Plan Variance movement CCG Adjusted Plan Actual Variance ' ' ' % ' % Elective 5,32 4, % 3,742 3, % Emergency 5,521 5, % 2,4 2, % Non-Elective % % A&E 1,27 1,4 23 2% 7,97 7, % Out Patient 1st 1,199 1, % 6,397 6, % Out Patient Follow Up 1,59 1, % 15,156 16,519-1,363-9% Out Patient Procedure 85 1, % 3,536 4,593-1,57-3% Critical Care 1,73 1, % 1,63 1, % Direct Access % 4,331 5, % Drugs & Devices 966 1, % % Maternity Pathway 1,23 1, % % Unbundled Diagnostics % 3,52 3, % PTS % % Other % % CQUIN % % Total 2,752 21, % 48,258 52,834-4,576-9% % Forecast Outturn - Finance 22,638 23, % Croydon CCG at St. Georges is over performing on plan by 67k in month 11 with a forecast out turn of 59k which is an improved position following quarter 2 and quarter 3 reconciliation adjustments being applied. A year end settlement is no longer being considered as the Trust is committed to a year-end position which limits any room for negotiation. Over performance continues in outpatient activity which is approximately 58k over plan (year to date). Firsts and follow ups have seen a slight increase on the previous month impacted by the reduced plans for QIPP with increases seen in diabetic medicine, neurology, and ENT; unrealised QIPP and reduced plans in growth are also contributing to this position. Cochlear rehabilitation and assessments continue as the main areas seeing increases; additional clinics have ceased therefore the increases should not be seen, however discussions with the clinical lead have identified that coding has historically been poor for this service which may have contributed to previous under reporting. Clarification has been sought if this activity is specialist as it is carried out at a specialist centre however it has been identified that only the cochlear devises are NHSE funded and the budget for outpatient activity sits with the commissioner. Maternity is over performing by 22k with deliveries above plan by 74k (26 patients) and antenatal and post-natal activity over by 173k (167 patients). Croydon Health Services is also seeing a corresponding decrease in normal deliveries and antenatal activity however postnatal activity continues to increase. Non- Elective activity continues to over due to excess bed days and Vascular and T&O activity. Drugs and Devices are 13k over plan mainly due to Continuous Positive Airwaves Pressure (CPAP) devices. Elective activity is 33k (mitigated) below plan driven by T&O ( 3k) with high cost reconstruction procedures less than plan. The Trust has suggested that this could be partly affected by the recording of activity. The Trust has advised that they are making a concerted effort to recruit more coders in order to improve recording. The RTT backlog continues with reinvestment in penalty monies (1% of contract from September) to fund the remedial action plan; this has been apportioned between commissioner, NHSE and the Trust. Critical Care continues to over perform however is reflecting an in month improved positon ( 96k) as the Trust is no longer adjusting for not yet discharged (NYD) critical care activity to reflect the NHSE share as the Trust are now flagging in the SLAM. Module Finance & Activity 13
14 St. George s Healthcare Activity Outpatients (OP Attendances - Outpatient 1st & Follow Up (inc Procedures) by source) All Types GP C2C Other OP 1st OP 1st OP 1st OP 1st OP 1st OP 1st OP 1st OP 1st OP FU OP FU OP FU OP FU OP FU OP FU OP FU OP FU Activity (Total activity by POD) A&E (all types) Emergency Non-Elective Non-Emergency Elective Module Finance & Activity Interactive Activity Dashboard Available at: 14
15 King s College Hospital Finance Year to Date - Finance (over) / under Year to Date - Activity (over) / under CCG Adjusted Plan YTD Actual YTD Variance to CCG Plan Variance movement CCG Adjusted Plan Finance YTD Actual Variance ' ' ' % ' % Elective 2,99 2, % 1,888 2,228 1, % Emergency 5,59 4, % 2,993 2,236 1, % Non-Elective % % A&E 1,123 1,73 5 4% 468 7,937 7, % Out Patient 1st % 47 5,4 4, % Out Patient Follow Up 1,491 1, % 1,179 15,197 14, % Out Patient Procedure % 54 2,226 1, % Critical Care 863 1, % % Direct Access % 26 22,535 2,295 2,24 1% Drugs & Devices 929 1, % 574 1,23 1, % Maternity Pathway 2,66 2, % 2,558 1,683 1, % Unbundled Diagnostics % 85 2,723 2, % PTS % -133 % Other % 585 8,6 22,338-14, % CQUIN % 265 % Total 18,79 18,41 38 % 11,534 71,963 82,75-1,787-15% % Forecast Outturn - Finance 19,722 19, % 7 Context: For 216/17 the CCG has agreed a cost & volume contract with Kings and reduced the levels of activity from the Trust s proposal in agreeing contract plans. Month 11 Finance & Activity Position The tables and graphs show the year to date service level agreement monitoring (SLAM) position by point of delivery (PoD) for finance and activity to show the underlying contractual position. Seasonality used at M11 is.3% on top of the straight line forecast for all activity related PODs. This has reduced from.6% at M1 as we get closer to the end of the year and Kings capacity restraints continue. Bar charts show the percentage variance against the year to date finance and activity plans across all PoDs. Further analysis for four PODs are provided to show the 216/17 The M11 SLAM position identifies the following points of interest: The recurrent underlying position (and the contractual underlying position) at M11 has improved and is 38k/.2% under plan compared to 17k/.6% over plan at M1. This improvement in position is driven by a number of PODs but predominately Critical Care and Drugs and Devices. Critical Care is over performing and at M11 is 164k/19.% over plan compared to 26k/26.2% over plan at M1 noting that performance within Critical Care is subject to fluctuations. This change is driven by a decrease in over performance for patients requiring 4,3 and 3 organs supported. Emergency activity continues to under perform and at M11 is 241k/4.8% under plan compared to 234k/5.1% at M1. Underperformance is predominately within Digestive System Procedures and Disorders. Module Finance & Activity 15
16 King s College Hospital Finance The Maternity Pathway is over performing at M11 by 368k/14.1%, a slight improvement compared to 344k/14.5% at M1. Over performance is particularly seen within normal deliveries, with and without complications, and with Post-partum Surgical Intervention. KCH reported significantly low activity levels in Q1 215/16 which resulted in the 216/17 plan set below actual levels. We continue to monitor the implementation of the Badgernet system with the Trust and are working with them to ensure accurate recording. The Non-Elective POD is over performing by 79k/33.4%, an improvement from the M1 position ( 83k/38.7%). The main driver of Non-Elective over performance is Neonatology (Minor Neonatal Diagnoses - 18k/78.2% over plan). This is due to the reporting issues at the beginning of 15/16 leading to a lower baseline in the 16/17 plan and has been resolved. The level of over performance in Drugs and Devices ( 118k/12.7%) has improved since M1 and is still driven by Percutaneous Valve Replacements ( 93k) and also Cytokine Modulators ( 42k). Explanations have been provided by the Trust and shared with CCG colleagues, we have also identified that actuals for Cytokine Modulators are in line with 15/16 and are reviewing with the Trust as to whether this is a planning issue. Outpatient 1st are now over performing by 7k/.9% compared to 19k/2.6% over plan at M1. Over performance is predominantly within Gynaecology ( 16k) and General Surgery ( 16k). Elective activity is underperforming by 421k/14.1%, compared to 349k/12.9% at M1. The Trust continues to work to reduce its RTT elective backlog, with an option being actively pursued to in house and employ external companies. Challenges The CSU is running monthly challenge processes to ensure the integrity of data. For M1-1, challenges have been raised for misattributions and a consolidated Q2 process has been completed and the final Q2 reconciliation figures are reflected in the M1 position. The Q3 reconciliation is almost complete, with a few outstanding areas to be finalised. Module Finance & Activity 16
17 King s College Hospital Activity Outpatients (OP Attendances - Outpatient 1st & Follow Up (inc Procedures) by source) All Types GP C2C Other OP 1st OP 1st OP 1st OP 1st OP 1st OP 1st OP 1st OP 1st OP FU OP FU OP FU OP FU OP FU OP FU OP FU OP FU Activity (Total activity by POD) A&E (all types) Emergency Non-Elective Non-Emergency Elective Apr May Jun Jul Aug Sep Oct Nov Dec Jan Feb Mar Apr May Jun Jul Aug Sep Oct Nov Dec Jan Feb Mar Apr May Jun Jul Aug Sep Oct Nov Dec Jan Feb Mar Apr May Jun Jul Aug Sep Oct Nov Dec Jan Feb Mar Module Finance & Activity Interactive Activity Dashboard Available at: 17
18 Epsom & St. Helier Finance Year to Date - Finance (over) / under Year to Date - Activity (over) / under CCG Adjusted Plan YTD Actual YTD Variance to CCG Plan Variance movement CCG Adjusted Plan Actual Variance ' ' ' % ' % Elective 1,15 1, % 1,293 1, % Emergency 1,696 1, % 998 1,1-3 % Non-Elective % % A&E % 4,32 4, % Out Patient 1st % 3,94 3, % Out Patient Follow Up 1,98 1,91 7 1% 11,114 11, % Out Patient Procedure % 1,3 1, % Critical Care % % Direct Access % 57,85 42,283 15,567 27% Drugs & Devices % % Maternity Pathway 1,154 1, % % Unbundled Diagnostics % 1,497 1, % PTS % % Other % % CQUIN % % Total 7,588 8, % 81,952 67,517 14,435 18% % 8,278 9, % Trust wide SLAM reported performance as at M1 YTD is 8m over plan. This is based on activity out turn year to date and does not reflect the block contract break even position. SLAM reported YTD over performance of 588k (579k mitigated). The key PODs responsible for the overall increased variance from plan are NEL (94k), Emergency (94k) and Electives (63k). The NEL POD is driven by: NELNE - 131k over plan YTD. The main drivers of over performance are reported under Nervous System Procedures and Disorders and Obstetrics medicine NELXBD - 19k over plan YTD, driven by patients admitted for Digestive System Procedures & Disorder and Orthopaedic Non Trauma. The Elective over performance is driven by Urological procedures, Orthopaedic Non Trauma and Musculoskeletal Disorders. Separately reported, the South West London Elective Orthopaedic Centre (SWLEOC) is over performing by 31k. Electives is the main driver for the over performance and is driven by musculoskeletal disorders ( 39k), and Reconstruction Procedures category 3 without CC ( 94k) 18
19 Epsom & St. Helier Activity Outpatients (OP Attendances - Outpatient 1st & Follow Up (inc Procedures) by source) All Types GP C2C Other OP 1st OP 1st OP 1st OP 1st OP 1st OP 1st OP 1st OP 1st OP FU OP FU OP FU OP FU OP FU OP FU OP FU OP FU Activity (Total activity by POD) A&E (all types) Emergency Non-Elective Non-Emergency Elective Module Finance & Activity Interactive Activity Dashboard Available at: 19
20 Moorfields Eye Hospital Finance Year to Date - Finance (over) / under Year to Date - Activity (over) / under CCG Adjusted Plan YTD Actual YTD Variance to CCG Plan Variance movement CCG Adjusted Plan Finance YTD Actual Variance ' ' ' % ' % Elective 2,135 2, % 2,126 2, % Emergency % % Non-Elective % % A&E % % Out Patient 1st 1,224 1, % 9,956 1, % Out Patient Follow Up 1,427 1, % 16,765 17,97-1,142-7% Out Patient Procedure 1,762 2, % 11,823 14,152-2,329-2% Critical Care % % Direct Access % % Drugs & Devices 1,617 2, % 1,963 3,54-1,91-56% Maternity Pathway % % Unbundled Diagnostics % % PTS % % Other % % CQUIN % % Total 8,293 9,848-1,555-19% 44,616 49,478-4,862-11% % Forecast Outturn - Finance 9,47 1,744-1,697-19% Whilst the table above shows a 1.555m overspend Year To Date based upon SUS, the position reflected in SLAM is a 1.35m overspend. The SLAM value reflects the contract value negotiated with the Trust. Elective is over-performing by 232k. An analysis of SLAM shows that this is being driven by over-performance for cataract procedures. The M11 position for all Providers shows that 2,112 cataract procedures have been undertaken (BZ2Z). The M11 position for 215/16 was 1,971 procedures and the M11 position 214/15 was 2,216 procedures. Whilst Moorfields appear to be over-performing, the overall level of activity across all Providers remains broadly consistent over that three year period. What is notable is that there has been a continued reduction in such procedures being carried out by BMI, whereby 275 have been undertaken Year To Date but 461 had been undertaken by M11 in 214/15. Outpatient procedures are over-performing by 316k. SLAM shows that this is mostly driven by Minor Vitreous Retinal Procedures (BZ23Z). Approximately 2/3 of that over-performance was undertaken with the Glaucoma sub-specialty. Drugs and devices is over-performing by 722k and relates mostly to Eylea injections, which is a treatment for Age-Related Macular Degeneration (AMD). Module Finance & Activity 2
21 Moorfields Eye Hospital Activity Outpatients (OP Attendances - Outpatient 1st & Follow Up (inc Procedures) by source) All Types GP C2C Other OP 1st OP 1st OP 1st OP 1st OP 1st OP 1st OP 1st OP 1st OP FU OP FU OP FU OP FU OP FU OP FU OP FU OP FU Activity (Total activity by POD) A&E (all types) Emergency Non-Elective Non-Emergency Elective Apr May Jun Jul Aug Sep Oct Nov Dec Jan Feb Mar Apr May Jun Jul Aug Sep Oct Nov Dec Jan Feb Mar Apr May Jun Jul Aug Sep Oct Nov Dec Jan Feb Mar Apr May Jun Jul Aug Sep Oct Nov Dec Jan Feb Mar Module Finance & Activity Interactive Activity Dashboard Available at: 21


22 South London and Maudsley (SLAM) Overview Commissioners Update A&E breaches are now a standing item at the monthly A&E Delivery Board. SLaM has produced an action plan to manage breaches. The CCG is working with both CHS and SLaM to understand the drivers behind patients presenting to A&E for Mental health Crises. Commissioners Update. The CCG continues to work with SLaM and Adult Social Care partners to understand the Acute Care pathway and unblock any areas that are affecting discharge of patients. The number of bed days lost due to Delayed Discharges is reducing as a result of the work being carried out. PbR Cluster Costs Year to Date M11 Care Plan In Place Percentage of patients on CPA with a care plan in place (CPA care plan / Support & Recovery Plan / Inpatient Care Plan e.t.c) Patients on CPA with Care Plans % of patients offered a copy of their care plan (Target for all - 95%) Mar 16 Apr 16 May 16 Jun 16 Jul 16 Aug 16 Sep-16 Oct-16 Nov-16 Dec-16 Jan-17 Feb-17 On Target? CAMHS CAMHS 1% LD MHOA AMH LD MHOA AMH Commissioners Update SLaM do not currently charge activity as PBR, they are working to be in a position when they will. Toward this, they are coding activity as if it would be PBR, so that coding process is in place going forward. The tables show the costs for the number of days in each cluster and the highest spending clusters. The CCG are working with SLaM to understand timescales of the cluster work. Commissioners Update No issues to report. 22
23 South London and Maudsley (SLAM) Overview Commissioners Update Croydon Occupied Bed Days (OBDs) & Psychiatric Intensive Care Unit (PICU) OBDs February 217, In February, AMH & PICU OBDs activity continues to reduce, as a result of CCG & SLaM actions to reduce OBDs. AMH triage has shown minor variance.. AMH EI activity has been high but has been reducing since Oct16. CCG commissioners have queried the reasons for this spike through the contract query route and expect more detail in the next commissioner s questions response. The CCG continues to work with the provider to reduce delayed transfers of care and improve discharge planning processes which are impacting on Acute OBD activity. 23

24 South London and Maudsley (SLAM) Overview AMH Teams Combined Waiting Times CAMHS Teams Combined Waiting Times MHOA Waiting Times LD Waiting Times Mar 16 Apr 16 May 16 Jun 16 Jul 16 Aug 16 Sept 16 Oct 16 Nov 16 Dec 16 Jan 17 Feb Mar 16 Apr 16 May 16 Jun 16 Jul 16 Aug 16 Sept 16 Oct 16 Nov 16 Dec 16 Jan 17 Feb Mar 16 Apr 16 May 16 Jun 16 Jul 16 Aug 16 Sept Oct 16 Nov 16 Dec 16 Jan 17 Feb Mar 16 Apr 16 May 16 Jun 16 Jul 16 Aug 16Sept 16 Oct 16 Nov 16 Dec 16 Jan 17 Feb 17-6 Weeks 6-18 Weeks 18+ Weeks - 6 Weeks 6-18 Weeks 18+ Weeks - 6 Weeks 6-18 Weeks 18+ Weeks - 6 Weeks 6-18 Weeks 18+ Weeks AMH Teams are: Croydon Adult ADHD, Croydon Personality Disorder Service - SUN Project, MAP Assessment Liaison East Croydon, MAP Assessment Liaison Mayday, MAP Assessment Liaison New Addington/Purley, MAP Assessment Liaison Thornton Heath/Woodside, CIPTS Treatment, Reablement Service (Croydon), MAP Croydon East Treatment, MAP Croydon West Treatment, Inaptient Liaison croydon University Hospital, Outpatient liaison croydon University Hospital, Croydon Adult Perinatal CMHT, Promoting recovery New Addington & Purley (Croydon), Croydon Medication Support Service. CAMHS Teams are: CAMHS (Croydon), CANS (Croydon), SEaDS, Croydon LAC Team, Croydon Youth Affending, MHOA Teams are: Croydon Care Home Intervention Team (Older Adults), Chelsham House - Bethlem, Croydon Memory Service (Older Adults), Liaison Psychiatry - Croydon (Older Adults) LD Teams are: Croydon MHLD Psych Service Commissioners Update No issues to report. 24
25 South London and Maudsley (SLAM) Overview National Targets Croydon Dementia Target achievement M11 February 217 Early Intervention Psychosis M11 February 217 Jun % Apr-16 5% Jul % May-16 % Aug % Jun-16 82% Sep % Jul-16 6% Oct % Aug-16 83% NHS England National Target 66.7% Nov % Sep % YTD Dec % Oct-16 66% Jan % Nov-16 75% Feb % Dec % Jan-17 8% Feb % Commissioners update: DiaDem continues to be promoted with support from the variation team,. The target for yearend has been achieved and two practices remain omitted from the official dataset which will increase the diagnosis rate by approx. a further 1.5%. The prevalence will change next year which will result in a drop in the April figure a recovery plan will be in place. Avg.63% Commissioners update: The service and performance continues to be monitored at a 4 borough level. The service missed the December target by one patient but remains compliant per rolling quarter and year to date, and has returned to compliance in January with 7 of out the 8 eligible referrals receiving a service within 2 weeks of referral. Caseloads remain high and a paper is being developed by the provider to consider when caseloads may affect compliance with national standard. In addition, the full range of NICE standards have been nationally audited through self-assessment and the results will highlight any gaps in individual teams. This report, once available, will inform a gap analysis to fully understand any and the impact of service gaps in Croydon. 25
26 IAPT Psychological Therapies and Wellbeing Service Overview Access The service has now a revised trajectory of 1.75% for the year, which has been achieved with a final position of 11.3% access reached and the service supporting 4,66 people over the 216/17 year. Access Apr May Jun Jul Aug Sep Oct Nov Dec Jan Feb Number of people entering treatment Percent monthly access rate (target 1.25%) Annualised percent access run rate (target 15% - for the given month) 1.21 % % 1.13%.83%.89%.94%.75%.68% 1.11%.88% 1.8%.9% 13.58% 9.97% 1.68% 11.28% 9% 8.16% 13.32% 1.67% 13% 1.8% Recovery The recovery rate in February was 43.44%, the year to date rate is now at 46.76%, and the service will not achieve the 5% at year end. The recovery rate will be closely monitored next year for improvement. The staff team is currently being restructured ahead of a new service model commencing in April 217 and this could impact recovery rates for M1 and M2 in the 217/18 financial year. The providers clinical team have held an away day with clinical staff to focus on recovery and improving the rate. The away day reviewed their current process against best practice. Two outcomes that will now be implemented are the service trialling in an Opt In process to ensure people accessing services are most likely to complete a course of treatment and reduce DNA s, and introducing greater flexibility to discharging patients nearer but not yet achieving recovery. Access Apr May Jun Jul Aug Sep Oct Nov Dec Jan Feb Number of people moving to recovery Recovery target 5% 5% 5% 5% 5% 5% 5% 5% 5% 5% 5% Recovery actual (%) 54.8% 48.% 48.5% 4.2% 42.77% 43.94% 51.15% 47.96% 44.91% 45.8% 43.44% Waiting times The Croydon service is currently achieving all national RTT waiting time targets. For those entering treatment this month, 98% were seen within 6weeks (target 75%) and 1% seen within 18weeks (target 95%). For patients who completed treatment (discharged) this month, 1% of patients were seen with 18 weeks (target 95%), and 95% of patients with 6weeks, (target 75%) 26


27 Finance Summary of key drivers, commissioning and contractual actions Performance issue Action taken Outpatients First - The most significant shift in M11 is the move of General Medicine from one of the top three areas of over performance in M1 to the highest underperforming speciality in M11. This is due a change in POD recording by the Trust for Edgecombe Unit activity and will be resolved in month 12. Aside from this, high over performing specialities remain constant as Cardiology, Cardiac Rehabilitation and T&O. The vast majority of the over-spend for these specialties is at CHS. Planned care and variation team colleagues continue to share referral rates by networks and practice. Variation visits to practices are being undertaken with all practices over the median having now had a visit and action plan. The CCG now beginning review visits of practices that have not had significant improvement. Cardiology: areas where care pathways have been developed include managing patients in primary care where appropriate. These have demonstrated a reduction in firsts when sorted by clinic code. Further work needed to establish which clinics are overperforming and would benefit from further redesign. 27
.")
28 Finance Summary of key drivers, commissioning and contractual actions Performance issue Action taken Outpatients Follow up - Outpatient follow ups continue to overperform in Neurology, and Diabetic Medicine; with a significant shift being seen again in General Medicine due to changes in POD recording for Edgecombe unit (to be resolved M12). The vast majority of this is at CHS; this Provider alone reported overspends of 111k, and 61k respectively. Proposals for service transformation reduction include consultant-delivered outpatient epilepsy follow-ups. This is being finalised with an aim to reduce neurology activity seen in secondary care and the type of follow up that takes place. Work continues with the Intermediate Diabetes service to reduce inappropriate follow ups taking place within the acute setting. Module Finance & Activity 28

29 Finance Summary of key drivers, commissioning and contractual actions Performance issue Commissioning action A&E - A&E is over-performing by 5% in terms of activity and 11% in terms of financial spend at M1. VB4Z -Category 2 investigation with category 4 treatment and VB7Z Category 2 investigation with category 2 treatment continues to be the top 2 overperforming HRG since M1 The change to coding and counting has been challenged under the year-end financial review and has resulted in a favourable 2k challenge. Please note monthly figures reflect accumulative YTD position Module Finance & Activity 29

30 Finance Summary of key drivers, commissioning and contractual actions Performance issue Action taken Elective - The top 3 over-performing HRG chapters for electives continue to be Urological and Male Reproductive, Cardiac procedures and Haematological Disorders. Cardiac procedures This is mainly at CHS and continues to be driven by EA5Z - Pace 2 - Dual Chamber and EA29Z - Complex Ablation (includes Atrial Fibrillation or Ventricular Tachycardia); together these contribute 167k of the over-spend. Urological and male reproductive system continues to be over-performing HRG chapter in M11 YTD. This disorder includes cystoscopies which are conducted mainly at CHS. A recent audit shows that cystoscopies are conducted aligning to CHS agreed protocols. Where relevant procedures are being reviewed against the ECI policy to ensure adherence to the present policy and tightening of policies where appropriate Cardiac Procedures: The Echocardiogram rise is attributed to CCG mandated cardiology pathways, specifically arrhythmia. A review of the echo element of arrhythmia pathway is underway with CCG clinical Lead and provider, connected to review of anti-coagulation pathway. Actions are in place to address PCI over performance as part of service redesign including promotion of medical rather than interventional management. Urology & Haematology: Where relevant, procedures are being reviewed against the ECI policy to ensure adherence to the present policy and tightening of policies where appropriate Module Finance & Activity 3

31 Finance Summary of key drivers, commissioning and contractual actions Performance issue Action taken Emergency A number of HRG s continue to over perform such as DZ Thoracic Procedures and disorders and Paediatric Medicine. Initial investigation does not suggest a coding and counting change. A new clinical pathway for management of pneumonia has been implemented in CUH, and the CCG lead is undertaking a deep dive with support from CSU to ensure that the trust is adhereing to this pathway. An audit is being completed to establish whether admitted patients received pneumococcal vaccination from their GP. Contact is also being made with Wandsworth CCG to identify any further service redesign opportunities. Module Finance & Activity 31

32 18 Week Analysis 18 week pathways - The 18 week pathways reports on the average wait times and the number of patients seen within the 18 week pathway at specialty level. Any specialty of note or concern has been highlighted in order to provide Croydon CGG with an updated position. In general across all specialities 92.4% of patients are seen within 18 weeks; this remains above the 92% target. The trend has gradually been reducing. The Trust has been requested to submit a plan to the CSU Performance team including a trajectory for improvement, which the CSU has received a trajectory plan with regards to clearing the existing backlog. Waiting times have remained relatively stable across this timeframe, albeit increasing from 6.99 weeks in M8 to 7.92 in M9. M11 reported average of 7.3 weeks ENT - This speciality failed to meet the 92% target for the number of patients seen within 18 weeks; performance has worsened each month since March 216, standing at 79.64% in M11. Average wait times for the speciality decreased compared to M1 to 1.9 weeks; this is the second time this year that it has improved in-month. There are known backlog issues in the RTT activity resulting in a decrease in the proportion of patients seen within 18 weeks; the speciality has an action plan in place to improve performance and is monitored at weekly performance calls 32


33 18 Week Analysis Gynaecology - This speciality has failed to meet the 92% target for the number of patients seen within 18 weeks; and this month continues to see a stabilisation in performance. In M % of patients were seen within 18 weeks, and this figure increased to 89.81% in M8. The speciality has an action plan in place to improve performance. Wait times has also improved compared to M1. The average wait time for M11 was 6.82 weeks. This is the second time YTD that the average waiting time has been under 7 weeks T&O - The speciality failed to meet the 92% target, with deterioration in performance seen in M1 compared to M11; in M11, 76.73% of patients were seen within 18 weeks, whilst 76.74% of patients were seen within 18 weeks in M1. The performance has seen a downward trend throughout Waiting times have decreased to 9.85 weeks in M11, from weeks in M1. The speciality has an action plan in place to improve performance and the CCG continues to review pathways. 33
34 Finance and Activity Operating Plan The operating plan is generated using different assumptions to the contract plan. These assumptions apply to all providers across the country and are mandated by NHS England, whereas the contract plan assumptions take into account local variations. There is therefore variance between reported performance against the contract plan which is included in the remainder of this Integrated Report and the Operating Plan. Variances include: Planning Assumptions reasons for variation between operating plan and contract plan Operating Plan assumptions Contract (SLAM) Plan assumptions Basis Admitted, Non admitted and OP data items from SUS. SUS SEM, prepopulated with Nationally processed data and automatic FOT based on 3 year rolling average. This covered the period of poor data due to the Cerner implementation. OP activity counted as Firsts and Follow up, not split out to OPPROC or other PODs identified separately in SLAM. Based on 215/16 M6*2 for majority of Providers All data items at POD level Providers All Providers Contracted Providers only Growth As per locally agreed For OP, NHSE requested for higher growth to be submitted than locally planned for. As per locally agreed at contract signing; CHS growth included desired repatriation levels; Limitations applied due to financial constraints on over 5m contracts; No growth or seasonality available to contracts under 5m QIPP All QIPP QIPP as agreed at contract signing (much less than total planned by commissioners) Other planning assumptions Submission timings of activity reviews against plan Planned increases included for CHS Edgecombe Unit activity, Cancer MDT data to start flowing to SUS, increase in Two week wait referrals. Submissions in line with National Timetable CHS Increase in two week waits taken from growth; CHS Edgecombe Unit activity excluded (assumed to be covered by existing Emergency spells and Outpatient attendances) with contract variation expected once activity and cost agreed; CHS Cancer MDT included with contracted activity; CHS Radnet Outpatient activity excluded as cost neutral in 216/17; Agreed chargeable Service Development activity included As per contract negotiation process Module Finance & Activity 34
35 Finance and Activity Operating Plan Monthly 216/17 Activity Plan Specific Acute Activity Current month: Dec-16 Year to Date 16/17 16/17 Plan Actual Variation actual v plan (#) Variation actual v plan (%) Plan growth over same period last year Actual growth over same period last year Plan growth as proportion of 15/16 FOT Actual growth as proportion of 15/16 Actual Annual planned growth Total Referrals 89,481 96,5 6, % -6.%.9% 7.8% 74.8% -3.2% Total OPD Attendances 316, ,39 18, %.% 5.8% 74.5% 79.%.2% 1st OPD Attendances 88,478 93,264 4, % 4.8% 1.5% 77.5% 81.% 4.5% Follow Up OPD Attendances 228, ,775 13,56 5.9% -1.8% 4.1% 73.4% 78.3% -1.4% Total Elective Admissions 27,56 27, % 1.1% 2.6% 75.7% 76.9% -.2% Ordinary Elective Admissions 4,643 4, % -2.8% 3.2% 73.5% 77.3% -3.8% Day Case Admissions 22,863 22, % 1.9% 2.4% 76.2% 76.8%.5% Total Non-Elective Admissions 28,47 27, %.4% -1.9% 74.7% 73.1% -.9% A&E Attendances excl. planned follow ups 1,152 14,258 4,16 4.1%.5% 4.6% 77.% 77.1%.5% Referrals- There has been a steady reduction in referrals from month 6-9. Month 9 shows a 2% reduction in referrals compared 215/16. Improvements need to be sustained in order to meet the revised trajectory. Focused work with GP practices and networks from September through to December has taken place, to review referral data. This work has highlighted variation across practices. Outpatient Attendances- Increase in referrals for ; Gynae 1.2%; Gastroenterology.9%; Colorectal.8%; T&O 1.4%;. Urology.7%; Ophthalmology and Screening Service Referrals.9%. A number of actions are being taken forward in the specific areas. For example the increase in Ophthalmology referral s from the Diabetic screening service has led to an increase in OP laser activity and procedures for cataracts. The CCG has conducted an audit of Moorfields cataract and laser activity. From the audit it was identified that 4% of cataract procedures would not meet the refreshed POLCE threshold which will be signed off in January 217 to commence from 1 st February 217. A&E-A&E is over plan, however, the MIU contract is underperforming against plan, and UCC activity is also lower than expected. Variance in cost is greater than activity; this is being picked up contractually. Croydon had a high proportion of ambulance calls that resulted in conveyances to ED. Current actions being taken are to review and extend scope of MIU to include minor illness. Module Finance & Activity 35
36 Community Community Croydon CCG Integrated Report Croydon CCG Integrated Report 36

37 Community (Block Contract) Overview Module Community 37

38 Community (Block Contract) Overview Module Community 38
39 Community (Block Contract) Commentary Adult Services Adult services reported an overall under-performance of 4,58 against the year to date (YTD) plan of 346,246 in activity. Key areas with significant under and over-performances in activity are as follows: Adult Community Nursing - CITMS continues to report an under-performance at 24.7% in activity, 435 under the YTD plan of 1, HV for Elderly reports an under-performance of 12.4% in activity Adult Therapy Services - Podiatry reports an under-performance of 5.1% in activity, 1,791 under the YTD plan of 34, Dietetics reports an over performance of 8.4% in activity, 173 over the YTD plan of 2,52. This has significantly reduced from M1 which showed an over performance of 13.6%. - CIMS is reporting an under-performance in activity by 8.8% - Wheelchair services under-performed by 29.7%. The wheelchair service has had major issues with staffing levels and changes. - Adult SALT over-performed in activity by 11.2%. Learning Disabilities - Learning Disability continues to report an under-performance of 18.6%, 1,397 below the YTD plan of 7,517. Rehabilitation & Independent Living Services - CICS over-performed by 974 in activity against the YTD plan, this is the equivalent of 5.6%. - Community Neuro-rehabilitation is under performing by 6.%. - Rehab Consultant reports an under performance of 34.1%, an increase of 4.8% on M1. Children Young People & Families Services Children s services are below plan at M11 in terms of activity; 3,326 below the YTD plan of 6,465, this equates to 5.5%. Key areas with significant under and over-performances in activity are as follows: Specialist Community Health Services - Rainbow Homeless Health reported an under-performance of 12.5%, 978 below the YTD plan of 7,831. The service receives their referrals from Migrant Helpline via the Home Office thus have no control over the numbers of asylums seekers that are referred to the service. Universal Children s Services - Special Schools Nursing reported an over-performance of 1.5%. Children s Specialist Services - Children s Hospital at Home (CHAH) report an under-performance of 4.7%; 378 under the YTD plan of 8,31. The CHAH diabetes service is down due to staff vacancies, staff on training and annual leave. The Diabetes team also use Cerner to capture contacts when the child is at CUH and if attending MDT or Nurse led clinics. - Children Medical Services report underperformance of 12.5%. - Paediatric Diabetic Children report under-performance of 13.8%. - Paediatric Physiotherapy is under-performing by 25.%. 1,592 under the YTD plan of 6,363. Module Community 39
40 Community TACS Dashboard Domain Measure Service Lead Unit Apr 216 May 216 Jun 216 Jul 216 Aug 216 Sept 216 Oct 216 Nov 216 Dec 216 Jan 217 Feb 217 Single Point of Assessment Rapid Response Number of referrals Referrals No of advice/signposting episodes # Total number of patients referred to Rapid Response Service each month Referrals Percentage of urgent referrals seen within 2 hours of acceptance of the referral by the clinician Referrals 96% 95% 98% 99% 98% 99% 97% 93% 96% 95% 98% Percentage of referrals resulting in hospital admission % 18% 19% 17% 24% 18% 2% 16% 13% 14% 13% 24% Integrated Bed Support Number of admissions to step up bed Patients Number of admissions to step down bed Number of discharges Average length of stay Days 16 days 16 days 12 days 13 days 16 days 13 days 13 days 14 days 16 days 15 days 14 days Occupancy- Average% over the month % 97% 92% 79% 94% 9% 93% 86% 91% 91% 91% 82% Enhanced Case Management Percentage attendance by the named community matron for the network at the MDT Meeting % 79% 87% 68% 65% 61% 67% 73% 49% 57% 54% 55% Percentage attendance by a community matron at the MDT Meeting % 7% 1% 19% 2% 14% 21% 24% 37% 37% 46% 4% Average length of stay on caseload Bed days 15 days 65 days 16 days 387 days 195 days 98 days 66 days 13 days 99 days 5 days 14 days Total Number Discharged Patients No of Patients with Care Plan and Escalation Plan in Place Patients No of Patients Discharged with Self-Management Plan Patients Total number of new patients (per month, per year) Patients No of Patients on Caseload for Over 9 Days Patients Module Community 4
41 Community TACS Commentary Single Point of Access Referrals to Single Point of Access decreased for the fourth consecutive month from 249 in M1 to 2346 in M11; the lowest amount received year to date. This is below the average number of referrals seen year to date (YTD). The number of patients signposted to other services decreased significantly in M11 to 78 from 17 in M1. Rapid Response The number of referrals received by the Rapid Response team in M11 decreased from 225 in M1 to 21 in M11. During M11, 98% of urgent referrals were seen within 2 hours of acceptance by the clinician. There is no real identifiable reason for decreases in referral numbers. There are differences between months due to number of days and number of weekends and bank holidays but however, there are continuous month on month increases but over the year as more referrals are received than that of the previous year. Intermediate Care Beds Of the twelve beds in the service 82% of the beds were occupied. 2 patients were admitted to Step Up beds and 22 patients were admitted to step down beds in M11. Average length of stay (ALOS) marginally had a slight decrease in M11 to 14 days from 15 days in M1. Enhanced Case Management A further 37 new patients were added to the caseload in M11. Attendance of the named community matron attending MDT meetings increased slightly to 55%.The Average length of Stay (ALOS) on the Community Matron caseload increased significantly in M11 to 14 days from 5 days in M1. The increase in data for the Community Matrons is due to data cleansing prior to the closing of EPEX. There is an increase in the LOS because several referrals for patients who have been on the caseload for over a year were closed during February. 41
42 Intermediate Planned Care Croydon CCG Integrated Report 42
43 Intermediate ENT Communitas Apr-16 May-16 Jun-16 Jul-16 Aug-16 Sep-16 Oct-16 Nov-16 Dec-16 Jan-17 Feb-17 YTD FOT Referrals Received Triage Intermediate ENT (both providersedec) Back to GP Secondary Care Audiology Patients seen at Communitas provider Firsts (Actual) Firsts (Planned) MRI (<1%) 6% 12% 7% 11% 4% 12% 9% 8% 13% 13% 15% 1% 1% CT (<3%) 5% 6% 5% 6% 4% 7% 7% 6% 7% 4% 1% 6% 6% Follow Up (Actual) Follow Up (Planned) Secondary Care % (Target <15%) 7% 5% 1% 1% 6% 13% 6% 7% 7% 1% 12% 8% 8% DNA Rate % (target <1%) 5% 5% 7% 9% 8% 9% 7% 6% 8% 7% 6% 7% 7% Waiting Times (4 Weeks) Activity-cost and volume PLANNED 17, , , , , , , , , , , , ,5. ACTUAL* 19,33. 2, , , ,34. 25, ,84. 28,73. 26, ,21. 25, , , *Financial sum includes First and Follow Ups only Croydon CCG Integrated Report 43
44 Intermediate ENT Communitas Activity The Provider triaged 496 referrals for M11 of which 8 were returned to GP, 17 were sent to Audiology, 14 onto secondary care and the remaining 331 were appropriate for the Provider. Although still above plan of 24 first appointments, M11 saw a decrease in first appointment activity from 245 in M1 to 21 in M11. Follow-up activity has increased for the second consecutive month to 124 in M11 compared to 113 in M1. Both M1 and M11 activity are significantly higher that the yearly trend. An explanation for this change in follow up levels will be sought from the provider. KPI performance: 1. Onward referrals to secondary care from the service have increased this month to 12% compared to M1 at 1%, but still remaining below the target threshold of 15%. 2. The percentage of MRI scans increased in M11 to 15% from 13% in M1. This is above the 1% performance target. 3. CT scans in M1 are at 1% which is in breach of the target threshold of 3%. The Provider explained that the percentage of MRI and CT patients is high as some scans are clinically needed to rule out certain conditions for Audiology patients, although this is not in keeping with low levels of audiology activity and therefore requires further clarity. 4. The percentage of patients who DNA their appointment remains below the KPI target of 1%, at 6% for M Waiting time into the service remains the same for the third consecutive month at 6 weeks. This is still above the contractual target of 4 weeks. The CSU will raise this with the provider.. Finance The FOT position projects that the Provider will be 67,51 over plan at year end. The CSU will continue to monitor this. 44
45 Intermediate Dermatology Communitas Apr-16 May-16 Jun-16 Jul-16 Aug-16 Sep-16 Oct-16 Nov-16 Dec-16 Jan-17 Feb-17 Total (YTD) FOT Referrals Received Triage (GPwSI) Intermediate Back to GP Secondary Care Firsts (Actual) Firsts (Planned) Procedures (Actual) Patients seen Procedures (Planned) Follow Up (Actual) Follow Up (Planned) Secondary Care % (Target <15%) 6% 8% 1% 8% 9% 1% 1% 8% 1% 8% 1% 9% 9% DNA Rate (<1%) 5% 6% 8% 9% 8% 6% 6% 7% 8% 7% 6% 7% 7% Activity PLANNED 37,667 37,667 37,667 37,667 37,667 37,667 37,667 37,667 37,667 37,667 37, , ,4 ACTUAL 45,699 46,541 44,426 42,84 29,53. 54,912 46,737 57,31 54,449 65,598 37,73 524, ,28 45
46 Intermediate Dermatology Communitas Activity 337 referrals were received in M11 of which 18 were returned to GP, 43 sent onto secondary care and the remaining 276 were appropriate for the Provider. There was a significant decrease in activity in M11, with first appointments reducing from 588 in M1 to 283 in M11(below plan of 329) and procedures at 54 in month 11 compared to 98 in M1 and against a plan of 84. Conversely, follow-up activity is above plan, with 241 follow-ups undertaken in M11; this is the highest number recorded year to date (YTD). An Audit on follow-ups requested vs. follow-ups carried out is due from the Provider. An explanation for activity changes this month will be picked up in the contract meeting. Performance 1. DNA s: The DNA rate has remained within the target threshold of <1% YTD. This was 6% for M Onward referrals: The Provider has continues to be below the performance threshold <15% YTD. Onward referrals from the service to secondary care for M11 are at 1%, this is after exemptions are taken into account. 3. Waiting times: The average waiting time is 2 weeks in M11. Finance The Provider is 594 under plan for M11. YTD actual is 524,359 against a plan 414,337 which means the service is over performing by 11,22. The CSU will continue to monitor this. Module Intermediate 46
47 Intermediate Gynaecology Triage/Telephon e Service Patients seen Apr-16 May-16 Jun-16 Jul-16 Aug-16 Sep-16 Oct-16 Nov-16 Dec-16 Jan-17 Feb-17 YTD FOT Referrals Received (plan 333 per month) Intermediate /IGS Back to GP Secondary Care Planned Triage Actual Triage 9.5 cost per case 4, ,427. 4, , ,636. 4, ,819. 2, ,68.5 2, ,51. 4,423 44,97 Telephone Charge (Monthly) ,375 1,5 Total Number of Referrals Received into IGS clinic Number of First OPA (plan 115 per month) Total cost of First 137 per case 16,44. 26, , ,495. 2,687. 2,2. 21,783. 2,139. 9, , , , ,918 Number of Follow up OPA (plan 19 per month) Total cost of Follow up 88 per case ,144. 1,848. 1,936. 2,376. 3,696. 3,696. 3,96. 1,496. 2,2. 1, , ,592 Total OPA Onward Referrals to Secondary Care 1% 31% 34% 11% 2% 28% 2% 18% 26% 27% 17% 18.5% 23% 23% Number of Diagnositc Hysteroscopy (plan 47 per month) Total 286. per case. 5,72. 4,29. 7,436. 8,58. 4,4. 6,292. 6,864. 5,72. 8,8. 4,4. 6,918 66,456 Number of Therapeuatic Hysteroscopy (plan 5 per month) TotalTherapeutic 286. per case First: FU (1:.4) 1:.2 1:.1 1: :51 1:61 1:.59 1:.56 1:.56 Average waiting time for first OPA (<4 weeks) DNA rate (<1%) 5% 7% 1% 7% 5% 5% 7% 8% 14% 12% 11% 8% 8% Finance PLANNED 35,588 35,588 35,588 35,588 35,588 35,588 35,588 35,588 35,588 35,588 35, , ,54 ACTUAL 2,988 38,268 42,442 31,935 36,44 32,32 35,715 33,967 2,274 25,13 18, ,17 366,563 47
48 Intermediate Gynaecology The number of triage referrals has decreased from 35 in M1 to 158 in M11. Out of the 158 referrals, 77 were triaged to the Intermediate Service, 79 to secondary care and 2 back to the GP. For M11, the service saw 82 firsts, (which is below the plan of 115) and 21 face-to-face follow ups (above plan of 19). Whilst the Provider continues to be on target YTD for their First: Follow Up ratio (1:4), discussion took place at the last Contract Review Meeting regarding the scope for providing further efficiencies in follow up provision. A new tariff for the provision of virtual/telephone clinics was agreed, with an aspiration to manage 25% of all follow ups virtually going forwards. The CSU have written a Contract Variation to this effect. Therapeutic and diagnostic hysteroscopies were under plan with 14 diagnostic hysteroscopies being seen in month 11, against a plan of 47 per month. The number of therapeutic hysteroscopies has continuously remained at year to date. This is due to changes in HRG reporting which no longer differentiates between diagnostic and therapeutic hysteroscopies. KPIs: The Provider has met the threshold for the following KPIs: 1. Number of patients returned completed patient surveys (1%): The performance was 5% in M11. KPIs not met: 1. First to Follow Up Ratio (1:.4): in M11 this was 1: Onward referrals to secondary care: In M11 this was 18.5%. The Provider has been in breach of the contractual threshold of 1% YTD. The Provider has challenged the performance threshold, however the CCG Clinical Lead has confirmed that the performance threshold cannot be increased as the purpose of the Intermediate Service is to help reduce the number of onward referrals to secondary care. Following the last Contract Review Meeting, the CCG and CSU will review again the audit on onward referrals to secondary care to identify any trends, areas for improvement. DNA Rate (<1%): In M11 this was 11%. The Provider has stated that they have a telephone, letter and text reminder system. A patient is discharged if they DNA twice. At the last Contract Review Meeting the Provider stated that often patients DNA because they no longer have symptoms. The CSU have requested a copy of the Providers Access Policy to provide assurance that the Provider is doing all that they can to manage DNAs. Finance: The service is forecasting a year end underperformance of 6,491 Module Intermediate 48
49 Intermediate Diabetes Education DAFNE Cost per Case Apr-16 May-16 Jun-16 Jul-16 Aug-16 Sep-16 Oct-16 Nov-16 Dec-16 Jan-17 Feb-17 YTD FOT Number of Patients on waiting list Number of Classes available Total Places taken up (booked) Total number completed Planned N/A N/A N/A N/A N/A N/A N/A N/A N/A N/A N/A N/A N/A Actual DAFNE REFRESHER Apr-16 May-16 Jun-16 Jul-16 Aug-16 Sep-16 Oct-16 Nov-16 Dec-16 Jan-17 Feb-17 YTD FOT Number of accepted referrals Number of Classes available Total Places taken up (booked) Total number completed Cost per Case DESMOND Cost per Case Conv. Mapping Cost per Case Education Quality Planned N/A N/A N/A N/A N/A N/A N/A N/A N/A N/A N/A N/A N/A Actual Apr-16 May-16 Jun-16 Jul-16 Aug-16 Sep-16 Oct-16 Nov-16 Dec-16 Jan-17 Feb-17 YTD FOT Number of accepted Referrals Number of patients sent offer letters Number of Classes available Total Places taken up (booked) Decline offer to treatment Total number completed Planned 1,26 1,26 1,26 1,26 1,26 1,26 1,26 1,26 1,26 1,26 1,26 13,86 15,12 Actual 2,17 3,5 2,94 2,59 2,73 2,8 1,68 2,8 1,33 3,1 3,43 28,98 31,615 Apr-16 May-16 Jun-16 Jul-16 Aug-16 Sep-16 Oct-16 Nov-16 Dec-16 Jan-17 Feb-17 YTD FOT Number of accepted referrals Number of patients sent offer letters Number of Classes available Total Places taken up Decline offer to treatment Total number completed Planned N/A N/A N/A N/A N/A N/A N/A N/A N/A N/A N/A N/A N/A Actual ,1 3,284 Apr-16 May-16 Jun-16 Jul-16 Aug-16 Sep-16 Oct-16 Nov-16 Dec-16 Jan-17 Feb-17 YTD FOT Patients contacted within two weeks of referral (95%) 98.9% 98.% 95.1% 97.6% 96.1% 98.3% 92.7% 94.3% 95.7% 93.9% 96.3% 96% 96% Patients offered a place on a programme within 4 weeks of receipt 97.7% 1.% 1.% 1.% of referral (95%) 98.9% 1.% 98.4% 98.8% 1.% 98.3% 1.% 99% 99% Patient DNA (< 1%) 9.26% 5.66% 7.84% 17.54% 18.87% 16.% 2.% 15.% 11.8% 23.9% 19.7% 15.5% 15.5% 49
50 Intermediate Diabetes Education Education- Activity: 32 patients were on the waiting list for DAFNE in M11, compared to 29 in M1. For the DESMOND Course, 76 patients were referred to the service in M patients completed training the course, whilst 23 patients declined the offer for education. Refusal has been attributed to lack of convenient sessions, so additional sessions are now being made available. 1 patient was referred to DAFNE Refresher in M11. Key Performance Indicator Education : 1% of patients were contacted following referral by letter and offered a structured education programme, meeting the target threshold at 95%. 1% of patients were offered a place on a programme within 4 weeks of receipt of referral. The target threshold is 95%. 1% of Patients were contacted by phone or text 3-5 working days prior to the course to confirm attendance (Target 1%). The Provider has continued to meet this target year to date. The percentage for DNA has decreased slightly from 23.9% in M1 to 19% in M11. This remains in breach of the performance threshold of <1%. At the last Contract Review meeting the Provider explained that they do the following in order to reduce DNAs: 1. Each month posters are displayed in the patient waiting areas highlighting the cost of DNA appointments. 2. Patients are called on the day of their DNA to establish the reason for the DNA. 3. Appointment reminder text messages are also sent. It was agreed that patient reasons for DNA would be collated for discussion at the next contract management meeting. Module Intermediate 5
51 Intermediate Diabetes Community Service Community Diabetes Apr-16 May-16 Jun-16 Jul-16 Aug-16 Sep-16 Oct-16 Nov-16 Dec-16 Jan-17 Feb-17 YTD FOT Referrals Accepted Number of First contacts Total patients seen Patients seen within 4 weeks of referral (75%) 83% 92% 94% 86% 86% 82% 73% 95% 86% 6% 82% 84% 84% Patient DNA (<1%) 8% 7% 7% 7% 9% 7% 6% 7% 4% 7% 8% 7% 7% Average wait time (weeks) Finance Block - 1/12th 83,273 83,273 83,273 83,273 83,273 83,273 83,273 83,273 83,273 83,273 83, ,2 999,274 Community - Activity: GP Referrals to the Community Diabetes Service increased slightly from 82 in M1 to 92 in M11. Of the 92 referrals from GPs, 13 were sent back to GP with clinical advice and 1 was sent back to CHS. Of the patients referred and accepted to the service, 12 patients were Type 1, 63 were Type 2, and 9 patients had an unverified diagnosis. The number of patients seen within the service during M11 is as follows: a. 31 seen by Diabetes Services Nurse (DSN) b. 53 seen by Consultants c. 46 seen by Dietetic Service d. 33 seen by HCA Key Performance Indicators Community Service: The first: follow up ratio for Type 1 has increased from 1:6.7 in M1 to 1:7.1 in M11 (threshold <1.41), although as stated in previous reports, the feasibility of this ratio has been challenged in line with NICE Guidelines on Diabetes. The first follow up ratio for Type 2 has decreased from 1:5.5 to 1:4.4 which is nearer towards the performance threshold of <1.41. Average waiting time for first appointment is 2.8 weeks, which is within the <4 weeks target threshold. There has been a significant improvement for the number of patients seen within 4 weeks of referral in M11 (82% compared to 6% in M1, and well above the threshold of 75%). DNAs are at 8%. 51
52 Intermediate Ophthalmology Activity (1st & Follow Up) Apr-16 May-16 Jun-16 Jul-16 Aug-16 Sept Oct Nov Dec Jan Feb YTD FOT Referrals Received for Triage % Triaged to GP/Back to GP 43% 43% 44% 39% 42% 4% 49% % % % 52% 32% 32% % Triaged to Secondary Care 57% 57% 56% 61% 58% 6% 51% % % % 48% 41% 41% Firsts (plan 35 per month) Follow Up (plan 84 per month) Onward referrals (MECs) <15% 2% 18% 15% 17% 23% 15% 18% 15% 16% 13% 14% 17% 17% DNA Rate <1% 1% 1% 2% 1% 2% 1% 2% 1% 1% 1% 1% 1% 1% Minor Eye GLAU CAT Finance Paediatric Screening Service Finance First Appointments 38,335 35,15 36,85 33,65 35,785 39,525 38,25 41,55 33,65 4,12 4,8 411,91 449,356 Follow Ups 7,2 5,94 5,376 6,768 6,528 7,44 7,44 8,496 6,96 8,16 7,968 78,24 85,353 GLAU Assessments 81 1,8 1,26 1,41 1,41 1,32 1,29 1,71 1,1 1,32 1,26 13,97 15,24 CAT Assessments 2,73 2,7 2,16 2,4 3,12 2,82 1,95 2,73 1,86 2,22 2,1 26,7 29,127 Total 49,75 44,789 45,61 43,643 46,843 51,15 48,93 53,991 42,985 51,82 52,38 53,82 579,76 No Patients Onward referrals PAED Assessments 48 1,62 1,38 1,48 1, ,9 7,527 Admin Cost ,45 3,764 Total Cost 72 2,43 2,7 2,22 1, ,35 11,291 Activity: Since the end of the CReSS contract on 31 st March 217, the Provider has been processing their own triage referrals. The number of referrals received for triage in M11 was 365, which is the lowest performance YTD. Ongoing monitoring will continue, to be assured that referrals are not bypassing the system and going directly to the acute setting. First attendances remained flat from 59 in M1 to 589 in M11. This is above the plan of 35 per month, in keeping with the trend for the year. Follow-up appointments were also flat compared to last month, (M11 at 166, compared to 17 in M1). This also continues to be significantly over the monthly plan of 84, but is in keeping with planned ratios (1:.2) and therefore due to significant over performance in firsts rather than inefficiencies in the follow up pathway. Increases in activity are due to a number of factors; the integration of the service in the community leading to the GPs becoming more familiar with the referral process; more accurate recording of referral data since all referrals from optometrists and GPs have been processed through CReSS; and growth not being taken into account in the setting of plan for 16/17. It is recommended that the plan figure be reviewed for any future years. 52
53 Intermediate Ophthalmology Paediatric Screening: There were no paediatric appointments in M11. This can be attributed to term times at school. Key Performance Indicators: The onward referrals for Minor Eye Conditions (MEC) threshold is <15%. Onward referrals to secondary care dropped in M1 from 16% to 13% which is a significant improvement for the provider. This continues to improve in M11 where the performance was 14%. This is as a result of ongoing pressure from commissioners through contract meetings to address this KPI. The provider has implemented a re- triaging approach which has proved successful in reducing the number of onward referrals to secondary care. The CCG have allowed until the end of March 217 for the Provider to recover this performance target. The CCG have also informed the provider that they will liaise with the CSU over the months that the Provider has been in breach of this threshold to discuss financial penalties. The Provider continues to perform well against the DNA rate achieving 1% in M11, below the <1% threshold. Finance The YTD to spend is 531k with an annual forecast outturn of 579k. This represents a significant over performance ( 262k) against plan ( 317k). This is attributed to the over performance in first and follow ups. The plan and budget should be reviewed at contract extension. Spend for the Paediatric Screening service is YTD is 1K and the FOT is 11k. Contract Extension: At the last Contract Review Meeting the CCG confirmed a contract extension with the existing provider for a further 12 months. The CSU are writing a contract variation to reflect this. 53
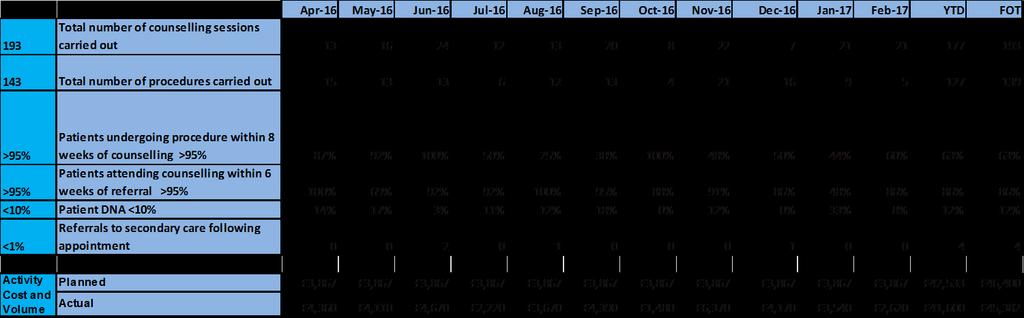
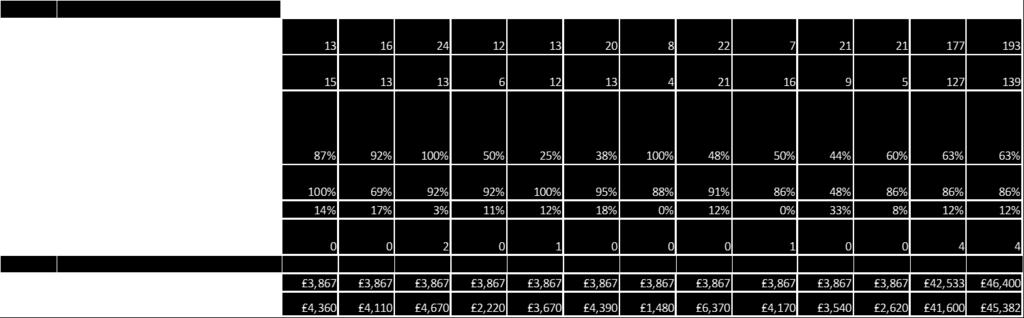
54 Intermediate Vasectomy 54
Newham Borough Summary report
 Newham Borough Summary report April 2013 Prepared on 17/04/13 by Commissioning Support team Apr-11 Jun-11 Aug-11 Oct-11 Dec-11 Feb-12 Apr-12 Jun-12 Aug-12 Oct-12 Dec-12 Feb-13 GREE N Finance and Activity
Newham Borough Summary report
 Newham Borough Summary report March 2013 Prepared on 18/03/13 by Commissioning Support team Finance and Activity Millions Apr-11 Jun-11 Aug-11 Oct-11 Dec-11 Newham Headlines March 2013 Feb-12 Apr-12 Jun-12
MERTON CLINICAL COMMISSIONING GROUP GOVERNING BODY
 MERTON CLINICAL COMMISSIONING GROUP GOVERNING BODY Date of Meeting: 23 rd March 2017 Agenda No: 9.3 Attachment: 15 Title of Document: CCG Governing Body Assurance Report & Scorecards: Month 9 Quality &
RTT Recovery Planning and Trajectory Development: A Cambridge Tale
 RTT Recovery Planning and Trajectory Development: A Cambridge Tale Linda Clarke Head of Operational Performance Addenbrooke s Hospital I Rosie Hospital Apr 2014 May 2014 Jun 2014 Jul 2014 Aug 2014 Sep
Performance and Quality Report Sean Morgan Director of Performance and Delivery Mary Hopper Director of Quality Dino Pardhanani, Clinical Director
 Sutton CCG Clinical Commissioning Group Governing Body Date Thursday, 06 September 2018 Document Title Lead Director (Name and Role) Clinical Sponsor (Name and Role) Performance and Quality Report Sean
WEST HAMPSHIRE PERFORMANCE REPORT. Based on performance data available as at 11 th January 2018
 WEST HAMPSHIRE PERFORMANCE REPORT Based on performance data available as at 11 th January 2018 1 CCG Quality and Performance Executive Summary Introduction: The purpose of this report is to provide an
2016/17 Activity Report April August/September 2016
 Due to a change in national hospital data flows (SUS) and also a delay in processing September 2016 Practice-level finance data, the latest information on hospital activity and spend is still up to August
Operational Focus: Performance
 Operational Focus: Performance Sandra Iskander Changes for 2015/16 Change of focus of 18-weeks and A&E 4-hour wait targets as recommended by Sir Bruce Keogh, Medical Director, NHS England. 18-weeks to
NHS performance statistics
 NHS performance statistics Published: 14 th December 217 Geography: England Official Statistics This monthly release aims to provide users with an overview of NHS performance statistics in key areas. Official
Waiting Times Report Strategic. Thematic Goals
 Strategic Improved Quality of Care Transformation - Prevention & Wellbeing Thematic Goals Waiting Times Report 2016-17 Transformation through Integration Improved Access to Services Improved Value This
REPORT TO CROYDON CLINICAL COMMISSIONING GROUP GOVERNING BODY Meeting in Public. 30 April 2013
 REPORT TO CROYDON CLINICAL COMMISSIONING GROUP GOVERNING BODY Meeting in Public 30 April 2013 Title of Paper: CONTRACT PERFORMANCE AND MANAGEMENT: NON ACUTE CONTRACTS Lead Director Report Author Contact
NHS performance statistics
 NHS performance statistics Published: 8 th February 218 Geography: England Official Statistics This monthly release aims to provide users with an overview of NHS performance statistics in key areas. Official
NHS Electronic Referrals Service. Paper Switch Off an update Digital Health Webinar 4 May 2018
 NHS Electronic Referrals Service Paper Switch Off an update Digital Health Webinar 4 May 2018 Aims of Session Introductions and refresh of Paper Switch Off Sharon Wilson Implementation manager NHS Digital
NHS Performance Statistics
 NHS Performance Statistics Published: 8 th March 218 Geography: England Official Statistics This monthly release aims to provide users with an overview of NHS performance statistics in key areas. Official
Prime Contractor Model King s Fund Nick Boyle Consultant Surgeon 27 March 2014
 Prime Contractor Model King s Fund Nick Boyle Consultant Surgeon 27 March 2014 Current Referral Route options - Information 1. Horizon Health Choices Horizon Musculoskeletal Triage & Treatment Chronic
Newham Borough Summary report
 Newham Borough Summary report Item K1 September 2013 Prepared on 30/09/2013 by Support team GREEN Finance and Activity Millions AMBER RED Headlines M5 Financial position M4 activity data The QIPP net savings
Reducing Elective Waits: Delivering 18 week pathways for patients. Programme Director NHS Elect Caroline Dove.
 Reducing Elective Waits: Delivering 18 week pathways for patients Programme Director NHS Elect Caroline Dove What I will cover 1. Why 18 Weeks is different 2. Where are we now 3. New models of delivery
Council of Members. 20 January 2016
 Council of Members 20 January 2016 Feedback on election process: Council of Members Chair and Deputy Chair Malcolm Hines, Chief Financial Officer Minutes of last meeting: 14 October 2015 Dr. Richard Proctor,
Performance and Delivery/ Chief Nurse
 Governing Body 26th May 2017 Quality and Performance Report 22nd May 2017 Author: Other contributors: Executive Lead Audience Eileen Clark - Acting Director of Clinical Performance and Delivery/ Chief
Integrated Performance Report Executive Summary (for NHS Fife Board Meeting) Produced in February 2018
 Produced in February 2018") 6b Integrated Performance Report Executive Summary (for NHS Fife Board Meeting) Produced in February 2018 2 Contents Integrated Performance Report: Executive Summary 5 Clinical Governance: Chair and Committee
6b Integrated Performance Report Executive Summary (for NHS Fife Board Meeting) Produced in February 2018 2 Contents Integrated Performance Report: Executive Summary 5 Clinical Governance: Chair and Committee
NHS DORSET CLINICAL COMMISSIONING GROUP GOVERNING BODY MEETING FINANCIAL POSITION AS AT 30TH NOVEMBER C Hickson, Head of Management Accounts
 NHS DORSET CLINICAL COMMISSIONING GROUP GOVERNING BODY MEETING FINANCIAL POSITION AS AT 30TH NOVEMBER 2013 Date of the meeting 15/01/2014 Author Sponsoring GB member Purpose of report Recommendation Resource
Integrated Performance Report
 Integrated Performance Report M06 September 2014 Presented by: Paul Bostock (Chief Operating Officer) Des Holden (Medical Director) Fiona Allsop (Chief Nurse) Paul Simpson (Chief Financial Officer) An
Governing Body meeting on 13th September 2018
 Governing Body meeting on 13th September 2018 Report from the Chair of the Integrated Governance Committee (IGC) Date of Meetings Reported: 9 th August 2018 Key achievements Author: Martin Wilkinson, Chair
WAITING TIMES AND ACCESS TARGETS
 NHS Board Meeting Tuesday 17 February 2015 Chief Officer (Acute Services) Board Paper No.15/08 WAITING TIMES AND ACCESS TARGETS Recommendation: The NHS Board is asked to note progress against the national
SUPPORTING PLANNING 2013/14 FOR CLINICAL COMMISSIONING GROUPs
 SUPPORTING PLANNING 2013/14 FOR CLINICAL COMMISSIONING GROUPs December 2012 SUPPORTING PLANNING 2013/14 FOR CLINICAL COMMISSIONING GROUPS First published: 21 December 2012 2 Contents 1. INTRODUCTION...
Ayrshire and Arran NHS Board
 Paper 12 Ayrshire and Arran NHS Board Monday 9 October 2017 Planned Care Performance Report Author: Fraser Doris, Performance Information Analyst Sponsoring Director: Liz Moore, Director for Acute Services
Ayrshire and Arran NHS Board
 Paper 12 Ayrshire and Arran NHS Board Monday 26 March 2018 Financial Management Report for the 11 months to 28 February 2018 Author: Bob Brown, Assistant Director of Finance Governance and Shared Services
Appendix 1: Croydon Clinical Commissioning Group Risk Register and Board Assurance Framework - 9th April 2013
 Appendix 1: Croydon Clinical Register and Board Assurance Framework - 9th April 2013 Principal to Delivery Key Assurance on we have in in our are 1. To achieve financial sustainability in three years (2013-2014
Improvement and Assessment Framework Q1 performance and six clinical priority areas
 Governing Body 30 th September 2016 Improvement and Assessment Framework Q1 performance and six clinical priority areas Agenda item 16 Paper 10 Summariser: Authors and contributors: Executive Lead(s):
Integrated Performance Report
 ENC Bi Integrated Performance Report M1 2014/15 26 June 2014 Contents 1. Structure of the Document... 3 2. Southwark CCG and Providers Performance Summary Dashboard... 4 3. Southwark CCG Dashboard... 5
GOVERNING BODY REPORT
 GOVERNING BODY REPORT Date of Governing Body Meeting: Title of Report: Key Messages: Finance, Performance and Commissioning Committee Report At the end of September 2017 we have reported an inyear deficit
NHS Portsmouth CCG 2013/14 Contract Agreements Summary. Michelle Spandley Deputy Chief Finance Officer May Improving health services
 NHS Portsmouth CCG 2013/14 Contract Agreements Summary Michelle Spandley Deputy Chief Finance Officer May 2013 Contents Contracts Summary Portsmouth Hospitals NHS Trust Solent NHS Trust South Central Ambulance
Kingston Clinical Commissioning Group Report Summary
 Kingston Clinical Commissioning Group Report Summary Meeting Title Governing Body in public Date 6 th March 2018 Report Title Integrated Governance Report Agenda Item 11 Attachment F Purpose (please indicate
CASE STUDY: THE ADULT MENTAL HEALTH (AMH) MODEL-REDESIGN OF INTEGRATED SERVICES FOR WORKING AGE ADULTS WITH SEVERE MENTAL ILLNESS.
 MODEL-REDESIGN OF INTEGRATED SERVICES FOR WORKING AGE ADULTS WITH SEVERE MENTAL ILLNESS.") CASE STUDY: THE ADULT MENTAL HEALTH (AMH) MODEL-REDESIGN OF INTEGRATED SERVICES FOR WORKING AGE ADULTS WITH SEVERE MENTAL ILLNESS. Summary The Adult Mental Health (AMH) model is a new initiative which
CASE STUDY: THE ADULT MENTAL HEALTH (AMH) MODEL-REDESIGN OF INTEGRATED SERVICES FOR WORKING AGE ADULTS WITH SEVERE MENTAL ILLNESS. Summary The Adult Mental Health (AMH) model is a new initiative which
Integrated Performance Report
 ENC Bi Integrated Performance Report M6 2013/14 28 November 2013 Contents 1. Structure of the Document... 3 2. Southwark CCG and Providers Performance Summary Dashboard... 4 3. Southwark CCG Dashboard...
NHS BOLTON CLINICAL COMMISSIONING GROUP Public Board Meeting AGENDA ITEM NO: 10. Date of Meeting:.24 th March 2017.
 NHS BOLTON CLINICAL COMMISSIONING GROUP Public Board Meeting AGENDA ITEM NO: 10 Date of Meeting:.24 th March 2017. TITLE OF REPORT: CCG Corporate Performance Report AUTHOR: Melissa Laskey Director of Service
The Board is asked to note the report and to support the delivery of the Operational Plan and associated work programmes during 2017/18 and 2018/19.
 Subject: Reason for briefing note: Responsible officer(s): Senior leader sponsor: Windsor, Ascot & Maidenhead CCG Operating Plan 2017-19 Refresh To present the WAM CCG Operating Plan Refresh information
WAITING TIMES AND ACCESS TARGETS
 NHS Board Meeting Tuesday 17 December 2013 Lead Director (Acute Services Division) Board Paper No 13/60 Recommendation: WAITING TIMES AND ACCESS TARGETS The NHS Board is asked to note progress against
NHS Diagnostic Waiting Times and Activity Data
 NHS Diagnostic Waiting Times and Activity Data 1 NHS Diagnostic Waiting Times and Activity Data January 2017 Monthly Report Version number: 1 First published: 9 th March 2017 Prepared by: Operational Information
Integrated Performance Report August 2017
 Integrated Performance Report Contents Section Page High Level Dashboard Balanced scorecard 3 Domain Scorecards and Director Commentaries Operational Performance 4 Quality and Patient Safety 9 Workforce
Urgent and Emergency Care Strategy 2013/ /17. Delivering High Quality Urgent and Emergency Care
 Urgent and Emergency Care Strategy 2013/14 2016/17 Delivering High Quality Urgent and Emergency Care Working together to deliver sustainable high quality, safe, efficient and patient centred Urgent and
NHS Fylde and Wyre CCG Performance Dashboard
 Governing Body January 2016 NHS Fylde and Wyre CCG Performance Dashboard October 2015 (Month 7) Governing Body This report provides a high level summary of performance and activity and across Fylde and
Strategic KPI Report Performance to December 2017
 Strategic KPI Report Performance to December 2017 Trust Board 25 th January 2018 Strategic KPI summary SROs: All Directors Objective KPI SRO Target Apr May Jun Jul Aug Sep Oct Nov Success Is Deliver A
Section 1 - Key Performance Indicators
 Clinical Quality Report Month 6 2016/17 period ending 30th September 2016 Section 1 - Key Performance Indicators 1.1 NHS Improvement; Risk Assessment Framework Clostridium difficile Indicator M6 2 YTD
NHS England London Southside 4th Floor 105 Victoria Street London SW1E 6QT. 24 th July Dear Daniel, Fiona and Louise. Re: CCG Annual Assurance
 NHS England London Southside 4th Floor 105 Victoria Street London SW1E 6QT 24 th July 2014 Dear Daniel, Fiona and Louise Re: CCG Annual Assurance Many thanks for meeting with us on 6 th June 2014 to discuss
Report to Governing Body 19 September 2018
 Report to Governing Body 19 September 2018 Report Title Author(s) Governing Body/Clinical Lead(s) Management Lead(s) CCG Programme Purpose of Report Summary NHS Lambeth Clinical Commissioning Group (CCG)
Integrated Performance Report
 Integrated Performance Report M12 March 2015 Presented by: Paul Bostock (Chief Operating Officer) Des Holden (Medical Director) Fiona Alsop (Chief Nurse) Paul Simpson (Chief Financial Officer) An Associated
Summarise the Impact of the Health Board Report Equality and diversity
 AGENDA ITEM 4.1 Health Board Report INTEGRATED PERFORMANCE DASHBOARD Executive Lead: Director of Planning and Performance Author: Assistant Director of Performance and Information Contact Details for further
PRIMARY CARE COMMISSIONING COMMITTEE
 PRIMARY CARE COMMISSIONING COMMITTEE 1. Date of Meeting: 2. Title of Report: Western Avenue Medical Centre Personal Medical Services (PMS) Reinvestment Report 3. Key Messages: The Personal Medical Services
Health Board Report INTEGRATED PERFORMANCE DASHBOARD
 AGENDA ITEM 4.2 27 th January 2016 Health Board Report INTEGRATED PERFORMANCE DASHBOARD Executive Lead: Director of Planning and Performance Author: Assistant Director of Performance and Information Contact
Service Level Agreements for
 99/06 Service Level Agreements for 2006 07 1. This paper summarises the outcome of discussions with commissioning PCTs for the year 2006 07. Whilst there are some areas of detail yet to be agreed with
Governing Body. TITLE OF REPORT: Performance Report for period ending 31st December 2012
 - Governing Body DATE OF MEETING: TITLE OF REPORT: Performance Report for period ending 31st December 2012 KEY MESSAGES: We are responsible for securing improvements in the quality of care and health outcomes.
WAITING TIMES AND ACCESS TARGETS
 NHS Board Meeting Tuesday 21 April 2015 Chief Officer (Acute Services) Board Paper No.15/17 WAITING TIMES AND ACCESS TARGETS Recommendation: The NHS Board is asked to note progress against the national
Referral Management Programme Report to the CCG Board
 Referral Management Programme Report to the CCG Board Emily O Donnell (Wandsworth CCG) 20 August 2015 Version 1. 22.8.2014 1 Executive Summary The Wandsworth CCG Referral Management Programme (RMP) aims
Bristol CCG North Somerset CGG South Gloucestershire CCG. Draft Commissioning Intentions for 2017/2018 and 2018/2019
 Bristol CCG North Somerset CGG South Gloucestershire CCG Draft Commissioning Intentions for 2017/2018 and 2018/2019 Programme Area Key intention Primary and community care Sustainable primary care Implement
NHS Diagnostic Waiting Times and Activity Data
 NHS Diagnostic Waiting Times and Activity Data 1 NHS Diagnostic Waiting Times and Activity Data January 2016 Monthly Report Version number: 1 First published: 10 th March 2016 Prepared by: Operational
Monthly and Quarterly Activity Returns Statistics Consultation
 Monthly and Quarterly Activity Returns Statistics Consultation Monthly and Quarterly Activity Returns Statistics Consultation Version number: 1 First published: 08/02/2018 Prepared by: Classification:
Warrington Children and Young People s Mental Health and Wellbeing Local Transformation Plan
 Warrington Children and Young People s Mental Health and Wellbeing Local Transformation Plan 2015-2020 1 Introduction 1.1 Welcome to the update on Warrington s Local Transformation Plan for Children and
NHS Diagnostic Waiting Times and Activity Data
 NHS Diagnostic Waiting Times and Activity Data 1 NHS Diagnostic Waiting Times and Activity Data February 2018 Monthly Report Version number: 1 First published: 12 th April 2018 Prepared by: Operational
Your Care, Your Future
 Your Care, Your Future Update report for partner Boards April 2016 Introduction The following paper has been prepared for the Board members of all Your Care, Your Future partner organisations: NHS Herts
NHS Diagnostic Waiting Times and Activity Data
 NHS Diagnostic Waiting Times and Activity Data 1 NHS Diagnostic Waiting Times and Activity Data March 2017 Monthly Report Version number: 1 First published: 11 th May 2017 Prepared by: Operational Information
St. George s University Hospitals NHS Foundation Trust. Annual Plan 2016/17
 St. George s University Hospitals NHS Foundation Trust Annual Plan 2016/17 1 Excellence in specialist and community healthcare Contents Page 1.0 Executive Summary 3 2.0 The strategic context and the emerging
Improving current delivery in London: a briefing for GP cancer leads
 Treatment summaries Improving current delivery in London: a briefing for GP cancer leads August 2016 Supported by and delivering for London s NHS, Public Health England and the Mayor of London Transforming
North Central London Sustainability and Transformation Plan. A summary
 Sustainability and Transformation Plan A summary N C L Introduction Hospitals, local authorities, GPs, commissioners, and mental health trusts across north central London have all come together to transform
Reference costs 2016/17: highlights, analysis and introduction to the data
 Reference s 2016/17: highlights, analysis and introduction to the data November 2017 We support providers to give patients safe, high quality, compassionate care within local health systems that are financially
Quarterly Diagnostics Census and Monthly Diagnostics Waiting Times and Activity Return Consultation
 Quarterly Diagnostics Census and Monthly Diagnostics Waiting Times and Activity Return Consultation NHS England INFORMATION READER BOX Directorate Medical Operations and Information Specialised Commissioning
Quality & Performance Report. Public Board
 Agenda Item 12.1 Quality & Performance Report Public Board 27 th November 2014 Presented for: Presented by: Author: Previous Committees: Governance Professor Suzanne Hinchliffe CBE Chief Nurse / Interim
Commissioning Intentions 2019 / 20
 Commissioning Intentions 2019 / 20 September 2018 Version 1.1 Final version. Approved at JCC on 26th September (by Jon Singfield - 24/09/18) 1) Introduction Introduction The development of commissioning
GOVERNING BODY REPORT
 GOVERNING BODY REPORT 1. Date of Governing Body Meeting: 2. Title of Report: Finance, Performance and Commissioning Committee Report 3. Key Messages: At the end of March 2017 the clinical commissioning
Executive Summary: This report focuses on month 10 data of the 2017/18 financial year, January 2018, unless otherwise indicated.
 Agenda item: 3.1 Paper No: 8 Committee: Venue: Governing Body The Boardroom, Dominion House : 27/03/2018 Status: FOR REVIEW AND DISCUSSION Title of Report Performance Report: Month 10, January 2018 Presented
Improving Healthcare Together : NHS Surrey Downs, Sutton and Merton clinical commissioning groups Issues Paper
 Improving Healthcare Together 2020-2030 NHS Surrey Downs, Sutton and Merton CCGs Improving Healthcare Together 2020-2030: NHS Surrey Downs, Sutton and Merton clinical commissioning groups Surrey Downs
Paediatric Critical Care and Specialised Surgery in Children Review. Paediatric critical care and ECMO: interim update
 Gateway Reference: 06662 Paediatric Critical Care and Specialised Surgery in Children Review Paediatric critical care and ECMO: interim update June 2017 Contents Executive summary 1. Introduction 2. Context
Item E1 - Bart s Health Quality Indicators
 Item E1 - Bart s Health Quality Indicators 1.0 Purpose 1.1 The purpose of this report is to provide the CCG Board with an update on quality matters across pertaining to our main local Provider organisations.
Update on NHS Central London CCG QIPP schemes
 Update on NHS Central London CCG QIPP schemes NHS Central London CCG has identified circa 11m for QIPP during 2013/14. Commissioning Intentions approved by the governing body included transformational
Community and Mental Health Services High Level Market Research PROSPECTUS
 and Mental Health Services High Level Market Research PROSPECTUS February 2014 Supporting people in Dorset to lead healthier lives NHS DORSET CLINICAL COMMISSIONING GROUP PROSPECTUS FOR COMMUNITY AND MENTAL
Therefore to accommodate these conflicting issues, the following contracting arrangements are proposed:
 Appendix: 3.3b North Central London CCGs Collaboration Arrangements for Contracting 22-1-13 Introduction Across the 5 CCGs in North Central London, the total value of all contracts excluding non clinical
NHS Diagnostic Waiting Times and Activity Data
 NHS Diagnostic Waiting Times and Activity Data 1 NHS Diagnostic Waiting Times and Activity Data March 2018 Monthly Report Version number: 1 First published: 10 th May 2018 Prepared by: Operational Information
NHS Bradford Districts CCG Commissioning Intentions 2016/17
 NHS Bradford Districts CCG Commissioning Intentions 2016/17 Introduction This document sets out the high level commissioning intentions of NHS Bradford Districts Clinical Commissioning Group (BDCCG) for
21 March NHS Providers ON THE DAY BRIEFING Page 1
 21 March 2018 NHS Providers ON THE DAY BRIEFING Page 1 2016-17 (Revised) 2017-18 (Revised) 2018-19 2019-20 (Indicative budget) 2020-21 (Indicative budget) Total revenue budget ( m) 106,528 110,002 114,269
Aylesbury Vale Clinical Commissioning Group Innovation & QIPP Report, October 2013
 Aylesbury Vale Clinical Commissioning Group Innovation & QIPP Report, October 2013 1. Introduction Programme Activity Finance Milestones InPACT (Urgent Care) Chronic diseases (LTCs) Early Years (Children
NHS Dorset Clinical Commissioning Group Governing Body Meeting Financial Position as at 31 st July C Hickson, Head of Management Accounts
 NHS Dorset Clinical Commissioning Group Governing Body Meeting Financial Position as at 31 st July 2013 9.4 Date of the meeting 18/09/2013 Author Sponsoring GB member Purpose of report Recommendation Resource
Standardising Acute and Specialised Care Theme 3 Governance and Approach to Hospital Based Services Strategy Overview 28 th July 2017
 Standardising Acute and Specialised Care Theme 3 Governance and Approach to Hospital Based Services Strategy Overview 28 th July 2017 Background Theme 3 builds upon previous key strategic commissioning
Norfolk and Suffolk NHS Foundation Trust mental health services in Norfolk
 Norfolk Health Overview and Scrutiny Committee 7 December 2017 Item no 6 Norfolk and Suffolk NHS Foundation Trust mental health services in Norfolk Suggested approach by Maureen Orr, Democratic Support
Update Report to Clinical Members. Quarter 3; what have we done so far
 Update Report to Clinical Members Quarter 3; what have we done so far Introduction: Dr Charlotte Canniff, Clinical Chair Following our Council of Members meeting in October we heard and recognised a clear
NHS Diagnostic Waiting Times and Activity Data
 NHS Diagnostic Waiting Times and Activity Data 1 NHS Diagnostic Waiting Times and Activity Data November 2017 Monthly Report Version number: 1 First published: 11 th January 2018 Prepared by: Operational
IAPT Service Review Norfolk and Waveney STP
 IAPT Service Review Norfolk and Waveney STP Intensive Support Team Mental Health 20 th April 2017 Context The Mental Health Intensive Support Team (IST) Part of the NHS Improvement A free resource to NHS
Westminster Partnership Board for Health and Care. 17 January pm pm Room 5.3 at 15 Marylebone Road
 Westminster Partnership Board for Health and Care 17 January 2018 4.30pm - 6.00pm Room 5.3 at 15 Marylebone Road Agenda Item # Item and discussion points Lead Papers Timing 1 Preliminary business Welcome
CCG authorisation Case Study Template NHS Croydon Clinical Commissioning Group. Urgent Care Redesign
 CCG name: CCG authorisation Case Study Template NHS Croydon Clinical Commissioning Group Case study title: Urgent Care Redesign CCG case study number: (specify 1 to 5) Does the case study provide core
briefing Liaison psychiatry the way ahead Background Key points November 2012 Issue 249
 briefing November 2012 Issue 249 Liaison psychiatry the way ahead Key points Failing to deal with mental and physical health issues at the same time leads to poorer health outcomes and costs the NHS more
Integrated Performance Report
 Integrated Performance Report M04 July 2016 Presented by: Angela Stevenson (Chief Operating Officer) Des Holden (Medical Director) Fiona Allsop (Chief Nurse) Paul Simpson (Chief Financial Officer) An Associated
Integrating Telemedicine into mental Health Care
 Integrating Telemedicine into mental Health Care learning from a Care Homes Vanguard Rachel Binks Nurse Consultant Digital & Acute Care Airedale NHS Foundation Trust Chris North Care Home Liaison Team
Nottingham University Hospitals Emergency Department Quality Issues Related to Performance
 RCCG/GB/14/123 Nottingham University Hospitals Emergency Department Quality Issues Related to Performance Introduction NUH have failed to meet the 95% 4 hour wait standard for a number of consecutive months.
WAITING TIMES 1. PURPOSE
 Agenda Item Meeting of Lanarkshire NHS Board 28 April 2010 Lanarkshire NHS board 14 Beckford Street Hamilton ML3 0TA Telephone 01698 281313 Fax 01698 423134 www.nhslanarkshire.org.uk WAITING TIMES 1. PURPOSE
Integrated Corporate Performance Report. August Page 1 of 9
 Integrated Corporate Performance Report August Page of 9 Integrated Corporate Performance Report... Introduction The Integrated Corporate Performance Report (ICPR) includes: An Executive Summary - highlights
NHS Diagnostic Waiting Times and Activity Data
 NHS Diagnostic Waiting Times and Activity Data 1 NHS Diagnostic Waiting Times and Activity Data July 2018 Monthly Report Version number: 1 First published: 13 th September 2018 Prepared by: Operational
November NHS Rushcliffe CCG Assurance Framework
 November 2015 NHS Rushcliffe CCG Assurance Framework ASSURANCE FRAMEWORK SUMMARY No. Lead & Sub Committee Date placed on Assurance Framework narrative Residual rating score L I rating in 19 March 2015
Sutton Homes of Care Vanguard Programme
 Sutton Homes of Care Vanguard Programme An Innovative End of Life Care model for care homes Kings Fund Conference 6 th December 2016 Corinne Campion, Clinical Nurse Specialist, Supportive Care Home Team
Westminster Partnership Board for Health and Care. 21 February pm pm Room 5.3 at 15 Marylebone Road
 Westminster Partnership Board for Health and Care 21 February 2018 4.30pm - 6.00pm Room 5.3 at 15 Marylebone Road Agenda Item # Item and discussion points Lead Papers Timing 1 Preliminary business Welcome
Child and Adolescent Mental Health Services Waiting Times in NHSScotland
 Publication Report Child and Adolescent Mental Health Services Waiting Times in NHSScotland Quarter ending 30 September 2016 Publication date 6 December 2016 An Official Statistics Publication for Scotland
Kingston Primary Care commissioning strategy Kingston Medical Services
 Kingston Primary Care commissioning strategy Kingston Medical Services Kathryn MacDermott Director of Planning and Primary Care Kathryn.macdermott@kingstonccg.nhs.uk kmacdermott@nhs.net 1 Contents 1. Introduction...