Swale Clinical Commissioning Group. Health Profile
|
|
|
- Paula Adams
- 5 years ago
- Views:
Transcription


1 Swale Clinical Commissioning Group Health Profile 2014 to 2016
2 Dr Faiza Khan Jack Baxter Colin Thompson Natasha Roberts Penelope Searle Kent & Medway Public Health Observatory January 2014 Page 2 of 136
3 Contents January 2014Conte... 2 Links to other plans... 5 Demography and Geography... 6 Geography... 6 Demography... 9 Predicted trends in population change Inequalities in Health Health inequalities through measurement of the social determinants of health in the Swale CCG area Children General Fertility Rate Low Birth Weight Breast feeding Early years, child health, health visitors, children s centres Immunisation and Vaccination Child wellbeing health overview Child wellbeing overview material wellbeing Child and Adolescent Mental Health Services Teenage Pregnancy Older People Chronic Diseases Risk Factors for Chronic Disease Smoking Prevalence Adult Obesity Prevalence Alcohol Misuse Kent Pharmacies with needle exchange services Chronic Disease Patterns Multi-Morbidity Cancer Registrations Diabetes Coronary Heart Disease (CHD) Stroke Chronic Obstructive Pulmonary Disease (COPD) Mental Health Mental Illness in Children and Young People Prevalence of more severe mental illness in adults Common mental illness described by reference to practice prescribing patterns Long term conditions and mental health: Co-morbidities Dementia Sexual Health Teenage Conceptions HIV Syphillis, Gonorrhoea and acute sexually transmitted infections Chlamydia Hospital Activity A&E Attendances & Admissions Swale A&E Admissions Swale Emergency Admissions Older People Falls All age all-cause mortality Page 3 of 136
4 Summary of Findings 1. Higher proportions of under 4 year olds are to be found in Sheerness East, Sheppey Central & Kemsley wards. 2. Minster Cliffs and Sheppey Central are the wards with the highest number of residents aged Minster Cliffs & Woodstock have the highest proportion of people aged over Grove, Milton Regis, Sheppey Central, Sheerness East, Leysdown and Warden & Sheerness West have the lowest life expectancy from birth than Swale at 75.5 years. The difference in life expectancy from birth between highest and lowest wards is 8.3 years. 5. The largest predicted rises in population are in the 65+ and 85+ populations which are set to increase by 55% and 126% of the 2013 population figures 6. The majority of deprived areas in Swale are found on the Isle of Sheppey. However on the main land one part of Murston is also amongst the 20% most deprived. 7. The Swale CCG area has the second highest infant mortality rate in comparison to the other CCG s in Kent. Although it s higher than the rate for Kent it s still below the England rate. 8. Generally the prevalence & coverage rates for breast feeding in Swale are lower than the Kent average. 9. The Swale CCG practices demonstrate mixed immunisation rates which highlights the need to keep focused on effective immunisation to achieve optimal rates. 10. A greater proportion of children with poor health and disability are found in Sheerness West, Sheerness East, Queenborough and Halfway, Murston and Milton Regis 11. The teenage conception rates are highest in Leysdown, Warden, Chalkwell and Roman ward 12. Smoking rates are highest around central Sittingbourne and Sheerness. 20% of mothers within the Swale Borough Council area continue to smoke during pregnancy. 13. Wards on the Isle of Sheppey have relatively higher estimated rates of obesity than those on the main land 14. Overall the cancer registrations for Swale CCG are marginally lower than the rate for Kent. 15. The prevalence of diabetes for the CCG is 6.8% which is second to Thanet CCG 16. The expected prevalence of CHD in Swale is estimated to be 5,430 which means there are potentially 2,146 people who are unaware they have the condition. 17. The expected and observed prevalence for stroke in Swale are broadly similar, with less variation between practices. 18. The prevalence of COPD within Swale CCG ranges from 0.8% to 2.9%., there maybe up to 842 patients in Swale CCG with undiagnosed COPD. 19. Swale CCG practices overall have lower rates of patients with mental illness as compared to the national and Kent & Medway average. 20. The highest age standardised admission rates for Swale residents aged 65+ are found in Sheppey Central, Sheerness East & West and Milton Regis Page 4 of 136
5 Links to other plans This needs assessment for the Swale CCG area may be read in conjunction with the following County and local plans: Kent Joint Strategic Needs Assessment Kent Children s Joint Strategic Needs Assessment Local Children s Trust Plan Swale Borough Council Corporate Plan Page 5 of 136
6 Demography and Geography Geography Swale Clinical Commissioning Group (Swale CCG) covers patients from 22 practices, with a registered practice population of 106,579 (7%) of Kent s total registered practice population. The registered practice population is drawn mainly from Sittingbourne, the Isle of Sheppey and the area east of Faversham within the Swale Borough Council boundary. It is important to recognise that patients resident in the CCG area cannot be presumed to be registered exclusively with Swale primary care teams. Residents of Iwade, Lower Halstow and Upchurch are as likely to be registered with Medway practices. Similarly large numbers of people resident in Teynham and Lynsted ward are registered with the Faversham practices (Canterbury & Coastal CCG) reflecting the hinterland of Faversham as a market town. The population pattern of Swale CCG is broadly similar to that for Kent and Medway although there is a slightly larger proportion aged 0 to 9 which may have an impact on services commissioned for children. Using resident populations for the district of Swale the population aged 65+ is predicted to increase by 68.1% from 2011 to 2031, i.e. from 22,600 to 38,000. This increase is greater in the 85+ group, being predicted to increase 142.3% during the same period (from 2,600 to 6,300). 2011Census data around ethnic populations show that 1.03% of the population of Swale are from a black or minority ethnic (BME) group. Anecdotal evidence suggests that a greater number of Eastern Europeans are migrating to Kent. Data from the 2011 census has provided a better understanding of the populations within Kent, for the first time this included the Gypsy and Traveller communities of which Swale has a higher proportion compared to the England percentage, this data is presented in the tables below (Please note that the data is produced at a local authority level, NOT CCG). Life expectancy from birth is 79.7 years; the same as Medway CCG and the 2 nd lowest of the eight CCGs. This compares to 80.9 years for Kent and Medway. Swale is the third most deprived district within Kent and is ranked 70 out of the 326 districts in England. Looking at practice level deprivation (derived from weighted population deprivation), no practices are within the 40% least deprived and eight practices are in the 20% most deprived. Ethnicity in Swale LA compared to England Broad Ethnic Group Swale Local Authority % of Population Broad Ethnic Group England Only % of Population All Residents 135, % All Residents 53,012, % White 131, % White 45,226, % Mixed/ Multiple Ethnicity % Mixed / Multiple Ethnicity 1,192, % Asian/ Asian British % Asian / Asian British 4,143, % Black / African / Caribbean / Black British % Black / African / Caribbean / Black British 1,846, % Other Ethnic Group % Other Ethnic Group 548, % Gypsy or Irish Traveller % Gypsy or Irish Traveller 54, % Page 6 of 136

7 Figure 1 Kent & Medway districts with CCG outlines Figure 2 - Prime electoral wards within Swale CCG area Page 7 of 136
8 Figure 3 - Approximate location of practices within Swale CCG area Key To Map G-Code Practice Name Partnership 1 G82023 Sheerness Health Centre Dr Fahmy M M E & Partner 1a G82023 The Surgery 2 G82026 Grovehurst Surgery Grovehurst Surgery 3 G82035 The Chestnuts Surgery The Chestnuts Surgery 4 G82057 St George's Medical Centre Dr A S Pannu & Partners 4c G82057 Leysdown Surgery 5 G82175 Dr H J Beerstecher Practice Dr Beerstecher H J 6 G82180 Maidstone Road Surgery Maidstone Road Surgery 7 G82231 The Medical Centre The Medical Centre 8 G82634 Saffron Way Health Centre Dr Pasola M 9 G82663 London Road Surgery Dr Mahtha S K 10 G82667 Teynham Medical Centre Dr Sikdar A N 11 G82671 Iwade Health Centre Iwade Health Centre Dr Sahu G B & Partner 13 G82686 Minster Medical Centre Minster Medical Centre 14 G82687 Sheerness Health Centre Sheerness Health Centre 15 G82693 Memorial Medical Centre Memorial Medical Centre 16 G82698 The Surgery, Teynham Dr R B Kumar 17 G82702 Milton Regis Surgery Dr Ramu C & Partner 18 G82757 Lakeside Medical Centre Dr Saha B K Dr Subash Chandran S 20 G82799 Sheppey Healthy Living Centre Dr Murthy S R S 21 Y01009 Holly Bank Surgery Holly Bank Surgery 22 Y02506 Sheppey NHS Healthcare Centre DMC Healthcare Centre 4a G82057 Eastchurch Practice G82682 The 'Om' Medical Centre G82791 Sheerness Health Centre 4b 12a 19a G82057 Warden Bay Surgery G82682 Shiva Medical Centre G82791 Sheerness Health Centre (Branch) Page 8 of 136
9 Demography Figure 4 - The distribution of residents aged 0-4 years by electoral ward Higher proportions of under fours are to be found in Sheerness East, Sheppey Central & Kemsley wards. West Downs, Borden and Woodstock wards have the lowest proportions of under fours. Page 9 of 136
10 Figure 5 - The distribution of residents aged 0-19 years by electoral ward The ward with the highest numbers of 0-19 year olds in Swale CCG are Grove, Kemsley and Sheppey Central. Page 10 of 136
11 Figure 6 - The distribution of residents of working age by electoral ward Sheppey Central and Kemsley are the wards with the highest numbers of working age people. Page 11 of 136
12 Figure 7 - The distribution of residents aged 65+ by electoral ward Minster Cliffs and Sheppey Central are the wards with the highest number of residents aged 65+. In comparison the ward with the lowest proportion with less than 500 people over 65 is Iwade and Lower Halstow. Page 12 of 136
13 Figure 8 - The distribution of residents aged 85+ by electoral ward Minster Cliffs & Woodstock have the highest proportion of people aged over 85 whereas Iwade and Lower Halstow, Leysdown and Warden, West Downs and Kemsley wards have less than 50 people aged 85+. Page 13 of 136


14 Figure 9 - Registered practice population as at September 2013 The registered practice population for the Swale CCG area closely reflects the pattern for Kent and Medway. However there appear to be slightly more 0-9 year olds and fewer women aged 70+ than that for Kent and Medway. Figure 10 - Life expectancy from birth The Swale area has the joint-second lowest life expectancy from birth compared to other CCGs in Kent. This is 1.2 years lower than the life expectancy for Kent & Medway. Page 14 of 136

15 Figure 11 - Life expectancy from birth by ward in Swale CCG area You will find the highest life expectancy from birth is in Woodstock ward at 83.8 years, this is reflected in the fact it is one of only 2 wards in Swale CCG with over 150 people aged over 85 living within it. Other wards with a higher life expectancy than Kent & Medway s include Murston, St. Michaels & West Downs. There are 6 wards with a significantly lower life expectancy from birth than Swale CCG overall, they are Grove, Milton Regis, Sheppey Central, Sheerness East, Leysdown and Warden & Sheerness West which has the lowest life expectancy at 75.5 years. It s also worth noting that the bottom 4 wards all reside on the Isle of Sheppey. The difference in life expectancy from birth between highest and lowest; Woodstock and Sheerness West is 8.3 years. Page 15 of 136

16 Figure 12 - Proportion of CCG registered practice populations aged 65+ and September 2013 The Swale CCG area has the third lowest proportion of registered practice populations aged 65+ and second lowest proportion of people aged 85+ in their population compared to the rest of Kent. Page 16 of 136
17 Predicted trends in population change Figure 13 - Population projection - females The predicted trends for the 0-4 and 5-19 age groups within Swale CCG are fairly static for the years The largest predicted rises are in the 65+ and 85+ populations which are set to increase by 55% and 126% of the 2013 population figures. This means there will be over 1.5 times more females aged 65+ and over 2 times more females aged 85+ than there are currently. Female Population Projection Age Group Predicted Difference from % Increase from 2013 % of Total Population % 6.10% 5.86% 5.75% 5.53% 5.35% % 17.73% 17.29% 17.38% 17.12% 16.81% % 61.60% 60.17% 59.20% 57.97% 56.31% % 19.62% 20.92% 22.19% 23.81% 26.03% % 2.76% 2.93% 3.34% 3.99% 5.35% Page 17 of 136
18 Figure 14 - Population projection - males The picture for males looks slightly different to that for females in that the number of people aged 65+ are due to surpass the number of 5-19 year olds around 2020 whereas they ve already done so amongst the female population. There is predicted to be a decrease in the 0-19 age groups as a percentage of the total population over the next 20 years (see table), while the 65+ and 85+ age groups are set to heavily increase over the next 20 years. This means there will be over 1.5 times more males aged 65+ and 3 times more males aged 85+ than there are currently. Male Population Projection % of Total Population Age Group Predicted Difference from % Increase from % 6.49% 6.21% 6.07% 5.86% 5.67% % 19.17% 18.90% 18.89% 18.75% 18.26% % 62.86% 61.33% 60.05% 58.93% 57.10% % 16.96% 18.34% 19.70% 21.48% 23.68% % 1.47% 1.83% 2.16% 2.86% 3.78% The older generation in most population groups will make the highest demands on health services. Nevertheless the biggest challenge for any CCG is to engage the 65+ age group in their health to prevent premature onset of chronic disease with the risk of related complications necessitating increased demand for secondary care based treatment. Where diagnoses of chronic diseases are made, it is essential that these conditions are identified early so that they can be managed effectively long term in primary and community care settings. Page 18 of 136
19 Inequalities in Health The Health and Social Care Act 2012 now places a new statutory duty on health services to reduce inequalities in health. Demonstrating this intention is also a requirement of CCGs for the purposes of authorisation by the NHS National Commissioning Board. Inequalities in health is primarily a socio-economic relationship. The poorer people are, the greater the likelihood of early onset disability, chronic disease and a shorter life span. In contrast, those who are of a higher status are expected to have a much greater disability-free life span and live a lot longer. People with low socio-economic status are at greater risk of behaviours causing ill health. They will have higher smoking rates, a poorer diet; have less opportunity to take part in social activities and poorer mental health. Whilst it is undeniable that individual behaviour is a significant driver of ill health, it is wrong to attribute all causes of premature poor health and early death to personal behaviour. If such behaviour was eliminated, people with the lowest socio-economic status would certainly live longer, but would continue to die prematurely relative to the mainstream society. Addressing health inequalities as a strategic response requires CCGs to commit to partnership working with other statutory agencies whose capacity to address the wider determinants of health is core to their purpose. Accordingly Swale CCG must support the actions of Kents Public Health Team, working with local authorities to address the root causes of disadvantages in society, whether through the Kent Health Inequalities Strategy, through Swale Borough Council s Corporate Plan or through the work of Local Children s Trusts. In addition the British Medical Association through the Presidency of Professor Sir Michael Marmot has identified a range of actions that doctors can implement directly. Doctors can help by intervening with individual patients, their families and contacts, using clinical tools including social prescribing and brief interventions. They can work within communities, for example, by commissioning measures including health promotion and ill-health prevention that will affect changes to the social determinants and are effective in the whole community including those who are traditionally hard to reach. Such as gypsy and traveller communities. Doctors can use evidence and influence to have a positive impact on health inequalities. Doctors can use their position and their expertise to advocate for change to areas outside traditional medical areas and to promote the generation of research, especially on the efficacy of prevention measures. Source: BMA Publications 2011 Page 19 of 136
 Partnership, vision and strategy, leadership and engagement This requires seamless partnership working between local authorities and CCGs.")
20 Figure 15 - Outline of the HINST Intervention Model Source: Bentley C (2007) Systematically Addressing Health Inequalities, Health Inequalities National Support Team The direct actions that clinical services need to focus upon include: A) Partnership, vision and strategy, leadership and engagement This requires seamless partnership working between local authorities and CCGs. The CCG has a statutory duty to collaborate with social services. Public Health has a major leadership role but cannot deliver on its own. There is a need for a detailed strategy or action plan which shows how local inequality targets can be achieved. B) Systematic and scaled interventions by frontline services Primary care services will need to play a central role requiring organisational capacity to be addressed by some practices if they are to work more effectively on this agenda. There is a need for training systematically to ensure effective brief interventions, referral pathways, and performance monitoring which should at least cover smoking, alcohol problems and obesity. C) Systematic community engagement The CCG and local authorities should have joint systems for reaching vulnerable patients at highest risk who may be demotivated and not in meaningful contact with services. Such systems should be of sufficient scale to make a difference. A comprehensive engagement Page 20 of 136
21 system is needed to interact not only with community groups but also with socially excluded individuals and families, e.g. through health trainers. D) Frontline service engagement with the community Many local areas have large portions of the population that are seldom seen, seldom heard. This can be addressed through the systematic use of practice registers and outreach staff to draw people in to services. Outreach strategies need to be targeted and scaled up appropriately in order to have impact across whole communities. The NHS workforce needs to be integrated effectively. The voluntary sector has great potential to bridge across from service into community provided that that sector is supported to develop its infrastructure to function at a strategic level. Health inequalities through measurement of the social determinants of health in the Swale CCG area Figure 16 - Indices of Multiple Deprivation local quintiles - LLSOAs in Swale CCG Source: Communities and Local Government This analysis describes the distribution of residents of the Swale CCG area by reference to their socio-economic status. The majority of deprived areas are found on the Isle of Sheppey. However on the main land one part of Murston is also amongst the 20% most deprived. The least deprived areas of Swale CCG are to be found at Iwade and Lower Halstow, Woodstock, West Downs and Borden. Page 21 of 136
22 Figure 17 - Indices of Multiple Deprivation Income Deprivation - local quintiles - LLSOAs in Swale CCG Source: Communities and Local Government Similarly the majority of areas that are the most income deprived are to be found on the Isle of Sheppey. On the main land parts of Milton Regis and Murston are also amongst the 20% most deprived areas. Table 1 Practice deprivation Most deprived 40% 60% 80% No of No of No of No of practices % practices % practices % practices % Least deprived No of practices % Total practices Swale CCG % % % 0 0.0% 0 0.0% 21 Source: IMD 2010 As will be seen on a national basis, there are no practices within the higher two quintiles. However 16 out of the 21 practices are within the two most deprived quintiles. Page 22 of 136

23 Figure 18 - Indices of Multiple Deprivation Employment Domain - local quintiles - LLSOAs in Swale CCG Source: Communities and Local Government This is a close reflection of the overall deprivation pattern within the Swale CCG area. Once again the most deprived areas are to be found on the Isle of Sheppey. Seasonal employment will be a contributory factor to this. Parts of Murston, Milton Regis and Roman wards on the main land are also within the 20% most deprived employment domain. The least deprived 20% are all in the western part of the CCG area and include the rural areas such as Borden, West Downs and Iwade and Lower Halstow wards. Page 23 of 136

24 Figure 19 - Indices of Multiple Deprivation Income Deprivation Affecting Children Index - local quintiles - LLSOAs in Swale CCG Source: Communities and Local Government In respect of children, there are more areas on the mainland that are within the 20% most deprived in comparison to the overall deprivation profile although the Isle of Sheppey still has the majority of areas amongst the most deprived. Page 24 of 136
25 Figure 20 - Indices of Multiple Deprivation Income Deprivation Affecting Older People Index - local quintiles - LLSOAs in Swale CCG Source: Communities and Local Government The prime measure here is the extent to which there are sufficient concentrations of older people whose primary dependency is upon state pensions alone. The lack of income in later years is a useful proxy for identifying people at greater risk of early onset chronic disease. Again the majority of older people affected by income deprivation are to be found on the Isle of Sheppey although there are parts of Murston, Kemsley and Milton Regis also affected. Table 2 - Income deprivation affecting older people index Most deprived 40% 60% 80% Least deprived Total No of No of No of No of No of practices practices % practices % practices % practices % practices % Swale CCG % % % % 0 0.0% 21 Source: IMD 2010 Index Affecting Older People (IDAOP) is a subset of the Index of Multiple Deprivation (IMD), the pattern of deprivation is broadly similar to that of the overall score. The number of practices within the 40% most deprived areas has reduced from 13 to 10, with 6 practices now within the 40% least deprived. There are no practices to be found in the least deprived 20%; however a third of practices are in the most deprived areas for income deprivation affecting older people. Page 25 of 136
26 Figure 21 - IMD Living Environment Domain - Local quintiles - LLSOAs in Swale CCG Source: Communities and Local Government This domain from the Index of Multiple Deprivation measures the physical and financial accessibility of housing and key local services. The indicators fall into two sub-domains: geographical barriers which relate to the physical proximity of local services and wider barriers which include issues relating to access to housing such as affordability. Seven indicators are combined to calculate this domain. Wider barriers: Household overcrowding the proportion of households within an LSO which are judged to have insufficient space to meet the household s needs; Homelessness the rate of acceptances for housing assistance under the homelessness provisions of the 1996 Housing Act (at local authority district level); Difficulty of access to owner-occupation (local authority district level) proportion of households aged under 35 whose income means they are unable to afford to enter owner occupation. Geographical barriers: Road distance to a GP surgery; Road distance to a supermarket or convenience store; Road distance to a primary school Road distance to a post office. What therefore is being measured is the extent of spatial and service isolation and thus factors which may have some dilatory influence on positive mental health. This analysis offers a perspective that is counter to many of the other cartographic descriptions of deprivation but not all. Housing issues such as overcrowding and homelessness are both still found in all of the major centres of populations. On the other hand, the distance from location of basic services and amenities is also reflected in the extensive rural parts of the Swale CCG area. Page 26 of 136

27 Children Figure 22 - Infant mortality rate, (pooled) Kent CCGs The Swale CCG area has the second highest infant mortality rate in comparison to the other CCG s in Kent. Although it s higher than the rate for Kent it s still below the England rate for (Most recently available) Page 27 of 136
28 Figure 23 - Infant mortality trends Figure 23 shows huge variation on the Swale IMR trend in comparison to the England and Kent averages. In 2005, the rate was below the England average, whereas in 2007 it was considerably higher; and again in This may be due to the relatively low numbers of infant deaths. Page 28 of 136
29 General Fertility Rate Figure 24 - General Fertility Rate by electoral ward for Swale CCG - Numbers of live births per 1,000 female population aged The lowest fertility rates are in areas that have relatively lower levels of deprivation (Woodstock, West Downs and Minster Cliffs). Conversely areas that are more deprived have a higher general fertility rate (Sheerness East & West, Murston and Leysdown & Warden). The one exception is Iwade and Lower Halstow which is a relatively affluent ward but has a higher proportion of young families. Page 29 of 136
30 Low Birth Weight Figure 25 - Percentage of low birth weight (<250g) babies born by electoral ward in Swale CCG, The pattern of low birth weight in the Swale CCG area appears to be at variance with the classic causal attribution of relative deprivation and teenage parenthood. The latter is only demonstrated by reference to Sheerness East, Milton Regis and Murston. Page 30 of 136
31 Breast feeding Table week breast feeding status 2012/ week breast feeding status by mother's CCG of residence /13 Area Swale CCG Kent & Medway Quarter 2012/13 Number of Maternities Number of breastfed infants Number of part breastfed infants Number of infants not breastfed (artificial) Number of Infants where status is unknown Prevalence of Breast feeding % coverage % 88.9% % 84.0% % 96.1% % 87.8% Total % 89.2% % 90.9% % 94.7% % 95.9% % 87.0% Total % 92.2% Table four shows variation between quarters regarding the prevalence of breast feeding (28.9% for quarter one, 20.4% for quarter two etc.). This could be related to the variation in coverage which fluctuates over the course of the year. Generally the prevalence & coverage rates are lower than the Kent average. Page 31 of 136
32 Early years, child health, health visitors, children s centres Figure 26 - Approximate locations of children's centres in Swale CCG area The monitoring of child health is in accordance with the national Healthy Child programme. This programme is conceived in two parts: birth to age five and five to 19. There is internationallybased evidence to show that over the life course, a person s health is fundamentally influenced by influences in the first few months of life and a child s early years (0-3). The delivery of this programme falls significantly to the role of the health visitor working in conjunction with a range of providers of children s services. In recent years there has been a transformation of early years provision through the establishment of children s centres. These are provided on the premise of locale and the reality that children s development is not something that should primarily be medicalised. The current policy of the Government is to re-build the profession of health visitor and to expand their numbers. Locally the importance of health visitors has been consistently recognised and a reduction in numbers has not been tolerated in the way that has been the case in some other parts of the County. In the short term the delivery of the health visitor programme will fall to the NHS Commissioning Board and at the completion of the programme (2015) the commissioning of these services will be transferred to local authorities, re-confirming an historic (pre 1974) position. Health visitor practise is seen to be crucial in the context of the role of children s centres and thus health visitors will primarily be based in such centres. It is essential that there is effective liaison between health visitors, children s centres and primary care teams and therefore a requirement that each practice has a named health visitor. Page 32 of 136
33 No. Vaccinated % Uptake No. Vaccinated % Uptake No. Vaccinated % Uptake No. Vaccinated % Uptake No. Vaccinated % Uptake No. Vaccinated % Uptake No. Vaccinated % Uptake No. Vaccinated % Uptake No. Vaccinated % Uptake Immunisation and Vaccination Figure 27 - Practice level vaccinations to first birthday Up to 1st birthday DTap/IPV/ Men C Pneu G code Practice Name No. of children Swale CCG Figure 28 - Practice level vaccinations to second birthday G82023 Sheerness Health Centre (Dr Fahmy) G82026 Grovehurst Surgery G82035 Chestnuts Surgery G82057 St George's Medical Centre G82175 Canterbury Road Surgery G82231 London Road Medical Centre (Dr Wilcox) G82634 Saffron Way Health Centre G82663 Hollybank Surgery (Dr Matha) - Merged with Y G82667 Teynham Medical Centre G82671 Iwade Health Centre G82682 Om Medical Centre G82686 Minster Medical Centre G82687 Sheerness Health Centre (Dr Witts) G82693 Memorial Medical Centre G82698 London Road Surgery (Teynham) G82702 Milton Regis Surgery G82757 Lakeside Medical Centre G82791 Sheerness Health Centre (Dr Chandran) G82799 Healthy Living Centre (Sheppey) Y01009 Hollybank Surgery Y02506 Sheppey NHS Health Centre Plover Rd Source: Child Health Computer Up to 2nd birthday primaries Dtap/IPV/ MMR 1 Men C Pneu Up to 2nd birthday Hib/MenC Pneu G code Practice Name No. of children Swale CCG G82023 Sheerness Health Centre (Dr Fahmy) G82026 Grovehurst Surgery G82035 Chestnuts Surgery G82057 St George's Medical Centre G82175 Canterbury Road Surgery G82231 London Road Medical Centre (Dr Wilcox) G82634 Saffron Way Health Centre G82663 Hollybank Surgery (Dr Matha) - Merged with Y G82667 Teynham Medical Centre G82671 Iwade Health Centre G82682 Om Medical Centre G82686 Minster Medical Centre G82687 Sheerness Health Centre (Dr Witts) G82693 Memorial Medical Centre G82698 London Road Surgery (Teynham) G82702 Milton Regis Surgery G82757 Lakeside Medical Centre G82791 Sheerness Health Centre (Dr Chandran) G82799 Healthy Living Centre (Sheppey) Y01009 Hollybank Surgery Y02506 Sheppey NHS Health Centre Plover Rd Source: Child Health Computer Page 33 of 136
34 No. Vaccinated % Uptake No. Vaccinated % Uptake No. Vaccinated % Uptake No. Vaccinated % Uptake No. Vaccinated % Uptake No. Vaccinated % Uptake No. Vaccinated % Uptake No. Vaccinated % Uptake Figure 29 - Practice level vaccinations to fifth birthday Up to 5th birthday primaries Dtap/IPV/ MMR 1 Men C Pneu Up to 5th birthday boosters DTPP MMR 2 Hib/Men C Pneu G code Practice Name No. of children Swale CCG G82023 Sheerness Health Centre (Dr Fahmy) G82026 Grovehurst Surgery G82035 Chestnuts Surgery G82057 St George's Medical Centre G82175 Canterbury Road Surgery G82231 London Road Medical Centre (Dr Wilcox) G82634 Saffron Way Health Centre G82663 Hollybank Surgery (Dr Matha) - Merged with Y G82667 Teynham Medical Centre G82671 Iwade Health Centre G82682 Om Medical Centre G82686 Minster Medical Centre G82687 Sheerness Health Centre (Dr Witts) G82693 Memorial Medical Centre G82698 London Road Surgery (Teynham) G82702 Milton Regis Surgery G82757 Lakeside Medical Centre G82791 Sheerness Health Centre (Dr Chandran) G82799 Healthy Living Centre (Sheppey) Y01009 Hollybank Surgery Y02506 Sheppey NHS Health Centre Plover Rd Source: Child Health Computer The national Childhood Immunisation programme is an essential part of protecting children s health. Low vaccine up-take puts children at risk. The right to be offered immunisation is enshrined in the NHS Constitution. Lower than acceptable levels of immunisation in east Kent were reviewed by a National Support Team in 2010 who made 29 detailed recommendations. The strategic aim is: To achieve herd immunity (95%+) in the population through increased uptake of immunisation; To ensure immunisation services are equitable and accessible; To provide a high quality standardised immunisation service; To ensure the implementation of NICE guidance relating to immunisation. Clearly Swale CCG practices demonstrate mixed rates which highlights the need to keep focused on effective immunisation to achieve optimal rates. Notwithstanding that higher rates of MMR have been achieved since the dis-information of risk affected people s confidence, the England recommended rate has not been reached in the Swale CCG area. Page 34 of 136

35 Child wellbeing health overview Figure 30 - Child Wellbeing Index Health and disability scores in the Swale CCG area This is a mapped overall summary of children s health drawn from a specific field of children s indicators of wellbeing based on a variant of the Index of Multiple Deprivation as published in It covers for this purpose: All emergency admissions to hospital for children aged 0-18 as a proportion of all children aged 0-18 in each LSOA. (Source: Hospital Episode Statistics for England, 2005/6); All outpatient hospital attendances for children aged 0-18 as a proportion of all children aged 0-18 in each LSOA. (Source: Hospital Episode Statistics for England, 2005/6); The proportion of children aged 0-16 receiving Disabled Living Allowance. (Source: DWP, 2005). Particular attention should be drawn to a greater proportion of children with poor health and disability found in Sheerness West, Sheerness East, Queenborough and Halfway, Murston and Milton Regis. Page 35 of 136
36 Child wellbeing overview material wellbeing Figure 31 - Child Wellbeing Index Material wellbeing scores in the Swale CCG area This map describes material wellbeing for children as analysed by a variant of the Index of Multiple Deprivation Particular note should be taken of Leysdown and Warden, Sheerness West, Queenborough and Halfway, Sheerness East, Kemsley, Milton Regis and Murston. Children born into poverty are more likely when compared to affluent families, to: Die in the first year of life; Be born small, or born early, or both; Be bottle fed; Die from an accident in childhood; Smoke and have a parent who smokes; Have poor nutrition; Become a lone parent; Have or father children younger; Suffer from mental health problems; Die in an accident; Die younger. Page 36 of 136

37 Figure 32 - Crude admission rates for deliberate and unintentional injury for 0-17 year olds by local authority in east Kent Although Swale has the highest crude rates in comparison to the other CCGs in Kent, overall their rates have dropped considerably since 2010/11. Page 37 of 136

38 Child and Adolescent Mental Health Services Figure 33 - Age specific CAMHS contact rates for children and young people aged 0-18 by electoral ward of residence Overall Swale has relatively low age specific contact rates for children and young people aged Page 38 of 136
. The national programme finished in 2011 but the Kent strategy is to reduce the rate of teenage conceptions in all districts to fewer than 40 per 1,000 young women under the age of 19 by 2015.")
39 Teenage Pregnancy Figure 34 - Teenage conceptions Swale CCG area The Swale CCG area has seen a welcome reduction in the rates of teenage pregnancy since the national programme commenced (1998). The national programme finished in 2011 but the Kent strategy is to reduce the rate of teenage conceptions in all districts to fewer than 40 per 1,000 young women under the age of 19 by Successful reductions in teenage pregnancy rates are the result of a strategy that combines the availability of sexual health services with working on the wider determinants of good health largely a partnership issue. Fundamentally the phenomenon of teenage pregnancy is a product of poor aspiration and self-regard amongst young people. The sustained downward trends in rates cannot be presumed to continue as the current national economic situation makes this a very difficult time for young people. Page 39 of 136

40 Older People As the population ages the need for health care increases. People are living longer and managing better with long term conditions. Figure 35 - Life expectancy at age by electoral wards in Swale CCG area The proportion of the Swale population aged 65+ is 17.3%, 1.9% are over the age of 85+, lower than the proportions for Kent 18.3% and 2.4% respectively. The population of Swale CCG who reach 65 years can expect to live a further 20.5 years compared to 21.1 years for Kent. Swale CCG has the third lowest life expectancy at 65+ of all CCGs. There are 6 wards in the CCG with a life expectancy at age 65 that is greater than that for Kent. Page 40 of 136
. The lowest rates are to be found south of Sittingbourne (Woodstock, West Downs and St Michaels). The estimated rates are considerably higher than the England estimate of 22.")
41 Chronic Diseases Risk Factors for Chronic Disease Smoking Prevalence Figure 36 - Modelled smoking prevalence estimates in the Swale CCG area Smoking rates are highest around central Sittingbourne and Sheerness (over 35%). The lowest rates are to be found south of Sittingbourne (Woodstock, West Downs and St Michaels). The estimated rates are considerably higher than the England estimate of 22.7%, the Kent estimate of 21.3% and the Swale Borough Council area estimate. Also of especial concern is the rate of smoking during pregnancy. 20% of mothers within the Swale Borough Council area continue to smoke through this period. In this respect, the Swale area and indeed all other parts of east Kent are now classified as a national outlier for poor health. Page 41 of 136

42 Figure 37 - Smoking prevalence in 16+ registered population *The crude rates are calculated by dividing the actual number of known smokers into the registered practice population without standardising using the European population estimates. Important note: The register figure does not represent all patients who smoke, but represents a count of patients noted as smoking within the last 15 months, who also have any combination of the following conditions: coronary heart disease, stroke/tia, hypertension, diabetes, COPD, asthma. (A patient with more than one of these conditions is counted only once.) Page 42 of 136

43 Adult Obesity Prevalence Figure 38 - Modelled adult obesity prevalence estimates in the Swale District area 30.2% of adults are estimated to be obese in the Swale Borough Council area. This position is significantly worse than the England average. Wards on the Isle of Sheppey have relatively higher estimated rates of obesity than those on the main land. Page 43 of 136

44 Figure 39 - Obesity prevalence in 16+ registered population Alcohol Misuse Figure 40 - Age standardised admission rate for alcohol specific* admission - trends for Swale CCG resident patients by gender Page 44 of 136
45 There has been a steady increase in the trend of alcohol specific admissions since In 2008 there was a slight decrease in admissions but there seems to be a fairly significant upward trend for males and females if you look at the last 5 years. The alcohol profile for Swale shows that generally Swale compares well to the England average. The trend in alcohol specific admissions shows an increase in males between 2008/09 and 2009/10, whist the rate for females has increased but on a smaller scale. Figure 41 - Alcohol specific admissions 2006/ /13 - Age specific rates for Swale CCG registered patients aged under 18 The trend for under 18s alcohol admissions has been erratic over the last five years, with a number of peaks and troughs this may be due in part to the small number of admissions for this indicator. Page 45 of 136
46 Figure 42 - Local alcohol profile - Swale compared to England and regional average Page 46 of 136
47 Alcohol and Drug Misuse treatments Eastern and Coastal Kent area 2012/13 The following data on treatment activity from the National Treatment Agency for Substance Misuse covers the whole of the NHS Eastern and Coastal Kent area. It is not possible to disaggregate the data to CCG level at the present time. Furthermore in this regard, activity is being used as a proxy for need. Nevertheless what the data highlights are routes into treatment, common treatment programmes and numbers participating in such programmes and exit from such programmes. It also highlights the age and gender profile of those actively in treatment, their ethnicity, abuse patterns at the time of treatment, adjunctive drug misuse and other needs. Table 4 - Alcohol Treatment System Information Number of clients in treatment year to date (YTD) - alcohol is the primary drug 1283 Number and % of clients with a new presentation to treatment YTD - alcohol is the % primary drug Number of clients receiving an alcohol specific intervention YTD - alcohol is not the 5 primary drug Number of clients exiting the treatment system YTD - alcohol is the primary drug 1272 Table 5 - Treatment Entry Source: NHS National Treatment Agency for Substance Misuse Referral source into treatment of all new presentations (YTD) Number Percent Health and Mental Health Services: A & E Health and Mental Health Services: Hospital 3 6 0% 1% Health and Mental Health Services: GP % Health and Mental Health Services: Other 45 5% Self, Family and Friends % Community Based Care Services 39 4% Children and Family Services 1 0% Substance Misuse Services 65 7% Criminal Justice % Other 18 2% Inconsistent/Missing 0 0% Source: NHS National Treatment Agency for Substance Misuse Page 47 of 136
48 Table 6 - In Treatment Common Treatment Pathways (clients latest treatment journey YTD) Common Treatment Pathways - (clients latest treatment journey YTD) Number Percent Number Percent Structured Psychosocial Intervention Only % Psychosocial and SDP 7 1% Other Structured Treatment (OST) Only 19 1% Residential Rehabilitation (RR) Only 5 0% Young Person Intervention Only 3 0% IP and Psychosocial 7 1% Prescribing Only 63 5% SDP and OST 0 0% Psychosocial and OST 3 0% Inpatient, Psychosocial and OST 0 0% Structured Day Programme (SDP) Only 87 7% Prescribing, Psychosocial and OST 2 0% Inpatient Treatment (IP) Only 9 1% Psychosocial, SDP and OST 1 0% Prescribing and Psychosocial 95 7% All Other Combinations (inc IP/RR) 19 1% IP and OST 0 0% All Other Combinations % Prescribing and OST 2 0% No Intervention Commenced 0 0% Source: NHS National Treatment Agency for Substance Misuse Table 7 - In Treatment - all interventions commenced (clients latest treatment journey YTD) All Interventions commenced (clients latest treatment journey YTD) ALC - Inpatient Treatment ALC - Residential Rehabilitation ALC - Community Prescribing ALC - Structured Psychosocial Intervention ALC - Structured Day Programmes ALC - Other Structured Treatment Non-Alcohol Specific Intervention Young Person Intervention Pharmacological Intervention (CDS-J) Psychosocial Intervention (CDS-J) Table 8 - Treatment Exits - Treatment Systems Exits (YTD) Number Percent* 34 3% 6 0% % % % 40 3% 22 2% 3 0% % % * % are calculated based on the number of clients in treatment YTD. As a client may receive more than one type of intervention in a journey % may sum to more than 100. Source: NHS National Treatment Agency for Substance Misuse Number Percent Average Length of Journey Prior to Exit (mean number of days) Completed - Planned Exit % 155 Unplanned Exit % 115 Transferred - Not in Custody % 170 Transferred - In Custody 8 10% 145 Referred On (old code) 0 0% 0 Source: NHS National Treatment Agency for Substance Misuse Page 48 of 136
49 Table 9 - Treatment Exits - Intervention Exit Status (ending YTD) Inpatient Treatment Residential Community Rehabilitation Prescribing Structured Psychosocial Intervention Structured Day Programme Other Structured Treatment Non Alcohol Specific Intervention Young Persons Intervention Pharmacological Intervention (CDS-J) Psychosocial Intervention (CDS-J) Interventions Ended Interventions with an Exit Status % Interventions with an Exit Status 100% 100% 100% 100% 100% 100% 100% 100% 100% 100% 100% Mutually Agreed Planned Exits Client Unilateral Unplanned Exits Intervention Withdrawn No Exit Status Recorded % Mutually Agreed Planned Exit 97% 67% 82% 83% 85% 95% 83% 89% 84% 79% 83% % Client Unilateral Unplanned Exits 3% 17% 16% 16% 11% 5% 8% 11% 12% 20% 16% % Intervention Withdrawn 0% 17% 2% 1% 4% 0% 8% 0% 3% 1% 2% % No Exit Status Recorded 0% 0% 0% 0% 0% 0% 0% 0% 0% 0% 0% Source: NHS National Treatment Agency for Substance Misuse TOTAL Table 10 - Treatment Exits - Individuals retained on the last day of the reporting period 31 March 2012 Number of Individuals retained on the last day of the period 11 Percentage of individuals in treatment YTD retained at the end of the period 1% Average Length of Journey on last day of reporting period (mean number of days) 143 Source: NHS National Treatment Agency for Substance Misuse Table 11 - Alcohol Client Information - Client Demographics Age group at mid-point of the year - all in treatment (YTD) Male Female Number Percent Number Percent % 38 3% % 37 3% % 57 4% % 84 7% % 73 6% % 80 6% % 54 4% % 27 2% % 25 2% % 17 1% Total % % Source: NHS National Treatment Agency for Substance Misuse Page 49 of 136
50 Table 12 - Alcohol Client Information - Ethnicity - All in treatment (YTD) Number Percent Number Percent White British % Bangladeshi 1 0% White Irish 11 1% Other Asian 2 0% Other White 24 2% Caribbean 0 0% White & Black Caribbean 5 0% African 3 0% White & Black African 1 0% Other Black 3 0% White & Asian 1 0% Chinese 0 0% Other Mixed 4 0% Other 3 0% Indian 0 0% Not Stated 3 0% Pakistani 0 0% Unknown / Missing or Inconsistent 0 0% Source: NHS National Treatment Agency for Substance Misuse Table 13 - Alcohol Client Information - All Interventions commenced (clients latest treatment journey YTD) Age - Band Sex Inpatient Treatment Residential Community Rehabilitation prescribing Structured Psychosocial Intervention Structured Day Programme Other Structured Treatment Non Alcohol Specific Intervention Young Persons Intervention Pharmacological Intervention (CDS-J) Psychosocial Intervention TOTAL (CDS-J) M F M F M F M F M F M F M F M F M F M F Source: NHS National Treatment Agency for Substance Misuse Page 50 of 136
51 Table 14 - Additional Client Information - Drinking Days and Units - all in treatment (YTD) Drinking Days and Units - all in treatment (YTD) Number of units on a typical drinking day Missing or Invalid Number of drinking days in the past 28 days Missing or Invalid Units per Month Missing Male Female All Number Percent Number Percent Number Percent 0 0% 0 0% 0 0% 78 10% 52 11% % % % % % % % % 90 18% % 80 10% 39 8% 119 9% 76 10% 26 5% 102 8% 74 9% 15 3% 89 7% Source: NHS National Treatment Agency for Substance Misuse Page 51 of 136
52 Table 15 - Additional Client Information - Adjunctive Drug Use - all in treatment (YTD) Adjunctive Drug Use - all in treatment (YTD) Second Drug Third Drug Heroin Methadone Other opiate Benzodiazepine Amphetamine Cocaine Crack Hallucinogens Ecstasy Cannabis Solvents Barbiturates Major Tranquiliser Anti-depressants Other drug Novel Psychoactive Substances Prescription Drugs Alcohol No second/ third drug or misuse free Missing Number Percent Number Percent 31 2% 10 1% 5 0% 0 0% 1 0% 1 0% 10 1% 11 1% 17 1% 11 1% 30 2% 8 1% 7 1% 7 1% 1 0% 2 0% 3 0% 6 0% % 18 1% 0 0% 0 0% 0 0% 0 0% 0 0% 0 0% 25 2% 1 0% 3 0% 1 0% 0% 0% 8 1% 2 0% 0 0% 0 0% % % 38 3% 58 5% Source: NHS National Treatment Agency for Substance Misuse Table 16 - Additional Client Information - Dual Diagnosis - all new presentations (YTD) Number Percent Dual diagnosis % No dual diagnosis % Missing status 1 0% Source: NHS National Treatment Agency for Substance Misuse Table 17 - Additional Client Information - Accommodation Need - all new presentations (YTD) Number Percent NFA - urgent housing problem 36 4% Housing Problem 80 9% No Housing Problem % Other Housing Problem (includes young persons accommodation need codes) 1 0% Missing status 0 0% Source: NHS National Treatment Agency for Substance Misuse Table 18 - Additional Client Information - Individuals with children - all new presentations Number Percent Parent living with own children % Other child contact: Living with children 11 1% Other child contact: Parent not living with children % Not a parent / no child contact % Both fields blank or "declined to answer" 2 0% Source: NHS National Treatment Agency for Substance Misuse Page 52 of 136
53 Kent Pharmacies with needle exchange services Town Address Opening Times Telephone Number Faversham Carlisles Pharmacy, 14 Cross Lane, ME13 8PN 8:45am 6:30pm Sheerness Mistry Chemist, Wood Street, Sheerness, Kent, ME12 1HA Saturday 9:00am 3:00pm Closed Sunday Sittingbourne Lloyds Pharmacy, 80 High Street, Milton, Sittingbourne, Kent, ME10 2AN Mon-Fri 9am 1pm, 2pm - 6pm Saturday 9am 12:30pm Closed Sunday Teynham Greenstreet Pharmacy, 105 London Road, Teynham, Kent, ME9 9QL Mon, Tue, Thur & Fri 9am 1pm & 2pm 6pm Wed & Sat 9am 1pm Closed Sunday Chronic Disease Patterns Multi-Morbidity An ageing population and increased prevalence of chronic diseases requires a service reorientation away from the current emphasis on acute and episodic care, towards prevention, selfcare, more consistent standards of primary care and care that is well co-ordinated and integrated. The King s Fund has identified 10 priorities for action: King s Fund 10 Priorities for Commissioners Active support for self-management Primary prevention Secondary prevention Managing ambulatory care sensitive conditions Improving the management of patients with both mental and physical health needs Care co-ordination through integrated health and social care teams Improving primary care management of end-of-life care Effective medicines management Managing elective activity referral quality Managing emergency activity urgent care A common feature of all 10 priorities is the degree to which they are dependent upon a change within primary care services and the way in which such services relate to the rest of health and social care. Clinical practise conventionally treats and thus measures individual diseases. Such an approach is increasingly challenged by the scale of service demands facing the NHS (and is also a worldwide problem) through the concept of multi-morbidity. In essence patients with chronic conditions often have more than one such condition simultaneously. It is the challenge of managing the complexities of co-morbid and multi-morbid conditions that gives rise to complications, often leading to high cost, unplanned, unscheduled care. Page 53 of 136
54 A landmark Scottish study (Barnett et al 2012) has examined the distribution of multi-morbidity and of co-morbidity of physical and mental health disorders in relation to both age and socio-economic deprivation. In a cross sectional study data from 40 morbidities relating to 1,751,841 people registered with 314 medical practices in Scotland as of March 2007 was analysed according to the number of morbidities, disorder type (physical or mental), age, sex and socio-economic status. Multi-morbidity for the purpose of this study was defined as the presence of two or more disorders. 42.2% of all patients had one or more morbidity. 23.2% were multi-morbid. Although the prevalence of multi-morbidity increased substantially with age and was present in most people aged 65 and older, the absolute number of people with multi-morbidity was higher in those younger than 65 (210,500 v 194,196). Onset multi-morbidity occurred years earlier in people living in the most deprived areas compared to the most affluent. The presence of a mental health disorder increased as the number of physical morbidities increased and was much greater in more deprived than in less deprived people. The authors recommend that generalist clinicians provide personalised, comprehensive continuity of care since the single disease framework on which most health care research and indeed medical education is based is profoundly challenged by this study. An ageing population and increased prevalence of chronic disease requires a strong re-orientation away from the current emphasis on acute and episodic care, towards prevention, self-care and more consistent standards of primary care that are well co-ordinated and integrated. The King s Fund (2011) has identified 10 priorities for action and most of these demand a change within primary care and in the way in which primary care relates to the rest of the health care system. The Swale CCG Board through its leadership needs to enable: The systematic and pro-active management of chronic disease within primary care. This will improve health outcomes, manage down inappropriate use of hospital services but will also make a significant and positive contribution to reducing health inequalities; The empowerment of patients. Patients are arguably the greatest untapped resource within the NHS. The active engagement of patients is a common thread throughout the 10 priorities identified by the King s Fund; A population-based approach to commissioning. This presents a dichotomy in relation to the primary care clinician s role as advocate for the individual patient but also in shifting a focus from patients that present in practice to the wider population needs and disease patterns. The presentation of this needs assessment, keeping separate the population-based patterns from practice-based patterns of disease, is illustrative of the conceptual challenge of this task; More integrated models of care. The aim is to improve the quality of care for patients and reduce waste, especially as CCGs are being tasked with providing leadership within the NHS at a time of financial constraint in which the burden of disease is growing, driven in part by demographic change, yet medical advances offer increasing opportunities to treat disease. Page 54 of 136


55 Cancer Registrations Figure 43 - Crude Cancer Registration Rates for the Period for all Cancers. All ages Cancer registrations cover all ages. Overall registrations for Swale CCG are marginally lower than the rate for Kent. Figure 44 - Prevalence of Cancer in practices within Swale CCG 2012/13 Page 55 of 136
 and Milton Regis Ward.")
56 Figure 45 Age-standardised U75 mortality rates for cancer residents by electoral ward There is some relationship between age standardised mortality rates for under 75 cancers and deprivation. The highest rates are found on the Isle of Sheppey (Sheerness East & West, Queenborough and Halfway) and Milton Regis Ward. The wards with the lowest rates are Teynham & Lynsted, West Downs, Woodstock and St Michaels. Figure 46 - Crude cancer registration rates for for all cancers in the under 75s by LA in east Kent It is important to recognise that the registration rates of cancers in the under 75s are ascribed to local authority areas rather than CCG areas. Overall Swale has a marginally lower rate of such registrations compared to the Kent county total. Page 56 of 136


57 Diabetes Figure 47 - Diabetes QOF register 2012/13 Figure 48 - Diabetes prevalence by practice The recorded prevalence of diabetes varies between practices from 4.1% to 9.7%. The prevalence for the CCG is 6.8% which is second to Thanet CCG with the highest prevalence of diabetes for the eight CCGs in Kent. Page 57 of 136

58 Figure 49 - Diabetes recorded prevalence QOF 2012/13 vs expected prevalence In 2012/13 there were 5,787 people on diabetes registers within Swale CCG. The expected number of diabetic patients is 6,080; this leaves potentially 293 patients undiagnosed. Figure 50 - Correlation between diabetes prevalence and obesity prevalence - Swale CCG practices 2012/13 The relationship between the level of diabetes and obesity has been explored by correlating the QOF registers for these conditions. Page 58 of 136
59 Figure 51 - Age standardised emergency admission rates for Swale CCG residents for diabetes 2010/ /13 by electoral ward The wards with the highest age standardised emergency admission rates for diabetes are Sheerness West, Sheerness East and Murston. Page 59 of 136
60 Figure 52 - Elective and emergency hospital admission rates for diabetes 2006/ /11 The trend in elective admissions had been declining until 2009/10, however there has been an increase between 2009/10 and 2011/12. The elective admission rate for Swale CCG is slightly higher than that for Kent and Medway. Emergency admissions for diabetes are higher than Kent and Medway s with a significant increase between 2010/11 and 2011/12. The rate for Kent and Medway has shown a year on year increase. **PLEASE NOTE!! All graphs and charts which include the mean cost and/or total expenditure for various diagnoses have not been updated since 2010/11 as the information in the SUS database doesn t match up with figures from previous years, work is being done to look into any changes that may have been incurred to have affected this. Page 60 of 136
61 Annual expenditure ( ) Annual expenditure ( ) Figure 53 Mean cost per hospital admission for diabetes 2006/ /11 3,000 2,500 2,000 1,500 1, / / / / /11 Swale 2,439 1,487 1,587 1,787 2,026 Kent and Medway 2,044 1,857 1,677 1,697 2,039 Source: SUS/ KMPHO Ordinary admissions only Figure 54 - Expenditure on hospital admissions for diabetes 2006/ /11 250, , , ,000 50, / / / / /11 Swale 190, , , , ,666 Source: SUS/ KMPHO Ordinary admissions only The mean cost of a hospital admission for diabetes has been increasing year on year from 2008 and is nearing the mean cost shown in 2006/07. Page 61 of 136

 and England (3.34%).")
62 Coronary Heart Disease (CHD) Figure 55 - Coronary Heart Disease QOF register 2012/13 Figure 56 - Prevalence of CHD by practice 2012/13 3,284 Swale CCG patients are recorded on the QOF CHD register and with a prevalence of 3.05% which is lower than Kent and Medway (3.13%) and England (3.34%). Page 62 of 136
![Figure 57 - CHD: Expected [2011 modelled prevalence] vs Observed [2012/13 QOF] The expected prevalence of CHD in Swale is estimated to be 5,430 which](/docs-images/89/97532272/images/63-0.jpg "means there are potentially 2,146 people who are unaware they have the condition. The observed number of people on the CHD register is 3,284.")

63 Figure 57 - CHD: Expected [2011 modelled prevalence] vs Observed [2012/13 QOF] The expected prevalence of CHD in Swale is estimated to be 5,430 which means there are potentially 2,146 people who are unaware they have the condition. The observed number of people on the CHD register is 3,284. Figure 58 - Elective and emergency admissions rates for CHD 2006/ /13 Elective admissions are declining in Swale CCG; however emergency admissions increased between 2009/10 and 2010/11. The standardised admission rate for the three year period 2010/11 to 2012/13 is lower than Kent and Medway. Page 63 of 136
64 Annual expenditure ( ) Annual expenditure ( ) Figure 59 - Mean cost per hospital admission for CHD 2006/ /11 3,500 3,000 2,500 2,000 1,500 1, / / / / /11 Swale 2,588 2,827 2,741 3,103 3,078 Kent and Medway 2,618 2,646 2,703 3,222 3,192 Source: SUS, KMPHO Ordinary admissions only Figure 60 - Expenditure on hospital admissions for CHD 2006/ /11 1,600,000 1,400,000 1,200,000 1,000, , , , , / / / / /11 Swale 1,128,473 1,173,286 1,452,487 1,396,128 1,394,434 Source: SUS, KMPHO Ordinary admissions only The mean cost per admission showed a small reduction between 2009/10 and 2010/11 and is slightly lower than the mean cost for Kent and Medway. Page 64 of 136
65 Figure 61 - Age standardised emergency admission rates for Swale CCG residents for acute myocardial infarction 2010/ /13 by electoral ward Figure 62 - Age standardised emergency admission rates for Swale CCG residents for revascularisation / /13 by electoral ward Page 65 of 136

66 Stroke Figure 63 - Stroke or transient ischemic attacks QOF register 2012/13 There were 1,527 patients on Swale CCG stroke registers in 2012/13, a prevalence of 1.4%. The expected and observed prevalence are broadly similar, with less variation between practices. This is one of the lowest in comparison to the other east Kent areas. Figure 64 - Prevalence of stroke by practice 2012/13 Page 66 of 136
![Figure 65 - Stroke: Expected [2011 modelled prevalence] vs Observed ([2012/13 QOF] Figure](/docs-images/89/97532272/images/67-1.jpg "66 - Age standardised emergency admission rates for Swale CCG residents for stroke")

67 Figure 65 - Stroke: Expected [2011 modelled prevalence] vs Observed ([2012/13 QOF] Figure 66 - Age standardised emergency admission rates for Swale CCG residents for stroke 2010/ /13 by electoral ward The highest emergency admission rates for stroke are to be found in the Sheerness West, Murston, St. Michaels and Leysdown and Warden wards. Page 67 of 136
68 Annual expenditure ( ) Figure 67 - Elective and emergency admissions for stroke 2006/ /13 Elective admissions for Swale CCG are lower than Kent and Medway although emergency admissions are slightly higher with a significantly high rate for the year 2011/12, however it would appear that this was an anomaly compared to previous years. Figure 68 - Mean cost per hospital admission for stroke 2006/ /11 6,000 5,000 4,000 3,000 2,000 1, / / / / /11 Swale CCG 3,890 4,816 4,062 2,849 3,412 Kent and Medway 3,889 3,945 3,737 3,520 4,173 Source: SUS, KMPHO Ordinary admissions only Page 68 of 136
69 Annual expenditure ( ) Figure 69 - Expenditure on hospital admissions for stroke 2006/ /11 900, , , , , , , , , / / / / /11 Swale CCG 824, , , , ,012 Source: SUS, KMPHO Ordinary admissions only Both total expenditure and the mean average cost for admissions were declining, until 2009/10 when there was a slight increase between 2009/10 and 2010/11 Figure 70 - Age standardised mortality rates for Swale CCG residents by electoral ward - under 75 circulatory disease Page 69 of 136


70 Chronic Obstructive Pulmonary Disease (COPD) Figure 71 - COPD QOF register 2010/11 Figure 72 - Prevalence of COPD by practice 2010/11 Prevalence of COPD is 1.9% which equates to a total of 2,054 patients compared to a rate of 1.7% for both Kent and Medway and England. The prevalence of COPD within Swale CCG ranges from 0.8% to 2.9%. Page 70 of 136
![Figure 73 - COPD: Expected [2011 modelled prevalence] vs Observed [2012/13 QOF] The Association of Public Health Observatory model estimates an](/docs-images/89/97532272/images/71-0.jpg "expected prevalence of 2,896 patients. This suggests that there may be 842 patients in Swale CCG with undiagnosed COPD.")

71 Figure 73 - COPD: Expected [2011 modelled prevalence] vs Observed [2012/13 QOF] The Association of Public Health Observatory model estimates an expected prevalence of 2,896 patients. This suggests that there may be 842 patients in Swale CCG with undiagnosed COPD. The elective admission rate is lower than that of Kent and Medway and has remained fairly stagnant over the last six years declining; however there is an increasing trend in the emergency admissions rate which is greater than that for Kent and Medway; who are both showing a year-onyear increase. Page 71 of 136
72 Figure 74 - Age standardised emergency admissions rates for Swale CCG residents for Chronic Obstructive Pulmonary Disease / /13 by electoral ward Higher emergency admission rates for COPD will be seen in Sheerness West, Sheppey Central, Leysdown and Warden and Milton Regis wards. Figure 75 - Age standardised emergency admission rates for Swale CCG residents for asthma 2010/ /13 by electoral ward Higher emergency admission rates for asthma will be seen in Sheerness West, Borden, West Downs and Milton Regis wards. Page 72 of 136
73 Mean cost per admission Figure 76 - Elective and emergency hospital admission rates for COPD 2006/ /11 Figure 77 - Mean cost per hospital admission for COPD 2006/ /11 3,000 2,500 2,000 1,500 1, / / / / /11 Swale CCG 2,081 2,044 1,904 2,180 2,328 Kent and Medway 1,883 1,902 1,852 2,267 2,435 Unfortunately the mean cost for COPD hospital admissions has been increasing steadily since 2006/07. The mean cost for Swale CCG is similar to that for Kent and Medway. Page 73 of 136
74 Annual expenditure ( ) Figure 78 - Expenditure on hospital admissions for COPD 2006/ /11 600, , , , , , / / / / /11 Swale CCG 330, , , , ,407 Figure 79 - Age standardised mortality rates for Swale CCG residents by electoral ward - all respiratory diseases Sheerness West, Milton Regis, Murston and Leysdown and Warden wards have the highest mortality rates for all respiratory diseases. Page 74 of 136
75 Mental Health In different types of areas, people are more or less likely to incur common mental illnesses. To some extent this can be predicted from characteristics of the population measured by the census or other types of survey. Mental health needs indices estimate by how much. A needs index of 0.8 suggests that there will be 20% less illness in an area than in the country as a whole, an index of 1.2 suggests 20% more. Mental Illness Needs Index In different types of areas, people are more or less likely to incur common mental illnesses. To some extent this can be predicted from characteristics of the population measured by the census or other types of survey. Mental health needs indices estimate by how much. A needs index of 0.8 suggests that there will be 20% less illness in an area than in the country as a whole, an index of 1.2 suggests 20% more. Figure 80 - Mental Illness Needs Index 20% more 5-20% less 20% less 5-20% more Expected national rate (+/- 5%) Mental Illness in Children and Young People Please refer to the Children s section of this needs assessment. The presumption being made is that children are children first, with specialist clinical needs as a second order consideration. Page 75 of 136

76 Prevalence of more severe mental illness in adults Figure 81 - Age specific adult mental health patient rates (ages 16-64) for 2012 by electoral ward of residence Higher rates of contact with specialist mental health services for adult persons aged up to 64 can be seen in St. Michaels and Leysdown and Warden. Medium rates are also shown for Borden. Figure 82 - Age specific elderly mental health patient rates (ages 65+) for 2012 by electoral ward of residence The highest concentrations of contact with specialist mental health services for persons aged 65 and above are to be found in Sheerness East & West, Iwade & Lower Halstow, Kemsley, Borden and St. Michaels. The contrast between older age groups and the high contact rate for residents of Iwade and Lower Halstow which had low rates of under 65 contacts is worth noting. Page 76 of 136


77 Figure 83 - Prevalence of mental illness in practices in Swale CCG 2012/13 Swale CCG practices overall have lower rates of patients with mental illness as measured by QOF, compared to the national and Kent & Medway average. This may reflect overall the younger population make-up of the Borough. The higher rates are found at Sheppey Healthcare Centre, Iwade Health Centre and Milton Regis surgery. Page 77 of 136
78 Common mental illness described by reference to practice prescribing patterns Figure 84 - Anti-depressant drugs - January December 2011 As a broad pattern, higher prescribing rates for the Sheppey-based practices reflect higher rates of depression which correspondingly can be associated with social dysfunction manifesting itself in mental illness. Figure 85 - Drugs for Dementia - Swale CCG Practices The prescribing rates for dementia largely reflect the geographic distribution of older people with a diagnosed mental illness across the CCG area. Page 78 of 136

79 Long term conditions and mental health: Co-morbidities Many people with long term physical health conditions also have mental health problems. These can lead to significantly poorer health outcomes and reduced quality of life. Costs to the health care system are also significant by interacting with and exacerbating physical illness, co-morbid mental health problems raise total health care costs by at least 45% for each person with a long term condition and co-morbid mental health problem. This suggests that between 12% and 18% of all expenditure on long term conditions is linked to poor mental health and wellbeing. People with long term conditions and co-morbid mental health problems disproportionately live in deprived areas and have access to fewer resources of all kinds. The interaction between comorbidities and deprivation makes a significant contribution to generating and maintaining inequalities. Care for large numbers of people with long term conditions could be improved by better integrating mental health support with primary care and chronic disease management programmes, with closer working between mental health specialists and other professionals. Collaborative care arrangements between primary care and mental health specialists can improve outcomes with no or limited additional net costs. Innovative forms of liaison psychiatry demonstrate that providing better support for co-morbid mental health needs can reduce physical health care costs in acute hospitals. The CCG should consider prioritising the integration of mental and physical health care more closely as a key part of its strategy to improve quality and productivity in health care. Dementia Figure 86 - Dementia QOF register by CCG 2012/13 It is well documented that the prevalence of dementia is set to increase as the population ages. 2012/13 QOF registers had 522 patients recorded on the dementia register. Page 79 of 136

80 Figure 87 - Prevalence of dementia by practice 2012/13 Figure 88 - Emergency admission rates for all dementia diagnoses 2010/ /13 Most dementia patients are admitted to hospital as an emergency and the rate of admissions has been steadily increasing since 2006/07. Swale CCG has a higher admission rate for dementia than Kent and Medway and has the highest rate of all the CCGs. During 2012/13 there were a total of 220 emergency admissions for dementia. Page 80 of 136
81 Annual expenditure ( ) Mean cost per admission Figure 89 - Mean cost per emergency hospital admission for dementia diagnoses 1-3, 2006/ /11 3,500 3,000 2,500 2,000 1,500 1, / / / / /11 Swale 3,060 2,447 2,029 1,672 1,721 Kent and Medway 2,278 2,050 2,222 2,004 2,185 Source: SUS, KMPHO Ordinary admissions only Figure 90 - Expenditure on emergency hospital admissions for dementia diagnoses 1-3, 2006/ /11 500, , , , , , , , ,000 50, / / / / /11 Swale 333, , , , ,620 Source: SUS, KMPHO ordinary admissions only Page 81 of 136


82 Figure 91 - Number of older people with a mental health problem living in a residential or nursing home - March 2011 Figure 91.5-Number of older people receiving enablement or active care Page 82 of 136
 who are in receipt of day care Page 83 of 136")
83 Figure 92 - Number of older people (65+) who receive domiciliary/community support services care Figure 93 - Number of older people (65+) who are in receipt of day care Page 83 of 136

84 Sexual Health Teenage Conceptions Page 84 of 136

85 Page 85 of 136

86 HIV Page 86 of 136

87 Page 87 of 136

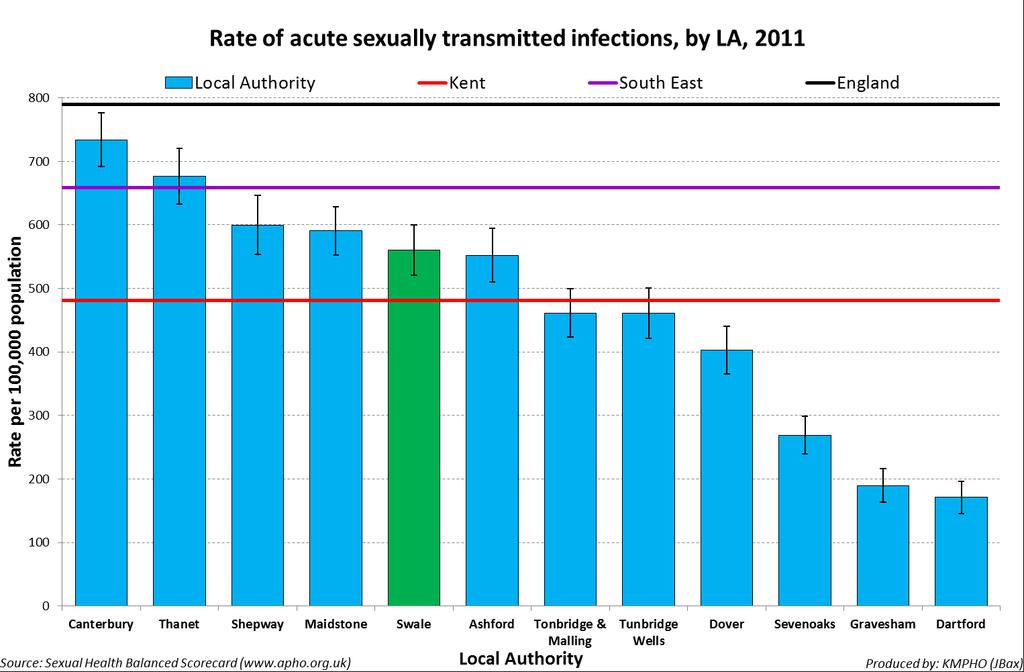
88 Syphillis, Gonorrhoea and acute sexually transmitted infections Page 88 of 136

89 Page 89 of 136

90 Page 90 of 136

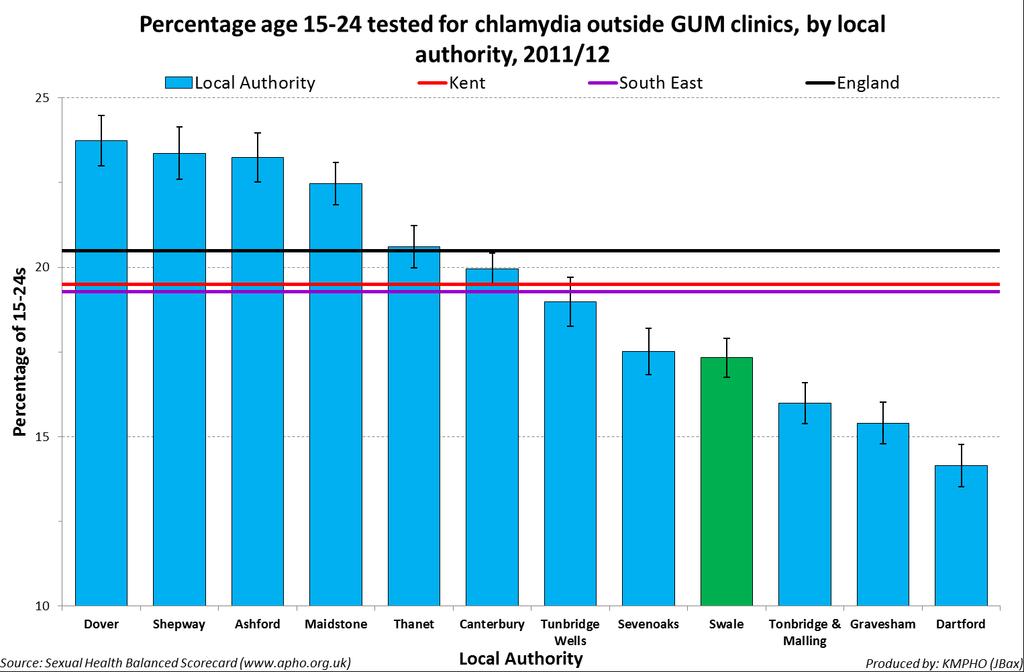
91 Chlamydia Page 91 of 136

92 Page 92 of 136

93 Hospital Activity A&E Attendances & Admissions Swale A&E Admissions Figure 94 - Swale CCG /12 Accident and emergency attendance rates for children aged 0-4 years There are modest rates of A&E attendance for children aged 0-4; the lowest rate wards corresponding with low numbers of children relative to the rest of the population. Page 93 of 136

94 Table 19 - Electoral ward age-specific accident and emergency attendance rates - Swale CCG residents aged 0-4 years /13 Ward Name 0-4 Milton Regis Sheppey Central Leysdown and Warden Sheerness West Roman Murston Queenborough and Halfway Hartlip, Newington and Upchurch Sheerness East St Michaels Minster Cliffs Borden Kemsley Woodstock Iwade and Lower Halstow Grove West Downs Chalkwell Table 20 - GP practice age-specific accident and emergency attendance rates - Swale CCG registered patients aged 0-4 years /13 Page 94 of 136
 relative to the general population.")
95 Figure 95 - Swale CCG 2012/13 Accident and emergency attendance rates for children aged 5-19 years There are modest rates of A&E attendance for children aged Interestingly Grove ward has higher rates of children (0-19) relative to the general population. There is no socio-economic factor (child poverty) that can at a population level be discerned as a driver for rates of attendance. Page 95 of 136
96 Table 21 - Electoral ward age-specific accident and emergency attendance rates - Swale CCG residents aged 5-19 years /13 Ward Name 5-19 Murston Leysdown and Warden Roman Sheerness East Sheppey Central Sheerness West Woodstock 97.1 Iwade and Lower Halstow 95.3 St Michaels 90.9 Chalkwell 90.8 Milton Regis 90.7 Queenborough and Halfway 89.8 Minster Cliffs 86.8 Borden 85.4 Kemsley 84.8 Hartlip, Newington and Upchurch 78.7 Grove 62.1 West Downs 54.7 Table 22 - GP practice age-specific accident and emergency attendance rates - Swale CCG registered patients aged 5-19 years /13 GP Surgery 5-19 Dr Beerstecher H J The Surgery Teynham Dr Sahu G B & Partner Grovehurst Surgery Dr Saha B K St George's Medical Centre The Chestnuts Surgery Dr Sikdar A N 99.7 Dr Murthy S R S 97.7 Dmc Healthcare Centre 97.0 Dr Pasola M 85.0 Memorial Medical Centre 85.0 Sheerness Health Centre 82.4 Dr Subash Chandran S 79.9 Minster Medical Centre 79.6 Dr Fahmy M M E & Partner 78.9 The Medical Centre 74.5 Holly Bank Surgery 74.0 Iwade Health Centre 58.4 Dr Ramu C & Partner 33.5 Page 96 of 136

97 Figure 96 Swale CCG /13 Accident and emergency attendance rates for people aged years Higher rates of attendance of residential people of working age can be discerned in Murston, Sheerness East and West and Leysdown and Warden. Murston, Kemsley, the Sheerness wards and Leysdown and Warden have significant populations of this age group living in relative deprivation. The people of Leysdown and Warden within this age group are a lower proportion of the ward population and therefore are making greater demands as A&E attenders. However this may also reflect the high seasonal population who are resident in holiday parks. Page 97 of 136
98 Table 23 - Electoral ward age-specific accident and emergency attendance rates - Swale CCG residents aged years /13 Ward Name Leysdown and Warden 244. Sheerness West 231. Murston 214. Sheerness East 200. Woodstock 199. Milton Regis 195. Sheppey Central 186. Roman 185. Queenborough and Halfway 176. Kemsley 175. Hartlip, Newington and Upchurch 169. Iwade and Lower Halstow 164. Chalkwell 163. Minster Cliffs 162. Grove 157. West Downs 153. St Michaels 144. Borden 124. Table 24 - GP practice age-specific accident and emergency attendance rates - Swale CCG registered patients aged years /13 GP Surgery Sheerness Health Centre Dr Fahmy M M E & Partner Dr Pasola M Dr Sahu G B & Partner St George's Medical Centre The Medical Centre Grovehurst Surgery Dr Sikdar A N Holly Bank Surgery Minster Medical Centre Dmc Healthcare Centre The Chestnuts Surgery Memorial Medical Centre Iwade Health Centre The Surgery Teynham Dr Subash Chandran S Dr Saha B K Dr Murthy S R S Dr Beerstecher H J Dr Ramu C & Partner Page 98 of 136

99 Figure 97 - Swale CCG /13 Accident and emergency attendance rates for people aged years Higher rates of attendance for people aged can be discerned in Leysdown and Warden, Sheerness West, Grove and Murston wards. These wards contain significant numbers of residents living in relative deprivation. Page 99 of 136

100 Table 25 - Electoral ward age-specific accident and emergency attendance rates - Swale CCG residents aged years /13 Ward Name Grove Leysdown and Warden Sheerness West Milton Regis Chalkwell Murston Sheerness East Hartlip, Newington and Upchurch Minster Cliffs Queenborough and Halfway Kemsley Roman St Michaels Woodstock Iwade and Lower Halstow Sheppey Central West Downs Borden Table 26 - GP practice age-specific accident and emergency attendance rates - Swale CCG registered patients aged years /13 Page 100 of 136

101 Figure /13 Accident and emergency attendance rates for people aged years There is a relatively greater demand on A&E services for the resident population in Sheerness East and Minster Cliffs. In contrast residents of Woodstock ward with a higher proportion of year olds makes a significantly smaller demand on A&E services. Page 101 of 136
102 Table 27 - Electoral ward age-specific accident and emergency attendance rates - Swale CCG residents aged years /13 Ward Name Kemsley Sheerness East Minster Cliffs Murston Sheerness West Sheppey Central St Michaels Roman Borden Milton Regis Leysdown and Warden Grove Queenborough and Halfway Hartlip, Newington and Upchurch West Downs Woodstock Chalkwell Iwade and Lower Halstow Table 28 - GP practice age-specific accident and emergency attendance rates - Swale CCG registered patients aged years /13 GP Surgery Sheerness Health Centre Dr Beerstecher H J Dr Murthy S R S Dr Pasola M Dr Sikdar A N Dr Fahmy M M E & Partner The Surgery Teynham The Chestnuts Surgery St George's Medical Centre Dr Sahu G B & Partner Dmc Healthcare Centre Memorial Medical Centre Grovehurst Surgery The Medical Centre Minster Medical Centre Dr Subash Chandran S Dr Saha B K Iwade Health Centre Dr Ramu C & Partner Holly Bank Surgery Page 102 of 136

103 Figure /13 Accident and emergency attendance rates for people aged 85+ years Low rates of A&E attenders for 85+ residents should be noted for areas previously highlighted as containing relatively deprived populations. The highest attendance rates are from the central area of Sheppey and for the south Sittingbourne wards. Page 103 of 136
104 Table 29 - Electoral ward age-specific accident and emergency attendance rates - Swale CCG residents aged 85+ years /13 Ward Name 85+ Milton Regis West Downs Borden Roman Leysdown and Warden Sheerness East Sheerness West Chalkwell Minster Cliffs Sheppey Central Iwade and Lower Halstow Murston Woodstock Hartlip, Newington and Upchurch Queenborough and Halfway Grove Kemsley St Michaels Table 30 - GP practice age-specific accident and emergency attendance rates - Swale CCG registered patients aged 85+ years /13 GP Surgery 85+ Dr Saha B K Dr Sikdar A N Dr Fahmy M M E & Partner Minster Medical Centre Sheerness Health Centre Grovehurst Surgery Dr Beerstecher H J Dr Murthy S R S St George's Medical Centre The Medical Centre Dr Ramu C & Partner Memorial Medical Centre The Chestnuts Surgery Holly Bank Surgery Dmc Healthcare Centre Dr Sahu G B & Partner Dr Pasola M Dr Subash Chandran S Iwade Health Centre The Surgery Teynham Page 104 of 136

105 Figure /13 Accident and emergency attendance rates all ages Overall the highest attendance rates are of residents in Leysdown and Warden, Murston, Milton Regis, Teynham and Lynstead and Sheerness West & East wards. Page 105 of 136
106 Table 31- Electoral ward age-specific accident and emergency attendance rates - Swale CCG residents all ages /13 Ward Name All Ages Leysdown and Warden Minster Cliffs Sheerness West Woodstock Milton Regis Murston Roman Hartlip, Newington and Upchurch Sheerness East Queenborough and Halfway Sheppey Central Borden St Michaels West Downs Grove Chalkwell Kemsley Iwade and Lower Halstow Table 32 - GP practice age-specific accident and emergency attendance rates - Swale CCG registered patients all ages /13 GP Surgery All Ages Dr Pasola M Dr Sikdar A N Sheerness Health Centre St George's Medical Centre The Chestnuts Surgery Dr Fahmy M M E & Partner The Surgery Teynham Dr Sahu G B & Partner Dr Murthy S R S Dr Beerstecher H J The Medical Centre Grovehurst Surgery Minster Medical Centre Memorial Medical Centre Dr Subash Chandran S Dmc Healthcare Centre Holly Bank Surgery Dr Saha B K Iwade Health Centre Dr Ramu C & Partner Page 106 of 136

107 Swale Emergency Admissions Figure 101 Swale CCG 2012/13 Emergency admission rates for children aged 0-4 years Higher rates of emergency admission should be noted for Murston, Sheerness West, Sheppey Central and Leysdown and Warden wards. Minster Cliffs and Leysdown and Warden have smaller proportions of 0-4 year olds relative to the total ward populations. These admissions may be inflated by seasonal residents of holiday parks. Page 107 of 136
108 Table 33 Electoral ward age-specific emergency admission rates Swale CCG residents aged 0-4 years 2012/13 Ward Name 0-4 Milton Regis 62.3 Sheerness West 56.3 Sheppey Central 54.2 Murston 50.0 Roman 49.5 Queenborough and Halfway 44.0 Iwade and Lower Halstow 43.4 Leysdown and Warden 42.4 Sheerness East 38.1 Hartlip, Newington and Upchurch 37.2 Kemsley 37.2 Grove 30.1 Minster Cliffs 27.4 St Michaels 26.9 Woodstock 25.2 West Downs 19.2 Borden 8.8 Chalkwell 0.0 Table 34 GP practice age-specific emergency admission rates - Swale CCG registered patients aged 0-4 years /13 GP Surgery Name 0-4 Dr Saha B K 99.4 Dr Sahu G B & Partner 55.0 The Chestnuts Surgery 52.4 St George's Medical Centre 50.7 Dr Subash Chandran S 46.0 Sheerness Health Centre 42.6 Dmc Healthcare Centre 39.1 Holly Bank Surgery 38.8 Iwade Health Centre 38.6 Dr Beerstecher H J 34.8 Minster Medical Centre 30.9 Grovehurst Surgery 28.4 Dr Ramu C & Partner 28.2 The Medical Centre 26.5 Dr Fahmy M M E & Partner 26.0 Dr Pasola M 26.0 Memorial Medical Centre 22.5 Dr Murthy S R S 12.8 The Surgery Teynham 10.5 Dr Sikdar A N 0.0 Page 108 of 136

109 Figure Swale CCG /13 Emergency admission rates for children aged 5-19 years The notably high rate of emergency admissions for children aged 5-19 resident in Leysdown and Warden should be noted. The proportion of children in this age group relative to the total ward population is low thus particularly high rates of emergency admissions should be noted. However this may be influenced by seasonal factors. Page 109 of 136
110 Table 35 - Electoral ward age-specific emergency admission rates Swale CCG residents aged 5-19 years 2012/13 Ward Name 5-19 Leysdown and Warden 32.6 Sheerness East 30.8 Iwade and Lower Halstow 23.5 Murston 23.4 Roman 22.0 Woodstock 20.4 St Michaels 16.8 Chalkwell 14.3 Minster Cliffs 13.4 Sheerness West 11.9 Queenborough and Halfway 10.4 Sheppey Central 10.1 Borden 10.1 Hartlip, Newington and Upchurch 7.6 Grove 7.5 Milton Regis 7.0 Kemsley 6.9 West Downs 0.0 Table 36 - GP practice age-specific emergency admission rates - Swale CCG registered patients aged 5-19 years /13 GP Surgery Name 5-19 Dr Beerstecher H J 40.9 The Surgery Teynham 30.6 St George's Medical Centre 25.2 Dmc Healthcare Centre 23.2 The Chestnuts Surgery 21.1 Dr Subash Chandran S 19.0 Dr Saha B K 15.0 Grovehurst Surgery 15.0 Memorial Medical Centre 14.1 The Medical Centre 13.3 Dr Sahu G B & Partner 12.5 Sheerness Health Centre 10.8 Dr Sikdar A N 10.0 Dr Pasola M 9.9 Dr Murthy S R S 9.6 Holly Bank Surgery 9.0 Dr Ramu C & Partner 8.9 Dr Fahmy M M E & Partner 7.5 Iwade Health Centre 4.8 Minster Medical Centre 1.0 Page 110 of 136

111 Figure Swale CCG /13 Emergency admission rates for people aged Higher emergency admission rates can be discerned for residents of both Sheerness wards, Minster Cliffs and Leysdown and Warden on the Isle of Sheppey; for many of the wards in central Sittingbourne and for Teynham and Lynstead. The low rates of admission should be noted for West Downs and Borden wards. Page 111 of 136
112 Table 37 - Electoral ward age-specific emergency admission rates Swale CCG residents aged years 2012/13 Ward Name Leysdown and Warden 46.6 Murston 35.1 Sheerness West 34.0 Woodstock 33.8 Milton Regis 31.9 Hartlip, Newington and Upchurch 30.7 Sheerness East 30.1 Chalkwell 26.6 Minster Cliffs 26.0 Kemsley 23.7 Sheppey Central 23.4 Roman 22.6 Grove 20.4 Queenborough and Halfway 19.5 West Downs 17.4 St Michaels 15.4 Iwade and Lower Halstow 11.3 Borden 6.2 Table 38 - GP practice age-specific emergency admission rates - Swale CCG registered patients aged years /13 GP Surgery Name Sheerness Health Centre 48.7 The Surgery Teynham 31.8 Dr Pasola M 31.2 Dr Sahu G B & Partner 30.7 Dr Sikdar A N 30.7 Dr Fahmy M M E & Partner 28.8 Minster Medical Centre 28.5 The Medical Centre 28.4 Dmc Healthcare Centre 27.1 Grovehurst Surgery 26.0 The Chestnuts Surgery 25.9 St George's Medical Centre 25.8 Memorial Medical Centre 25.2 Dr Murthy S R S 21.1 Holly Bank Surgery 20.4 Dr Saha B K 18.1 Iwade Health Centre 14.9 Dr Ramu C & Partner 13.3 Dr Beerstecher H J 8.3 Dr Subash Chandran S 8.1 Page 112 of 136

113 Figure 104 -Swale CCG /13 Emergency admission rate for people aged years Notable emergency admission rates for residents of Sheerness West and Leysdown and Warden should be noted for the Isle of Sheppey. The high rates for Leysdown and Warden may be inflated by holiday park residents. High rates for residents of Teynham and Lynstead can also be observed. Generally the lowest rates are for residents of the south Sittingbourne wards. Page 113 of 136

114 Table 39 - Electoral ward age-specific emergency admission rates Swale CCG residents aged years 2012/13 Ward Name Murston 63.2 Sheerness West 57.9 Leysdown and Warden 50.6 Milton Regis 44.4 Sheerness East 41.7 Minster Cliffs 40.5 Hartlip, Newington and Upchurch 39.4 Grove 38.9 Queenborough and Halfway 36.3 Kemsley 31.2 Roman 31.2 Sheppey Central 29.7 St Michaels 25.9 Iwade and Lower Halstow 24.3 West Downs 24.1 Chalkwell 23.7 Woodstock 23.3 Borden 15.1 Table 40 - GP practice age-specific emergency admission rates - Swale CCG registered patients aged years /13 Page 114 of 136

115 Figure 105 Swale CCG 2012/13 Emergency admission rates for people aged years The highest emergency admissions rate for people aged are of residents of Milton Regis ward. The low rate of admission reflected in one practice located in Milton Regis ward is noteworthy. Higher rates of admission should also be noted for Sheppey Central, Leysdown and Warden and Sheerness West wards. This pattern is also to be observed for residents of Teynham and Lynstead ward. Low rates of emergency admission can be discerned for Woodstock and West Downs ward as well as Iwade and Lower Halstow. However the latter ward has lower numbers of people in this age group relative to the ward population as a whole. Page 115 of 136


116 Table 41 - Electoral ward age specific emergency admission rates - Swale CCG residents aged years 2012/13 Table 42 - GP practice age-specific emergency admission rates - Swale CCG registered patients aged years /13 Page 116 of 136

117 Figure Swale CCG 2012/13 Emergency admission rates for people aged 85+ years The highest emergency admission rates are found in Milton Regis, Sheerness East and West Downs. The high rates of admission for residents of West Downs and Borden wards may be inflated by the presence of residential and nursing homes since overall this age group does not constitute a significant proportion of the ward population. However looking at the overall pattern of demand for A&E services, residents of West Downs and Borden wards have proportionately less need of such services and thus may account for high demands in old age. Page 117 of 136
118 Table 43 - Electoral ward age-specific emergency admission rates - Swale CCG residents aged 85+yrs /13 Ward Name 85+ West Downs Sheerness East Milton Regis Leysdown and Warden Iwade and Lower Halstow Chalkwell Borden Sheppey Central Minster Cliffs Woodstock Hartlip, Newington and Upchurch Roman Sheerness West Grove Murston St Michaels Queenborough and Halfway Kemsley Table 44 - GP practice age-specific emergency admission rates - Swale CCG registered patients aged 85+yrs /13 GP Surgery Name 85+ Dr Sikdar A N Dr Murthy S R S Dr Beerstecher H J Dr Ramu C & Partner The Medical Centre Minster Medical Centre St George's Medical Centre Grovehurst Surgery Dr Saha B K Sheerness Health Centre Dr Subash Chandran S Memorial Medical Centre Dr Sahu G B & Partner Dr Pasola M Dmc Healthcare Centre The Chestnuts Surgery Iwade Health Centre Holly Bank Surgery Dr Fahmy M M E & Partner The Surgery Teynham Page 118 of 136

119 Figure Swale CCG /13 Emergency admission rate for all ages Overall the area of Swale CCG with the highest rates of admission is Leysdown and Warden. However this may be inflated by seasonal factors and thus the residents of holiday parks. Generally lower rates of admission can be discerned from both the south and west wards surrounding Sittingbourne. Teynham and Lynstead ward demonstrates higher rates of admission than might be expected for this population. Page 119 of 136
120 Table 45 - Electoral ward age-specific emergency admission rates Swale CCG residents all ages 2012/13 Ward Name All Ages Leysdown and Warden 74.1 Milton Regis 59.1 Minster Cliffs 57.8 Sheerness West 56.3 Sheerness East 50.9 Murston 50.8 Hartlip, Newington and Upchurch 48.5 Woodstock 47.5 Roman 43.9 Sheppey Central 42.4 Borden 39.3 Queenborough and Halfway 39.1 West Downs 37.1 Chalkwell 36.9 Grove 35.1 St Michaels 34.3 Kemsley 29.5 Iwade and Lower Halstow 29.1 Table 46 - GP practice age-specific accident and emergency attendance rates - Swale CCG registered patients all ages /13 GP Surgery Name All Ages Dr Sikdar A N 64.1 St George's Medical Centre 62.0 The Surgery Teynham 55.3 Sheerness Health Centre 51.8 Dr Sahu G B & Partner 51.2 Dr Pasola M 49.2 The Medical Centre 47.5 Dr Beerstecher H J 47.4 Minster Medical Centre 46.0 Dr Fahmy M M E & Partner 44.9 The Chestnuts Surgery 44.1 Dr Murthy S R S 41.9 Dr Subash Chandran S 41.6 Grovehurst Surgery 40.9 Memorial Medical Centre 38.4 Dmc Healthcare Centre 34.5 Iwade Health Centre 25.8 Dr Saha B K 25.6 Holly Bank Surgery 24.7 Dr Ramu C & Partner 24.3 Page 120 of 136

121 Older People Figure 108 Swale CCG 2012/13 Elective admission rates for people aged years There is an equitable distribution of elective admissions for residents of the CCG aged Residents of Leysdown and Warden and of Teynham and Lynstead wards have modest elective admission rates in contrast to the relatively higher demands made of unplanned care. Page 121 of 136
122 Table 47 - Electoral ward age-specific elective admission rates - Swale CCG residents aged 65-84yrs /13 Ward name Sheerness East Kemsley Roman Minster Cliffs Iwade and Lower Halstow Sheppey Central Borden Woodstock Murston Grove St Michaels Hartlip, Newington and Upchurch Queenborough and Halfway Milton Regis Sheerness West West Downs Chalkwell Leysdown and Warden Table 48 - GP practice age-specific elective admission rates - Swale CCG registered patients aged 65-84yrs /13 GP name Sheerness Health Centre Dr Beerstecher H J The Surgery Teynham Dr Fahmy M M E & Partner Dr Sikdar A N Dmc Healthcare Centre The Chestnuts Surgery Dr Pasola M Grovehurst Surgery Memorial Medical Centre Dr Sahu G B & Partner The Medical Centre St George's Medical Centre Dr Murthy S R S Minster Medical Centre Dr Subash Chandran S Dr Ramu C & Partner Iwade Health Centre Dr Saha B K 96.6 Holly Bank Surgery 80.2 Page 122 of 136

123 Figure 109 Swale CCG 2012/13 Elective admission rates for people aged 85+ years The low elective admission rates for 85+ residents of Grove and Minster Cliffs, Sheppey Central and Woodstock should be noted as these are areas with a higher proportion of people aged over 85 for the ward. The high rates of elective admission of residents of West Downs and Murston wards should be observed since the proportion of this age group relative to the ward population is low. Highest rates can be observed for residents of the south central Sittingbourne wards together with West Downs ward. The latter has among the lowest numbers of 85+ relative to the population as a whole. Page 123 of 136
124 Table 49 - Electoral ward age-specific elective admission rates - Swale CCG residents aged 85+yrs /13 Ward name 85+ Murston Borden West Downs Sheerness West Milton Regis Leysdown and Warden Roman Queenborough and Halfway Sheerness East Iwade and Lower Halstow Hartlip, Newington and Upchurch Minster Cliffs Woodstock Sheppey Central St Michaels 77.5 Chalkwell 74.1 Kemsley 73.2 Grove 61.4 Table 50 - GP practice age-specific elective admission rates - Swale CCG registered patients aged 85+yrs /13 GP name 85+ Dr Saha B K Dr Fahmy M M E & Partner Sheerness Health Centre Dmc Healthcare Centre The Surgery Teynham St George's Medical Centre The Medical Centre The Chestnuts Surgery Memorial Medical Centre Dr Sahu G B & Partner Minster Medical Centre Dr Murthy S R S Dr Sikdar A N Grovehurst Surgery 94.8 Iwade Health Centre 83.3 Holly Bank Surgery 81.1 Dr Pasola M 80.0 Dr Beerstecher H J 76.9 Dr Subash Chandran S 72.5 Dr Ramu C & Partner 0.0 Page 124 of 136

125 Figure Swale CCG /13 First outpatient attendance rates for people aged years There is an equitable distribution of first outpatient attendance for people aged across the CCG area. Page 125 of 136
126 Table 51 - Electoral ward age-specific outpatient first attendance rates - Swale CCG residents aged years /13 Ward name Kemsley Sheerness East Minster Cliffs Murston Sheerness West Sheppey Central St Michaels Roman Borden Milton Regis Leysdown and Warden Grove Queenborough and Halfway Hartlip, Newington and Upchurch West Downs Woodstock Chalkwell Iwade and Lower Halstow Table 52 - GP practice age specific outpatient first attendance rate - Swale CCG registered patients aged years /13 GP Surgery Sheerness Health Centre Dr Beerstecher H J Dr Murthy S R S Dr Pasola M Dr Sikdar A N Dr Fahmy M M E & Partner The Surgery Teynham The Chestnuts Surgery St George's Medical Centre Dr Sahu G B & Partner Dmc Healthcare Centre Memorial Medical Centre Grovehurst Surgery The Medical Centre Minster Medical Centre Dr Subash Chandran S Dr Saha B K Iwade Health Centre Dr Ramu C & Partner Holly Bank Surgery Page 126 of 136

127 Figure Swale CCG -2012/13 Outpatient first attendance rates for people aged 85+ years The very high rates of outpatient first attendances amongst people aged 85+ resident in Milton Regis should be noted as this age group constitutes a higher proportion of ward residents. The rates in one of the highest group for the neighbouring West Down ward should be noted as proportionately this age group is lower relative to the total ward population. Page 127 of 136
128 Table 53 - Electoral ward age-specific outpatient first attendance rates - Swale CCG residents aged 85+ years /13 Ward name 85+ Milton Regis West Downs Borden Roman Leysdown and Warden Sheerness East Sheerness West Chalkwell Minster Cliffs Sheppey Central Iwade and Lower Halstow Murston Woodstock Hartlip, Newington and Upchurch Queenborough and Halfway Grove Kemsley St Michaels Table 54 - GP practice age specific outpatient first attendance rates - Swale CCG registered patients aged /13 GP Surgery 85+ Dr Saha B K Dr Sikdar A N Dr Fahmy M M E & Partner Minster Medical Centre Sheerness Health Centre Grovehurst Surgery Dr Beerstecher H J Dr Murthy S R S St George's Medical Centre The Medical Centre Dr Ramu C & Partner Memorial Medical Centre The Chestnuts Surgery Holly Bank Surgery Dmc Healthcare Centre Dr Sahu G B & Partner Dr Pasola M Dr Subash Chandran S Iwade Health Centre The Surgery Teynham Page 128 of 136
129 Falls Figure Emergency admission rates as a result of a fall, 2008/ /11 - all diagnoses Emergency admissions due to a fall has declined since 2009/10. The rate for Swale CCG has been greater than that for Kent and Medway until 2012/13. For the year 2012/13 Swale CCG had the second lowest directly age standardised emergency admissions rate due to a fall. More females than males are admitted as a result of a fall and the majority of admissions are in the 85+ age group. Page 129 of 136
130 Annual expenditure Annual expenditure ( 000s) Figure Mean cost per emergency hospital admission due to a fall 2008/ /11 3,000 2,900 2,800 2,700 2,600 2,500 2, / / /11 Swale CCG 2,772 2,592 2,946 Kent and Medway 2,791 2,652 2,836 Figure Expenditure on emergency admissions for falls 2008/ /11 3,000,000 2,500,000 2,000,000 1,500,000 1,000, , / / /11 Swale CCG 2,045,799 2,172,205 2,518,774 Expenditure for emergency falls admissions has increased year on year and the mean cost per admission for Swale CCG is higher than that for Kent and Medway Page 130 of 136
131 Figure Age standardised emergency admission rates for Swale CCG residents - Falls 2010/ /13 by electoral ward The highest rates of emergency admissions due to falls can be found in Sheerness East, Sheerness Wes, Roman and Milton Regis wards. Page 131 of 136
132 Figure Age standardised elective admissions rates for Swale CCG residents aged / /13 by electoral ward The highest elective admission rates are to be found in Minster Cliffs, Teynham and Lynsted, Murston and Roman wards. Page 132 of 136
133 Figure Age standardised emergency admission rates for Swale CCG residents aged / /13 by electoral ward The highest age standardised admission rates for Swale residents aged 65+ are to be found in Sheppey Central, Sheerness East & West and Milton Regis. Page 133 of 136
134 Figure Age standardised emergency admissions rates for Swale CCG residents - fractured neck of femur 2010/ /13 by electoral ward The highest age standardised emergency admissions rates for Swale CCG residents for fractured neck of femur are in Sheerness East & West, Milton Regis and Sheppy Central wards. Page 134 of 136

135 Figure Age standardised emergency admission rates for Swale CCG residents - hip or knee replacement 2010/ /13 by electoral ward The highest rates of age standardised emergency admission rates for Swale CCG residents for hip or knee replacement are to be found in Sheerness East, Milton Regis, Chalkwell and Roman wards. Page 135 of 136
Commentary for East Sussex
 Commentary for based on JSNA Scorecards, January 2013 This commentary is to be read alongside the JSNA scorecards. Scorecards and commentaries are available at both local authority and NHS geographies
PUBLIC HEALTH IN HALTON. Eileen O Meara Director of Public Health & Public Protection
 PUBLIC HEALTH IN HALTON Eileen O Meara Director of Public Health & Public Protection Aim of Presentation What we do. How we do it. What are the service outputs. What are the outcomes. How can we help.
Our five year plan to improve health and wellbeing in Portsmouth
 Our five year plan to improve health and wellbeing in Portsmouth Contents Page 3 Page 4 Page 5 A Message from Dr Jim Hogan Who we are What we do Page 6 Page 7 Page 10 Who we work with Why do we need a
Birmingham Solihull and the Black Country Area Team
 Birmingham Solihull and the Black Country Area Team A summary of the Five Year Primary Care Strategy: High quality care for all now and for future generations 1 NHS England The Birmingham, Solihull and
Cranbrook a healthy new town: health and wellbeing strategy
 Cranbrook a healthy new town: health and wellbeing strategy 2016 2028 Executive Summary 1 1. Introduction: why this strategy is needed, its vision and audience Neighbourhoods and communities are the building
Inequalities Sensitive Practice Initiative
 Inequalities Sensitive Practice Initiative Maternity Unit Report - 2008 Royal Alexandria Hospital 1 Acknowledgment I would like to take this opportunity to thank the staff from the maternity services in
Child Health 2020 A Strategic Framework for Children and Young People s Health
 Child Health 2020 A Strategic Framework for Children and Young People s Health Consultation Paper Please Give Us Your Views Consultation: 10 September 2013 21 October 2013 Our Child Health 2020 Vision
17. Updates on Progress from Last Year s JSNA
 17. Updates on Progress from Last Year s JSNA 3. The Health of People in Bromley NHS Health Checks The previous JSNA reported that 35 (0.5%) patients were identified through NHS Health Checks with non-diabetic
Our vision. Ambition for Health Transforming health and social care services in Scarborough, Ryedale, Bridlington and Filey
 Ambition for Health Transforming health and social care services in Scarborough, Ryedale, Bridlington and Filey Our vision www.ambitionforhealth.co.uk Contents 1.0 Introduction: A shared ambition for health
Outcomes benchmarking support packs: CCG level
 Outcomes benchmarking support packs: CCG level NHS South Devon and Torbay CCG Produced with input from: Public Health England Forward and Introduction Local decision making is at the heart of the NHS,
NHS Bradford Districts CCG Commissioning Intentions 2016/17
 NHS Bradford Districts CCG Commissioning Intentions 2016/17 Introduction This document sets out the high level commissioning intentions of NHS Bradford Districts Clinical Commissioning Group (BDCCG) for
 A technical guide explaining the data sources and methods used in this profile, plus interactive spreadsheets providing the data in charts and tables, are available at: www.publichealthwalesobservatory.wales.nhs.uk/gpclusters
Lincolnshire Pharmaceutical Needs Assessment
 Lincolnshire Pharmaceutical Needs Assessment Lincolnshire Health and Wellbeing Board March 2015 Final version 31 March 2015 Foreword Our pharmacies provide people in Lincolnshire with vital supportive
Kingston Primary Care commissioning strategy Kingston Medical Services
 Kingston Primary Care commissioning strategy Kingston Medical Services Kathryn MacDermott Director of Planning and Primary Care Kathryn.macdermott@kingstonccg.nhs.uk kmacdermott@nhs.net 1 Contents 1. Introduction...
A guide to NHS Bexley Clinical Commissioning Group
 A guide to NHS Bexley Clinical Commissioning Group Everything you need to know about how local healthcare in Bexley is planned, bought and monitored. 1 Welcome to NHS Bexley Clinical Commissioning Group
National Health Promotion in Hospitals Audit
 National Health Promotion in Hospitals Audit Acute & Specialist Trusts Final Report 2012 www.nhphaudit.org This report was compiled and written by: Mr Steven Knuckey, NHPHA Lead Ms Katherine Lewis, NHPHA
NHS LEWISHAM CLINICAL COMMISSIONING GROUP. COMMISSIONING INTENTIONS 2014/15 and 2015/16
 NHS LEWISHAM CLINICAL COMMISSIONING GROUP COMMISSIONING INTENTIONS 2014/15 and 2015/16 1 CONTENTS Introduction 1. Who We Are p5-6 1.1 CCG s Responsibilities p5 1.2 Partnership Working p6 2. CCG s Strategic
Figure 1: Domains of the Three Adult Outcomes Frameworks
 Outcomes Frameworks across Public Health, Social Care and NHS Relevance to Ealing Health & Wellbeing Strategy 1. Overview For adults there are three outcomes frameworks, one each for public health, NHS
South East London Commissioning Strategy Programme. Case for Change
 South East London Commissioning Strategy Programme Office South East London Commissioning Strategy Programme Case for Change (DRAFT) 28 February 2014 DOCUMENT CONTROL Version Date Author Comments V0.14
Guideline scope Intermediate care - including reablement
 NATIONAL INSTITUTE FOR HEALTH AND CARE EXCELLENCE Guideline scope Intermediate care - including reablement Topic The Department of Health in England has asked NICE to produce a guideline on intermediate
Commissioning for Value insight pack
 Commissioning for Value insight pack NHS England Gateway ref: 00525 Contents Introduction: the call to action The approach Where to look using indicative data Phase 2 & 3 Why act what benefits do the population
NATIONAL HEALTHCARE AGREEMENT 2011
 NATIONAL HEALTHCARE AGREEMENT 2011 Council of Australian Governments An agreement between the Commonwealth of Australia and the States and Territories, being: the State of New South Wales; the State of
Aneurin Bevan Health Board. Living Well, Living Longer: Inverse Care Law Programme
 Aneurin Bevan Health Board Living Well, Living Longer: Inverse Care Law Programme 1 Introduction The purpose of this paper is to seek the Board s agreement to a set of priority statements for an Inverse
Islington CCG Commissioning Statement in relation to the commissioning of health services for children and young people 0-18 years
 Islington CCG Commissioning Statement in relation to the commissioning of health services for children and young people 0-18 years Introduction 1. Islington CCG funds a range of health services for children
Equality and Diversity strategy
 Equality and Diversity strategy 2016-2019 DRAFT If you would like this document in a different format, please telephone 0117 9474400 or e-mail getinvolved@southgloucestershireccg.nhs.uk Executive Summary
TITLE OF REPORT: Looked After Children Annual Report
 NHS BOLTON CLINICAL COMMISSIONING GROUP Public Board Meeting AGENDA ITEM NO: 13 Date of Meeting:..27 th October 2017.. TITLE OF REPORT: Looked After Children Annual Report 2016-2017 AUTHOR: Christine Dixon,
BIRMINGHAM CITY COUNCIL SERVICE REVIEWS GREEN PAPER UPDATE: ADULTS SOCIAL CARE INTRODUCTION THE BUDGET NUMBERS
 BIRMINGHAM CITY COUNCIL SERVICE REVIEWS GREEN PAPER UPDATE: ADULTS SOCIAL CARE INTRODUCTION Birmingham City Council is facing a big challenge, having to cut the budget we can control by half over seven
NHS Ayrshire and Arran. 1. Which of the following performance frameworks has the most influence on your budget decisions:
 A: Budget setting process Performance budgeting 1. Which of the following performance frameworks has the most influence on your budget decisions: National Performance Framework Quality Measurement Framework
Stockport Strategic Vision. for. Palliative Care and End of Life Care Services. Final Version. Ratified by the End of Life Care Programme Board
 Stockport Strategic Vision for Palliative Care and End of Life Care Services Final Version Ratified by the End of Life Care Programme Board on 8 th February 2012 Clinical Commissioning Pathfinder Contents
Healthy London Partnership. Transforming London s health and care together
 Healthy London Partnership Transforming London s health and care together London-wide transformation In 2014, two publications set out London s transformation priorities NHS Five Year Forward View Better
Draft Commissioning Intentions
 The future for Luton s primary care services Draft Commissioning Intentions 2013-14 The NHS will have less money to spend over the next three years. Overall, it has to make 20 billion of efficiency savings
West Wandsworth Locality Update - July 2014
 Attach 5 West Wandsworth Locality Update - July 2014 1) Introduction The West Wandsworth Locality covers the areas of Roehampton and Putney, and the nine practices that lie in these areas. The 2013 GP
Foreword 4. Section 1: Introduction 5. Section 2: Our Vision for Health and Social Care in Angus 6. Section 3: Why Change? 7
 Strategic Plan 2016-2019 1 2 Contents Foreword 4 Section 1: Introduction 5 Section 2: Our Vision for Health and Social Care in Angus 6 Section 3: Why Change? 7 Section 4: Strategic Commissioning 8 Section
Lincolnshire JSNA: Chronic Obstructive Pulmonary Disease (COPD)
") Disease (COPD) What do we know? Summary is a long-term condition, which is affecting increasing numbers of people. There is a wide range of interventions to address COPD, from prevention to the ongoing
Disease (COPD) What do we know? Summary is a long-term condition, which is affecting increasing numbers of people. There is a wide range of interventions to address COPD, from prevention to the ongoing
Patient survey report Survey of people who use community mental health services gether NHS Foundation Trust
 Patient survey report 2014 Survey of people who use community mental health services 2014 National NHS patient survey programme Survey of people who use community mental health services 2014 The Care
SERVICE SPECIFICATION
 SERVICE SPECIFICATION Service Childhood Immunisation Service Commissioner Lead Sarah Darcy Provider GP Confederation Mary Clarke Provider Lead Period 1 April 2018 to 31 2019 Date of Review December 2018
East Community Assembly
 Health Profile 2011 for East Community Assembly This profile gives a snapshot overview of key Health and Well-being indicators in the chosen Ward or Community Assembly, with comparisons to. It is complemented
Making an impact on the public's health and wellbeing in England: Emerging Approaches and Lessons
 Making an impact on the public's health and wellbeing in England: Emerging Approaches and Lessons Professor Kevin Fenton Snr. Advisor, Health and Wellbeing Public Health England Director of Health and
EDUCATION AND SUPPORT OF THE FAMILY THE ROLE OF THE PUBLIC HEALTH NURSE ANNE MCDONALD PHN PHIT PROJECT LEADER
 EDUCATION AND SUPPORT OF THE FAMILY THE ROLE OF THE PUBLIC HEALTH NURSE ANNE MCDONALD PHN PHIT PROJECT LEADER Public Health Nursing PHN is a generalist nurse with specialist education Postgraduate Diploma
Particulars Version 22. NHS Standard Contract 2018/19. Particulars Enhanced Homeless Health
 NHS Standard Contract 2018/19 Particulars Enhanced Homeless Health 1 SCHEDULE 2 THE SERVICES A. Service Specifications Service Specification No. Service OOHS_011 Enhanced Homeless Health Commissioner Lead
GOVERNING BODY PAPER
 Enclosure: E Agenda item: 7 GOVERNING BODY PAPER Title of paper: To approve South London Commissioning Strategy Programme Case for change Date of meeting: Wednesday 26 th March 2014 Presented by: Dr Hany
Public Attitudes to Self Care Baseline Survey
 Public Attitudes to Self Care Baseline Survey Department of Health February 2005 1 Contents Executive Summary 3 Introduction 7 Background and objectives of the research 7 Methodology 8 How Healthy is the
STP: Latest position. Developing and delivering the Humber, Coast and Vale Sustainability and Transformation Plan. July 2016
 STP: Latest position Developing and delivering the Humber, Coast and Vale Sustainability and Transformation Plan July 2016 Who s involved? NHS Commissioners East Riding of Yorkshire CCG Hull CCG North
London Councils: Diabetes Integrated Care Research
 London Councils: Diabetes Integrated Care Research SUMMARY REPORT Date: 13 th September 2011 In partnership with Contents 1 Introduction... 4 2 Opportunities within the context of health & social care
National review of NHS acute inpatient mental health services in England: implications for psychiatric intensive care units
 National review of NHS acute inpatient mental health services in England: implications for psychiatric intensive care units Nicola Vick, Project lead September 2008 Outline of presentation 1. Overview
Worcestershire Public Health Directorate. Business plan 2011/12
 Worcestershire Public Health Directorate Business plan Public Health website: www.worcestershire.nhs.uk/publichealth 1 Worcestershire Public Health Directorate Business Plan Vision 1. The Public Health
Telford and Wrekin Clinical Commissioning Group. Prospectus 2013/2014
 Telford and Wrekin Clinical Commissioning Group Prospectus 2013/2014 Who we are Telford and Wrekin Clinical Commissioning Group (CCG) is responsible for healthcare in the Telford and Wrekin area. We Plan
Healthy lives, healthy people: consultation on the funding and commissioning routes for public health
 Healthy lives, healthy people: consultation on the funding and commissioning routes for public health December 2010 The coalition Government published Healthy Lives, Health people: consultation on the
GREATER VICTORIA Local Health Area Profile 2015
 GREATER VICTORIA Local Health Area Profile 215 Greater Victoria LHA is one of 14 LHAs in Island Health and is located in Island Health s South Island Health Service Delivery Area (HSDA). The LHA is at
briefing Liaison psychiatry the way ahead Background Key points November 2012 Issue 249
 briefing November 2012 Issue 249 Liaison psychiatry the way ahead Key points Failing to deal with mental and physical health issues at the same time leads to poorer health outcomes and costs the NHS more
Balanced year end position. Monthly Indicators Red Amber Green No Total Status May (No. of indicators)
") From: Martin Wade Tel.: 1223 699733 Date: 11 July 218 Public Health Directorate Finance and Performance Report June 218 1 SUMMARY 1.1 Finance Previous Status Green Category Income and Expenditure Balanced
From: Martin Wade Tel.: 1223 699733 Date: 11 July 218 Public Health Directorate Finance and Performance Report June 218 1 SUMMARY 1.1 Finance Previous Status Green Category Income and Expenditure Balanced
Bedfordshire, Luton and Milton Keynes Sustainability and Transformation Plan. October 2016 submission to NHS England Public summary
 Bedfordshire, Luton and Milton Keynes Sustainability and Transformation Plan October 2016 submission to NHS England Public summary 15 November 2016 Contents 1 Introduction what is the STP all about?...
grampian clinical strategy
 healthfit caring listening improving grampian clinical strategy 2016 to 2021 1 summary version For full version of the Grampian Clinical Strategy, please go to www.nhsgrampian.org/clinicalstrategy Document
Survey of people who use community mental health services Leicestershire Partnership NHS Trust
 Survey of people who use community mental health services 2017 Survey of people who use community mental health services 2017 National NHS patient survey programme Survey of people who use community mental
Primary Care Workforce Survey Scotland 2017
 Primary Care Workforce Survey Scotland 2017 A Survey of Scottish General Practices and General Practice Out of Hours Services Publication date 06 March 2018 An Official Statistics publication for Scotland
grampian clinical strategy
 healthfit caring listening improving consultation grampian clinical strategy 2016 to 2021 1 summary version NHS Grampian Clinical Strategy 2016 to 2021 Purpose and aims 5 Partnership working and the changing
North Central London Sustainability and Transformation Plan. A summary
 Sustainability and Transformation Plan A summary N C L Introduction Hospitals, local authorities, GPs, commissioners, and mental health trusts across north central London have all come together to transform
Community Care Statistics : Referrals, Assessments and Packages of Care for Adults, England
 Community Care Statistics 2006-07: Referrals, Assessments and Packages of Care for Adults, England 1 Report of the 2006-07 RAP Collection England, 1 April 2006 to 31 March 2007 Editor: Associate Editors:
Avoidable Hospitalisation
 Avoidable Hospitalisation Introduction Avoidable hospitalisation is used to measure the occurrence of a severe illness that theoretically could have been avoided by either; Ambulatory sensitive hospitalisation
MONROE COUNTY HEALTH PROFILE. Finger Lakes Health Systems Agency, 2017
 MONROE COUNTY HEALTH PROFILE Finger Lakes Health Systems Agency, 2017 About the Report The purpose of this report is to provide a summary of health data specific to Monroe County. Where possible, benchmarks
Patient survey report National children's inpatient and day case survey 2014 The Mid Yorkshire Hospitals NHS Trust
 Patient survey report 2014 National children's inpatient and day case survey 2014 National NHS patient survey programme National children's inpatient and day case survey 2014 The Care Quality Commission
NHS Leeds West CCG Clinical Commissioning Strategy. 2013/14 to 2015/16
 NHS Leeds West CCG Clinical Commissioning Strategy 2013/14 to 2015/16 Working together locally to achieve the best health and care in all our communities 1 Contents Section 1: Summary Page 3 Section 2:
COURTENAY Local Health Area Profile 2015
 COURTENAY Local Health Area Profile 215 Courtenay Local Health Area (LHA) is one of 14 LHAs in Island Health and is located in Island Health s North Island Health Service Delivery Area (HSDA). Courtenay
Quality and Leadership: Improving outcomes
 Quality and Leadership: Improving outcomes Podiatry Managers/Allied Health Managers and Leaders 5 March 2014 Shelagh Morris OBE Acting Chief Allied Health Professions Officer 2 http://www.nhsemployers.org/aboutus/latest-news/pages/the-new-nhs-in-2013-infographic.aspx
Patient survey report Survey of people who use community mental health services Boroughs Partnership NHS Foundation Trust
 Patient survey report 2013 Survey of people who use community mental health services 2013 The survey of people who use community mental health services 2013 was designed, developed and co-ordinated by
Sustainability and transformation plan (STP)
") Sustainability and transformation plan (STP) David Bowen-Cassie, Harrow CCG Alex Dewsnap, London Borough of Harrow Sanjay Dighe, Lay Member, Harrow CCG About Harrow A population of more than 239,000 people
Sustainability and transformation plan (STP) David Bowen-Cassie, Harrow CCG Alex Dewsnap, London Borough of Harrow Sanjay Dighe, Lay Member, Harrow CCG About Harrow A population of more than 239,000 people
Leicestershire Partnership NHS Trust Summary of Equality Monitoring Analyses of Service Users. April 2015 to March 2016
 Leicestershire Partnership NHS Trust Summary of Equality Monitoring Analyses of Service Users April 2015 to March 2016 NOT FOR PUBLICATION Table of Contents Introduction... 2 Principle findings from the
Patient survey report Survey of adult inpatients 2013 North Bristol NHS Trust
 Patient survey report 2013 Survey of adult inpatients 2013 National NHS patient survey programme Survey of adult inpatients 2013 The Care Quality Commission The Care Quality Commission (CQC) is the independent
The adult social care sector and workforce in. Yorkshire and The Humber
 The adult social care sector and workforce in Yorkshire and The Humber 2015 Published by Skills for Care, West Gate, 6 Grace Street, Leeds LS1 2RP www.skillsforcare.org.uk Skills for Care 2016 Copies of
Council of Members. 20 January 2016
 Council of Members 20 January 2016 Feedback on election process: Council of Members Chair and Deputy Chair Malcolm Hines, Chief Financial Officer Minutes of last meeting: 14 October 2015 Dr. Richard Proctor,
COMMUNITY HEALTH NEEDS ASSESSMENT HINDS, RANKIN, MADISON COUNTIES STATE OF MISSISSIPPI
 COMMUNITY HEALTH NEEDS ASSESSMENT HINDS, RANKIN, MADISON COUNTIES STATE OF MISSISSIPPI Sample CHNA. This document is intended to be used as a reference only. Some information and data has been altered
NHS GRAMPIAN. Local Delivery Plan - Mental Health and Learning Disability Services
 NHS GRAMPIAN Board Meeting 01.06.17 Open Session Item 8 Local Delivery Plan - Mental Health and Learning Disability Services 1. Actions Recommended The Board is asked to: Note the context regarding the
The prevention and self care workshop 16 th September Dr. Jenny Harries Regional Director PHE South Regional Office
 The prevention and self care workshop 16 th September 2016 Dr. Jenny Harries Regional Director PHE South Regional Office Jenny.harries@phe.gov.uk The health and wellbeing gap If the nation fails to get
NHS performance statistics
 NHS performance statistics Published: 8 th February 218 Geography: England Official Statistics This monthly release aims to provide users with an overview of NHS performance statistics in key areas. Official
Patient survey report Survey of adult inpatients 2012 Sheffield Teaching Hospitals NHS Foundation Trust
 Patient survey report 2012 Survey of adult inpatients 2012 The national survey of adult inpatients in the NHS 2012 was designed, developed and co-ordinated by the Co-ordination Centre for the NHS Patient
DELAWARE FACTBOOK EXECUTIVE SUMMARY
 DELAWARE FACTBOOK EXECUTIVE SUMMARY DaimlerChrysler and the International Union, United Auto Workers (UAW) launched a Community Health Initiative in Delaware to encourage continued improvement in the state
Mental Capacity Act (2005) Deprivation of Liberty Safeguards (England)
 Deprivation of Liberty Safeguards (England)") Mental Capacity Act (2005) Deprivation of Liberty Safeguards (England) England 2016/17 National Statistics Published 1 November 2017 This official statistics report provides the findings from the Mental
Mental Capacity Act (2005) Deprivation of Liberty Safeguards (England) England 2016/17 National Statistics Published 1 November 2017 This official statistics report provides the findings from the Mental
NHS Grampian Equal Pay Monitoring Report
 NHS Grampian Equal Pay Monitoring Report April 2017 This document is also available in large print, and in other formats, upon request. Please contact Corporate Communications on Aberdeen (01224) 552245
The incentives framework for ACOs
 New care models The incentives framework for ACOs Accountable Care Organisation (ACO) Contract package - supporting document Our values: clinical engagement, patient involvement, local ownership, national
LIVINGSTON COUNTY HEALTH PROFILE. Finger Lakes Health Systems Agency, 2017
 LIVINGSTON COUNTY HEALTH PROFILE Finger Lakes Health Systems Agency, 2017 About the Report The purpose of this report is to provide a summary of health data specific to Livingston County. Where possible,
Strategic Plan
 Strategic Plan 2013-2025 Toi Te Ora Public Health Service (Toi Te Ora) is one of 12 public health units funded by the Ministry of Health and is the public health unit for the Bay of Plenty and Lakes District
Newton Abbot Locality Development
 Newton Abbot Locality Development Newton Abbot Locality Resident population (2013) (population that live in the area) Registered population (2015) (population that are registered to a GP) 50,500 52,300
ONTARIO COUNTY HEALTH PROFILE. Finger Lakes Health Systems Agency, 2017
 ONTARIO COUNTY HEALTH PROFILE Finger Lakes Health Systems Agency, 2017 About the Report The purpose of this report is to provide a summary of health data specific to Ontario County. Where possible, benchmarks
 A technical guide explaining the data sources and methods used in this profile, plus interactive spreadsheets providing the data in charts and tables, are available at: www.publichealthwalesobservatory.wales.nhs.uk/gpclusters
City and Hackney Clinical Commissioning Group Prospectus May 2013
 City and Hackney Clinical Commissioning Group Prospectus May 2013 Foreword We are excited to be finally live as a CCG, picking up our responsibilities as commissioners for the bulk of the NHS. The changeover
National Inpatient Survey. Director of Nursing and Quality
 Reporting to: Title Sponsoring Director Trust Board National Inpatient Survey Director of Nursing and Quality Paper 6 Author(s) Sarah Bloomfield, Director of Nursing and Quality, Sally Allen, Clinical
Northumberland, Tyne and Wear, and North Durham Draft Sustainability and Transformation Plan A summary
 Northumberland, Tyne and Wear, and North Durham Draft Sustainability and Transformation Plan A summary This summary has been prepared to aid understanding of the draft STP technical submission. Copies
Longer, healthier lives for all the people in Croydon
 D R A F T Croydon Clinical Commissioning Group Prospectus 2013/14 Longer, healthier lives for all the people in Croydon (Version TL) 1 Contents Foreword from the chair 3 Introduction 4 Who we are our Governing
Valuing and Supporting Carers. Stockport s Carers Strategy and Action Plan
 Valuing and Supporting Carers Stockport s Carers Strategy and Action Plan 2013 to 2016 1 CONTENTS Page Executive Summary 3 Who Do We Mean by Carers? 4 Profile of Carers in Stockport 5 Our Vision 9 1. Integrated
NHS Performance Statistics
 NHS Performance Statistics Published: 8 th March 218 Geography: England Official Statistics This monthly release aims to provide users with an overview of NHS performance statistics in key areas. Official
Changing for the Better 5 Year Strategic Plan
 Quality Care - for you, with you 5 Year Strategic Plan Contents: Section 1: Vision and Priorities for Change 3 Section 2: About the Trust 5 Section 3: Promoting Health & Wellbeing and Primary Care 6 Section
Whittington Health Quality Strategy
 Whittington Health Quality Strategy 2012-2017 Safe care Effective care Excellent patient experience...caring for you Quality Strategy for Whittington Health Introduction The purpose of this quality strategy
NEW MODELS OF CARE AND THE PREVENTION AGENDA: AN INTEGRAL PARTNERSHIP CHAIR: ROB WEBSTER, CHIEF EXECUTIVE, NHS CONFEDERATION
 NEW MODELS OF CARE AND THE PREVENTION AGENDA: AN INTEGRAL PARTNERSHIP CHAIR: ROB WEBSTER, CHIEF EXECUTIVE, NHS CONFEDERATION 10.10am 10.30pm 11.15am 12.00pm 12.45pm 1.30pm 2.15pm 2.45pm 3.30pm Interview
A review of 2017/18 and a summary of the Greenwich Commissioning Strategy. Transforming our health and social care system 2018 to 2022
 A review of 2017/18 and a summary of the Greenwich Commissioning Strategy Transforming our health and social care system 2018 to 2022 Welcome... 4 Who we are and what we do... 6 Our achievements... 8 Our
NW Health & Physical Activity Forum. Martin Ashton Service Manager: Commissioning for Health Improvement NHSALW / Wigan Council
 NW Health & Physical Activity Forum Martin Ashton Service Manager: Commissioning for Health Improvement NHSALW / Wigan Council Team Purpose Strategically lead CYP Health Improvement & early intervention
Vale of York Clinical Commissioning Group Governing Body Public Health Services. 2 February Summary
 Vale of York Clinical Commissioning Group Governing Body Public Health Services 2 February 2017 Summary 1. The purpose of this report is to provide the Vale of York Clinical Commissioning Group (CCG) with
Basic Concepts of Data Analysis for Community Health Assessment Module 5: Data Available to Public Health Professionals
 Basic Concepts of Data Analysis for Community Assessment Module 5: Data Available to Public Professionals Data Available to Public Professionals in Washington State Welcome to Data Available to Public
EDS 2. Making sure that everyone counts Initial Self-Assessment
 EDS 2 Making sure that everyone counts Initial Self-Assessment Equality Delivery System for the NHS EDS2 Summary Report Implementation of the Equality Delivery System EDS2 is a requirement on both NHS
National Survey of Patient Activity Data for Specialist Palliative Care Services MDS Full Report for the year
 National Survey of Patient Activity Data for Specialist Palliative Care Services MDS Full Report for the year 2010-2011 About the National Council for Palliative Care The National Council for Palliative
Patient survey report Survey of adult inpatients in the NHS 2009 Airedale NHS Trust
 Patient survey report 2009 Survey of adult inpatients in the NHS 2009 The national survey of adult inpatients in the NHS 2009 was designed, developed and co-ordinated by the Acute Surveys Co-ordination