Quality & Performance Report Author: John Adler Sponsor: Chief Executive Date: PPPC + QOC 21 ST December 2017
|
|
|
- Anthony Cobb
- 6 years ago
- Views:
Transcription
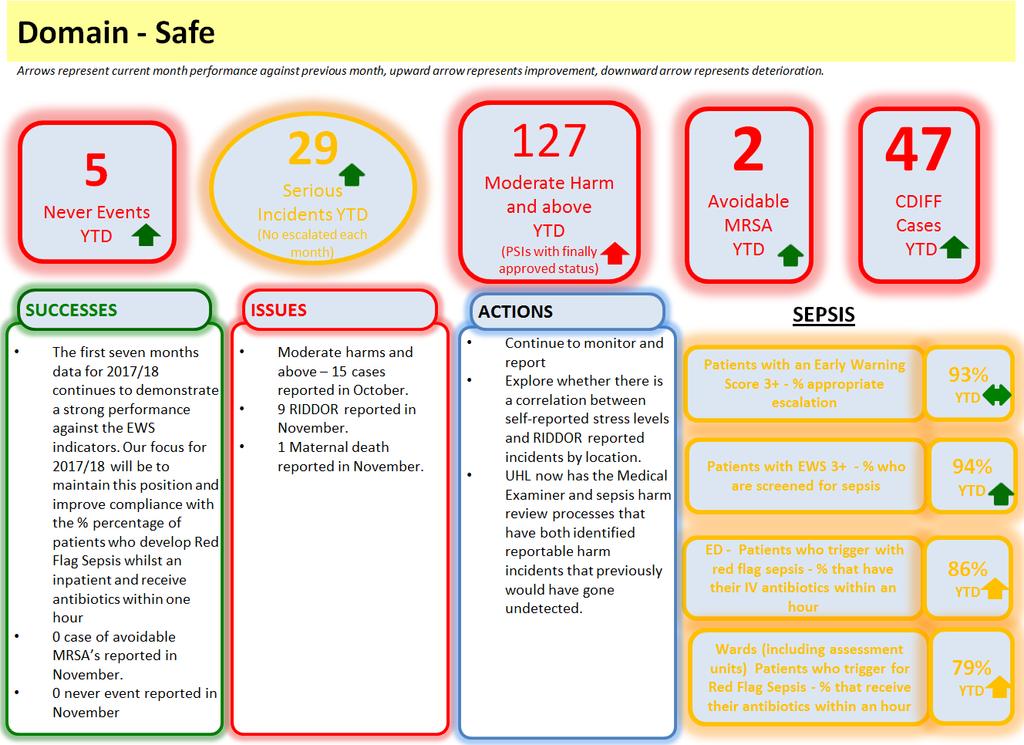
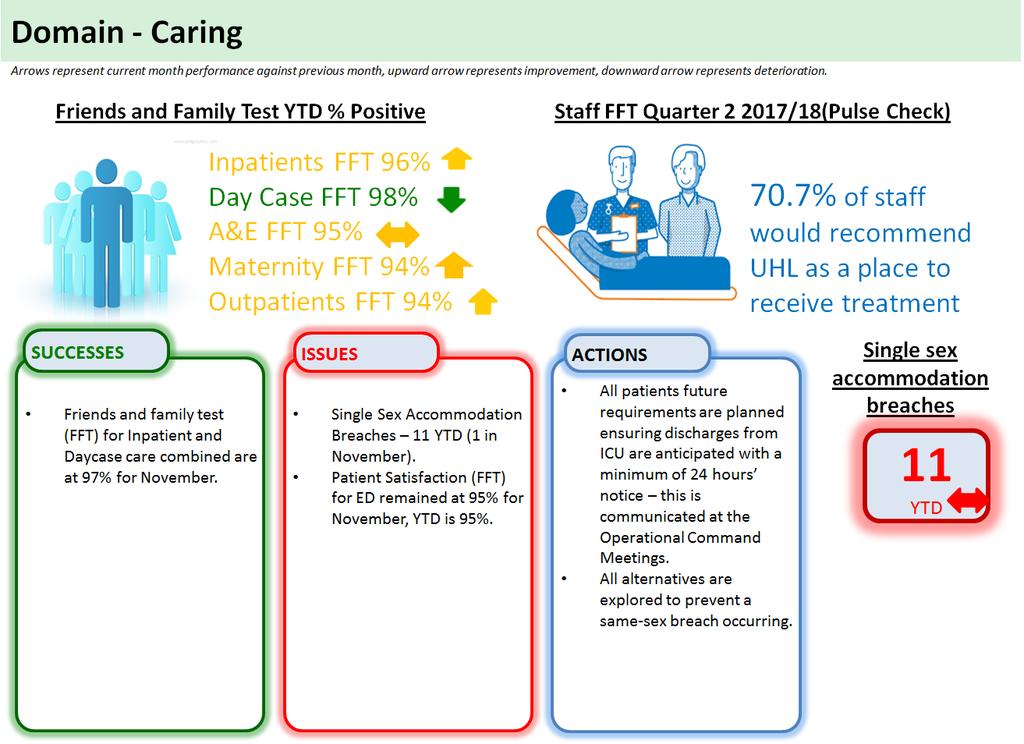
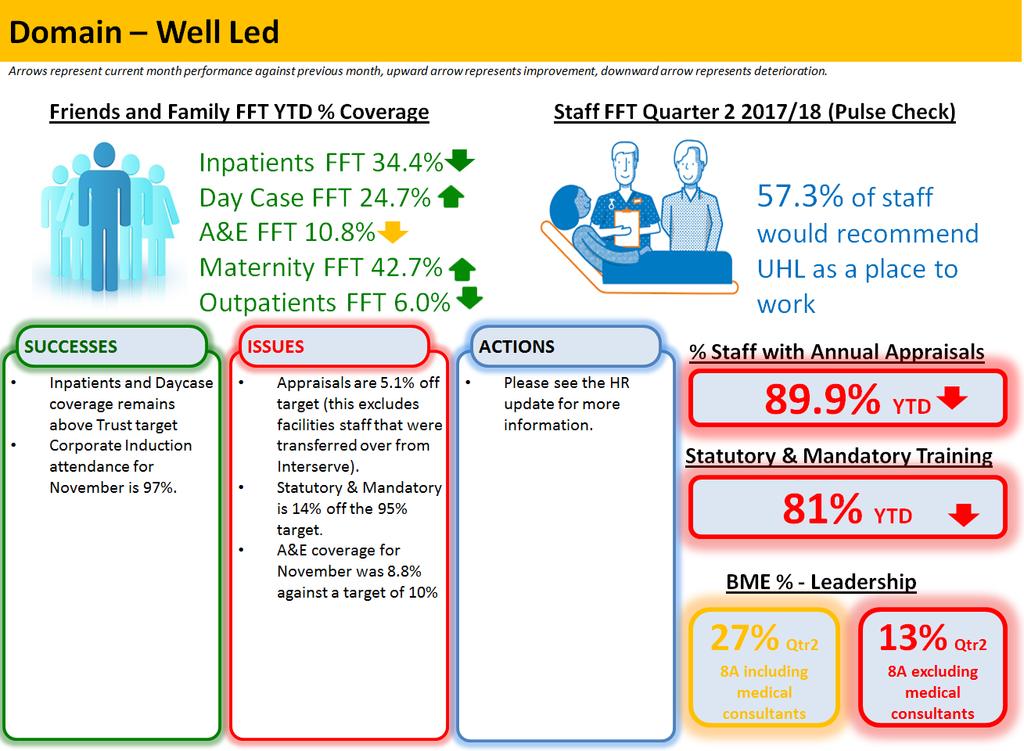
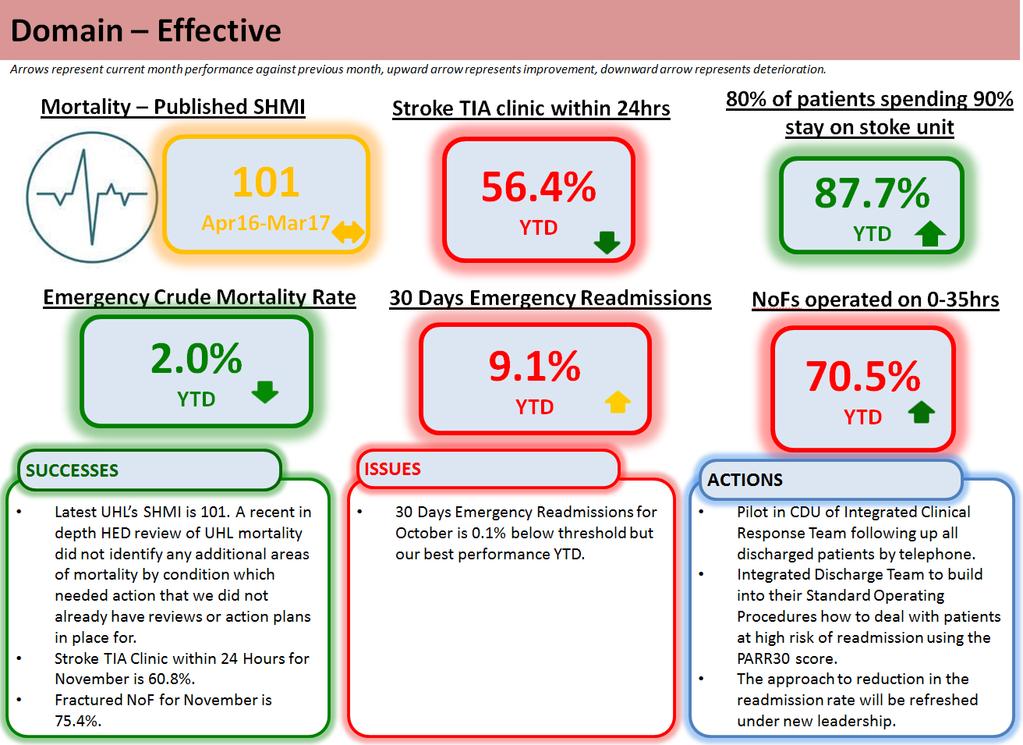
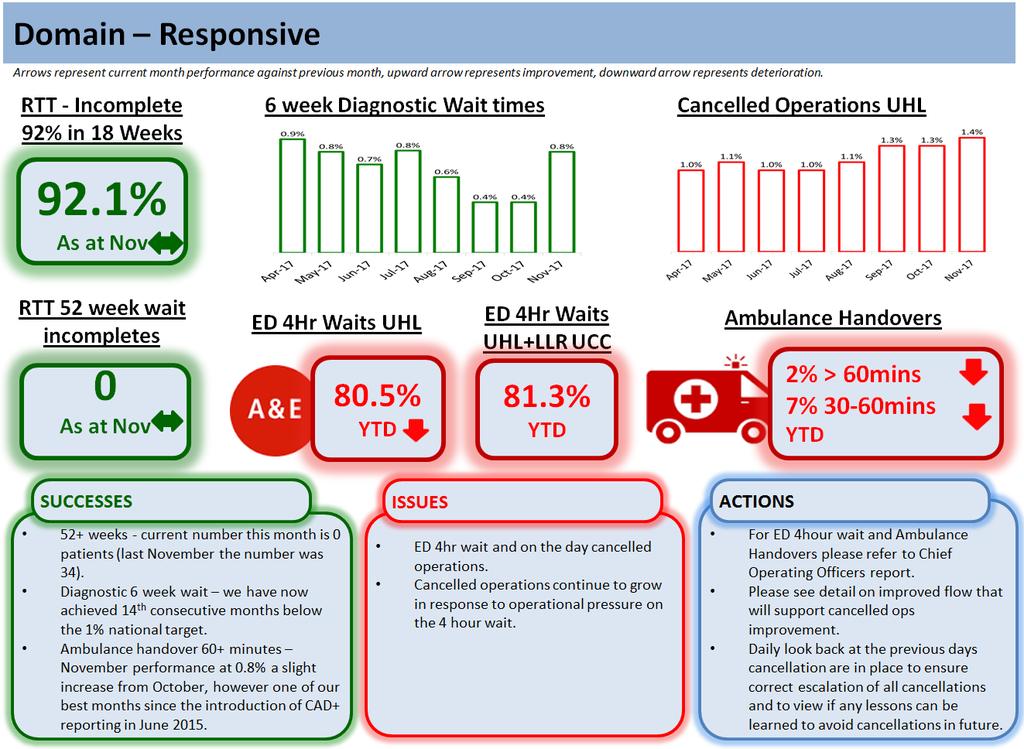
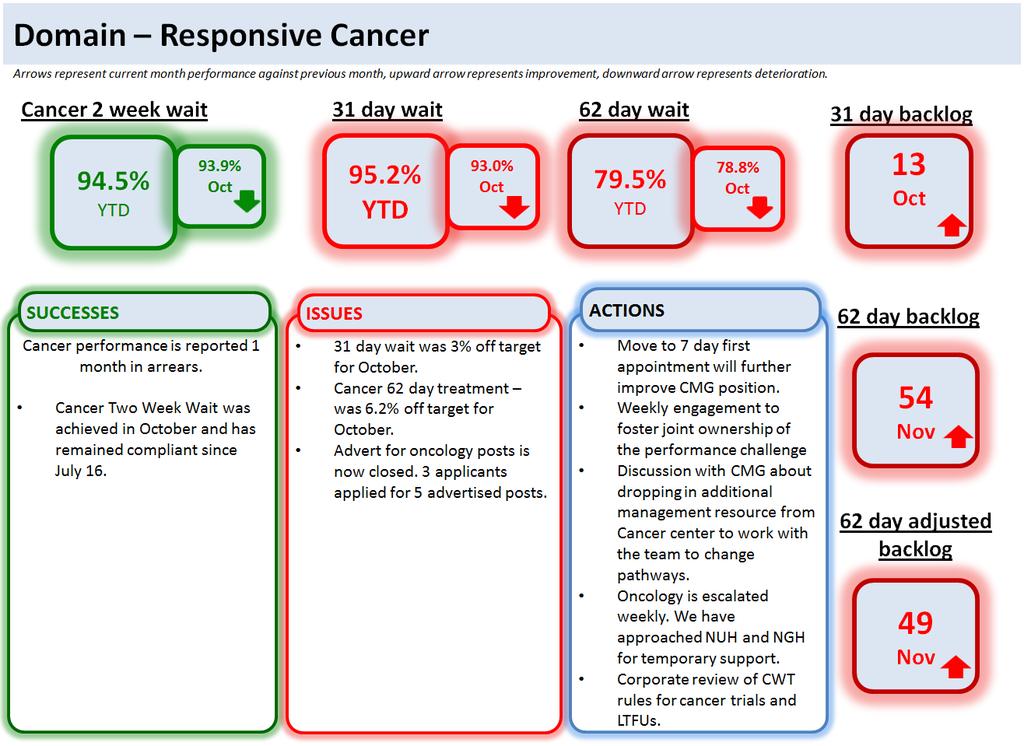
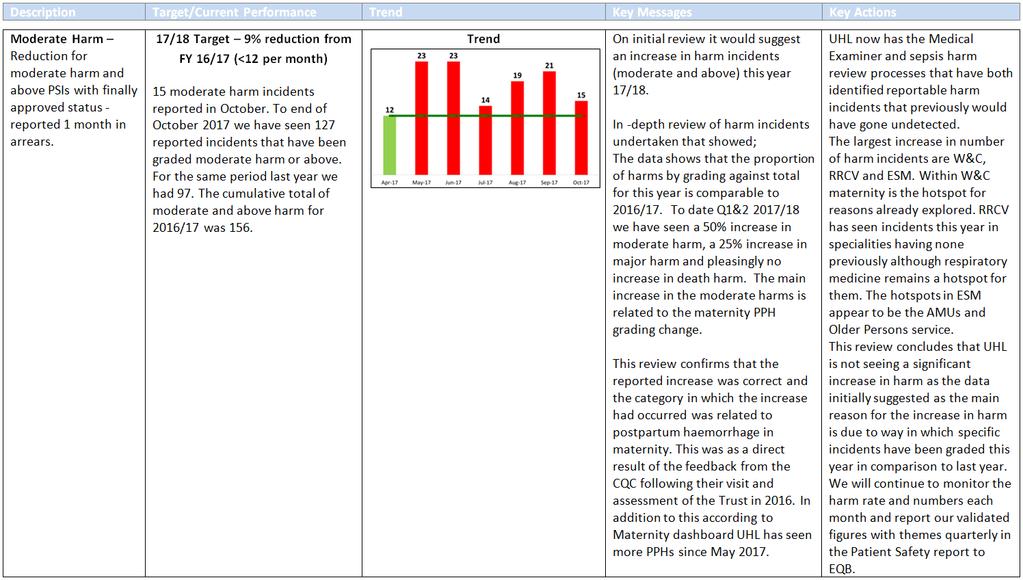
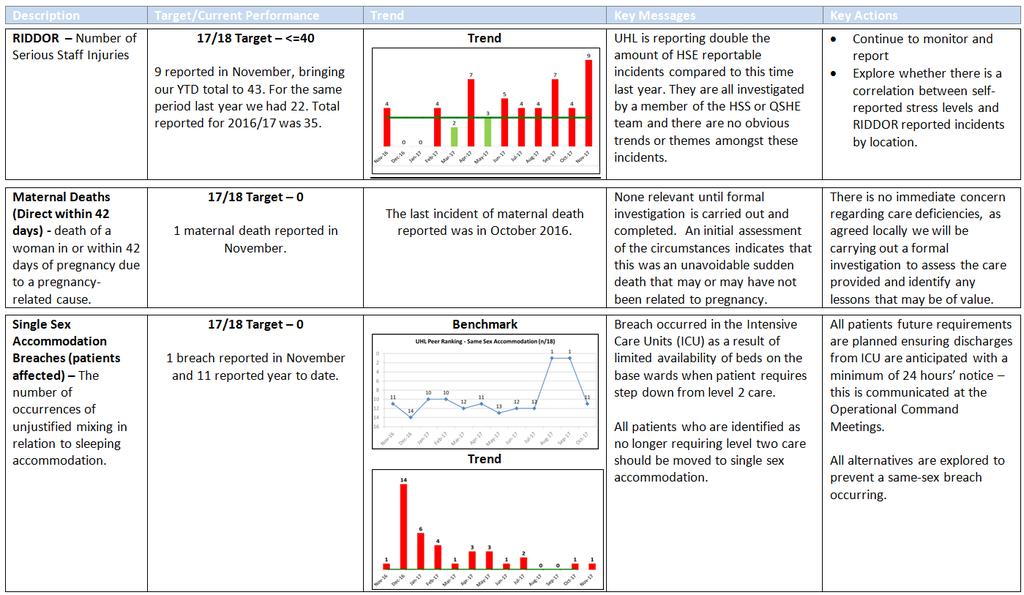
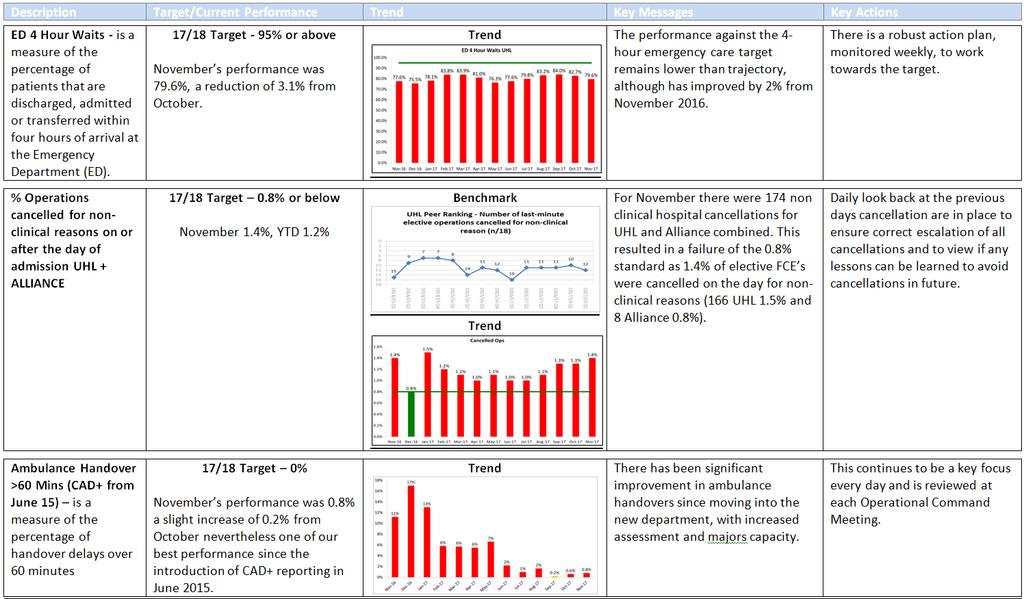
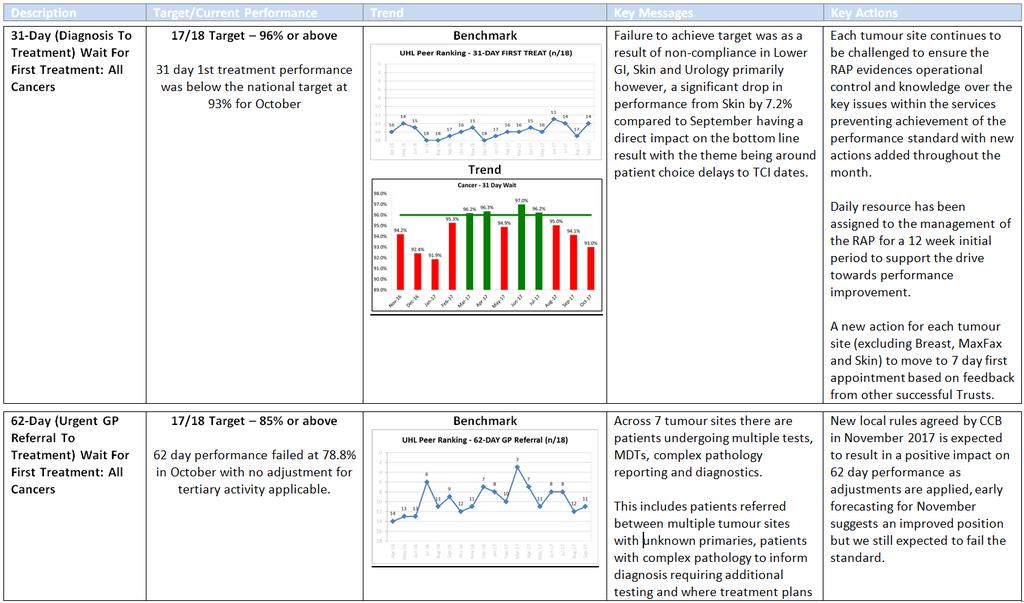
1 UNIVERSITY HOSPITALS OF LEICESTER NHS TRUST PAGE 1 OF 2 Quality & Performance Report Author: John Adler Sponsor: Chief Executive Date: PPPC + QOC 21 ST December 2017 Executive Summary from CEO Joint Paper 1 Context It has been agreed that I will provide a summary of the issues within the Q&P Report that I feel should particularly be brought to the attention of EPB, PPPC and QOC. This complements the Exception Reports which are triggered automatically when identified thresholds are met. Questions 1. What are the issues that I wish to draw to the attention of the committee? 2. Is the action being taken/planned sufficient to address the issues identified? If not, what further action should be taken? Conclusion Good News: Mortality the latest published SHMI (period April 2016 to March 2017) has remained at 101 and is within the expected range. Never events 0 reported this month. MRSA 0 avoidable cases reported this month. C DIFF November was within threshold, however year to date position remains higher than the threshold. Diagnostic 6 week wait compliant for the 14th consecutive month. Referral to Treatment was 92.1% against a target of 92% for the second consecutive month. 52+ weeks wait 0 patients (last November the number was 34). Cancer Two Week Wait have achieved the 93% threshold for over a year. Delayed transfers of care remain within the tolerance. However, there are a range of other delays that do not appear in the count. Pressure Ulcers 0 Grade 4 reported during November. Grade 3 and Grade 2 are well within the trajectory for the month and year to date. CAS alerts we remain compliant. TIA (high risk patients) target was achieved in November. Inpatient and Day Case Patient Satisfaction (FFT) achieved the Quality Commitment of 97%. Fractured NOF achieved at 75.4% after 2 months of non compliance. Ambulance Handover 60+ minutes (CAD+) performance at 0.8% a slight increase from October, however this remains one of our best months since the introduction of CAD+ reporting in June Bad News: UHL ED 4 hour performance was 79.6%, system performance (including LLR UCCs) was 84.6%. Further detail is in the COO s report. Moderate harms and above 15 cases reported during October (reported 1 month in arrears). A detailed report will be presented to the December QOC. Single Sex Accommodation Breaches 1 breach reported in November. Maternal Deaths 1 reported in November. Cancelled operations and patients rebooked within 28 days continued to be non compliant. Cancer 31 day and 62 day treatment were not achieved in October delayed referrals from network hospitals continue to be a significant factor. Statutory and Mandatory Training reported from HELM is at 81%. Annual Appraisal has dropped below 90% in November. Board Intelligence Hub template
2 UNIVERSITY HOSPITALS OF LEICESTER PAGE 2 OF 2 Input Sought I recommend that the Committee: Commends the positive achievements noted under Good News Note the areas of Bad News and consider if the actions being taken are sufficient. For Reference Edit as appropriate: 1. The following objectives were considered when preparing this report: Safe, high quality, patient centred healthcare [Yes /No /Not applicable] Effective, integrated emergency care [Yes /No /Not applicable] Consistently meeting national access standards [Yes /No /Not applicable] Integrated care in partnership with others [Yes /No /Not applicable] Enhanced delivery in research, innovation & ed [Yes /No /Not applicable] A caring, professional, engaged workforce [Yes /No /Not applicable] Clinically sustainable services with excellent facilities [Yes /No /Not applicable] Financially sustainable NHS organisation [Yes /No /Not applicable] Enabled by excellent IM&T [Yes /No /Not applicable] 2. This matter relates to the following governance initiatives: Organisational Risk Register [Yes /No /Not applicable] Board Assurance Framework [Yes /No /Not applicable] 3. Related Patient and Public Involvement actions taken, or to be taken: Not Applicable 4. Results of any Equality Impact Assessment, relating to this matter: Not Applicable 5. Scheduled date for the next paper on this topic: 25 th January 2018 Board Intelligence Hub template
3 Quality and Performance Report November 2017
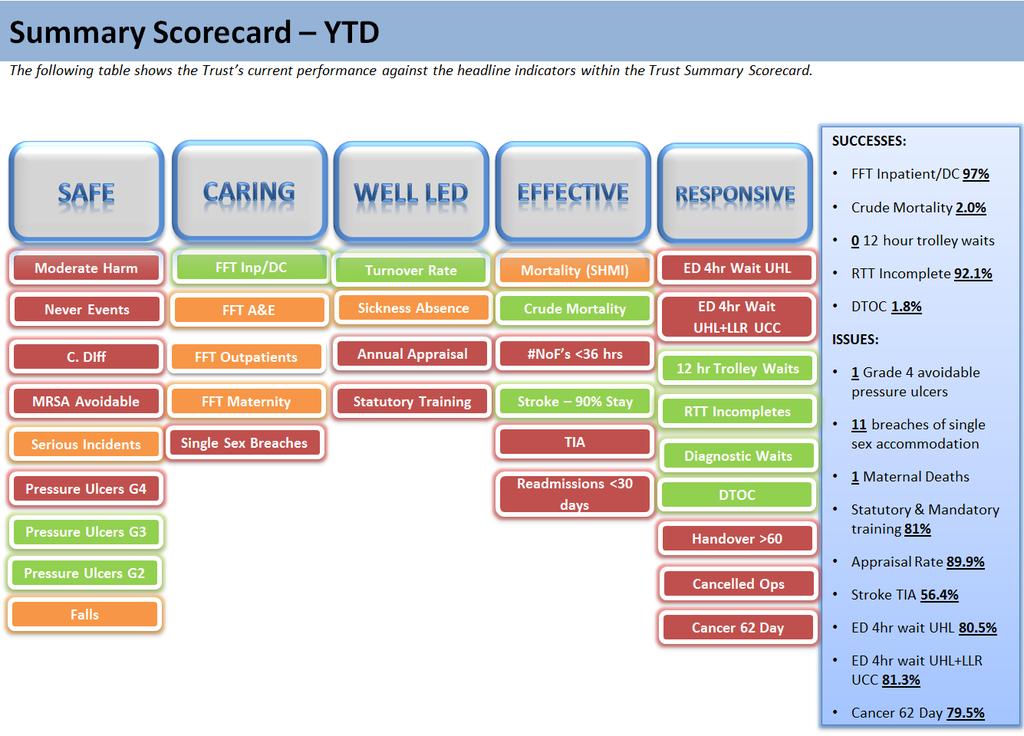
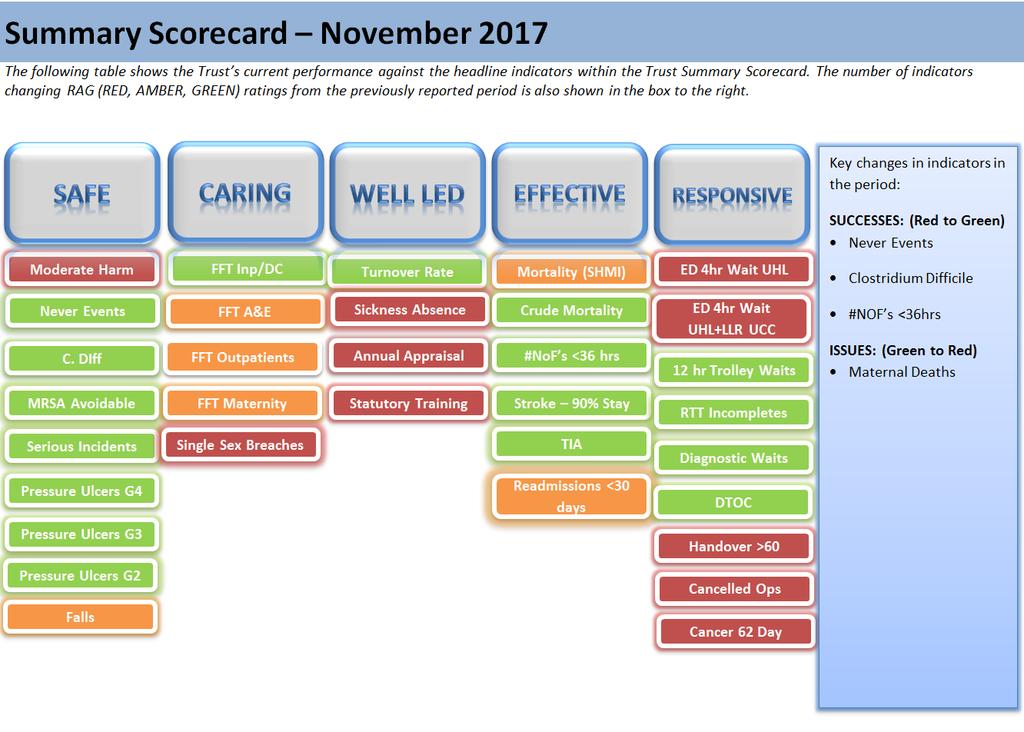
4 CONTENTS Page 2 Page 3 Introduction Performance Summary and Data Quality Forum (DQF) Assessment Outcome Executive Summary Page 4 Page 5 Page 6 Summary Scorecard (YTD) Summary Scorecard (October) Q&P Executive Summary Exception Reports and Dashboards Page 12 Page 18 Page 19 Page 20 Page 21 Page 22 Page 23 Page 24 Page 25 Exception Q&P Summary Report Safe Domain Dashboard Caring Domain Dashboard Well Led Domain Dashboard Effective Domain Dashboard Responsive Domain Dashboard Responsive Domain Cancer Dashboard Research & Innovation - UHL Compliance Forecast for Key Responsive Indicators Appendices Page 26 Page 29 Page 35 Page 37 Page 39 Page 50 Page 54 Page 56 Appendix A - Estates and Facilities Appendix B - RTT Performance Appendix C - Diagnostic Performance Appendix D - November Cancelled Operations: Executive Performance Board Appendix E - Cancer Waiting Time Performance Appendix F - Peer Group Analysis Appendix G - UHL Activity Trend Appendix H - UHL Bed Occupancy 1
5 UNIVERSITY HOSPITALS OF LEICESTER NHS TRUST REPORT TO: INTEGRATED FINANCE, PERFORMANCE AND INVESTMENT COMMITTEE QUALITY ASSURANCE COMMITTEE DATE: 21 ST DECEMBER 2017 REPORT BY: SUBJECT: ANDREW FURLONG, MEDICAL DIRECTOR TIM LYNCH, INTERIM CHIEF OPERATING OFFICER JULIE SMITH, CHIEF NURSE LOUISE TIBBERT, DIRECTOR OF WORKFORCE AND ORGANISATIONAL DEVELOPMENT DARRYN KERR, DIRECTOR OF ESTATES AND FACILITIES NOVEMBER 2017 QUALITY & PERFORMANCE SUMMARY REPORT 1.0 Introduction The following report provides an overview of performance for NHS Improvement (NHSI) and UHL key quality commitment/performance metrics. Escalation reports are included where applicable. The NHSI have recently published the Single Oversight Framework which sets out NHSI s approach to overseeing both NHS Trusts and NHS Foundation Trusts and shaping the support that NHSI provide. The NHS Single Oversight Framework sets out NHS Improvement s approach to overseeing and supporting NHS trusts and NHS foundation trusts under the Single Oversight Framework (SOF). It explains what the SOF is, how it is applied and how it relates to NHS Improvement s duties and strategic priorities. The document helps providers to understand how NHS Improvement is monitoring their performance; how NHSI identify any support providers need to improve standards and outcomes; and how NHSI co-ordinate agreed support packages where relevant. It summarises the data and metrics regularly collected and reviewed for all providers, and the specific factors that will trigger more detailed investigation into a trust s performance and support needs. NHSI have also made a small number of changes to the information and metrics used to assess providers performance under each theme, and the indicators that trigger consideration of a potential support need. These updates reflect changes in national policy and standards, other regulatory frameworks and the quality of performance data, to ensure that the oversight activities are consistent and aligned. The Quality and Performance report has been updated to report the new indicators. For further information see section 4 Changes to Indicators/Thresholds. 2
6 2.0 Performance Summary Domain Page Number Number of Indicators Number of Red Indicators this month Safe Caring Well Led Effective Responsive Responsive Cancer Research UHL Total Data Quality Forum (DQF) Assessment Outcome/Date The Trust Data Quality Forum Assessment combines the Trust s old data quality forum process and the Oxford University Hospital model. The responsibility for data quality against datasets and standards under consideration are the data owners rather than the forum members, with the executive lead for the data carrying the ultimate responsibility. In this manner, the Data Quality Forum operates as an assurance function rather than holding accountability for data quality. The process focuses on peer challenge with monthly meetings assessing where possible 4 indicators / standards at each meeting. The outputs are an agreed assessment of the data quality of the indicator under consideration with recommendations as required, a follow up date for review is also agreed. The assessment outcomes are detailed in the table below: Rating Data Quality Green Satisfactory Amber Data can be relied upon, but minor areas for improvement identified Red Unsatisfactory/ significant areas for improvement identified If the indicator is not RAG rated, the date of when the indicator is due to be quality assured is included. 4.0 Changes to Indicators/Thresholds Added - ED 4 Hour Waits UHL + LLR UCC (Type 3) 3
7 4
8 5
9 6
10 7
11 8
12 9
13 10
14 11
15 12
16 13
17 14
18 15
19 16
20 17
21 Safe Safe Caring Well Led Effective Responsive Research KPI Ref Indicators Board Director Lead Officer 17/18 Target Target Set by Red RAG/ Exception Report Threshold (ER) DQF Assessment outcome/date 14/15 Outturn 15/16 Outturn 16/17 Outturn Nov-16 Dec-16 Jan-17 Feb-17 Mar-17 Apr-17 May-17 Jun-17 Jul-17 Aug-17 Sep-17 Oct-17 Nov-17 17/18 YTD S1 Reduction for moderate harm and above PSIs with finally approved status - reported 1 month in arrears AF MD 9% REDUCTION FROM FY 16/17 (<12 per month) QC Red if >12 in mth, ER if >12 for 2 consecutive mths May-17 New Indicator S2 Serious Incidents - actual number escalated each month AF MD <=37 by end of FY 17/18 UHL Red / ER if >8 in mth or >5 for 3 consecutive mths May S3 Proportion of reported safety incidents per 1000 attendances (IP, OP and ED) AF MD > FY 16/17 UHL Not required May-17 New Indicator S4 S5 S6 SEPSIS - Patients with an Early Warning Score 3+ - % appropriate escalation - reported 1 month in arrears SEPSIS - Patients with EWS 3+ - % who are screened for sepsis - reported 1 month in arrears SEPSIS - ED - Patients who trigger with red flag sepsis - % that have their IV antibiotics within an hour - reported 1 month in arrears AF SH 95% UHL TBC Dec-17 New Indicator 88% 89% 88% 89% 89% 90% 91% 91% 92% 94% 94% 95% 95% 93% AF SH 95% UHL TBC Dec-17 New Indicator 93% 99% 99% 99% 97% 96% 96% 95% 94% 92% 94% 93% 95% 94% AF SH 90% UHL TBC Dec-17 New Indicator 76% 82% 76% 83% 88% 85% 86% 86% 87% 86% 86% 85% 86% 86% S7 SEPSIS - Wards (including assessment units) Patients who trigger for Red Flag Sepsis - % that receive their antibiotics within an hour - reported 1 month in arrears AF SH 90% UHL TBC Dec-17 New Indicator 55% 67% 76% 78% 77% 85% 81% 75% 82% 80% 75% 80% 84% 79% S8 Overdue CAS alerts AF MD 0 NHSI S9 RIDDOR - Serious Staff Injuries AF MD FYE <=40 UHL S10 Never Events AF MD 0 NHSI Red if >0 in mth ER = in mth >0 Nov Red / ER if non compliance with cumulative target Oct Red if >0 in mth ER = in mth >0 May S11 Clostridium Difficile JS DJ 61 NHSI Red if >mthly threshold / ER if Red or Non compliance with cumulative target Nov S12 MRSA Bacteraemias - Unavoidable or Assigned to third Party JS DJ 0 NHSI Red if >0 ER Not Required Nov S13 MRSA Bacteraemias (Avoidable) JS DJ 0 UHL S14 MRSA Total JS DJ 0 UHL Red if >0 ER if >0 Nov Red if >0 ER if >0 Nov S15 E. Coli Bacteraemias - Community JS DJ TBC NHSI TBC TBC New Indicator S16 E. Coli Bacteraemias - Acute JS DJ TBC NHSI TBC TBC New Indicator S17 E. Coli Bacteraemias - Total JS DJ TBC NHSI TBC TBC New Indicator S18 MSSA - Community JS DJ TBC NHSI TBC TBC New Indicator S19 MSSA - Acute JS DJ TBC NHSI TBC TBC New Indicator S20 MSSA - Total JS DJ TBC NHSI TBC TBC New Indicator S21 % of UHL Patients with No Newly Acquired Harms JS NB >=95% UHL Red if <95% ER if in mth <95% Sept-16 New Indicator 97.7% 97.7% 97.3% 98.0% 98.0% 97.7% 96.7% 97.2% 97.8% 97.4% 97.4% 98.0% 98.0% 97.6% 97.8% 97.6% S22 S23 % of all adults who have had VTE risk assessment on adm to hosp All falls reported per 1000 bed stays for patients >65yearsreported 1 month in arrears AF SR >=95% NHSI JS HL <=5.5 UHL Red if <95% ER if in mth <95% Nov % 95.9% 95.8% 96.3% 95.1% 95.0% 95.1% 95.1% 95.4% 95.8% 96.2% 95.9% 96.1% 95.7% 95.8% 96.1% 95.8% Red if >6.6 ER if 2 consecutive reds Jan S24 Avoidable Pressure Ulcers - Grade 4 JS MC 0 QS Red / ER if Non compliance with monthly target Aug S25 Avoidable Pressure Ulcers - Grade 3 JS MC <=3 a month (revised) with FY End <27 <=7 a month (revised) with FY End <84 QS Red / ER if Non compliance with monthly target Aug S26 Avoidable Pressure Ulcers - Grade 2 JS MC QS Red / ER if Non compliance with monthly target Aug S27 Maternal Deaths (Direct within 42 days) AF IS 0 UHL Red or ER if >0 Jan S28 Emergency C Sections (Coded as R18) IS EB Not within Highest Decile NHSI Red / ER if Non compliance with monthly target Jan % 17.5% 16.8% 15.3% 16.3% 17.9% 17.0% 16.7% 18.4% 19.3% 18.0% 16.6% 18.3% 17.7% 19.3% 16.1% 18.0% 18
22 Caring Safe Caring Well Led Effective Responsive Research KPI Ref Indicators Board Director Lead Officer 17/18 Target Target Set by Red RAG/ Exception Report Threshold (ER) DQF Assessment outcome/date 14/15 Outturn 15/16 Outturn 16/17 Outturn Nov-16 Dec-16 Jan-17 Feb-17 Mar-17 Apr-17 May-17 Jun-17 Jul-17 Aug-17 Sep-17 Oct-17 Nov-17 17/18 YTD C1 >75% of patients in the last days of life have individualised End of Life Care plans TBC TBC TBC QC TBC NEW INDICATOR C2 Formal complaints rate per 1000 IP,OP and ED attendances AF MD No Target UHL Monthly reporting Aug-17 NEW INDICATOR % 0% 0% 0% C3 Percentage of upheld PHSO cases AF MD No Target UHL Quarterly reporting TBC NEW INDICATOR 5% 0.0 (0 out of 3 cases) (Zero cases) (0 out of 3 cases) (0 out of 2 cases) C4 Published Inpatients and Daycase Friends and Family Test - % positive JS HL 97% UHL C5 Inpatients only Friends and Family Test - % positive JS HL 97% UHL C6 Daycase only Friends and Family Test - % positive JS HL 97% UHL C7 A&E Friends and Family Test - % positive JS HL 97% UHL C8 Outpatients Friends and Family Test - % positive JS HL 97% UHL C9 Maternity Friends and Family Test - % positive JS HL 97% UHL C10 C11 Friends & Family staff survey: % of staff who would recommend the trust as place to receive treatment (from Pulse Check) Single Sex Accommodation Breaches (patients affected) Red if <95% ER if red for 3 consecutive months Revise threshold 17/18 Red if <95% ER if red for 3 consecutive months Revise threshold 17/18 Red if <95% ER if red for 3 consecutive months Revise threshold 17/18 Red if <93% ER if red for 3 consecutive months Revised threshold 17/18 Red if <93% ER if red for 3 consecutive months Revised threshold 17/18 Red if <93% ER if red for 3 consecutive months Revised threshold 17/18 Jun-17 New Indicator 97% 97% 97% 97% 96% 96% 96% 97% 97% 97% 97% 97% 97% 97% 97% 97% Jun-17 96% 97% 96% 96% 96% 95% 95% 95% 96% 96% 96% 96% 96% 97% 95% 96% 96% Jun-17 New Indicator 98% 98% 98% 98% 98% 99% 98% 99% 98% 99% 98% 98% 98% 99% 98% 98% Jun-17 96% 96% 91% 84% 91% 93% 94% 95% 94% 93% 96% 95% 98% 96% 95% 95% 95% Jun-17 New Indicator 94% 93% 95% 92% 92% 92% 92% 92% 93% 95% 94% 95% 95% 94% 95% 94% Jun-17 96% 95% 95% 94% 93% 96% 94% 95% 94% 95% 96% 94% 93% 93% 93% 95% 94% LT LT TBC NHSI TBC Aug % 70.0% 73.6% 73.3% 72.7% 74.3% 70.7% 72.5% JS HL 0 NHSI Red if >0 ER if 2 consecutive months >5 Dec
23 Well Led Safe Caring Well Led Effective Responsive Research KPI Ref Indicators Board Director Lead Officer 17/18 Target Target Set by Red RAG/ Exception Report Threshold (ER) DQF Assessment outcome/date 14/15 Outturn 15/16 Outturn 16/17 Outturn Nov-16 Dec-16 Jan-17 Feb-17 Mar-17 Apr-17 May-17 Jun-17 Jul-17 Aug-17 Sep-17 Oct-17 Nov-17 17/18 YTD W1 W2 W3 Published Inpatients and Daycase Friends and Family Test - Coverage (Adults and Children) Inpatients only Friends and Family Test - Coverage (Adults and Children) Daycase only Friends and Family Test - Coverage (Adults and Children) JS HL Not Appicable N/A Not Appicable Jun-17 JS HL 30% QS JS HL 20% QS W4 A&E Friends and Family Test - Coverage JS HL 10% QS W5 Outpatients Friends and Family Test - Coverage JS HL 5% QS W6 Maternity Friends and Family Test - Coverage JS HL 30% UHL W7 Friends & Family staff survey: % of staff who would recommend the trust as place to work (from Pulse Check) LT BK Not within Lowest Decile W8 Nursing Vacancies JS MM TBC UHL W9 Nursing Vacancies in ESM CMG JS MM TBC UHL Red if <26% ER if 2mths Red Red if <10% ER if 2 mths Red Red if <7.1% ER if 2 mths Red Red if <1.5% ER if 2 mths Red Jun-17 Jun-17 Jun-17 Jun-17 New Indicator New Indicator New Indicator New Indicator New Indicator 27.4% 30.2% 31.6% 27.5% 27.2% 30.7% 30.4% 32.4% 31.9% 27.7% 31.0% 29.3% 29.4% 28.2% 27.7% 29.7% 31.0% 35.3% 37.0% 31.9% 31.3% 35.4% 33.8% 37.1% 37.2% 30.6% 37.7% 35.6% 33.2% 32.4% 31.6% 34.4% 22.5% 24.4% 25.7% 22.3% 22.5% 25.5% 26.4% 27.1% 26.4% 24.7% 23.9% 22.7% 25.3% 23.8% 23.9% 24.7% 10.5% 10.8% 11.4% 7.1% 10.4% 13.8% 12.1% 13.8% 8.3% 9.4% 11.1% 13.5% 12.4% 9.7% 8.8% 10.8% 1.4% 3.0% 1.8% 5.7% 5.9% 5.9% 6.5% 5.4% 5.6% 6.0% 5.7% 6.4% 6.6% 6.1% 6.0% 6.0% Red if <26% ER if 2 mths Red Jun % 31.6% 38.0% 41.1% 37.1% 40.9% 38.0% 41.1% 46.8% 44.1% 42.2% 43.3% 40.9% 38.8% 40.3% 46.0% 42.7% NHSI TBC Sep % 55.4% 61.9% 62.9% 61.4% 62.5% 57.3% 59.9% Separate report submitted to QAC Separate report submitted to QAC Dec-17 Dec-17 New Indicator New Indicator 8.4% 9.2% 9.7% 7.1% 7.6% 7.4% 9.2% 10.9% 9.9% 11.1% 10.8% 10.3% 9.7% 9.4% 9.4% 17.2% 15.4% 20.2% 14.5% 11.9% 13.7% 15.4% 19.7% 16.9% 21.3% 23.3% 22.5% 22.4% 22.1% 22.1% W10 Turnover Rate LT LG TBC NHSI W11 Sickness absence (reported 1 month in arrears) LT BK 3% UHL ER = Red for 3 Consecutive Mths Red = 11% or above Nov % 9.9% 9.3% 9.2% 9.3% 9.3% 9.3% 9.3% 8.7% 8.8% 8.8% 8.8% 8.7% 8.5% 8.6% 8.5% 8.5% ER if 3 consecutive mths >4.0% Red if >4% Oct % 3.6% 3.3% 3.6% 3.6% 3.7% 3.5% 3.3% 3.3% 3.5% 3.6% 3.8% 3.8% 4.1% 4.7% 3.8% W12 Temporary costs and overtime as a % of total paybill LT LG TBC NHSI TBC Nov % 10.7% 10.6% 10.9% 10.1% 10.8% 10.5% 11.4% 11.1% 11.0% 11.1% 11.2% 11.6% 11.0% 10.7% 11.5% 11.3% W13 % of Staff with Annual Appraisal (excluding facilities Services) LT BK 95% UHL ER if 3 consecutive mths <90% Red if <90% Dec % 90.7% 91.7% 91.9% 91.7% 91.6% 92.4% 91.7% 92.1% 92.5% 92.1% 91.7% 91.2% 91.0% 90.9% 89.9% 89.9% W14 Statutory and Mandatory Training LT BK 95% UHL TBC Dec-16 95% 93% 87% 82% 83% 81% 82% 87% 86% 85% 85% 85% 81% 81% W15 % Corporate Induction attendance LT BK 95% UHL ER if 3 consecutive mths <90% Red if <90% Dec % 97% 96% 95% 99% 98% 97% 96% 100% 98% 96% 98% 97% 94% 95% 97% 97% W16 W17 W18 W19 W20 W21 W22 W23 BME % - Leadership (8A Including Medical Consultants) BME % - Leadership (8A Excluding Medical Consultants) Executive Team Turnover Rate - Executive Directors (rolling 12 months) Executive Team Turnover Rate - Non Executive Directors (rolling 12 months) DAY Safety staffing fill rate - Average fill rate - registered nurses/midwives (%) DAY Safety staffing fill rate - Average fill rate - care staff (%) NIGHT Safety staffing fill rate - Average fill rate - registered nurses/midwives (%) NIGHT Safety staffing fill rate - Average fill rate - care staff (%) LT AH 28% UHL 4% improvement on Qtr 1 baseline Oct-17 26% 26% 26% 26% 27% 27% New Indicator LT AH 28% UHL 4% improvement on Qtr 1 baseline Oct-17 12% 12% 12% 12% 13% 13% LT AH TBC UHL TBC Nov-17 0% 0% 0% 0% 0% 0% 0% 0% 20% 20% 20% 20% 20% 20% 20% New Indicator LT AH TBC UHL TBC Nov-17 25% 43% 25% 25% 25% 25% 25% 25% 29% 14% 14% 14% 14% 14% 14% JS MM TBC NHSI TBC Apr % 90.5% 90.5% 89.3% 90.4% 91.6% 91.6% 89.8% 90.3% 90.3% 89.9% 89.4% 87.8% 93.3% 92.3% 93.3% 90.6% JS MM TBC NHSI TBC Apr % 92.0% 92.3% 93.2% 91.9% 89.7% 91.1% 87.4% 96.7% 91.6% 87.9% 93.0% 94.9% 106.1% 109.6% 113.0% 98.3% JS MM TBC NHSI TBC Apr % 95.4% 96.4% 95.9% 96.9% 97.6% 97.2% 96.2% 96.6% 96.5% 95.9% 95.4% 95.2% 93.2% 90.3% 91.1% 94.3% JS MM TBC NHSI TBC Apr % 98.9% 97.1% 95.6% 98.5% 95.8% 97.8% 94.7% 100.2% 99.1% 93.1% 100.2% 107.7% 114.3% 119.9% 122.5% 107.0% 20
24 Effective Safe Caring Well Led Effective Responsive Research KPI Ref Indicators Board Director Lead Officer 17/18 Target Target Set by Red RAG/ Exception Report Threshold (ER) DQF Assessment outcome/date 14/15 Outturn 15/16 Outturn 16/17 Outturn Nov-16 Dec-16 Jan-17 Feb-17 Mar-17 Apr-17 May-17 Jun-17 Jul-17 Aug-17 Sep-17 Oct-17 Nov-17 17/18 YTD E1 Emergency readmissions within 30 days following an elective or emergency spell AF CM Monthly <8.5% QC Red if >8.6% ER if >8.6% Jun % Target 7% 8.9% 8.5% 8.1% 8.7% 8.7% 8.4% 8.8% 9.5% 9.0% 9.0% 8.9% 9.2% 9.3% 8.6% 9.1% E2 Mortality - Published SHMI AF RB <=99 QC Red/ER if not within national expected range Sep (Oct15- Sep16) 99 (Apr15- Mar16) 101 (Jul15-Jun16) 102 (Oct15-Sep16) 101 (Jan16-Dec16) 101 (Apr16-Mar17) 101 (Apr16- Mar17) E3 Mortality - Rolling 12 mths SHMI (as reported in HED) Rebased AF RB <=99 QC Red/ER if not within national expected range Sep Awaiting HED Update 98 E4 Mortality - Rolling 12 mths HSMR (Rebased Monthly as reported in HED) AF RB <=99 UHL Red/ER if not within national expected range Sep Awaiting HED Update 97 E5 Crude Mortality Rate Emergency Spells AF RB <=2.4% UHL Monthly Reporting Apr % 2.3% 2.4% 2.4% 2.7% 2.9% 2.6% 2.4% 2.1% 1.9% 2.0% 2.2% 1.8% 1.8% 1.9% 2.1% 2.0% E6 No. of # Neck of femurs operated on 0-35 hrs - Based on Admissions AF AC 72% or above QS Red if <72% ER if 2 consecutive mths <72% Jun % 63.8% 71.2% 78.0% 60.3% 70.9% 67.6% 71.2% 47.1% 76.5% 76.8% 76.1% 80.6% 69.6% 61.1% 75.4% 70.5% E7 Stroke - 90% of Stay on a Stroke Unit TL IL 80% or above QS Red if <80% ER if 2 consecutive mths <80% Dec % 85.6% 85.0% 88.0% 83.8% 87.4% 86.6% 85.1% 87.3% 85.7% 85.7% 93.6% 89.0% 85.4% 87.4% 87.7% E8 Stroke - TIA Clinic within 24 Hours (Suspected High Risk TIA) TL IL 60% or above QS Red if <60% ER if 2 consecutive mths <60% Dec % 75.6% 66.9% 75.9% 69.2% 87.7% 57.3% 66.3% 57.8% 57.0% 68.6% 64.3% 51.7% 28.6% 67.9% 60.8% 56.4% 21
25 Responsive Safe Caring Well Led Effective Responsive Research KPI Ref Indicators Board Director Lead Officer 17/18 Target Target Set by 17/18 Red RAG/ Exception Report Threshold (ER) DQF Assessment outcome/date 14/15 Outturn 15/16 Outturn 16/17 Outturn Nov-16 Dec-16 Jan-17 Feb-17 Mar-17 Apr-17 May-17 Jun-17 Jul-17 Aug-17 Sep-17 Oct-17 Nov-17 17/18 YTD R1 ED 4 Hour Waits UHL TL IL 95% or above NHSI R2 ED 4 Hour Waits UHL + LLR UCC (Type 3) TL IL 95% or above NHSI R3 12 hour trolley waits in A&E TL IL 0 NHSI Red if <92% ER via ED TB report Aug % 86.9% 79.6% 77.6% 75.5% 78.1% 83.8% 83.9% 81.0% 76.3% 77.6% 79.8% 83.2% 84.0% 82.7% 79.6% 80.5% Red if <92% ER via ED TB report TBC NEW INDICATOR 84.6% 81.3% Red if >0 ER via ED TB report Aug R4 RTT - Incomplete 92% in 18 Weeks UHL+ALLIANCE TL WM 92% or above NHSI Red /ER if <92% Nov % 92.6% 91.8% 92.2% 91.3% 90.9% 91.2% 91.8% 91.3% 92.3% 92.3% 91.8% 91.8% 91.4% 92.1% 92.1% 92.1% R5 RTT 52 Weeks+ Wait (Incompletes) UHL+ALLIANCE TL WM 0 NHSI Red /ER if >0 Nov R6 6 Week - Diagnostic Test Waiting Times (UHL+ALLIANCE) TL WM 1% or below NHSI Red /ER if >1% Dec % 1.1% 0.9% 0.6% 0.9% 0.9% 0.9% 0.9% 0.9% 0.8% 0.7% 0.8% 0.6% 0.4% 0.4% 0.8% 0.8% R7 Urgent Operations Cancelled Twice (UHL+ALLIANCE) TL WM 0 NHSI Red if >0 ER if >0 Jan R8 Cancelled patients not offered a date within 28 days of the cancellations UHL TL WM 0 NHSI Red if >2 ER if >0 Jan R9 Cancelled patients not offered a date within 28 days of the cancellations ALLIANCE TL WM 0 NHSI Red if >2 ER if >0 Jan R10 R11 % Operations cancelled for non-clinical reasons on or after the day of admission UHL % Operations cancelled for non-clinical reasons on or after the day of admission ALLIANCE TL WM 0.8% or below Contract TL WM 0.8% or below Contract Red if >0.8% ER if >0.8% Jan % 1.0% 1.2% 1.5% 0.8% 1.6% 1.2% 1.2% 0.9% 1.1% 1.0% 1.1% 1.2% 1.4% 1.4% 1.5% 1.2% Red if >0.8% ER if >0.8% Jan % 0.9% 0.9% 0.5% 0.1% 0.4% 1.3% 0.5% 2.5% 0.1% 0.4% 0.0% 0.1% 0.1% 0.9% 0.8% 0.6% R12 R13 % Operations cancelled for non-clinical reasons on or after the day of admission UHL + ALLIANCE No of Operations cancelled for non-clinical reasons on or after the day of admission UHL + ALLIANCE TL WM 0.8% or below Contract R14 Delayed transfers of care TL JD 3.5% or below NHSI R15 R16 Ambulance Handover >60 Mins (CAD+ from June 15) Ambulance Handover >30 Mins and <60 mins (CAD+ from June 15) Red if >0.8% ER if >0.8% Jan % 1.0% 1.2% 1.4% 0.8% 1.5% 1.2% 1.1% 1.0% 1.1% 1.0% 1.0% 1.1% 1.3% 1.3% 1.4% 1.2% TL WM Not Applicable UHL Not Applicable Jan TL LG 0 Contract TL LG 0 Contract Red if >3.5% ER if Red for 3 consecutive mths Oct % 1.4% 2.4% 2.7% 2.8% 2.7% 2.3% 2.5% 2.1% 2.0% 1.4% 1.6% 1.7% 1.9% 1.7% 1.9% 1.8% Red if >0 ER if Red for 3 consecutive mths TBC 5% 5% 9% 11% 17% 13% 6% 6% 6% 7% 2% 1% 2% 0.2% 0.6% 0.8% 2% Red if >0 ER if Red for 3 consecutive mths TBC 19% 19% 14% 18% 18% 15% 12% 13% 13% 13% 8% 5% 4% 3% 6% 8% 7% 22
26 Responsive Cancer Safe Caring Well Led Effective Responsive Research KPI Ref Indicators Board Director Lead Officer 17/18 Target Target Set by Red RAG/ Exception Report Threshold (ER) DQF Assessment outcome/date 14/15 Outturn 15/16 Outturn 16/17 Outturn Nov-16 Dec-16 Jan-17 Feb-17 Mar-17 Apr-17 May-17 Jun-17 Jul-17 Aug-17 Sep-17 Oct-17 Nov-17 17/18 YTD ** Cancer statistics are reported a month in arrears. RC1 Two week wait for an urgent GP referral for suspected cancer to date first seen for all suspected cancers TL DB 93% or above NHSI Red if <93% ER if Red for 2 consecutive mths Jul % 90.5% 93.2% 95.2% 93.8% 93.2% 94.3% 94.0% 93.3% 95.4% 95.1% 93.7% 94.3% 95.6% 93.9% ** 94.5% RC2 Two Week Wait for Symptomatic Breast Patients (Cancer Not initially Suspected) TL DB 93% or above NHSI Red if <93% ER if Red for 2 consecutive mths Jul % 95.1% 93.9% 96.0% 91.1% 93.4% 97.0% 90.8% 89.6% 94.2% 89.6% 93.0% 92.3% 95.4% 94.3% ** 92.8% RC3 31-Day (Diagnosis To Treatment) Wait For First Treatment: All Cancers TL DB 96% or above NHSI Red if <96% ER if Red for 2 consecutive mths Jul % 94.8% 93.9% 94.2% 92.4% 91.9% 95.3% 96.2% 96.3% 94.9% 97.0% 96.2% 95.0% 94.1% 93.0% ** 95.2% RC4 31-Day Wait For Second Or Subsequent Treatment: Anti Cancer Drug Treatments TL DB 98% or above NHSI Red if <98% ER if Red for 2 consecutive mths Jul % 99.7% 99.7% 100.0% 100.0% 98.9% 100.0% 100.0% 98.7% 97.7% 100.0% 97.9% 99.1% 99.1% 100.0% ** 99.0% RC5 31-Day Wait For Second Or Subsequent Treatment: Surgery TL DB 94% or above NHSI Red if <94% ER if Red for 2 consecutive mths Jul % 85.3% 86.4% 83.3% 87.2% 90.9% 88.5% 95.4% 85.5% 85.7% 88.9% 90.5% 81.5% 82.1% 80.2% ** 84.8% RC6 31-Day Wait For Second Or Subsequent Treatment: Radiotherapy Treatments TL DB 94% or above NHSI Red if <94% ER if Red for 2 consecutive mths Jul % 94.9% 93.5% 94.8% 98.1% 95.3% 99.1% 96.7% 95.0% 93.0% 96.2% 95.6% 94.5% 92.1% 90.7% ** 93.8% RC7 62-Day (Urgent GP Referral To Treatment) Wait For First Treatment: All Cancers TL DB 85% or above NHSI Red if <85% ER if Red in mth or YTD Jul % 77.5% 78.1% 77.2% 79.5% 75.4% 76.1% 86.5% 83.7% 76.8% 77.7% 82.1% 78.9% 79.1% 78.8% ** 79.5% RC8 62-Day Wait For First Treatment From Consultant Screening Service Referral: All Cancers TL DB 90% or above NHSI Red if <90% ER if Red for 2 consecutive mths Jul % 89.1% 88.6% 88.0% 90.9% 93.1% 78.1% 95.1% 95.0% 92.3% 93.3% 85.3% 90.5% 80.0% 89.3% ** 90.1% RC9 Cancer waiting 104 days TL DB 0 NHSI TBC Jul-16 New Indicator Day (Urgent GP Referral To Treatment) Wait For First Treatment: All Cancers Inc Rare Cancers Board Lead Target Set KPI Ref Indicators 17/18 Target Director Officer by RC10 Brain/Central Nervous System TL DB 85% or above NHSI RC11 Breast TL DB 85% or above NHSI RC12 Gynaecological TL DB 85% or above NHSI RC13 Haematological TL DB 85% or above NHSI RC14 Head and Neck TL DB 85% or above NHSI RC15 Lower Gastrointestinal Cancer TL DB 85% or above NHSI RC16 Lung TL DB 85% or above NHSI RC17 Other TL DB 85% or above NHSI RC18 Sarcoma TL DB 85% or above NHSI RC19 Skin TL DB 85% or above NHSI RC20 Upper Gastrointestinal Cancer TL DB 85% or above NHSI RC21 Urological (excluding testicular) TL DB 85% or above NHSI RC22 Rare Cancers TL DB 85% or above NHSI RC23 Grand Total TL DB 85% or above NHSI Red RAG/ Exception Report Threshold (ER) DQF Assessment outcome 14/15 Outturn 15/16 Outturn 16/17 Outturn Nov-16 Dec-16 Jan-17 Feb-17 Mar-17 Apr-17 May-17 Jun-17 Jul-17 Aug-17 Sep-17 Oct-17 Nov-17 17/18 YTD Red if <90% ER if Red for 2 consecutive mths Jul % 100.0% % ** -- Red if <90% ER if Red for 2 consecutive mths Jul % 95.6% 96.3% 95.8% 94.6% 96.6% 92.6% 93.48% 97.4% 97.4% 93.3% 96.3% 91.7% 93.1% 97.0% ** 95.1% Red if <90% ER if Red for 2 consecutive mths Jul % 73.4% 69.5% 66.7% 44.4% 71.4% 81.8% 78.6% 64.3% 89.5% 92.3% 75.0% 43.6% 46.7% 82.4% ** 70.0% Red if <90% ER if Red for 2 consecutive mths Jul % 63.0% 70.6% 77.8% 66.7% 87.5% 81.8% 88.9% 100% 64.3% 92.9% 100.0% 81.8% 70.0% 100.0% ** 85.5% Red if <90% ER if Red for 2 consecutive mths Jul % 50.7% 44.5% 66.7% 33.3% 41.7% 33.3% 66.7% 85.7% 48.3% 61.9% 64.7% 47.8% 61.9% 57.7% ** 57.6% Red if <90% ER if Red for 2 consecutive mths Jul % 59.8% 56.8% 61.5% 75.0% 48.3% 54.5% 75.0% 40.0% 63.8% 50.0% 60.5% 78.9% 78.3% 38.7% ** 58.6% Red if <90% ER if Red for 2 consecutive mths Jul % 71.0% 65.1% 67.5% 79.5% 74.0% 33.3% 67.5% 78.4% 64.8% 61.1% 74.4% 68.8% 61.4% 64.1% ** 67.0% Red if <90% ER if Red for 2 consecutive mths Jul % 71.4% 60.0% % % 50.0% 100.0% 100.0% 0.0% 100.0% 40.0% 66.7% ** 66.7% Red if <90% ER if Red for 2 consecutive mths Jul % 81.3% 45.2% 100.0% 66.7% 40.0% 0% 100.0% % 100.0% 50.0% 100.0% 50.0% 100.0% ** 68.8% Red if <90% ER if Red for 2 consecutive mths Jul % 94.1% 96.9% 92.3% 97.0% 96.9% 96.6% 96.2% 96.8% 95.5% 93.8% 97.5% 100.0% 96.1% 97.3% ** 96.8% Red if <90% ER if Red for 2 consecutive mths Jul % 63.9% 68.0% 100.0% 72.0% 61.4% 63.6% 85.7% 92.3% 66.7% 59.4% 58.6% 75.7% 63.2% 81.1% ** 70.9% Red if <90% ER if Red for 2 consecutive mths Jul % 74.4% 80.8% 75.0% 79.3% 71.4% 76.2% 89.9% 82.1% 79.4% 72.3% 84.7% 77.4% 83.5% 66.7% ** 78.6% Red if <90% ER if Red for 2 consecutive mths Jul % 100.0% 100.0% 100.0% 100.0% 100.0% 100.0% 100.0% 100.0% % 100.0% 50.0% 100.0% 100.0% ** 90.9% Red if <90% ER if Red for 2 consecutive mths Jul % 77.5% 78.1% 77.2% 79.5% 75.4% 76.1% 86.5% 83.7% 76.8% 77.7% 82.1% 78.9% 79.1% 78.8% ** 79.5% 23
27 Research UHL Safe Caring Well Led Effective Responsive Research Note: changes with the HRA process have changed the start point for these KPI's KPI Ref Indicators Board Director Lead Officer 17/18 Target Target Set by Red RAG/ Exception Report Threshold (ER) 14/15 Outturn 15/16 Outturn 16/17 Outturn Jul-16 Aug-16 Sep-16 Oct-16 Nov-16 Dec-16 Jan-17 Feb-17 Mar-17 Apr-17 May-17 Jun-17 Jul-17 Aug-17 Sep-17 RU1 Median Days from submission to Trust approval (Portfolio) AF NB TBC TBC TBC RU2 Median Days from submission to Trust approval (Non Portfolio) RU3 Recruitment to Portfolio Studies AF NB RU4 % Adjusted Trials Meeting 70 day Benchmark (data sunbmitted for the previous 12 month period) AF NB TBC TBC TBC Aspirational target=10920/ye ar (910/month) AF NB TBC TBC TBC Q2-Q TBC TBC (Oct15 - Sep16) 90.3% 90 (Jan16 - Dec16) 100% 27 (Apr16 - Mar17) 50% (metric change due to HRA process change) (July 16 - July 17) 81% RU5 Rank No. Trials Submitted for 70 day Benchmark (data submitted for the previous 12 month period) AF NB TBC TBC TBC (Oct15 - Sep16) 10/205 (Jan16 - Dec16) 31/186 (Apr16 - Mar17) 14/187 (July 16 - July 17) 12/196 RU6 %Closed Commercial Trials Meeting Recruitment Target (data submitted for the previous 12 month period) AF NB TBC TBC TBC (Oct15 - Sep16) 52.0% (Jan16 - Dec16) 49.2% (Apr16 - Mar17) 44.9% (July 16 - July 17) 43.5% 24
28 Compliance Forecast for Key Responsive Indicators Standard Nov Dec Commentary Emergency Care 4+ hr Wait (95%) 79.6% 4+ hr Wait UHL + LLR UCC (95%) 84.6% Ambulance Handover (CAD+) % Ambulance Handover >60 Mins (CAD+) 0.8% % Ambulance Handover >30 Mins and <60 mins (CAD+) 8% Validated position. EMAS monthly report RTT (inc Alliance) Incomplete (92%) 92.1% 90.7% Diagnostic (inc Alliance) DM01 - diagnostics 6+ week waits (<1%) 0.8% 0.9% # Neck of femurs % operated on within 36hrs - all admissions (72%) 75.0% 72% Cancelled Ops (inc Alliance) Cancelled Ops (0.8%) 1.4% 1.4% Not Rebooked within 28 days (0 patients) Cancer Two Week Wait (93%) 94% 94% 31 Day First Treatment (96%) 93% 92% 31 Day Subsequent Surgery Treatment (94%) 92% 92% 62 Days (85%) 76% 80% Cancer waiting 104 days (0 patients)
29 Nov-16 Dec-16 Jan-17 Feb-17 Mar-17 Apr-17 May-17 Jun-17 Jul-17 Aug-17 Sep-17 Oct-17 Nov % 98% 96% 94% 92% 90% 88% 86% 84% APPENDIX A Estates and Facilities - Cleanliness Cleanliness Audit Scores by Risk Category - Very High Jun-17 Jul-17 Aug-17 Sep-17 Oct-17 Nov-17 Triangulation Data - Cleaning Q4 Q1 Q2 Q3 Q4 Q1 Q2 Q3 Q4 Q1 Q Number of Datix Incidents Logged - Cleaning 96% 94% 92% 90% 88% 86% 84% Cleaning Standards Cleaning Frequency Cleanliness Audit Scores by Risk Category - High Jun-17 Jul-17 Aug-17 Sep-17 Oct-17 Nov-17 Cleanliness Report The above charts show average audit scores for the whole Trust and by hospital site since April Each chart covers specific risk categories:- Very High e.g. Operating Theatres, ITUs, A&E - Target Score 98%High Wards e.g. Sterile supplies, Public Toilets Target Score 95% Significant e.g. Outpatient Departments, Pathology labs Cleanliness audits are undertaken jointly involving both ward staff as well as members of the Facilities Team. This month we have reviewed the risk categories and have raised these in certain areas. This has had a small impact on the overall scores. Very high-risk areas have dropped slightly since October, remaining behind target at all of the 3 sites. We are currently reviewing the audits to identify specific cleaning elements that are failing. Two of the Datix incidents recorded in November applied to the very high risk areas. These issues have been addressed by the Service Manager. More detailed reporting including analysis of clinical equipment cleanliness as well as general environmental cleanliness will feature in the more detailed quarterly report. High-risk audit scores have fallen back slightly this month at the LRI and the LGH and whilst the GGH remains at 94%; all sites continue to fall short of target. Significant risk areas all exceed the 85% target. The triangulation data is collected by the Trust from numerous patient sources including Message to Matron, Friends and Family Test, Complaints, online sources and Message to Volunteer or Carer collated collectively as Suggestions for Improvement. Figures for Q2 are the latest update and continue to demonstrate a reduction in the number of issues identified. The number of datix incidents logged for November has seen an increase compared to last month but remains within the range of recent normally observed variability. Performance scores overall continue to fluctuate just below target levels with month on month small variations. Gaps in rotas continue to present challenges. With a freeze on overtime except for business critical reasons only filling about half of the gap is possible. Whilst this is risk prioritised, it inevitably means that some areas will be below standard. Current levels of winter related outbreaks on a number of wards are also presenting challenges in terms of the spread of resources % 94% 92% 90% 88% 86% 84% Cleaniness Audit Scores by Risk Category - Significant Jun-17 Jul-17 Aug-17 Sep-17 Oct-17 Nov-17 UHL LRI LGH GGH Target
30 Estates and Facilities Patient Catering Patient Catering Survey September 2017 Oct-17 Percentage OK or Good Nov-17 Did you enjoy your food? 93% 100% Did you feel the menu has a good choice of food? 96% 100% Did you get the meal that you ordered? 100% 97% Were you given enough to eat? 99% 100% % 80 90% <80% Triangulation Data - Catering Catering Standards Availability of refreshments Choice of Food Number of Patient Meals Served Month LRI LGH GGH UHL September 67,351 22,722 28, ,658 October 69,459 21,841 29, ,170 October 67,209 22,533 30, ,877 Patient Meals Served On Time (%) Month LRI LGH GGH UHL September 100% 100% 100% 100% October 100% 100% 100% 100% November 100% 100% 100% 100% % 95 97% <95% 0 Q4 Q1 Q2 Q3 Q4 Q1 Q2 Q3 Q4 Q1 Q Patient Catering Report This month we survey numbers were down with the scores being based on 39 returns. Survey scores this month have largely improved and continue to reflect satisfactory performance. Comment data collected continues to show no discernible trends. In terms of ensuring patients are fed on time this continues to perform well. The triangulation data has been updated to include Q2 data and this back up the overall levels of satisfaction considering the number of meals served. Datix incidents reported have seen a spike compared to the normal level of variation seen. However, these still remain at a low level proportionally. The number reported in this chart has been moderated to reflect the fact that there were a number of duplicate items referring to one issue. 20 Number of Datix Incidents Logged -Patient Catering
 September October November Overall 94% 94% 94% Routine 91% 93% 94% Urgent 98% 100% 98% Overall 94% 94% 94% Routine 93% 93% 93% Urgent 98% 98% 99% Overall 92% 90% 91% Routine 91%")

31 Nov-16 Dec-16 Jan-17 Feb-17 Mar-17 Apr-17 May-17 Jun-17 Jul-17 Aug-17 Sep-17 Oct-17 Nov-17 Estates and Facilities - Portering Site GH LGH LRI Reactive Portering Tasks in Target Task Month (Urgent 15min, Routine 30min) September October November Overall 94% 94% 94% Routine 91% 93% 94% Urgent 98% 100% 98% Overall 94% 94% 94% Routine 93% 93% 93% Urgent 98% 98% 99% Overall 92% 90% 91% Routine 91% 89% 89% Urgent 98% 98% 97% % 90 94% <90% Average Portering Task Response Times Category Time No of tasks Urgent 16:07 2,474 Routine 22:34 9,847 Total 12, Number of Datix Incidents Logged - Portering Portering Report November performance timings maintain the consistent picture seen across recent months. Datix incidents have risen sharply and particularly relate to Imaging in ED. Discussions are on-going to resolve operational issues with the Department. The introduction of iporter within ED is now planned to take place in the middle of January This will assist in providing clear data on which appropriate action can be taken. Estates Planned Maintenance Report For November we achieved 88% in the delivery of Statutory Maintenance tasks in the month. This is due to a number of Fire Damper Maintenance tasks that could not be completed due to remedial works impinging on the programme. This will be resolved in the next month. For the Non-Statutory tasks, completion of the monthly schedule is subject to the volume of reactive calls. Drainage issues continue to compete for resources within the Estates front line team. The performance reported this month is affected by the timing of the report. Figures reported are a worst case scenario and actual work completed is likely to be higher. Next month s report will reflect a corrected actual figure for November 28
.")
32 APPENDIX B RTT Performance The combined performance for UHL and the Alliance for RTT in November was 92.1% achieving the National Standard. Overall combined performance saw 4,967 patients in the backlog, a reduction of 12 since the last reporting period (UHL increase of 27, Alliance reduction of 39). The number of patients waiting over 18 weeks for treatment was 49 less than the required amount. Forecast performance for next reporting period: It is forecasted that we will not meet the standard in December due to risks outlined below: Reduction in discretionary effort during Christmas and New Year holiday period Reduction in available capacity due to bank holidays Competing demands with emergency and cancer performance Increase in cancellations due to bed capacity Reduction in capacity due to theatre staffing Reduced in capacity due to loss of theatres at Glenfield 29


33 The combined UHL and Alliance RTT position has been forecasted starting with October 2017 s actual performance through to May The table and graph below details a downside, upside and a seasonal forecast scenario from previous financial years. RTT will likely see a significant drop in performance from December due to winter bed pressures, increased bank holidays and increased annual leave uptake and reduction in discretionary effort during this period. Increased cancellations due to lack of beds has already occurred at the end of November and start of December. In order to continue to deliver the 92% standard for the remainder of the financial year, performance would need to be at 93.0% going into December to cope with the reduced capacity. This would require November predicted end of month backlog to be reduced by an additional circa 650 patients. 30

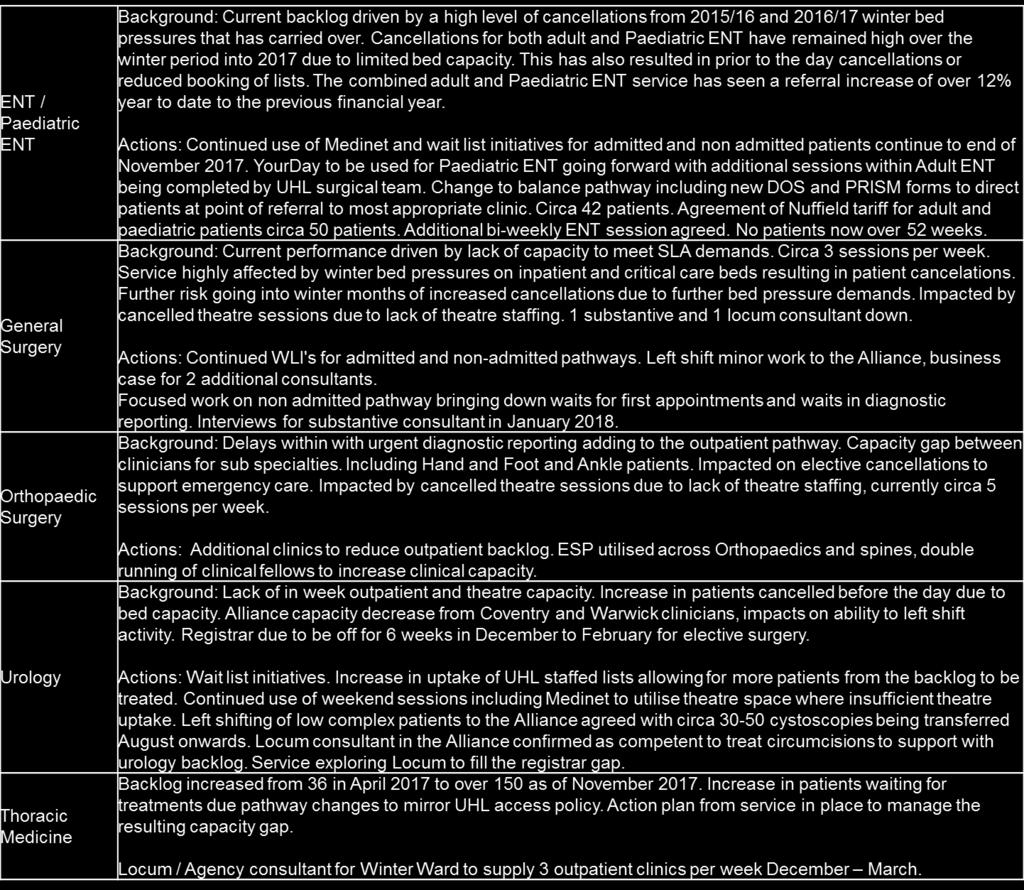
34 There are currently 5 specialties that, due to size of number of patients in their backlog and relative size, have individual action plans. They are Paediatric ENT, ENT, General Surgery, Urology and Orthopaedics. They are monitored monthly. Current plans and performance are highlighted later in the report. The table opposite details the average case per list against speciality targets. At the end November there was zero patients with an incomplete pathway at more than 52 weeks. This is the second consecutive month of UHL having no patients waiting over 52 weeks for treatment. Patients TCI s at 48 weeks and over are escalated operationally to reduce the risk of cancellation as the surgery typically routine and non-urgent in nature and will be cancelled ahead of cancer and urgent patients. Forecasted breaches for the end of December remain zero. Cancellations due to capacity pressures remain a risk to achieving the forecast. This financial we have 100 fewer patients awaiting treatment at over 40weeks compared to November 2016 with 84 this year compared to 184 last year. Although there has been an increase in overall backlog size, there are far fewer patients waiting long waits reducing the overall risk of 52 week breaches coming out of winter. 31


35 The tables opposite outline the overall 10 largest backlog increases, 10 largest backlog reductions and 10 overall largest backlogs by specialty from last month. Significant reductions in Ophthalmology, Urology and Spinal Surgery support the overall position. The largest overall backlog increases were within General Surgery, Gastroenterology and Orthopaedic Surgery. Of the 59 specialties with a backlog, 24 saw their backlog increase, 5 specialties backlog stayed the same and 25 specialties reduced their backlog size. Overall, the UHL admitted and non-admitted backlogs have increased from October by 2.0% and 0.2% respectively. 32

36 The table opposite illustrates that the largest pressure to achieve 18 week RTT performance is for patients waiting for elective surgery. All CMG s and the Alliance are achieving the 92% standard for non-admitted patients and over 95% overall. Only ESM and ITAPS are achieving the standard for admitted patients but neither CMG hold any surgical specialties. The continuing challenge for UHL will be actions that support in reducing the admitted backlog. The non-admitted backlog has remained relatively consistent over the past 18 months. During the same period the admitted backlog has increased by over 300%. Patients on an admitted incomplete pathway make up only 20% of the UHL incomplete waiting list whilst making up 60% of the backlog. Sustaining an overall 92% will only be achievable by improving the admitted performance, with a step change in capacity required through. Key Actions Required: Right sizing bed capacity to increase the number of admitted patients able to received treatment. Improving ACPL through reduction in cancellation and increased theatre throughput. Demand reduction with primary care as a key priority to achieving on-going performance for our patients to receive treatment in a timely manner. 33
37 34

38 APPENDIX C Diagnostic Performance November diagnostic performance for UHL and the Alliance combined is 0.81% achieving the standard by performing below the 1% threshold. UHL alone achieved 0.49% for the month of November with 126 patients out of 15,102 not receiving their diagnostic within 6 weeks. Performance remains ahead of trajectory. Continued strong performances were seen from Computed Tomography 0.4% with 12 breaches from 2,766 patients, Non-Obstetric Ultrasound 0.1% with 7 breaches from 4,883 patients and Audiology 0.0% with 0 breaches out of 557. The 5 modalities with the highest number of breaches are listed below: Of the 15 modalities measured against, 8 achieved the performance standard with 7 areas having waits of 6 weeks or more greater than 1%. Future Months Performance There is significant risk to the Trust achieving the diagnostic standard in December: Outpatient Cystoscopy (72) due to sickness in medical workforce Reduction in available capacity due to bank holidays Reduction in discretionary effort during Christmas and New Year holiday period Radiology competing demands with emergency IP diagnostic requirements Competing demands with cancer to reduce 2WW to 1WW 35
39 1.2% UHL and Alliance Diagnostic Performance Last 12 Months 1.0% 0.8% 0.6% 0.4% 0.2% 0.0% Dec 16 Jan 17 Feb 17 Mar 17 Apr 17 May 17 Jun 17 Jul 17 Aug 17 Sep 17 Oct 17 Nov 17 6 Week Diagnostic Test Waiting Times (UHL+Alliance) Target 36
 of admission. 2.")

40 APPENDIX D November Cancelled Ops: Executive Performance Board INDICATORS: The cancelled operations target comprises of two components; 1. The % of cancelled operations for non-clinical reasons On The Day (OTD) of admission. 2. The number of patients cancelled who are not offered another date within 28 days of the cancellation Indicator Target (monthly) Latest month YTD performance (inc Alliance) Forecast performance for next reporting period 1 0.8% 1.5% 1.1% 1.2% Cancelled Operation Performance Indicator 1 For November there were 174 non clinical hospital cancellations for UHL and Alliance combined. This resulted in a failure of the 0.8% standard as 1.4% of elective FCE s were cancelled on the day for non-clinical reasons (166 UHL 1.5% and 8 Alliance 0.8%). UHL alone saw 166 patients cancelled on the day for an individual performance of 1.5%. 112 patients (69%) were cancelled due to capacity related issues of which 17 were Paediatrics. 51 patients were cancelled for other reasons. The 5 most common reasons for cancellation are listed below. There were 36 more cancellations due to lack of ward bed than in the same month last year. 37
41 28 Day Performance Indicator 2 There were 15 patients who did not receive their operation within 28 days of a non-clinical cancellation. These comprised of CHUGGS 3, ESM 1, MSS 5, RRCV 4 and W&C 2. The 2 theatres currently closed at Glenfield has resulted in increased 28 day breaches as there is no emergency theatre for Vascular patients resulting in elective capacity being prioritised for emergency patients. Risk for next reporting period Achieving the 0.8% standard in December remains a risk due to: Continuing capacity pressures due to emergencies 38


42 APPENDIX E Cancer Waiting Time Performance Out of the 9 standards, UHL achieved 3 in October 2WW, 2WW Breast and 31 Day Drugs 2WW performance continued to deliver in October achieving 93.9%. November is also expected to deliver the standard. 62 day performance failed at 78.8% in October with no adjustment for tertiary activity applicable. New local rules agreed by CCB in November 2017 is expected to result in a positive impact on 62 day performance as adjustments are applied, early forecasting for November suggests an improved position but we still expected to fail the standard. The adjusted backlog, although above trajectory is back in the 50s, the key areas being Urology, Lung and Gynae Systems development work in the Cancer information system (Infoflex) remains delayed due to technical issues. 62 Day Performance 62 Day Adjusted Backlog 39

43 62 Day Adjusted Backlog by Tumour Site The following details the backlog numbers by Tumour Site for week ending 8th December The Trend reflects performance against target on the previous week. The forecast position is the early prediction for week ending 15th December 2017 Note: - these numbers are subject to validation and review throughout the week via the clinical PTL reviews and Cancer Action Board. 40
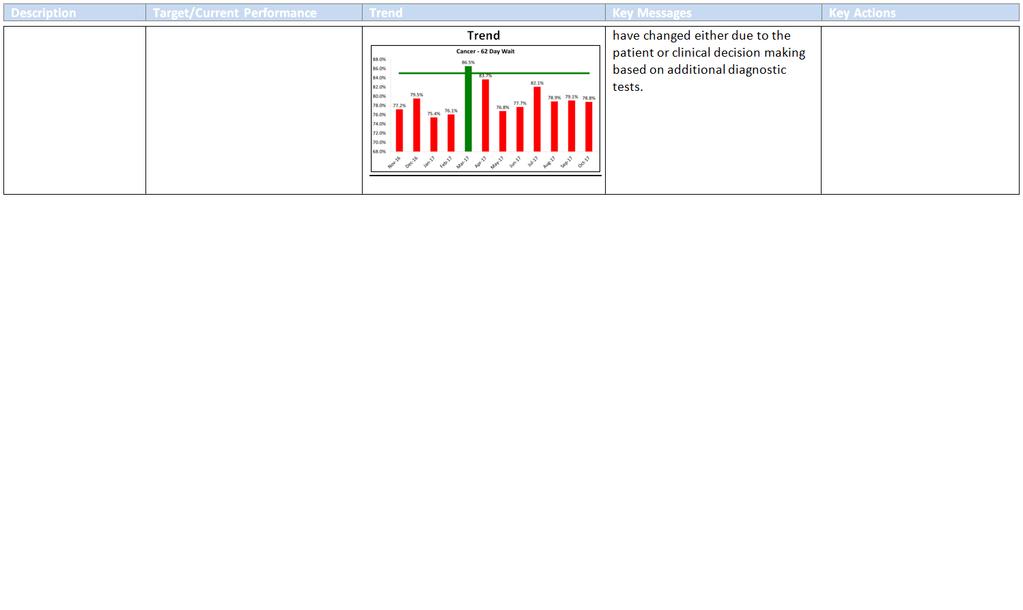
44 Key themes identified in 8 th December Note This report includes all patients (including those waiting 104 days+) Summary of delays Complex Patients/Complex Diagnostic Pathways Capacity Delays OPD & Surgical Numbers Summary of patients 10 7 Across 7 tumour sites, these are patients undergoing multiple tests, MDTs, complex pathology reporting and diagnostics. This includes patients referred between multiple tumour sites with unknown primaries, patients with complex pathology to inform diagnosis requiring additional testing and where treatment plans have changed either due to the patient or clinical decision making based on additional diagnostic tests. In 5 tumour sites, a combination of surgical treatment/diagnostic capacity, Endoscopy and Oncology outpatient capacity affecting the patients pathway UHL Pathway Delays (Next Steps compliance) 6 Across 4 tumour sites where more than 1 delay has occurred within the pathway and lack of compliance with Next Steps is evident. This includes delays in the diagnostic phase in one tumour site prior to referral to another. Patient Delays (Choice, Engagement, Thinking Time) 17 Across all tumour sites, where patients have cancelled or DNA d outpatients, diagnostics or treatment admission on more than one occasion. Where patients aren t decided on their treatment plan and require more thinking time, including 1 patient in HPB 3rd opinions from other Trusts and has now gone abroad for a further opinion.. Patients where they are choosing to delay treatment for a specific reason, e.g. family wedding, cruise holiday for the Winter. The new local rules agreed for management of patients on a 62 day pathway would impact on these patients once treated, i.e. their pathways would be adjusted following treatment which would result in their treatment being captured on a 31 day pathway and therefore would not impact on 62 day performance. 41
45 Summary of delays Clinically Appropriate Pathway Delays Numbers of patients 8 Summary In Urology (x6) patients where the initial TRUS biopsy is reported as either benign/nondiagnostic but in correlation with clinical review, an MRI is required for further investigation a clinically appropriate 6 week delay is required between biopsy and MRI to allow for healing and to avoid a haematoma on MRI. This also includes x1 patient who is All Options for review and decision with both Oncology and Urology. A patient awaiting PACE trial consent, randomisation and thinking time is also included. Late Tertiary Referrals 7 Patients Unfit 6 In Lung (x3) where patients require a delayed repeat CT scan post antibiotic treatment at 2 months that don t fall into the new LTFU policy so therefore remain on an active pathway until next reviewed often benign and then discharged. Across 4 tumour sites, where tertiaries are received after Day 38. From NGH, KGH and ULH. This includes x1 patient from NGH that was referred over prior to completion of the correct presurgical tests which further delayed the pathway at UHL. Across 3 tumour sites, patients who are unavailable for treatment due to other on-going health issues of a higher clinical priority, where high blood pressure and uncontrolled diabetes result in a delay to the patient be anaesthetically fit for treatment. This includes x3 patients whose initial diagnostic admission was cancelled as required a bridging plan which further delayed the new admission in the diagnostic phase of the pathway. This also includes x1 patient with dementia where consent has been difficult to confirm due to the patient being in a care home with limited family support. 42
46 Backlog Review for patients waiting >104 08/12/2017 The following details all patients declared in the 104 Day Backlog for week ending 8/12/17. Last month s report showed 16 patients in the 104 Day backlog, 14 of which are now treated. This month s report details 11 patients in the backlog across 6 specialties. NOTE: where patients who have a treatment date confirmed but with no diagnosis of Cancer confirmed, on review of histology, should that confirm a cancer diagnosis then this would class as treatment in those cases. Tumour Site Total Number of patients GYNAE 1 Pt No Current Wait (Days) Confirmed Cancer Y/N Treatment Date Y/N Y N Summary Delay Reasons Patient referred , seen Day 13 and pipelle taken. Results reviewed patient TCI for Myosure cancelled as patient required ECHO and bridging plan following pre-assessment. Surgeon review, patient referred for cardiology review as per Anaesthetist. Capacity delay in Cardiology - OPD Specific surgeon only to do case combined with complexity of patient delaying TCI date? awaiting update from service Y Y Patient referred to ENT and underwent USFNA by Day 8, results reviewed suggestive of lymphoma. MDT Lymphoma await patient informed at OPD delay to OPD due to patient holiday. Transferred to Haem Day 48 and underwent CT and PET. MDT review of results recommended for surgical biopsy to determine diagnosis of lymphoma sub type. Delay to biopsy due to process issues within ENT and subsequent patient admission due to hip problems. HAEM Y N Patient referred to ENT and had US FNA , results suggested lymphoma, patient for core biopsy and CT. US Core Bx , CT suggested lymph node bx. Biopsy results reported Pathology for further molecular testing at NUH - reported OPD for neck lump biopsy to diagnosis. Results reviewed OPD patient referred to Haem - required PET for staging to confirm localised disease. For OPD Haem - delay to OPD to await outcome? Radiotherapy treatment. 43
47 Tumour Site Total Number of patients Pt No 69 Current Wait (Days) 117 Confirmed Cancer Y/N Y Treatment Date Y/N Y Tumour Site Complex diagnostic pathway initially due to previous Breast and pancreatic cancer requiring multiple MDT discussions and diagnostic tests. Patient initially referred on HPB pathway, transferred to Lower GI following pathology from liver biopsy suggesting metastatic adenocarcinoma from colorectal origin. MDT for MRI, sigmoidoscopy and outpatient review. MDT and OPD review patient for chemotherapy. Oncology OPD patient delay to treatment start date due to holiday until LOGI Y Y Patient referred on a LOGI straight to test pathway, OGD and CT stated no colonic malignancy but? Carcinoid tumour. Patient sent for flexi which was cancelled by the clinician as an inappropriate test, rebooked for a colonoscopy for the Report stated NAD and this patient was removed from the pathway Pathology from the polyp flagged for MDT recommended neuroendocrine review. Complex diagnosis, unknown primary and multiple MDTs resulting in a delayed pathway. Neuroendocrine primary diagnosed at MDT and for resection. Decision to treat made and patient listed for surgery. HPB Y N Patient referred from NGH on Day 58, MDT 16/10/17 for Liver biopsy. Plan for patient to have biopsy at NGH, delay to biopsy awaiting update from NGH that biopsy couldn't be performed at NGH, required at UHL. Biopsy 13/11/17 - no capacity to bring forward. Unable to perform biopsy on the day, reviewed by MDT requires CT Guided Biopsy. CTGBX specific USS machine required with specific radiologists in addition to a daycase bed resulting in delay to biopsy. Await MDT for review of results N N Referred from KGH at Day 33 for MDT discussion only Taken off tracking post MDT as patient having MR in KGH KGH request for EUS and TURBT at UHL.TURBT , EUS patient requested delay to biopsy and further review until after Christmas. Awaiting update on new date. 44
48 Tumour Site Lung 2 Total Number of patients Pt No 74 Current Wait (Days) 126 Confirmed Cancer Y/N Y Treatment Date Y/N N Summary Delay Reasons Patient referred to ENT OPD and CT with follow up by Day Flagged consolidation in lung requiring respiratory review and Vascular review due to AAA. Transferred to Lung Delay between ENT and Lung clinicians re GP contact over antibiotics required. Patient in Lung OPD required CT and follow up at 6 weeks due to antibiotics. Clinical diagnosis of lung cancer made at MDT referred to oncology for consideration of SABR treatment. Oncology capacity delays review to CNS team in Lung already discussed SABR with patient to avoid delay. Await Oncology OPD outcome Y N Patient referred to LOGI , following CT Colon flagged for Lung MDT. Lead clinician decision for OPD review Lung first with a CTT prior. CT , RAL For PET and CT Guided Bx unable to biopsy due to location being too close to the liver. PET scan doesn't show SUV uptake in lesion therefore for repeat CT at 2 months. CT , OPD capacity delay to outpatients in Lung Y N Patient referred from ULH on Day 53 15/9/17. Outpatients Urology 28/9/17 - referred for high risk anaesthetic assessment. Patient wants to wait for surgery until the New Year as going on a cruise 29/10/17-16/12/17. HRA 13/10/17 - pt requires ECHO and further anaesthetic review due to newly diagnosed AFR. For outpatient review 21/12/17 for decision on fitness for surgery and patient decision. Urology Y N Clinical delay in diagnostic phase initially due to post TRUS biopsy the patient required an MRI. MRI identified bone scan required. Patient declined bone scan until OPD patient for all options - referred to Oncology for review. Oncology discussed PACE trial options - patient for thinking time to consider options of PACE vs standard radiotherapy with hormones. Await OPD for patient decision and consent. 45

49 31 Day First Treatment Backlog & Performance 31 day 1st treatment performance was below the national target at 93% for October. This was as a result of non-compliance in Lower GI, Skin and Urology primarily however, a significant drop in performance from Skin by 7.2% compared to September having a direct impact on the bottom line result with the theme being around patient choice delays to TCI dates. At the time of reporting, the backlog is lower than last month s report (previously 18) with 11 patients in the backlog (across 4 tumour sites): access to beds and theatre capacity particularly around joint surgical cases, patient engagement issues (Skin), robotic procedures (Urology) and unfit patients (Gynae) has seen an increase in the backlog this month. 46
 with an average performance of 84.9% since. The backlog at the time of reporting sits at 3, spread across 2 tumour sites.")
50 31 Day Subsequent Performance Surgery 31 day Subsequent performance for Surgery in October under performed at 80.2%. The last time this standard was achieved was in March 2017 (95.4%) with an average performance of 84.9% since. The backlog at the time of reporting sits at 3, spread across 2 tumour sites. Pressure in Oncology and Radiotherapy delaying a Breast patient and Urology due to x1 Tertiary from Lincoln and the other due to ITU bed capacity issues. 47
51 Summary of the plan The recovery action plan (RAP) is the central repository detailing measureable actions agreed between the Cancer Centre, Tumour Sites and CCGs aimed to address recovery in performance delivery and quality of patient care. Following recent feedback from NHSI, the RAP is undergoing a further review to ensure it provides clarity on the key interventions to support an improvement in 62 day performance. Each tumour site continues to be challenged to ensure the RAP evidences operational control and knowledge over the key issues within the services preventing achievement of the performance standard with new actions added throughout the month. Daily resource has been assigned to the management of the RAP for a 12 week initial period to support the drive towards performance improvement. A new action for each tumour site (excluding Breast, MaxFax and Skin) to move to 7 day first appointment based on feedback from other successful Trusts. 48
52 Summary of high risks The following remain the high risk issues affecting the delivery of the cancer standards and have been categorised as agreed by the joint working group Issue Action being taken Category 1 Next steps not consistently implemented in all areas. Resulting in unnecessary delay for patients. 2 Continued increase in demand for screening and urgent cancer services. Additional 31 day and 62 day treatments compared to prior years. 3 Access to constrained resources within UHL Next steps programme board established. Additional central funding for next steps programme secured. Recruitment for additional staff for next steps in progress. Cancer 2020 group delivering alternative pathways (e.g. FIT testing). Annual planning cycle to review all elements of cancer pathway. Further central funding requested for increased BI support. Resources continued to be prioritised for Cancer but this involves significant re-work to cancel routine patients. Capital for equipment is severely limited so is currently directed to safety concerns. Further central support has been requested. Staffing plans for theatres are requested on the RAP. Organisations of care programmes focused on Theatres and Beds. Plans and capital agreed for LRI and GH ITU expansion. Internal factors impacting on delivery Internal and External factors impacting on delivery External factors impacting on delivery 4 Access to Oncology and Specialist workforce. 7 Patients arriving after day 40 on complex pathways from other providers Oncology recruitment in line with business case. Oncology WLI being sought. H&N staff being identified prior to qualifying. Theatre staffs continue to be insufficient to meet the need. Weekly feedback to tertiary providers. Specialty level feedback. New process to be introduced to include writing to the COO for each late tertiary. Internal factors impacting on delivery External factors impacting on delivery 49

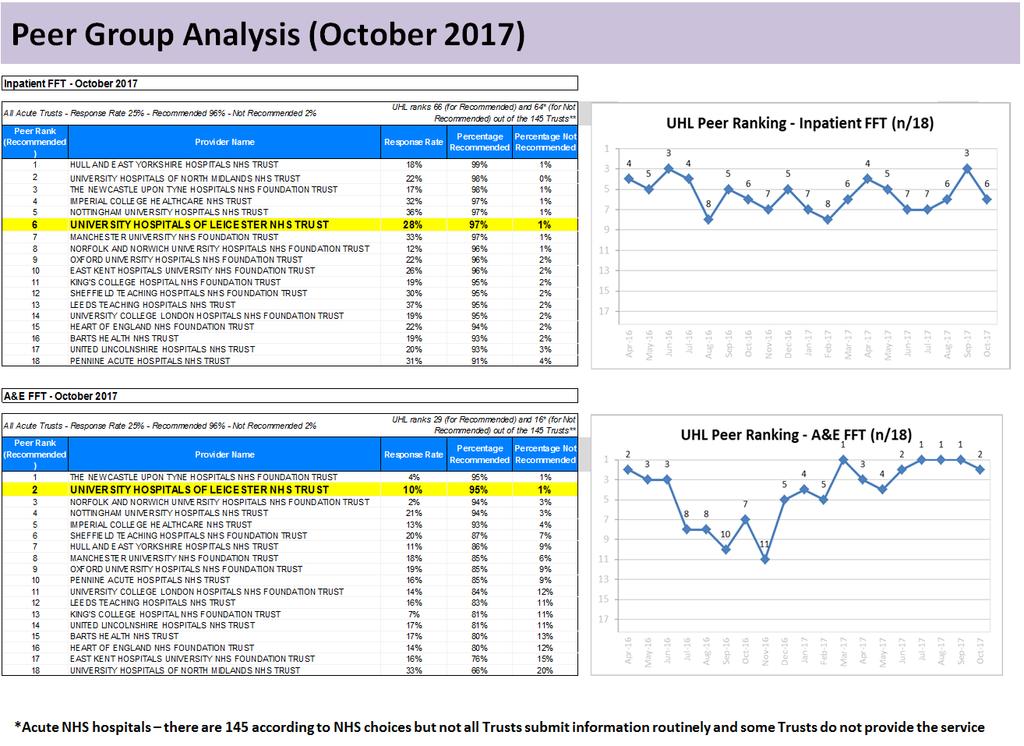
53 APPENDIX F 50
54 51
55 52
56 53

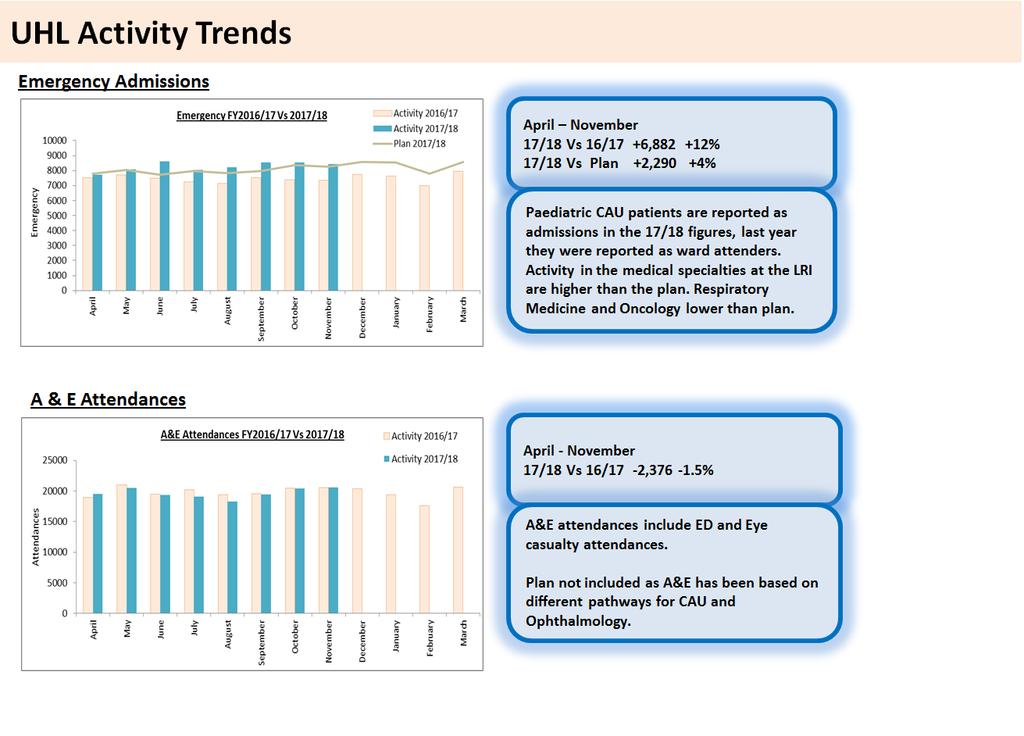
57 APPENDIX G 54
58 55

59 APPENDIX H 56
Quality & Performance Report Author: John Adler Sponsor: Chief Executive Date: FIC, PPP + QAC 28 th September Executive Summary from CEO
 UNIVERSITY HOSPITALS OF LEICESTER NHS TRUST PAGE 1 OF 2 Quality & Performance Report Author: John Adler Sponsor: Chief Executive Date: FIC, PPP + QAC 28 th September 2017 Executive Summary from CEO Paper
Quality & Performance Report Author: John Adler Sponsor: Chief Executive Date: IFPIC + QAC 25 June Executive Summary from CEO
 U N I V E R S I T Y H O S P I T A L S O F L E I C E S T E R N H S T R U S T P A G E 1 O F 2 Quality & Performance Report Author: John Adler Sponsor: Chief Executive Date: IFPIC + QAC 25 June 20 Executive
Quality & Performance Report. Public Board
 Agenda Item 12.1 Quality & Performance Report Public Board 27 th November 2014 Presented for: Presented by: Author: Previous Committees: Governance Professor Suzanne Hinchliffe CBE Chief Nurse / Interim
Integrated Performance Report
 Integrated Performance Report M06 September 2014 Presented by: Paul Bostock (Chief Operating Officer) Des Holden (Medical Director) Fiona Allsop (Chief Nurse) Paul Simpson (Chief Financial Officer) An
The Royal Wolverhampton NHS Trust
 The Royal Wolverhampton NHS Trust Meeting Date: 3 th June 214 Trust Board Report Title: Executive Summary: Action Requested: Report of: Author: Contact Details: Resource Implications: Public or Private:
BSUH INTEGRATED PERFORMANCE REPORT. 1) Responsive Domain 2) Safe Domain 3) Effective Domain 4) Caring Domain 5) Well Led Domain
 Responsive Domain 2) Safe Domain 3) Effective Domain 4) Caring Domain 5) Well Led Domain") BSUH INTEGRATED PERFORMANCE REPORT 1) Responsive Domain 2) Safe Domain 3) Effective Domain 4) Caring Domain 5) Well ed Domain RESPONSIVE DOMAIN RESPONSIVE DOMAIN Metric Defined by Standard Apr-16 May-16
BSUH INTEGRATED PERFORMANCE REPORT 1) Responsive Domain 2) Safe Domain 3) Effective Domain 4) Caring Domain 5) Well ed Domain RESPONSIVE DOMAIN RESPONSIVE DOMAIN Metric Defined by Standard Apr-16 May-16
Integrated Performance Report
 Integrated Performance Report M12 March 2015 Presented by: Paul Bostock (Chief Operating Officer) Des Holden (Medical Director) Fiona Alsop (Chief Nurse) Paul Simpson (Chief Financial Officer) An Associated
Governing Body. TITLE OF REPORT: Performance Report for period ending 31st December 2012
 - Governing Body DATE OF MEETING: TITLE OF REPORT: Performance Report for period ending 31st December 2012 KEY MESSAGES: We are responsible for securing improvements in the quality of care and health outcomes.
WEST HAMPSHIRE PERFORMANCE REPORT. Based on performance data available as at 11 th January 2018
 WEST HAMPSHIRE PERFORMANCE REPORT Based on performance data available as at 11 th January 2018 1 CCG Quality and Performance Executive Summary Introduction: The purpose of this report is to provide an
SHEFFIELD TEACHING HOSPITALS NHS FOUNDATION TRUST EXECUTIVE SUMMARY REPORT TO THE TRUST BOARD HELD ON 18 NOVEMBER 2015
 SHEFFIELD TEACHING HOSPITALS NHS FOUNDATION TRUST EXECUTIVE SUMMARY REPORT TO THE TRUST BOARD HELD ON 18 NOVEMBER 2015 Subject: Supporting TEG Member: Authors: Status 1 Data Quality Baseline Assessment
SOUTHAMPTON UNIVERSITY HOSPITALS NHS TRUST Trust Key Performance Indicators May Regular report to Trust Board
 SOUTHAMPTON UNIVERSITY HOSPITALS NHS TRUST Trust Key Performance Indicators May 20 Report to: Trust Board July 20 Report from: Sponsoring Executive: Aim of Report/Principle Topic: Review History to date:
Integrated Performance Report
 Integrated Performance Report M04 July 2016 Presented by: Angela Stevenson (Chief Operating Officer) Des Holden (Medical Director) Fiona Allsop (Chief Nurse) Paul Simpson (Chief Financial Officer) An Associated
Integrated Performance Report August 2017
 Integrated Performance Report Contents Section Page High Level Dashboard Balanced scorecard 3 Domain Scorecards and Director Commentaries Operational Performance 4 Quality and Patient Safety 9 Workforce
2017/18 Trust Balanced Scorecard
 ITEM 8b ENC 9 2017/18 Trust Balanced Scorecard Author: Performance Management Team March 2017 The purpose of this paper is to provide an update on the development of the 2017/18 Balanced Scorecard for
Operational Focus: Performance
 Operational Focus: Performance Sandra Iskander Changes for 2015/16 Change of focus of 18-weeks and A&E 4-hour wait targets as recommended by Sir Bruce Keogh, Medical Director, NHS England. 18-weeks to
Section 1 - Key Performance Indicators
 Clinical Quality Report Month 6 2016/17 period ending 30th September 2016 Section 1 - Key Performance Indicators 1.1 NHS Improvement; Risk Assessment Framework Clostridium difficile Indicator M6 2 YTD
NHS performance statistics
 NHS performance statistics Published: 8 th February 218 Geography: England Official Statistics This monthly release aims to provide users with an overview of NHS performance statistics in key areas. Official
Summarise the Impact of the Health Board Report Equality and diversity
 AGENDA ITEM 4.1 Health Board Report INTEGRATED PERFORMANCE DASHBOARD Executive Lead: Director of Planning and Performance Author: Assistant Director of Performance and Information Contact Details for further
Newham Borough Summary report
 Newham Borough Summary report April 2013 Prepared on 17/04/13 by Commissioning Support team Apr-11 Jun-11 Aug-11 Oct-11 Dec-11 Feb-12 Apr-12 Jun-12 Aug-12 Oct-12 Dec-12 Feb-13 GREE N Finance and Activity
Ayrshire and Arran NHS Board
 Paper 12 Ayrshire and Arran NHS Board Monday 9 October 2017 Planned Care Performance Report Author: Fraser Doris, Performance Information Analyst Sponsoring Director: Liz Moore, Director for Acute Services
INTEGRATED PERFORMANCE REPORT. BOARD OF DIRECTORS 20 September 2017
 INTEGRATED PERFORMANCE REPORT BOARD OF DIRECTORS 20 September 2017 1 S Section Page Executive Summary 4 Trust Performance Overview 7 Trust Performance Report by Exception 9 MSSA Bacteraemia - Actual numbers
Integrated Quality and Performance Report (IQPR)
") Management Board 28 th November 2012 Trust Public Board 29 th November 2012 Integrated Quality and Performance Report (IQPR) M07 October 2012 Presented by: Bernie Bluhm (Chief Operating Officer) Author:
Management Board 28 th November 2012 Trust Public Board 29 th November 2012 Integrated Quality and Performance Report (IQPR) M07 October 2012 Presented by: Bernie Bluhm (Chief Operating Officer) Author:
WAITING TIMES AND ACCESS TARGETS
 NHS Board Meeting Tuesday 17 December 2013 Lead Director (Acute Services Division) Board Paper No 13/60 Recommendation: WAITING TIMES AND ACCESS TARGETS The NHS Board is asked to note progress against
RTT Recovery Planning and Trajectory Development: A Cambridge Tale
 RTT Recovery Planning and Trajectory Development: A Cambridge Tale Linda Clarke Head of Operational Performance Addenbrooke s Hospital I Rosie Hospital Apr 2014 May 2014 Jun 2014 Jul 2014 Aug 2014 Sep
NHS Performance Statistics
 NHS Performance Statistics Published: 8 th March 218 Geography: England Official Statistics This monthly release aims to provide users with an overview of NHS performance statistics in key areas. Official
Integrated Performance Report Executive Summary (for NHS Fife Board Meeting) Produced in February 2018
 Produced in February 2018") 6b Integrated Performance Report Executive Summary (for NHS Fife Board Meeting) Produced in February 2018 2 Contents Integrated Performance Report: Executive Summary 5 Clinical Governance: Chair and Committee
6b Integrated Performance Report Executive Summary (for NHS Fife Board Meeting) Produced in February 2018 2 Contents Integrated Performance Report: Executive Summary 5 Clinical Governance: Chair and Committee
NHS performance statistics
 NHS performance statistics Published: 14 th December 217 Geography: England Official Statistics This monthly release aims to provide users with an overview of NHS performance statistics in key areas. Official
Report to: Trust Board 25 th April Enclosure 4. Title Integrated Performance Report March Sponsoring Executive Director
 Report to: Trust Board 25 th April 2013 Title Integrated Performance Report March 2013 Enclosure 4 Sponsoring Executive Director Author(s) Purpose Previously considered by Peter Herring Chief Executive
Quality Improvement Scorecard November 2017
 Mortality: HSMR Performance remained below target in July Nat NB: Each month is a 12 month rolling value. I.e. Mar-16 reports the monthly average of Apr-15 to Mar-16. Mortality: HSMR (weekday) vs. HSMR
Quality Improvement Scorecard June 2017
 Mortality: HSMR Nat NB: Each month is a 12 month rolling value. I.e. Mar-16 reports the monthly average of Apr-15 to Mar-16. Performance remained below target in February. Mortality: HSMR (weekday) vs.
COVENTRY AND RUGBY CLINICAL COMMISSIONING GROUP
 COVENTRY AND RUGBY CLINICAL COMMISSIONING GROUP Report To: Governing Body 11 September 2013 Report From: Title of Report: Purpose of the Report: Jacqueline Barnes, Executive Nurse The Nursing and Quality
SUMMARY OF INDICATOR CHANGES FOR VERSION 3 INTELLIGENT MONITORING REPORTS Acute and Specialist NHS Trusts 23 June Final Draft, Subject to Change
 Never Event incidence Yes: 01 May 2013-30 Apr 2014 Incidence of Clostridium difficile (C.difficile) Incidence of Meticillin-resistant Staphylococcus aureus (MRSA) Dr Foster Intelligence: Mortality rates
Health Board Report INTEGRATED PERFORMANCE DASHBOARD
 AGENDA ITEM 4.2 27 th January 2016 Health Board Report INTEGRATED PERFORMANCE DASHBOARD Executive Lead: Director of Planning and Performance Author: Assistant Director of Performance and Information Contact
Quality Improvement Scorecard December 2016
 Mortality: HSMR Nat The improvement in performance has been maintained in year. NB: Each month is a 12 month rolling value. I.e. Mar-16 reports the average of Apr-15 to Mar-16. Mortality: HSMR (weekday)
Quality Improvement Scorecard December 2017
 Mortality: HSMR Performance improved in August Nat NB: Each month is a 12 month rolling value. I.e. Mar-16 reports the monthly average of Apr-15 to Mar-16. Mortality: HSMR (weekday) vs. HSMR (weekend)
July (Month 4) Integrated Performance Report. John Grinnell, Director of Finance. Executive Directors. For Information For Discussion For Approval
 Integrated Performance Report. John Grinnell, Director of Finance. Executive Directors. For Information For Discussion For Approval") BOARD OF DIRECTORS Subject/Title July (Month 4) Integrated Performance Report Executive Responsible Paper prepared by (if different from above) John Grinnell, Director of Finance Executive Directors Nature
BOARD OF DIRECTORS Subject/Title July (Month 4) Integrated Performance Report Executive Responsible Paper prepared by (if different from above) John Grinnell, Director of Finance Executive Directors Nature
Balanced Scorecard. Paper 5.2. TRUST BOARD 24 th September 2015 TITLE EXECUTIVE SUMMARY
 TRUST BOARD 24 th September 2015 TITLE EXECUTIVE SUMMARY Balanced Scorecard The Trust reported an in-month deficit of 0.7m against a deficit budget of 0.6m, resulting in a year to date surplus to 0.2m
Quality Improvement Scorecard March 2018
 Mortality: HSMR Nat NB: Each month is a 12 month rolling value. I.e. Mar-16 reports the monthly average of Apr-15 to Mar-16. Performance further improved in October. November data not yet available. Mortality:
Board of Director s Meeting
 Board of Director s Meeting Meeting Date: 15 November 212 Agenda item: 6.1 Title: Purpose: Summary: Recommendation: Author: Presented by: QUALITY AND PATIENT SAFETY ASSURANCE COMMITTEE To provide an exception
NHS BOLTON CLINICAL COMMISSIONING GROUP Public Board Meeting AGENDA ITEM NO: 10. Date of Meeting:.24 th March 2017.
 NHS BOLTON CLINICAL COMMISSIONING GROUP Public Board Meeting AGENDA ITEM NO: 10 Date of Meeting:.24 th March 2017. TITLE OF REPORT: CCG Corporate Performance Report AUTHOR: Melissa Laskey Director of Service
Quality Improvement Scorecard February 2017
 Mortality: HSMR Nat Performance continued to improve into Q3 2016/17. NB: Each month is a 12 month rolling value. I.e. Mar-16 reports the monthly average of Apr-15 to Mar-16. Mortality: HSMR (weekday)
EAST KENT HOSPITALS UNIVERSITY NHS FOUNDATION TRUST
 EAST KENT HOSPITALS UNIVERSITY NHS FOUNDATION TRUST REPORT TO: BOARD OF DIRECTORS DATE: 28 NOVEMBER 2014 SUBJECT: REPORT FROM: PURPOSE: KEY NATIONAL PERFORMANCE TARGETS INTERIM DIRECTOR OF OPERATIONS Discussion
April Clinical Governance Corporate Report Narrative
 April 14 - Clinical Governance Corporate Report Narrative ITEM 7B Narrative has been provided where there is something of note in relation to a specific metric; this could be positive improvement, decline
Performance and Delivery/ Chief Nurse
 Governing Body 26th May 2017 Quality and Performance Report 22nd May 2017 Author: Other contributors: Executive Lead Audience Eileen Clark - Acting Director of Clinical Performance and Delivery/ Chief
NHS Milton Keynes CCG Board Meeting
 Subject: Meeting: Quality & Performance Report NHS Milton Keynes CCG Board Meeting Date of Meeting: Tuesday 28 th November 2017 Report of: Neve Patel Head of Performance Is this document: Commercially
NHS Wales Delivery Framework 2011/12 1
 1. Introduction NHS Wales Delivery Framework for 2011/12 NHS Wales has made significant improvements in targeted performance areas over recent years. This must continue and be associated with a greater
SUMMARY REPORT TRUST BOARD 1 March 2018 Agenda Number: 07
 SUMMARY REPORT TRUST BOARD 1 March 218 Agenda Number: 7 Title of Report Accountable Officer Author(s) Purpose of Report Recommendation Consultation Undertaken to Date Signed off by Executive Owner Integrated
TRUST BOARD/DIRECTORS GROUP 2016 Key Performance Indicators
 TRUST BOARD/DIRECTORS GROUP 2016 Key Performance Indicators Introduction This paper provides an update on our progress towards our vision to be England s best acute teaching trust in 2016 and beyond. The
Newham Borough Summary report
 Newham Borough Summary report Item K1 September 2013 Prepared on 30/09/2013 by Support team GREEN Finance and Activity Millions AMBER RED Headlines M5 Financial position M4 activity data The QIPP net savings
Strategic KPI Report Performance to December 2017
 Strategic KPI Report Performance to December 2017 Trust Board 25 th January 2018 Strategic KPI summary SROs: All Directors Objective KPI SRO Target Apr May Jun Jul Aug Sep Oct Nov Success Is Deliver A
Bristol, North Somerset and South Gloucestershire Clinical Commissioning Group Governing Body Meeting In-Common
 Bristol, North Somerset and South Gloucestershire Clinical Commissioning Group Governing Body Meeting In-Common Date: Tuesday 7 th November Time: 13.30 Location: Cleve Rugby Club, The Hayfields, Mangotsfield,
WAITING TIMES AND ACCESS TARGETS
 NHS Board Meeting Tuesday 17 February 2015 Chief Officer (Acute Services) Board Paper No.15/08 WAITING TIMES AND ACCESS TARGETS Recommendation: The NHS Board is asked to note progress against the national
Standardising Acute and Specialised Care Theme 3 Governance and Approach to Hospital Based Services Strategy Overview 28 th July 2017
 Standardising Acute and Specialised Care Theme 3 Governance and Approach to Hospital Based Services Strategy Overview 28 th July 2017 Background Theme 3 builds upon previous key strategic commissioning
Reducing Elective Waits: Delivering 18 week pathways for patients. Programme Director NHS Elect Caroline Dove.
 Reducing Elective Waits: Delivering 18 week pathways for patients Programme Director NHS Elect Caroline Dove What I will cover 1. Why 18 Weeks is different 2. Where are we now 3. New models of delivery
Executive Summary: This report focuses on month 10 data of the 2017/18 financial year, January 2018, unless otherwise indicated.
 Agenda item: 3.1 Paper No: 8 Committee: Venue: Governing Body The Boardroom, Dominion House : 27/03/2018 Status: FOR REVIEW AND DISCUSSION Title of Report Performance Report: Month 10, January 2018 Presented
Paper 8 DECISION NOTE. Recommendation
 Paper 8 Recommendation DECISION NOTE Reporting to: The Trust Board is asked to: Discuss the current performance in relation to key quality indicators as at the end of August 20 Consider the actions being
Richard Wilson, Quality Insight and Intelligence Director
 To: Board For meeting: 24 May 2018 Agenda item: 8 Report by: Richard Wilson, Quality Insight and Intelligence Director Report on: Quality Dashboard Purpose 1. This paper highlights the key observations
Quality Framework Healthier, Happier, Longer
 Quality Framework 2015-2016 Healthier, Happier, Longer Telford & Wrekin Clinical Commissioning Group (CCG) makes quality everyone s business. Our working processes are designed to ensure we all have the
NHS Fylde and Wyre CCG Performance Dashboard
 Governing Body January 2016 NHS Fylde and Wyre CCG Performance Dashboard October 2015 (Month 7) Governing Body This report provides a high level summary of performance and activity and across Fylde and
Appendix 1. Quality Update Report for Salford CCG Open Board. Salford Royal, Oaklands and other providers of clinical services November 2013
 Appendix 1 Quality Update Report for Salford CCG Open Board. Salford Royal, Oaklands and other providers of clinical services November 201 Contents Purpose of Paper... Ошибка! Закладка не определена. Greater
Nottingham University Hospitals Emergency Department Quality Issues Related to Performance
 RCCG/GB/14/123 Nottingham University Hospitals Emergency Department Quality Issues Related to Performance Introduction NUH have failed to meet the 95% 4 hour wait standard for a number of consecutive months.
Board Briefing. Board Briefing of Nursing and Midwifery Staffing Levels. Date of Briefing January 2018 (December 2017 data)
") Board Briefing Board Briefing of Nursing and Midwifery Staffing Levels Date of Briefing January 2018 (December 2017 data) This paper is for: Sponsor: Chief Nurse- Dame Eileen Sills (DBE) Decision Author:
Board Briefing Board Briefing of Nursing and Midwifery Staffing Levels Date of Briefing January 2018 (December 2017 data) This paper is for: Sponsor: Chief Nurse- Dame Eileen Sills (DBE) Decision Author:
Urgent Care Short Term Actions to Improve Performance
 To: Trust Board From: Chief Operating Officer Date: March 2017 Healthcare standard Title: Urgent Care Short Term Actions to Improve Performance Author/Responsible Director: Michael Woods / Andrew Prydderch
MERTON CLINICAL COMMISSIONING GROUP GOVERNING BODY
 MERTON CLINICAL COMMISSIONING GROUP GOVERNING BODY Date of Meeting: 23 rd March 2017 Agenda No: 9.3 Attachment: 15 Title of Document: CCG Governing Body Assurance Report & Scorecards: Month 9 Quality &
ESHT Our ambition to be outstanding by 2020
 ESHT 2020 Our ambition to be outstanding by 2020 June 2018 1 Contents Page 3 Page 4 Page 6 Page 8 Background 2017/18 progress Vision, values and objectives CQC ratings Page 10 What we will have achieved
Health Board Report INTEGRATED PERFORMANCE DASHBOARD
 AGENDA ITEM 4.4 2 nd March 2016 Health Board Report INTEGRATED PERFORMANCE DASHBOARD Executive Lead: Director of Planning and Performance Author: Assistant Director of Performance and Information Contact
RTT Assurance Paper. 1. Introduction. 2. Background. 3. Waiting List Management for Elective Care. a. Planning
 RTT Assurance Paper 1. Introduction The purpose of this paper is to provide assurance to Trust Board in relation to the robust management of waiting lists and timely delivery of elective patient care within
November NHS Rushcliffe CCG Assurance Framework
 November 2015 NHS Rushcliffe CCG Assurance Framework ASSURANCE FRAMEWORK SUMMARY No. Lead & Sub Committee Date placed on Assurance Framework narrative Residual rating score L I rating in 19 March 2015
Integrated Quality and Performance Report
 Integrated Quality and Performance Report Agenda Item No: 12.1 The Royal Wolverhampton NHS Trust Meeting Date: 28 th April 214 Trust Board Report Title: Executive Summary: Action Requested: Report of:
DELIVERING THE LONDON QUALITY STANDARDS AND 7 DAY SERVICES
 Enclosure I DELIVERING THE LONDON QUALITY STANDARDS AND 7 DAY SERVICES Trust Board Meeting Item: 13 Date: 25 th May 2016 Purpose of the Report: Enclosure: I To update the Board on the Trust s current performance
SUPPORTING PLANNING 2013/14 FOR CLINICAL COMMISSIONING GROUPs
 SUPPORTING PLANNING 2013/14 FOR CLINICAL COMMISSIONING GROUPs December 2012 SUPPORTING PLANNING 2013/14 FOR CLINICAL COMMISSIONING GROUPS First published: 21 December 2012 2 Contents 1. INTRODUCTION...
Reporting to: Trust Board Meeting - 26 th June Title Integrated Performance Report - May 2014/15. Previously considered by Not Applicable
 Reporting to: Trust Board Meeting - 26 th June 2014 Paper 6 Title Integrated Performance Report - May 2014/15 Sponsoring Director Author(s) Peter Herring - Chief Executive Directors Previously considered
Safe Nurse Staffing Levels. June 2017
 Safe Nurse Staffing Levels Executive Summary June 2017 The purpose of this report is: 1. To provide an assurance with regard to the management of safe nursing and midwifery staffing for the month of June
WAITING TIMES AND ACCESS TARGETS
 NHS Board Meeting Tuesday 21 April 2015 Chief Officer (Acute Services) Board Paper No.15/17 WAITING TIMES AND ACCESS TARGETS Recommendation: The NHS Board is asked to note progress against the national
Annual Complaints Report 2014/15
 Annual Complaints Report 2014/15 1.0 Introduction This report provides information in regard to complaints and concerns received by The Rotherham NHS Foundation Trust between 01/04/2014 and 31/03/2015.
Integrated Quality and Operational Compliance Report. 01/03/18 10:30 Final Report v1.4. February 2018
 Integrated Quality and Oational Compliance Report //8 : Final Report v. February 8 Contents Domain Pages Safe to Effective to 8 Caring to Responsive to Well-led - Workforce to Domain Scorecard Summary
Trust Key Performance Indicators
 Monthly - February 2007 Patient Experience Length of Stay - Overall A Mortality Rate G Cancelled Operations R Elective A Peri-operative Mortality Rate Cancelled Operations (28 day reschedule) A Non-elective
Newham Borough Summary report
 Newham Borough Summary report March 2013 Prepared on 18/03/13 by Commissioning Support team Finance and Activity Millions Apr-11 Jun-11 Aug-11 Oct-11 Dec-11 Newham Headlines March 2013 Feb-12 Apr-12 Jun-12
Quarter /13 Quality Account (Quality and Safety)
") Airedale NHS Foundation Trust Board of Directors:23 rd January 213 Title: Quarter 2 212/13 Quality Account (Quality and Safety) Author: Alison Fuller, Assistant Director Healthcare Quarter 2 212/13 Quality
Airedale NHS Foundation Trust Board of Directors:23 rd January 213 Title: Quarter 2 212/13 Quality Account (Quality and Safety) Author: Alison Fuller, Assistant Director Healthcare Quarter 2 212/13 Quality
Board Briefing. Board Briefing of Nursing and Midwifery Staffing Levels. Date of Briefing August 2017 (July 2017 data)
") Board Briefing Board Briefing of Nursing and Midwifery Staffing Levels Date of Briefing August 2017 (July 2017 data) This paper is for: Sponsor: Chief Nurse- Dame Eileen Sills (DBE) Decision Author: Workforce
Board Briefing Board Briefing of Nursing and Midwifery Staffing Levels Date of Briefing August 2017 (July 2017 data) This paper is for: Sponsor: Chief Nurse- Dame Eileen Sills (DBE) Decision Author: Workforce
QUALITY REPORT. Part A Patient Experience
 QUALITY REPORT Part A Patient Experience 1 Number of complaints Complaints and Patient Advice and Liaison Report 40 Total number of complaints received 30 20 10 Number of complaints received Trendline
BOARD OFFICIAL NHS GREATER GLASGOW AND CLYDE S INTEGRATED PERFORMANCE REPORT
 NHS Greater Glasgow & Clyde BOARD OFFICIAL NHS Board Meeting Head of Performance 19 December 2017 Paper No: 17/64 NHS GREATER GLASGOW AND CLYDE S INTEGRATED PERFORMANCE REPORT Recommendation Board members
Delivering our Vision How are we doing? August 2018
 Delivering our Vision How are we doing? August 2018 We will pursue perfection in the delivery of safe, high quality healthcare which puts the people of our community first Safety & quality Patient Vision
Quality Improvement Strategy
 / Colchester Hospital University NHS Foundation Trust Quality Improvement Strategy 2015-2018 Including our four Quality goals Strategy Author Angela Tillett, Medical Director Version 1 Date of Issue -
2016/17 Activity Report April August/September 2016
 Due to a change in national hospital data flows (SUS) and also a delay in processing September 2016 Practice-level finance data, the latest information on hospital activity and spend is still up to August
Performance and Quality Report Sean Morgan Director of Performance and Delivery Mary Hopper Director of Quality Dino Pardhanani, Clinical Director
 Sutton CCG Clinical Commissioning Group Governing Body Date Thursday, 06 September 2018 Document Title Lead Director (Name and Role) Clinical Sponsor (Name and Role) Performance and Quality Report Sean
Safer Nursing and Midwifery Staffing Recommendation The Board is asked to: NOTE the report
 To: Board of Directors Date of Meeting: 26 th July 20 Title Safer Nursing and Midwifery Staffing Responsible Executive Director Nicola Ranger, Chief Nurse Prepared by Helen O Dell, Deputy Chief Nurse Workforce
Haringey CCG MDT Integrated Contract Monitoring Report July 2015
 Haringey CCG MDT Integrated Contract Monitoring Report July 2015 Executive Summary 2 Executive Summary Contents Title page Executive Summary: Finance 4 Executive Summary: Performance 9 Executive Summary:
BOARD CLINICAL GOVERNANCE & QUALITY UPDATE MARCH 2013
 Borders NHS Board BOARD CLINICAL GOVERNANCE & QUALITY UPDATE MARCH 2013 Aim The aim of this report is to provide the Board with an overview of progress in the areas of: Patient Safety Person Centred Health
Appendix A: University Hospitals Birmingham NHS Foundation Trust Draft Action Plan in Response to CQC Recommendations
 No. Domain CQC Recommendation Lead Operational Lead Current Status 1 Appendix A: University Hospitals Birmingham NHS Foundation Trust Draft Action Plan in Response to CQC Recommendations Wording in long
NHS Electronic Referrals Service. Paper Switch Off an update Digital Health Webinar 4 May 2018
 NHS Electronic Referrals Service Paper Switch Off an update Digital Health Webinar 4 May 2018 Aims of Session Introductions and refresh of Paper Switch Off Sharon Wilson Implementation manager NHS Digital
NHS Borders Feedback and Complaints Annual Report
 NHS Borders Feedback and Complaints Annual Report 2016-17 1 Introduction NHS Borders Feedback and Complaints Annual Report 2016-17 is a summary of the feedback provided by the complaints, comments, concerns
TRUST BOARD SUBMISSION TEMPLATE. MEETING Trust Board Ref No Trust Performance Report
 TRUST BOARD SUBMISSION TEMPLATE MEETING Trust Board Ref No. 6.1 DIRECTOR Purpose Director of Planning, Performance and Informatics For Approval Trust Performance Report Date 2 Nov 20 Corporate Objective
NHS England London Southside 4th Floor 105 Victoria Street London SW1E 6QT. 24 th July Dear Daniel, Fiona and Louise. Re: CCG Annual Assurance
 NHS England London Southside 4th Floor 105 Victoria Street London SW1E 6QT 24 th July 2014 Dear Daniel, Fiona and Louise Re: CCG Annual Assurance Many thanks for meeting with us on 6 th June 2014 to discuss
TRUST BOARD. Document is for: (indicate with an x) Assurance X Information Decision. Executive Summary
 Assurance X Information Decision. Executive Summary") Document Title: Presenter: Author: Contact details for further information: Performance Report TRUST BOARD Chris Sands, Director of Finance, Performance & Information Amanda Rawlings, Director of People
Document Title: Presenter: Author: Contact details for further information: Performance Report TRUST BOARD Chris Sands, Director of Finance, Performance & Information Amanda Rawlings, Director of People
Agenda Item: 10.1 (3) HR & OD Monthly Trust Report (September 2016)
 HR & OD Monthly Trust Report (September 2016)") Agenda Item: 10.1 (3) HR & OD Monthly Trust Report (September 2016) Prepared by: Karen Taylor, Assistant Director of HR & Kyriacos Kyriacou, Interim Deputy Director of HR & OD Presented by: Louise Ludgrove,
Agenda Item: 10.1 (3) HR & OD Monthly Trust Report (September 2016) Prepared by: Karen Taylor, Assistant Director of HR & Kyriacos Kyriacou, Interim Deputy Director of HR & OD Presented by: Louise Ludgrove,
Delivering Improvement in Practice
 v Delivering Improvement in Practice NHS Providers Governance Conference 7 July 2016 Sir Mike Aaronson Chairman, Frimley Health NHS Foundation Trust 2006-2016 Frimley Health FT Comprises: Frimley Park
Performance, Quality and Outcomes Report: Position Statement
 Performance, Quality and Outcomes Report: Position Statement Update to Governing Body 5 April 2018 Item 1 Author(s) Sponsor Directors Purpose of Paper Jane Howcroft Programme and Performance Assurance
TRUST BOARD Annual Operational Plan for 16/17. Author: Gino DiStefano Sponsor: Paul Traynor Trust Board 7 April 2016 updated paper I
 UNIVERSITY HOSPITALS OF LEICESTER NHS TRUST TRUST BOARD Annual Operational Plan for 16/17 Author: Gino DiStefano Sponsor: Paul Traynor Trust Board 7 April 2016 updated paper I Context Our annual operational
Learning from Patient Deaths: Update on Implementation and Reporting of Data: 5 th January 2018
 Learning from Patient Deaths: Update on Implementation and Reporting of Data: 5 th January 218 Purpose The purpose of this paper is to update the Trust Board on progress with implementing the mandatory